examples of real-life problem solving with mascot integra · examples of real-life problem solving...
TRANSCRIPT

1
: Problem solving with Mascot Integra © 2006 Matrix Science
Examples of real-life problem solving with Mascot Integra
We have introduced Mascot Integra at previous ASMS user meetings so I thought that we would cover something different this time.For those that are not familiar with Mascot Integra it is our solution to proteomics data management and you can find out more about it on our website or see it in action at our booth, number 39, during the conference.
This time I’m going to talk about solving real life problems with Mascot Integra.
2
: Problem solving with Mascot Integra © 2006 Matrix Science
Requirements
I need experiment condition trackingI need sample tracking I need flexible reportingI need to analysis large data sets
What sort of requirements are we going to ask of Mascot Integra?
Firstly I need to track experiment conditions.Secondly I want to know what happened to my samples three or more months laterThirdly I want to create reports with the information that I’m interested in.Finally I want to analysis large data sets and filter the identified proteins by different constraints
3
: Problem solving with Mascot Integra © 2006 Matrix Science
1. I need experiment condition tracking
Load the results in to the database as fast as possibleTrack as many details as possible
An experiment can be as simple as this:
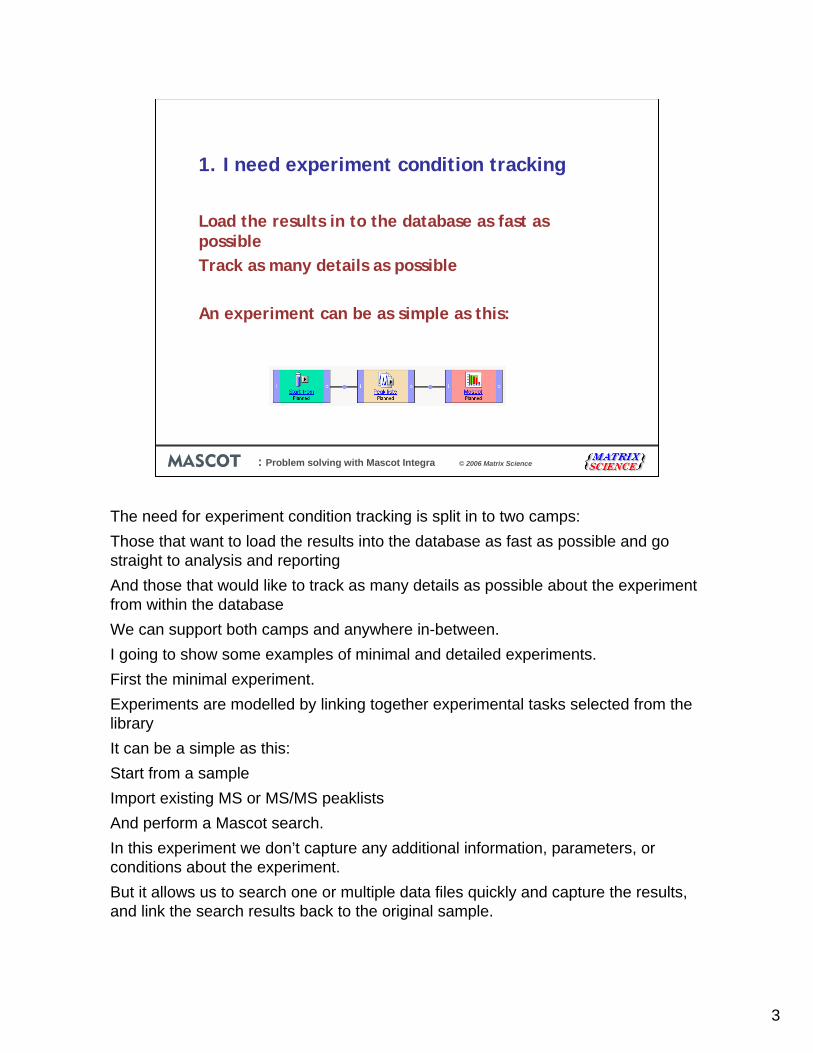
The need for experiment condition tracking is split in to two camps:Those that want to load the results into the database as fast as possible and go straight to analysis and reporting And those that would like to track as many details as possible about the experiment from within the database We can support both camps and anywhere in-between.I going to show some examples of minimal and detailed experiments.First the minimal experiment.Experiments are modelled by linking together experimental tasks selected from the libraryIt can be a simple as this:Start from a sampleImport existing MS or MS/MS peaklistsAnd perform a Mascot search.In this experiment we don’t capture any additional information, parameters, or conditions about the experiment. But it allows us to search one or multiple data files quickly and capture the results, and link the search results back to the original sample.
4
: Problem solving with Mascot Integra © 2006 Matrix Science
Experiment modelling
Or as detailed as required
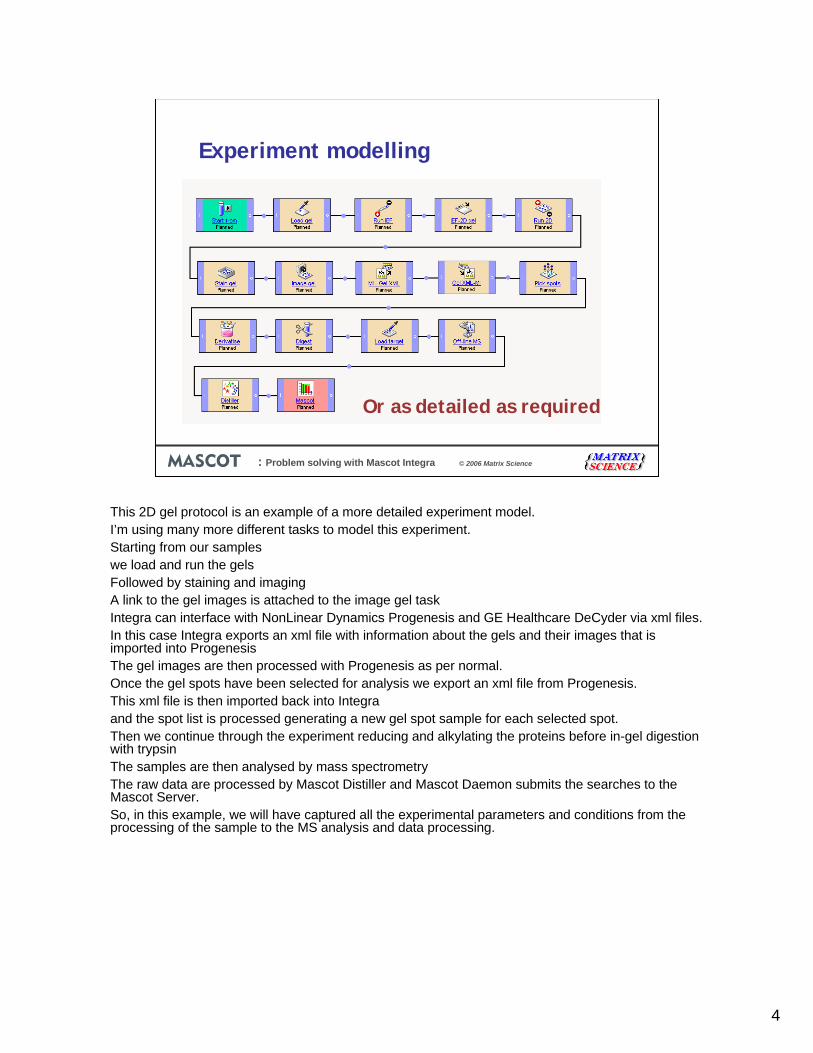
This 2D gel protocol is an example of a more detailed experiment model.I’m using many more different tasks to model this experiment.Starting from our samples we load and run the gelsFollowed by staining and imagingA link to the gel images is attached to the image gel taskIntegra can interface with NonLinear Dynamics Progenesis and GE Healthcare DeCyder via xml files.In this case Integra exports an xml file with information about the gels and their images that is imported into ProgenesisThe gel images are then processed with Progenesis as per normal.Once the gel spots have been selected for analysis we export an xml file from Progenesis.This xml file is then imported back into Integra and the spot list is processed generating a new gel spot sample for each selected spot.Then we continue through the experiment reducing and alkylating the proteins before in-gel digestion with trypsinThe samples are then analysed by mass spectrometry The raw data are processed by Mascot Distiller and Mascot Daemon submits the searches to the Mascot Server.So, in this example, we will have captured all the experimental parameters and conditions from the processing of the sample to the MS analysis and data processing.
5
: Problem solving with Mascot Integra © 2006 Matrix Science
Experimental data capture
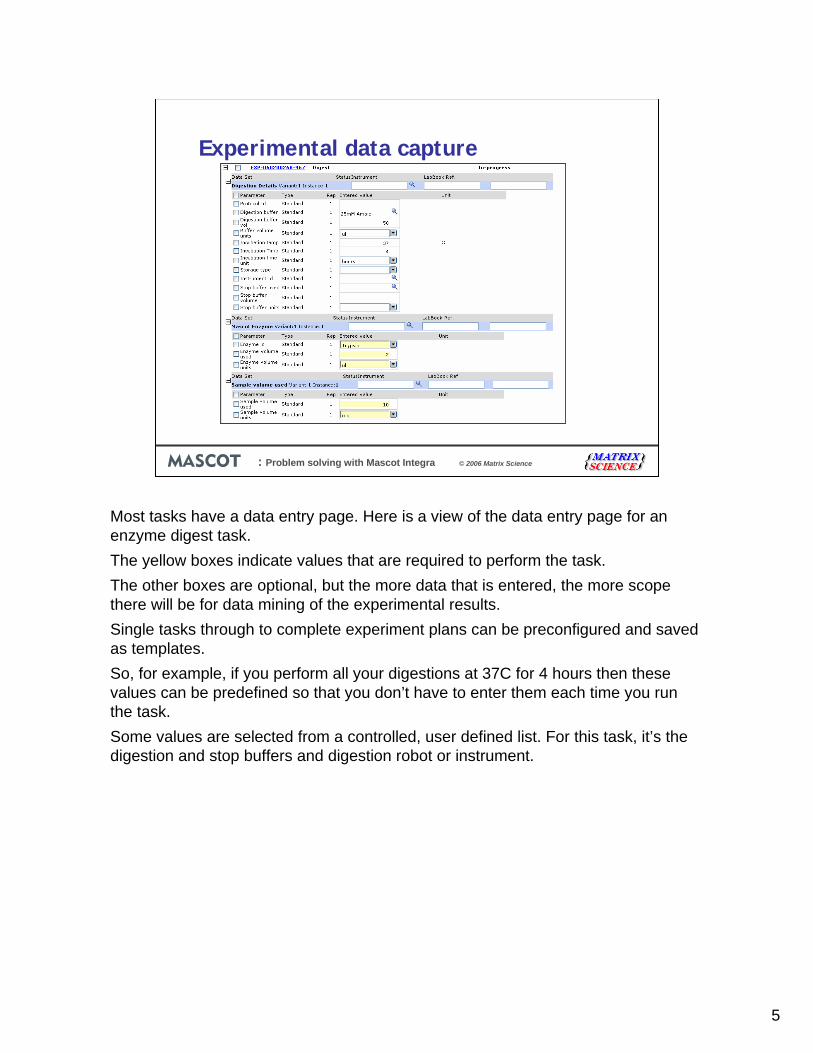
Most tasks have a data entry page. Here is a view of the data entry page for an enzyme digest task. The yellow boxes indicate values that are required to perform the task.The other boxes are optional, but the more data that is entered, the more scope there will be for data mining of the experimental results.Single tasks through to complete experiment plans can be preconfigured and saved as templates.So, for example, if you perform all your digestions at 37C for 4 hours then these values can be predefined so that you don’t have to enter them each time you run the task.Some values are selected from a controlled, user defined list. For this task, it’s the digestion and stop buffers and digestion robot or instrument.
6
: Problem solving with Mascot Integra © 2006 Matrix Science
Experiment modelling
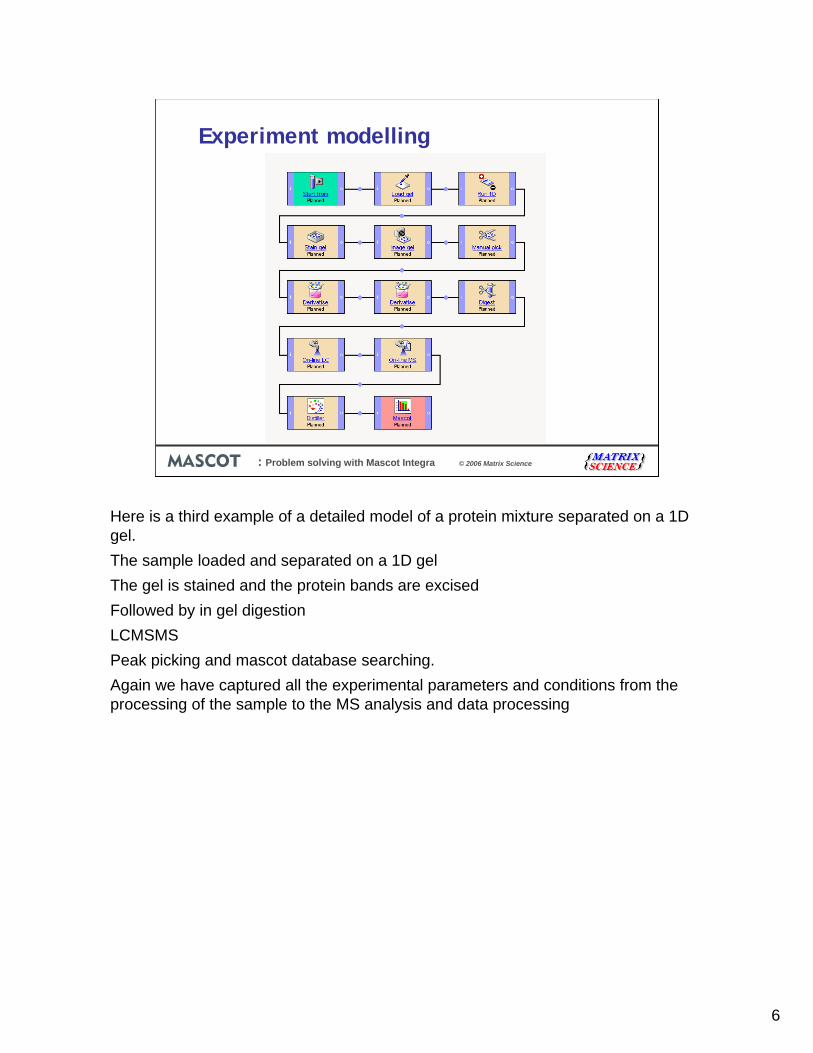
Here is a third example of a detailed model of a protein mixture separated on a 1D gel.The sample loaded and separated on a 1D gelThe gel is stained and the protein bands are excised Followed by in gel digestion LCMSMSPeak picking and mascot database searching.Again we have captured all the experimental parameters and conditions from the processing of the sample to the MS analysis and data processing
7
: Problem solving with Mascot Integra © 2006 Matrix Science
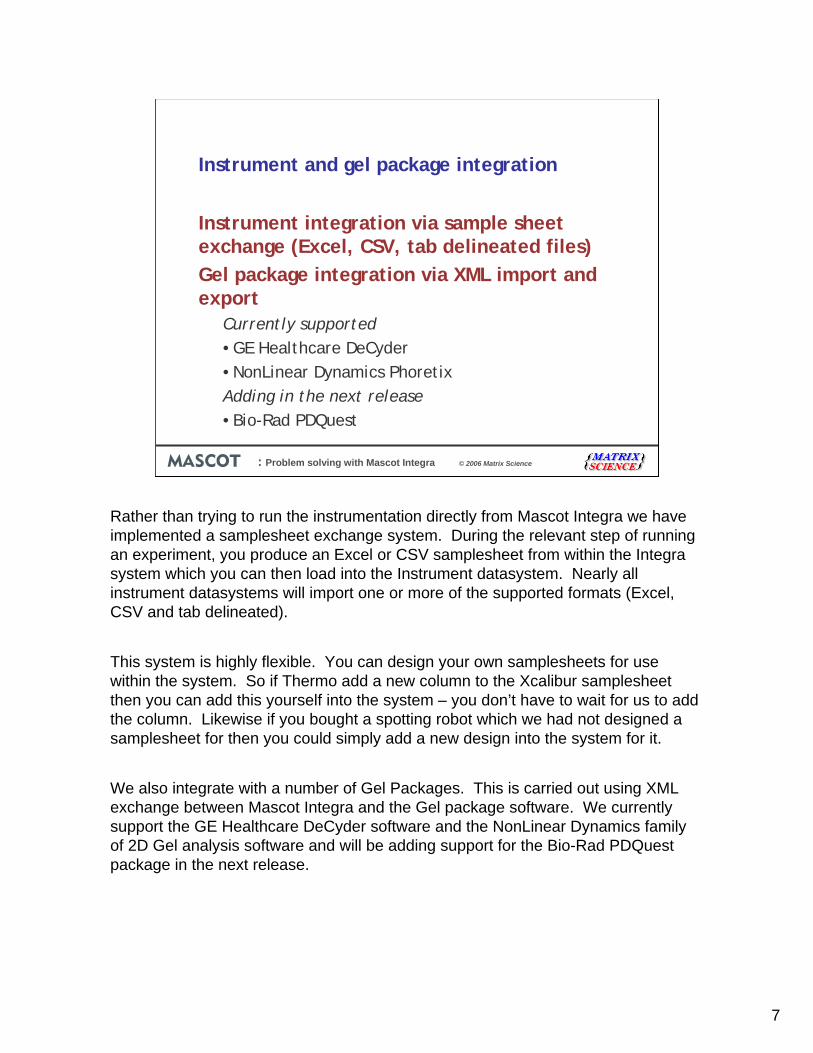
Instrument and gel package integration
Instrument integration via sample sheet exchange (Excel, CSV, tab delineated files)Gel package integration via XML import and export
Currently supported•GE Healthcare DeCyder•NonLinear Dynamics PhoretixAdding in the next release•Bio-Rad PDQuest
Rather than trying to run the instrumentation directly from Mascot Integra we have implemented a samplesheet exchange system. During the relevant step of running an experiment, you produce an Excel or CSV samplesheet from within the Integra system which you can then load into the Instrument datasystem. Nearly all instrument datasystems will import one or more of the supported formats (Excel, CSV and tab delineated).
This system is highly flexible. You can design your own samplesheets for use within the system. So if Thermo add a new column to the Xcalibur samplesheetthen you can add this yourself into the system – you don’t have to wait for us to add the column. Likewise if you bought a spotting robot which we had not designed a samplesheet for then you could simply add a new design into the system for it.
We also integrate with a number of Gel Packages. This is carried out using XML exchange between Mascot Integra and the Gel package software. We currently support the GE Healthcare DeCyder software and the NonLinear Dynamics family of 2D Gel analysis software and will be adding support for the Bio-Rad PDQuestpackage in the next release.
8
: Problem solving with Mascot Integra © 2006 Matrix Science
2. I need sample tracking
Relationships between samples are tracked at each and every experimental stepThese can be 1-1, 1-many, many-1 or many-many relationshipsAllows you to easily answer the question –where did this search result come from (or the other way round)?
Now on to the second requirement of sample tracking.One of the key advantages of tracking your experiments and results through Mascot Integra is that at each step of the experiment the relationships between samples are tracked and stored, readily accessible, in the database.
These relationships can be 1-1 (i.e. doing a simple digest to produce a child sample), 1-many (i.e. splitting a sample into multiple aliquots), many-1 (i.e. creating a single mixture from multiple starting samples) or many-many (i.e. creating multiple mixtures from multiple starting samples).
Because we have tracked all of these relationships, then answering the question ‘where did this search result come from’ 12 months down the line is now trivial.
9
: Problem solving with Mascot Integra © 2006 Matrix Science
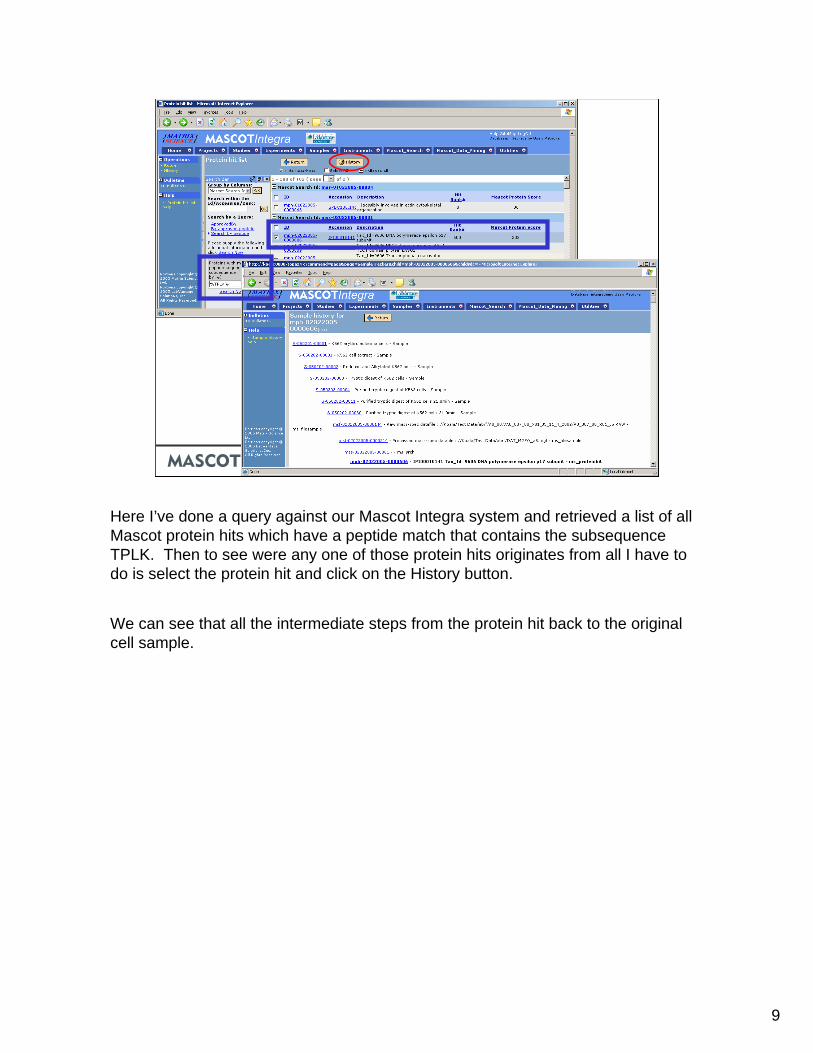
Here I’ve done a query against our Mascot Integra system and retrieved a list of all Mascot protein hits which have a peptide match that contains the subsequence TPLK. Then to see were any one of those protein hits originates from all I have to do is select the protein hit and click on the History button.
We can see that all the intermediate steps from the protein hit back to the original cell sample.
10
: Problem solving with Mascot Integra © 2006 Matrix Science
3. I need flexible reporting
Excel reporting• Analysis of all the peptides identified by MS/MS from a
single or multiple analysis• Produce a mass and retention time overview• Protein vs DNA (human genome) data comparison
Advanced reporting• Plate assay report• PMF report that satisfies MCP guide lines
Once that I have samples and data in the system I would like to perform some analysis and create some reports.
Mascot Integra uses Excel for custom reporting.For more complex data mining, involving multiple SQL statements and further data processing, the Integra database can be mined using custom scripts or programs.Pretty much any programming language can be used, for example Perl, Java, Visual Basic or C++. You could even use Visual Basic macros in an Excel sheet.
I’m going to show how an excel report is designed and three examples from the currently available report set.
Then I’m going to show some examples of what you might want to do with more advanced reporting.
11
: Problem solving with Mascot Integra © 2006 Matrix Science
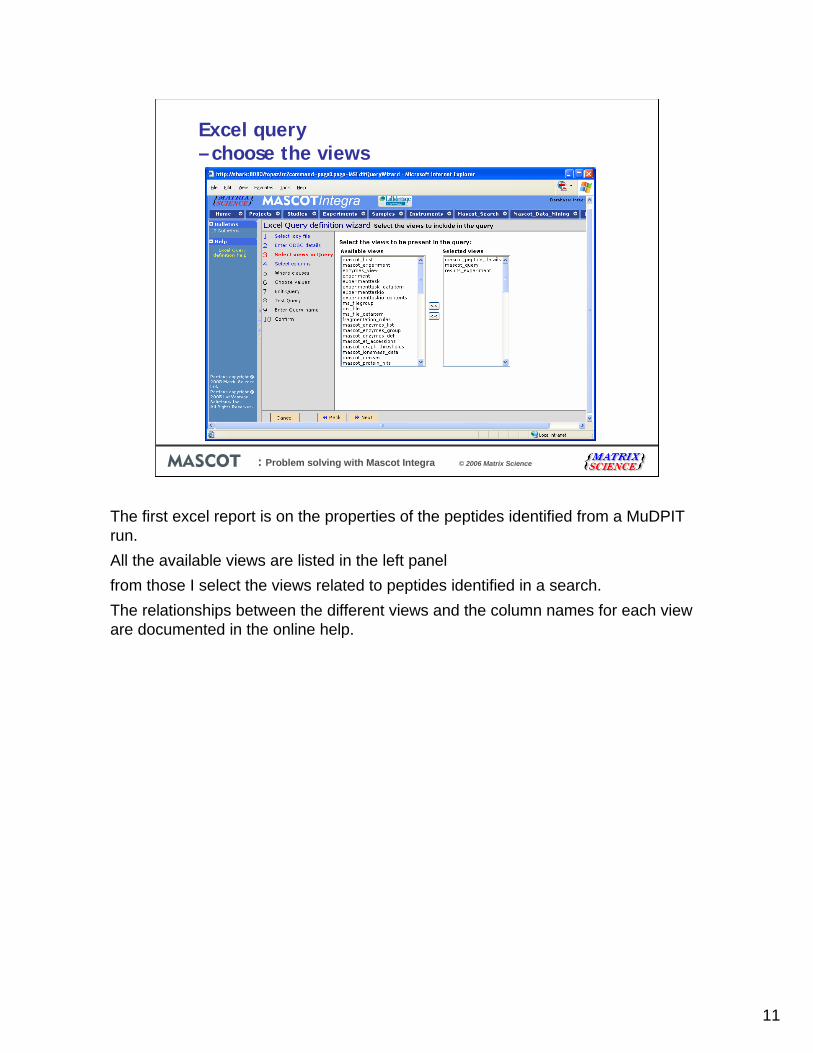
Excel query – choose the views
The first excel report is on the properties of the peptides identified from a MuDPITrun.All the available views are listed in the left panel from those I select the views related to peptides identified in a search.The relationships between the different views and the column names for each view are documented in the online help.
12
: Problem solving with Mascot Integra © 2006 Matrix Science
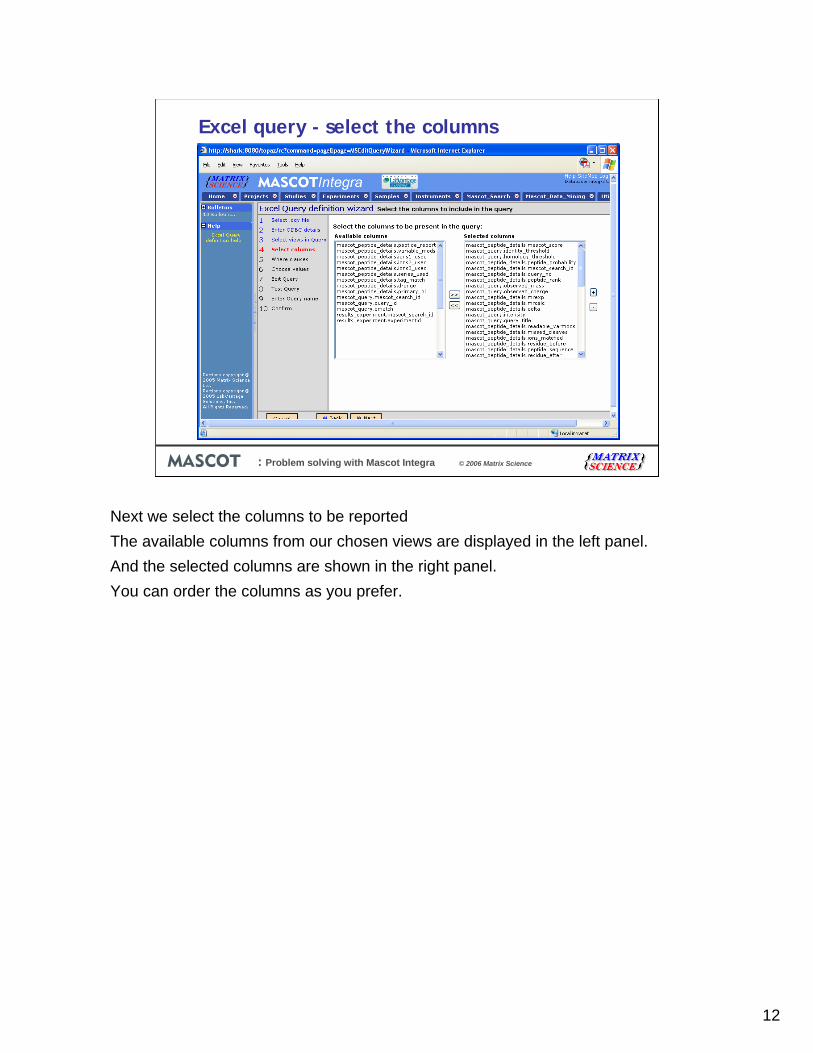
Excel query - select the columns
Next we select the columns to be reportedThe available columns from our chosen views are displayed in the left panel. And the selected columns are shown in the right panel.You can order the columns as you prefer.
13
: Problem solving with Mascot Integra © 2006 Matrix Science
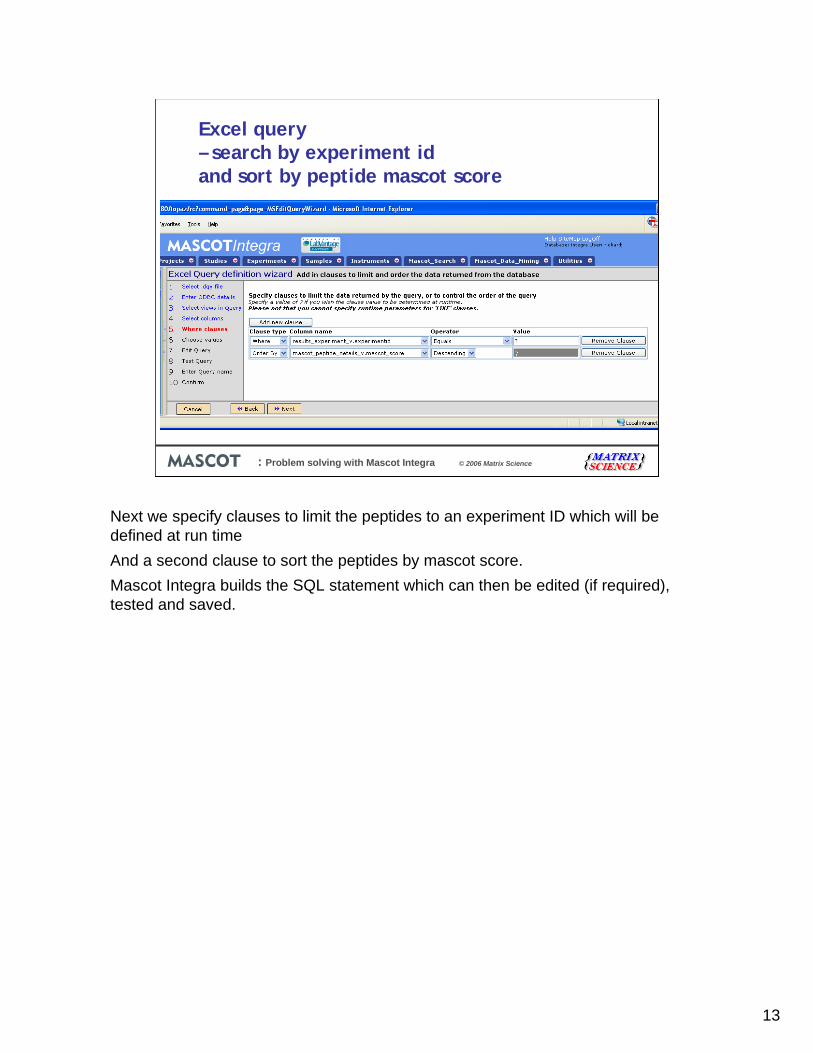
Excel query – search by experiment id and sort by peptide mascot score
Next we specify clauses to limit the peptides to an experiment ID which will be defined at run time And a second clause to sort the peptides by mascot score.Mascot Integra builds the SQL statement which can then be edited (if required), tested and saved.
14
: Problem solving with Mascot Integra © 2006 Matrix Science
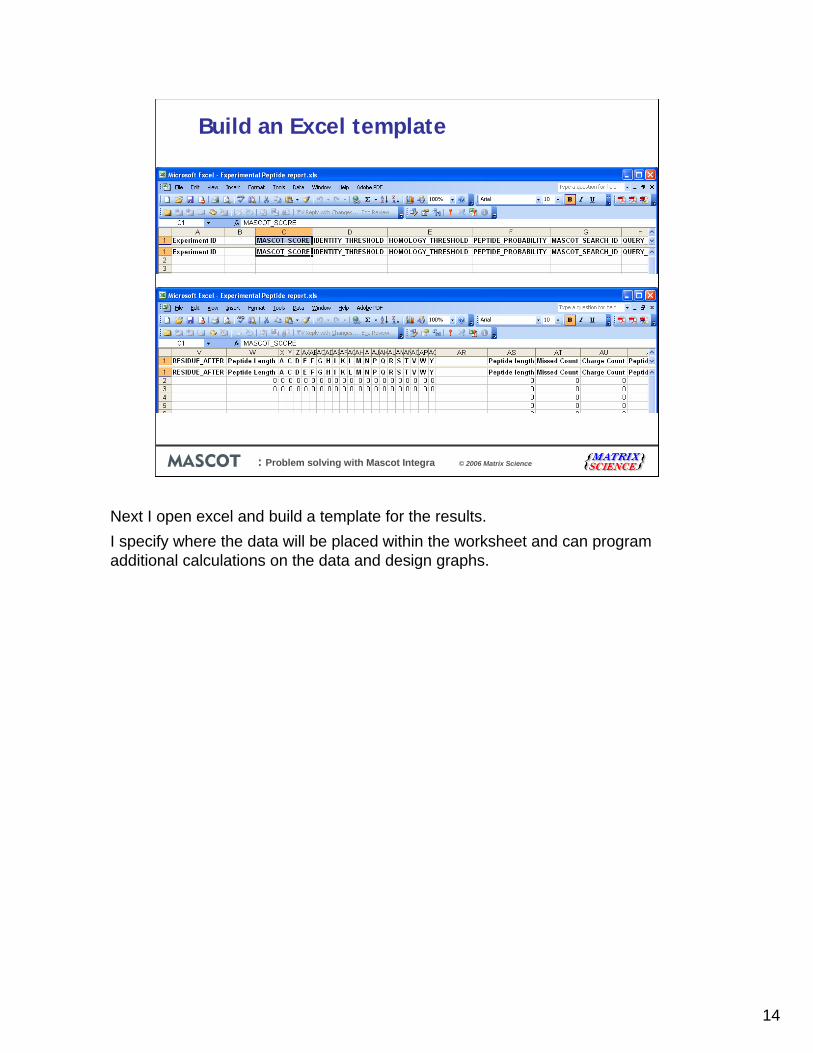
Build an Excel template
Next I open excel and build a template for the results.I specify where the data will be placed within the worksheet and can program additional calculations on the data and design graphs.
15
: Problem solving with Mascot Integra © 2006 Matrix Science
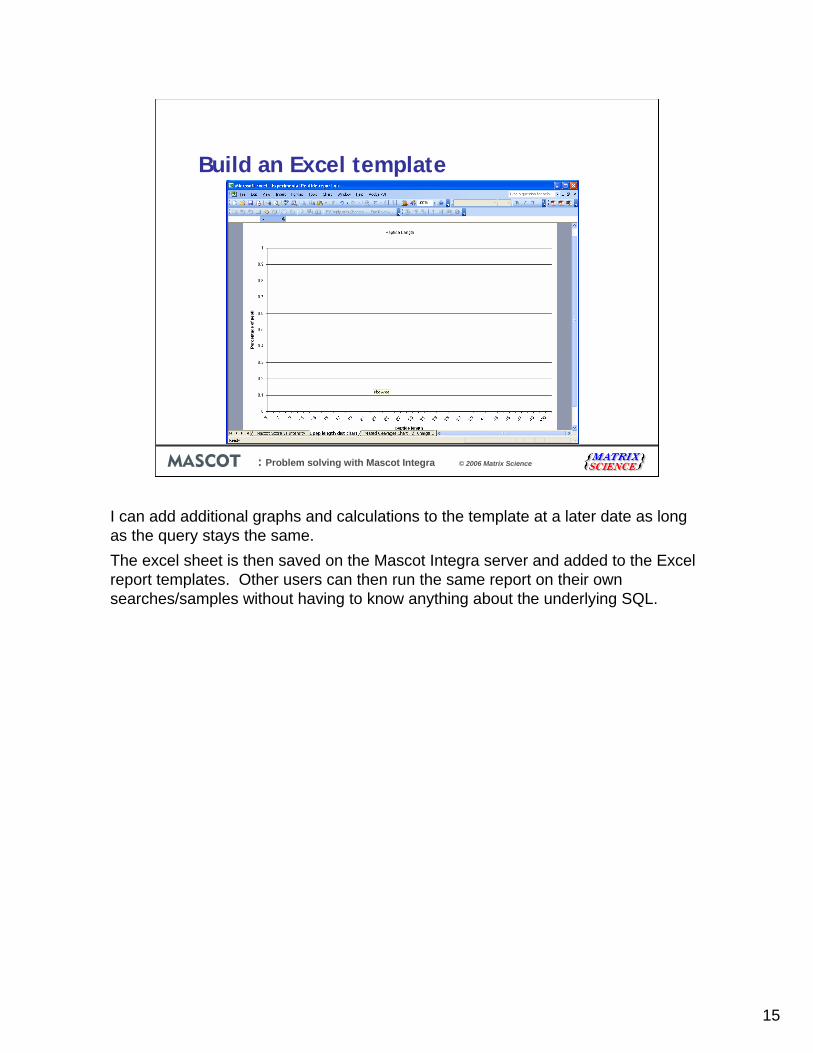
Build an Excel template
I can add additional graphs and calculations to the template at a later date as long as the query stays the same.The excel sheet is then saved on the Mascot Integra server and added to the Excel report templates. Other users can then run the same report on their own searches/samples without having to know anything about the underlying SQL.
16
: Problem solving with Mascot Integra © 2006 Matrix Science
Test sample
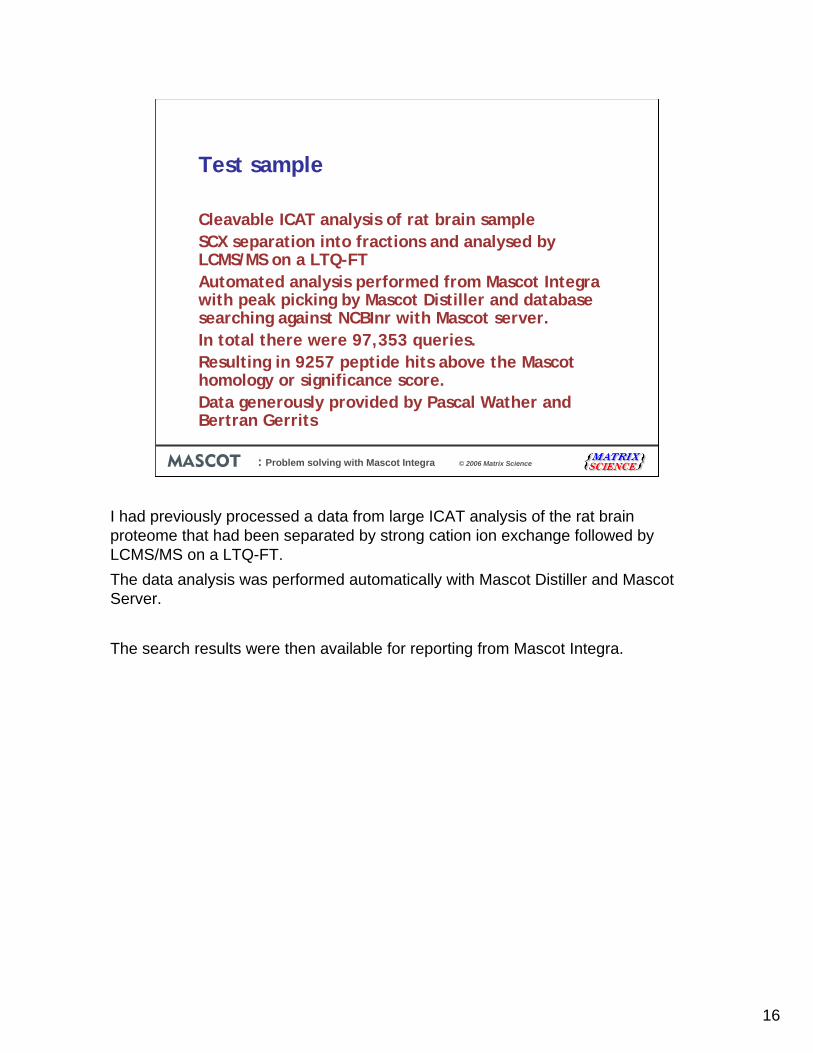
Cleavable ICAT analysis of rat brain sampleSCX separation into fractions and analysed by LCMS/MS on a LTQ-FTAutomated analysis performed from Mascot Integra with peak picking by Mascot Distiller and database searching against NCBInr with Mascot server. In total there were 97,353 queries.Resulting in 9257 peptide hits above the Mascot homology or significance score.Data generously provided by Pascal Wather and Bertran Gerrits
I had previously processed a data from large ICAT analysis of the rat brain proteome that had been separated by strong cation ion exchange followed by LCMS/MS on a LTQ-FT.The data analysis was performed automatically with Mascot Distiller and Mascot Server.
The search results were then available for reporting from Mascot Integra.
17
: Problem solving with Mascot Integra © 2006 Matrix Science
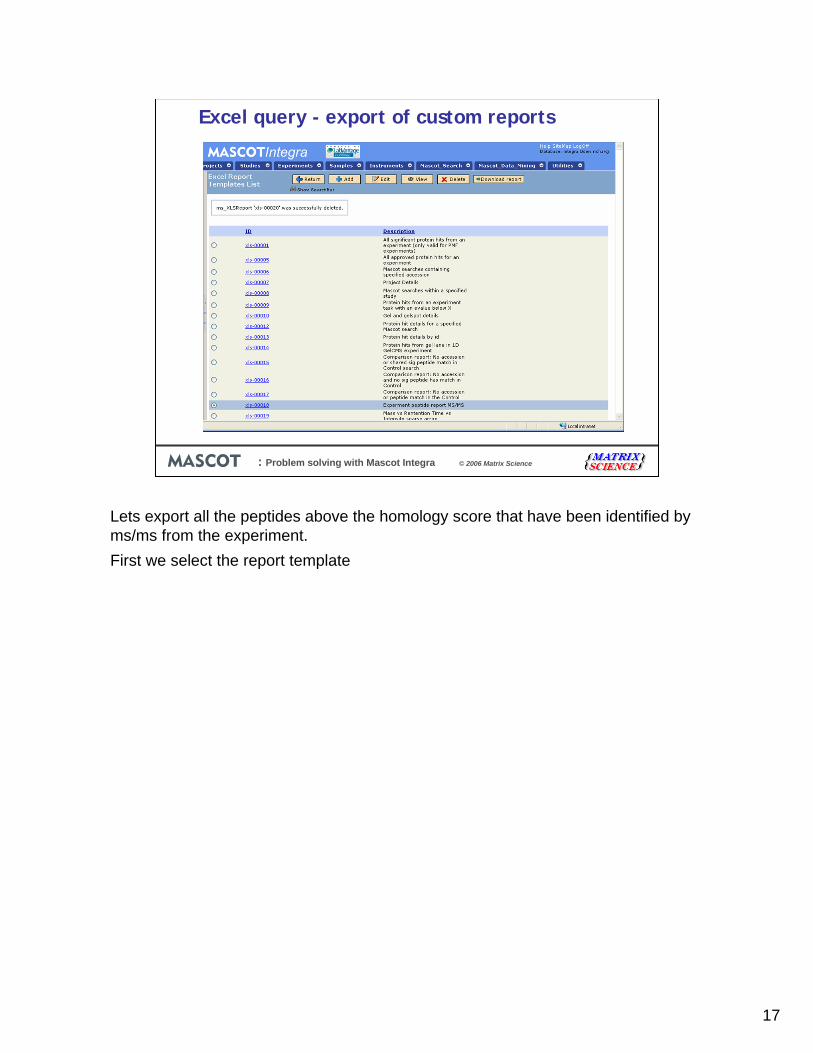
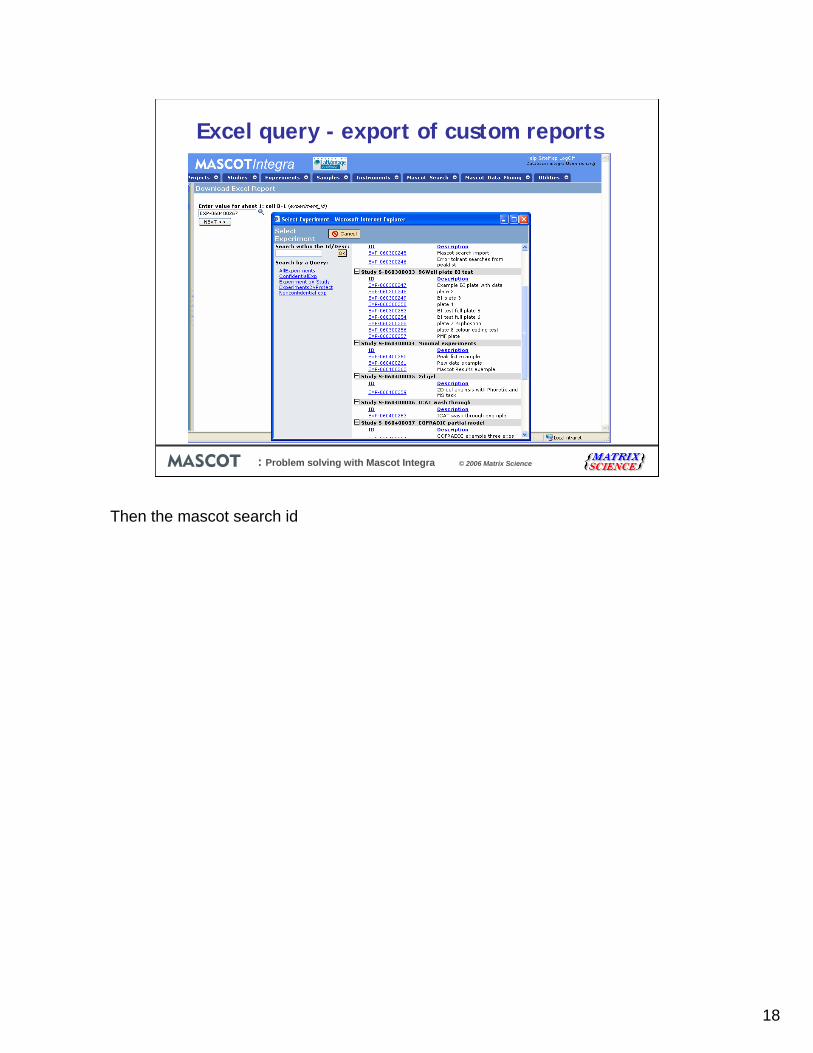
Excel query - export of custom reports
Lets export all the peptides above the homology score that have been identified by ms/ms from the experiment.First we select the report template
18
: Problem solving with Mascot Integra © 2006 Matrix Science
Excel query - export of custom reports
Then the mascot search id
19
: Problem solving with Mascot Integra © 2006 Matrix Science
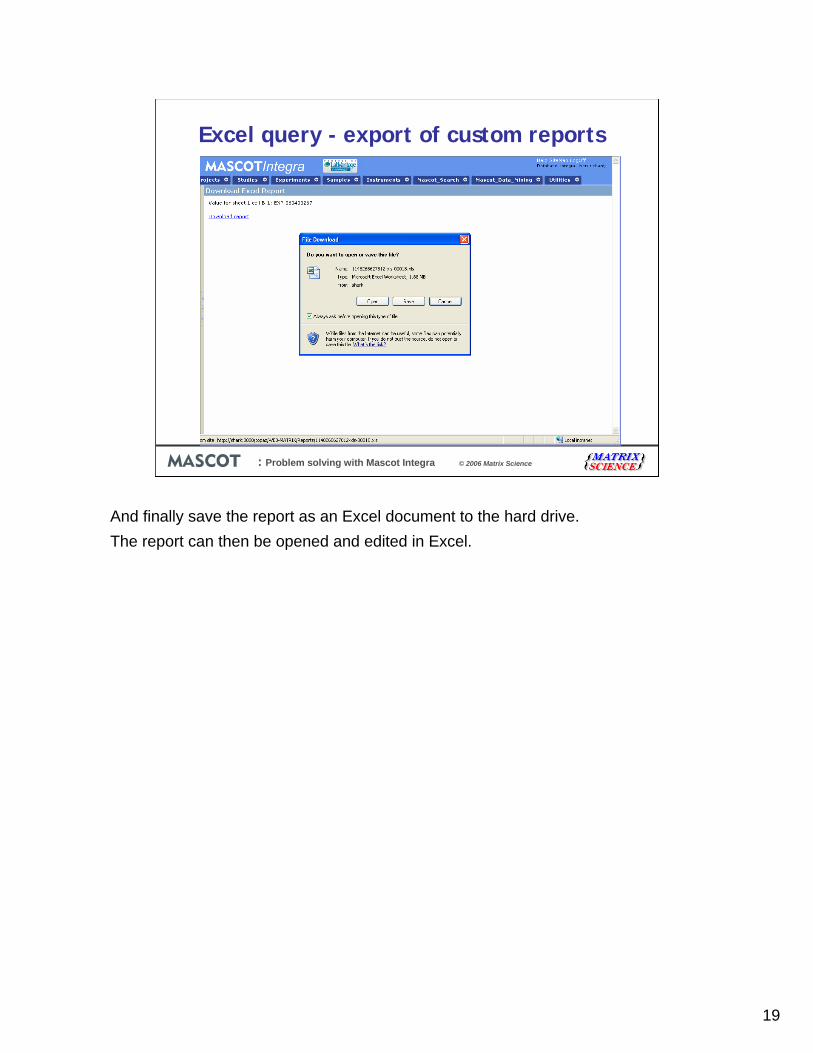
Excel query - export of custom reports
And finally save the report as an Excel document to the hard drive.The report can then be opened and edited in Excel.
20
: Problem solving with Mascot Integra © 2006 Matrix Science
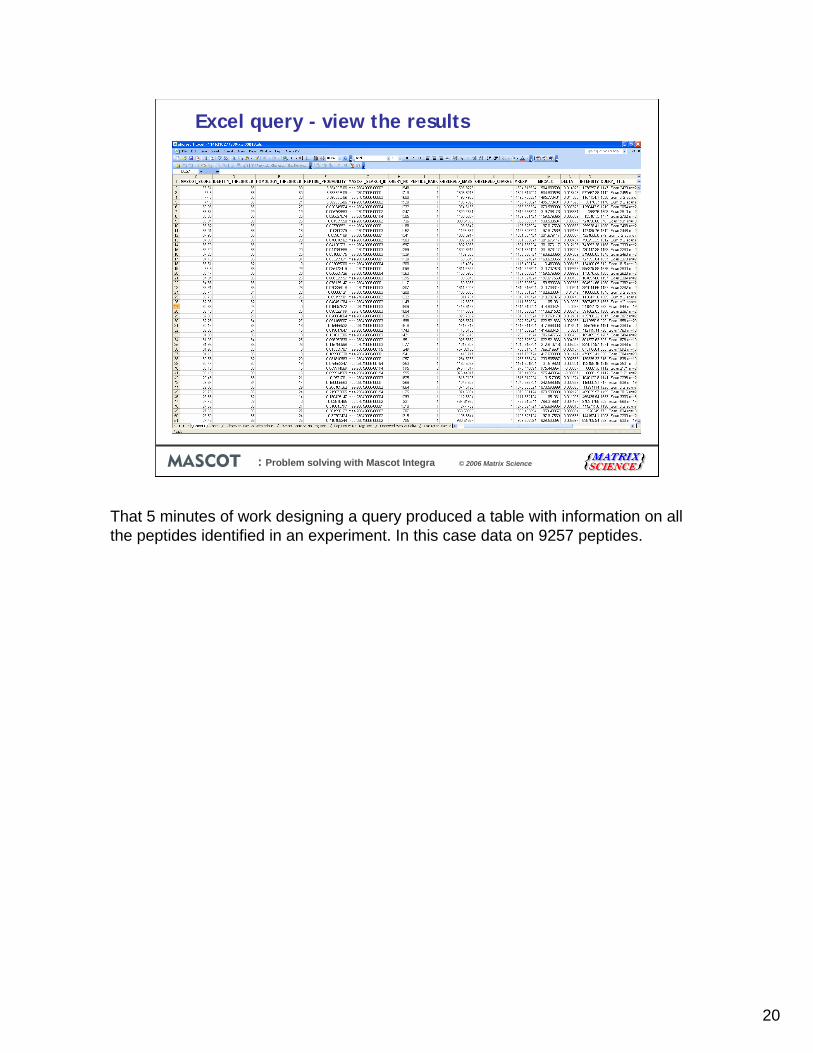
Excel query - view the results
That 5 minutes of work designing a query produced a table with information on all the peptides identified in an experiment. In this case data on 9257 peptides.
21
: Problem solving with Mascot Integra © 2006 Matrix Science
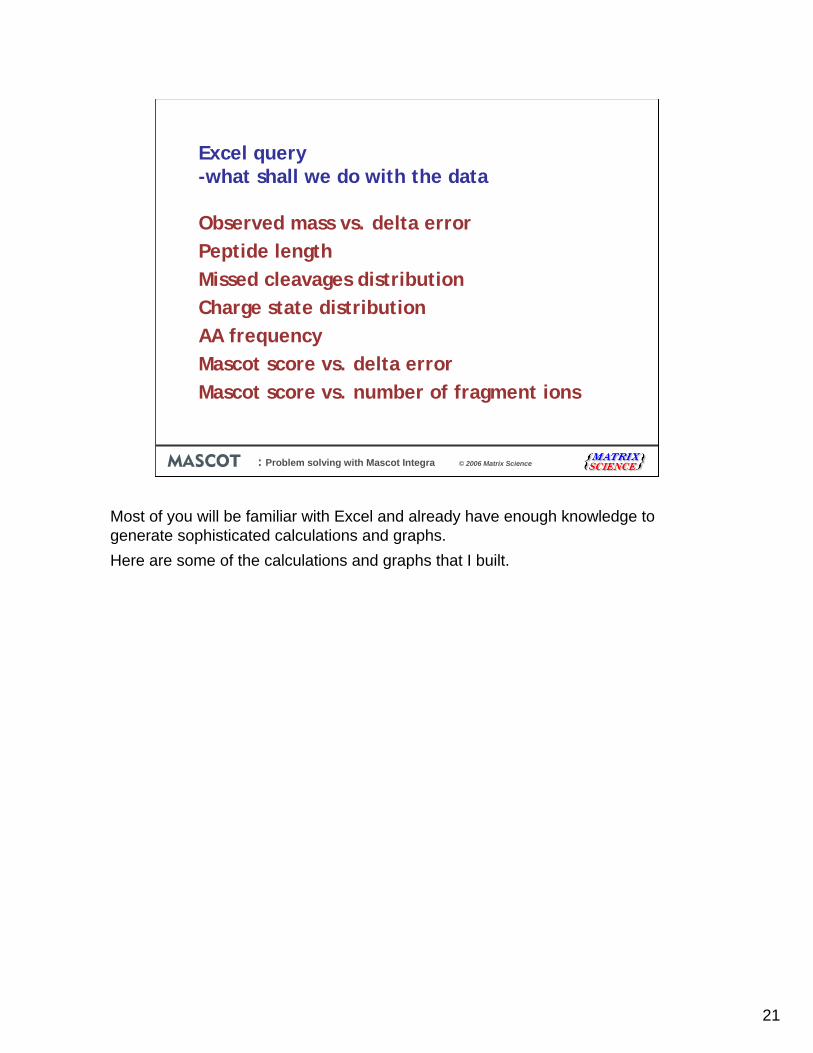
Excel query-what shall we do with the data
Observed mass vs. delta errorPeptide lengthMissed cleavages distributionCharge state distributionAA frequencyMascot score vs. delta errorMascot score vs. number of fragment ions
Most of you will be familiar with Excel and already have enough knowledge to generate sophisticated calculations and graphs.Here are some of the calculations and graphs that I built.
22
: Problem solving with Mascot Integra © 2006 Matrix Science
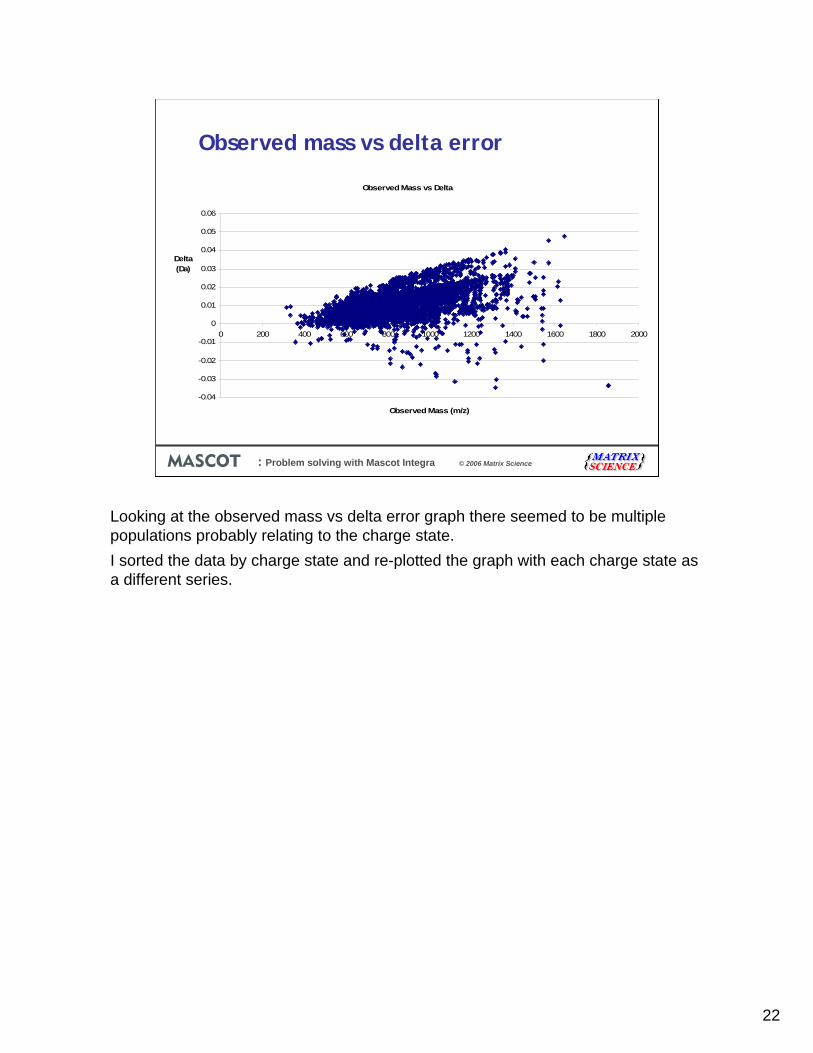
Observed mass vs delta error
Observed Mass vs Delta
-0.04
-0.03
-0.02
-0.01
0
0.01
0.02
0.03
0.04
0.05
0.06
0 200 400 600 800 1000 1200 1400 1600 1800 2000
Observed Mass (m/z)
Delta (Da)
Looking at the observed mass vs delta error graph there seemed to be multiple populations probably relating to the charge state.I sorted the data by charge state and re-plotted the graph with each charge state as a different series.
23
: Problem solving with Mascot Integra © 2006 Matrix Science
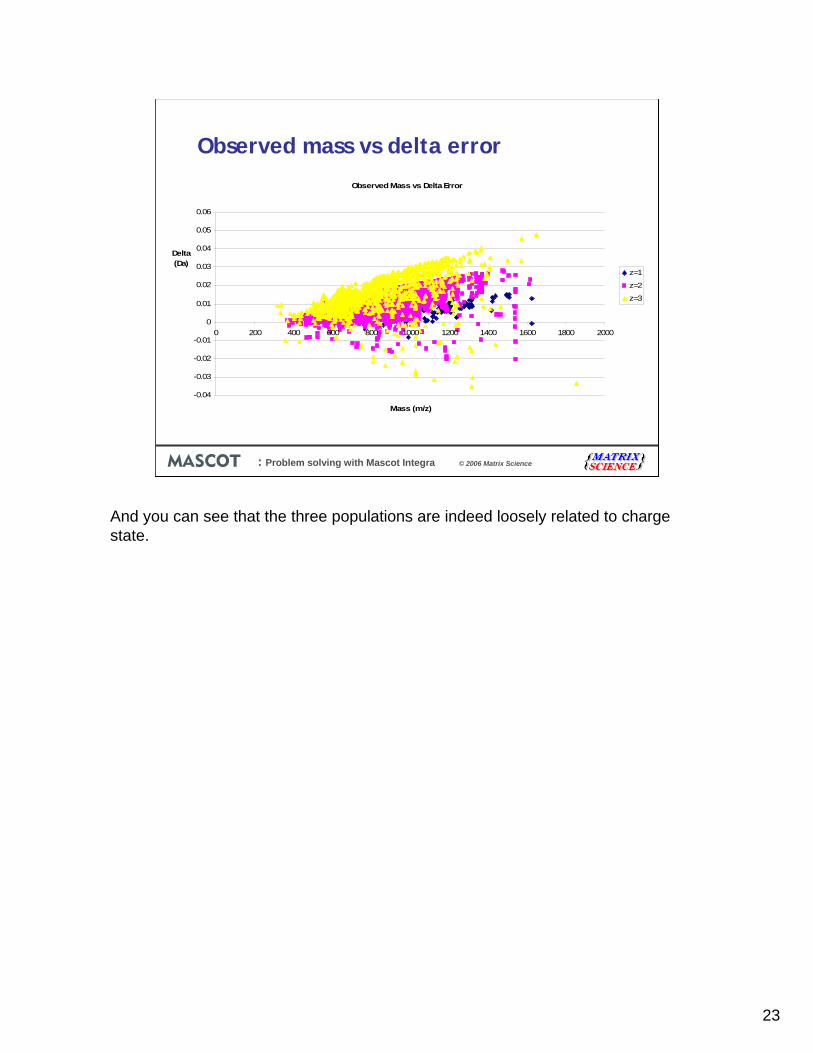
Observed mass vs delta errorObserved Mass vs Delta Error
-0.04
-0.03
-0.02
-0.01
0
0.01
0.02
0.03
0.04
0.05
0.06
0 200 400 600 800 1000 1200 1400 1600 1800 2000
Mass (m/z)
Delta (Da)
z=1
z=2
z=3
And you can see that the three populations are indeed loosely related to charge state.
24
: Problem solving with Mascot Integra © 2006 Matrix Science
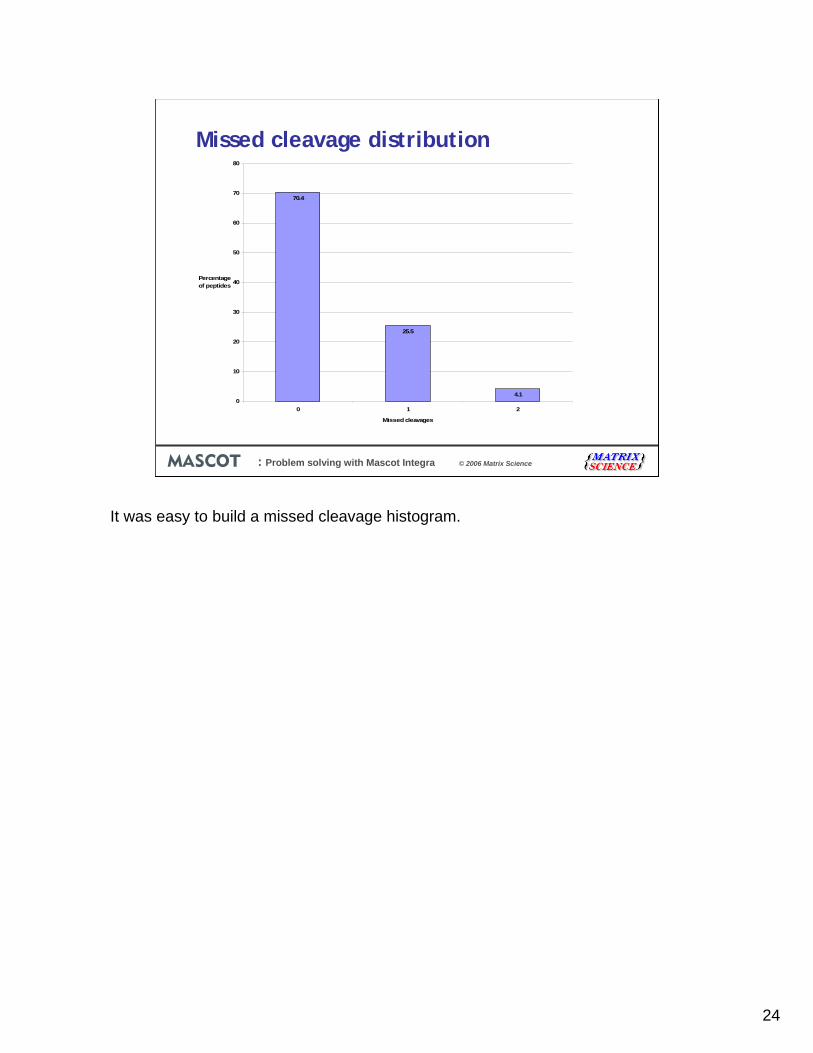
Missed cleavage distribution
70.4
25.5
4.10
10
20
30
40
50
60
70
80
0 1 2
Missed cleavages
Percentage of peptides
It was easy to build a missed cleavage histogram.
25
: Problem solving with Mascot Integra © 2006 Matrix Science
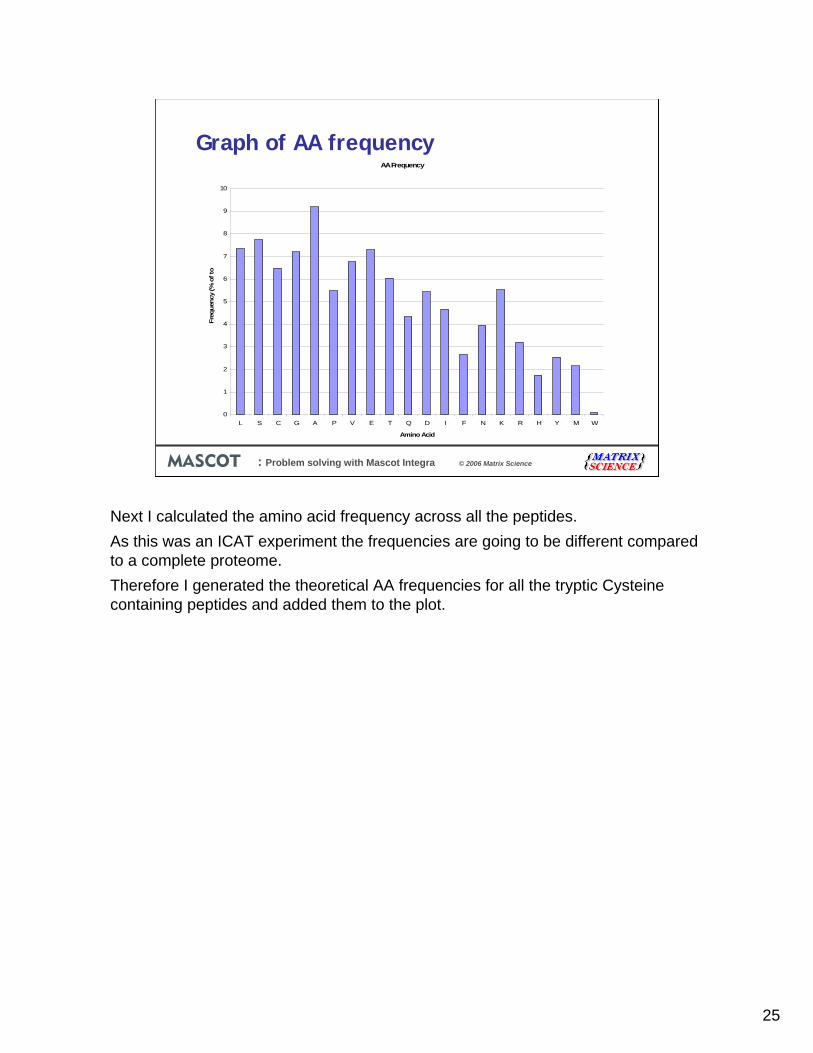
Graph of AA frequencyAA Frequency
0
1
2
3
4
5
6
7
8
9
10
L S C G A P V E T Q D I F N K R H Y M W
Amino Acid
Freq
uenc
y (%
of t
o
Next I calculated the amino acid frequency across all the peptides.As this was an ICAT experiment the frequencies are going to be different compared to a complete proteome.Therefore I generated the theoretical AA frequencies for all the tryptic Cysteinecontaining peptides and added them to the plot.
26
: Problem solving with Mascot Integra © 2006 Matrix Science
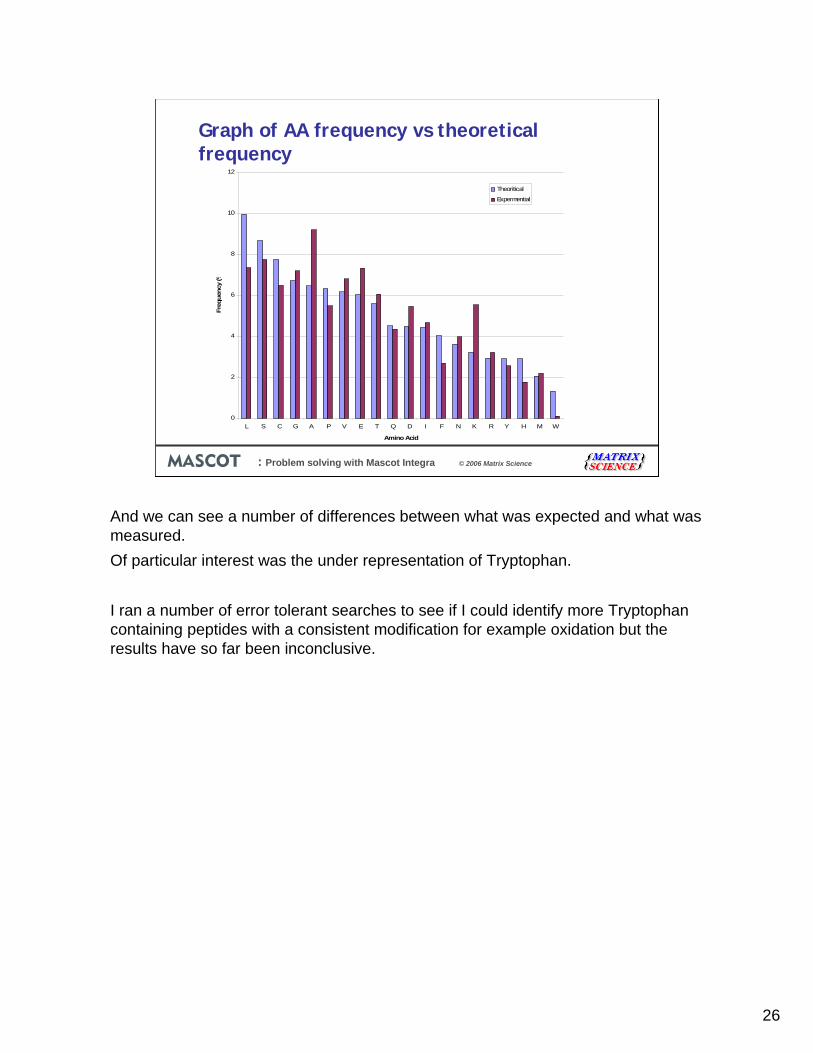
Graph of AA frequency vs theoretical frequency
0
2
4
6
8
10
12
L S C G A P V E T Q D I F N K R Y H M W
Amino Acid
Freq
uenc
y (%
Theoritical
Expermential
And we can see a number of differences between what was expected and what was measured. Of particular interest was the under representation of Tryptophan.
I ran a number of error tolerant searches to see if I could identify more Tryptophan containing peptides with a consistent modification for example oxidation but the results have so far been inconclusive.
27
: Problem solving with Mascot Integra © 2006 Matrix Science
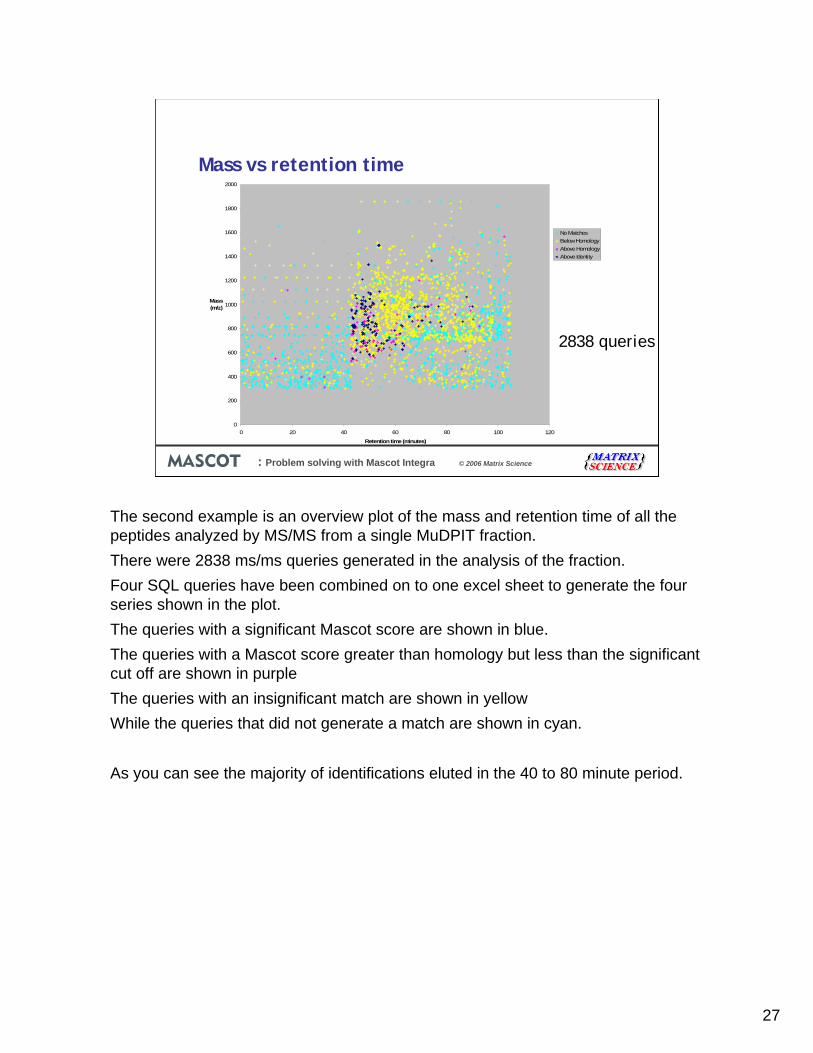
Mass vs retention time
0
200
400
600
800
1000
1200
1400
1600
1800
2000
0 20 40 60 80 100 120
Retention time (minutes)
Mass(m/z)
No MatchesBelow HomologyAbove HomologyAbove Identity
2838 queries
The second example is an overview plot of the mass and retention time of all the peptides analyzed by MS/MS from a single MuDPIT fraction.There were 2838 ms/ms queries generated in the analysis of the fraction.Four SQL queries have been combined on to one excel sheet to generate the four series shown in the plot.The queries with a significant Mascot score are shown in blue.The queries with a Mascot score greater than homology but less than the significant cut off are shown in purpleThe queries with an insignificant match are shown in yellowWhile the queries that did not generate a match are shown in cyan.
As you can see the majority of identifications eluted in the 40 to 80 minute period.
28
: Problem solving with Mascot Integra © 2006 Matrix Science
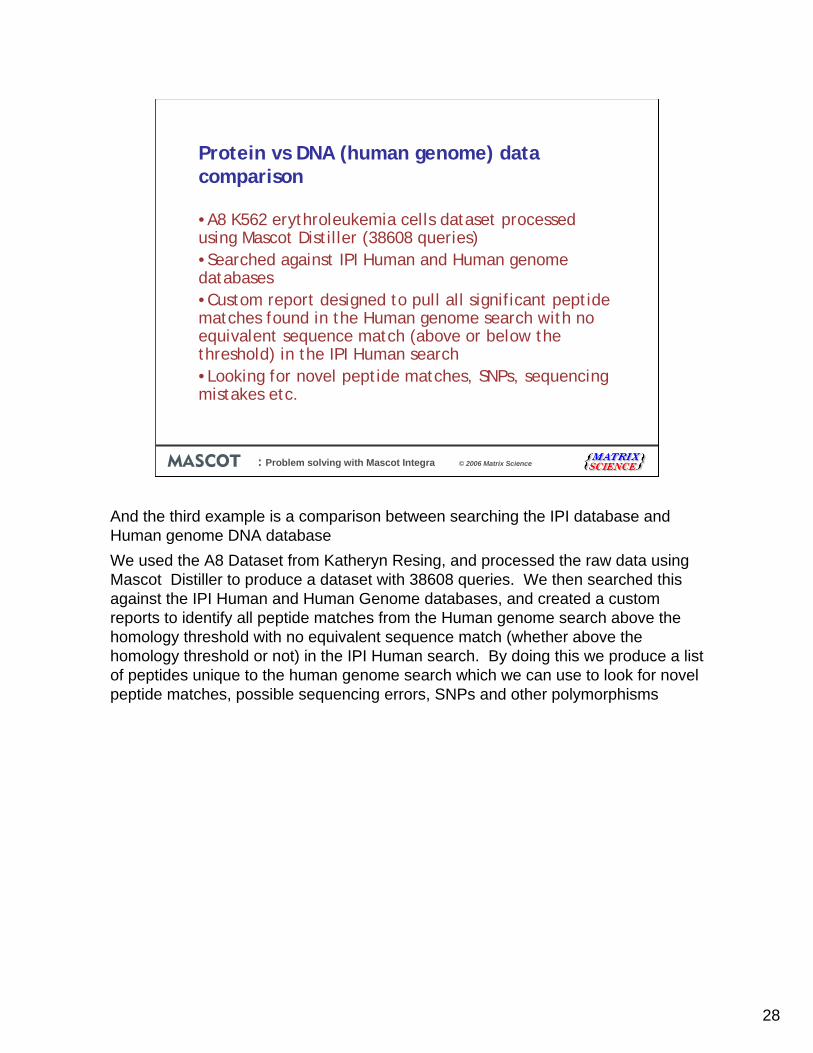
Protein vs DNA (human genome) data comparison
•A8 K562 erythroleukemia cells dataset processed using Mascot Distiller (38608 queries)•Searched against IPI Human and Human genome databases•Custom report designed to pull all significant peptide matches found in the Human genome search with no equivalent sequence match (above or below the threshold) in the IPI Human search•Looking for novel peptide matches, SNPs, sequencing mistakes etc.
And the third example is a comparison between searching the IPI database and Human genome DNA databaseWe used the A8 Dataset from Katheryn Resing, and processed the raw data using Mascot Distiller to produce a dataset with 38608 queries. We then searched this against the IPI Human and Human Genome databases, and created a custom reports to identify all peptide matches from the Human genome search above the homology threshold with no equivalent sequence match (whether above the homology threshold or not) in the IPI Human search. By doing this we produce a list of peptides unique to the human genome search which we can use to look for novel peptide matches, possible sequencing errors, SNPs and other polymorphisms
29
: Problem solving with Mascot Integra © 2006 Matrix Science
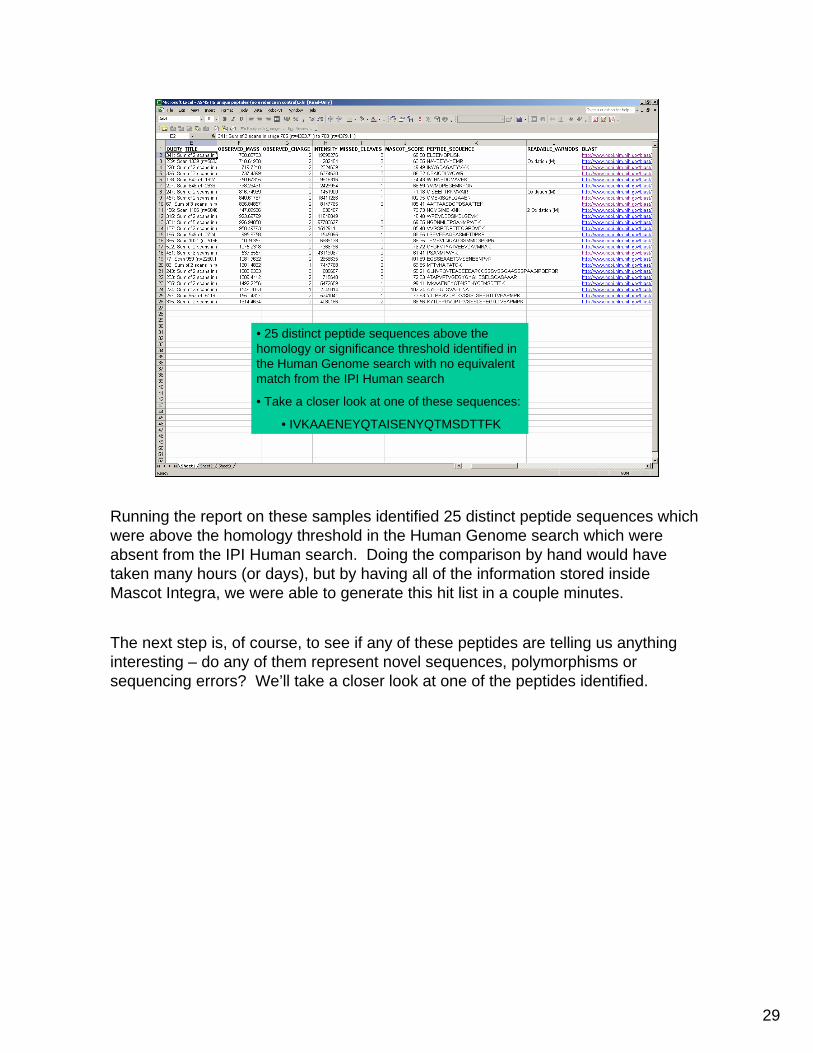
• 25 distinct peptide sequences above the homology or significance threshold identified in the Human Genome search with no equivalent match from the IPI Human search
• Take a closer look at one of these sequences:
• IVKAAENEYQTAISENYQTMSDTTFK
Running the report on these samples identified 25 distinct peptide sequences which were above the homology threshold in the Human Genome search which were absent from the IPI Human search. Doing the comparison by hand would have taken many hours (or days), but by having all of the information stored inside Mascot Integra, we were able to generate this hit list in a couple minutes.
The next step is, of course, to see if any of these peptides are telling us anything interesting – do any of them represent novel sequences, polymorphisms or sequencing errors? We’ll take a closer look at one of the peptides identified.
30
: Problem solving with Mascot Integra © 2006 Matrix Science
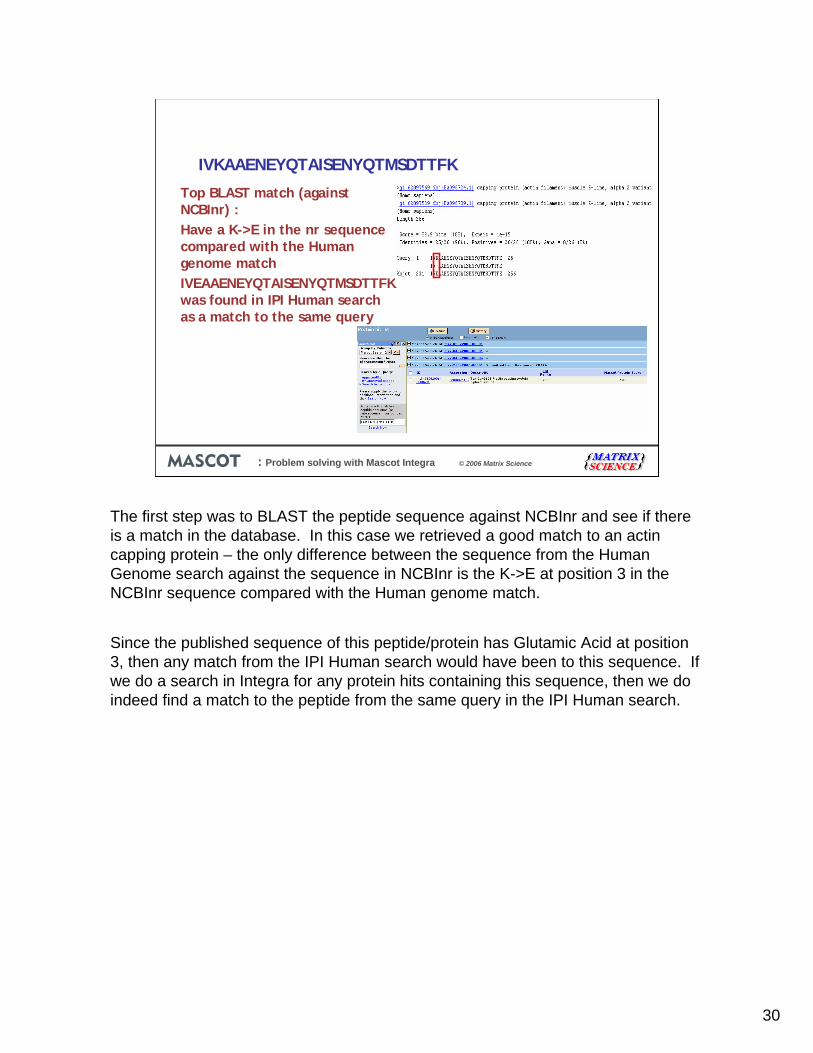
IVKAAENEYQTAISENYQTMSDTTFK
Top BLAST match (against NCBInr) :Have a K->E in the nr sequence compared with the Human genome matchIVEAAENEYQTAISENYQTMSDTTFK was found in IPI Human search as a match to the same query
The first step was to BLAST the peptide sequence against NCBInr and see if there is a match in the database. In this case we retrieved a good match to an actincapping protein – the only difference between the sequence from the Human Genome search against the sequence in NCBInr is the K->E at position 3 in the NCBInr sequence compared with the Human genome match.
Since the published sequence of this peptide/protein has Glutamic Acid at position 3, then any match from the IPI Human search would have been to this sequence. If we do a search in Integra for any protein hits containing this sequence, then we do indeed find a match to the peptide from the same query in the IPI Human search.
31
: Problem solving with Mascot Integra © 2006 Matrix Science
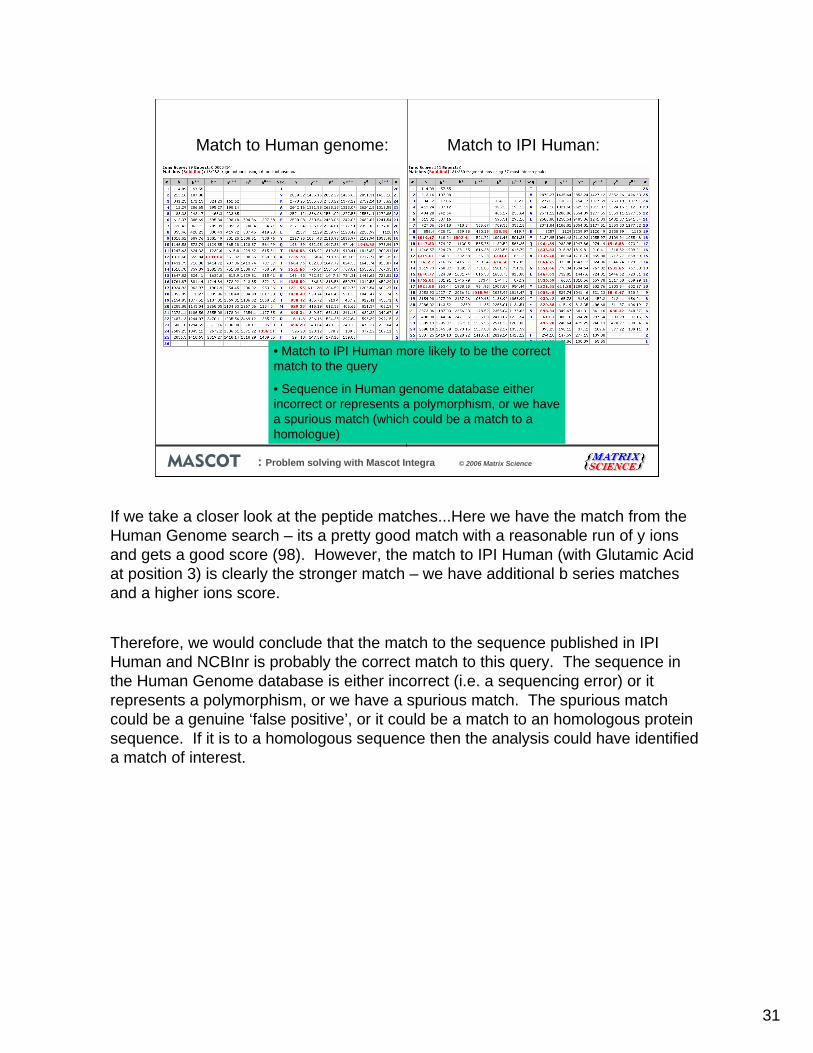
Match to Human genome: Match to IPI Human:
• Match to IPI Human more likely to be the correct match to the query
• Sequence in Human genome database either incorrect or represents a polymorphism, or we have a spurious match (which could be a match to a homologue)
If we take a closer look at the peptide matches...Here we have the match from the Human Genome search – its a pretty good match with a reasonable run of y ions and gets a good score (98). However, the match to IPI Human (with Glutamic Acid at position 3) is clearly the stronger match – we have additional b series matches and a higher ions score.
Therefore, we would conclude that the match to the sequence published in IPI Human and NCBInr is probably the correct match to this query. The sequence in the Human Genome database is either incorrect (i.e. a sequencing error) or it represents a polymorphism, or we have a spurious match. The spurious match could be a genuine ‘false positive’, or it could be a match to an homologous protein sequence. If it is to a homologous sequence then the analysis could have identified a match of interest.
32
: Problem solving with Mascot Integra © 2006 Matrix Science
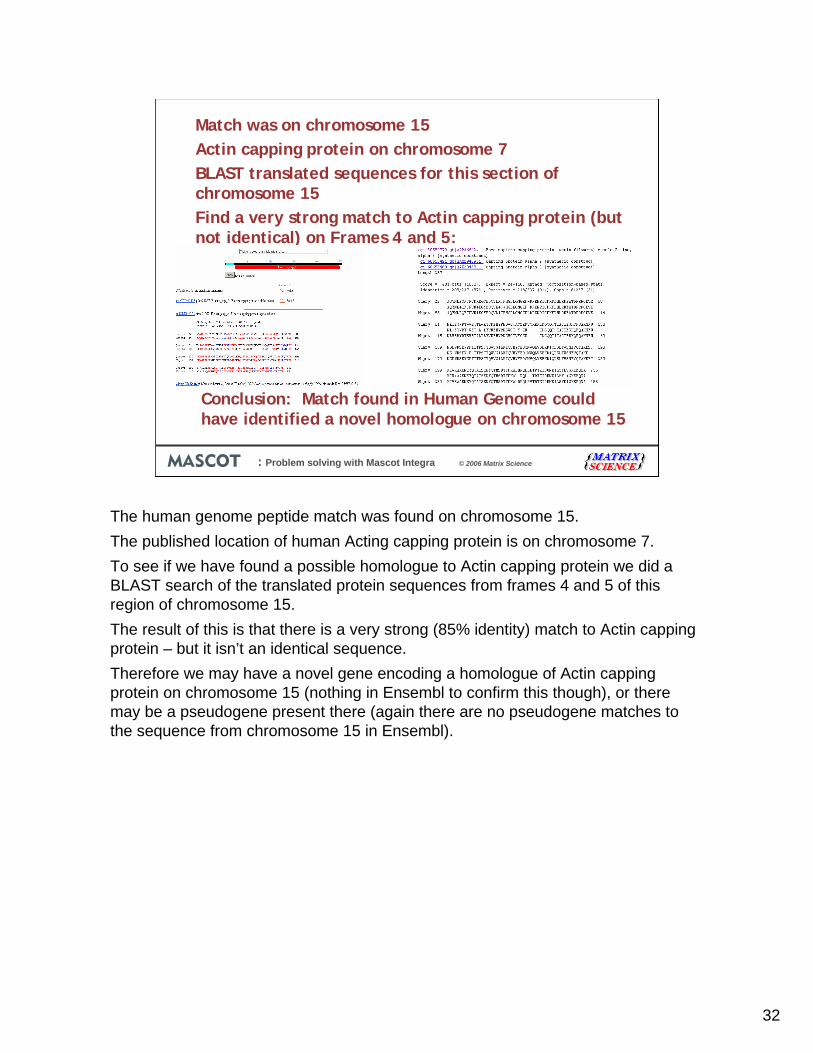
Match was on chromosome 15Actin capping protein on chromosome 7BLAST translated sequences for this section of chromosome 15Find a very strong match to Actin capping protein (but not identical) on Frames 4 and 5:
Conclusion: Match found in Human Genome couldhave identified a novel homologue on chromosome 15
The human genome peptide match was found on chromosome 15.The published location of human Acting capping protein is on chromosome 7.To see if we have found a possible homologue to Actin capping protein we did a BLAST search of the translated protein sequences from frames 4 and 5 of this region of chromosome 15.The result of this is that there is a very strong (85% identity) match to Actin capping protein – but it isn’t an identical sequence.Therefore we may have a novel gene encoding a homologue of Actin capping protein on chromosome 15 (nothing in Ensembl to confirm this though), or there may be a pseudogene present there (again there are no pseudogene matches to the sequence from chromosome 15 in Ensembl).
33
: Problem solving with Mascot Integra © 2006 Matrix Science
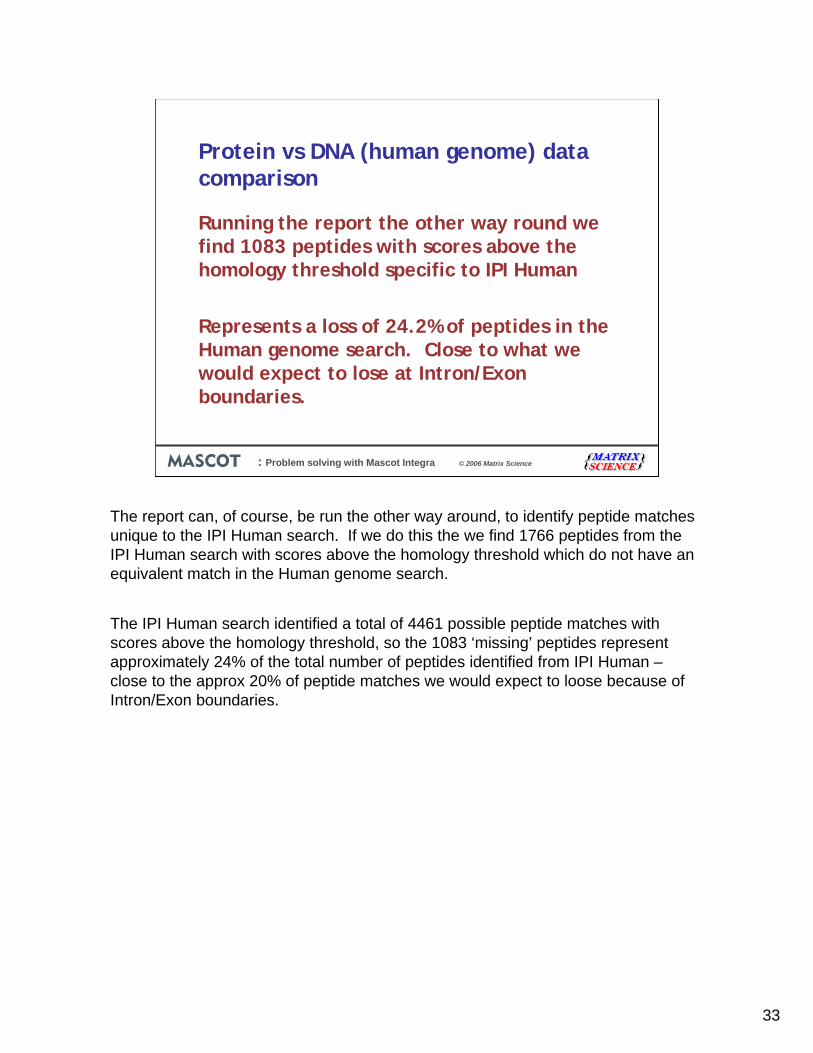
Protein vs DNA (human genome) data comparison
Running the report the other way round we find 1083 peptides with scores above the homology threshold specific to IPI Human
Represents a loss of 24.2% of peptides in the Human genome search. Close to what we would expect to lose at Intron/Exonboundaries.
The report can, of course, be run the other way around, to identify peptide matches unique to the IPI Human search. If we do this the we find 1766 peptides from the IPI Human search with scores above the homology threshold which do not have an equivalent match in the Human genome search.
The IPI Human search identified a total of 4461 possible peptide matches with scores above the homology threshold, so the 1083 ‘missing’ peptides represent approximately 24% of the total number of peptides identified from IPI Human –close to the approx 20% of peptide matches we would expect to loose because of Intron/Exon boundaries.
34
: Problem solving with Mascot Integra © 2006 Matrix Science
Advanced reporting
96 well plate assay report.PMF report that satisfies MCP guidelines.
•Blast cluster of proteins to determine nearest non homologous match
•Meet all of the MCP criteria
Now on to more advanced reporting. As I said earlier we could use many different computer languages to do this but for these examples I used the perl scripting language.
The first example is of an assay report for a 96 well plate.The second is a report for the proteins identified from a 2D gel by peptide mass fingerprinting and it has to satisfy the Molecular and Cellular proteomics guide lines
35
: Problem solving with Mascot Integra © 2006 Matrix Science
96 well plate assay report
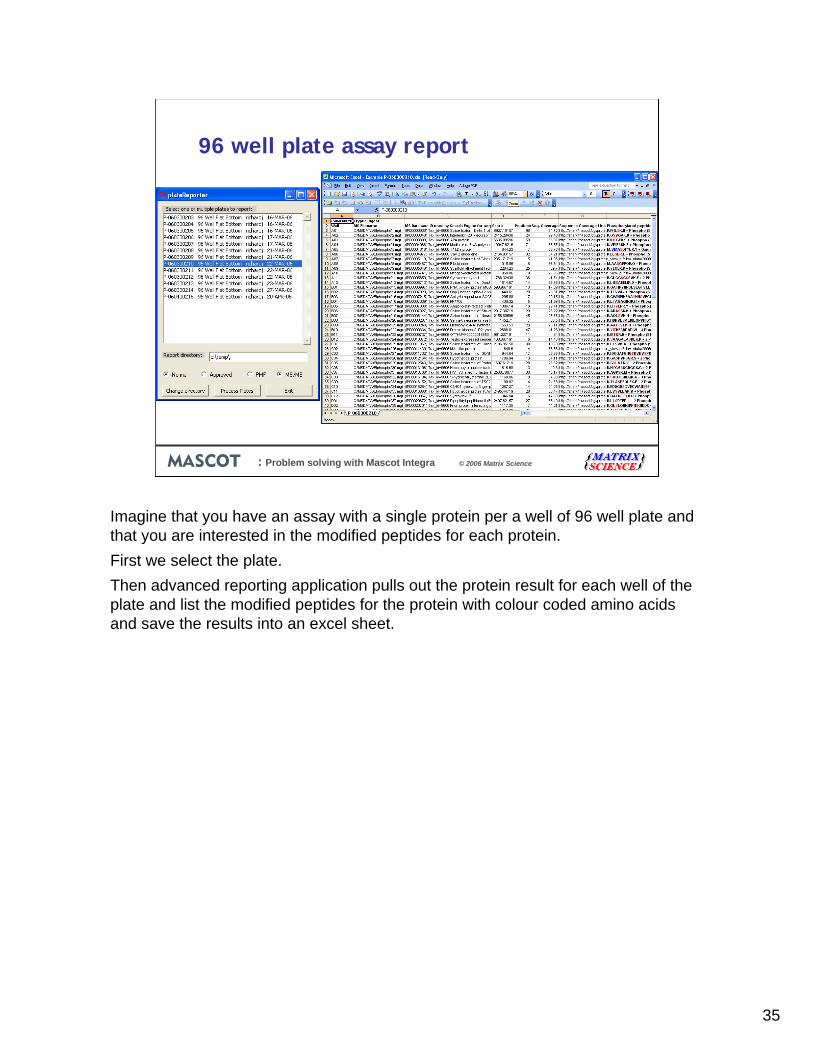
Imagine that you have an assay with a single protein per a well of 96 well plate and that you are interested in the modified peptides for each protein.First we select the plate.Then advanced reporting application pulls out the protein result for each well of the plate and list the modified peptides for the protein with colour coded amino acids and save the results into an excel sheet.
36
: Problem solving with Mascot Integra © 2006 Matrix Science
Molecular Cellular Proteomics publication guidelines
Guideline 1: Supporting information •The method and/or program (including version number) used to create the "peak list" from the raw data and the parameters used in the creation of this peak list.
•The name and version of the program(s) used for database searching and the values of search parameters.
•The name and version of the sequence database(s) used.
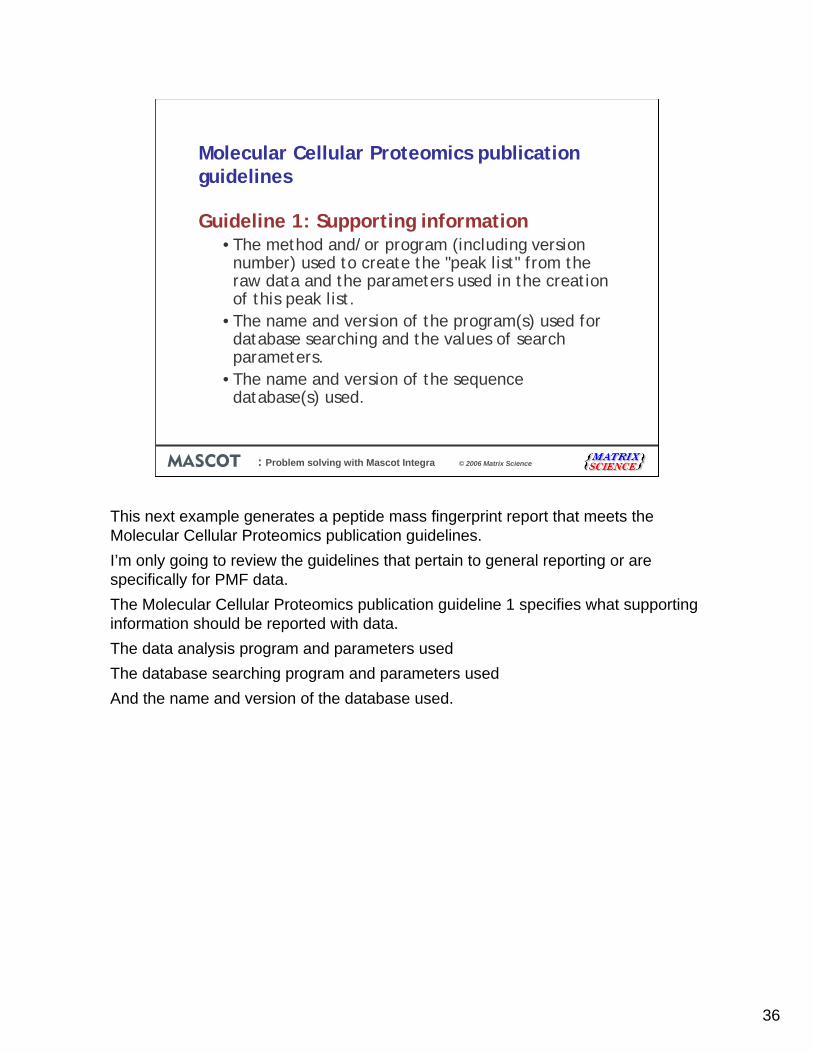
This next example generates a peptide mass fingerprint report that meets the Molecular Cellular Proteomics publication guidelines.I’m only going to review the guidelines that pertain to general reporting or are specifically for PMF data.The Molecular Cellular Proteomics publication guideline 1 specifies what supporting information should be reported with data.The data analysis program and parameters usedThe database searching program and parameters usedAnd the name and version of the database used.
37
: Problem solving with Mascot Integra © 2006 Matrix Science
Molecular Cellular Proteomics publication guidelines
Guideline 2: Information for each protein sequence identified should specify the following:
• Accession number and database source; • Score(s) and any associated statistical information obtained for
searches conducted; • Sequence coverage• Total number of peptides assigned to the protein.
Guideline 3: Additional potentially valuable information • Retention time of each peptide• Observation of multiple charge states• Multiple observations of the same peptide• Flanking residues• Start and end positions of peptides in proteins
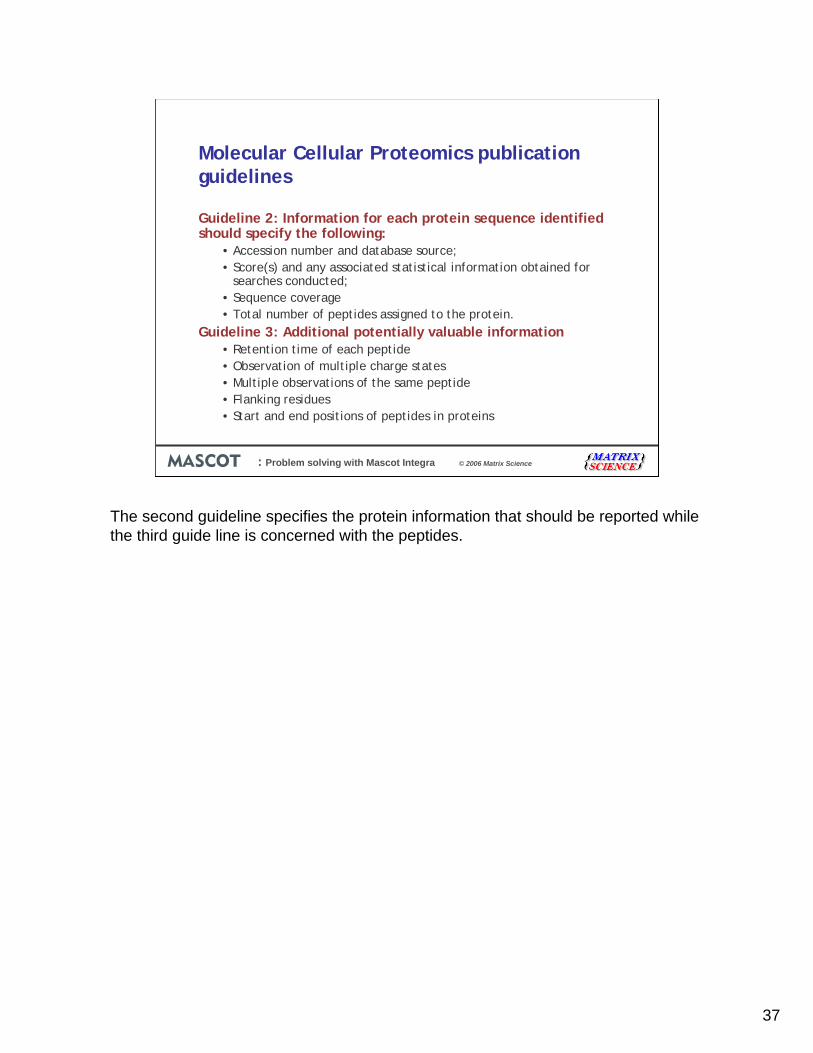
The second guideline specifies the protein information that should be reported while the third guide line is concerned with the peptides.
38
: Problem solving with Mascot Integra © 2006 Matrix Science
Molecular Cellular Proteomics publication guidelines
Guideline 6 Peptide Mass Fingerprinting •Number of matched peaks•Number of unmatched peaks•Sequence coverage•In addition to the score for the top match we must also show the score for the highest ranked hit to a non-homologous protein
Guideline 6 is for peptide mass fingerprinting and asks for the number of matched and unmatched peaks, sequence coverage and the score of the nearest non-homologous protein hit.Depending on the redundancy of the database this may not necessarily be the second ranked protein hit. We determine the score for the highest ranked hit to a non-homologous protein with BLAST cluster.
39
: Problem solving with Mascot Integra © 2006 Matrix Science
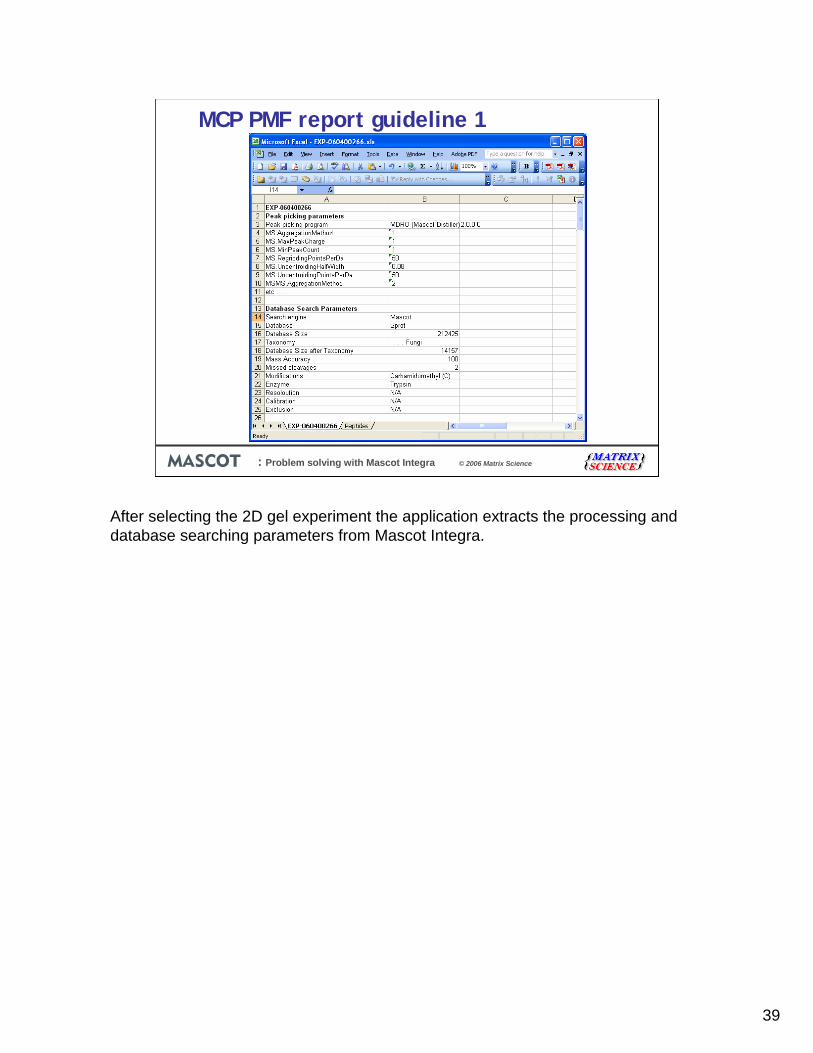
MCP PMF report guideline 1
After selecting the 2D gel experiment the application extracts the processing and database searching parameters from Mascot Integra.
40
: Problem solving with Mascot Integra © 2006 Matrix Science
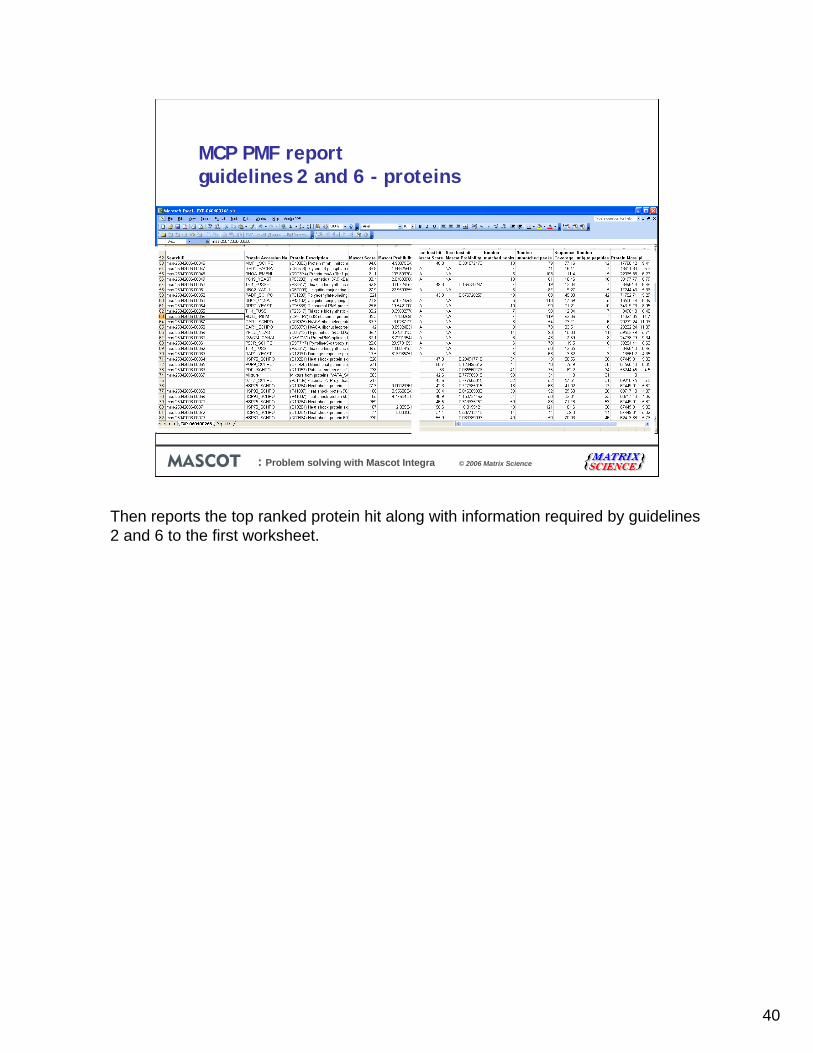
MCP PMF report guidelines 2 and 6 - proteins
Then reports the top ranked protein hit along with information required by guidelines 2 and 6 to the first worksheet.
41
: Problem solving with Mascot Integra © 2006 Matrix Science
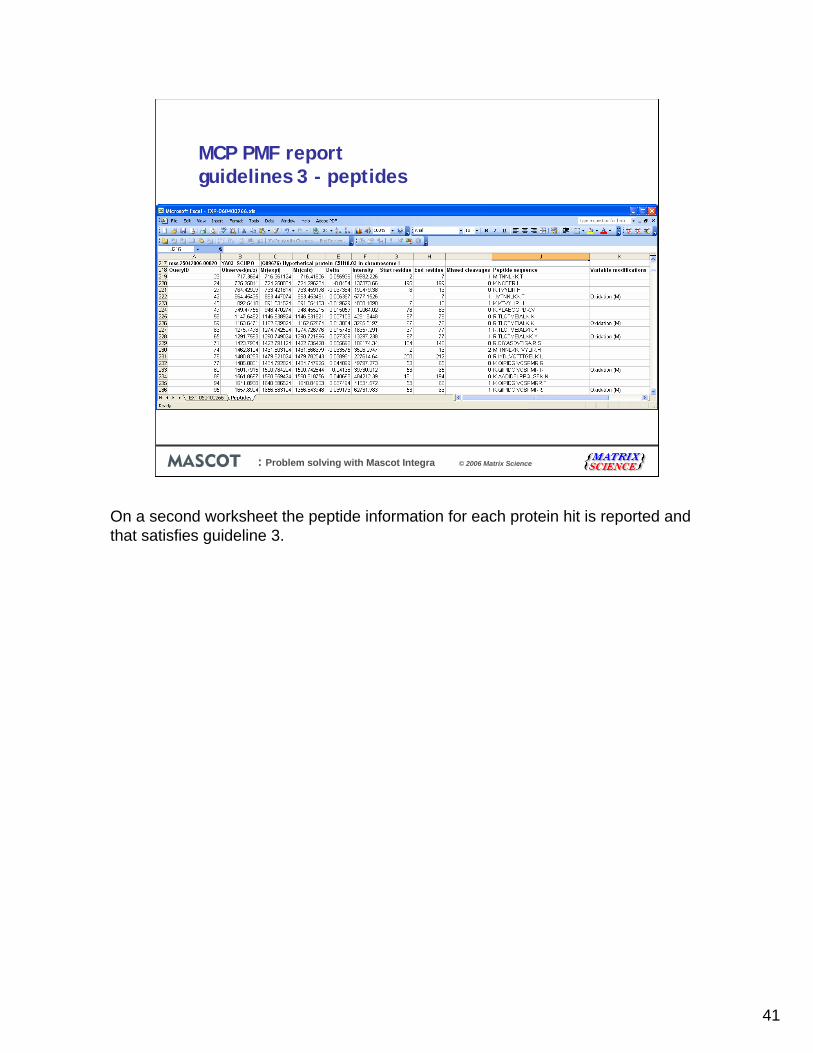
MCP PMF report guidelines 3 - peptides
On a second worksheet the peptide information for each protein hit is reported and that satisfies guideline 3.
42
: Problem solving with Mascot Integra © 2006 Matrix Science
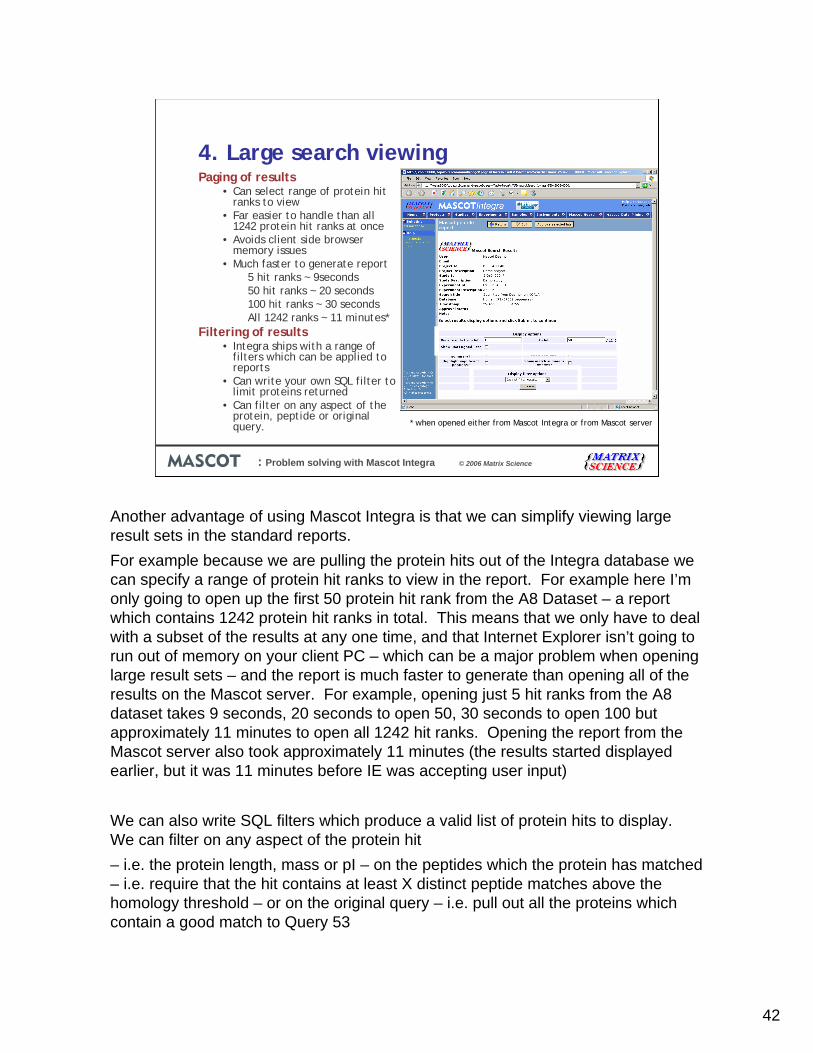
4. Large search viewingPaging of results
• Can select range of protein hit ranks to view
• Far easier to handle than all 1242 protein hit ranks at once
• Avoids client side browser memory issues
• Much faster to generate report5 hit ranks ~ 9seconds50 hit ranks ~ 20 seconds100 hit ranks ~ 30 secondsAll 1242 ranks ~ 11 minutes*
Filtering of results• Integra ships with a range of
filters which can be applied to reports
• Can write your own SQL filter to limit proteins returned
• Can filter on any aspect of the protein, peptide or original query. * when opened either from Mascot Integra or from Mascot server
Another advantage of using Mascot Integra is that we can simplify viewing large result sets in the standard reports.For example because we are pulling the protein hits out of the Integra database we can specify a range of protein hit ranks to view in the report. For example here I’m only going to open up the first 50 protein hit rank from the A8 Dataset – a report which contains 1242 protein hit ranks in total. This means that we only have to deal with a subset of the results at any one time, and that Internet Explorer isn’t going to run out of memory on your client PC – which can be a major problem when opening large result sets – and the report is much faster to generate than opening all of the results on the Mascot server. For example, opening just 5 hit ranks from the A8 dataset takes 9 seconds, 20 seconds to open 50, 30 seconds to open 100 but approximately 11 minutes to open all 1242 hit ranks. Opening the report from the Mascot server also took approximately 11 minutes (the results started displayed earlier, but it was 11 minutes before IE was accepting user input)
We can also write SQL filters which produce a valid list of protein hits to display. We can filter on any aspect of the protein hit – i.e. the protein length, mass or pI – on the peptides which the protein has matched – i.e. require that the hit contains at least X distinct peptide matches above the homology threshold – or on the original query – i.e. pull out all the proteins which contain a good match to Query 53
43
: Problem solving with Mascot Integra © 2006 Matrix Science
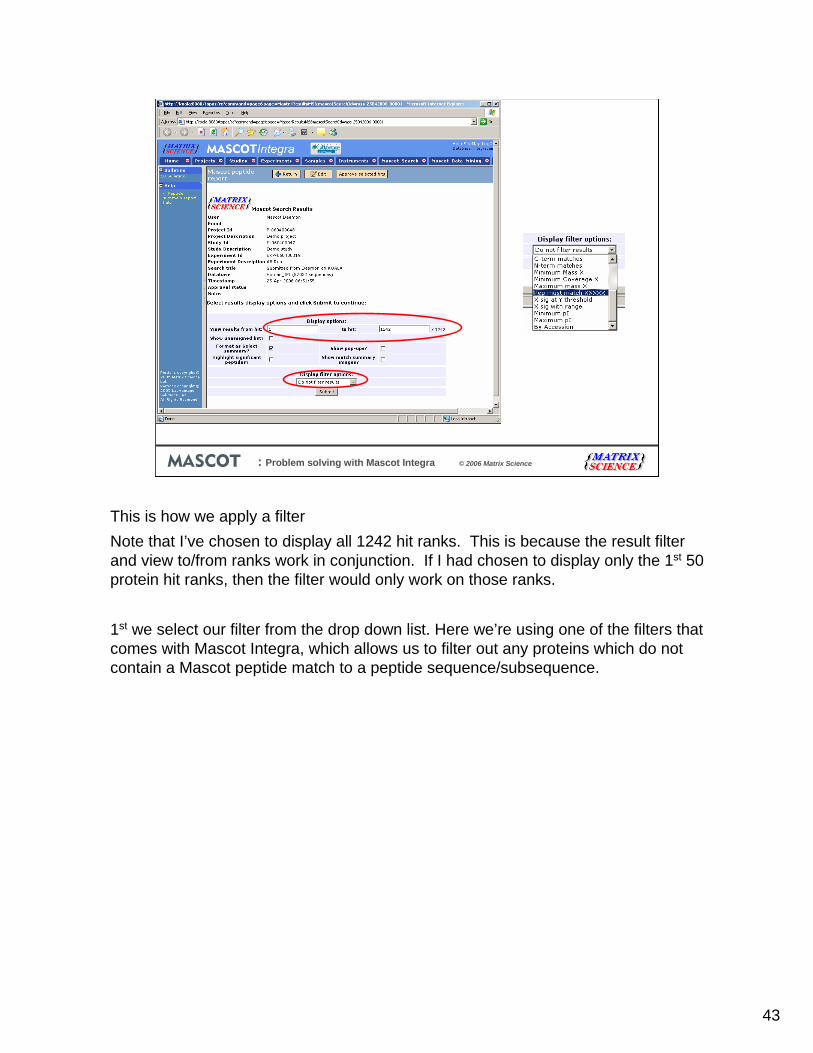
This is how we apply a filterNote that I’ve chosen to display all 1242 hit ranks. This is because the result filter and view to/from ranks work in conjunction. If I had chosen to display only the 1st 50 protein hit ranks, then the filter would only work on those ranks.
1st we select our filter from the drop down list. Here we’re using one of the filters that comes with Mascot Integra, which allows us to filter out any proteins which do not contain a Mascot peptide match to a peptide sequence/subsequence.
44
: Problem solving with Mascot Integra © 2006 Matrix Science
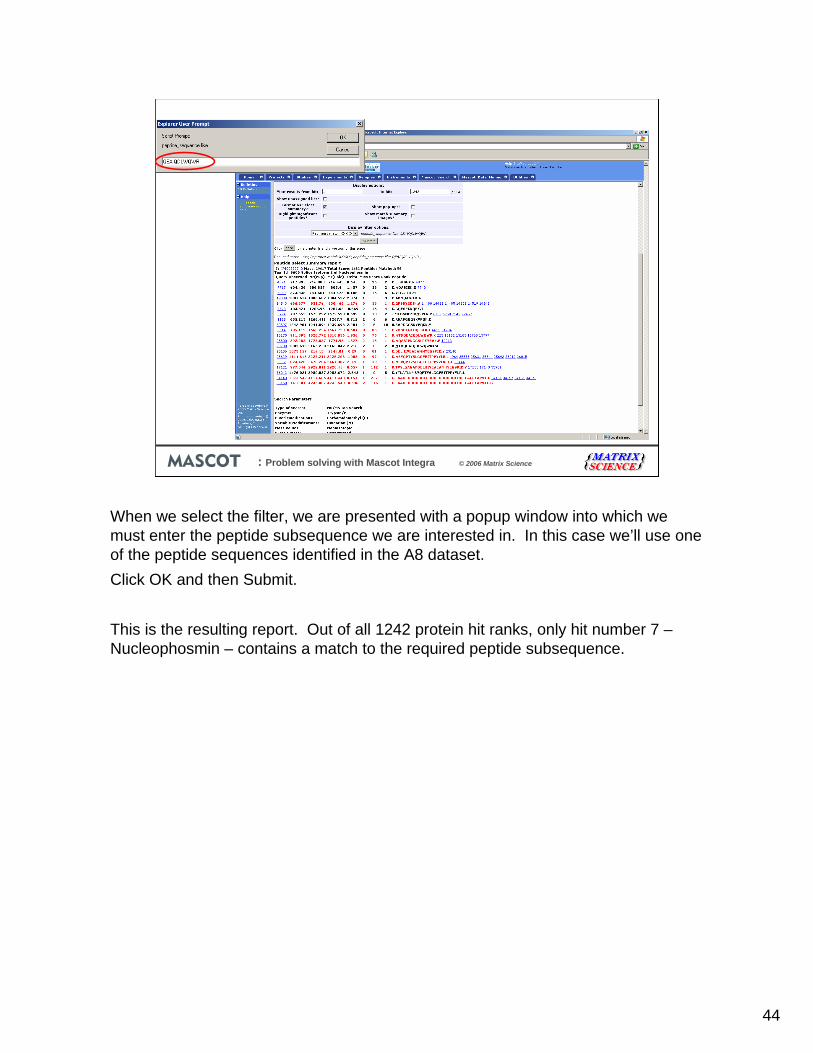
When we select the filter, we are presented with a popup window into which we must enter the peptide subsequence we are interested in. In this case we’ll use one of the peptide sequences identified in the A8 dataset.Click OK and then Submit.
This is the resulting report. Out of all 1242 protein hit ranks, only hit number 7 –Nucleophosmin – contains a match to the required peptide subsequence.
45
: Problem solving with Mascot Integra © 2006 Matrix Science
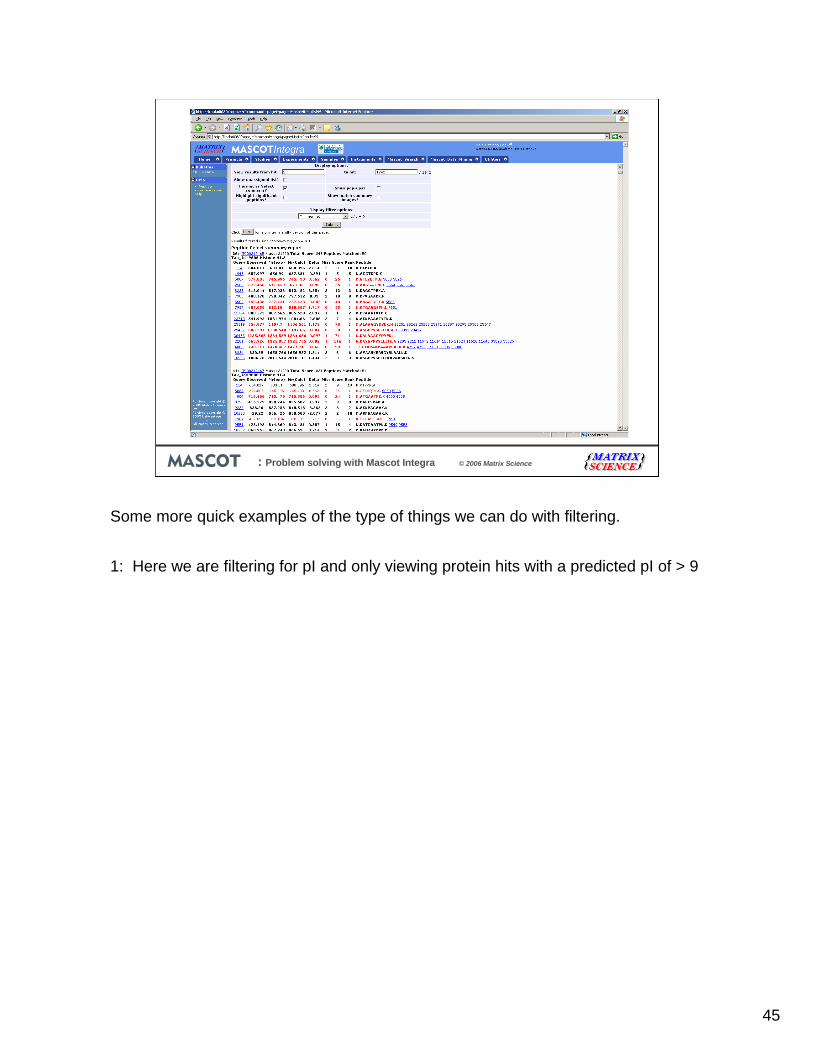
Some more quick examples of the type of things we can do with filtering.
1: Here we are filtering for pI and only viewing protein hits with a predicted pI of > 9
46
: Problem solving with Mascot Integra © 2006 Matrix Science
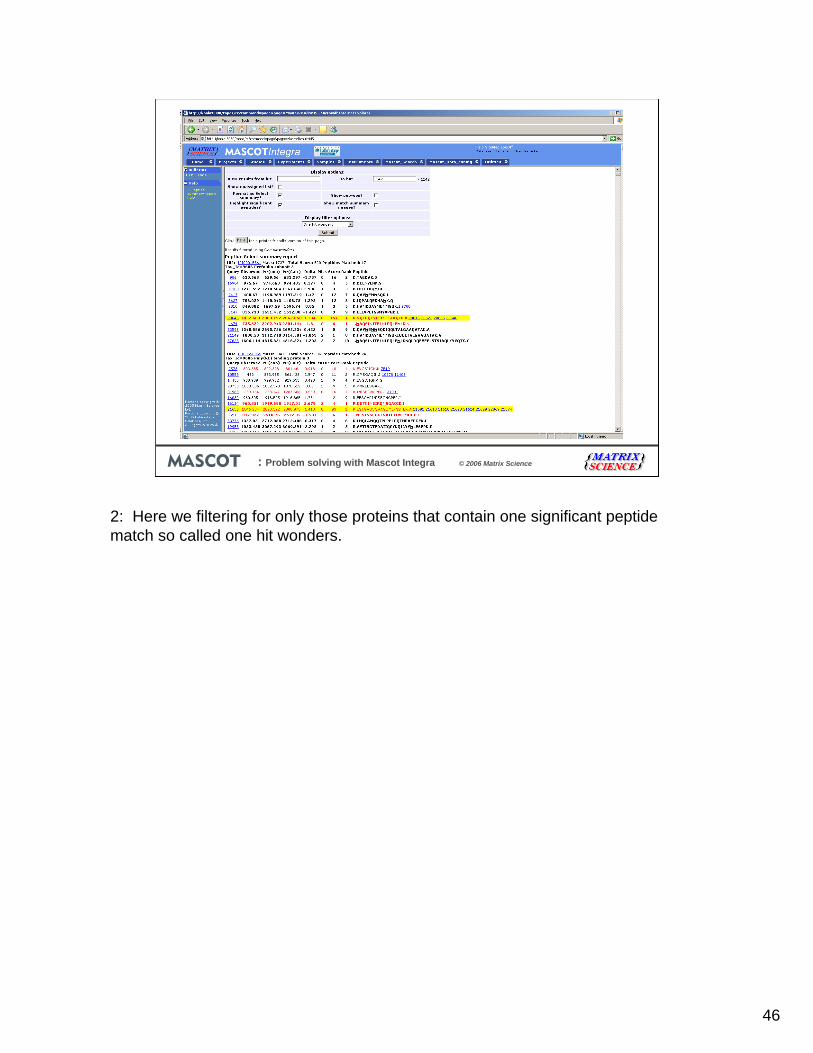
2: Here we filtering for only those proteins that contain one significant peptide match so called one hit wonders.
47
: Problem solving with Mascot Integra © 2006 Matrix Science
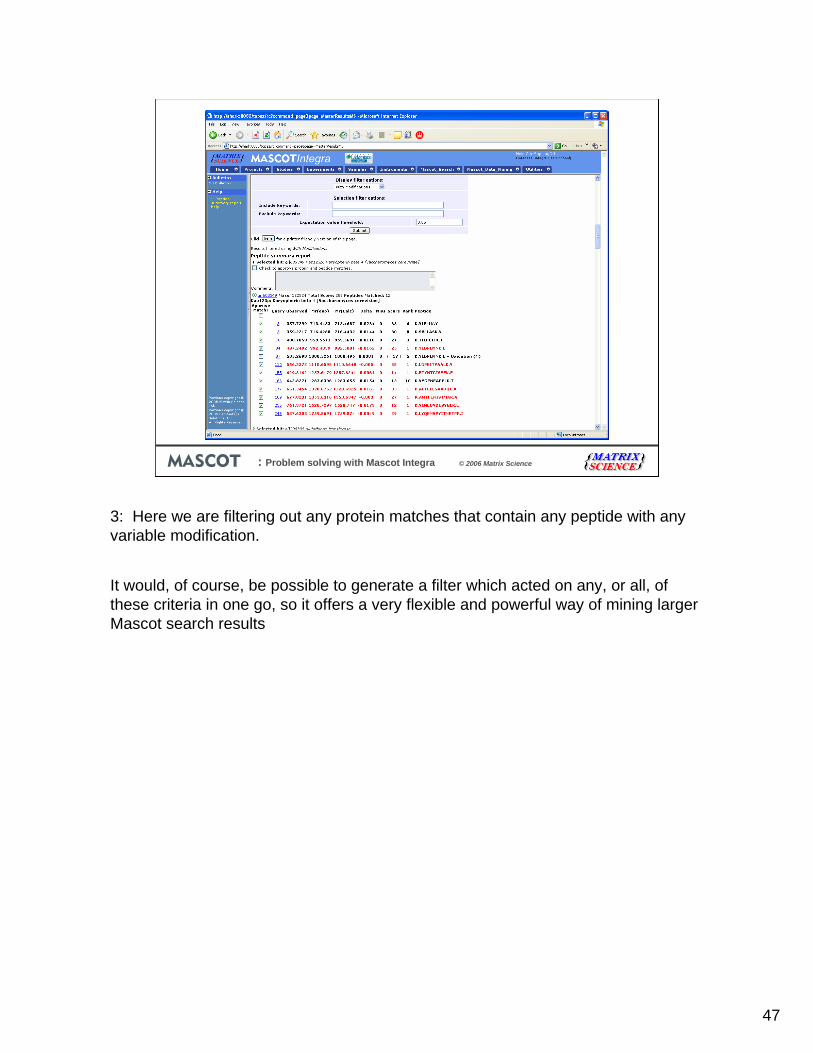
3: Here we are filtering out any protein matches that contain any peptide with any variable modification.
It would, of course, be possible to generate a filter which acted on any, or all, of these criteria in one go, so it offers a very flexible and powerful way of mining larger Mascot search results
48
: Problem solving with Mascot Integra © 2006 Matrix Science
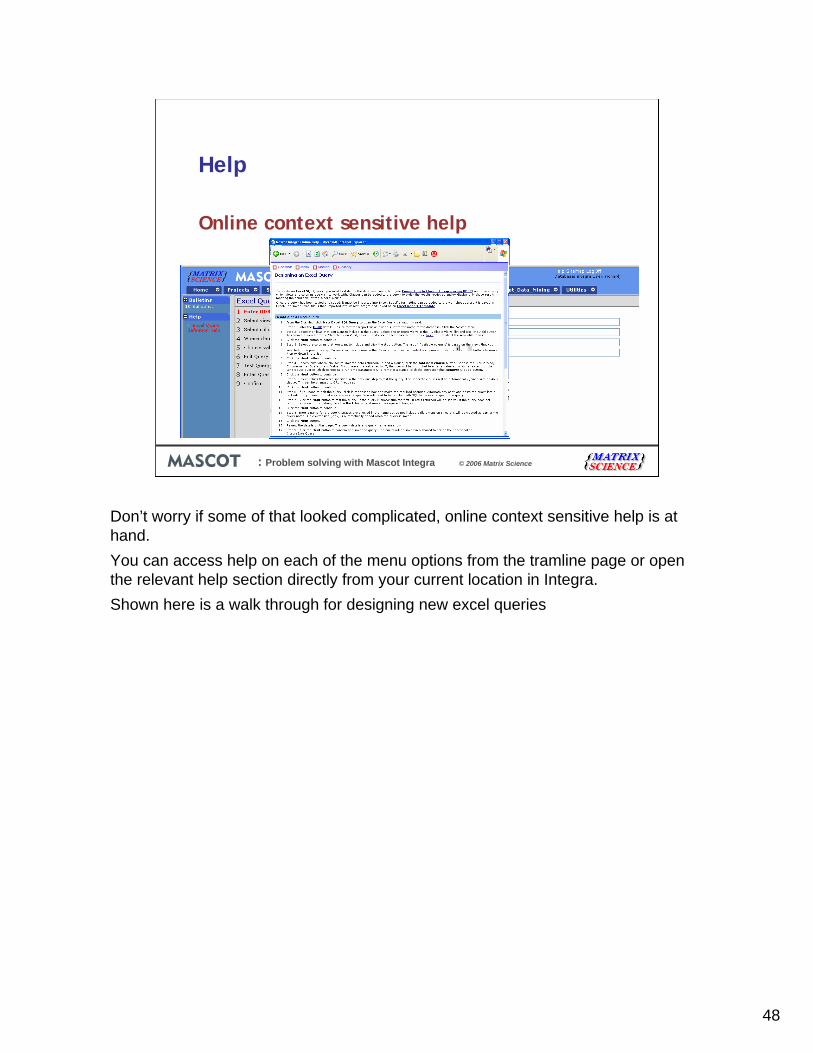
Help
Online context sensitive help
Don’t worry if some of that looked complicated, online context sensitive help is at hand.You can access help on each of the menu options from the tramline page or open the relevant help section directly from your current location in Integra.Shown here is a walk through for designing new excel queries
49
: Problem solving with Mascot Integra © 2006 Matrix Science
Acknowledgments
Pascal Wather•Department of Biochemistry, University of Zurich, Switzerland
and Bertran Gerrits for mouse ICAT dataset•Functional Genomics Center Zurich, Uni|ETHZurich, Switzerland
Katheryn Resing for A8 dataset•University of Colorado, USA
I would like to thank two labs for the data sets,Pascal Wather and Bertran Gerrits for the use of the Mouse ICAT data andKatheryn Resing for making the A8 dataset publicly available on the Peptide Atlas website.