examination report · the part 1 frcophth sub-committee considered the success of a minimally...
TRANSCRIPT
Page 1 of 15 Commercial-in-Confidence 04 January 2019
Examination Report October 2018 Part 1 Fellowship Exam of The
Royal College of Ophthalmologists
Examination
Matthew Turner, Ben Smith
Page 2 of 15 Commercial-in-Confidence 04 January 2019
Contents 1 Summary ................................................................................................................................................. 3
2 MCQ paper .............................................................................................................................................. 3
2.1 Paper statistics .............................................................................................................................. 3
2.2 Quality of questions ...................................................................................................................... 5
2.3 Standard setting ........................................................................................................................... 5
3 CRQ paper ............................................................................................................................................... 7
3.1 Paper statistics .............................................................................................................................. 7
3.2 Standard setting ........................................................................................................................... 9
4 Overall Results .......................................................................................................................................10
4.1 Comparison to previous Part 1 examinations ............................................................................ 12
4.2 Breakdown of Results ................................................................................................................. 13
Appendix 1: Overall results for each deanery............................................................................................15
Page 3 of 15 Commercial-in-Confidence 04 January 2019
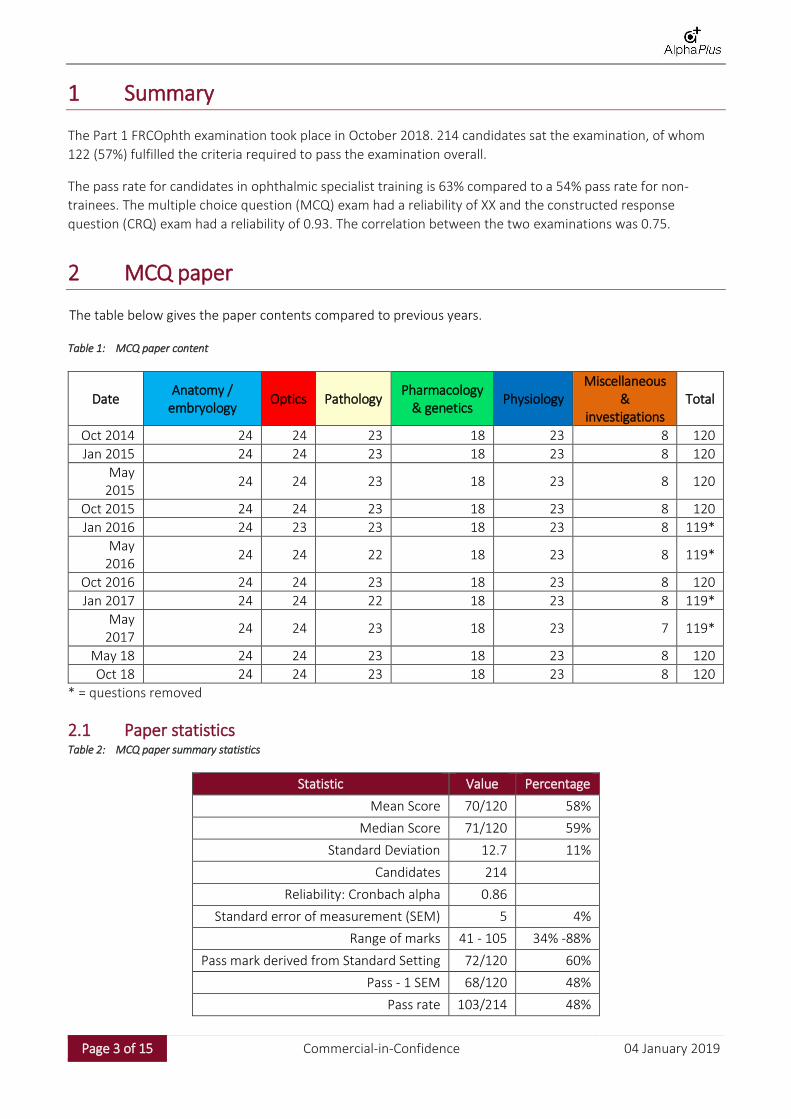
1 Summary
The Part 1 FRCOphth examination took place in October 2018. 214 candidates sat the examination, of whom
122 (57%) fulfilled the criteria required to pass the examination overall.
The pass rate for candidates in ophthalmic specialist training is 63% compared to a 54% pass rate for non-
trainees. The multiple choice question (MCQ) exam had a reliability of XX and the constructed response
question (CRQ) exam had a reliability of 0.93. The correlation between the two examinations was 0.75.
2 MCQ paper
The table below gives the paper contents compared to previous years.
Table 1: MCQ paper content
Date Anatomy /
embryology Optics Pathology
Pharmacology & genetics
Physiology Miscellaneous
& investigations
Total
Oct 2014 24 24 23 18 23 8 120
Jan 2015 24 24 23 18 23 8 120
May 2015
24 24 23 18 23 8 120
Oct 2015 24 24 23 18 23 8 120
Jan 2016 24 23 23 18 23 8 119*
May 2016
24 24 22 18 23 8 119*
Oct 2016 24 24 23 18 23 8 120
Jan 2017 24 24 22 18 23 8 119*
May 2017
24 24 23 18 23 7 119*
May 18 24 24 23 18 23 8 120
Oct 18 24 24 23 18 23 8 120
* = questions removed
2.1 Paper statistics Table 2: MCQ paper summary statistics
Statistic Value Percentage
Mean Score 70/120 58%
Median Score 71/120 59%
Standard Deviation 12.7 11%
Candidates 214
Reliability: Cronbach alpha 0.86
Standard error of measurement (SEM) 5 4%
Range of marks 41 - 105 34% -88%
Pass mark derived from Standard Setting 72/120 60%
Pass - 1 SEM 68/120 48%
Pass rate 103/214 48%
Page 4 of 15 Commercial-in-Confidence 04 January 2019
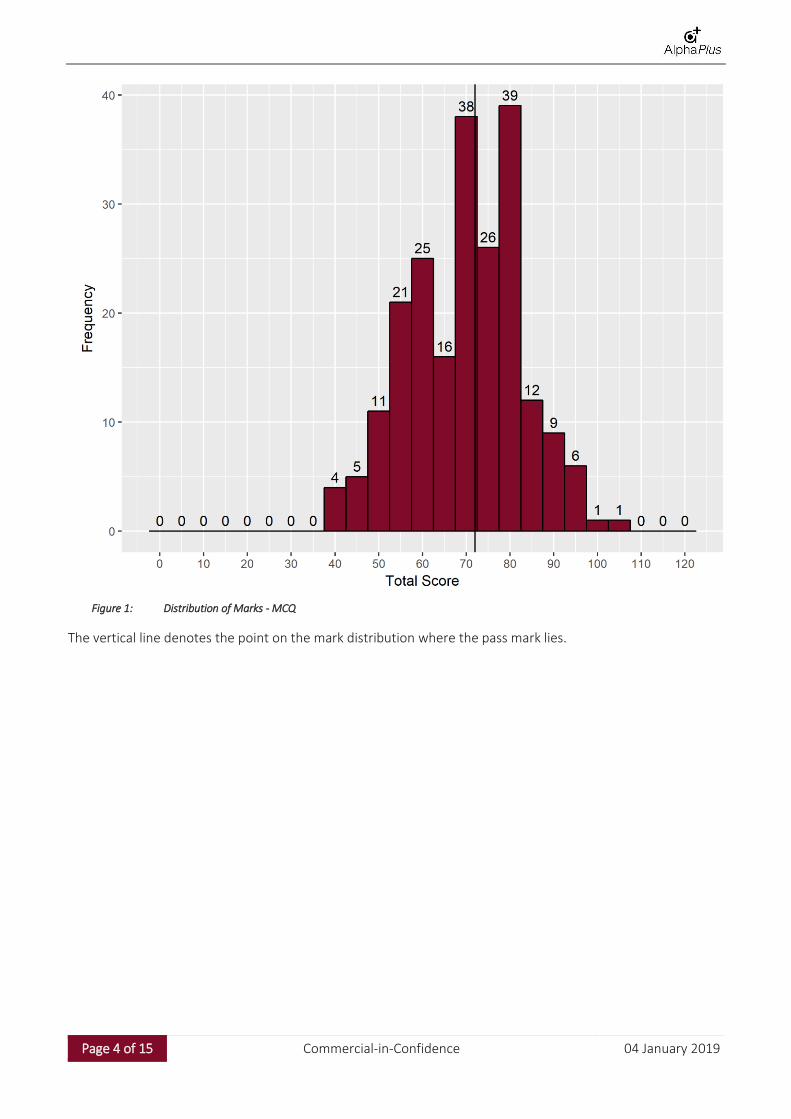
Figure 1: Distribution of Marks - MCQ
The vertical line denotes the point on the mark distribution where the pass mark lies.
Page 5 of 15 Commercial-in-Confidence 04 January 2019
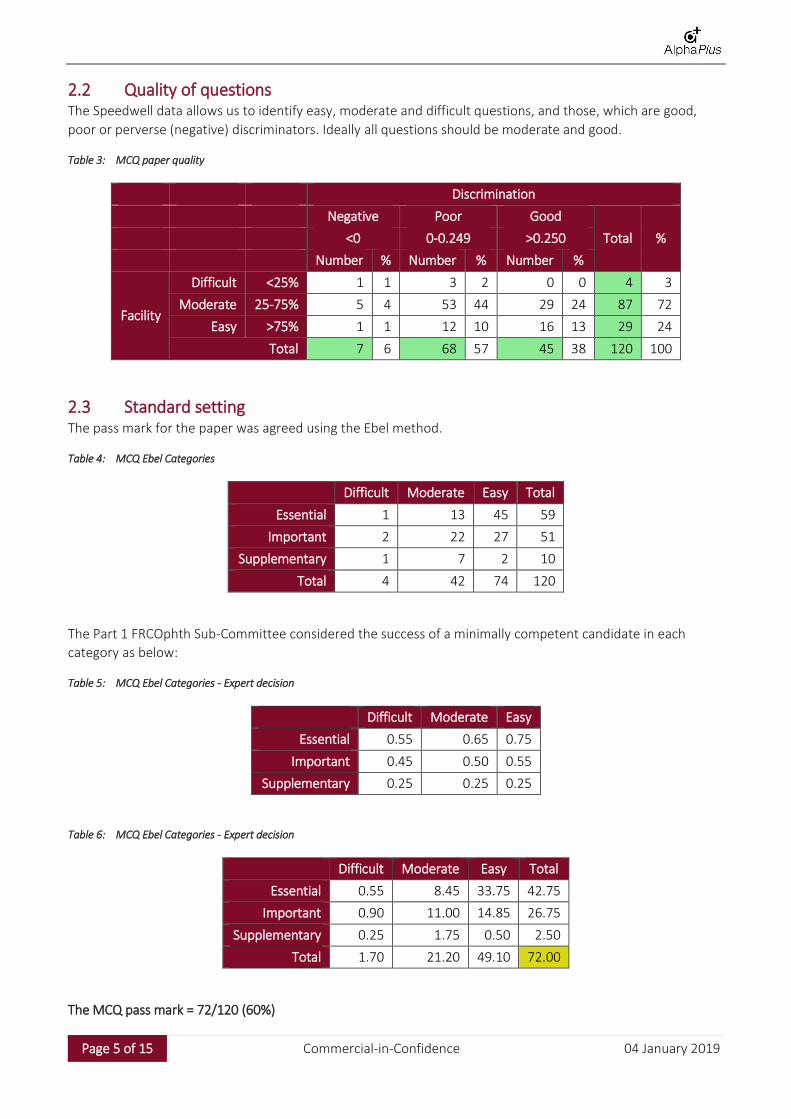
2.2 Quality of questions The Speedwell data allows us to identify easy, moderate and difficult questions, and those, which are good,
poor or perverse (negative) discriminators. Ideally all questions should be moderate and good.
Table 3: MCQ paper quality
Discrimination
Negative Poor Good
Total % <0 0-0.249 >0.250
Number % Number % Number %
Facility
Difficult <25% 1 1 3 2 0 0 4 3
Moderate 25-75% 5 4 53 44 29 24 87 72
Easy >75% 1 1 12 10 16 13 29 24
Total 7 6 68 57 45 38 120 100
2.3 Standard setting The pass mark for the paper was agreed using the Ebel method.
Table 4: MCQ Ebel Categories
Difficult Moderate Easy Total
Essential 1 13 45 59
Important 2 22 27 51
Supplementary 1 7 2 10
Total 4 42 74 120
The Part 1 FRCOphth Sub-Committee considered the success of a minimally competent candidate in each
category as below:
Table 5: MCQ Ebel Categories - Expert decision
Difficult Moderate Easy
Essential 0.55 0.65 0.75
Important 0.45 0.50 0.55
Supplementary 0.25 0.25 0.25
Table 6: MCQ Ebel Categories - Expert decision
Difficult Moderate Easy Total
Essential 0.55 8.45 33.75 42.75
Important 0.90 11.00 14.85 26.75
Supplementary 0.25 1.75 0.50 2.50
Total 1.70 21.20 49.10 72.00
The MCQ pass mark = 72/120 (60%)
Page 6 of 15 Commercial-in-Confidence 04 January 2019
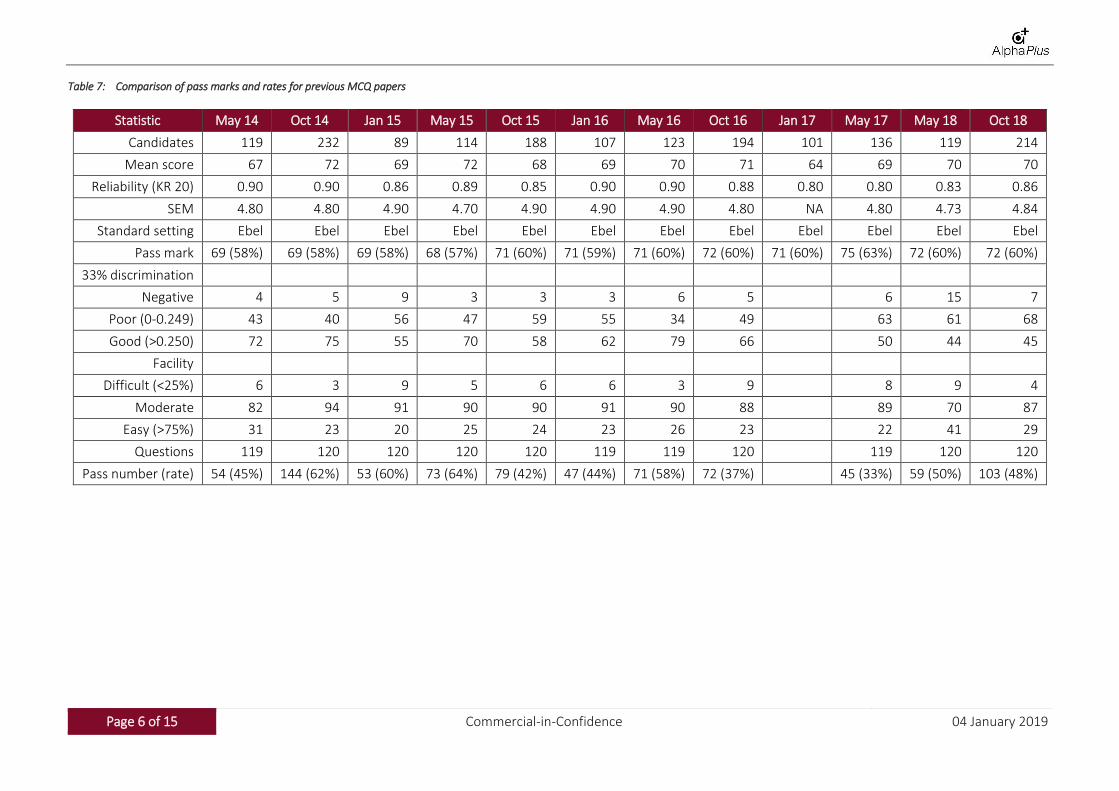
Table 7: Comparison of pass marks and rates for previous MCQ papers
Statistic May 14 Oct 14 Jan 15 May 15 Oct 15 Jan 16 May 16 Oct 16 Jan 17 May 17 May 18 Oct 18
Candidates 119 232 89 114 188 107 123 194 101 136 119 214
Mean score 67 72 69 72 68 69 70 71 64 69 70 70
Reliability (KR 20) 0.90 0.90 0.86 0.89 0.85 0.90 0.90 0.88 0.80 0.80 0.83 0.86
SEM 4.80 4.80 4.90 4.70 4.90 4.90 4.90 4.80 NA 4.80 4.73 4.84
Standard setting Ebel Ebel Ebel Ebel Ebel Ebel Ebel Ebel Ebel Ebel Ebel Ebel
Pass mark 69 (58%) 69 (58%) 69 (58%) 68 (57%) 71 (60%) 71 (59%) 71 (60%) 72 (60%) 71 (60%) 75 (63%) 72 (60%) 72 (60%)
33% discrimination
Negative 4 5 9 3 3 3 6 5 6 15 7
Poor (0-0.249) 43 40 56 47 59 55 34 49 63 61 68
Good (>0.250) 72 75 55 70 58 62 79 66 50 44 45
Facility
Difficult (<25%) 6 3 9 5 6 6 3 9 8 9 4
Moderate 82 94 91 90 90 91 90 88 89 70 87
Easy (>75%) 31 23 20 25 24 23 26 23 22 41 29
Questions 119 120 120 120 120 119 119 120 119 120 120
Pass number (rate) 54 (45%) 144 (62%) 53 (60%) 73 (64%) 79 (42%) 47 (44%) 71 (58%) 72 (37%) 45 (33%) 59 (50%) 103 (48%)
Page 7 of 15 Commercial-in-Confidence 04 January 2019
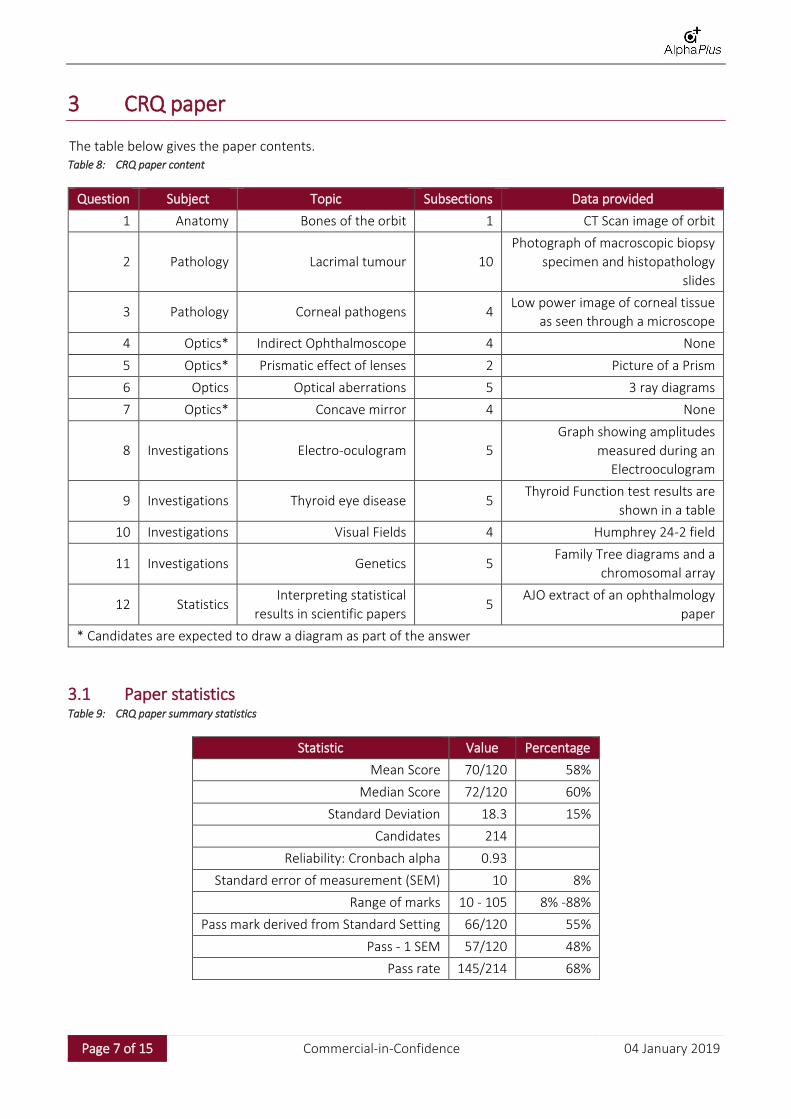
3 CRQ paper
The table below gives the paper contents. Table 8: CRQ paper content
Question Subject Topic Subsections Data provided
1 Anatomy Bones of the orbit 1 CT Scan image of orbit
2 Pathology Lacrimal tumour 10
Photograph of macroscopic biopsy
specimen and histopathology
slides
3 Pathology Corneal pathogens 4 Low power image of corneal tissue
as seen through a microscope
4 Optics* Indirect Ophthalmoscope 4 None
5 Optics* Prismatic effect of lenses 2 Picture of a Prism
6 Optics Optical aberrations 5 3 ray diagrams
7 Optics* Concave mirror 4 None
8 Investigations Electro-oculogram 5
Graph showing amplitudes
measured during an
Electrooculogram
9 Investigations Thyroid eye disease 5 Thyroid Function test results are
shown in a table
10 Investigations Visual Fields 4 Humphrey 24-2 field
11 Investigations Genetics 5 Family Tree diagrams and a
chromosomal array
12 Statistics Interpreting statistical
results in scientific papers 5
AJO extract of an ophthalmology
paper
* Candidates are expected to draw a diagram as part of the answer
3.1 Paper statistics Table 9: CRQ paper summary statistics
Statistic Value Percentage
Mean Score 70/120 58%
Median Score 72/120 60%
Standard Deviation 18.3 15%
Candidates 214
Reliability: Cronbach alpha 0.93
Standard error of measurement (SEM) 10 8%
Range of marks 10 - 105 8% -88%
Pass mark derived from Standard Setting 66/120 55%
Pass - 1 SEM 57/120 48%
Pass rate 145/214 68%
Page 8 of 15 Commercial-in-Confidence 04 January 2019
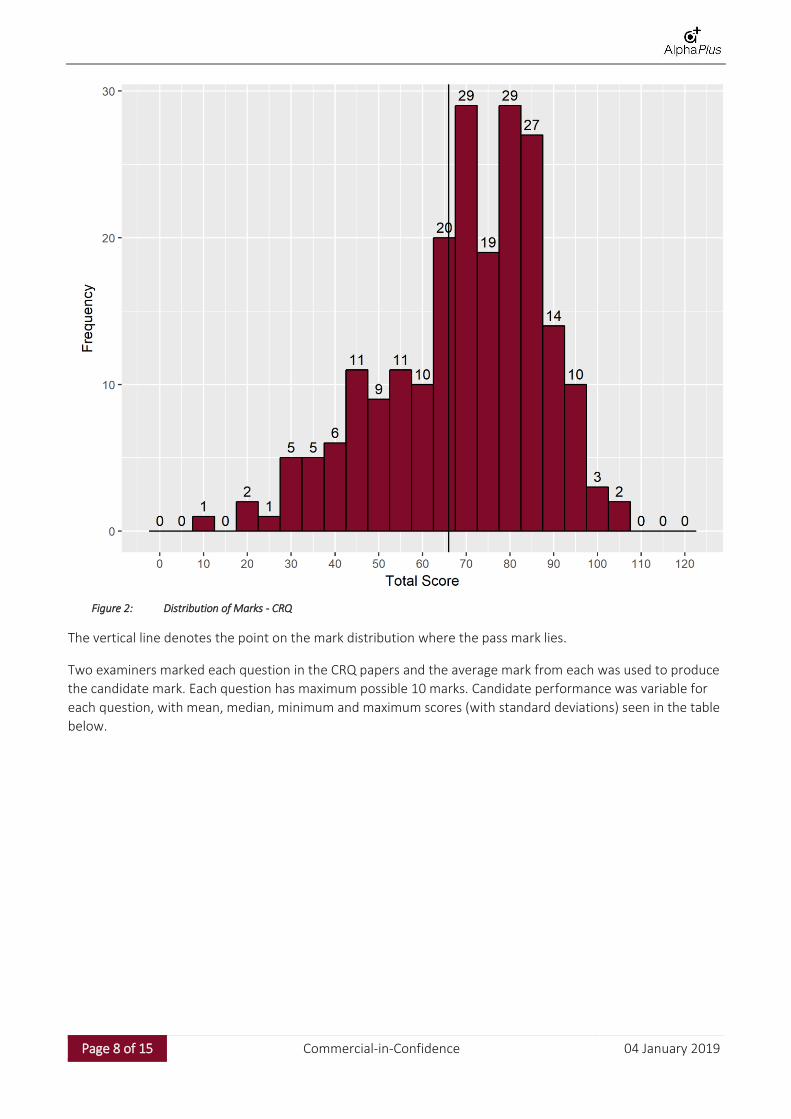
Figure 2: Distribution of Marks - CRQ
The vertical line denotes the point on the mark distribution where the pass mark lies.
Two examiners marked each question in the CRQ papers and the average mark from each was used to produce
the candidate mark. Each question has maximum possible 10 marks. Candidate performance was variable for
each question, with mean, median, minimum and maximum scores (with standard deviations) seen in the table
below.
Page 9 of 15 Commercial-in-Confidence 04 January 2019
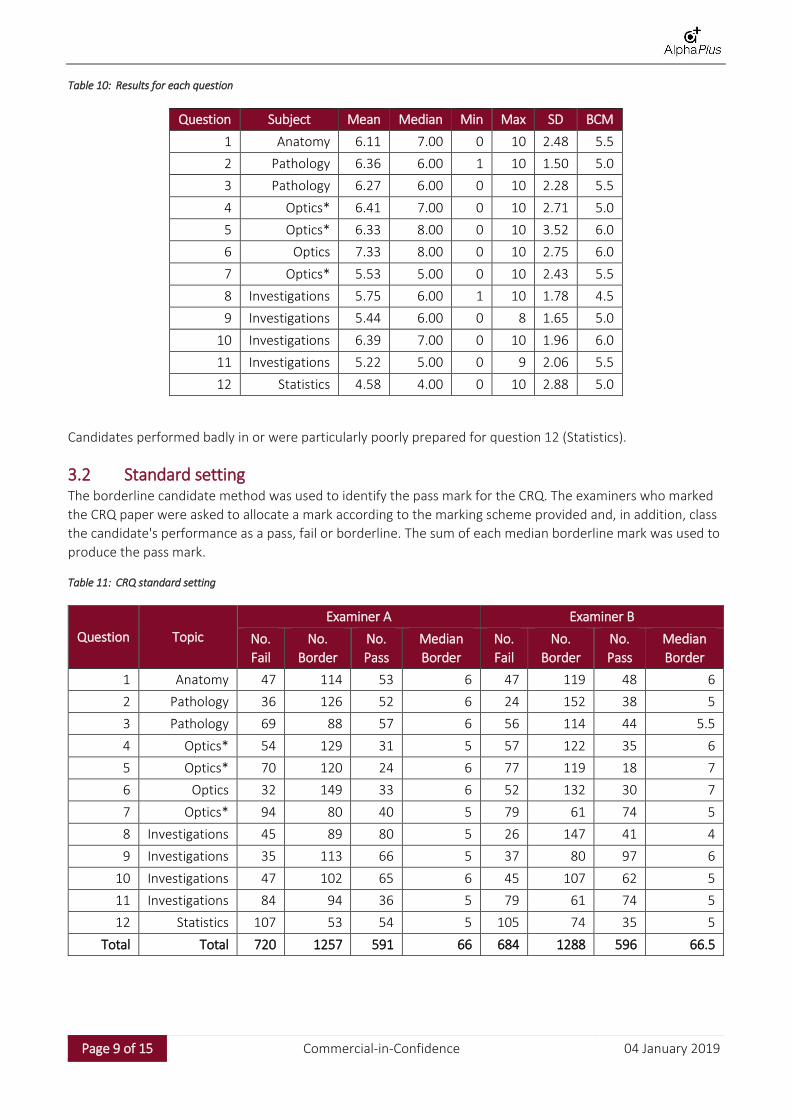
Table 10: Results for each question
Question Subject Mean Median Min Max SD BCM
1 Anatomy 6.11 7.00 0 10 2.48 5.5
2 Pathology 6.36 6.00 1 10 1.50 5.0
3 Pathology 6.27 6.00 0 10 2.28 5.5
4 Optics* 6.41 7.00 0 10 2.71 5.0
5 Optics* 6.33 8.00 0 10 3.52 6.0
6 Optics 7.33 8.00 0 10 2.75 6.0
7 Optics* 5.53 5.00 0 10 2.43 5.5
8 Investigations 5.75 6.00 1 10 1.78 4.5
9 Investigations 5.44 6.00 0 8 1.65 5.0
10 Investigations 6.39 7.00 0 10 1.96 6.0
11 Investigations 5.22 5.00 0 9 2.06 5.5
12 Statistics 4.58 4.00 0 10 2.88 5.0
Candidates performed badly in or were particularly poorly prepared for question 12 (Statistics).
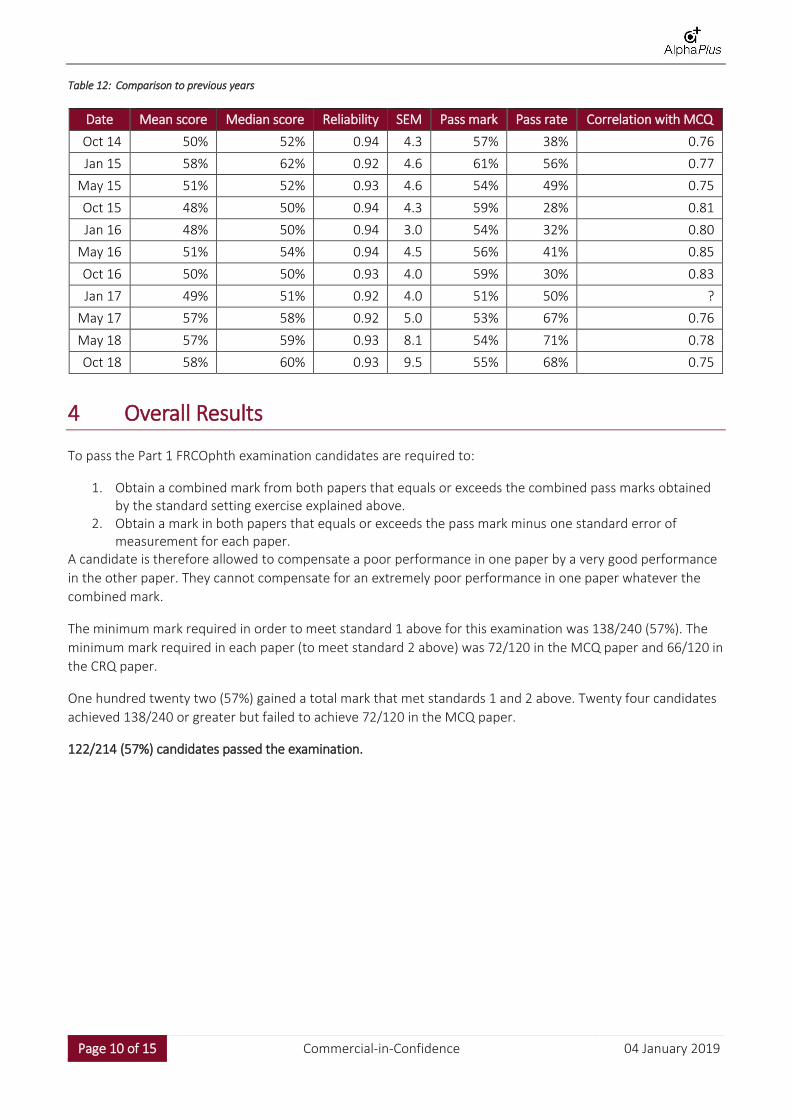
3.2 Standard setting The borderline candidate method was used to identify the pass mark for the CRQ. The examiners who marked
the CRQ paper were asked to allocate a mark according to the marking scheme provided and, in addition, class
the candidate's performance as a pass, fail or borderline. The sum of each median borderline mark was used to
produce the pass mark.
Table 11: CRQ standard setting
Question Topic
Examiner A Examiner B
No.
Fail
No.
Border
No.
Pass
Median
Border
No.
Fail
No.
Border
No.
Pass
Median
Border
1 Anatomy 47 114 53 6 47 119 48 6
2 Pathology 36 126 52 6 24 152 38 5
3 Pathology 69 88 57 6 56 114 44 5.5
4 Optics* 54 129 31 5 57 122 35 6
5 Optics* 70 120 24 6 77 119 18 7
6 Optics 32 149 33 6 52 132 30 7
7 Optics* 94 80 40 5 79 61 74 5
8 Investigations 45 89 80 5 26 147 41 4
9 Investigations 35 113 66 5 37 80 97 6
10 Investigations 47 102 65 6 45 107 62 5
11 Investigations 84 94 36 5 79 61 74 5
12 Statistics 107 53 54 5 105 74 35 5
Total Total 720 1257 591 66 684 1288 596 66.5
Page 10 of 15 Commercial-in-Confidence 04 January 2019
Table 12: Comparison to previous years
Date Mean score Median score Reliability SEM Pass mark Pass rate Correlation with MCQ
Oct 14 50% 52% 0.94 4.3 57% 38% 0.76
Jan 15 58% 62% 0.92 4.6 61% 56% 0.77
May 15 51% 52% 0.93 4.6 54% 49% 0.75
Oct 15 48% 50% 0.94 4.3 59% 28% 0.81
Jan 16 48% 50% 0.94 3.0 54% 32% 0.80
May 16 51% 54% 0.94 4.5 56% 41% 0.85
Oct 16 50% 50% 0.93 4.0 59% 30% 0.83
Jan 17 49% 51% 0.92 4.0 51% 50% ?
May 17 57% 58% 0.92 5.0 53% 67% 0.76
May 18 57% 59% 0.93 8.1 54% 71% 0.78
Oct 18 58% 60% 0.93 9.5 55% 68% 0.75
4 Overall Results
To pass the Part 1 FRCOphth examination candidates are required to:
1. Obtain a combined mark from both papers that equals or exceeds the combined pass marks obtained by the standard setting exercise explained above.
2. Obtain a mark in both papers that equals or exceeds the pass mark minus one standard error of measurement for each paper.
A candidate is therefore allowed to compensate a poor performance in one paper by a very good performance
in the other paper. They cannot compensate for an extremely poor performance in one paper whatever the
combined mark.
The minimum mark required in order to meet standard 1 above for this examination was 138/240 (57%). The
minimum mark required in each paper (to meet standard 2 above) was 72/120 in the MCQ paper and 66/120 in
the CRQ paper.
One hundred twenty two (57%) gained a total mark that met standards 1 and 2 above. Twenty four candidates
achieved 138/240 or greater but failed to achieve 72/120 in the MCQ paper.
122/214 (57%) candidates passed the examination.
Page 11 of 15 Commercial-in-Confidence 04 January 2019
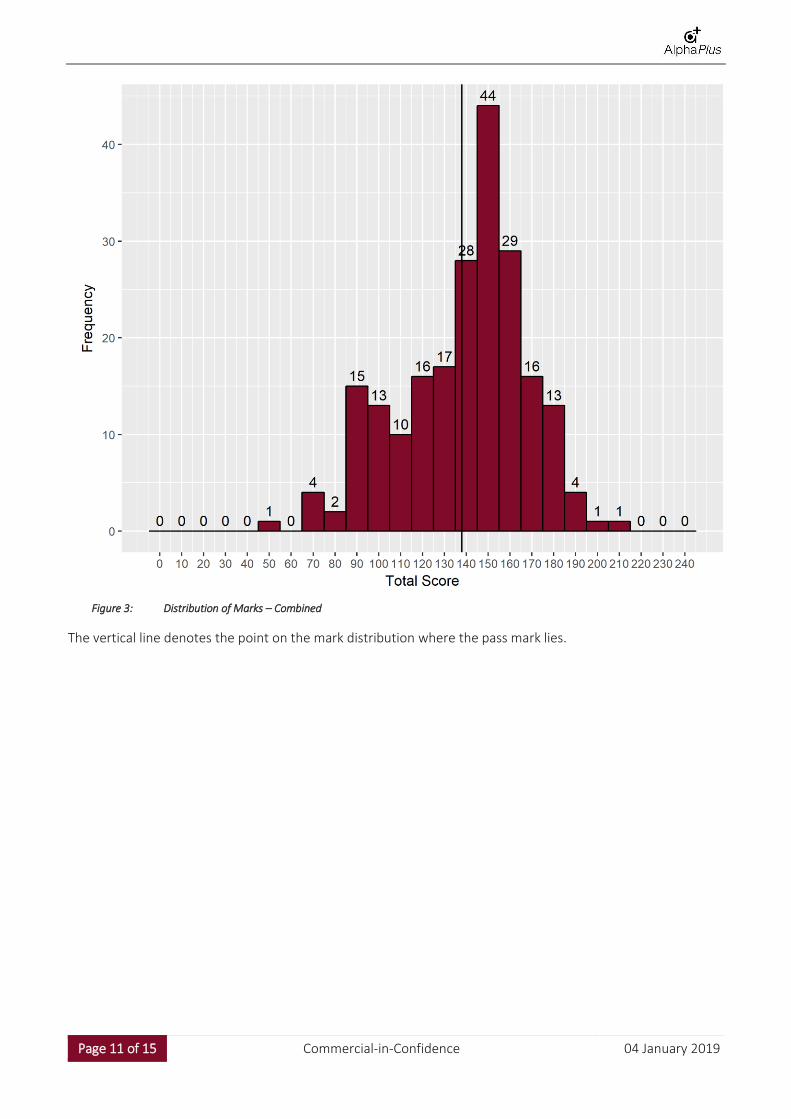
Figure 3: Distribution of Marks – Combined
The vertical line denotes the point on the mark distribution where the pass mark lies.
Page 12 of 15 Commercial-in-Confidence 04 January 2019
4.1 Comparison to previous Part 1 examinations
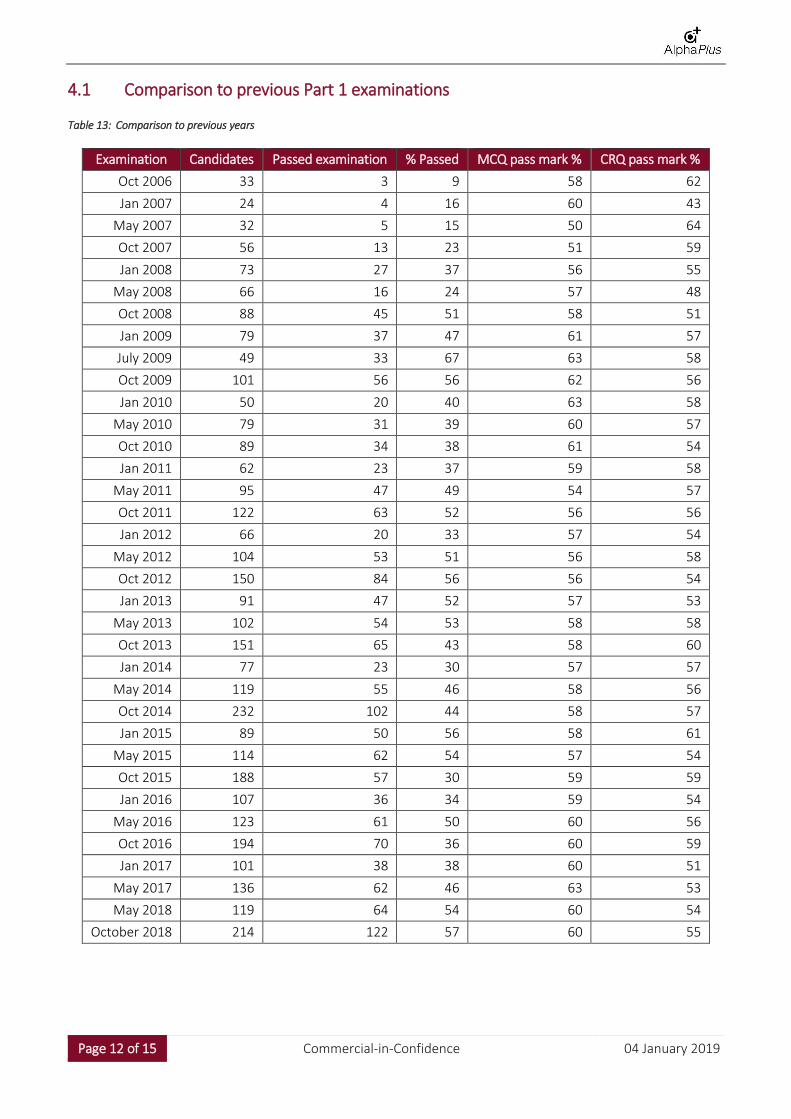
Table 13: Comparison to previous years
Examination Candidates Passed examination % Passed MCQ pass mark % CRQ pass mark %
Oct 2006 33 3 9 58 62
Jan 2007 24 4 16 60 43
May 2007 32 5 15 50 64
Oct 2007 56 13 23 51 59
Jan 2008 73 27 37 56 55
May 2008 66 16 24 57 48
Oct 2008 88 45 51 58 51
Jan 2009 79 37 47 61 57
July 2009 49 33 67 63 58
Oct 2009 101 56 56 62 56
Jan 2010 50 20 40 63 58
May 2010 79 31 39 60 57
Oct 2010 89 34 38 61 54
Jan 2011 62 23 37 59 58
May 2011 95 47 49 54 57
Oct 2011 122 63 52 56 56
Jan 2012 66 20 33 57 54
May 2012 104 53 51 56 58
Oct 2012 150 84 56 56 54
Jan 2013 91 47 52 57 53
May 2013 102 54 53 58 58
Oct 2013 151 65 43 58 60
Jan 2014 77 23 30 57 57
May 2014 119 55 46 58 56
Oct 2014 232 102 44 58 57
Jan 2015 89 50 56 58 61
May 2015 114 62 54 57 54
Oct 2015 188 57 30 59 59
Jan 2016 107 36 34 59 54
May 2016 123 61 50 60 56
Oct 2016 194 70 36 60 59
Jan 2017 101 38 38 60 51
May 2017 136 62 46 63 53
May 2018 119 64 54 60 54
October 2018 214 122 57 60 55
Page 13 of 15 Commercial-in-Confidence 04 January 2019
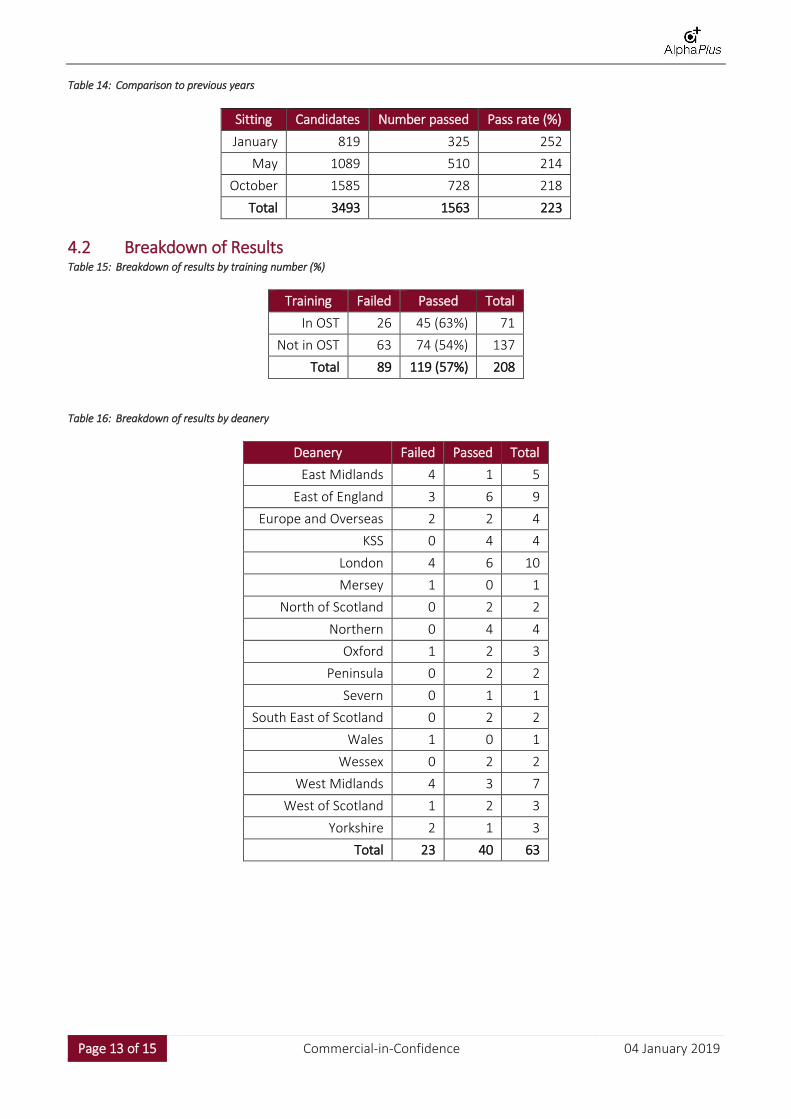
Table 14: Comparison to previous years
Sitting Candidates Number passed Pass rate (%)
January 819 325 252
May 1089 510 214
October 1585 728 218
Total 3493 1563 223
4.2 Breakdown of Results Table 15: Breakdown of results by training number (%)
Training Failed Passed Total
In OST 26 45 (63%) 71
Not in OST 63 74 (54%) 137
Total 89 119 (57%) 208
Table 16: Breakdown of results by deanery
Deanery Failed Passed Total
East Midlands 4 1 5
East of England 3 6 9
Europe and Overseas 2 2 4
KSS 0 4 4
London 4 6 10
Mersey 1 0 1
North of Scotland 0 2 2
Northern 0 4 4
Oxford 1 2 3
Peninsula 0 2 2
Severn 0 1 1
South East of Scotland 0 2 2
Wales 1 0 1
Wessex 0 2 2
West Midlands 4 3 7
West of Scotland 1 2 3
Yorkshire 2 1 3
Total 23 40 63
Page 14 of 15 Commercial-in-Confidence 04 January 2019
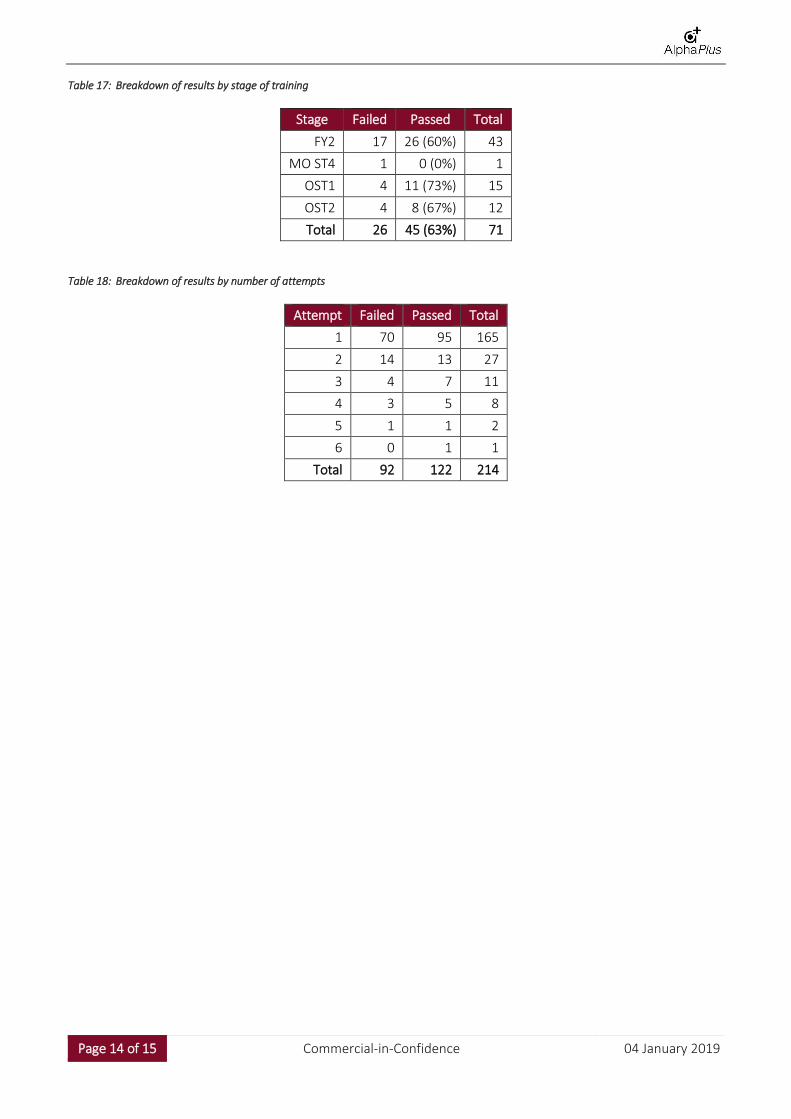
Table 17: Breakdown of results by stage of training
Stage Failed Passed Total
FY2 17 26 (60%) 43
MO ST4 1 0 (0%) 1
OST1 4 11 (73%) 15
OST2 4 8 (67%) 12
Total 26 45 (63%) 71
Table 18: Breakdown of results by number of attempts
Attempt Failed Passed Total
1 70 95 165
2 14 13 27
3 4 7 11
4 3 5 8
5 1 1 2
6 0 1 1
Total 92 122 214
Page 15 of 15 Commercial-in-Confidence 04 January 2019
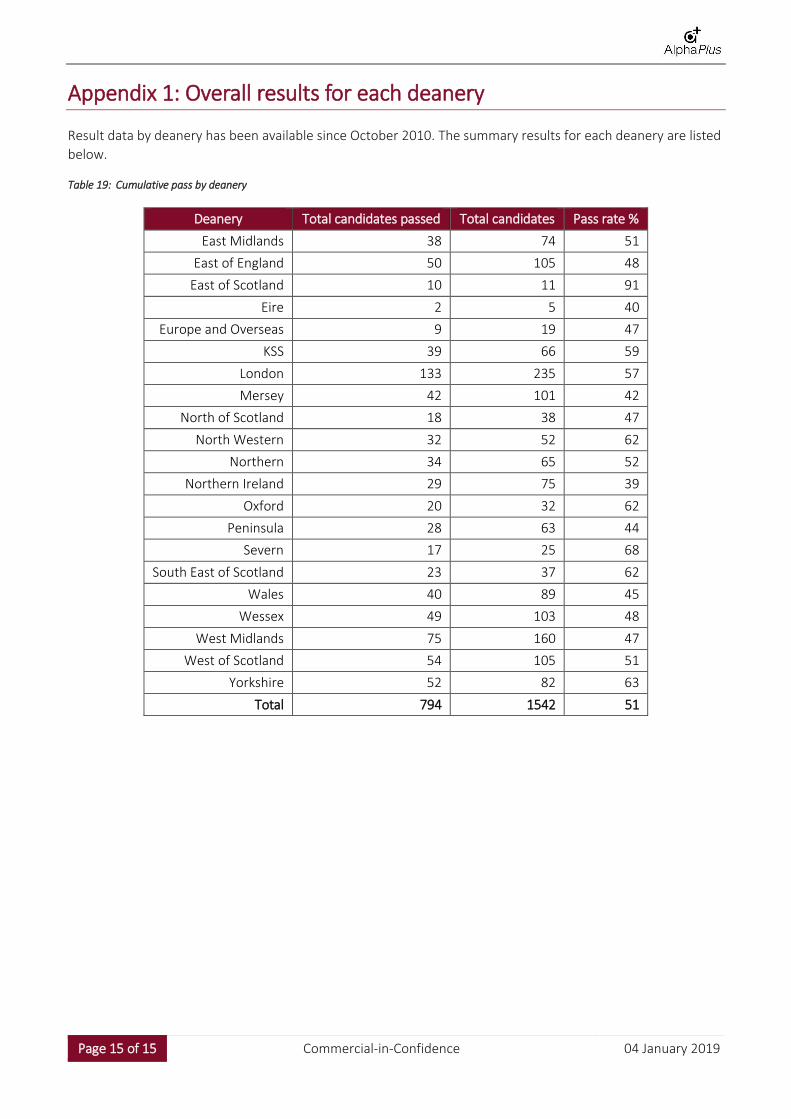
Appendix 1: Overall results for each deanery
Result data by deanery has been available since October 2010. The summary results for each deanery are listed
below.
Table 19: Cumulative pass by deanery
Deanery Total candidates passed Total candidates Pass rate %
East Midlands 38 74 51
East of England 50 105 48
East of Scotland 10 11 91
Eire 2 5 40
Europe and Overseas 9 19 47
KSS 39 66 59
London 133 235 57
Mersey 42 101 42
North of Scotland 18 38 47
North Western 32 52 62
Northern 34 65 52
Northern Ireland 29 75 39
Oxford 20 32 62
Peninsula 28 63 44
Severn 17 25 68
South East of Scotland 23 37 62
Wales 40 89 45
Wessex 49 103 48
West Midlands 75 160 47
West of Scotland 54 105 51
Yorkshire 52 82 63
Total 794 1542 51