ex 1) factor the binomial: – 8y + 16y2 gcf · factoring a difference of squares ex 6) factor:...
TRANSCRIPT
3.0A –Factoring Review Name: Date: Goal: Review of Factor Polynomials Factor using the GCF Factor a trinomial when a = 1 Factor a trinomial when a ≠1
Ex 1) Factor the binomial: – 8y + 16y2 Ex 2) Factor the trinomial: 3x2 +12x – 6 Ex 3) Factor: 𝑎! – 2𝑎 − 8 Ex 4) Factor: −12 − 9𝑔 + 3𝑔! Ex 5) Factor the trinomial: 4g2 + 11g + 6

Factoring a Difference of Squares
Ex 6) Factor: 8𝑝! − 18𝑝 – 5 Ex 7) Factor the binomial: 81m2 - 49 Ex 8) Factor the binomial: 162v2 – 2w4
Reflection: How are the processes of factoring and expanding related?
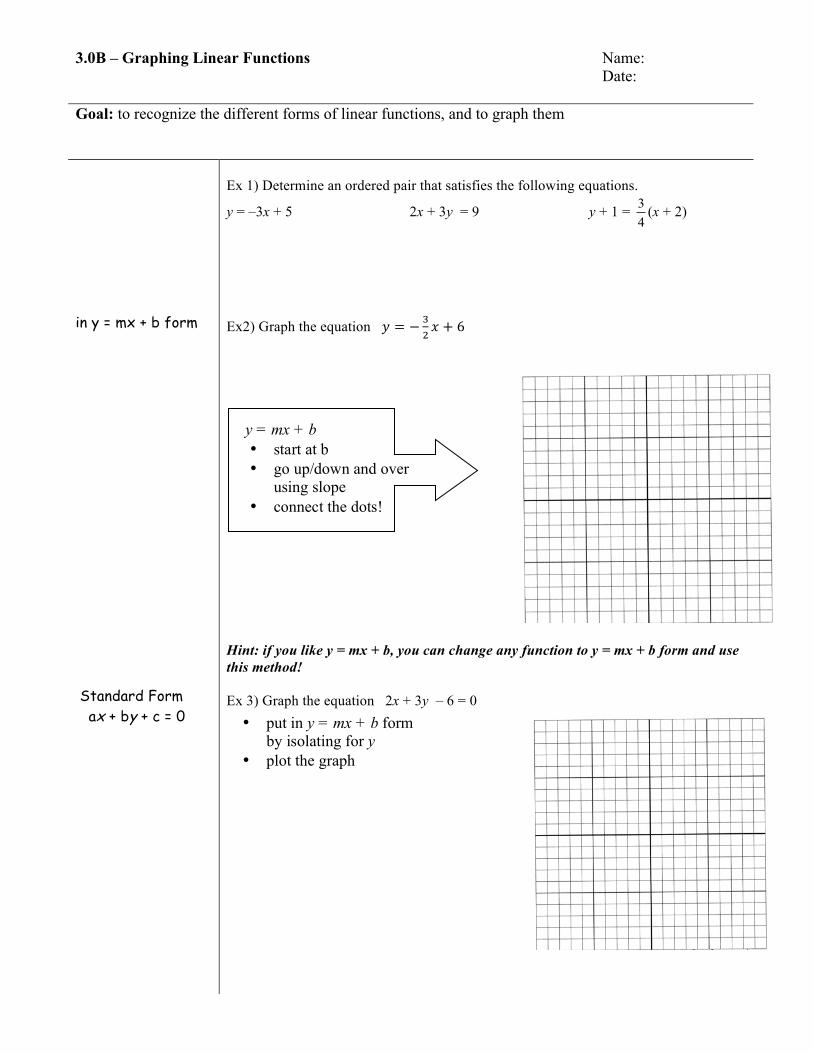
3.0B – Graphing Linear Functions Name: Date: Goal: to recognize the different forms of linear functions, and to graph them in y = mx + b form Standard Form ax + by + c = 0
Ex 1) Determine an ordered pair that satisfies the following equations.
y = –3x + 5 2x + 3y = 9 y + 1 = 34
(x + 2)
Ex2) Graph the equation 𝑦 = − !
!𝑥 + 6
- Hint: if you like y = mx + b, you can change any function to y = mx + b form and use this method! Ex 3) Graph the equation 2x + 3y – 6 = 0
y = mx + b • start at b • go up/down and over
using slope • connect the dots!
• put in y = mx + b form by isolating for y
• plot the graph

Fractions in Function
Ex 4) Graph the equation − !
!𝑦 + 2 = !
!𝑥
Reflection: Which form of equation do you prefer to graph?
• eliminate the fractions • put in y = mx + b form
by isolating for y • plot the graph
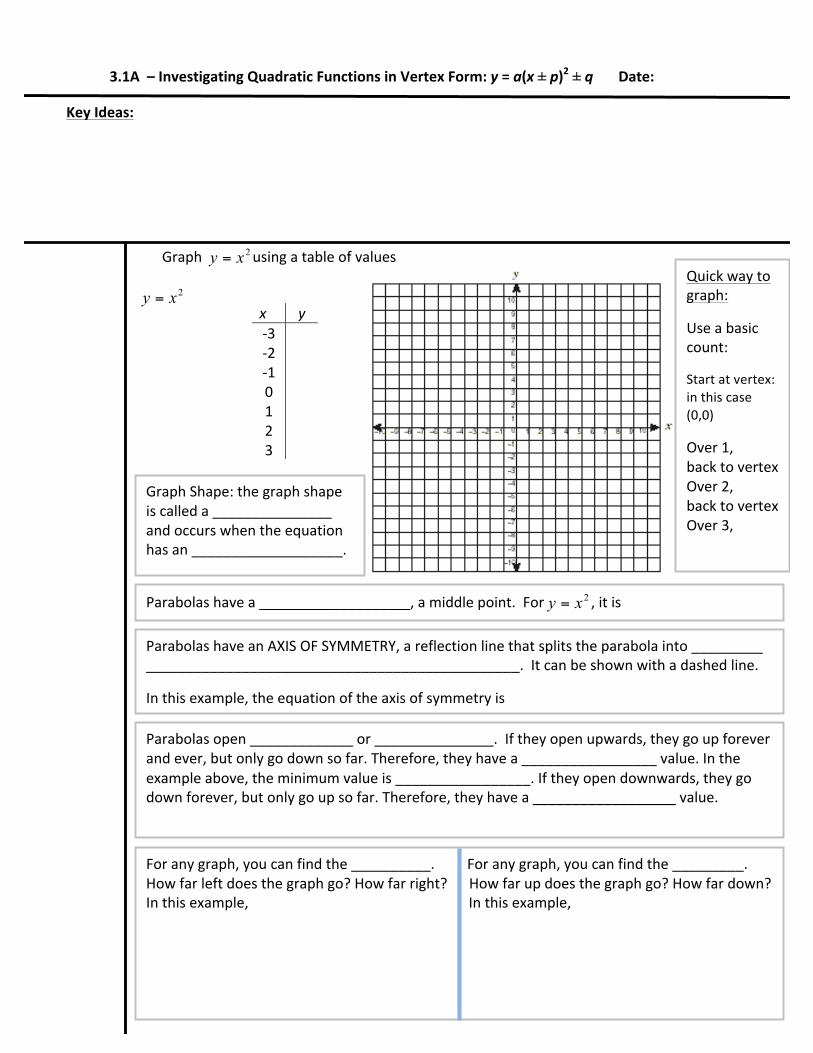
3.1A – Investigating Quadratic Functions in Vertex Form: y = a(x ± p)2 ± q Date:
Key Ideas:
Graph 2xy = using a table of values
2xy =
x y -‐3 -‐2 -‐1 0 1 2 3
Graph Shape: the graph shape is called a _______________ and occurs when the equation has an ___________________.
Quick way to graph:
Use a basic count:
Start at vertex: in this case (0,0)
Over 1, back to vertex Over 2, back to vertex Over 3,
Parabolas have a ___________________, a middle point. For 2xy = , it is
Parabolas have an AXIS OF SYMMETRY, a reflection line that splits the parabola into _________ _______________________________________________. It can be shown with a dashed line.
In this example, the equation of the axis of symmetry is
Parabolas open _____________ or _______________. If they open upwards, they go up forever and ever, but only go down so far. Therefore, they have a _________________ value. In the example above, the minimum value is _________________. If they open downwards, they go down forever, but only go up so far. Therefore, they have a __________________ value.
For any graph, you can find the __________. For any graph, you can find the _________. How far left does the graph go? How far right? How far up does the graph go? How far down? In this example, In this example,
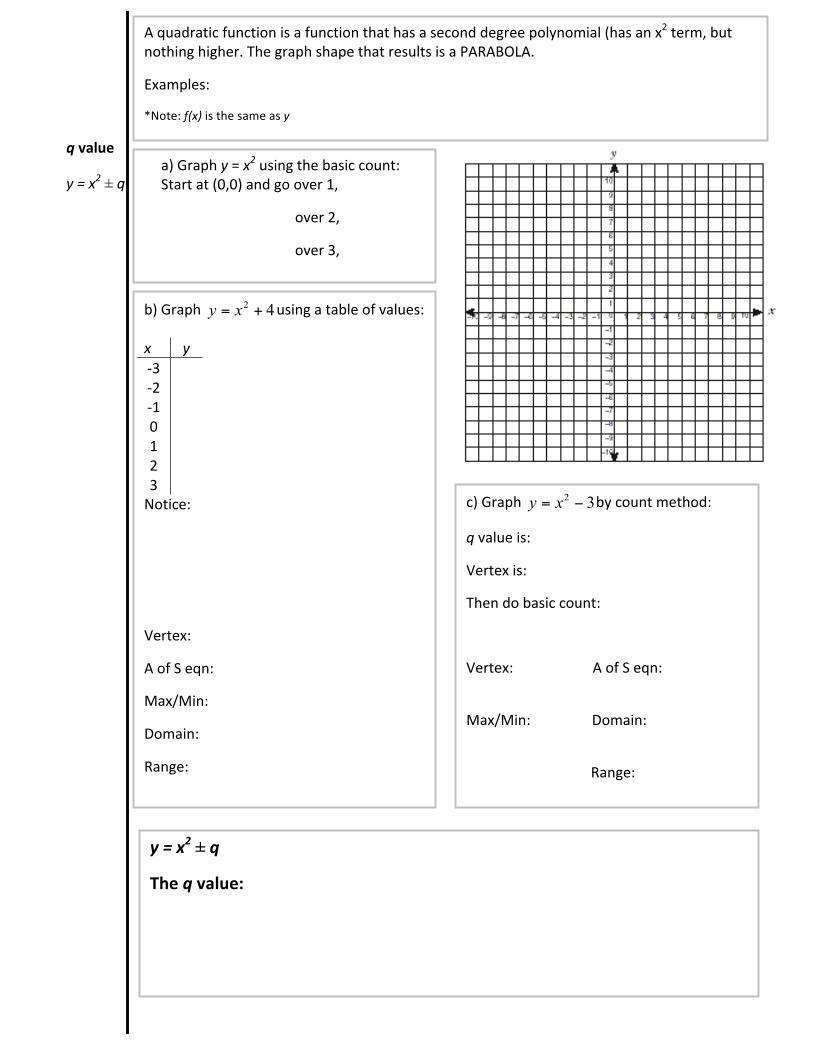
q value
y = x2 ± q
A quadratic function is a function that has a second degree polynomial (has an x2 term, but nothing higher. The graph shape that results is a PARABOLA.
Examples:
*Note: f(x) is the same as y
a) Graph y = x2 using the basic count: Start at (0,0) and go over 1,
over 2,
over 3,
b) Graph 42 += xy using a table of values:
x y -‐3 -‐2 -‐1 0 1 2 3
Notice:
Vertex:
A of S eqn:
Max/Min:
Domain:
Range:
c) Graph 32 −= xy by count method:
q value is:
Vertex is:
Then do basic count:
Vertex: A of S eqn:
Max/Min: Domain:
Range:
y = x2 ± q
The q value:
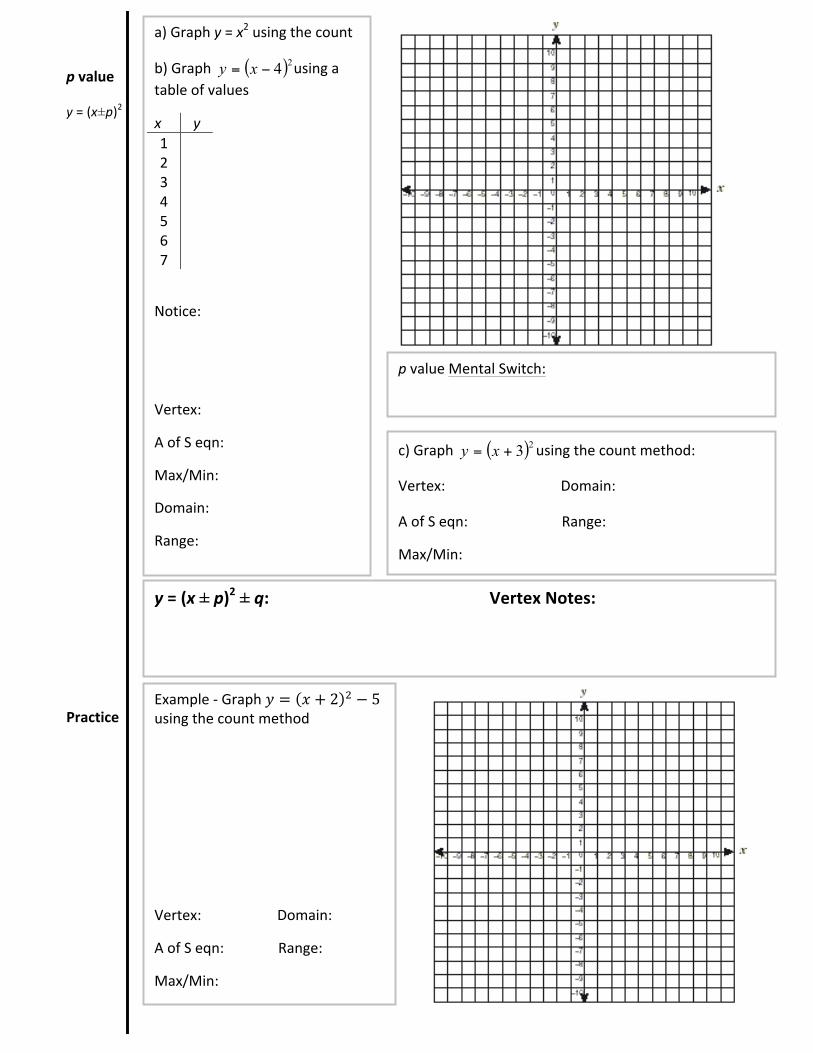
p value
y = (x±p)2
Practice
a) Graph y = x2 using the count
b) Graph ( )24−= xy using a table of values
x y 1 2 3 4 5 6 7
Notice:
Vertex:
A of S eqn:
Max/Min:
Domain:
Range:
p value Mental Switch:
c) Graph ( )23+= xy using the count method:
Vertex: Domain:
A of S eqn: Range:
Max/Min:
y = (x ± p)2 ± q: Vertex Notes:
Example -‐ Graph 𝑦 = 𝑥 + 2 ! − 5 using the count method
Vertex: Domain:
A of S eqn: Range:
Max/Min:

3.1B – Investigating Quadratic Functions in Vertex Form: y = a(x ± p)2 ± q Date:
Key Ideas:
a value
y = ax2
Graph 2xy −= using a table of values
x y -‐3 -‐2 -‐1 0 1 2 3
Vertex: Domain:
A of S eqn: Range:
Max/Min:
a)Graph 𝑦 = 𝑥! using the count.
b) Graph 22xy = using a table of values
x y -‐3 -‐2 -‐1 0 1 2 3
Notice:
c) Graph 2
21 xy = using the count method:
The a value:
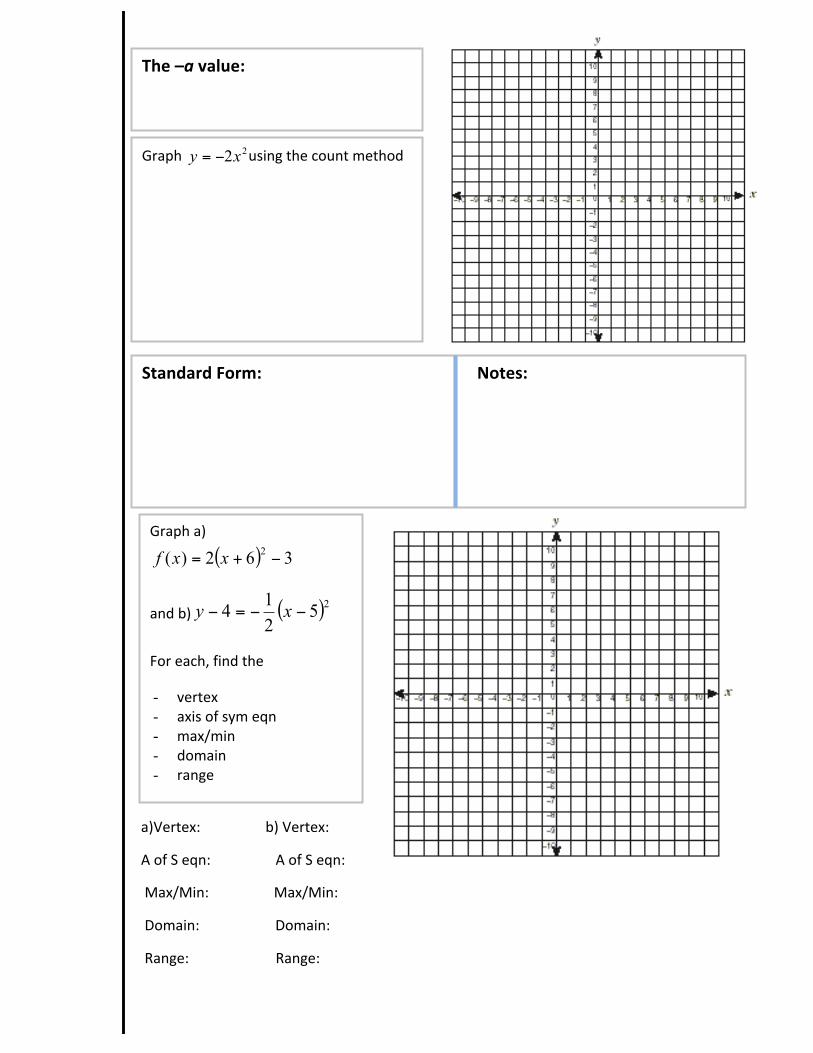
The –a value:
Graph 22xy −= using the count method
Standard Form: Notes:
Graph a)
( ) 362)( 2 −+= xxf
and b) ( )25214 −−=− xy
For each, find the
- vertex - axis of sym eqn - max/min - domain - range
a)Vertex: b) Vertex:
A of S eqn: A of S eqn:
Max/Min: Max/Min:
Domain: Domain:
Range: Range:

Example – Do the ‘Your Turn’ on the top of p.153 in the text
a) b)
Example -‐ A parabola with vertex (1, -‐2) passes through the point (4, 1). Write an equation for the parabola in the form 𝑦 = 𝑎 𝑥 ± 𝑝 ! ± 𝑞
x-‐ints
An x-‐intercept is when a graph…
A parabola can have…
Example – Determine the number of x-‐intercepts for each quadratic function without graphing
a) 𝑦 = −2 𝑥 − 7 ! − 1 b) 𝑦 = 0.5𝑥! − 6 c) 𝑦 = −2 𝑥 + 1 !
1) Vertex: 3) Vertex:
A of S eqn: A of S eqn:
Max/Min: Max/Min:
Domain: Domain:
Range: Range:
2) Vertex: A of S eqn: Max/Min: Domain: Range:
3.3 – Completing the Square Date:
Key Ideas:
When quadratic functions are in STANDARD FORM [𝑦 = 𝑎𝑥! ± 𝑏𝑥 ± 𝑐], they can be changed into VERTEX FORM [𝑦 = 𝑥 ± 𝑝 ! ± 𝑞] using a technique called
_____________________________________________________________.
Example -‐ Rewrite 21014 xxy ++= in vertex form by completing the square.
Then sketch the graph and find the max/min value.
STEPS:
1) Rearrange so squared term is first and x term is second.
2) Find the a, b, c values
3) Take half the b-‐value (you’ll need this later), then square it.
4) Add and subtract the result to your quadratic function after the x term.
5) Make sure the new term you added is the third term.
6) Factor the trinomial and add the two last terms.
Shortcut for factoring the trinomial:
completing the square
Example -‐ Change 142 −−= xxy into vertex form, then verify it was done correctly.
When a ≠ 1 When the a value is different from 1, there are a few more steps.
Example -‐ Change 542 2 ++−= xxy into vertex form, then sketch the graph and give the max/min.
STEPS:
1) Group the first two terms together.
2) Factor the a value out.
3) Find the b value. Take half and square it.
4) Add and subtract the result IN THE BRACKETS.
5) Get the subtracted result out of the brackets by multiplying to the coefficient in front of the brackets.
6) Factor the trinomial.
Example -‐ Change 11123 2 +−= xxy into vertex form, then sketch the graph and give the max/min.
Example -‐ Change 135 2 +−= xxy into standard form. Do this both in ‘fraction form’ and ‘decimal form’. Then verify that you did it correctly.
Ch 3 Quadratic Word Problems (from Sections 3.2 & 3.3) Date:
Key Ideas: *always answer word problems with a sentence
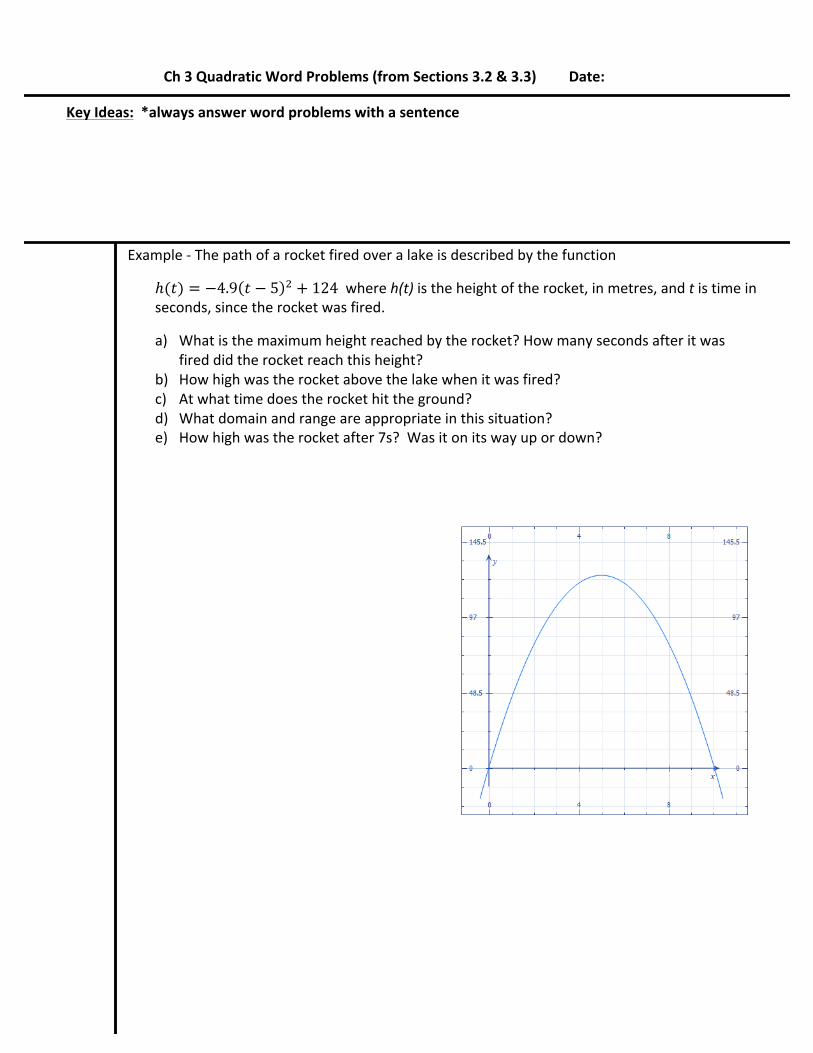
Example -‐ The path of a rocket fired over a lake is described by the function
ℎ(𝑡) = −4.9 𝑡 − 5 ! + 124 where h(t) is the height of the rocket, in metres, and t is time in seconds, since the rocket was fired.
a) What is the maximum height reached by the rocket? How many seconds after it was fired did the rocket reach this height?
b) How high was the rocket above the lake when it was fired? c) At what time does the rocket hit the ground? d) What domain and range are appropriate in this situation? e) How high was the rocket after 7s? Was it on its way up or down?

Example – A diver jumps from a 3-‐m springboard with an initial vertical velocity of 6.8m/s. Her height, h, in metres, above the water t seconds after leaving the diving board can be modeled by the function ℎ(𝑡) = −4.9𝑡! + 6.8𝑡 + 3.
a) What does the y-‐intercept represent? b) What is the height of the diver 0.6s after leaving the board? c) What maximum height does the diver reach? When does she reach that height? d) How long does it take before the diver hits the water? e) What domain and range are appropriate in this situation?
Ch 3 – Using Quadratic Functions to Solve Problems Involving Date:
Maximums and/or Minimums
Key Ideas: *always answer word problems with a sentence
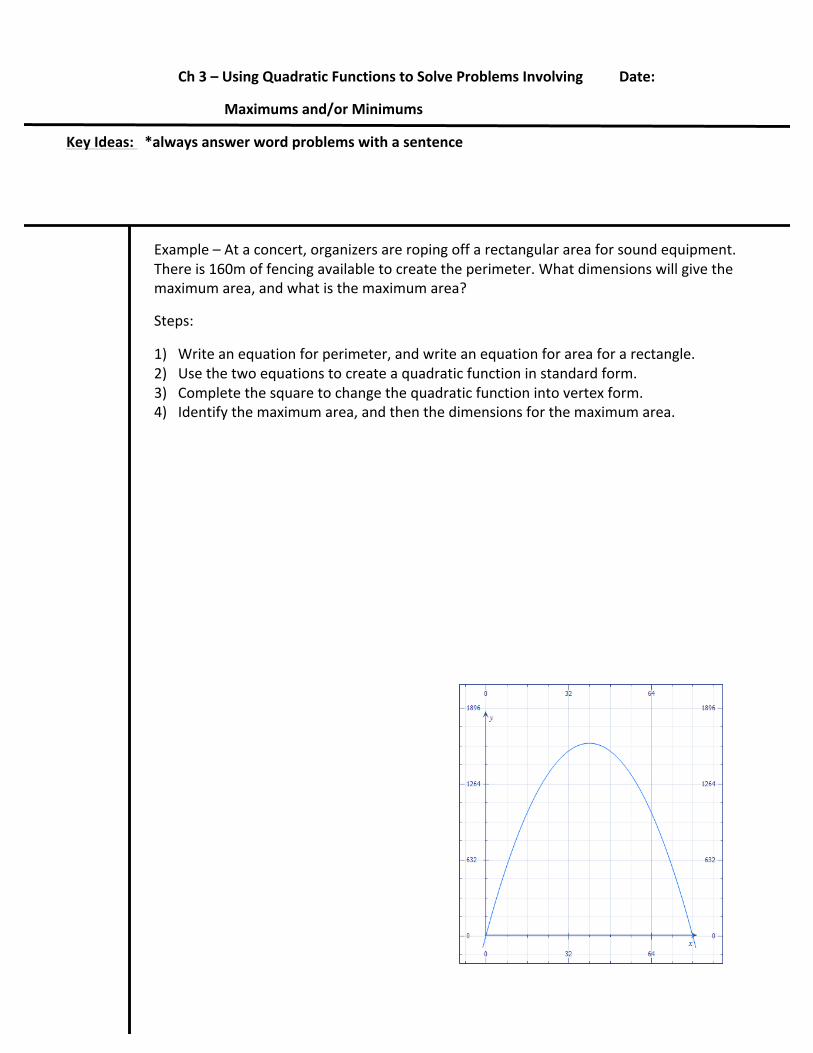
Example – At a concert, organizers are roping off a rectangular area for sound equipment. There is 160m of fencing available to create the perimeter. What dimensions will give the maximum area, and what is the maximum area?
Steps:
1) Write an equation for perimeter, and write an equation for area for a rectangle. 2) Use the two equations to create a quadratic function in standard form. 3) Complete the square to change the quadratic function into vertex form. 4) Identify the maximum area, and then the dimensions for the maximum area.

Example – A sporting goods store sells basketball shorts for $8. At this price their weekly sales are approximately 100 items. Research says that for every $2 increase in price, the manager can expect the store to sell five fewer pairs of shorts. Determine the maximum revenue the manager can expect based on these estimates. What selling price will give that maximum revenue, and how many shorts will be sold?