evonik power to create.corporate.evonik.com/downloads/171219_kepler gcc_evonik company... · 1...
TRANSCRIPT
1
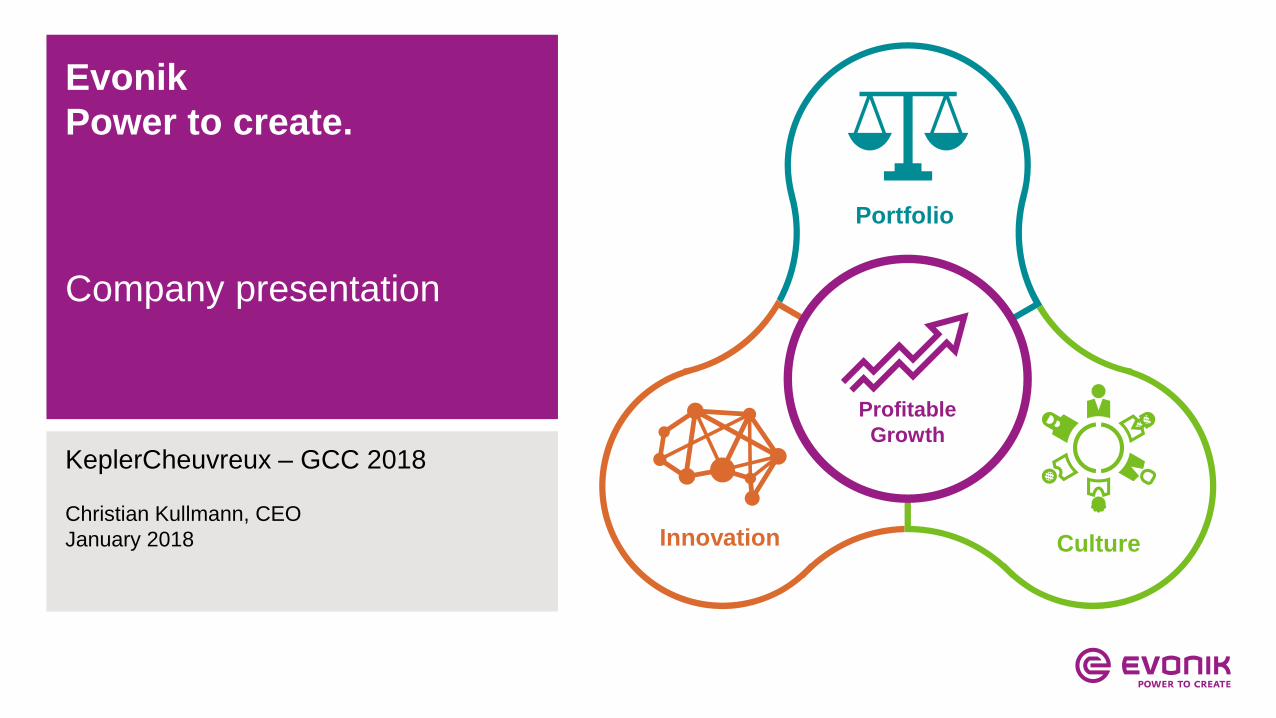
Evonik
Power to create.
KeplerCheuvreux – GCC 2018
Christian Kullmann, CEO
January 2018
Company presentation
Portfolio
Innovation Culture
Profitable
Growth
2
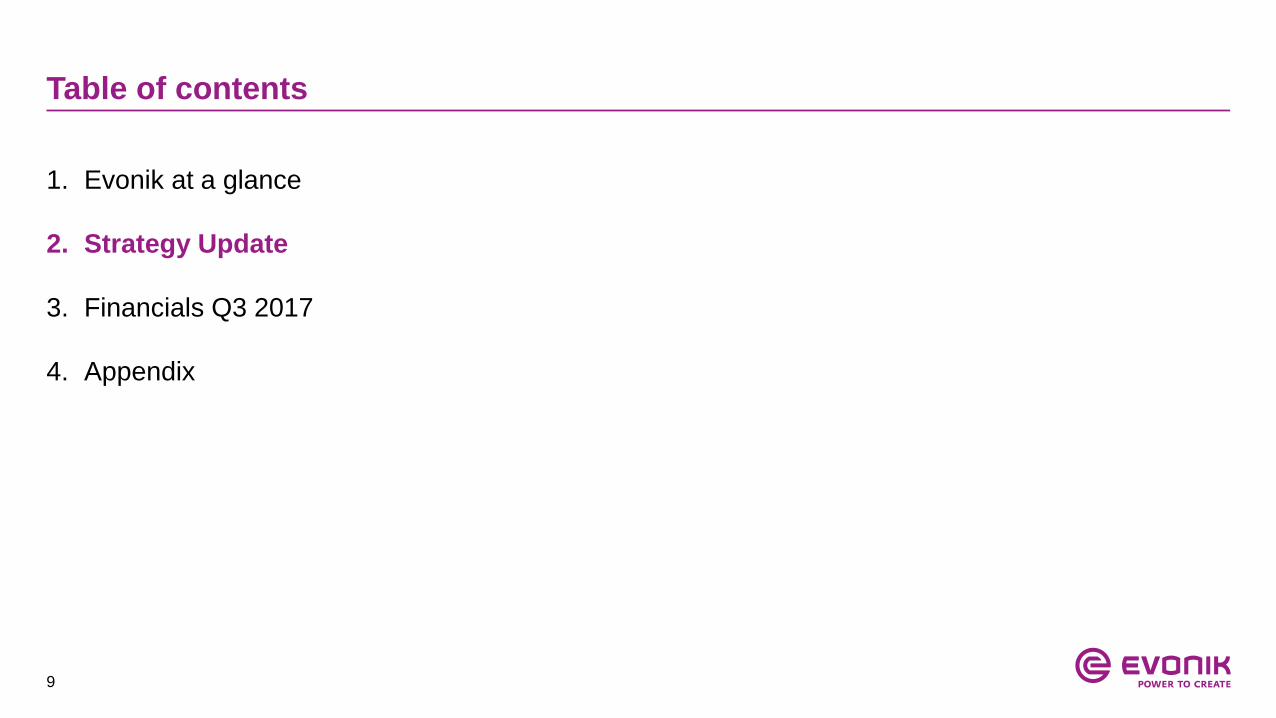
Table of contents
1. Evonik at a glance
2. Strategy Update
3. Financials Q3 2017
4. Appendix
3
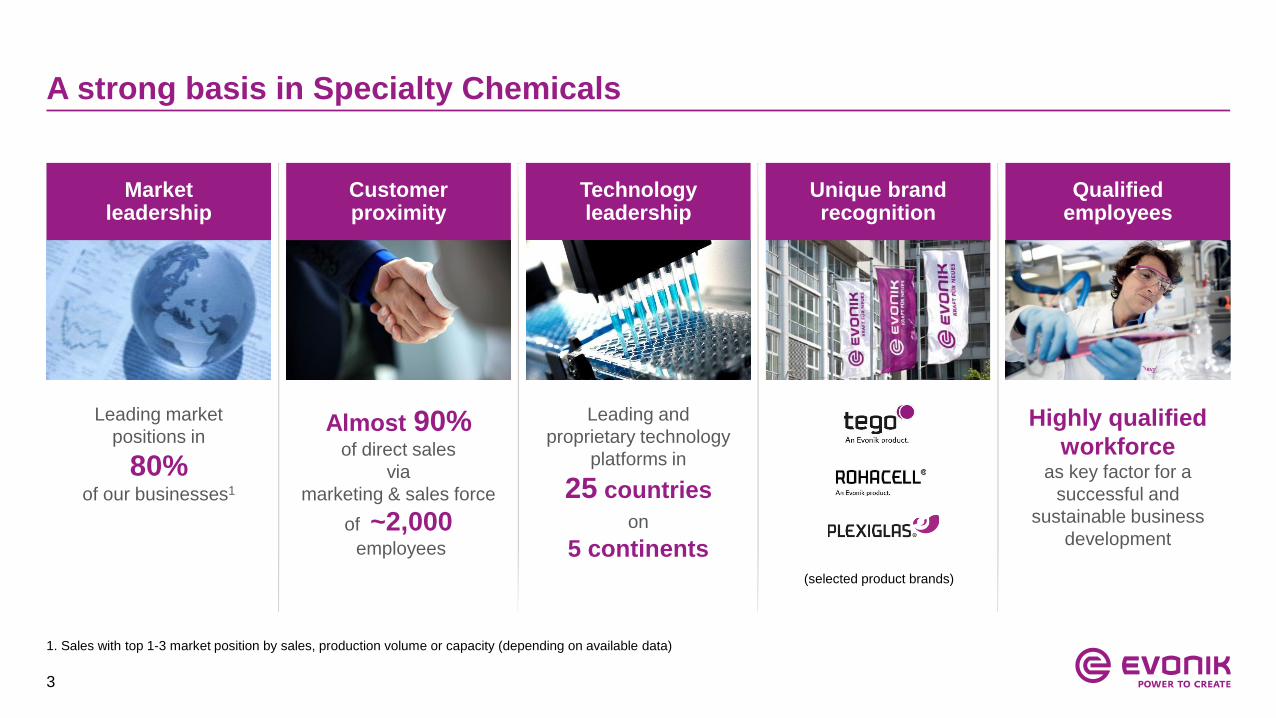
A strong basis in Specialty Chemicals
1. Sales with top 1-3 market position by sales, production volume or capacity (depending on available data)
Leading market
positions in
80% of our businesses1
Almost 90% of direct sales
via
marketing & sales force
of ~2,000 employees
Leading and
proprietary technology
platforms in
25 countries
on
5 continents
Highly qualified
workforceas key factor for a
successful and
sustainable business
development
Qualified employees
Market leadership
Customerproximity
Technologyleadership
Unique brand recognition
(selected product brands)
4
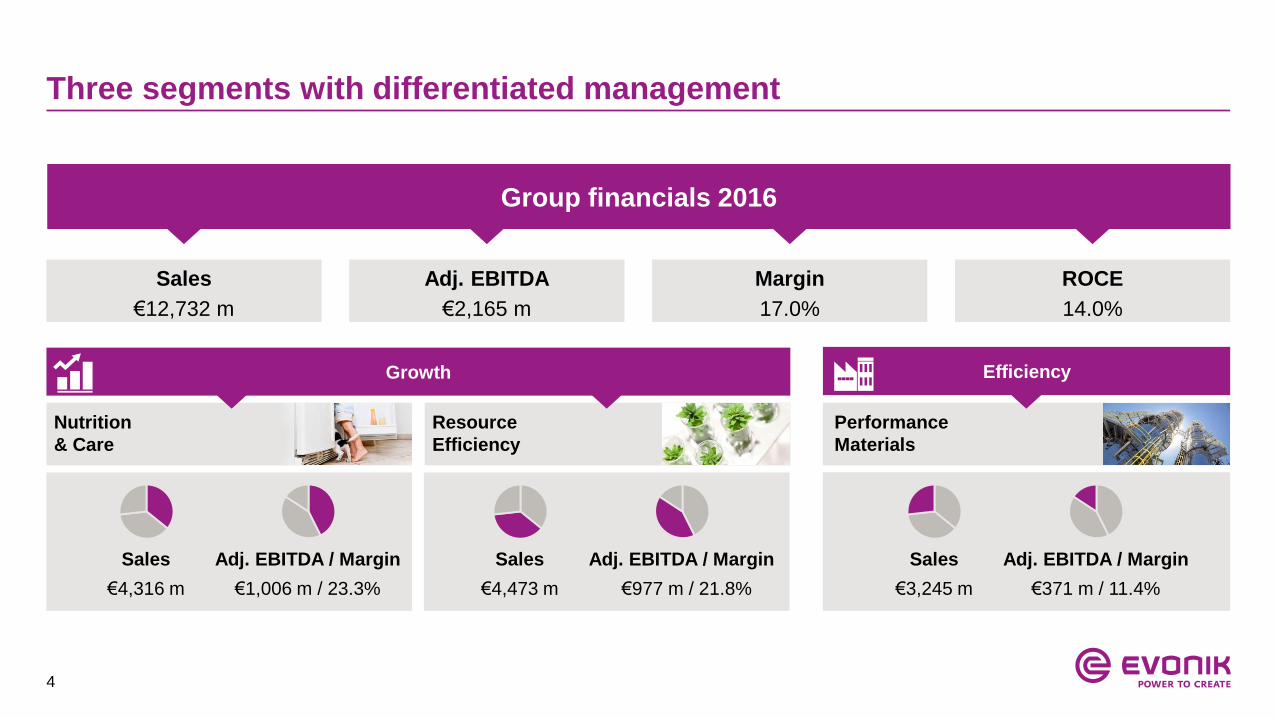
Three segments with differentiated management
Nutrition
& Care
Resource
Efficiency
Performance
Materials
Growth Efficiency
€4,316 m €1,006 m / 23.3% €4,473 m €977 m / 21.8%
Sales
€3,245 m
Adj. EBITDA / Margin
€371 m / 11.4%
Sales Adj. EBITDA / MarginSales Adj. EBITDA / Margin
Sales
€12,732 m
Adj. EBITDA
€2,165 m
Margin
17.0%
ROCE
14.0%
Group financials 2016
5
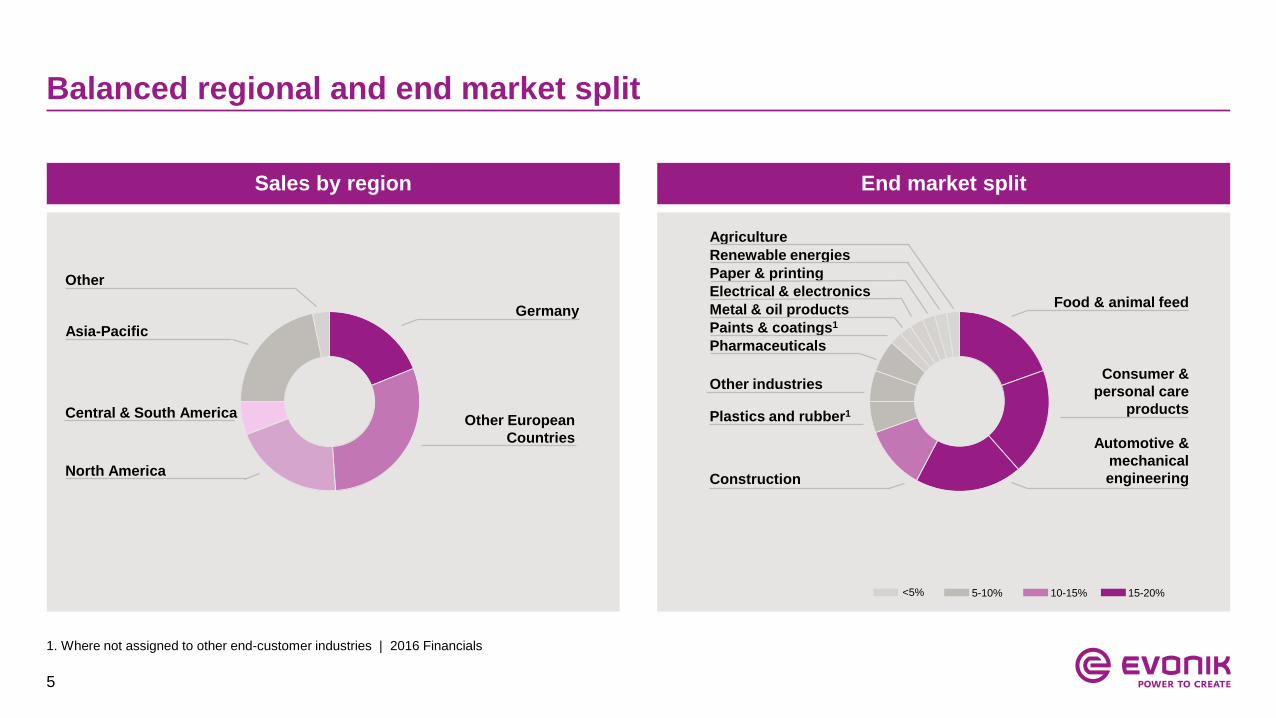
Balanced regional and end market split
End market split
Plastics and rubber1
Food & animal feed
Consumer &
personal care
products
Construction
Automotive &
mechanical
engineering
Other industries
Pharmaceuticals
Paints & coatings1
Metal & oil products
Renewable energies
Paper & printing
Electrical & electronics
Agriculture
<5% 5-10% 10-15% 15-20%
Sales by region
Germany
Other European
Countries
North America
Central & South America
Asia-Pacific
Other
1. Where not assigned to other end-customer industries | 2016 Financials
6
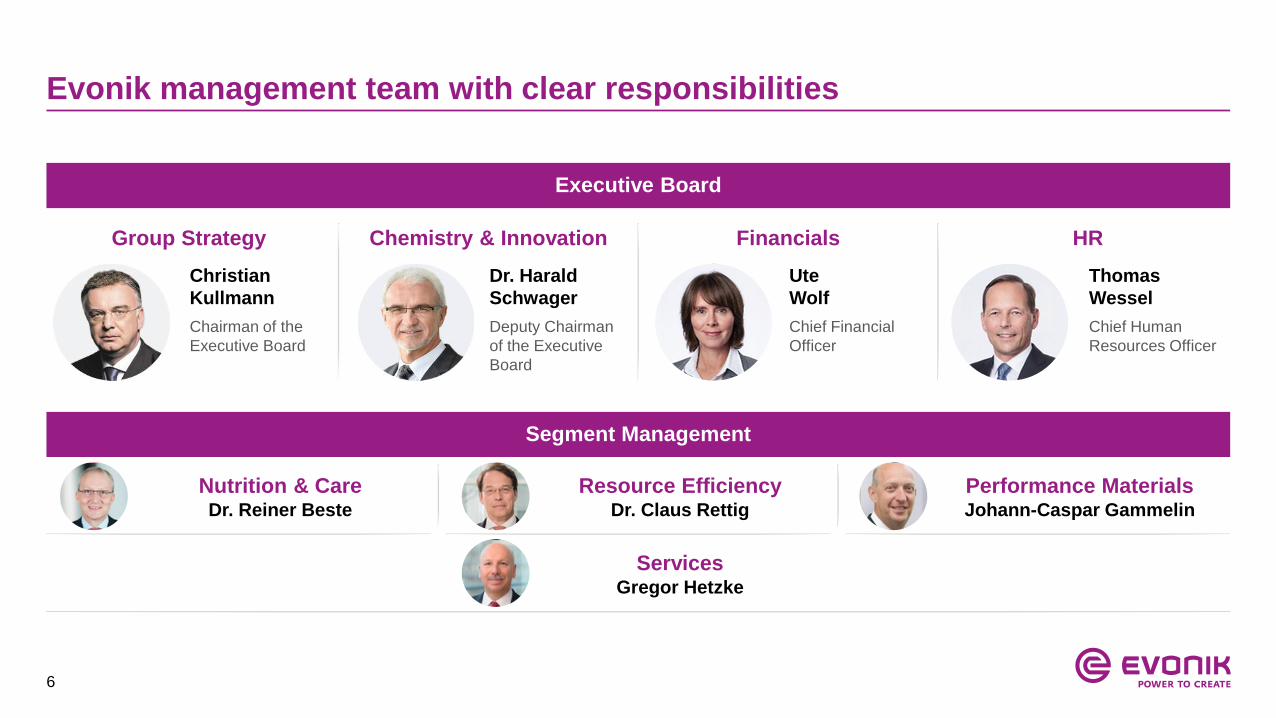
Evonik management team with clear responsibilities
Segment Management
Executive Board
Group Strategy
Christian
Kullmann
Chairman of the
Executive Board
Financials
Ute
Wolf
Chief Financial
Officer
HR
Thomas
Wessel
Chief Human
Resources Officer
Chemistry & Innovation
Dr. Harald
Schwager
Deputy Chairman
of the Executive
Board
Nutrition & CareDr. Reiner Beste
Resource EfficiencyDr. Claus Rettig
Performance MaterialsJohann-Caspar Gammelin
ServicesGregor Hetzke
7
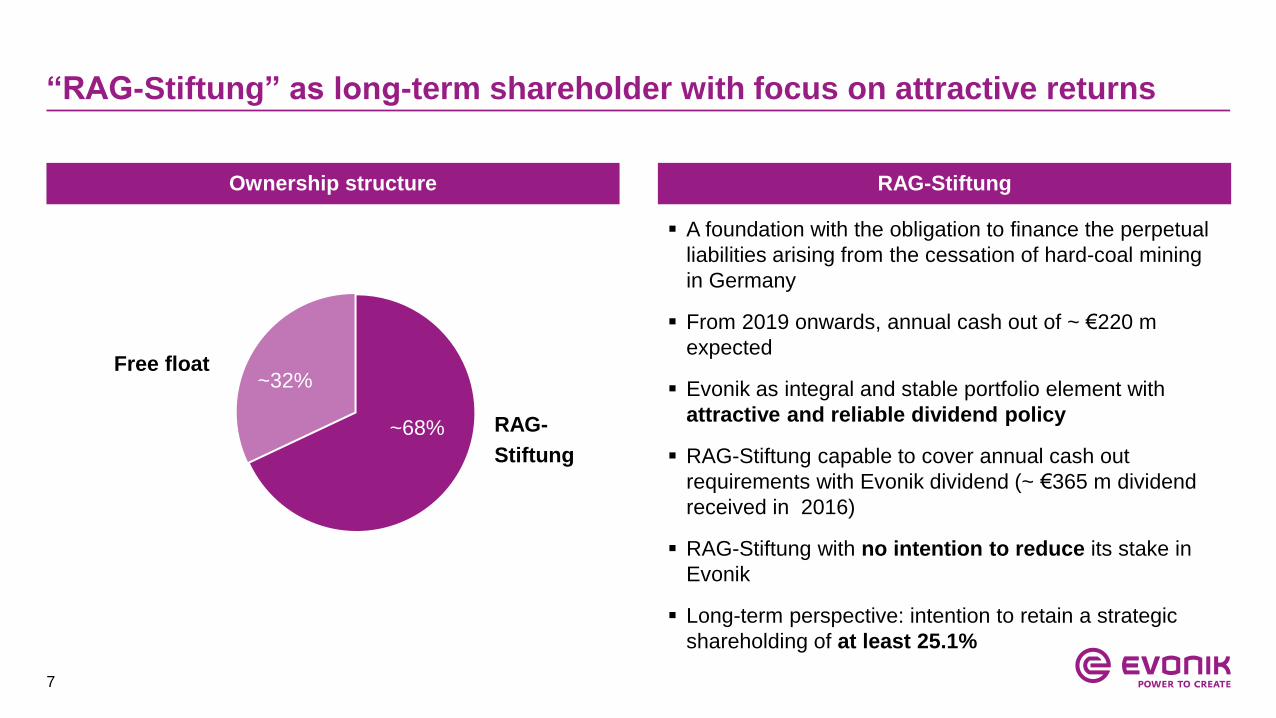
“RAG-Stiftung” as long-term shareholder with focus on attractive returns
~32%
~68% RAG-
Stiftung
Free float
Ownership structure RAG-Stiftung
A foundation with the obligation to finance the perpetual
liabilities arising from the cessation of hard-coal mining
in Germany
From 2019 onwards, annual cash out of ~ €220 m
expected
Evonik as integral and stable portfolio element with
attractive and reliable dividend policy
RAG-Stiftung capable to cover annual cash out
requirements with Evonik dividend (~ €365 m dividend
received in 2016)
RAG-Stiftung with no intention to reduce its stake in
Evonik
Long-term perspective: intention to retain a strategic
shareholding of at least 25.1%
8
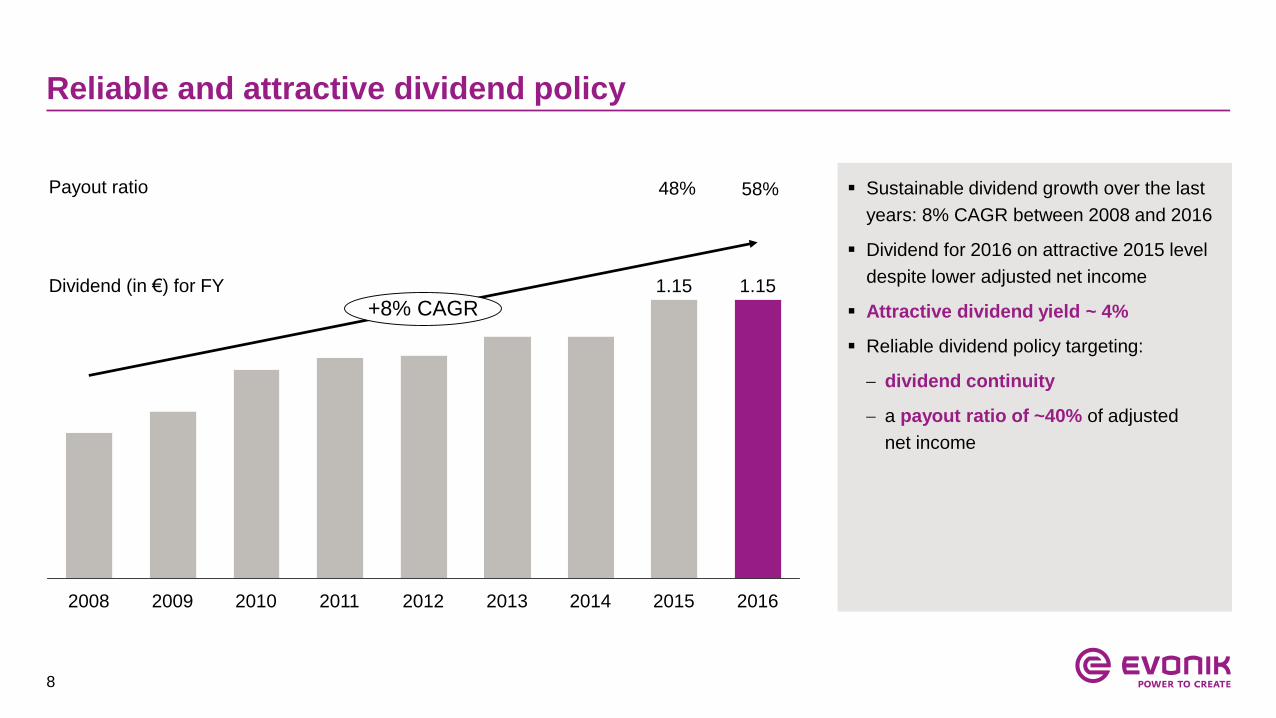
Reliable and attractive dividend policy
2008 2009 20112010 20132012 20152014
1.15
+8% CAGR
2016
1.15
Sustainable dividend growth over the last
years: 8% CAGR between 2008 and 2016
Dividend for 2016 on attractive 2015 level
despite lower adjusted net income
Attractive dividend yield ~ 4%
Reliable dividend policy targeting:
dividend continuity
a payout ratio of ~40% of adjusted
net income
Dividend (in €) for FY
Payout ratio 48% 58%
9
Table of contents
1. Evonik at a glance
2. Strategy Update
3. Financials Q3 2017
4. Appendix
10
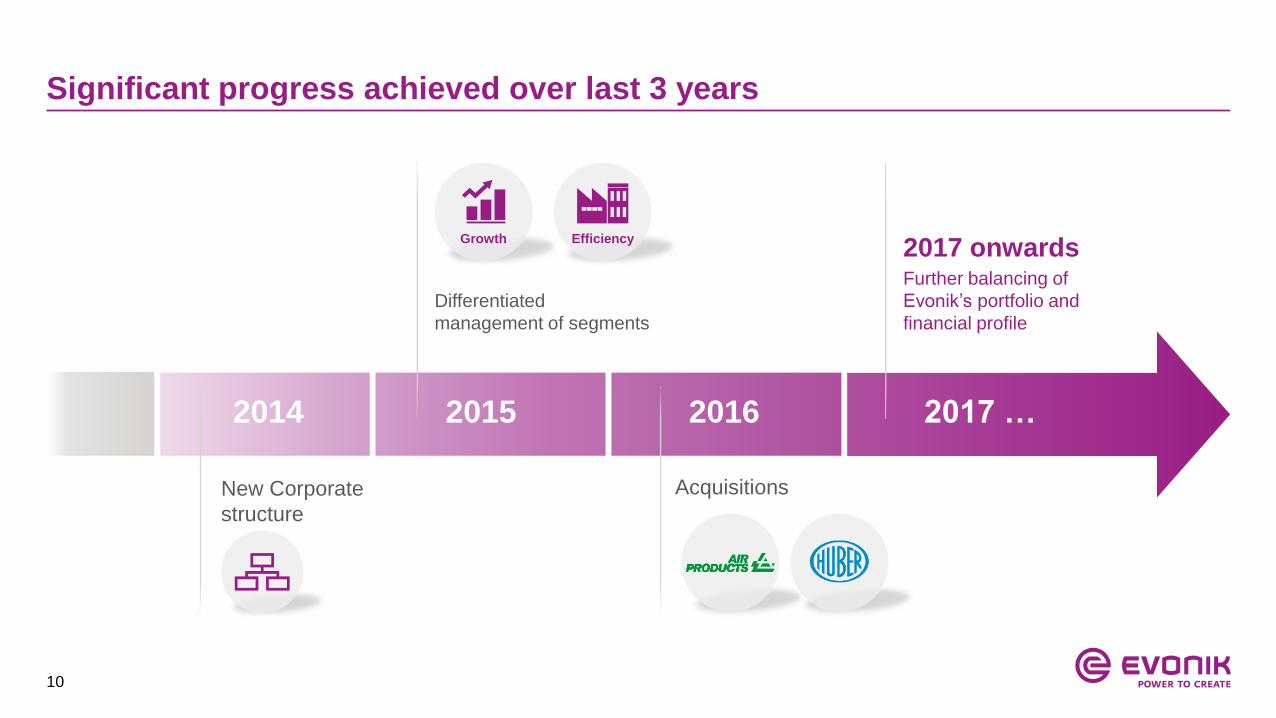
Significant progress achieved over last 3 years
2017 …201620152014
Acquisitions
EfficiencyGrowth
Differentiated
management of segments
New Corporate
structure
2017 onwardsFurther balancing of
Evonik’s portfolio and
financial profile
11
Building a best-in-class
specialty chemicals company
12
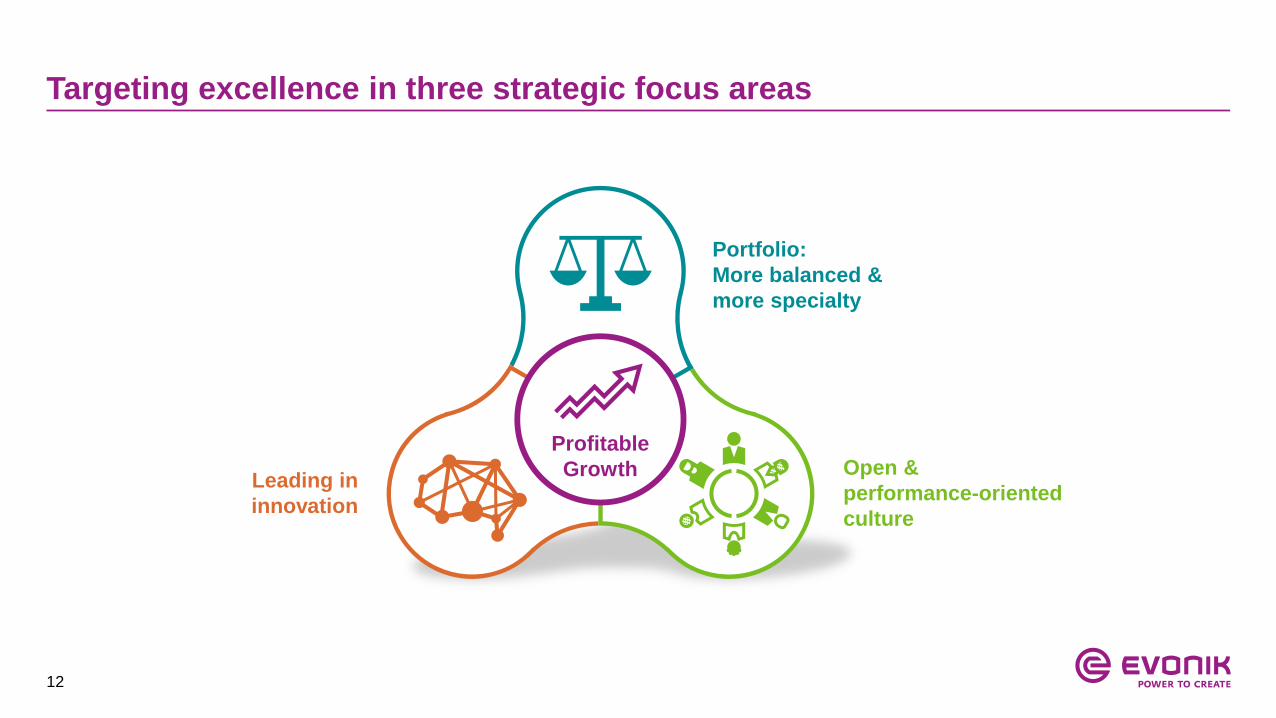
Targeting excellence in three strategic focus areas
Portfolio:
More balanced &
more specialty
Leading in
innovation
Open &
performance-oriented
culture
Profitable
Growth
13
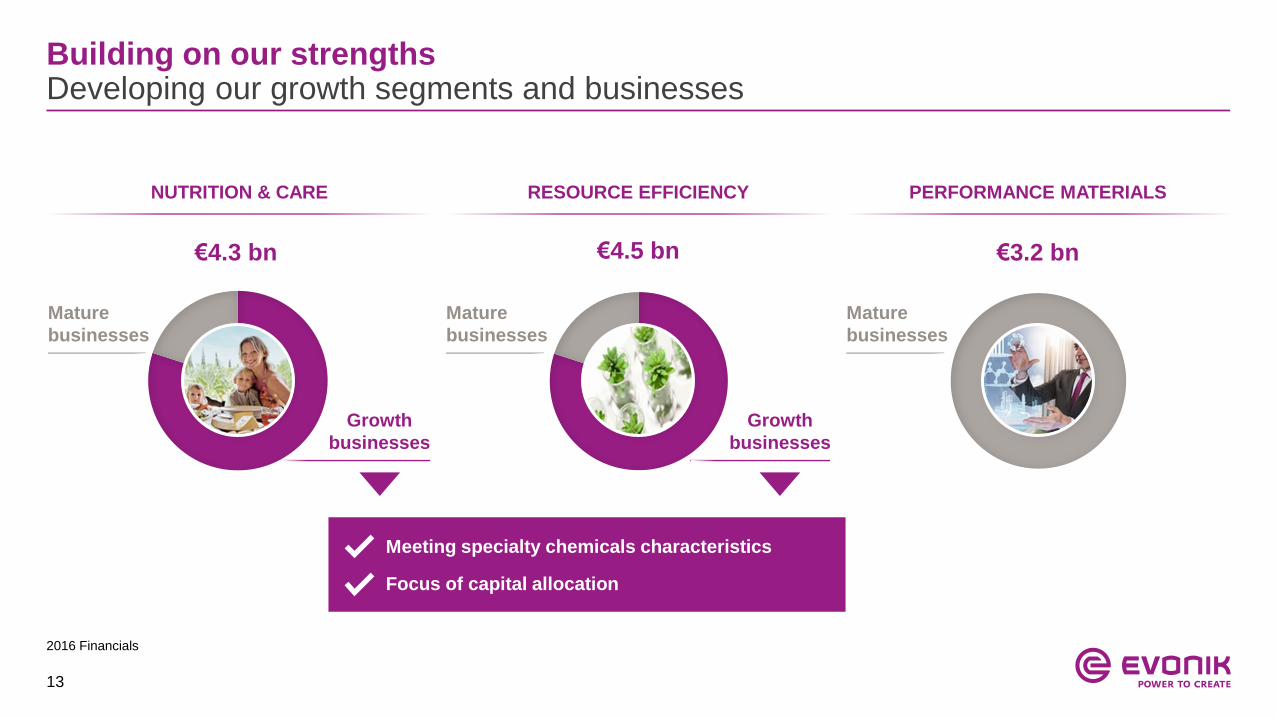
Building on our strengthsDeveloping our growth segments and businesses
NUTRITION & CARE RESOURCE EFFICIENCY PERFORMANCE MATERIALS
€4.3 bn €4.5 bn €3.2 bn
Meeting specialty chemicals characteristics
Focus of capital allocation
Growth
businesses
Growth
businesses
Mature
businesses
Mature
businesses
Mature
businesses
2016 Financials
14
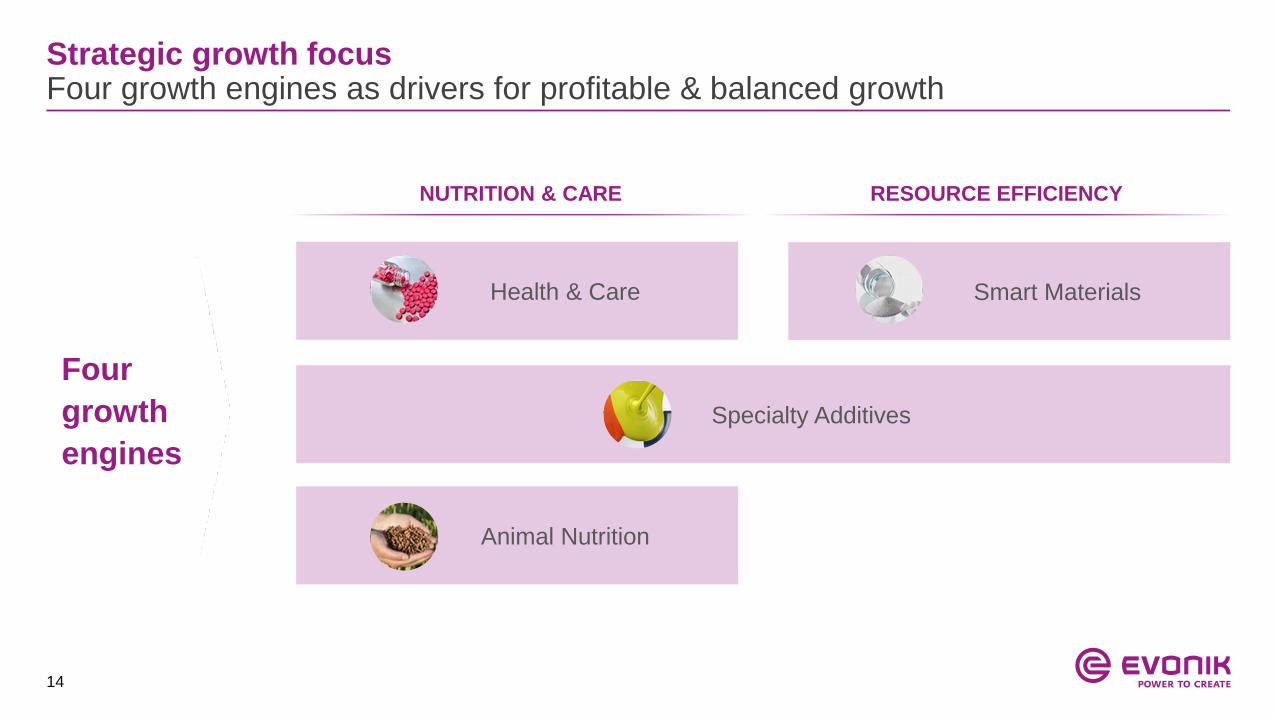
Smart MaterialsHealth & Care
Strategic growth focusFour growth engines as drivers for profitable & balanced growth
Four
growth
engines
NUTRITION & CARE RESOURCE EFFICIENCY
Animal Nutrition
Specialty Additives
15
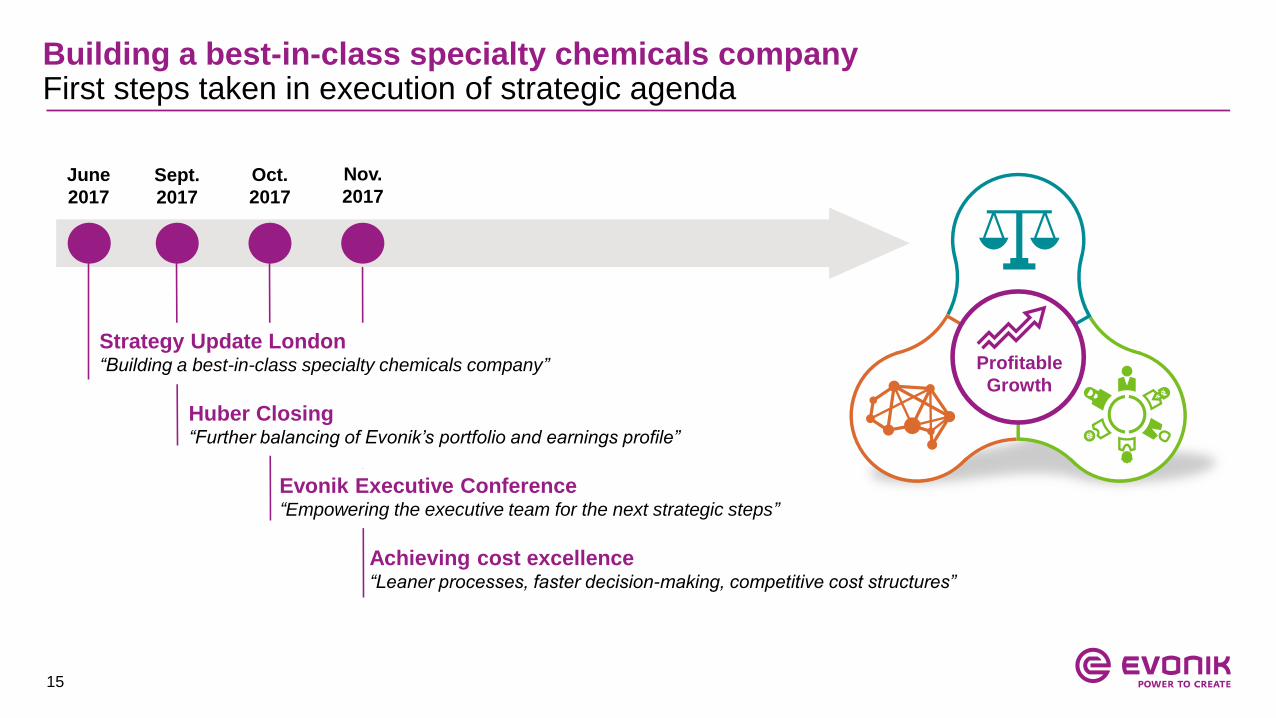
Building a best-in-class specialty chemicals companyFirst steps taken in execution of strategic agenda
Profitable
Growth
Evonik Executive Conference “Empowering the executive team for the next strategic steps”
Achieving cost excellence“Leaner processes, faster decision-making, competitive cost structures”
June
2017
Sept.
2017
Oct.
2017
Nov.
2017
Huber Closing“Further balancing of Evonik’s portfolio and earnings profile”
Strategy Update London“Building a best-in-class specialty chemicals company”
16
Achieving cost excellenceLeaner processes, higher cost discipline, competitive cost structures
Focus: Administrative & selling expenses
Scope: Management holding, segments & regions
Leaner organization and processes
Competitive cost structures
Higher cost discipline
Less regulation – focus on value generation
All measures implemented by end of 2020,
full effect in 2021
Immediate effect
in 2018 of
€200 mCost savings of
€50 m Immediate implementation & realization
Fully earnings-accretive already in 2018
Limited implementation costs and time
Strengthening free cash flow in 2018
17
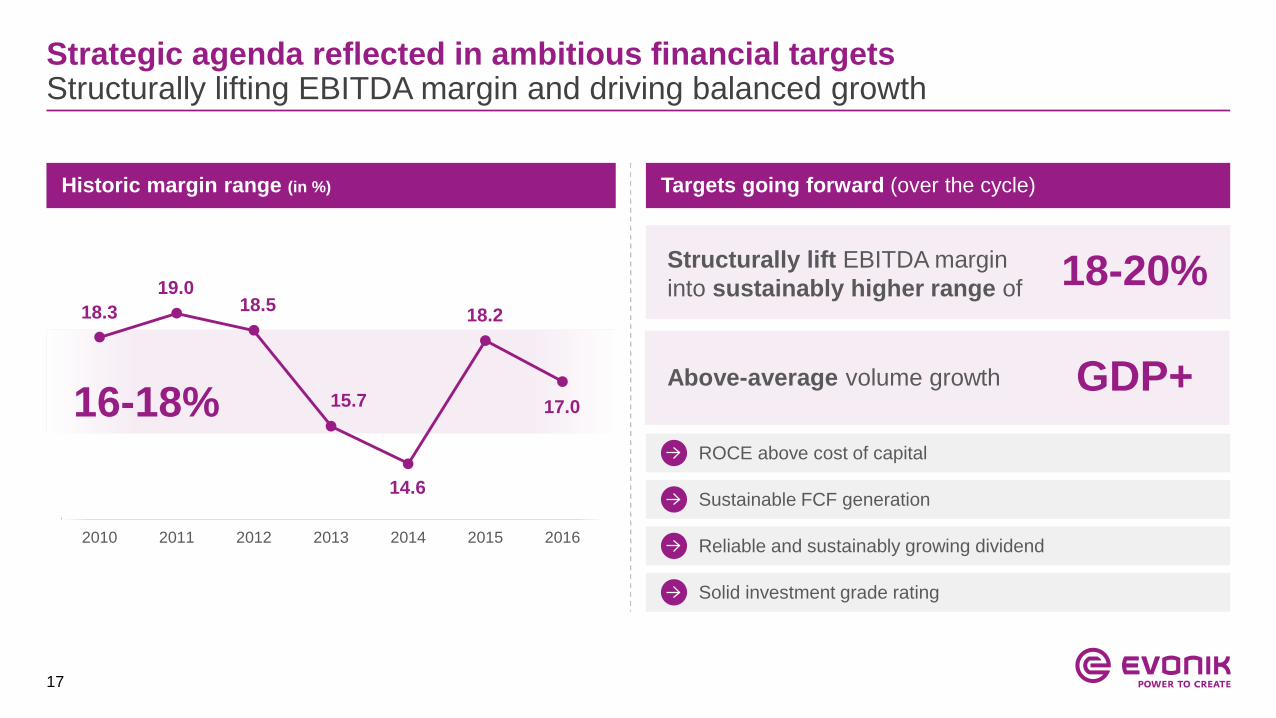
Strategic agenda reflected in ambitious financial targetsStructurally lifting EBITDA margin and driving balanced growth
Historic margin range (in %) Targets going forward (over the cycle)
2010 2011 2012 2013 2014 2015 2016
18.3
19.018.5
15.7
14.6
18.2
17.0
ROCE above cost of capital
Sustainable FCF generation
Reliable and sustainably growing dividend
Solid investment grade rating
18-20%Structurally lift EBITDA margin
into sustainably higher range of
16-18%GDP+Above-average volume growth
18
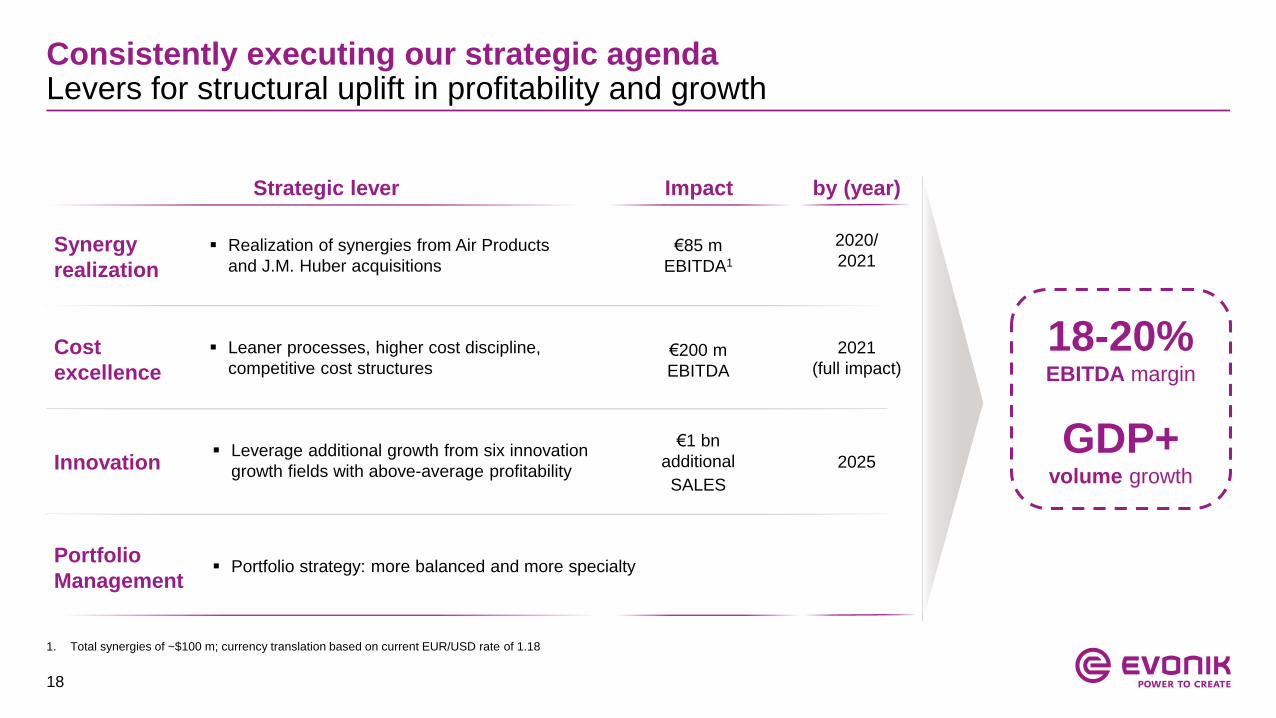
Consistently executing our strategic agenda Levers for structural uplift in profitability and growth
Cost
excellence
Innovation
Portfolio
Management
Synergy
realization
by (year)
Realization of synergies from Air Products
and J.M. Huber acquisitions
Leaner processes, higher cost discipline,
competitive cost structures
Leverage additional growth from six innovation
growth fields with above-average profitability
Portfolio strategy: more balanced and more specialty
Impact
€85 m
EBITDA1
€200 m
EBITDA
€1 bn
additional
SALES
Strategic lever
2020/
2021
2021
(full impact)
2025
18-20%EBITDA margin
GDP+volume growth
1. Total synergies of ~$100 m; currency translation based on current EUR/USD rate of 1.18
19
Table of contents
1. Evonik at a glance
2. Strategy Update
3. Financials Q3 2017
4. Appendix
20
Financial highlights Q3 2017 Positive volume and price trend, only modest NFD increase despite Huber
Sales(in € m)
Adj. EPS (in €)
Adj. EBITDA (in € m)
/ margin (in %)
Net financial
position (in € m)
3,1643,556
+12%
Q3 16 Q3 17
Q3 16 vs. Q3 17
Volume Price
+4% +3%
FX Other1
-3% +8%
+11%
Q3 17
0.590.53
Q3 16
+11%
Q3 17
639
Q3 16
578
18.3 18.0in %
-€69 m
-3,087 -3,156
30 June 30 Sept
1. Portfolio effects
21
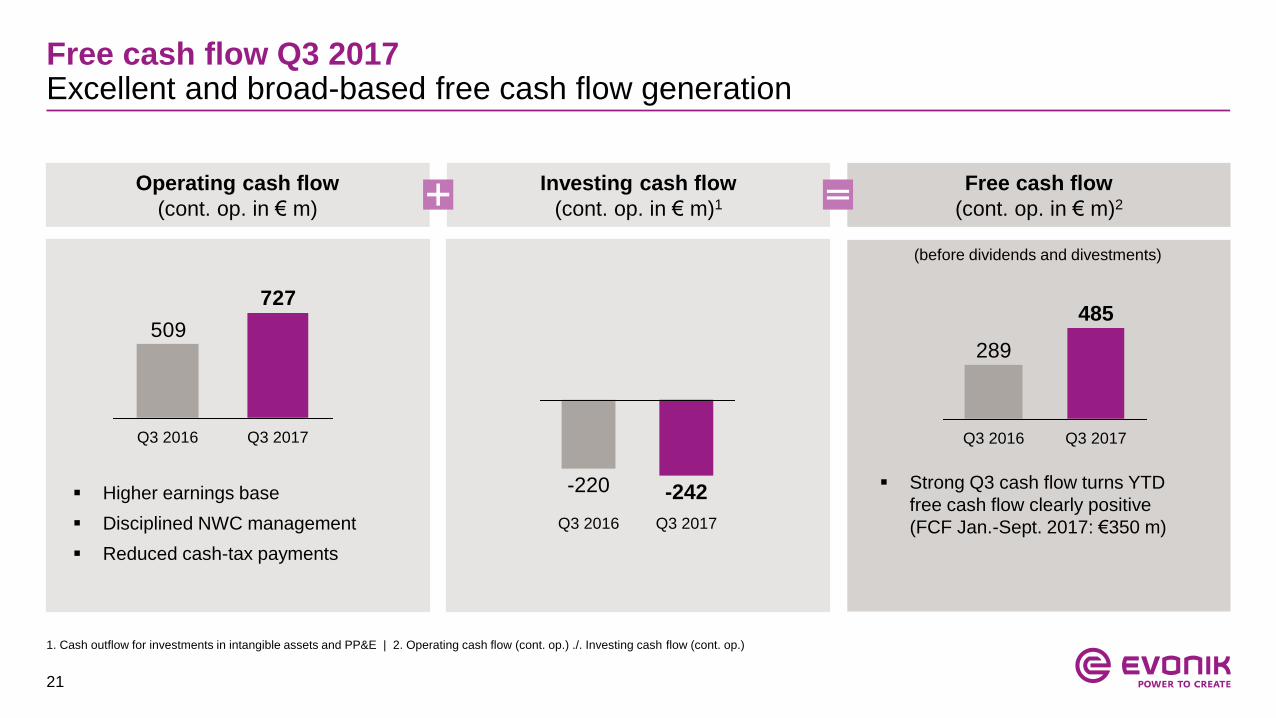
Free cash flow Q3 2017Excellent and broad-based free cash flow generation
Operating cash flow
(cont. op. in € m)
Investing cash flow
(cont. op. in € m)1
Free cash flow
(cont. op. in € m)2
1. Cash outflow for investments in intangible assets and PP&E | 2. Operating cash flow (cont. op.) ./. Investing cash flow (cont. op.)
(before dividends and divestments)
509
727
Q3 2017Q3 2016
Q3 2017
-242
Q3 2016
-220
Q3 2017
485
Q3 2016
289
Higher earnings base
Disciplined NWC management
Reduced cash-tax payments
Strong Q3 cash flow turns YTD
free cash flow clearly positive
(FCF Jan.-Sept. 2017: €350 m)
22
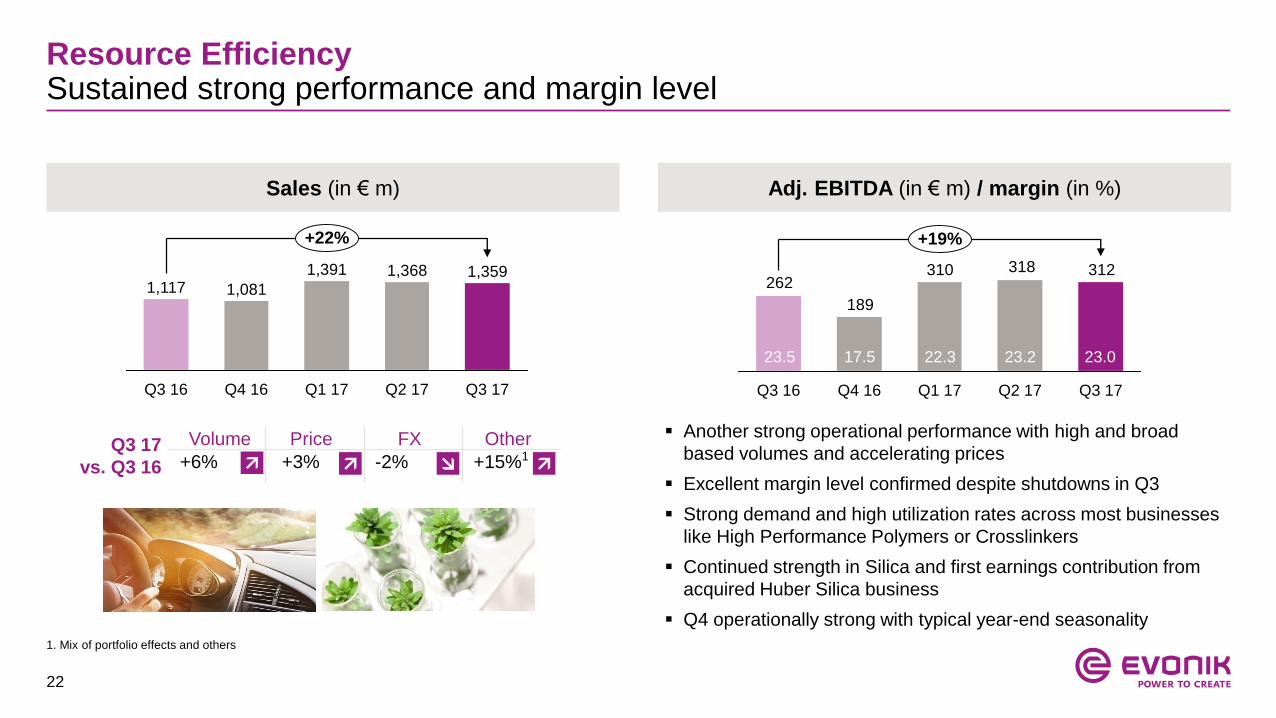
Resource EfficiencySustained strong performance and margin level
Sales (in € m) Adj. EBITDA (in € m) / margin (in %)
+22%
Q3 17
1,359
Q2 17
1,368
Q1 17
1,391
Q4 16
1,081
Q3 16
1,117
Another strong operational performance with high and broad
based volumes and accelerating prices
Excellent margin level confirmed despite shutdowns in Q3
Strong demand and high utilization rates across most businesses
like High Performance Polymers or Crosslinkers
Continued strength in Silica and first earnings contribution from
acquired Huber Silica business
Q4 operationally strong with typical year-end seasonality
312318310
189
262
Q3 17Q1 17 Q2 17
+19%
Q4 16Q3 16
Q3 17
vs. Q3 16
Volume Price FX Other
+6% +3% -2% +15%1
23.023.5 17.5 22.3 23.2
1. Mix of portfolio effects and others
23
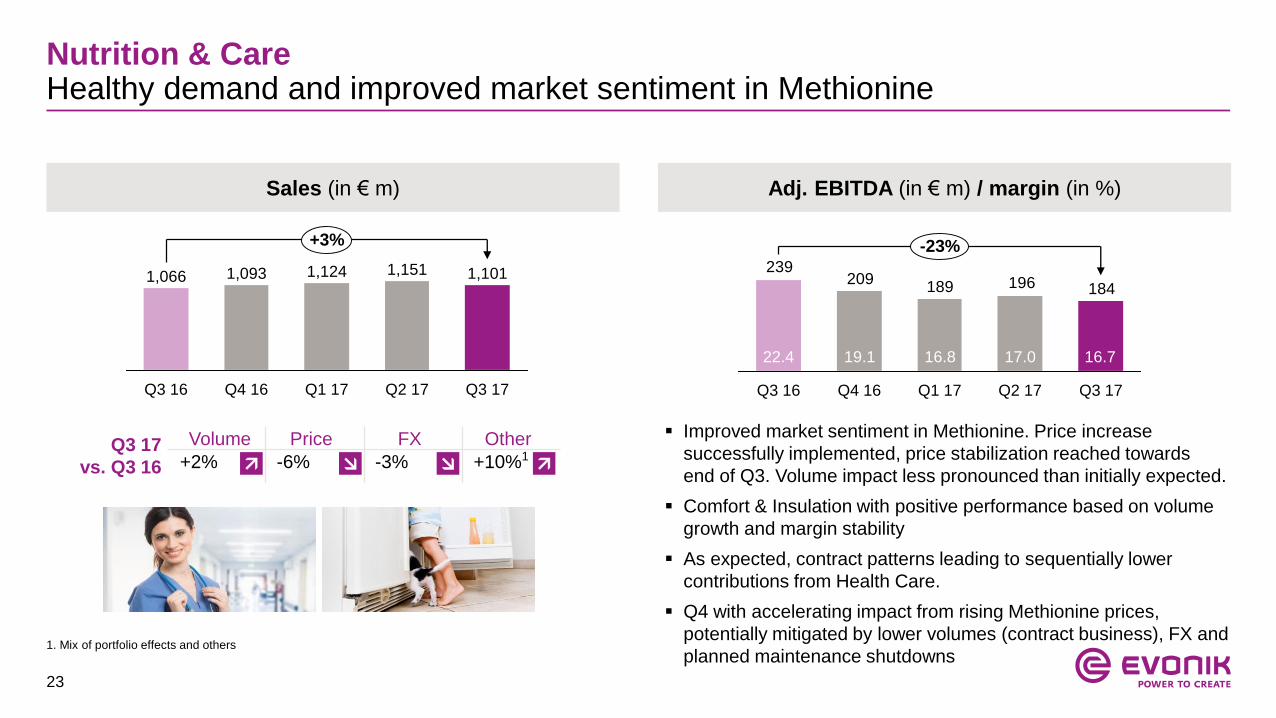
Nutrition & CareHealthy demand and improved market sentiment in Methionine
Sales (in € m) Adj. EBITDA (in € m) / margin (in %)
Q3 17
1,101
Q2 17
1,151
Q1 17
1,124
Q4 16
1,093
Q3 16
1,066
+3%
Improved market sentiment in Methionine. Price increase
successfully implemented, price stabilization reached towards
end of Q3. Volume impact less pronounced than initially expected.
Comfort & Insulation with positive performance based on volume
growth and margin stability
As expected, contract patterns leading to sequentially lower
contributions from Health Care.
Q4 with accelerating impact from rising Methionine prices,
potentially mitigated by lower volumes (contract business), FX and
planned maintenance shutdowns
184196189209
239
Q3 17Q4 16 Q1 17 Q2 17
-23%
Q3 16
22.4 19.1 16.8 17.0 16.7
Q3 17
vs. Q3 16
Volume Price FX Other
+2% -6% -3% +10%1
1. Mix of portfolio effects and others
24
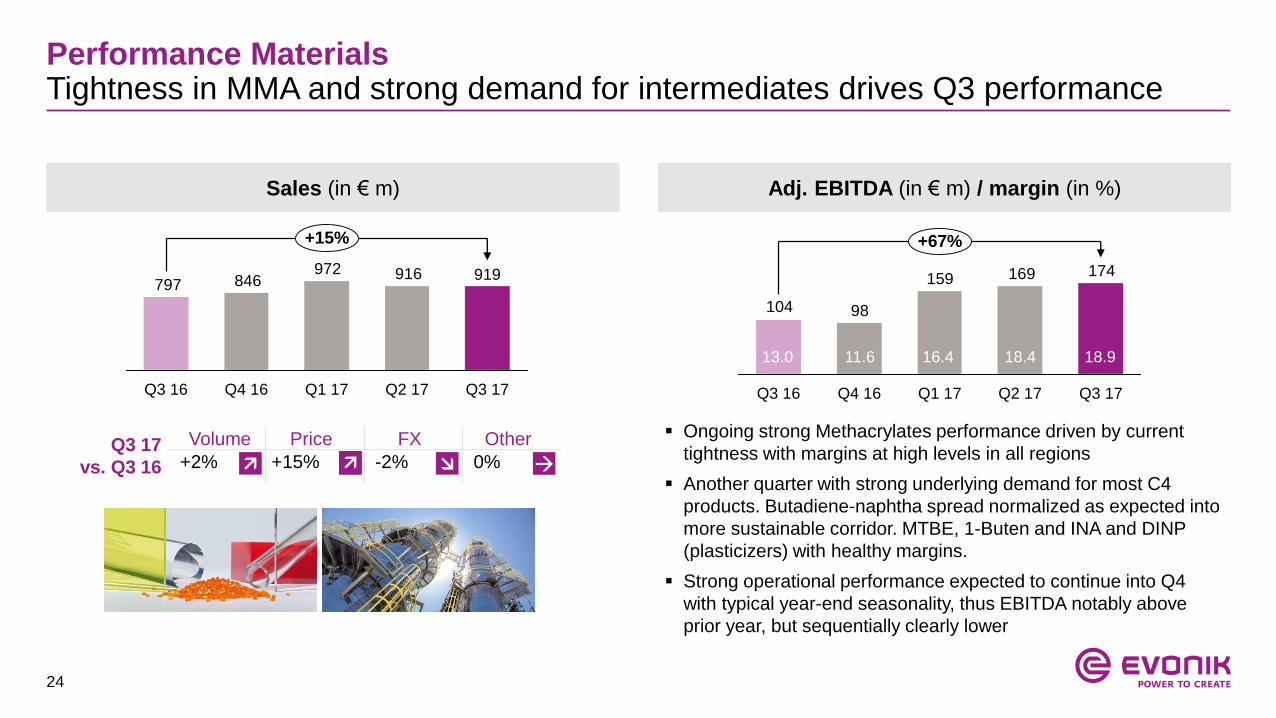
Performance MaterialsTightness in MMA and strong demand for intermediates drives Q3 performance
Sales (in € m) Adj. EBITDA (in € m) / margin (in %)
916972846797
Q4 16Q3 16
+15%
Q3 17
919
Q2 17Q1 17
Ongoing strong Methacrylates performance driven by current
tightness with margins at high levels in all regions
Another quarter with strong underlying demand for most C4
products. Butadiene-naphtha spread normalized as expected into
more sustainable corridor. MTBE, 1-Buten and INA and DINP
(plasticizers) with healthy margins.
Strong operational performance expected to continue into Q4
with typical year-end seasonality, thus EBITDA notably above
prior year, but sequentially clearly lower
174169159
98104
+67%
Q3 17Q2 17Q1 17Q4 16Q3 16
18.913.0 11.6 16.4 18.4
Q3 17
vs. Q3 16
Volume Price FX Other
+2% +15% -2% 0%
25
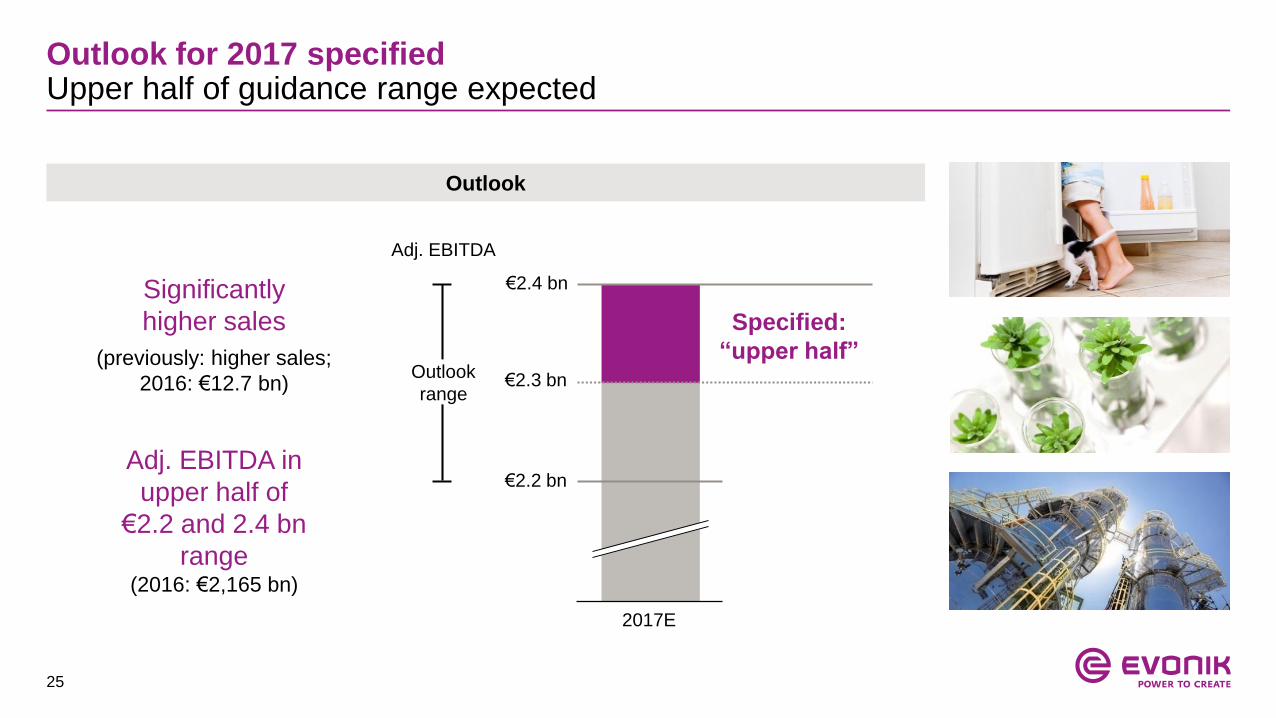
Outlook for 2017 specifiedUpper half of guidance range expected
Outlook
Significantly
higher sales
(previously: higher sales;
2016: €12.7 bn)
Adj. EBITDA in
upper half of
€2.2 and 2.4 bn
range(2016: €2,165 bn)
€2.2 bn
€2.3 bn
Adj. EBITDA
€2.4 bn
2017E
Specified:
“upper half”Outlook
range
26
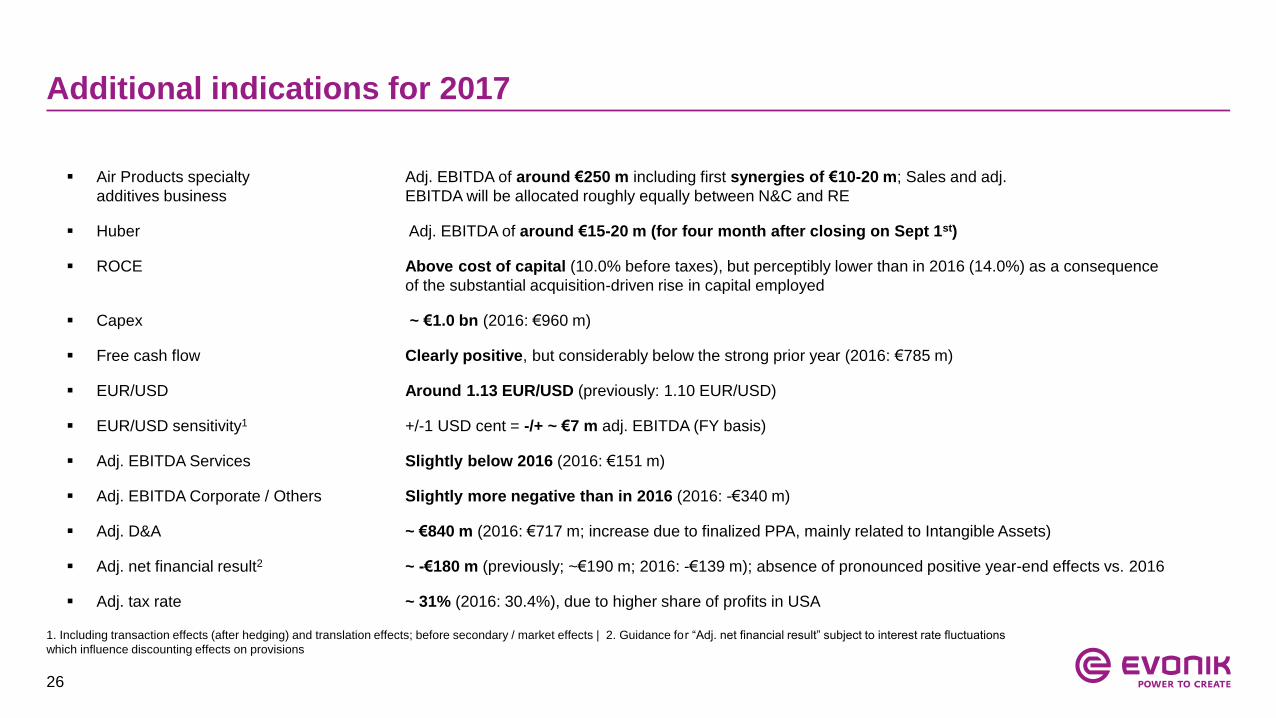
Additional indications for 2017
1. Including transaction effects (after hedging) and translation effects; before secondary / market effects | 2. Guidance for “Adj. net financial result” subject to interest rate fluctuations
which influence discounting effects on provisions
Air Products specialty Adj. EBITDA of around €250 m including first synergies of €10-20 m; Sales and adj.
additives business EBITDA will be allocated roughly equally between N&C and RE
Huber Adj. EBITDA of around €15-20 m (for four month after closing on Sept 1st)
ROCE Above cost of capital (10.0% before taxes), but perceptibly lower than in 2016 (14.0%) as a consequence
of the substantial acquisition-driven rise in capital employed
Capex ~ €1.0 bn (2016: €960 m)
Free cash flow Clearly positive, but considerably below the strong prior year (2016: €785 m)
EUR/USD Around 1.13 EUR/USD (previously: 1.10 EUR/USD)
EUR/USD sensitivity1 +/-1 USD cent = -/+ ~ €7 m adj. EBITDA (FY basis)
Adj. EBITDA Services Slightly below 2016 (2016: €151 m)
Adj. EBITDA Corporate / Others Slightly more negative than in 2016 (2016: -€340 m)
Adj. D&A ~ €840 m (2016: €717 m; increase due to finalized PPA, mainly related to Intangible Assets)
Adj. net financial result2 ~ -€180 m (previously; ~€190 m; 2016: -€139 m); absence of pronounced positive year-end effects vs. 2016
Adj. tax rate ~ 31% (2016: 30.4%), due to higher share of profits in USA

27
28
Appendix
1. Strategy Update Details
2. Acquisition of Air Products specialty additives business
3. Acquisition of Huber Silica
4. Segment overview
5. Financials
6. Upcoming events

29
Targeting excellence in three strategic focus areas
Portfolio:
More balanced &
more specialty
Leading in
innovation
Open &
performance-oriented
culture
Profitable
Growth
30
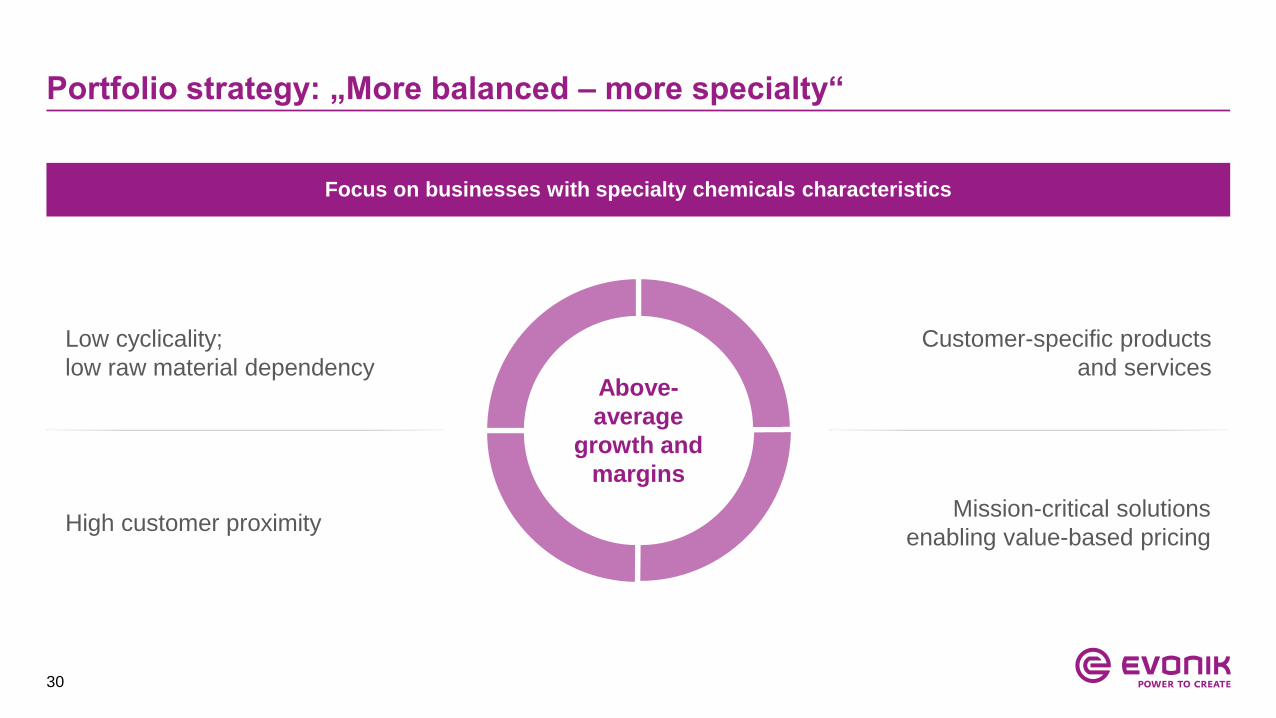
Portfolio strategy: „More balanced – more specialty“
Focus on businesses with specialty chemicals characteristics
High customer proximityMission-critical solutions
enabling value-based pricing
Low cyclicality;
low raw material dependency
Customer-specific products
and servicesAbove-
average
growth and
margins
31
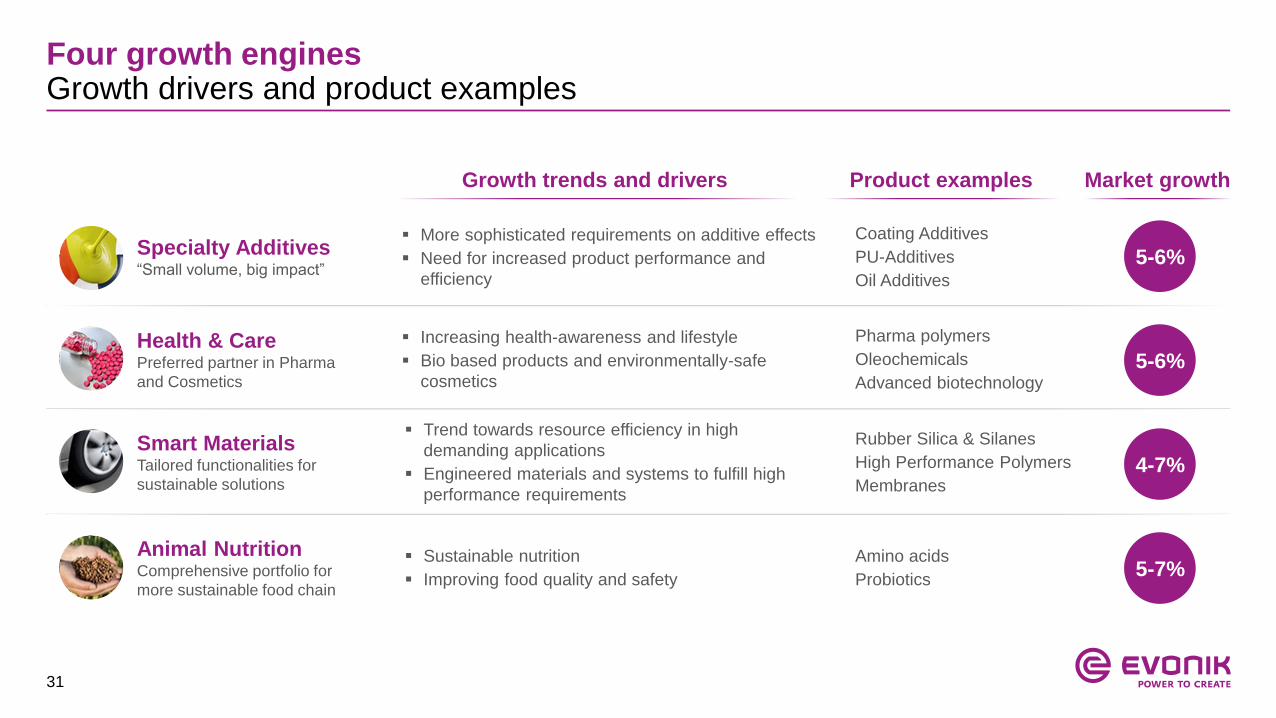
Four growth enginesGrowth drivers and product examples
Health & CarePreferred partner in Pharma
and Cosmetics
Smart MaterialsTailored functionalities for
sustainable solutions
Animal NutritionComprehensive portfolio for
more sustainable food chain
Specialty Additives“Small volume, big impact”
Growth trends and drivers Market growth
5-7%
5-6%
5-6%
4-7%
More sophisticated requirements on additive effects
Need for increased product performance and
efficiency
Increasing health-awareness and lifestyle
Bio based products and environmentally-safe
cosmetics
Trend towards resource efficiency in high
demanding applications
Engineered materials and systems to fulfill high
performance requirements
Sustainable nutrition
Improving food quality and safety
Product examples
Coating Additives
PU-Additives
Oil Additives
Pharma polymers
Oleochemicals
Advanced biotechnology
Rubber Silica & Silanes
High Performance Polymers
Membranes
Amino acids
Probiotics
32
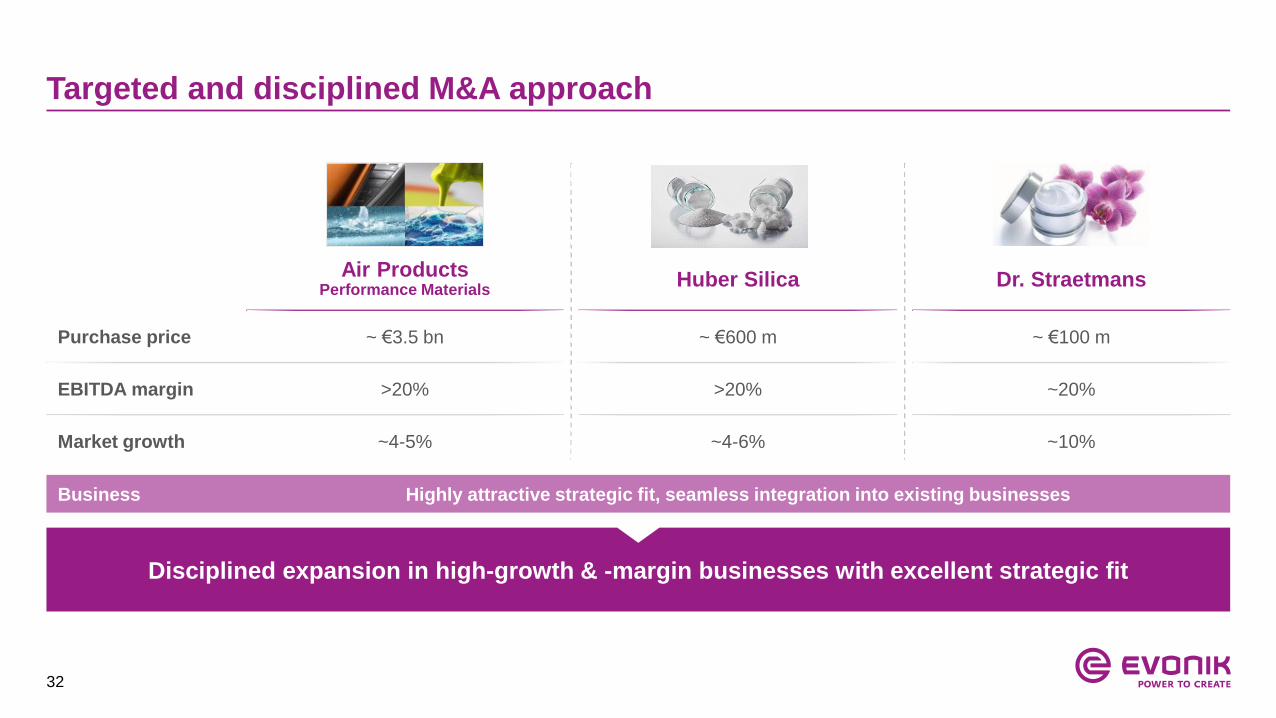
Targeted and disciplined M&A approach
Air ProductsPerformance Materials
Huber Silica Dr. Straetmans
Business Highly attractive strategic fit, seamless integration into existing businesses
Purchase price ~ €3.5 bn ~ €600 m ~ €100 m
EBITDA margin >20% >20% ~20%
Market growth ~4-5% ~4-6% ~10%
Disciplined expansion in high-growth & -margin businesses with excellent strategic fit
333 November 2017 | Evonik Q3 2017 Earnings Conference Call
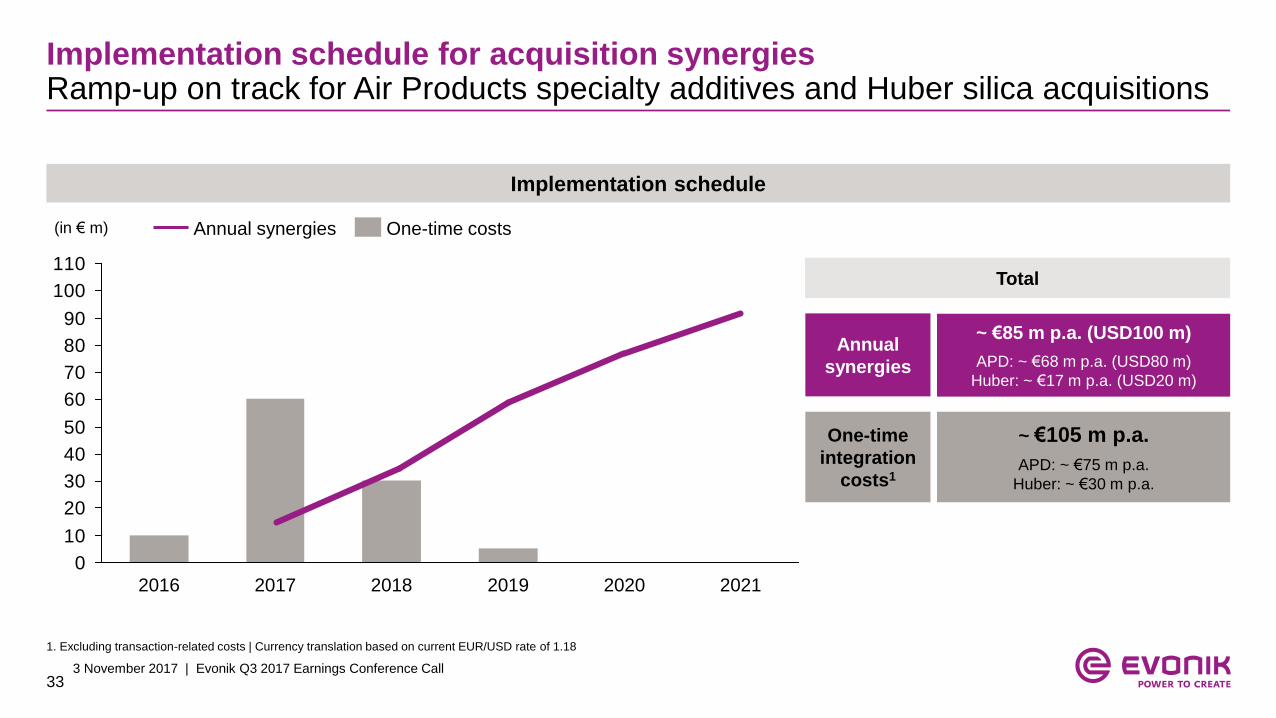
Implementation schedule for acquisition synergiesRamp-up on track for Air Products specialty additives and Huber silica acquisitions
Implementation schedule
0
10
20
30
40
50
60
70
80
90
100
110
20212016 2020201920182017
(in € m)
One-time
integration
costs1
Annual
synergies
Total
~ €85 m p.a. (USD100 m)
APD: ~ €68 m p.a. (USD80 m)
Huber: ~ €17 m p.a. (USD20 m)
~ €105 m p.a.
APD: ~ €75 m p.a.
Huber: ~ €30 m p.a.
Annual synergies One-time costs
1. Excluding transaction-related costs | Currency translation based on current EUR/USD rate of 1.18
34
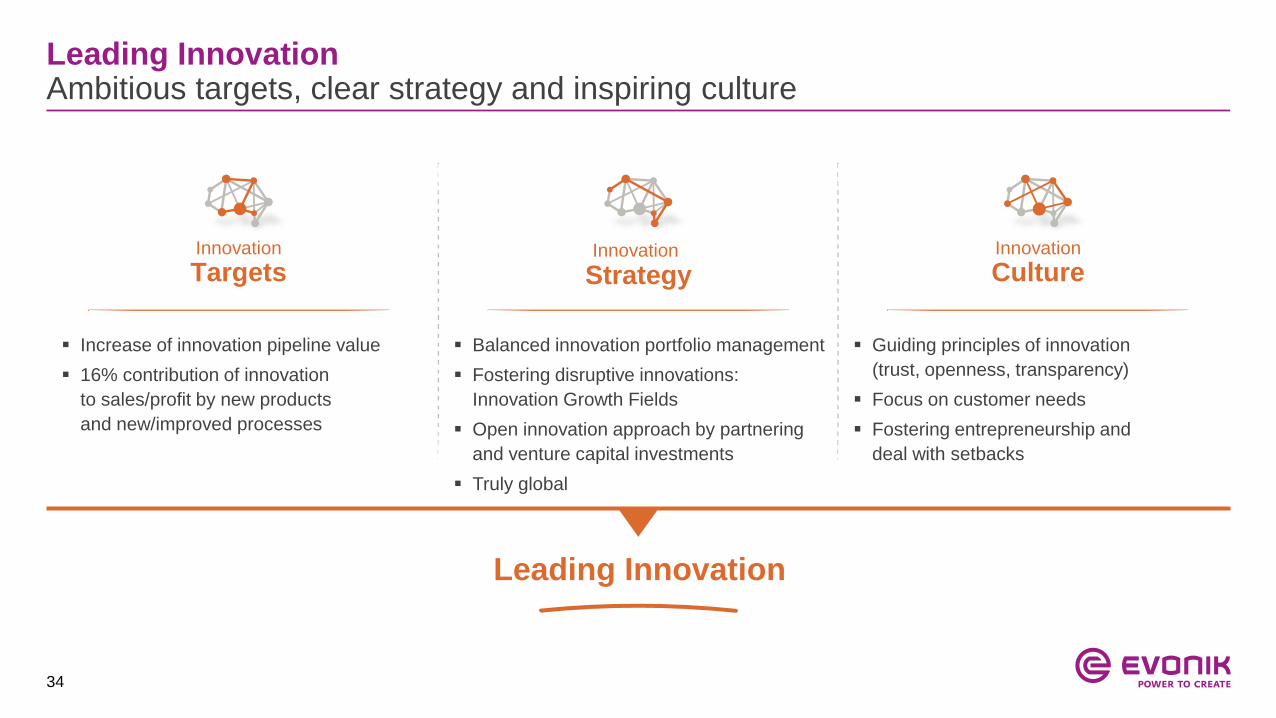
Leading InnovationAmbitious targets, clear strategy and inspiring culture
Increase of innovation pipeline value
16% contribution of innovation
to sales/profit by new products
and new/improved processes
Balanced innovation portfolio management
Fostering disruptive innovations:
Innovation Growth Fields
Open innovation approach by partnering
and venture capital investments
Truly global
Guiding principles of innovation
(trust, openness, transparency)
Focus on customer needs
Fostering entrepreneurship and
deal with setbacks
Leading Innovation
Innovation
CultureInnovation
TargetsInnovation
Strategy
35
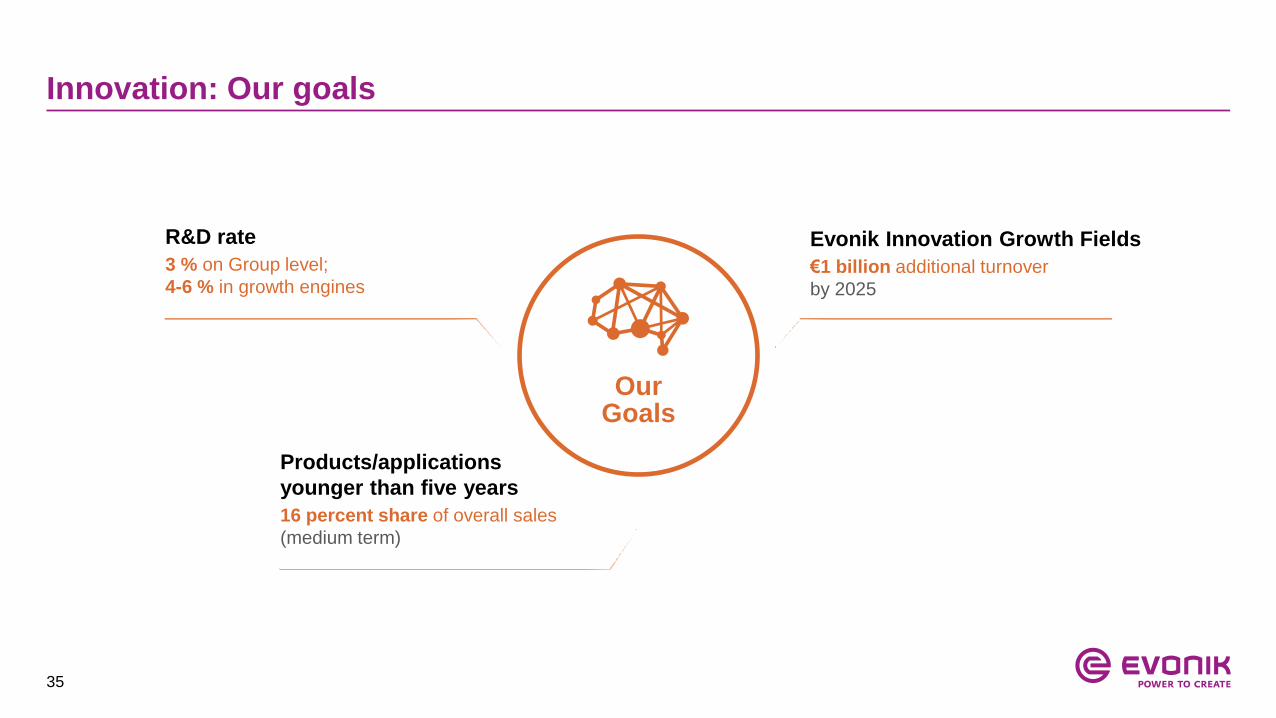
Innovation: Our goals
R&D rate
3 % on Group level;
4-6 % in growth engines
Evonik Innovation Growth Fields
€1 billion additional turnover
by 2025
Products/applications
younger than five years
16 percent share of overall sales
(medium term)
Our Goals
36
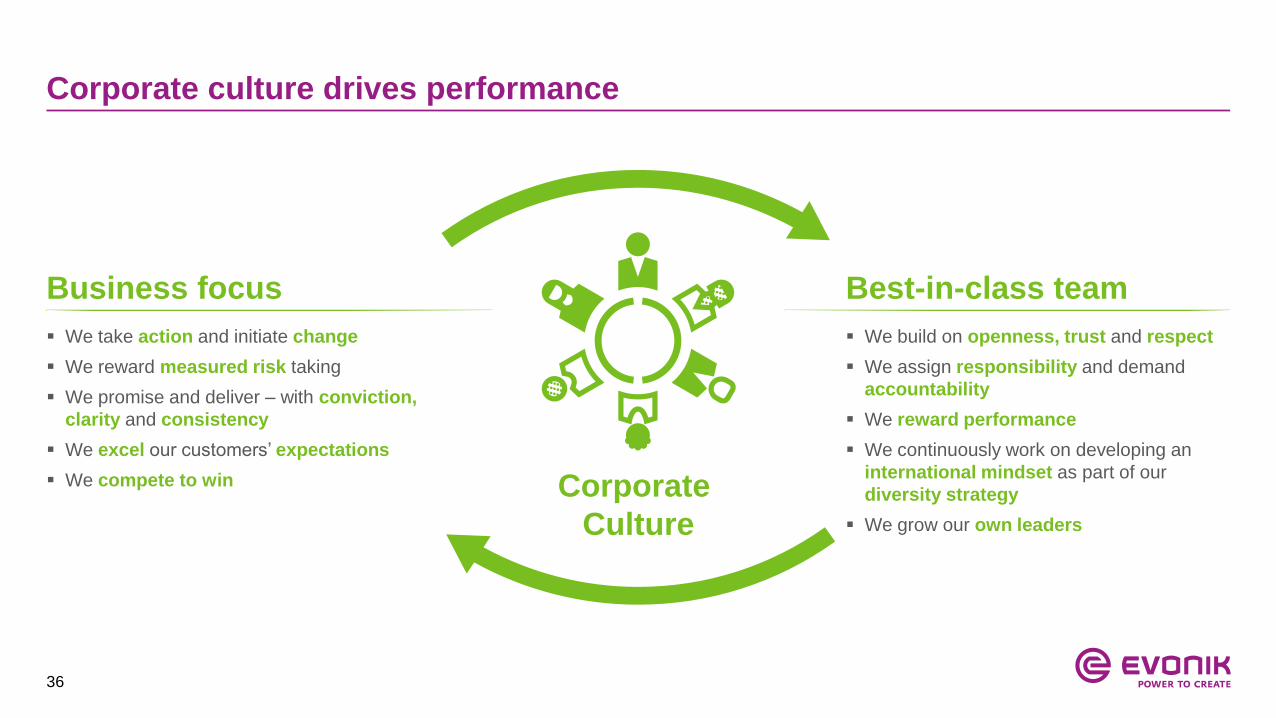
Corporate culture drives performance
Best-in-class team
We build on openness, trust and respect
We assign responsibility and demand
accountability
We reward performance
We continuously work on developing an
international mindset as part of our
diversity strategy
We grow our own leaders
Business focus
We take action and initiate change
We reward measured risk taking
We promise and deliver – with conviction,
clarity and consistency
We excel our customers’ expectations
We compete to win Corporate
Culture
37
Appendix
1. Strategy Update Details
2. Acquisition of Air Products specialty additives business
3. Acquisition of Huber Silica
4. Segment overview
5. Financials
6. Upcoming events
38
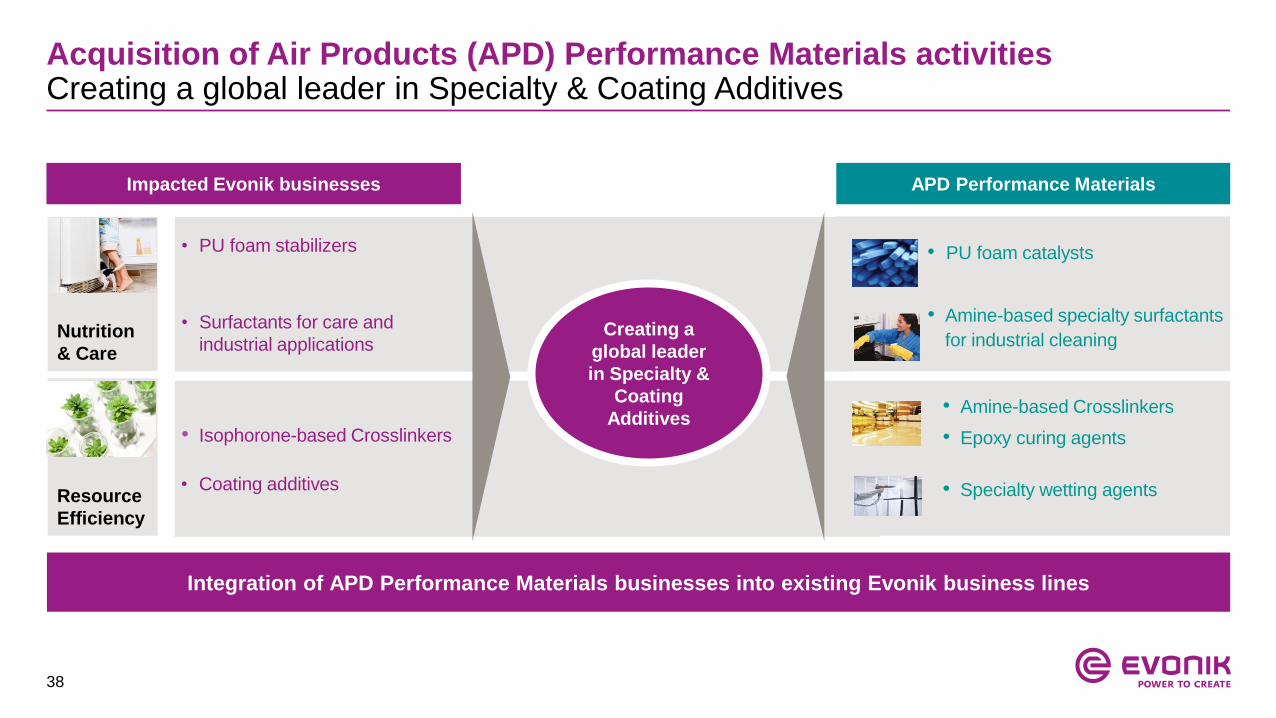
Acquisition of Air Products (APD) Performance Materials activitiesCreating a global leader in Specialty & Coating Additives
• PU foam catalysts
• Amine-based specialty surfactants
for industrial cleaning
• Amine-based Crosslinkers
• Epoxy curing agents
• Specialty wetting agents
• PU foam stabilizers
• Surfactants for care and
industrial applicationsNutrition
& Care
• Isophorone-based Crosslinkers
• Coating additivesResource
Efficiency
Integration of APD Performance Materials businesses into existing Evonik business lines
Impacted Evonik businesses APD Performance Materials
Creating a
global leader
in Specialty &
Coating
Additives
39
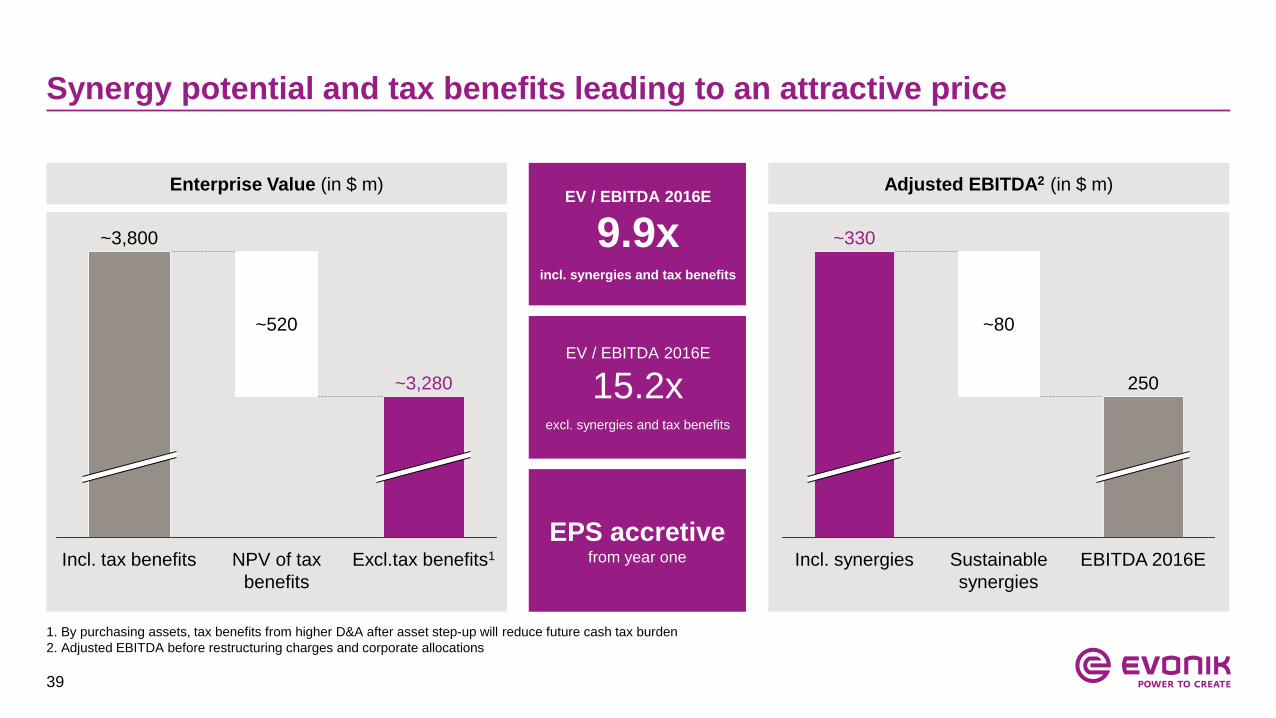
Synergy potential and tax benefits leading to an attractive price
EV / EBITDA 2016E
9.9xincl. synergies and tax benefits
EV / EBITDA 2016E
15.2xexcl. synergies and tax benefits
EPS accretive from year oneExcl.tax benefits1
~3,280
NPV of tax
benefits
~520
Incl. tax benefits
~3,800
EBITDA 2016E
250
Sustainable
synergies
~80
Incl. synergies
~330
1. By purchasing assets, tax benefits from higher D&A after asset step-up will reduce future cash tax burden
2. Adjusted EBITDA before restructuring charges and corporate allocations
Enterprise Value (in $ m) Adjusted EBITDA2 (in $ m)
40
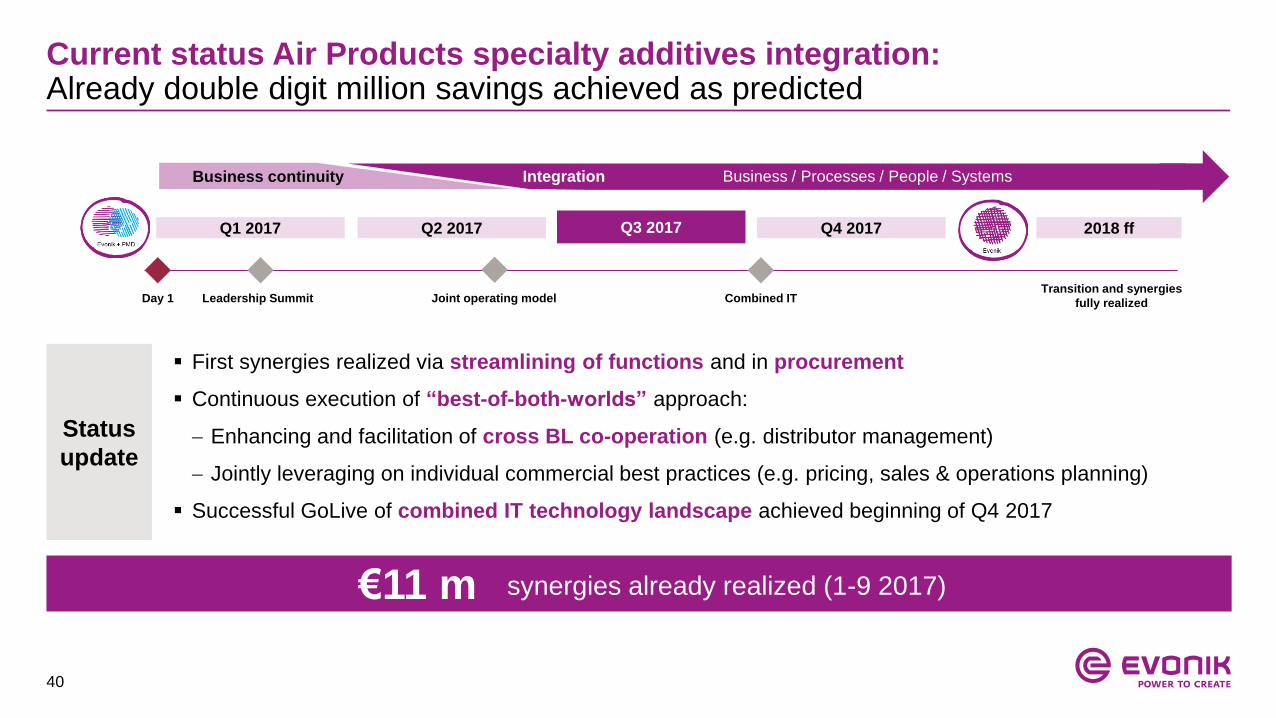
Current status Air Products specialty additives integration: Already double digit million savings achieved as predicted
Q1 2017 Q3 2017Q2 2017
Leadership Summit Joint operating modelTransition and synergies
fully realizedDay 1 Combined IT
Q4 2017 2018 ff
First synergies realized via streamlining of functions and in procurement
Continuous execution of “best-of-both-worlds” approach:
Enhancing and facilitation of cross BL co-operation (e.g. distributor management)
Jointly leveraging on individual commercial best practices (e.g. pricing, sales & operations planning)
Successful GoLive of combined IT technology landscape achieved beginning of Q4 2017
Status
update
Business continuity Business / Processes / People / SystemsIntegration
+ 3% + x% synergies already realized (1-9 2017)€11 m
41
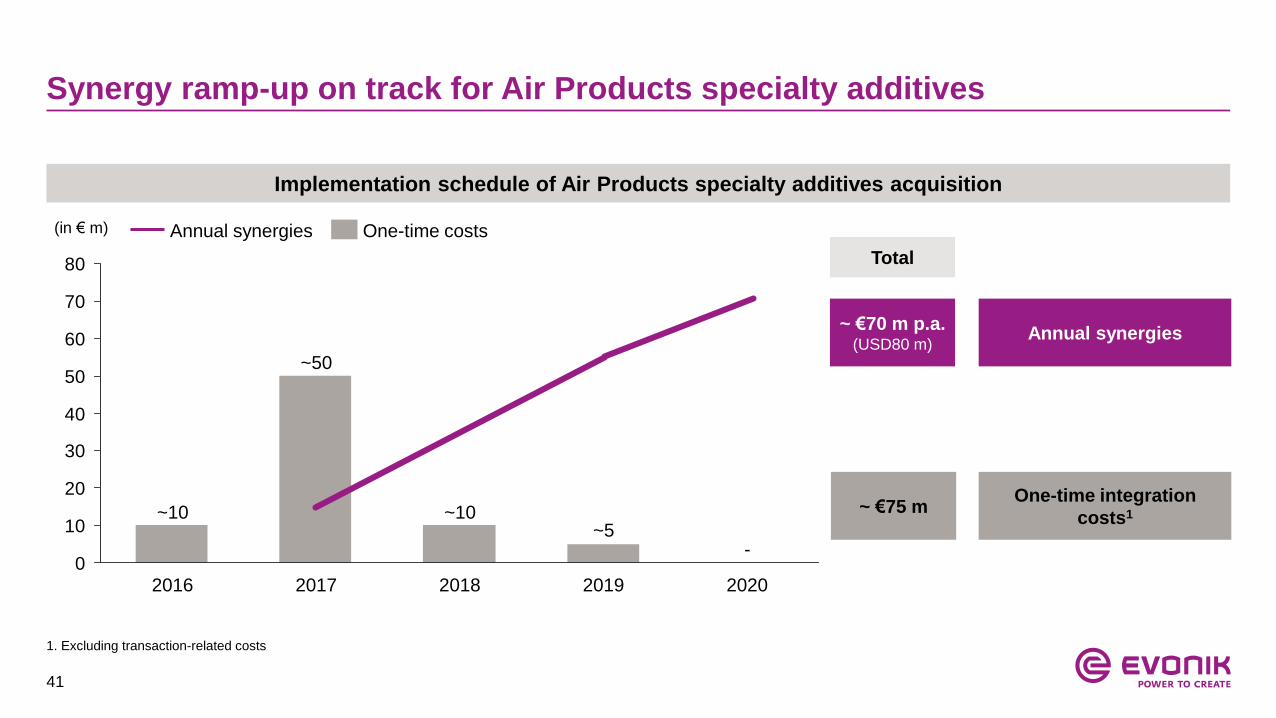
Synergy ramp-up on track for Air Products specialty additives
Implementation schedule of Air Products specialty additives acquisition
0
10
20
30
40
50
60
70
80
-
20202019
~5
2018
~10
2017
~50
2016
~10
(in € m)
One-time integration
costs1
Annual synergies
Total
~ €70 m p.a.(USD80 m)
~ €75 m
One-time costsAnnual synergies
1. Excluding transaction-related costs
42
Appendix
1. Strategy Update Details
2. Acquisition of Air Products specialty additives business
3. Acquisition of Huber Silica
4. Segment overview
5. Financials
6. Upcoming events
43
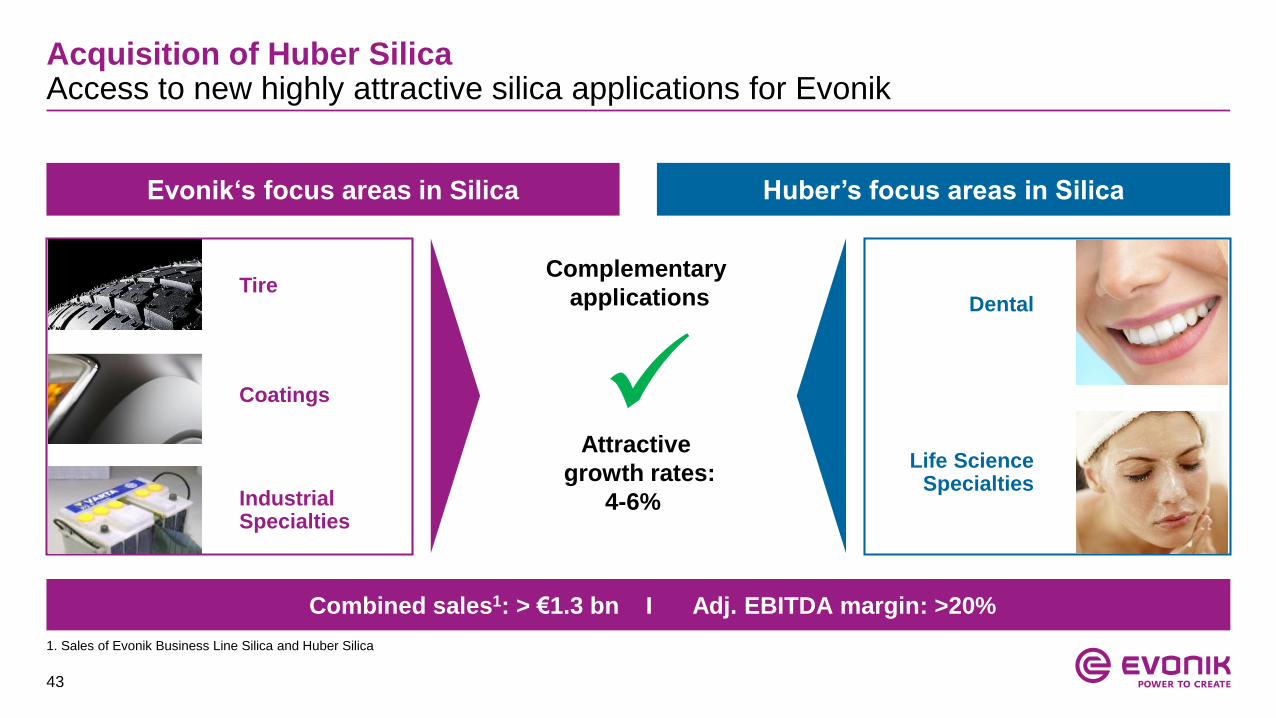
Acquisition of Huber SilicaAccess to new highly attractive silica applications for Evonik
Evonik‘s focus areas in Silica Huber’s focus areas in Silica
Tire
Coatings
Industrial Specialties
Dental
Life Science Specialties
Complementary
applications
Attractive
growth rates:
4-6%
Combined sales1: > €1.3 bn I Adj. EBITDA margin: >20%
1. Sales of Evonik Business Line Silica and Huber Silica
44
Diversified exposure with attractive growth ratesResource Efficiency and Convenience as major growth drivers
Coatings Matting agent of choice for waterborne coatings
Rheology control additive in automotive coatings
Reduced rolling resistance of “Green Tires”
Increased tensile strength and hardness of e.g. beltsTire
Tear resistance in silicones and rubbers
Flow control of bonding pastes in windmill productionIndustrial
Pharma & Care
Tableting aid and carrier for drugs
Replacement of plastic scrub particles for peelings
Food & Feed Anti-settling in liquid agrochemicals
Carrier for liquid ingredients (e.g. vitamins)
Anti-caking during food processing
Dental Abrasive silica for cleaning and whitening
Thickening agent for toothpaste
5% p.a.
5-7% p.a.
3-5% p.a.
5% p.a.
4% p.a.
4% p.a.
Source: Notch Consulting, Inc.; Evonik estimates
45
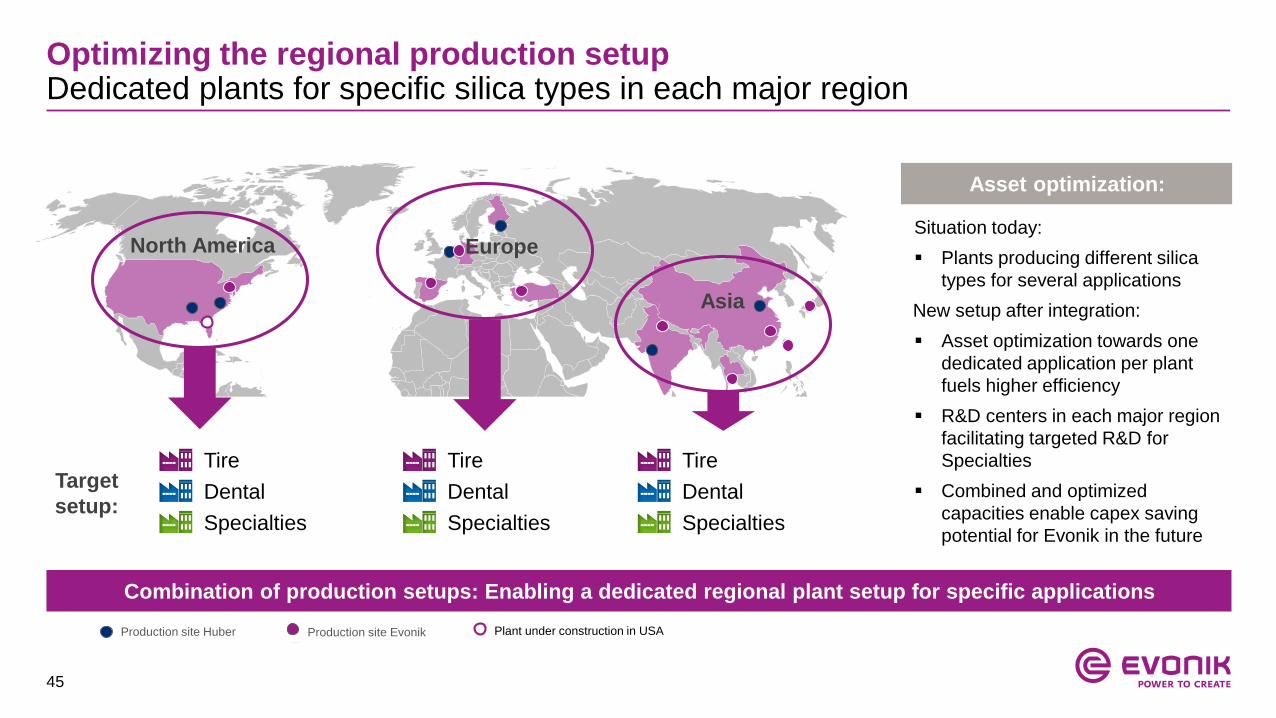
Optimizing the regional production setupDedicated plants for specific silica types in each major region
Asset optimization:
Asia
North America Europe
Combination of production setups: Enabling a dedicated regional plant setup for specific applications
Situation today:
Plants producing different silica
types for several applications
New setup after integration:
Asset optimization towards one
dedicated application per plant
fuels higher efficiency
R&D centers in each major region
facilitating targeted R&D for
Specialties
Combined and optimized
capacities enable capex saving
potential for Evonik in the future
Tire
Dental
Specialties
Tire
Dental
Specialties
Tire
Dental
Specialties
Target
setup:
Production site Huber Production site Evonik Plant under construction in USA
46
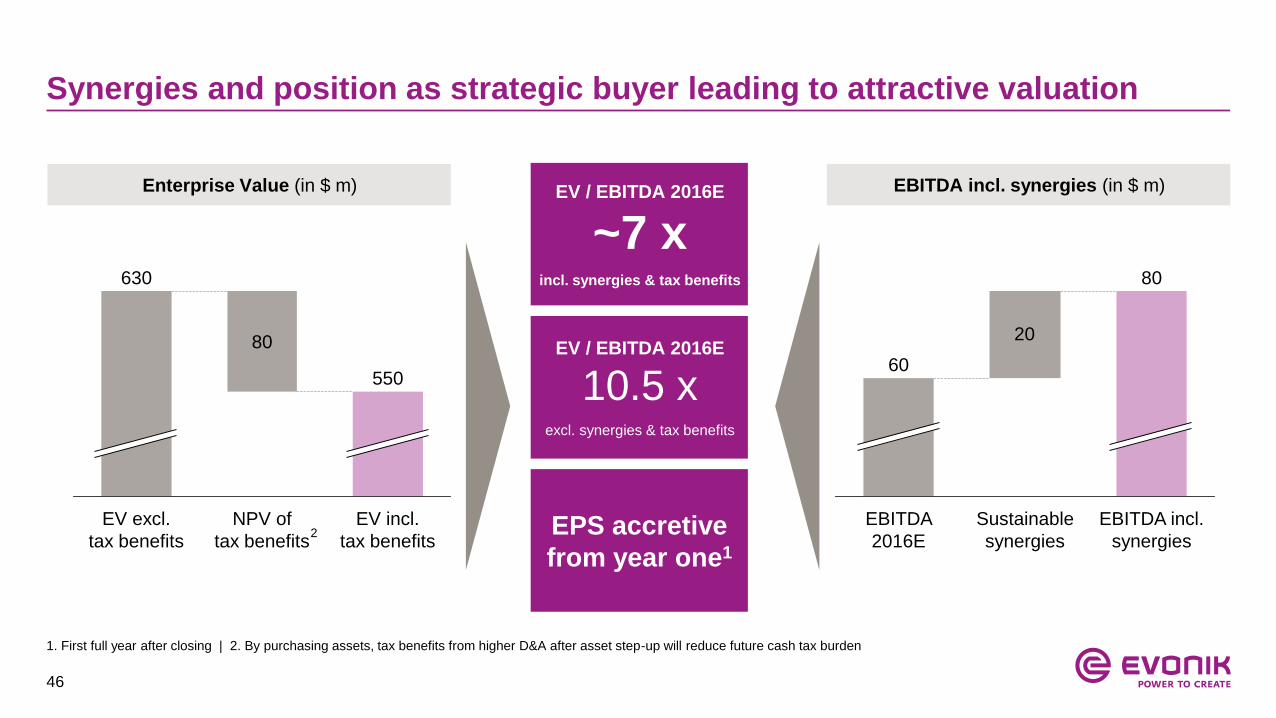
Synergies and position as strategic buyer leading to attractive valuation
Enterprise Value (in $ m) EV / EBITDA 2016E
~7 xincl. synergies & tax benefits
EV / EBITDA 2016E
10.5 xexcl. synergies & tax benefits
EPS accretive
from year one1
EBITDA incl. synergies (in $ m)
60
EBITDA incl.
synergies
80
Sustainable
synergies
EBITDA
2016E
EV incl.
tax benefits
550
NPV of
tax benefits
80
EV excl.
tax benefits
630
20
2
1. First full year after closing | 2. By purchasing assets, tax benefits from higher D&A after asset step-up will reduce future cash tax burden
47
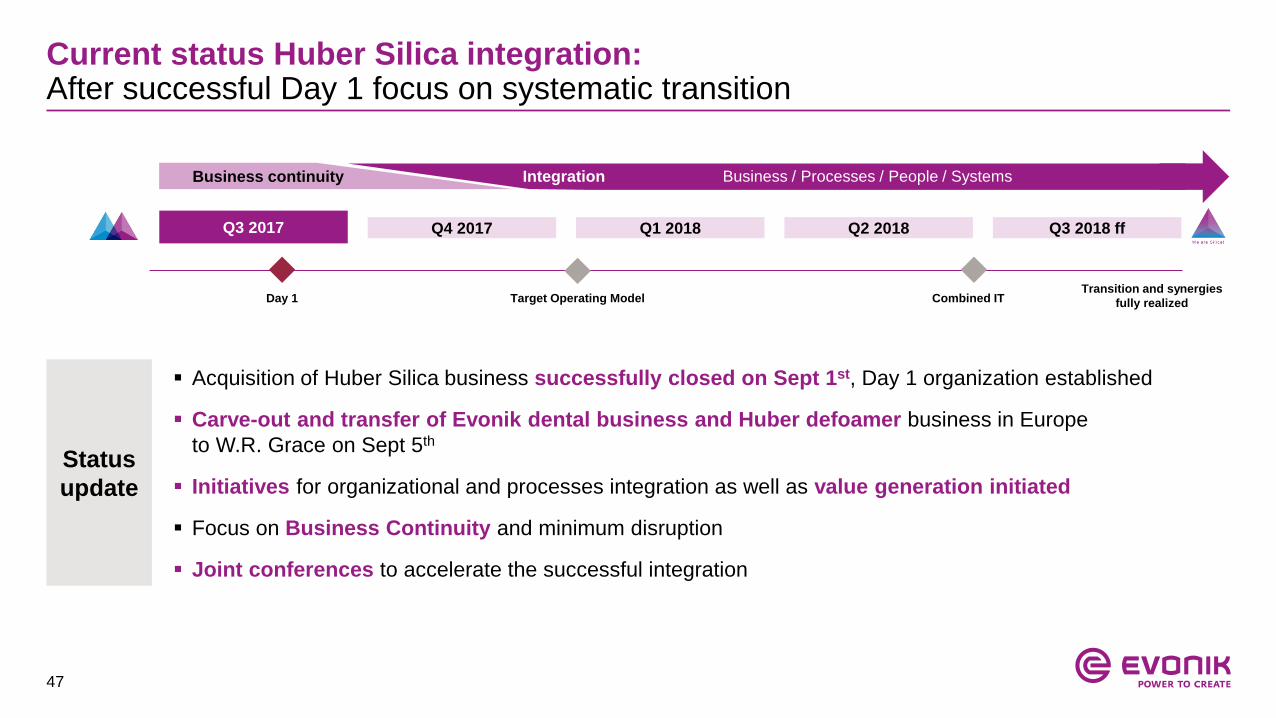
Current status Huber Silica integration:After successful Day 1 focus on systematic transition
Business continuity Business / Processes / People / SystemsIntegration
Q1 2018Q3 2017 Q4 2017 Q2 2018 Q3 2018 ff
Target Operating ModelTransition and synergies
fully realizedDay 1 Combined IT
Status
update
Acquisition of Huber Silica business successfully closed on Sept 1st, Day 1 organization established
Carve-out and transfer of Evonik dental business and Huber defoamer business in Europe
to W.R. Grace on Sept 5th
Initiatives for organizational and processes integration as well as value generation initiated
Focus on Business Continuity and minimum disruption
Joint conferences to accelerate the successful integration
48
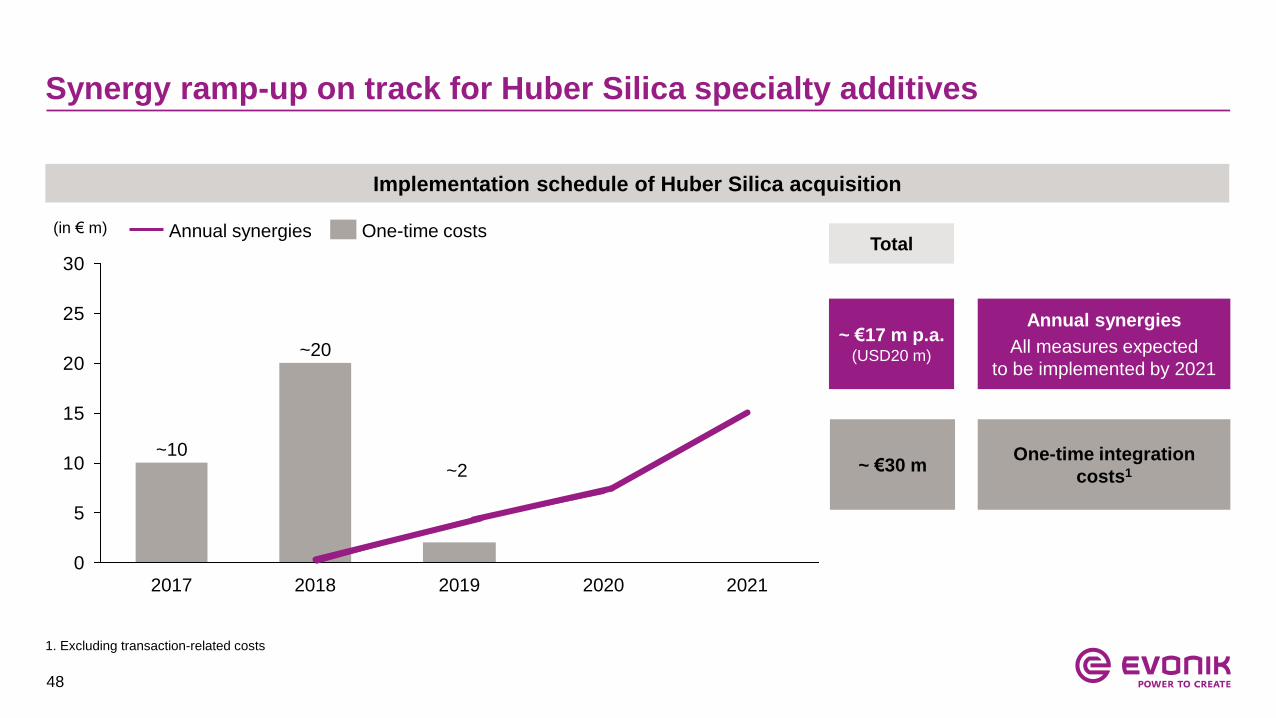
Synergy ramp-up on track for Huber Silica specialty additives
Implementation schedule of Huber Silica acquisition
0
5
10
15
20
25
30
~10
~20
2017 2018 2019 2020 2021
(in € m)
One-time integration
costs1
Annual synergies
All measures expected
to be implemented by 2021
Total
~ €17 m p.a.(USD20 m)
~ €30 m
One-time costsAnnual synergies
1. Excluding transaction-related costs
~2

49
Appendix
1. Strategy Update Details
2. Acquisition of Air Products specialty additives business
3. Acquisition of Huber Silica
4. Segment overview
5. Financials
6. Upcoming events
50
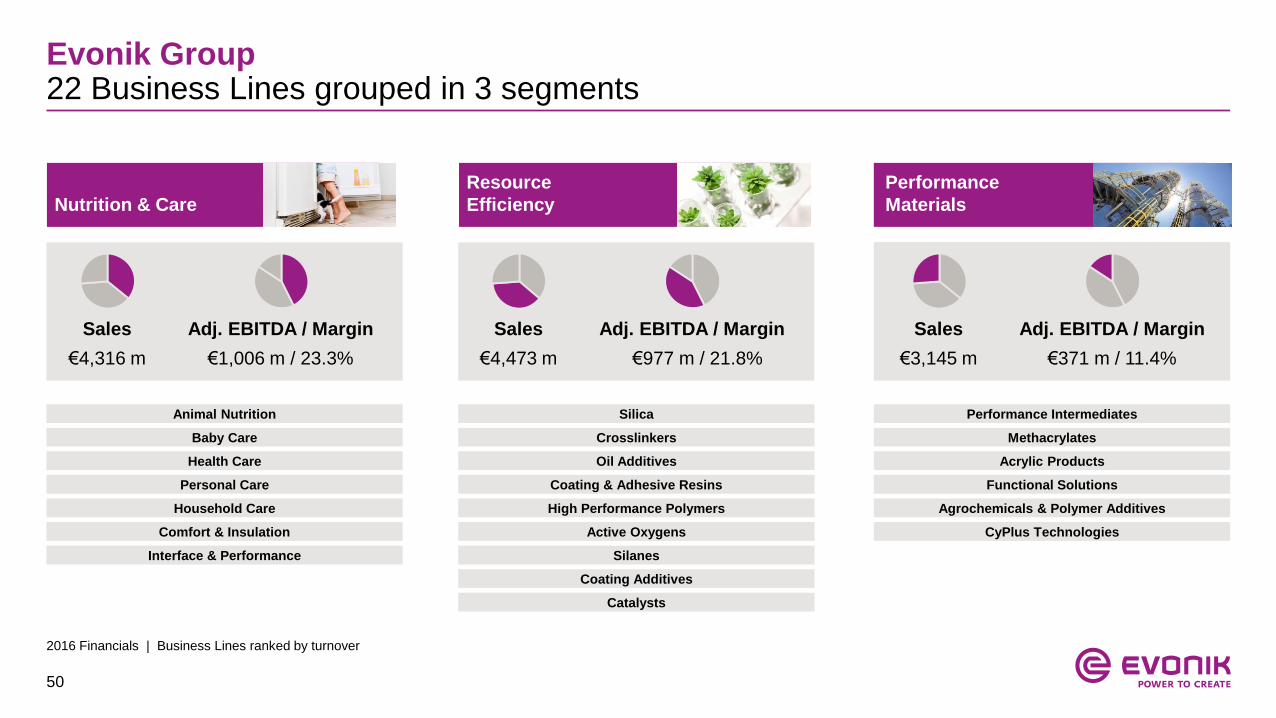
Evonik Group22 Business Lines grouped in 3 segments
Animal Nutrition
Baby Care
Health Care
Personal Care
Household Care
Comfort & Insulation
Interface & Performance
Silica
Crosslinkers
Oil Additives
Coating & Adhesive Resins
High Performance Polymers
Active Oxygens
Silanes
Coating Additives
Catalysts
Performance Intermediates
Methacrylates
Acrylic Products
Functional Solutions
Agrochemicals & Polymer Additives
CyPlus Technologies
2016 Financials | Business Lines ranked by turnover
Nutrition & Care
Resource
Efficiency
Performance
Materials
€4,316 m €1,006 m / 23.3% €4,473 m €977 m / 21.8%
Sales
€3,145 m
Adj. EBITDA / Margin
€371 m / 11.4%
Sales Adj. EBITDA / MarginSales Adj. EBITDA / Margin
51
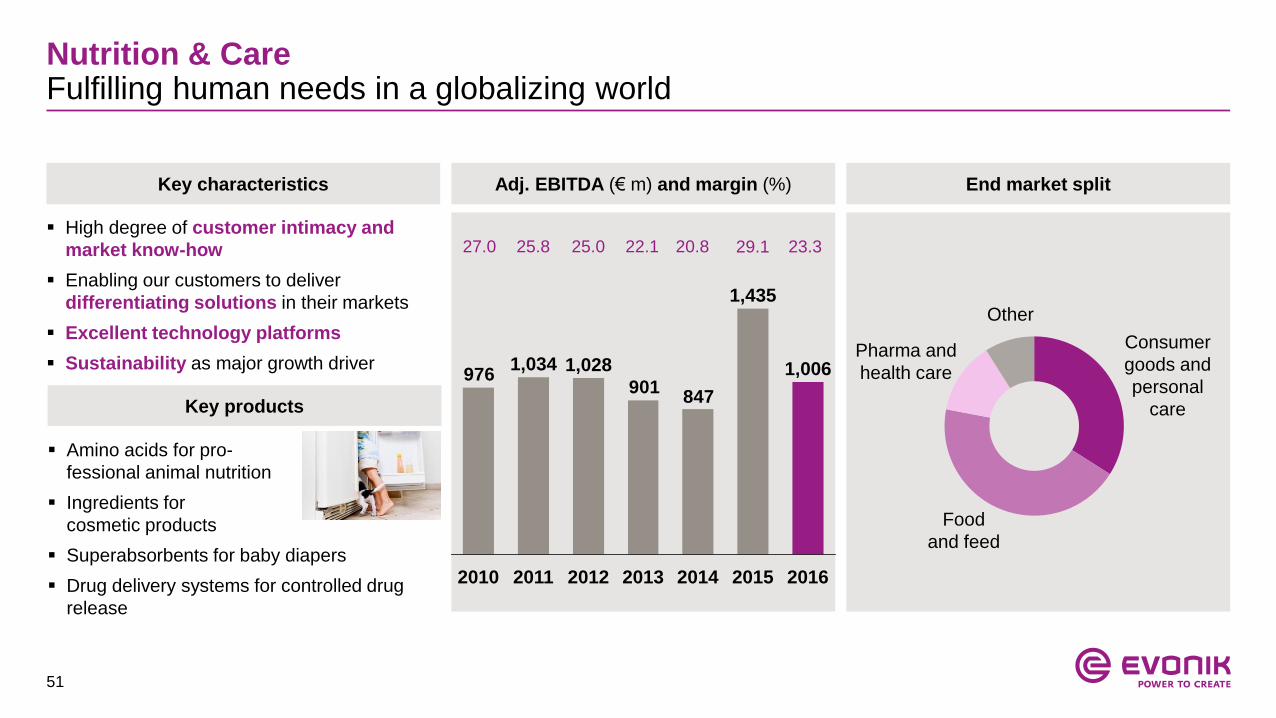
Key characteristics
Key products
Adj. EBITDA (€ m) and margin (%) End market split
847901
9761,028
2011
1,034
2010
1,006
20162015
1,435
201420132012
27.0 25.8 25.0 22.1 20.8 29.1
Consumer
goods and
personal
care
Food
and feed
Other
Pharma and
health care
Nutrition & CareFulfilling human needs in a globalizing world
High degree of customer intimacy and
market know-how
Enabling our customers to deliver
differentiating solutions in their markets
Excellent technology platforms
Sustainability as major growth driver
Amino acids for pro-
fessional animal nutrition
Ingredients for
cosmetic products
Superabsorbents for baby diapers
Drug delivery systems for controlled drug
release
23.3
52
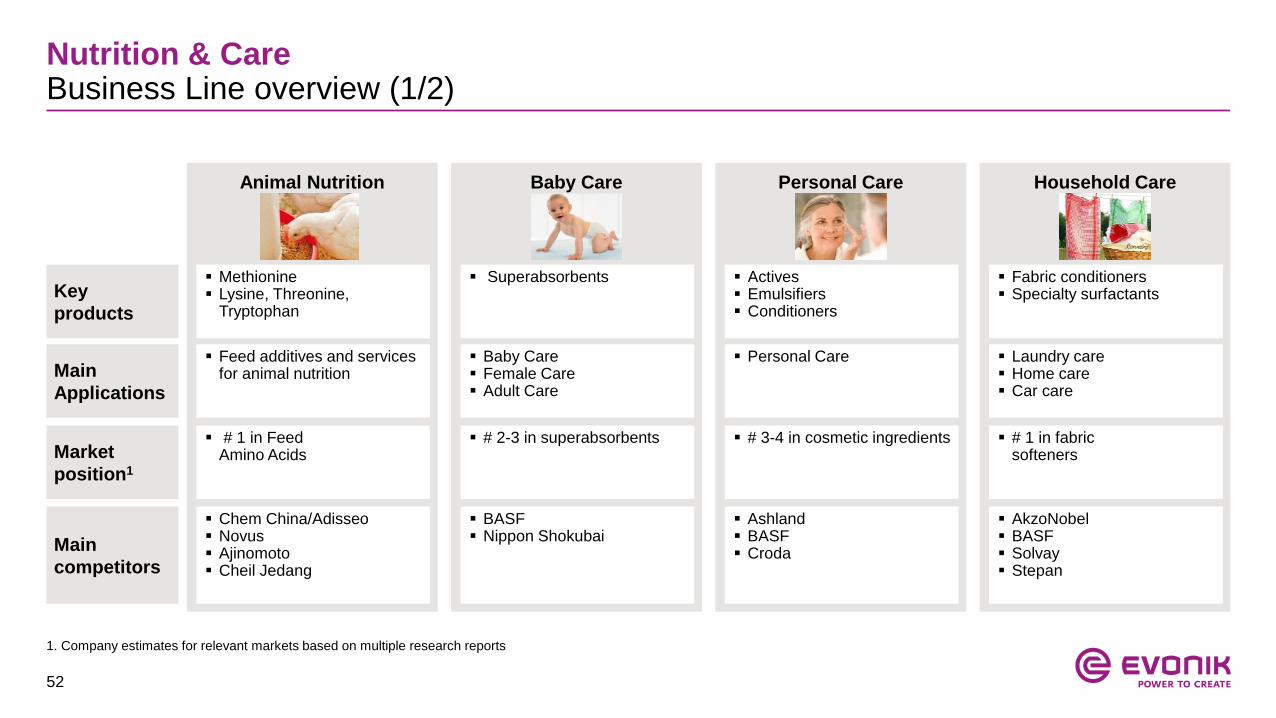
Animal Nutrition Baby Care Personal Care Household Care
Methionine Lysine, Threonine,
Tryptophan
Personal Care Laundry care Home care Car care
Baby Care Female Care Adult Care
Feed additives and services for animal nutrition
Fabric conditioners Specialty surfactants
Superabsorbents
# 3-4 in cosmetic ingredients # 1 in fabric softeners
# 2-3 in superabsorbents # 1 in Feed Amino Acids
Ashland BASF Croda
AkzoNobel BASF Solvay Stepan
BASF Nippon Shokubai
Chem China/Adisseo Novus Ajinomoto Cheil Jedang
Key
products
Main
Applications
Market
position1
Main
competitors
1. Company estimates for relevant markets based on multiple research reports
Nutrition & CareBusiness Line overview (1/2)
Actives Emulsifiers Conditioners
53
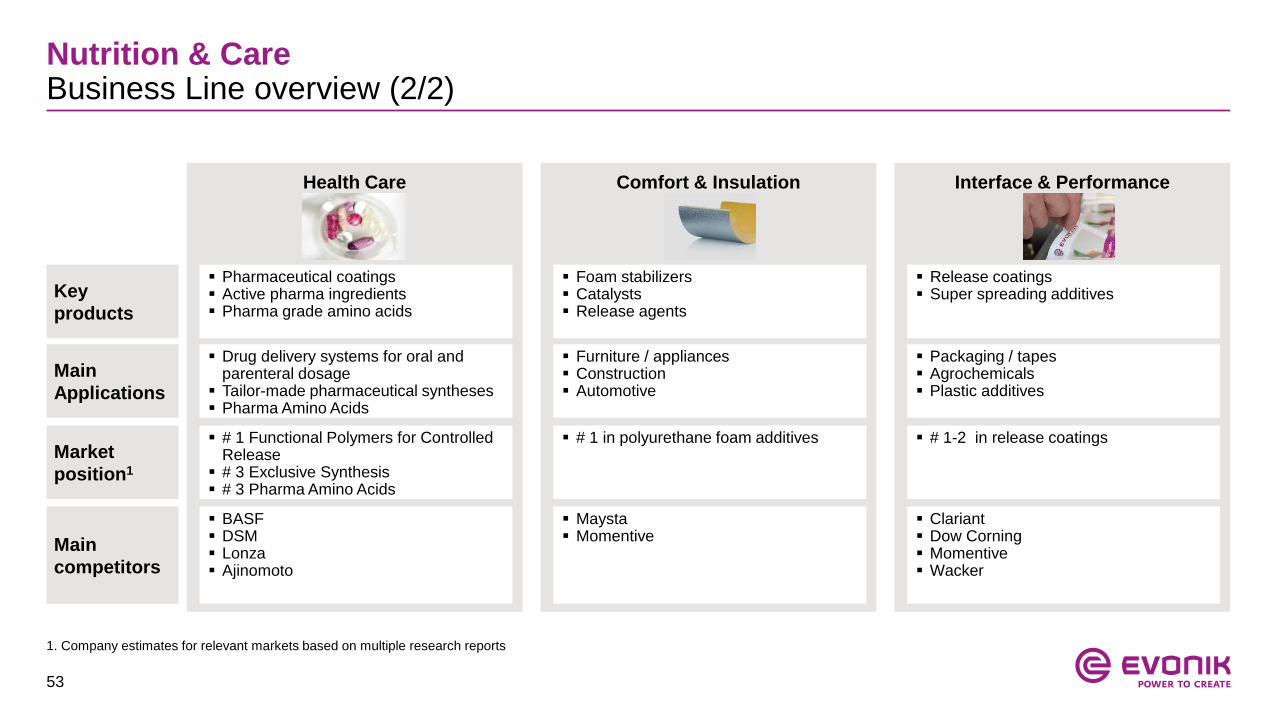
1. Company estimates for relevant markets based on multiple research reports
Nutrition & CareBusiness Line overview (2/2)
Key
products
Main
Applications
Market
position1
Main
competitors
Health Care Comfort & Insulation Interface & Performance
Pharmaceutical coatings Active pharma ingredients Pharma grade amino acids
Packaging / tapes Agrochemicals Plastic additives
Furniture / appliances Construction Automotive
Drug delivery systems for oral and parenteral dosage
Tailor-made pharmaceutical syntheses Pharma Amino Acids
Foam stabilizers Catalysts Release agents
# 1-2 in release coatings # 1 in polyurethane foam additives # 1 Functional Polymers for Controlled Release
# 3 Exclusive Synthesis # 3 Pharma Amino Acids
Clariant Dow Corning Momentive Wacker
Maysta Momentive
BASF DSM Lonza Ajinomoto
Release coatings Super spreading additives
54
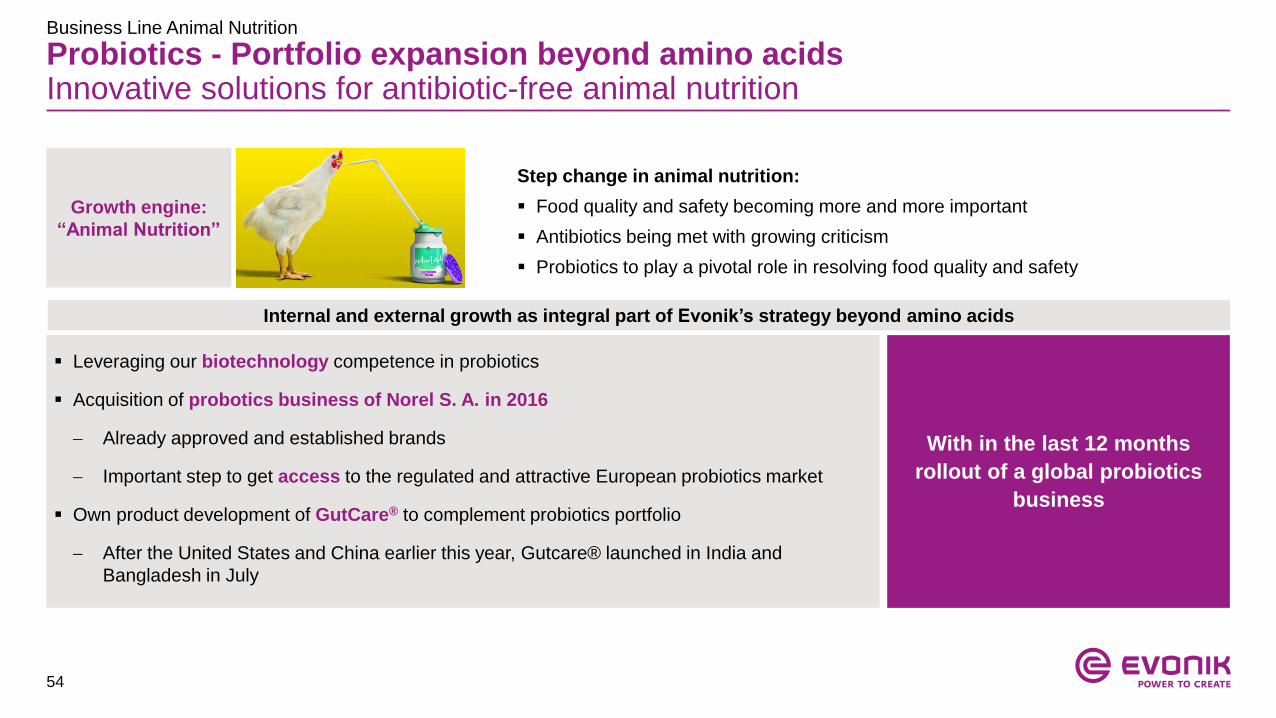
Probiotics - Portfolio expansion beyond amino acids Innovative solutions for antibiotic-free animal nutrition
Growth engine:
“Animal Nutrition”
Internal and external growth as integral part of Evonik’s strategy beyond amino acids
Step change in animal nutrition:
Food quality and safety becoming more and more important
Antibiotics being met with growing criticism
Probiotics to play a pivotal role in resolving food quality and safety
Leveraging our biotechnology competence in probiotics
Acquisition of probotics business of Norel S. A. in 2016
Already approved and established brands
Important step to get access to the regulated and attractive European probiotics market
Own product development of GutCare® to complement probiotics portfolio
After the United States and China earlier this year, Gutcare® launched in India and
Bangladesh in July
With in the last 12 months
rollout of a global probiotics
business
Business Line Animal Nutrition
55
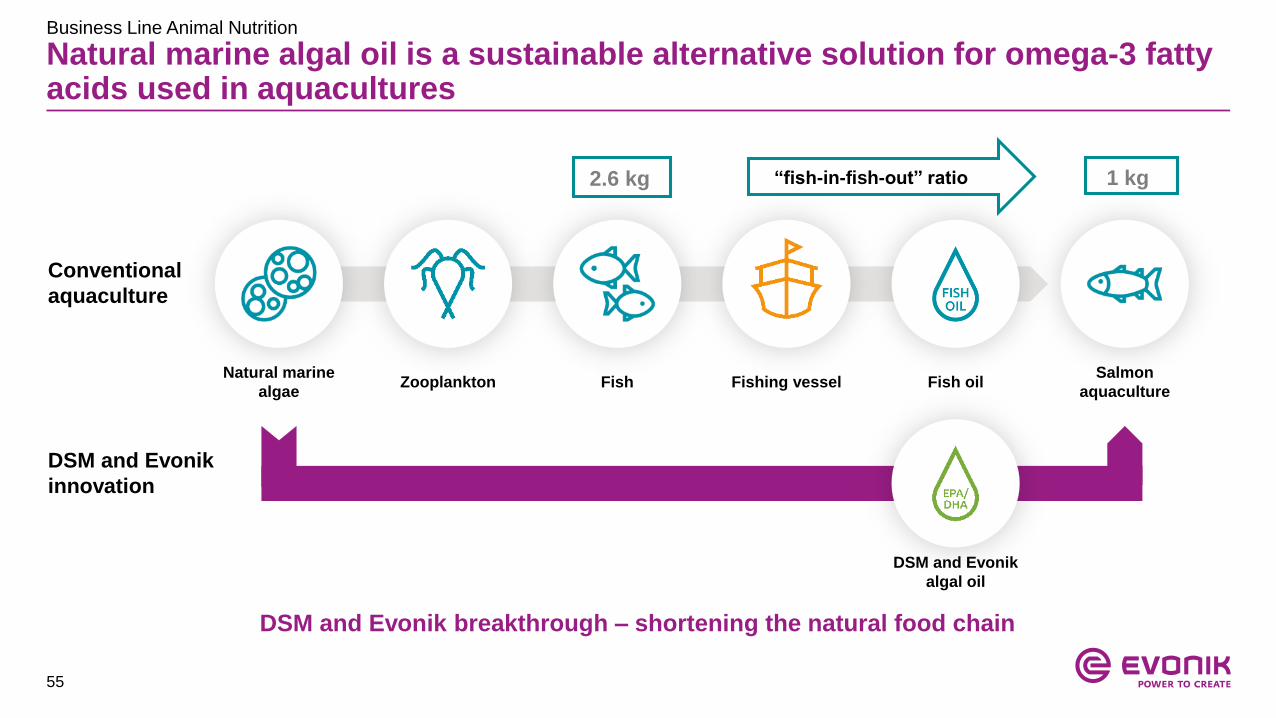
Natural marine algal oil is a sustainable alternative solution for omega-3 fatty acids used in aquacultures
Natural marine
algaeZooplankton Fish Fishing vessel Fish oil
Salmon
aquaculture
DSM and Evonik breakthrough – shortening the natural food chain
DSM and Evonik
algal oil
Conventional
aquaculture
“fish-in-fish-out” ratio2.6 kg 1 kg
DSM and Evonik
innovation
Business Line Animal Nutrition
56
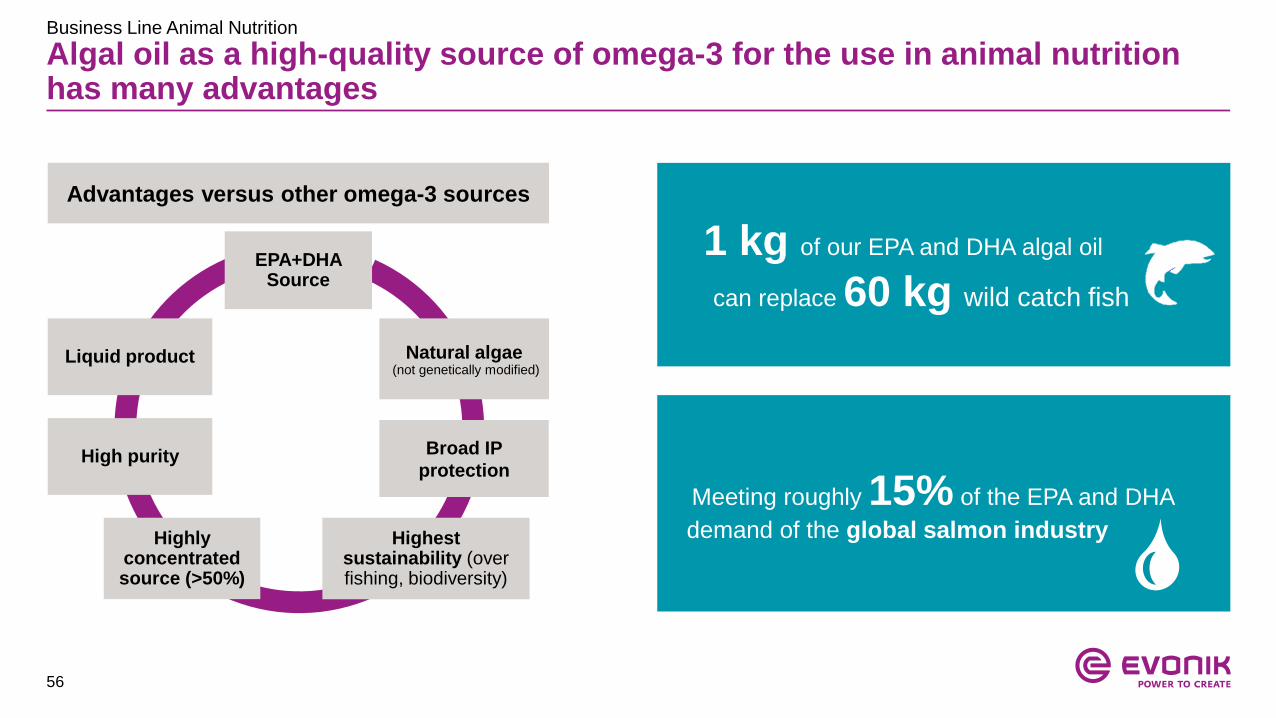
Algal oil as a high-quality source of omega-3 for the use in animal nutrition has many advantages
3
Advantages versus other omega-3 sources
EPA+DHA Source
Natural algae(not genetically modified)
Highest sustainability (over fishing, biodiversity)
Highly concentrated source (>50%)
Liquid product
Broad IP
protectionHigh purity
1 kg of our EPA and DHA algal oil
can replace 60 kg wild catch fish
Meeting roughly 15% of the EPA and DHA
demand of the global salmon industry
Business Line Animal Nutrition
57
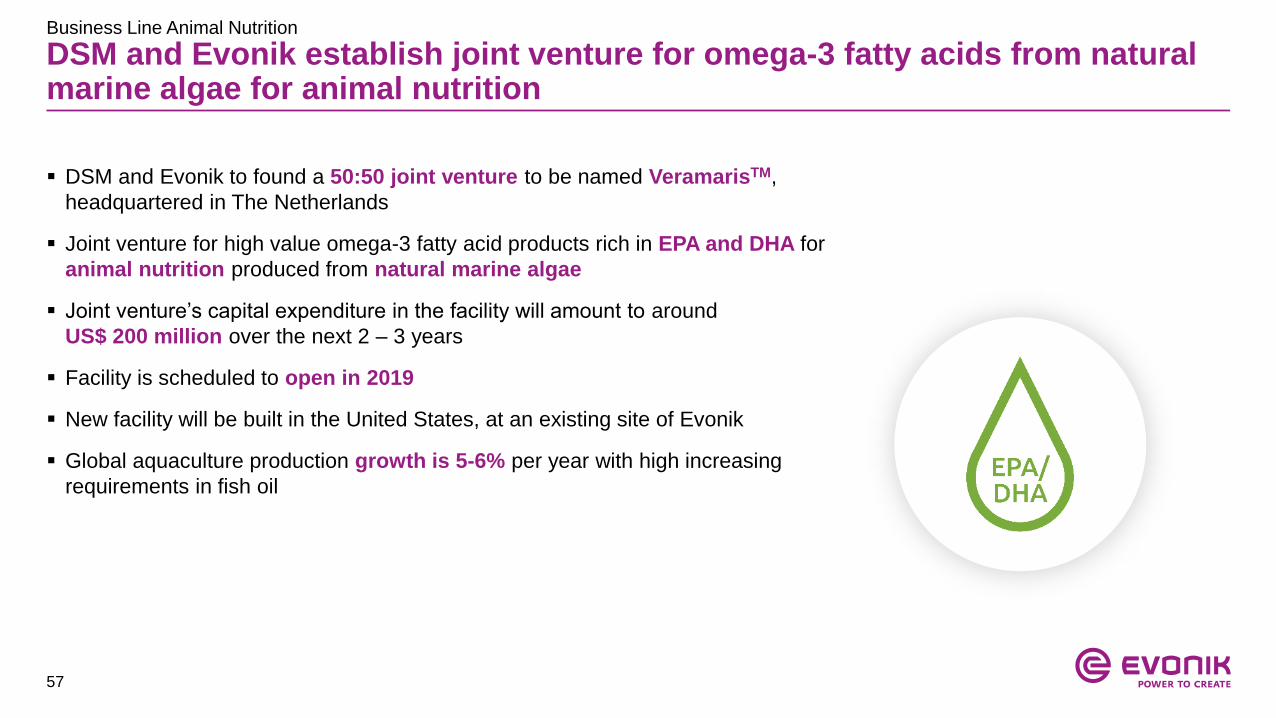
DSM and Evonik establish joint venture for omega-3 fatty acids from natural marine algae for animal nutrition
DSM and Evonik to found a 50:50 joint venture to be named VeramarisTM,
headquartered in The Netherlands
Joint venture for high value omega-3 fatty acid products rich in EPA and DHA for
animal nutrition produced from natural marine algae
Joint venture’s capital expenditure in the facility will amount to around
US$ 200 million over the next 2 – 3 years
Facility is scheduled to open in 2019
New facility will be built in the United States, at an existing site of Evonik
Global aquaculture production growth is 5-6% per year with high increasing
requirements in fish oil
Business Line Animal Nutrition
58
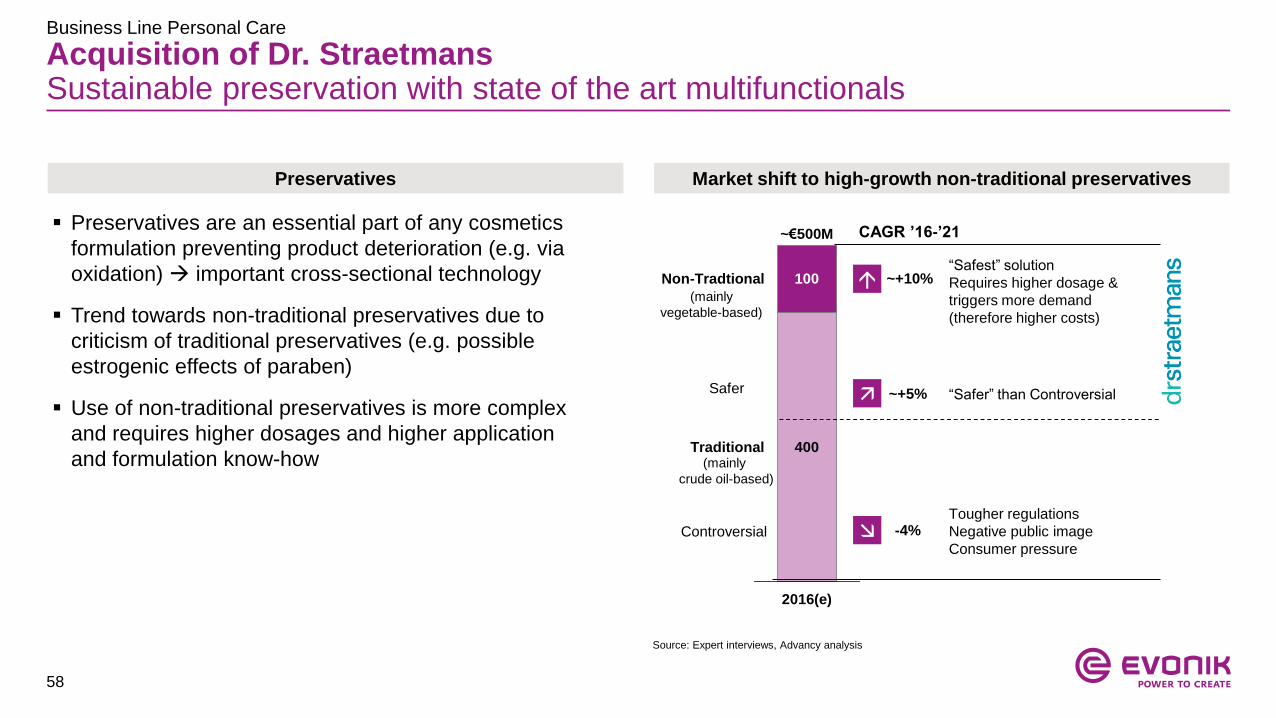
Acquisition of Dr. StraetmansSustainable preservation with state of the art multifunctionals
Source: Expert interviews, Advancy analysis
2016(e)
~€500M
Traditional
100Non-Tradtional
400
CAGR ’16-’21
~+10%“Safest” solution
Requires higher dosage &
triggers more demand
(therefore higher costs)
Market shift to high-growth non-traditional preservatives
-4%Tougher regulations
Negative public image
Consumer pressure
Preservatives
~+5% “Safer” than Controversial
Controversial
Safer
Preservatives are an essential part of any cosmetics
formulation preventing product deterioration (e.g. via
oxidation) important cross-sectional technology
Trend towards non-traditional preservatives due to
criticism of traditional preservatives (e.g. possible
estrogenic effects of paraben)
Use of non-traditional preservatives is more complex
and requires higher dosages and higher application
and formulation know-how
(mainly
vegetable-based)
(mainly
crude oil-based)
Business Line Personal Care
59
Acquisition of Dr. StraetmansHelping Evonik Personal Care to become a wide technology player
Specialties Fragrances
Functional
Ingredients
Active
Ingredients
Base Products
Evonik Personal Care
(Secondary
Surfactants)
Preser-
vatives
Chassis
Emulgators
Emollients
Perf. Additives
Conditioners
Preservatives
1 2
21
Tip-in Ingredients
Ceramide
Peptide
Strategic rationale
Combination of preservatives know how of Dr. Straetmans with emulsifier know how of Evonik
Expanded formulation skills in one hand, thus enhanced capability to offer formulation packages
Reduced development time and costs for customers
Natural
products
Typical
Formulation
components
Business Line Personal Care
60
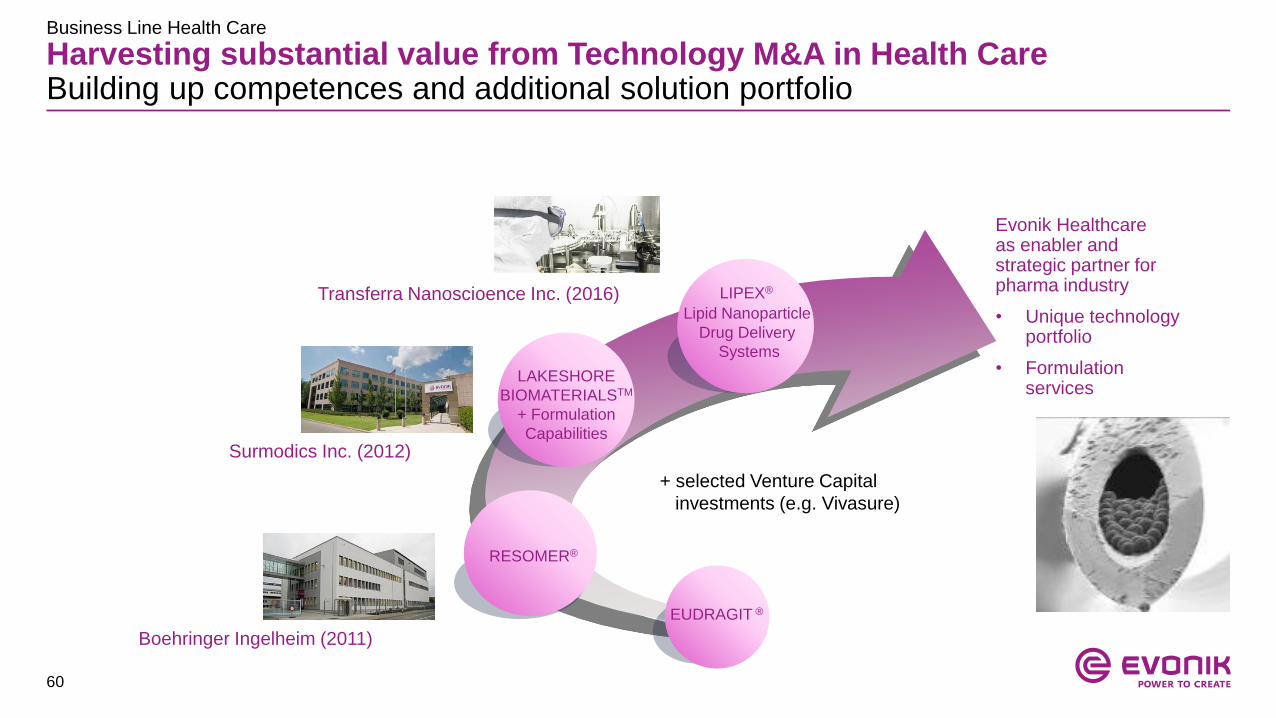
Harvesting substantial value from Technology M&A in Health CareBuilding up competences and additional solution portfolio
EUDRAGIT ®
Evonik Healthcareas enabler and strategic partner forpharma industry
• Unique technology portfolio
• Formulation services
RESOMER®
Boehringer Ingelheim (2011)
Surmodics Inc. (2012)
LAKESHORE
BIOMATERIALSTM
+ Formulation
Capabilities
Transferra Nanoscioence Inc. (2016) LIPEX®
Lipid Nanoparticle
Drug Delivery
Systems
+ selected Venture Capital
investments (e.g. Vivasure)
Business Line Health Care
61
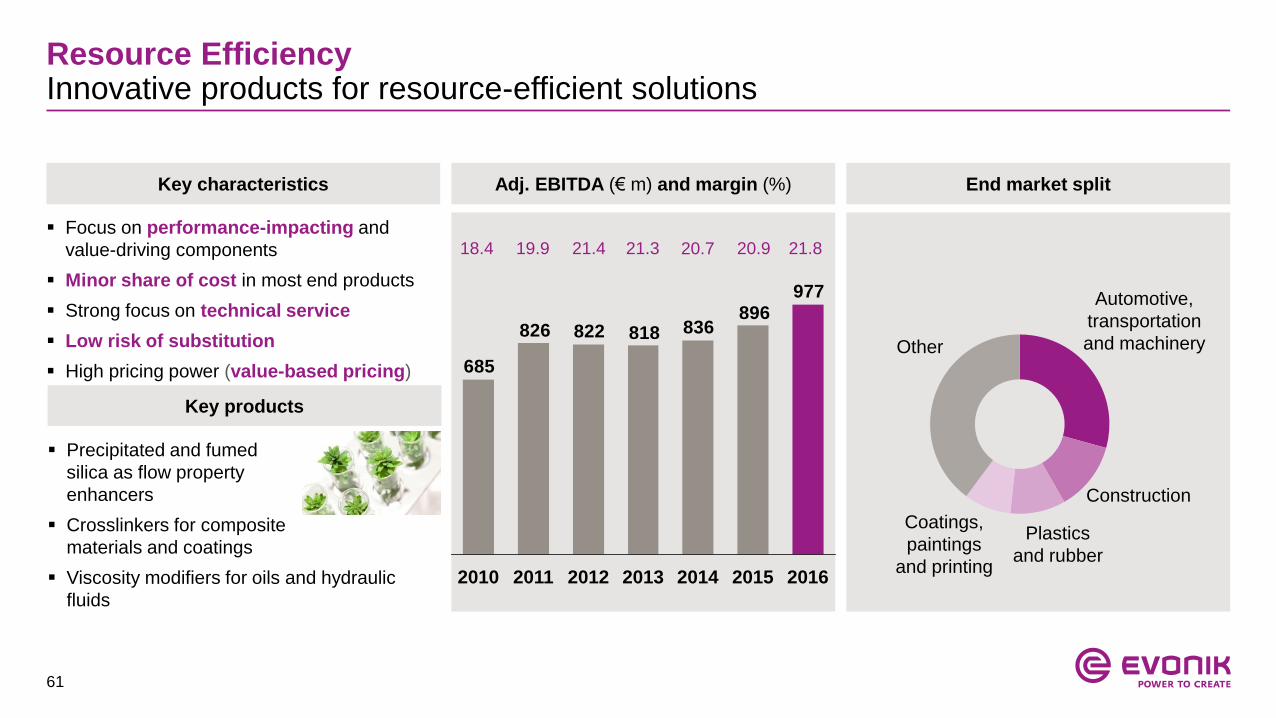
977
896836818822826
685
2014 20152013 201620122010 2011
Resource EfficiencyInnovative products for resource-efficient solutions
Key characteristics
Key products
Adj. EBITDA (€ m) and margin (%) End market split
Other
Focus on performance-impacting and
value-driving components
Minor share of cost in most end products
Strong focus on technical service
Low risk of substitution
High pricing power (value-based pricing)
Precipitated and fumed
silica as flow property
enhancers
Crosslinkers for composite
materials and coatings
Viscosity modifiers for oils and hydraulic
fluids
18.4 19.9 21.4 21.3 20.7 20.9
Automotive,
transportation
and machinery
Construction
Coatings,
paintings
and printing
21.8
Plastics
and rubber
62
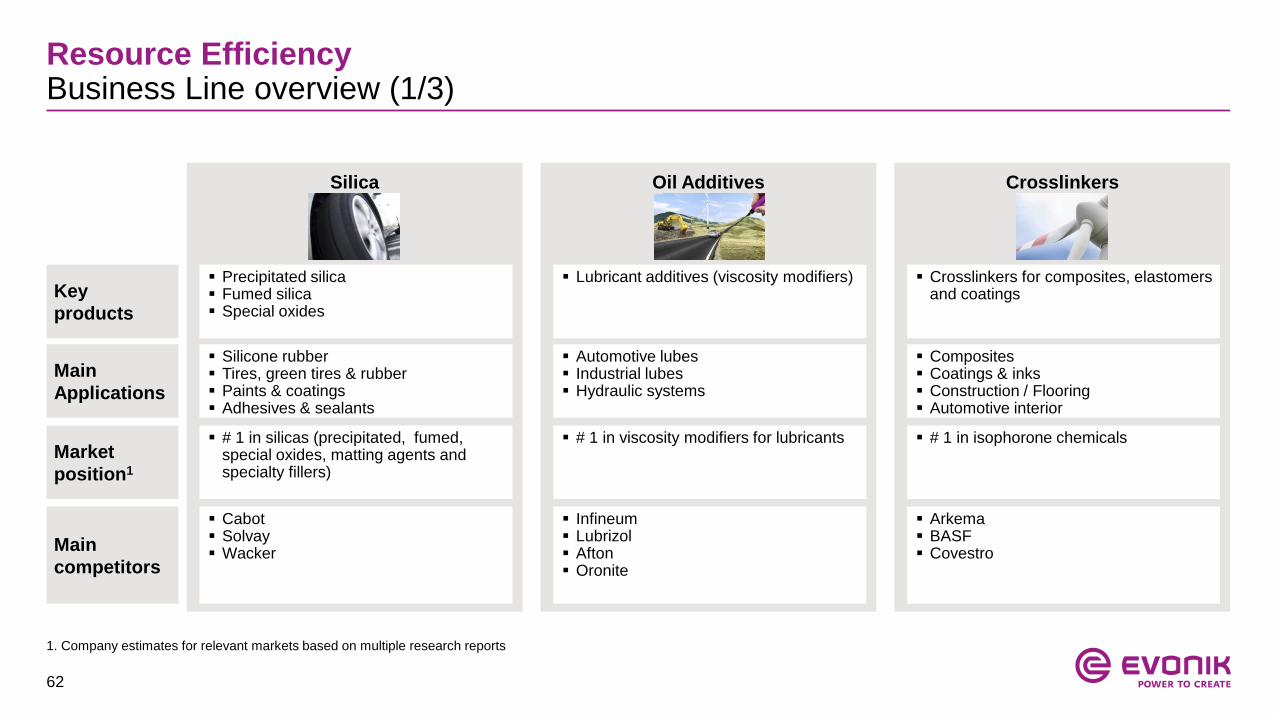
1. Company estimates for relevant markets based on multiple research reports
Resource EfficiencyBusiness Line overview (1/3)
Key
products
Main
Applications
Market
position1
Main
competitors
Silica Oil Additives Crosslinkers
Precipitated silica Fumed silica Special oxides
Composites Coatings & inks Construction / Flooring Automotive interior
Automotive lubes Industrial lubes Hydraulic systems
Silicone rubber Tires, green tires & rubber Paints & coatings Adhesives & sealants
Lubricant additives (viscosity modifiers)
# 1 in isophorone chemicals # 1 in viscosity modifiers for lubricants # 1 in silicas (precipitated, fumed, special oxides, matting agents and specialty fillers)
Arkema BASF Covestro
Infineum Lubrizol Afton Oronite
Cabot Solvay Wacker
Crosslinkers for composites, elastomers and coatings
63
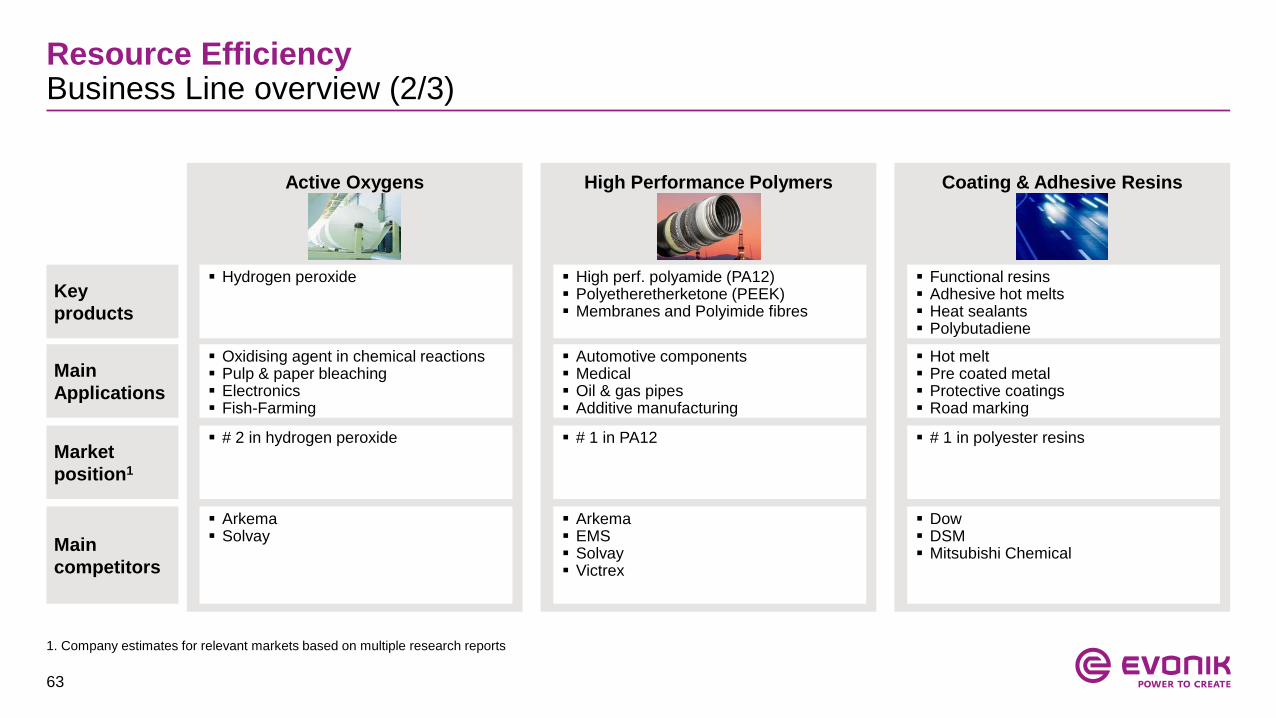
1. Company estimates for relevant markets based on multiple research reports
Resource EfficiencyBusiness Line overview (2/3)
Key
products
Main
Applications
Market
position1
Main
competitors
Active Oxygens High Performance Polymers Coating & Adhesive Resins
Hydrogen peroxide
Hot melt Pre coated metal Protective coatings Road marking
Automotive components Medical Oil & gas pipes Additive manufacturing
Oxidising agent in chemical reactions Pulp & paper bleaching Electronics Fish-Farming
High perf. polyamide (PA12) Polyetheretherketone (PEEK) Membranes and Polyimide fibres
# 1 in polyester resins # 1 in PA12 # 2 in hydrogen peroxide
Dow DSM Mitsubishi Chemical
Arkema EMS Solvay Victrex
Arkema Solvay
Functional resins Adhesive hot melts Heat sealants Polybutadiene
64
1. Company estimates for relevant markets based on multiple research reports
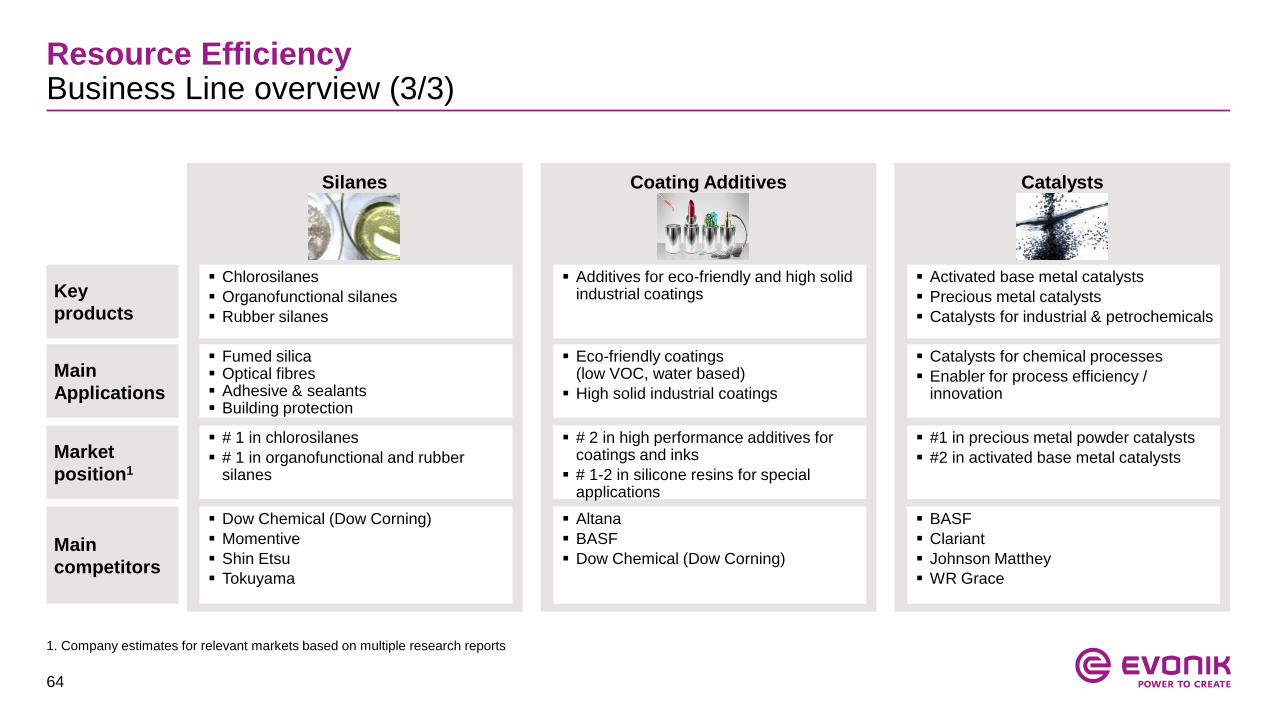
Resource EfficiencyBusiness Line overview (3/3)
Key
products
Main
Applications
Market
position1
Main
competitors
Silanes Coating Additives Catalysts
Chlorosilanes
Organofunctional silanes
Rubber silanes
Catalysts for chemical processes
Enabler for process efficiency / innovation
Eco-friendly coatings (low VOC, water based)
High solid industrial coatings
Fumed silica Optical fibres Adhesive & sealants Building protection
Additives for eco-friendly and high solid industrial coatings
#1 in precious metal powder catalysts
#2 in activated base metal catalysts
# 2 in high performance additives for coatings and inks
# 1-2 in silicone resins for special applications
# 1 in chlorosilanes
# 1 in organofunctional and rubber silanes
BASF
Clariant
Johnson Matthey
WR Grace
Altana
BASF
Dow Chemical (Dow Corning)
Dow Chemical (Dow Corning)
Momentive
Shin Etsu
Tokuyama
Activated base metal catalysts
Precious metal catalysts
Catalysts for industrial & petrochemicals
65
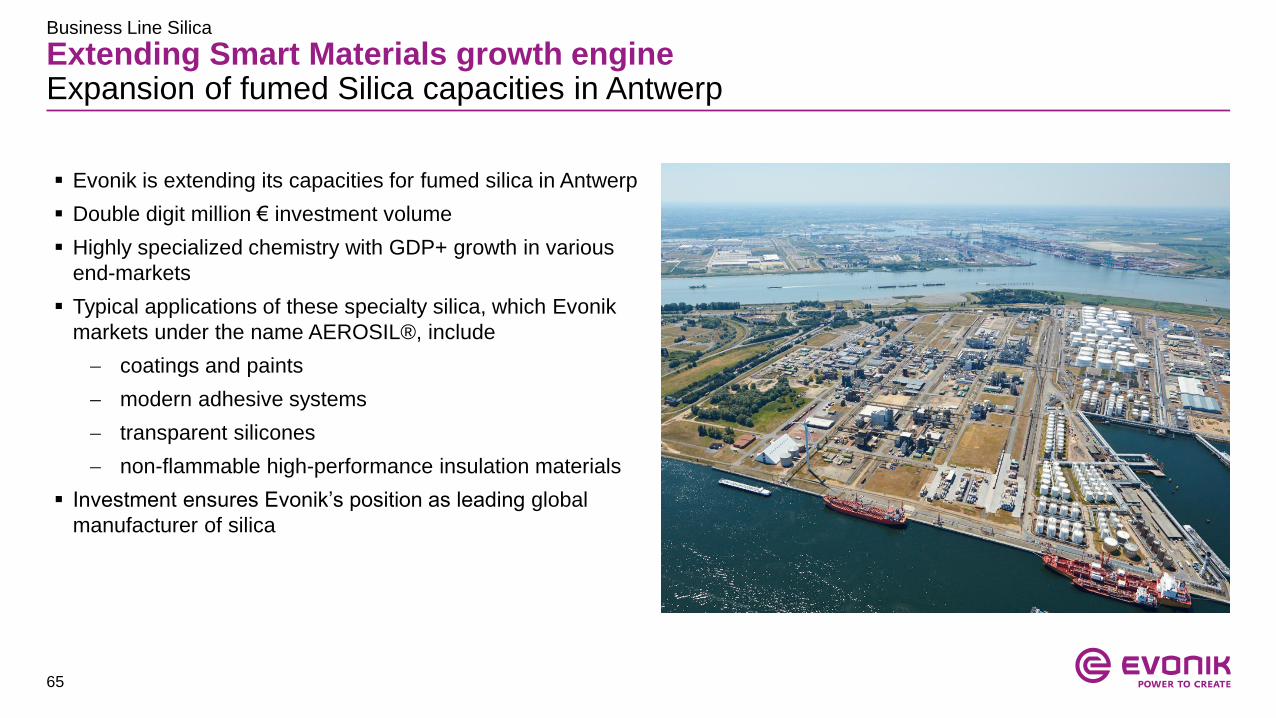
Extending Smart Materials growth engine Expansion of fumed Silica capacities in Antwerp
Evonik is extending its capacities for fumed silica in Antwerp
Double digit million € investment volume
Highly specialized chemistry with GDP+ growth in various
end-markets
Typical applications of these specialty silica, which Evonik
markets under the name AEROSIL®, include
coatings and paints
modern adhesive systems
transparent silicones
non-flammable high-performance insulation materials
Investment ensures Evonik’s position as leading global
manufacturer of silica
Business Line Silica
66
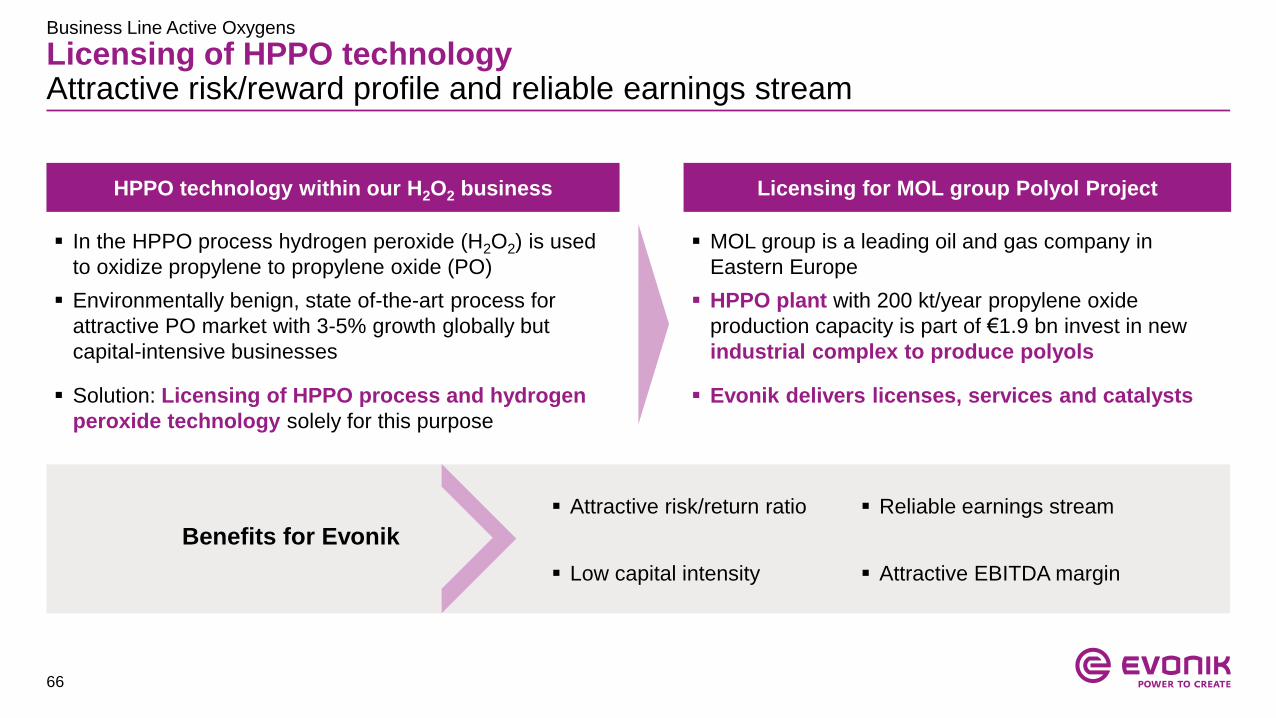
Licensing of HPPO technologyAttractive risk/reward profile and reliable earnings stream
HPPO technology within our H2O2 business Licensing for MOL group Polyol Project
In the HPPO process hydrogen peroxide (H2O2) is used
to oxidize propylene to propylene oxide (PO)
Environmentally benign, state of-the-art process for
attractive PO market with 3-5% growth globally but
capital-intensive businesses
MOL group is a leading oil and gas company in
Eastern Europe
HPPO plant with 200 kt/year propylene oxide
production capacity is part of €1.9 bn invest in new
industrial complex to produce polyols
Attractive risk/return ratio
Low capital intensity
Solution: Licensing of HPPO process and hydrogen
peroxide technology solely for this purpose
Evonik delivers licenses, services and catalysts
Benefits for Evonik
Reliable earnings stream
Attractive EBITDA margin
Business Line Active Oxygens
67
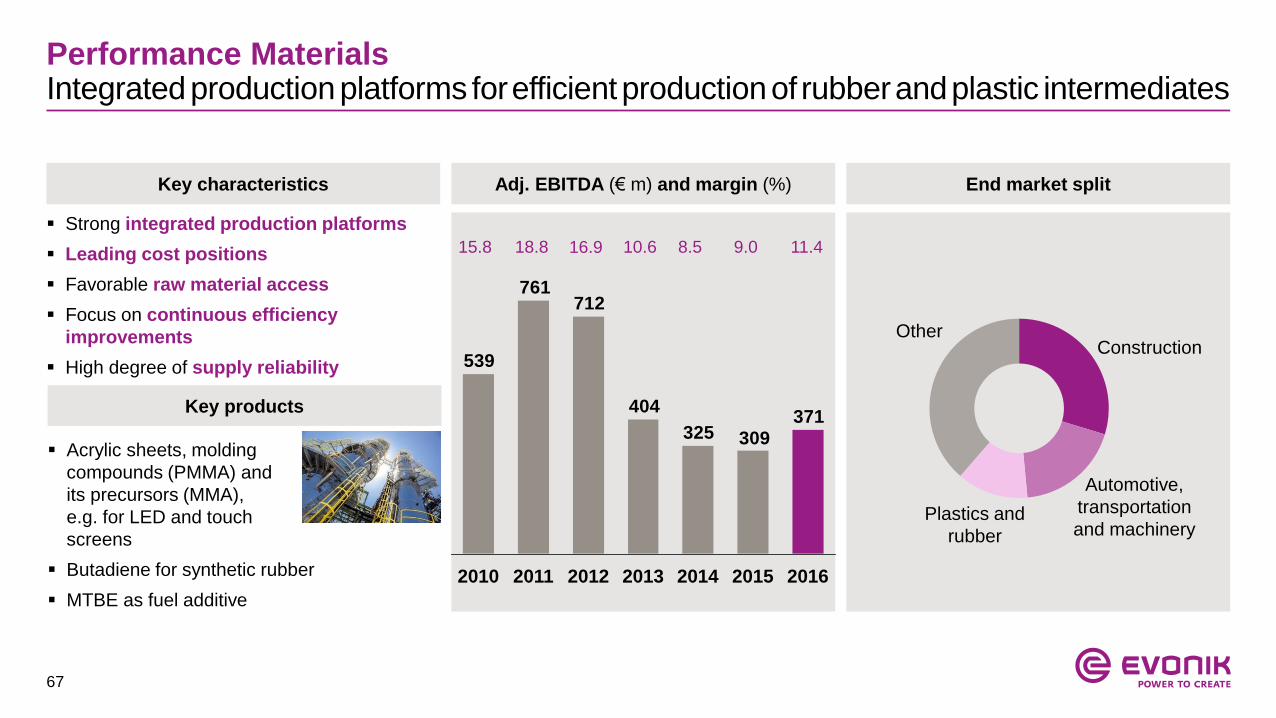
Performance Materials Integrated production platforms forefficientproductionof rubberandplastic intermediates
Key characteristics
Key products
Adj. EBITDA (€ m) and margin (%) End market split
Other
Strong integrated production platforms
Leading cost positions
Favorable raw material access
Focus on continuous efficiency
improvements
High degree of supply reliability
Acrylic sheets, molding
compounds (PMMA) and
its precursors (MMA),
e.g. for LED and touch
screens
Butadiene for synthetic rubber
MTBE as fuel additive
Automotive,
transportation
and machinery
Construction
Plastics and
rubber
371
309325
404
712761
539
20112010 20162015201420132012
15.8 18.8 16.9 10.6 8.5 9.0 11.4
68
1. Company estimates for relevant markets based on multiple research reports
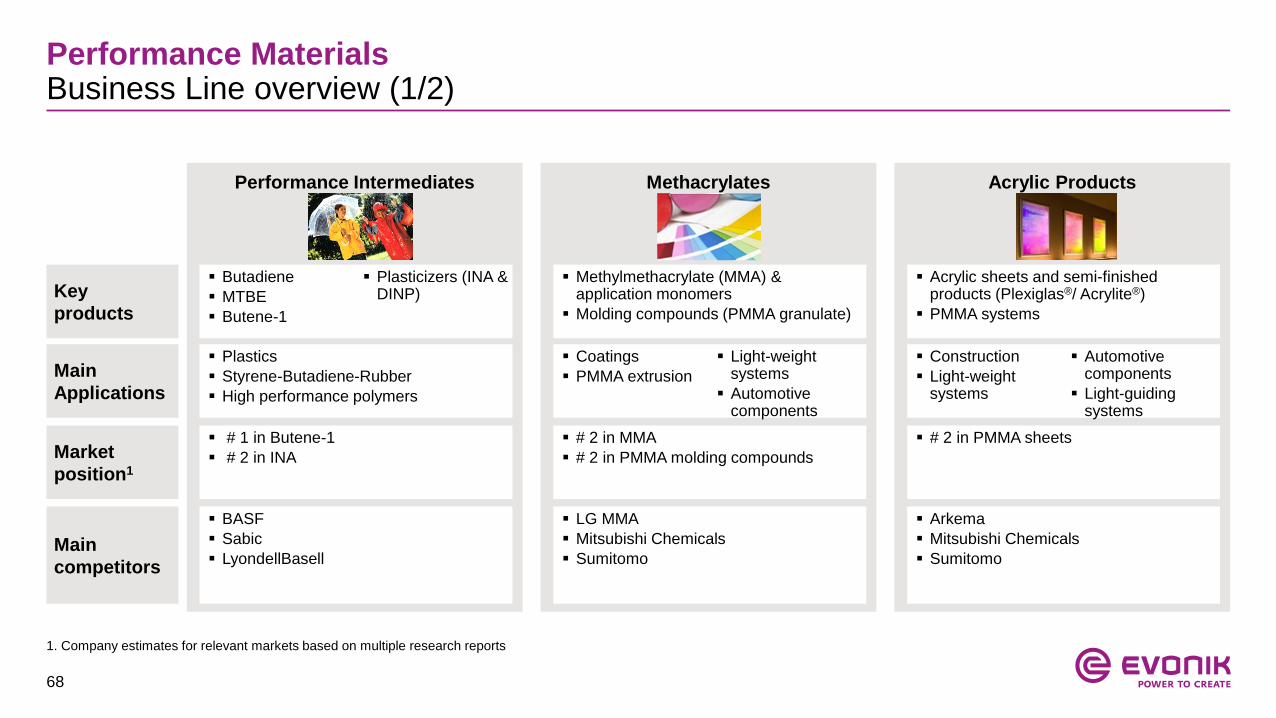
Performance Materials Business Line overview (1/2)
Key
products
Main
Applications
Market
position1
Main
competitors
Performance Intermediates Methacrylates Acrylic Products
Butadiene
MTBE
Butene-1
Plasticizers (INA & DINP)
Construction
Light-weight systems
Automotive components
Light-guiding systems
Coatings
PMMA extrusion
Light-weight systems
Automotive components
Plastics
Styrene-Butadiene-Rubber
High performance polymers
Methylmethacrylate (MMA) & application monomers
Molding compounds (PMMA granulate)
# 2 in PMMA sheets # 2 in MMA
# 2 in PMMA molding compounds
# 1 in Butene-1
# 2 in INA
Arkema
Mitsubishi Chemicals
Sumitomo
LG MMA
Mitsubishi Chemicals
Sumitomo
BASF
Sabic
LyondellBasell
Acrylic sheets and semi-finished products (Plexiglas®/ Acrylite®)
PMMA systems
69
1. Company estimates for relevant markets based on multiple research reports
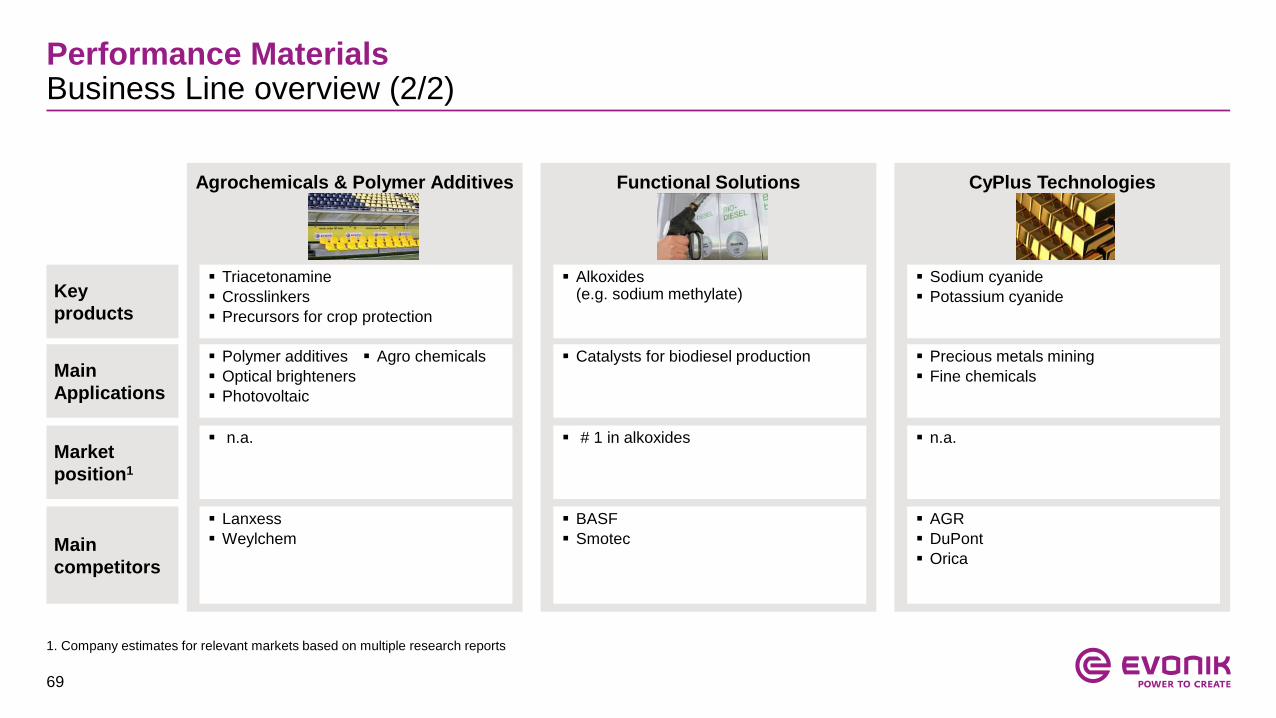
Performance Materials Business Line overview (2/2)
Key
products
Main
Applications
Market
position1
Main
competitors
Agrochemicals & Polymer Additives Functional Solutions CyPlus Technologies
Triacetonamine
Crosslinkers
Precursors for crop protection
Precious metals mining
Fine chemicals
Catalysts for biodiesel production Polymer additives
Optical brighteners
Photovoltaic
Agro chemicals
Alkoxides(e.g. sodium methylate)
n.a. # 1 in alkoxides n.a.
AGR
DuPont
Orica
BASF
Smotec
Lanxess
Weylchem
Sodium cyanide
Potassium cyanide
70
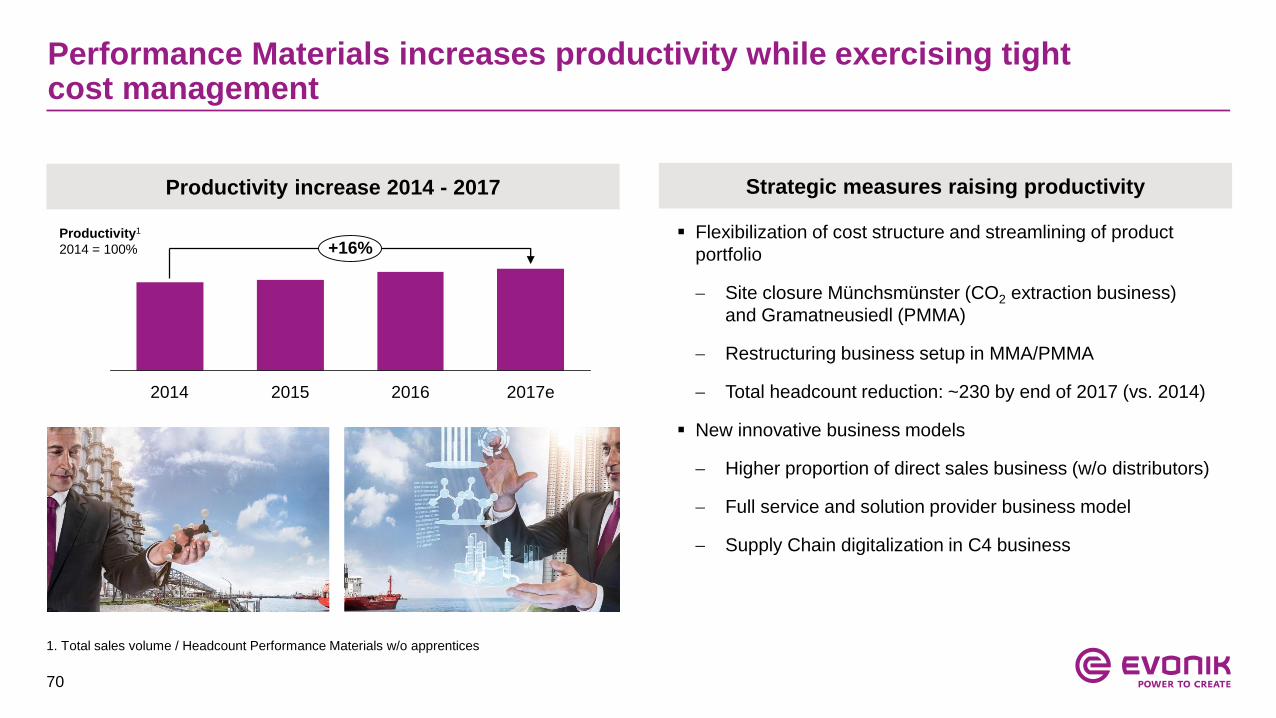
Performance Materials increases productivity while exercising tight cost management
Productivity increase 2014 - 2017
Flexibilization of cost structure and streamlining of product
portfolio
Site closure Münchsmünster (CO2 extraction business)
and Gramatneusiedl (PMMA)
Restructuring business setup in MMA/PMMA
Total headcount reduction: ~230 by end of 2017 (vs. 2014)
New innovative business models
Higher proportion of direct sales business (w/o distributors)
Full service and solution provider business model
Supply Chain digitalization in C4 business
+16%
2017e201620152014
Productivity1
2014 = 100%
Strategic measures raising productivity
1. Total sales volume / Headcount Performance Materials w/o apprentices
71
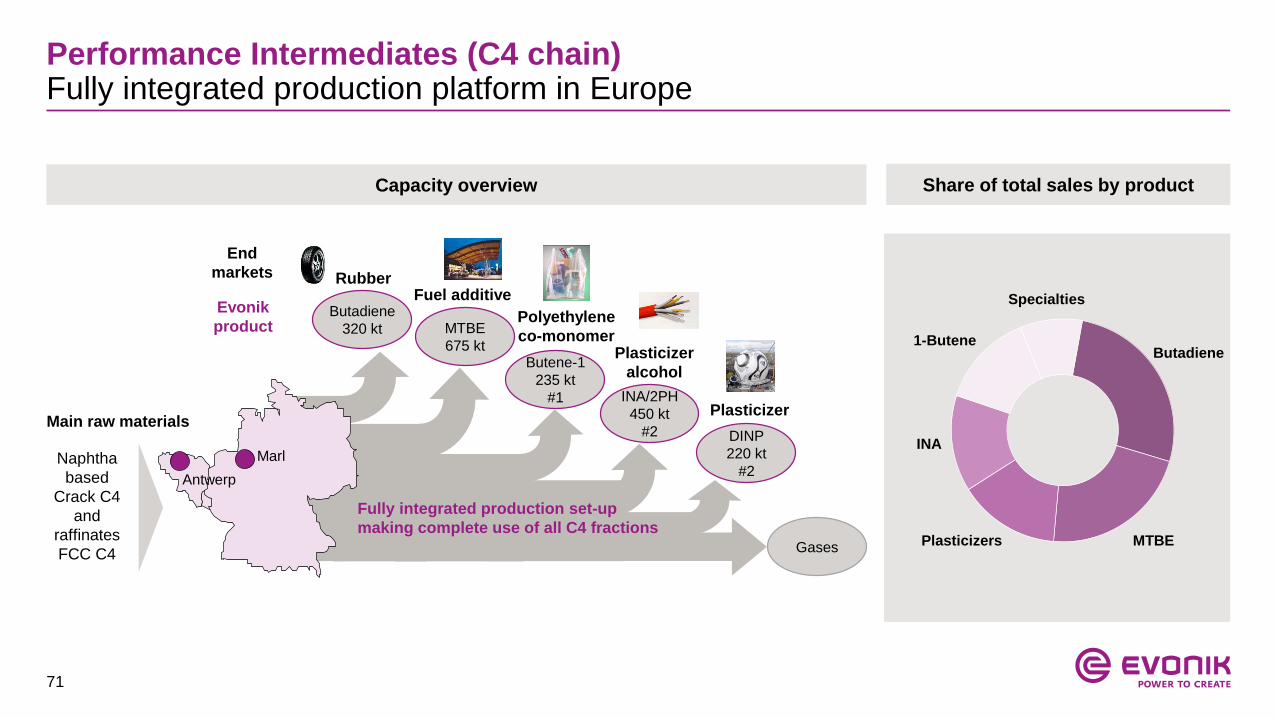
Performance Intermediates (C4 chain)Fully integrated production platform in Europe
Butadiene
320 kt
Butene-1
235 kt
#1 INA/2PH
450 kt
#2
Gases
MTBE
675 kt
DINP
220 kt
#2Antwerp
Marl
Rubber
Plasticizer
Plasticizer
alcohol
Polyethylene
co-monomer
Fuel additive
Fully integrated production set-up
making complete use of all C4 fractions
Main raw materials
Naphtha
based
Crack C4
and
raffinates
FCC C4
End
markets
Evonik
product
Capacity overview Share of total sales by product
Butadiene
MTBE
Specialties
1-Butene
INA
Plasticizers
72
Appendix
1. Strategy Update Details
2. Acquisition of Air Products specialty additives business
3. Acquisition of Huber Silica
4. Segment overview
5. Financials
6. Upcoming events
73
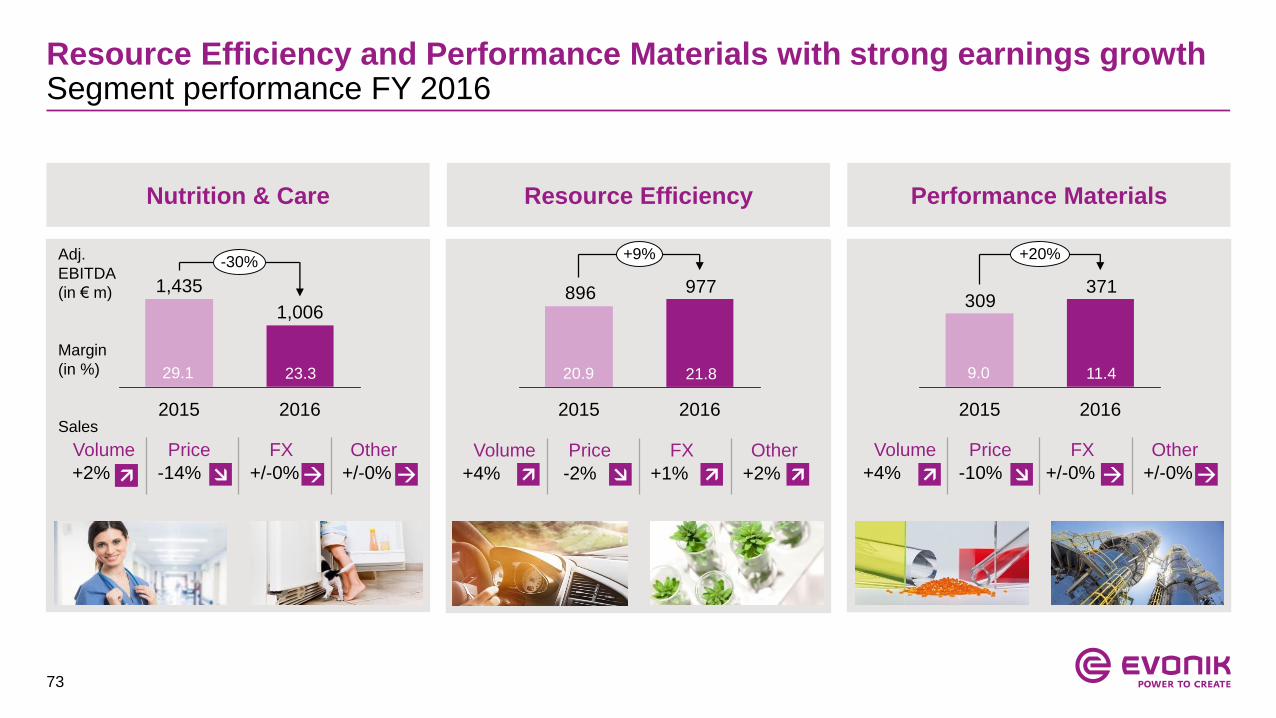
Resource Efficiency and Performance Materials with strong earnings growthSegment performance FY 2016
Volume Price FX Other
+2% -14% +/-0% +/-0%
Nutrition & Care Resource Efficiency Performance Materials
-30%
2016
1,006
2015
1,435
23.329.1
Adj.
EBITDA
(in € m)
Margin
(in %)
Sales
Volume Price FX Other
+4% -2% +1% +2%
977896
+9%
20162015
21.820.9
Volume Price FX Other
+4% -10% +/-0% +/-0%
371309
2015
+20%
2016
11.49.0
74
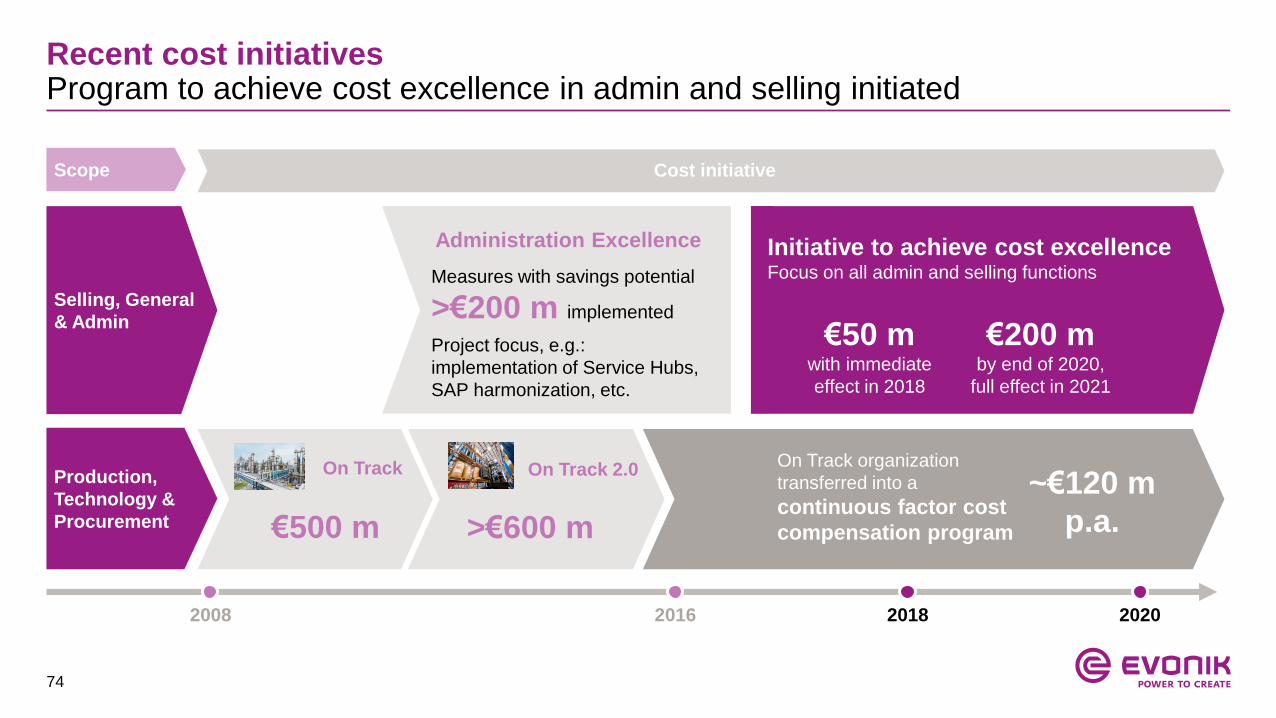
Recent cost initiatives Program to achieve cost excellence in admin and selling initiated
2008 2016 2018 2020
On Track
Administration Excellence
€500 m
Measures with savings potential
>€200 m implemented
Project focus, e.g.:
implementation of Service Hubs,
SAP harmonization, etc.
Selling, General
& Admin
Production,
Technology &
Procurement
Scope Cost initiative
>€600 m
On Track organization
transferred into a
continuous factor cost
compensation program
~€120 m
p.a.
€50 m with immediate
effect in 2018
€200 m by end of 2020,
full effect in 2021
On Track 2.0
Initiative to achieve cost excellence Focus on all admin and selling functions
75
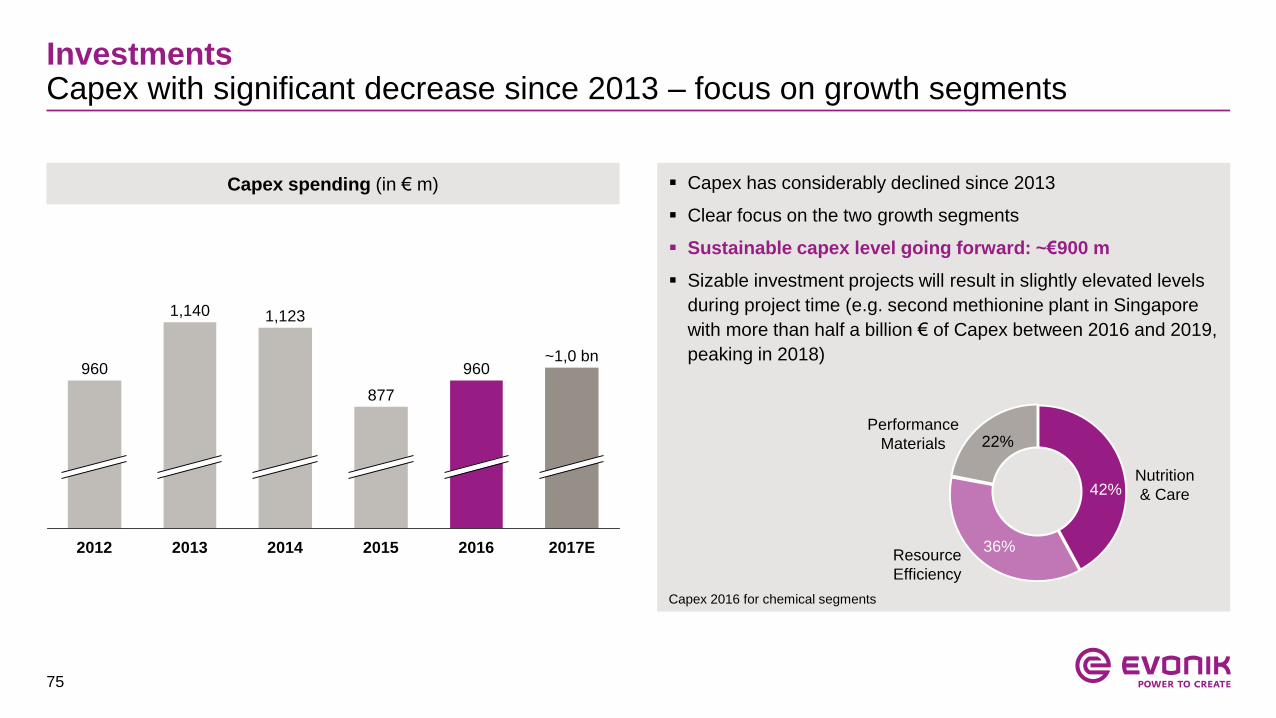
InvestmentsCapex with significant decrease since 2013 – focus on growth segments
Capex has considerably declined since 2013
Clear focus on the two growth segments
Sustainable capex level going forward: ~€900 m
Sizable investment projects will result in slightly elevated levels
during project time (e.g. second methionine plant in Singapore
with more than half a billion € of Capex between 2016 and 2019,
peaking in 2018)
2017E
~1,0 bn
2016
960
2015
877
2014
1,123
2013
1,140
2012
960
Capex spending (in € m)
Nutrition
& Care
Resource
Efficiency
Performance
Materials
42%
36%
22%
Capex 2016 for chemical segments
76
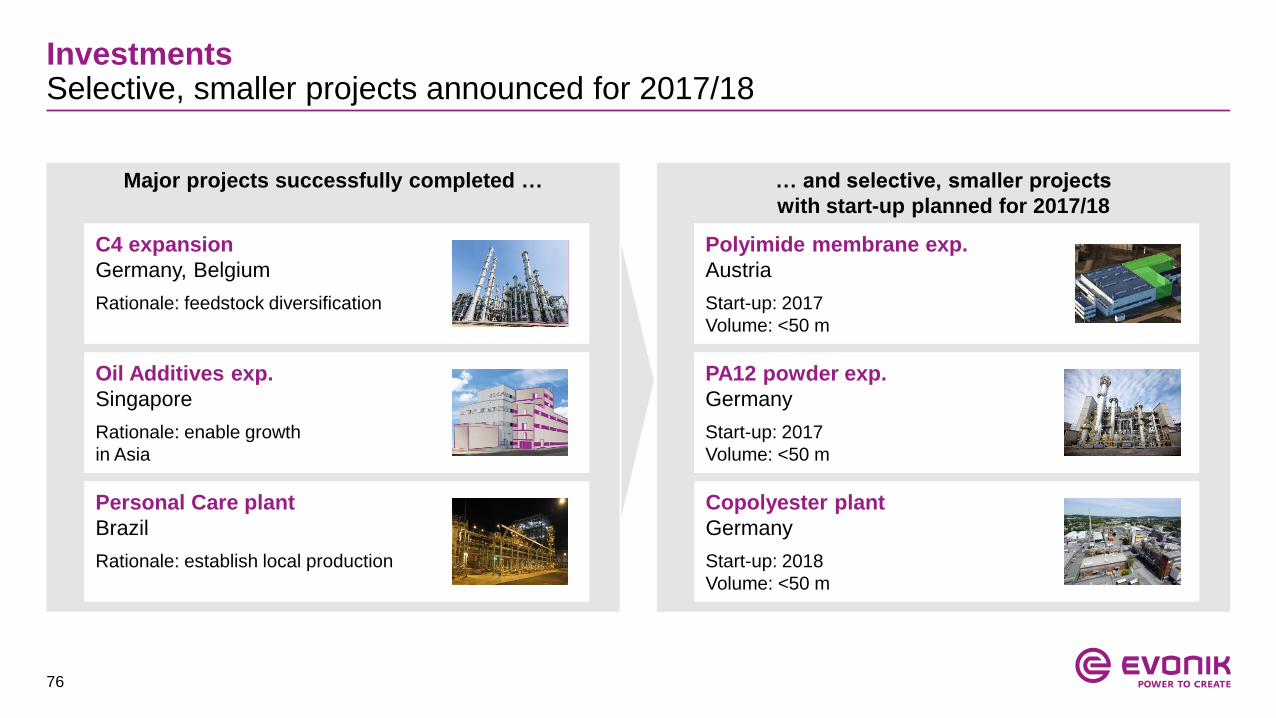
InvestmentsSelective, smaller projects announced for 2017/18
Major projects successfully completed … … and selective, smaller projects
with start-up planned for 2017/18
PA12 powder exp.
Germany
Start-up: 2017
Volume: <50 m
C4 expansion
Germany, Belgium
Rationale: feedstock diversification
Oil Additives exp.
Singapore
Rationale: enable growth
in Asia
Personal Care plant
Brazil
Rationale: establish local production
Polyimide membrane exp.
Austria
Start-up: 2017
Volume: <50 m
Copolyester plant
Germany
Start-up: 2018
Volume: <50 m
77
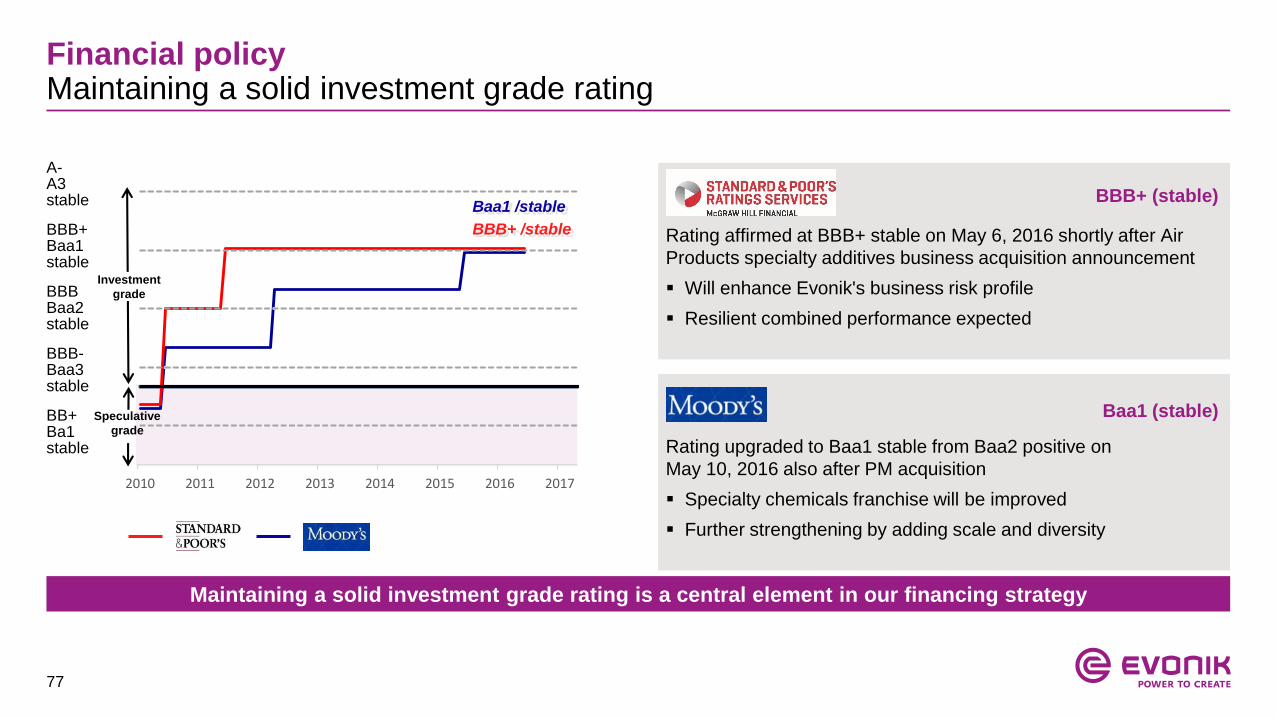
Financial policyMaintaining a solid investment grade rating
BBB+Baa1stable
BBBBaa2stable
BBB-Baa3stable
BB+Ba1stable
A-A3stable Baa1 /stable
BBB+ /stable
Speculative
grade
Investment
grade
Rating affirmed at BBB+ stable on May 6, 2016 shortly after Air
Products specialty additives business acquisition announcement
Will enhance Evonik's business risk profile
Resilient combined performance expected
BBB+ (stable)
Rating upgraded to Baa1 stable from Baa2 positive on
May 10, 2016 also after PM acquisition
Specialty chemicals franchise will be improved
Further strengthening by adding scale and diversity
Baa1 (stable)
Maintaining a solid investment grade rating is a central element in our financing strategy
2010 2011 2012 2013 2014 2015 2016 2017
78
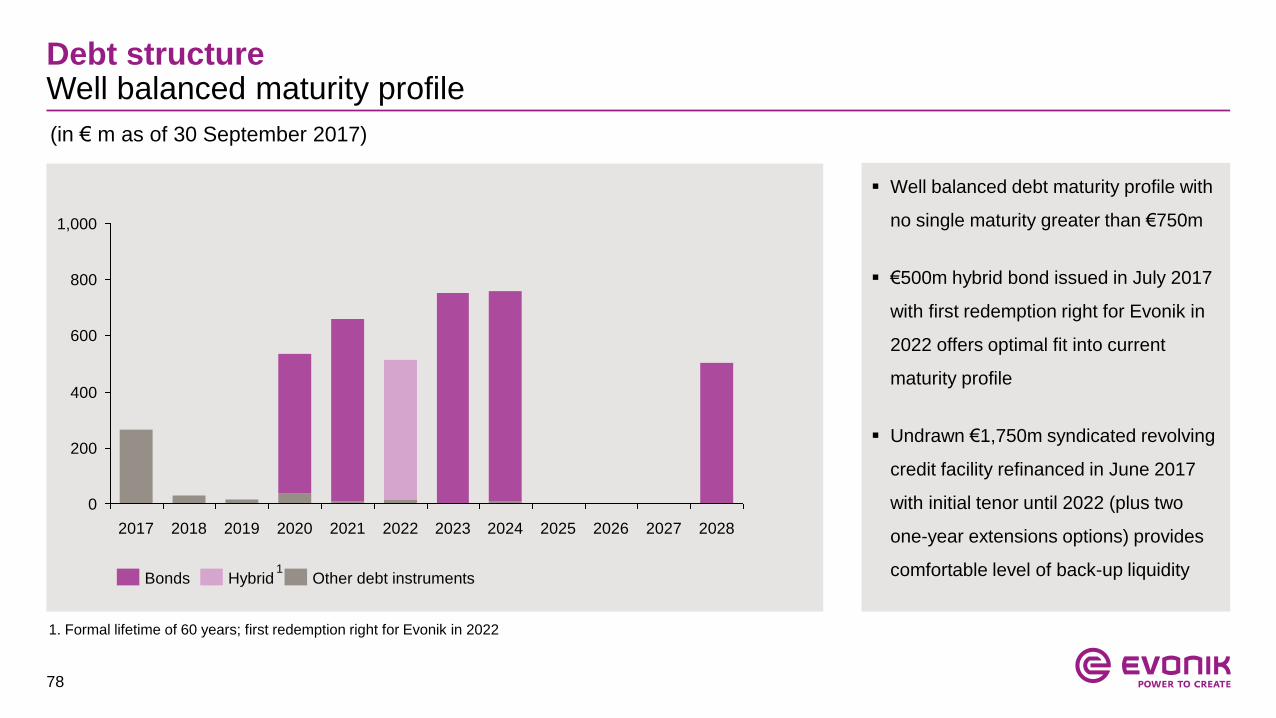
Debt structureWell balanced maturity profile
Well balanced debt maturity profile with
no single maturity greater than €750m
€500m hybrid bond issued in July 2017
with first redemption right for Evonik in
2022 offers optimal fit into current
maturity profile
Undrawn €1,750m syndicated revolving
credit facility refinanced in June 2017
with initial tenor until 2022 (plus two
one-year extensions options) provides
comfortable level of back-up liquidity
(in € m as of 30 September 2017)
1,000
800
600
400
200
0
20212020201920182017 2028202720262025202420232022
Other debt instrumentsBonds Hybrid
1. Formal lifetime of 60 years; first redemption right for Evonik in 2022
1
79
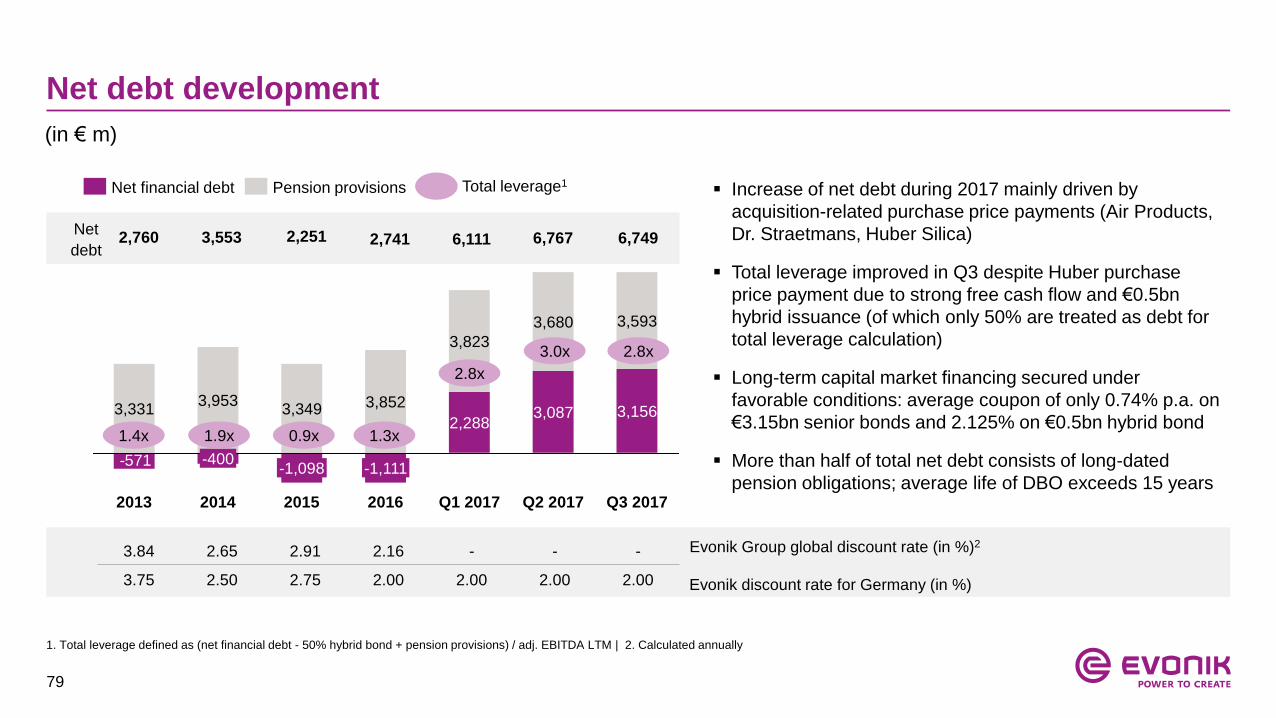
Net debt development
-571
Q3 2017Q2 2017
3,087
3,680
Q1 2017
2,288
3,823
2016
3,852
-1,111
2015
3,349
-1,098
2014
3,953
-400
2013
3,331 3,156
3,593
Pension provisionsNet financial debt Total leverage1
Evonik Group global discount rate (in %)2
Evonik discount rate for Germany (in %)
3.84 2.65 2.91 2.16 - - -
3.75 2.50 2.75 2.00 2.00 2.00 2.00
1.9x1.4x 0.9x
Net
debt2,760 3,553 2,251 2,741
Increase of net debt during 2017 mainly driven by
acquisition-related purchase price payments (Air Products,
Dr. Straetmans, Huber Silica)
Total leverage improved in Q3 despite Huber purchase
price payment due to strong free cash flow and €0.5bn
hybrid issuance (of which only 50% are treated as debt for
total leverage calculation)
Long-term capital market financing secured under
favorable conditions: average coupon of only 0.74% p.a. on
€3.15bn senior bonds and 2.125% on €0.5bn hybrid bond
More than half of total net debt consists of long-dated
pension obligations; average life of DBO exceeds 15 years
1. Total leverage defined as (net financial debt - 50% hybrid bond + pension provisions) / adj. EBITDA LTM | 2. Calculated annually
(in € m)
6,111
3.0x
6,767
1.3x
2.8x
2.8x
6,749
80
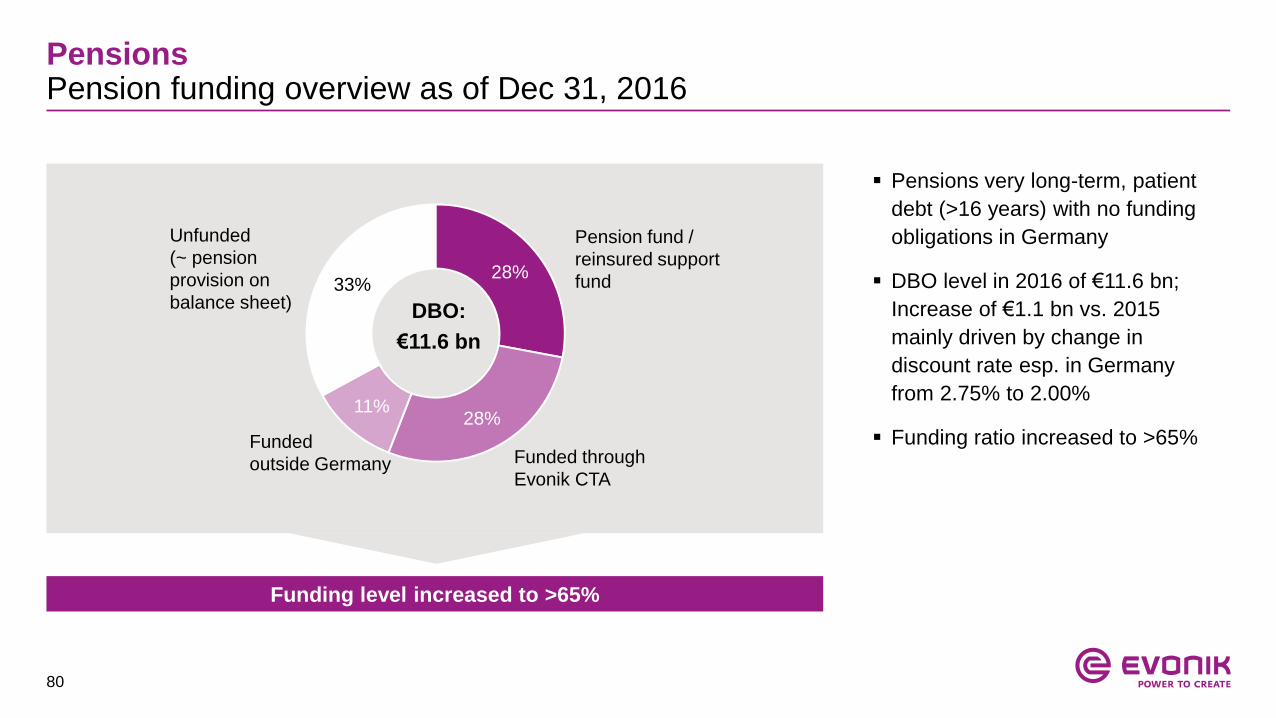
Funding level increased to >65%
Pension fund /
reinsured support
fund
Funded through
Evonik CTA
28%
28%11%
33%
Unfunded
(~ pension
provision on
balance sheet) DBO:
€11.6 bn
Funded
outside Germany
PensionsPension funding overview as of Dec 31, 2016
Pensions very long-term, patient
debt (>16 years) with no funding
obligations in Germany
DBO level in 2016 of €11.6 bn;
Increase of €1.1 bn vs. 2015
mainly driven by change in
discount rate esp. in Germany
from 2.75% to 2.00%
Funding ratio increased to >65%
81
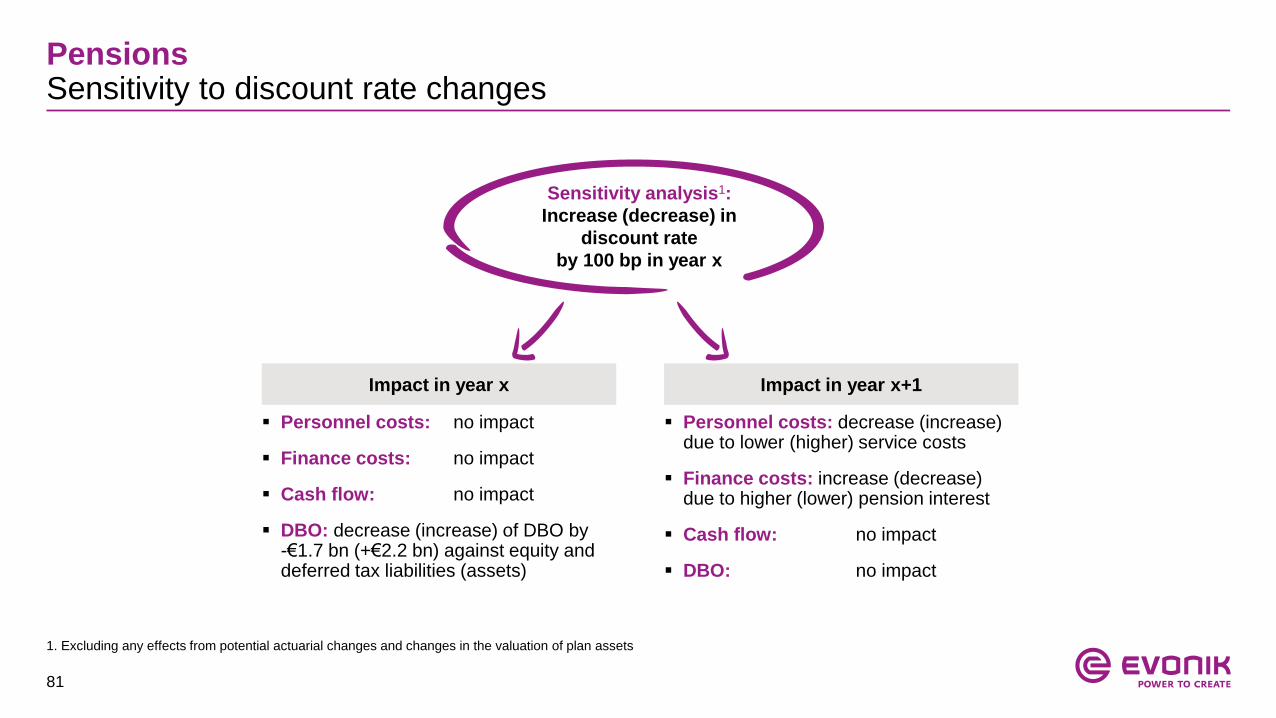
Sensitivity analysis1:
Increase (decrease) in
discount rate
by 100 bp in year x
Personnel costs: no impact
Finance costs: no impact
Cash flow: no impact
DBO: decrease (increase) of DBO by -€1.7 bn (+€2.2 bn) against equity and deferred tax liabilities (assets)
Personnel costs: decrease (increase) due to lower (higher) service costs
Finance costs: increase (decrease) due to higher (lower) pension interest
Cash flow: no impact
DBO: no impact
1. Excluding any effects from potential actuarial changes and changes in the valuation of plan assets
PensionsSensitivity to discount rate changes
Impact in year x Impact in year x+1
82
PensionsBreakdown of P&L and cash flow effects
in € m 2015 2016 Annual report ‘16
Benefits paid -433 -428 p. 161
Benefits paid from plan assets +185 +181 p. 162
Contribution to plan assets (excl. CTA) -145 -152 p. 162
Payments under defined contribution plans -156 -166 p. 163
Total cash out for pensions (excl. CTA) -549 -565
P&L
Cashflow
From
defined
benefit
plans
in € m P&L item / KPI 2015 2016 Annual report ‘16
Current service costs Adj. EBITDA -191 -180 p. 161
Interest costs Net interest expense -281 -297 p. 161
Exp. return on plan assets Net interest expense +185 +207 p. 162 / 163
Other Adj. EBITDA -40 -44 p. 163
Total pension expense -327 -316
83
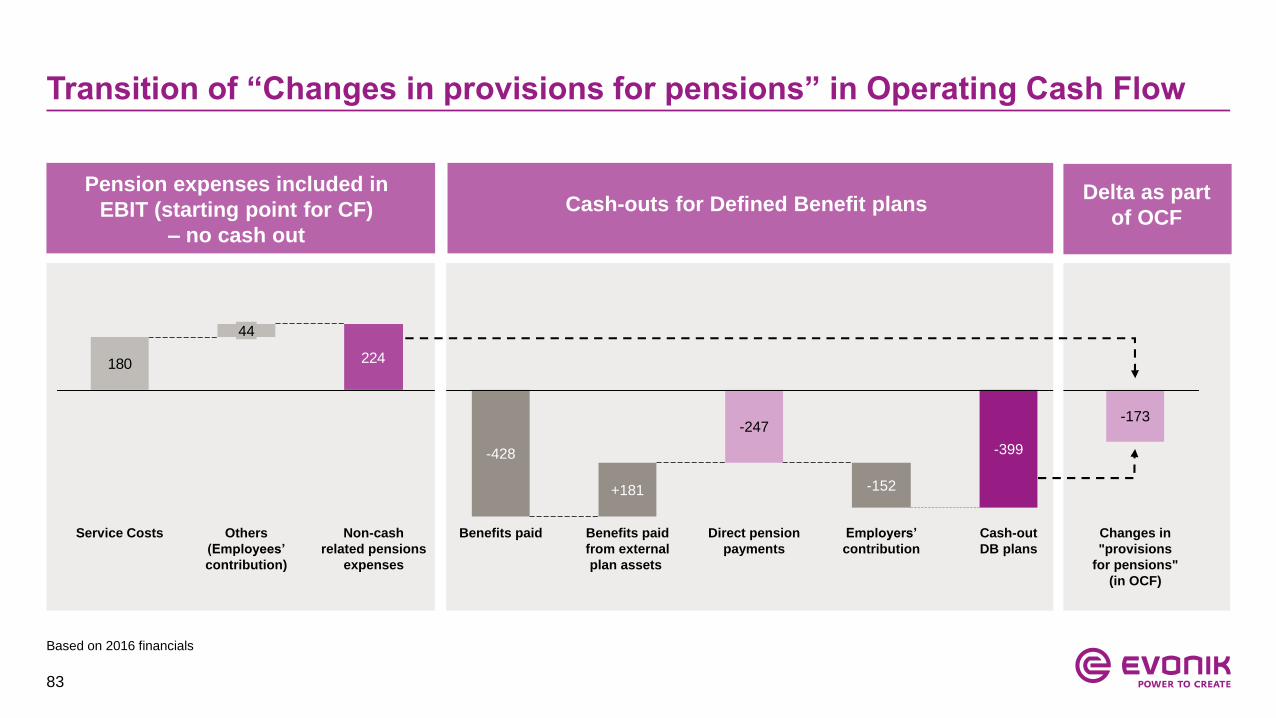
Transition of “Changes in provisions for pensions” in Operating Cash Flow
224180
Others
(Employees’
contribution)
44
Service Costs
-247
-152
Direct pension
payments
-399
Employers’
contribution
-173
Cash-out
DB plans
Changes in
"provisions
for pensions"
(in OCF)
Benefits paid
from external
plan assets
+181
-428
Benefits paidNon-cash
related pensions
expenses
Pension expenses included in
EBIT (starting point for CF)
– no cash out
Cash-outs for Defined Benefit plans Delta as part
of OCF
Based on 2016 financials
84
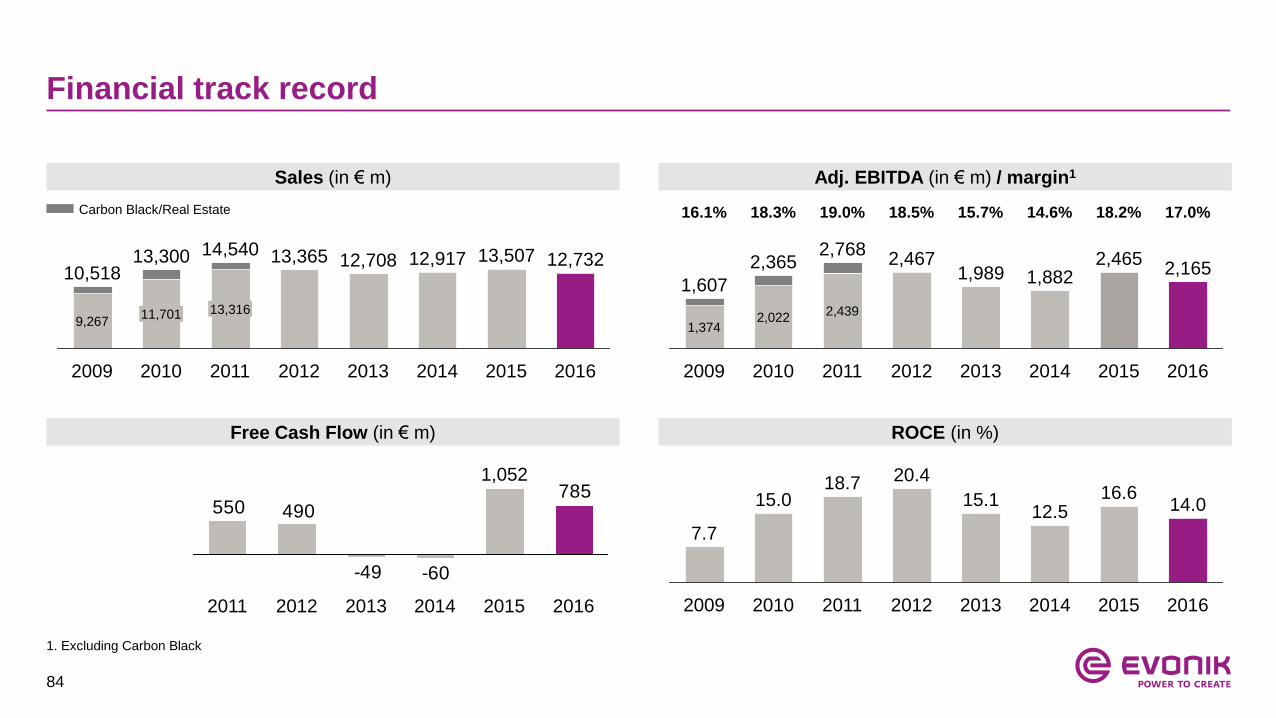
Financial track record
Carbon Black/Real Estate 16.1% 18.3% 19.0% 18.5% 15.7% 14.6%
1. Excluding Carbon Black
2016
2,165
2015
2,465
2014
1,882
2013
1,989
2012
2,467
2011
2,768
2,439
2010
2,365
2,022
2009
1,607
1,374
18.2%
13,316
2010
13,300
11,701
2009
10,518
9,267
2016
12,732
2015
13,507
2014
12,917
2013
12,708
2012
13,365
2011
14,540
785
-60-49
490550
1,052
20162012 20152013 20142011 2014
14.0
2016
7.7
20152009
15.0 16.612.5
20132012
15.1
20.4
20112010
18.7
Sales (in € m) Adj. EBITDA (in € m) / margin1
Free Cash Flow (in € m) ROCE (in %)
17.0%
85
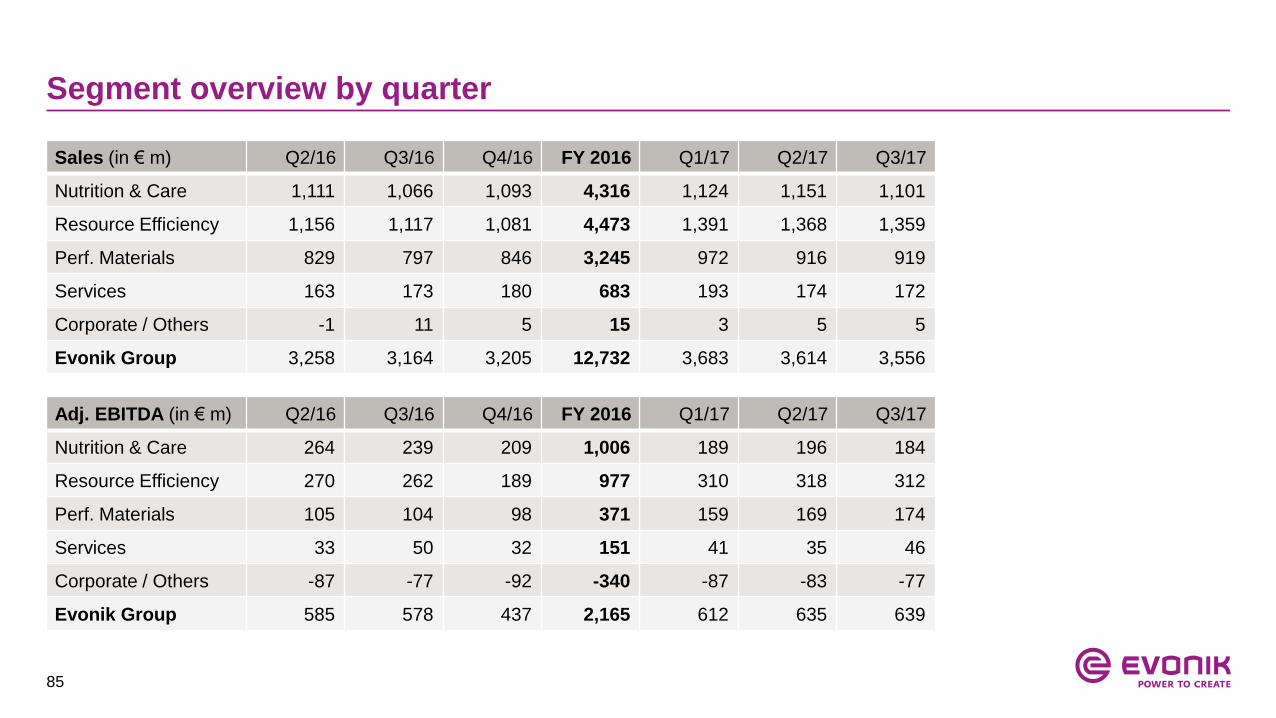
Segment overview by quarter
Sales (in € m) Q2/16 Q3/16 Q4/16 FY 2016 Q1/17 Q2/17 Q3/17
Nutrition & Care 1,111 1,066 1,093 4,316 1,124 1,151 1,101
Resource Efficiency 1,156 1,117 1,081 4,473 1,391 1,368 1,359
Perf. Materials 829 797 846 3,245 972 916 919
Services 163 173 180 683 193 174 172
Corporate / Others -1 11 5 15 3 5 5
Evonik Group 3,258 3,164 3,205 12,732 3,683 3,614 3,556
Adj. EBITDA (in € m) Q2/16 Q3/16 Q4/16 FY 2016 Q1/17 Q2/17 Q3/17
Nutrition & Care 264 239 209 1,006 189 196 184
Resource Efficiency 270 262 189 977 310 318 312
Perf. Materials 105 104 98 371 159 169 174
Services 33 50 32 151 41 35 46
Corporate / Others -87 -77 -92 -340 -87 -83 -77
Evonik Group 585 578 437 2,165 612 635 639
86
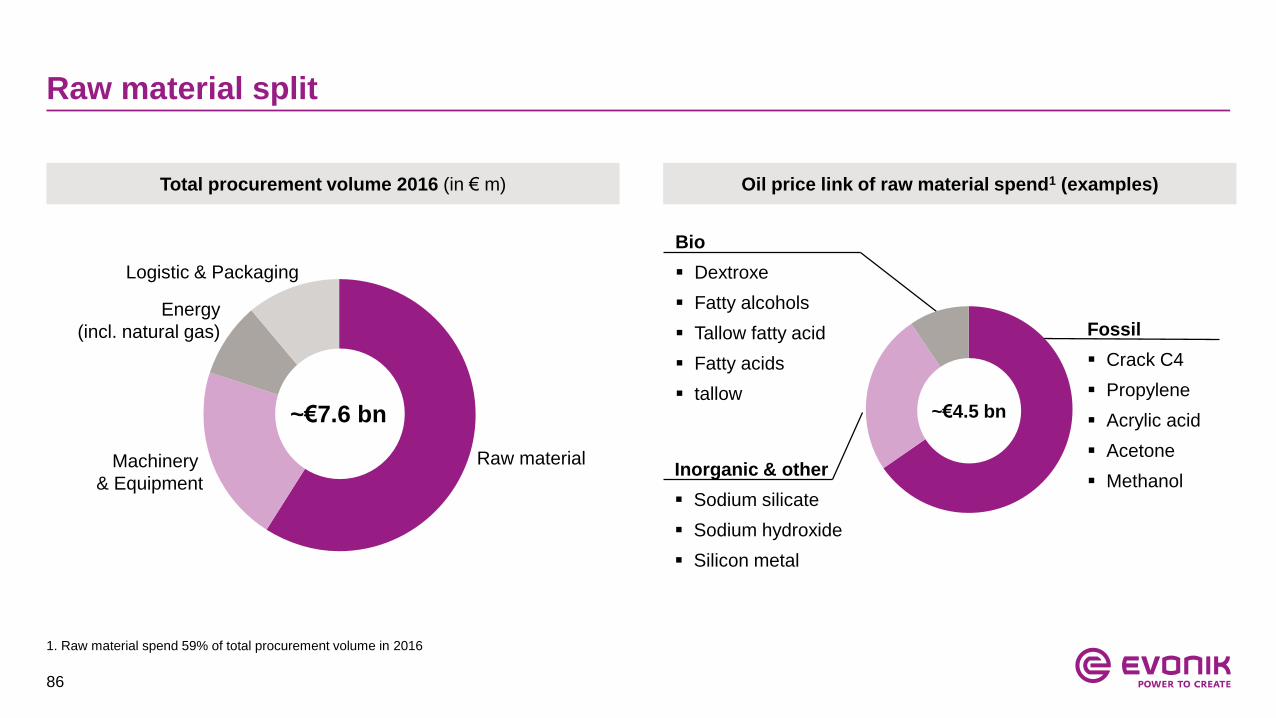
Raw material split
Fossil
Crack C4
Propylene
Acrylic acid
Acetone
MethanolInorganic & other
Sodium silicate
Sodium hydroxide
Silicon metal
Bio
Dextroxe
Fatty alcohols
Tallow fatty acid
Fatty acids
tallow
1. Raw material spend 59% of total procurement volume in 2016
Total procurement volume 2016 (in € m) Oil price link of raw material spend1 (examples)
Energy
(incl. natural gas)
Raw materialMachinery
& Equipment
Logistic & Packaging
~€7.6 bn ~€4.5 bn
87
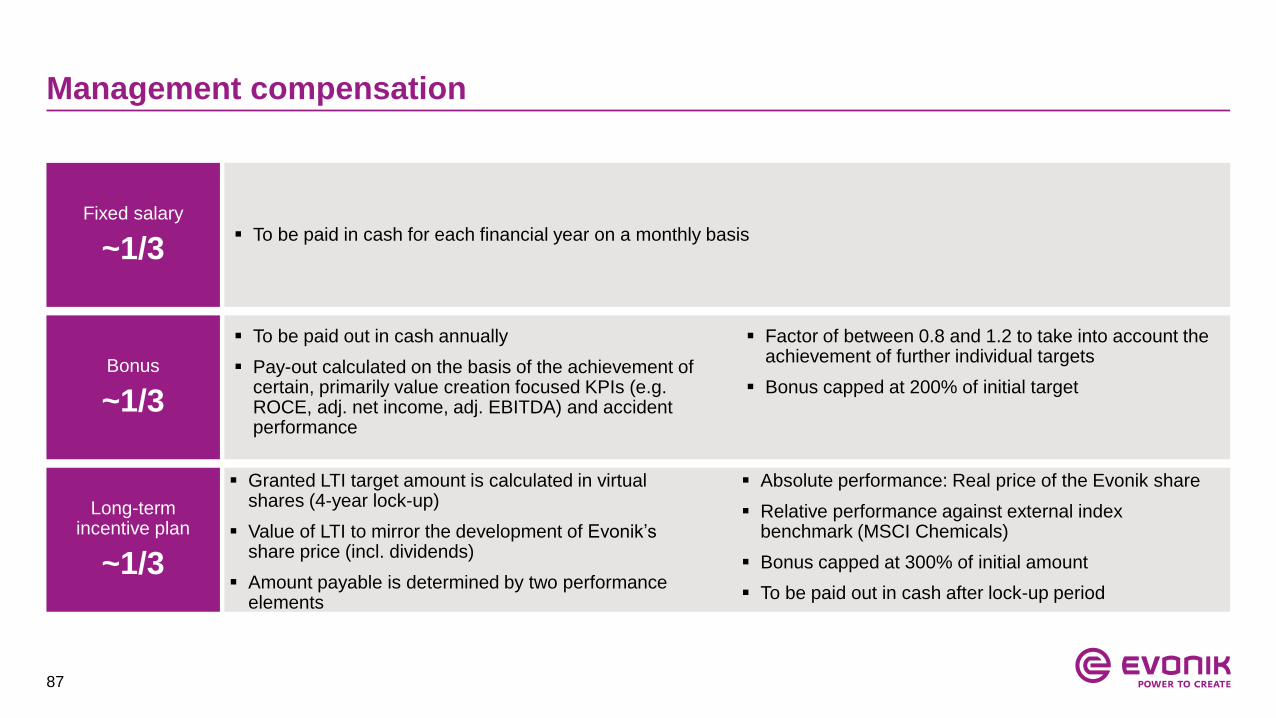
Management compensation
To be paid in cash for each financial year on a monthly basisFixed salary
~1/3
To be paid out in cash annually
Pay-out calculated on the basis of the achievement of certain, primarily value creation focused KPIs (e.g. ROCE, adj. net income, adj. EBITDA) and accident performance
Factor of between 0.8 and 1.2 to take into account the achievement of further individual targets
Bonus capped at 200% of initial targetBonus
~1/3
Granted LTI target amount is calculated in virtual shares (4-year lock-up)
Value of LTI to mirror the development of Evonik’sshare price (incl. dividends)
Amount payable is determined by two performance elements
Absolute performance: Real price of the Evonik share
Relative performance against external index benchmark (MSCI Chemicals)
Bonus capped at 300% of initial amount
To be paid out in cash after lock-up period
Long-term incentive plan
~1/3
88
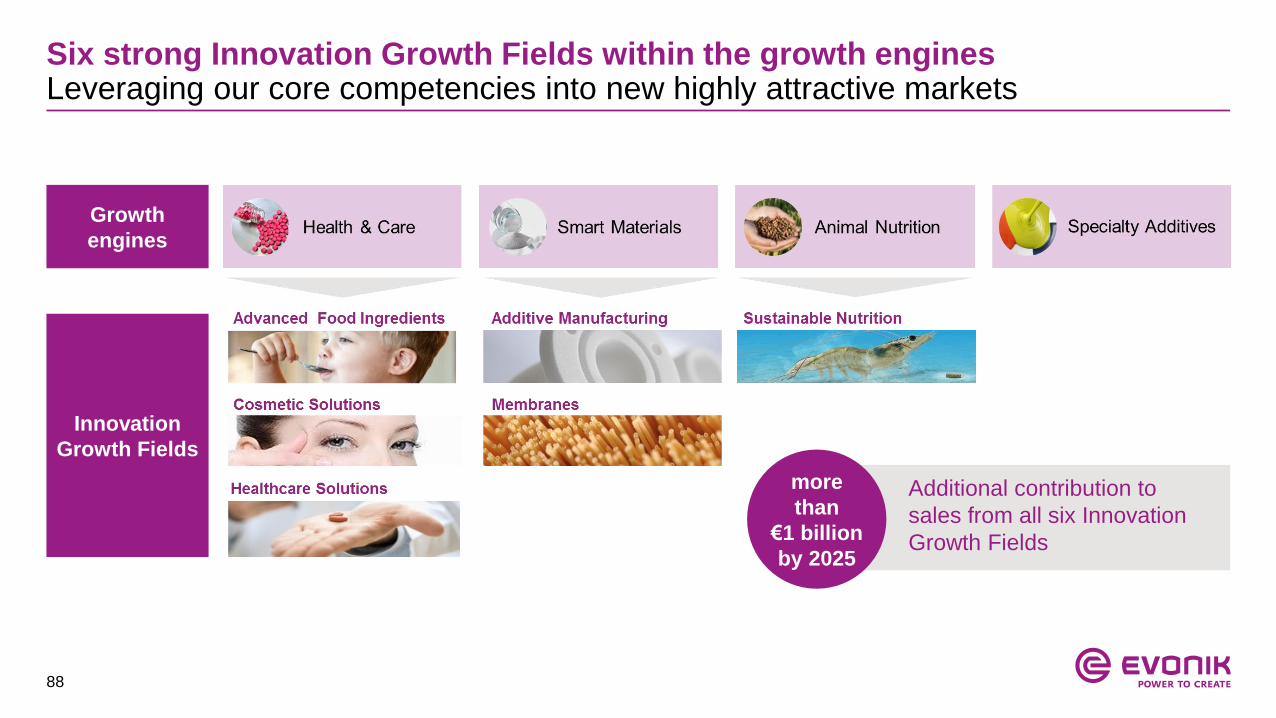
Six strong Innovation Growth Fields within the growth enginesLeveraging our core competencies into new highly attractive markets
Additional contribution to
sales from all six Innovation
Growth Fields
more
than
€1 billion
by 2025
Growth
engines
Innovation
Growth Fields
89
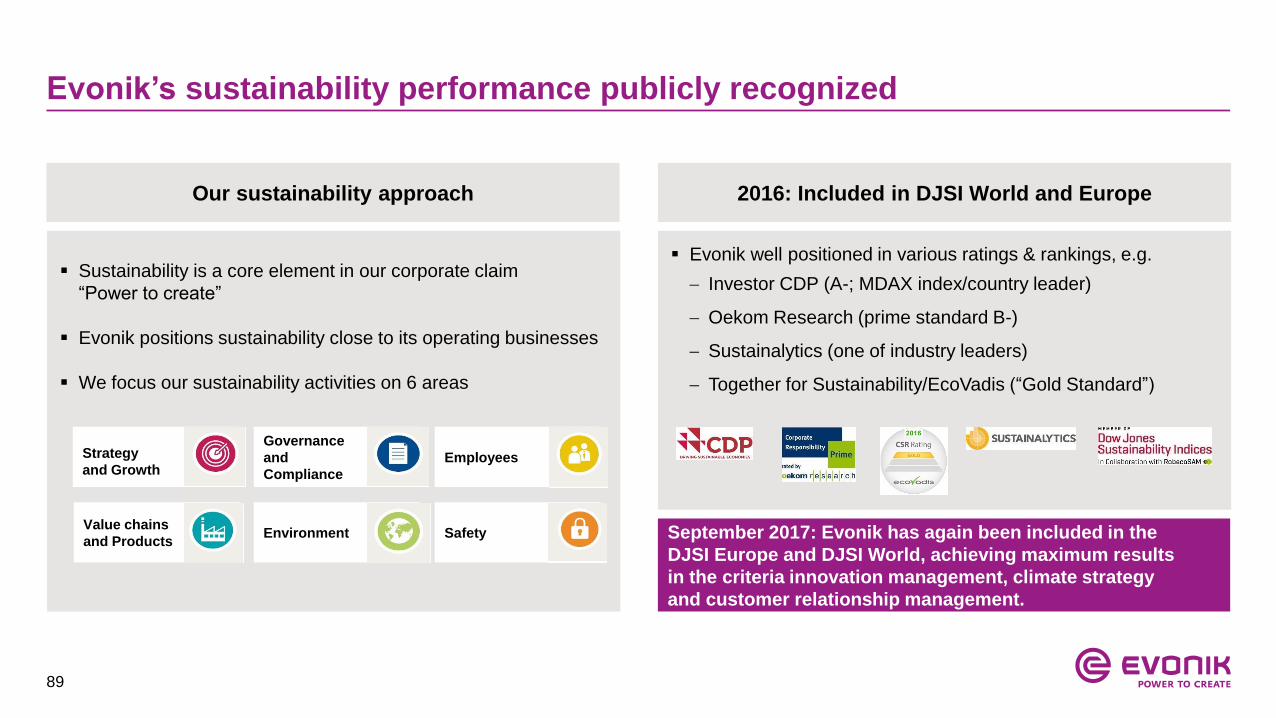
Evonik’s sustainability performance publicly recognized
Our sustainability approach 2016: Included in DJSI World and Europe
Evonik well positioned in various ratings & rankings, e.g.
Investor CDP (A-; MDAX index/country leader)
Oekom Research (prime standard B-)
Sustainalytics (one of industry leaders)
Together for Sustainability/EcoVadis (“Gold Standard”)
Sustainability is a core element in our corporate claim
“Power to create”
Evonik positions sustainability close to its operating businesses
We focus our sustainability activities on 6 areas
Strategy
and Growth
Governance
and
Compliance
Employees
Value chains
and ProductsEnvironment Safety September 2017: Evonik has again been included in the
DJSI Europe and DJSI World, achieving maximum results
in the criteria innovation management, climate strategy
and customer relationship management.
90
Appendix
1. Strategy Update
2. Acquisition of Air Products specialty additives business
3. Acquisition of Huber Silica
4. Segment overview
5. Financials
6. Upcoming events
91
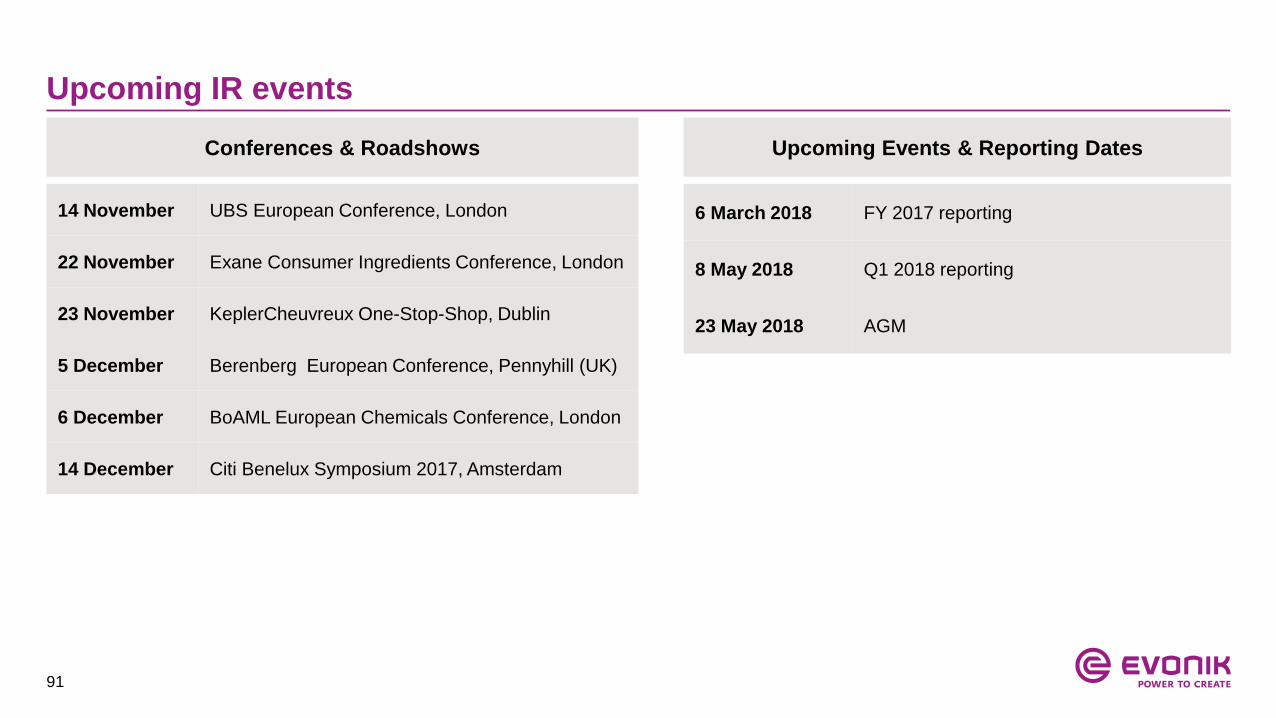
Upcoming IR events
Conferences & Roadshows Upcoming Events & Reporting Dates
14 November UBS European Conference, London
22 November Exane Consumer Ingredients Conference, London
23 November KeplerCheuvreux One-Stop-Shop, Dublin
5 December Berenberg European Conference, Pennyhill (UK)
6 December BoAML European Chemicals Conference, London
14 December Citi Benelux Symposium 2017, Amsterdam
6 March 2018 FY 2017 reporting
8 May 2018 Q1 2018 reporting
23 May 2018 AGM
92
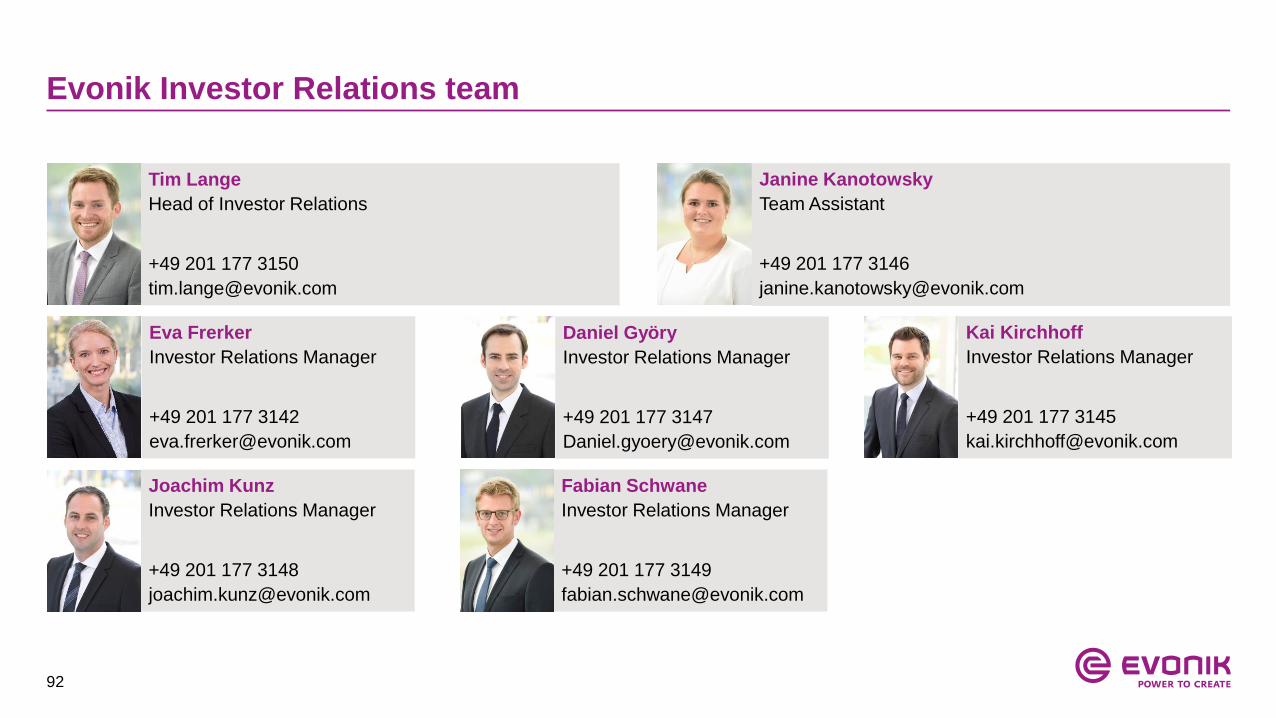
Evonik Investor Relations team
Tim Lange
Head of Investor Relations
+49 201 177 3150
Janine Kanotowsky
Team Assistant
+49 201 177 3146
Eva Frerker
Investor Relations Manager
+49 201 177 3142
Daniel Györy
Investor Relations Manager
+49 201 177 3147
Kai Kirchhoff
Investor Relations Manager
+49 201 177 3145
Joachim Kunz
Investor Relations Manager
+49 201 177 3148
Fabian Schwane
Investor Relations Manager
+49 201 177 3149
Janine Kanotowsky
Team Assistant
+49 201 177 3146
93
Disclaimer
In so far as forecasts or expectations are expressed in this presentation or where our statements concern the future, these
forecasts, expectations or statements may involve known or unknown risks and uncertainties. Actual results or developments
may vary, depending on changes in the operating environment. Neither Evonik Industries AG nor its group companies
assume an obligation to update the forecasts, expectations or statements contained in this release.
94