evm = evm: earned value management yields early visibility ... = evm scea 2004 sparrow.pdfbcws acwp...
TRANSCRIPT
EVM = EVM: Earned Value Management Yields Early Visibility &
Management Opportunitiespresented by
Harry Sparrowfor
THE SOCIETY OF COST ESTIMATING & ANALYSIS2004 NATIONAL CONFERENCE & TRAINING WORKSHOP
June 15-18, 2004Los Angeles, California
829 Chiles Avenue St. Helena, CA 94574707-967-0420 [email protected]
2Copyright © 2004 • All Rights Reserved
Performance Management Associates, Inc. SCEA04 EVM = EVM
EVM Isn’t Just EV
◆ It is integrated project management◆ Specifically, it is predicated on the
development of a baseline◆ Integrates the technical (scope), cost, and
schedule elements of the plan◆ Presumes the maintenance of this baseline
over the life of the project
3Copyright © 2004 • All Rights Reserved
Performance Management Associates, Inc. SCEA04 EVM = EVM
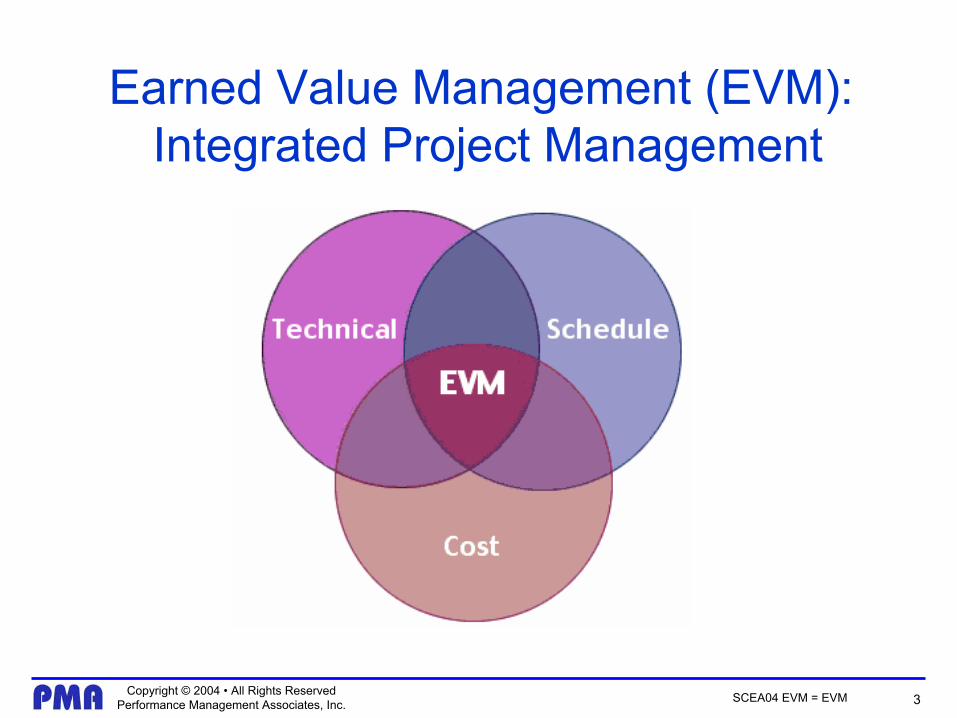
Earned Value Management (EVM): Integrated Project Management
4Copyright © 2004 • All Rights Reserved
Performance Management Associates, Inc. SCEA04 EVM = EVM
EVM: A Vision*
The quality of a management system is determined not by the absence of defects, but
by the presence of management value
Gary Christle, The Cost/Schedule Control Systems Criteria (C/SCSC) and Earned Value Management: A Vision , 9/15/94
5Copyright © 2004 • All Rights Reserved
Performance Management Associates, Inc. SCEA04 EVM = EVM
How Is Value Added?
The management system provides information that is used to make effective management decisions
Harry Sparrow
6Copyright © 2004 • All Rights Reserved
Performance Management Associates, Inc. SCEA04 EVM = EVM
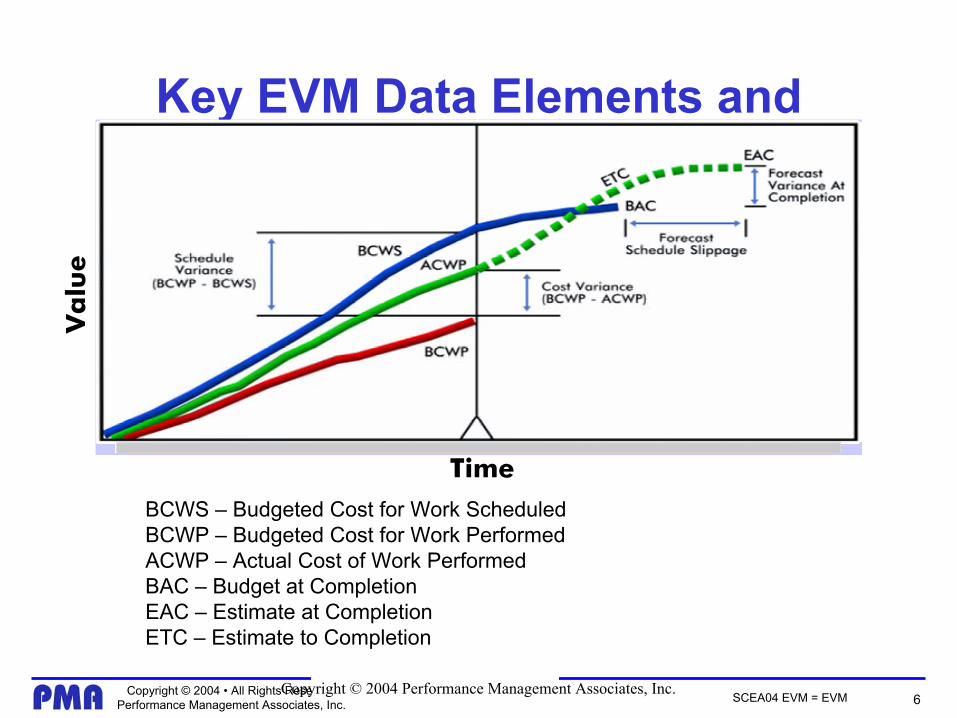
Key EVM Data Elements and Variances
Value
Copyright © 2004 Performance Management Associates, Inc.
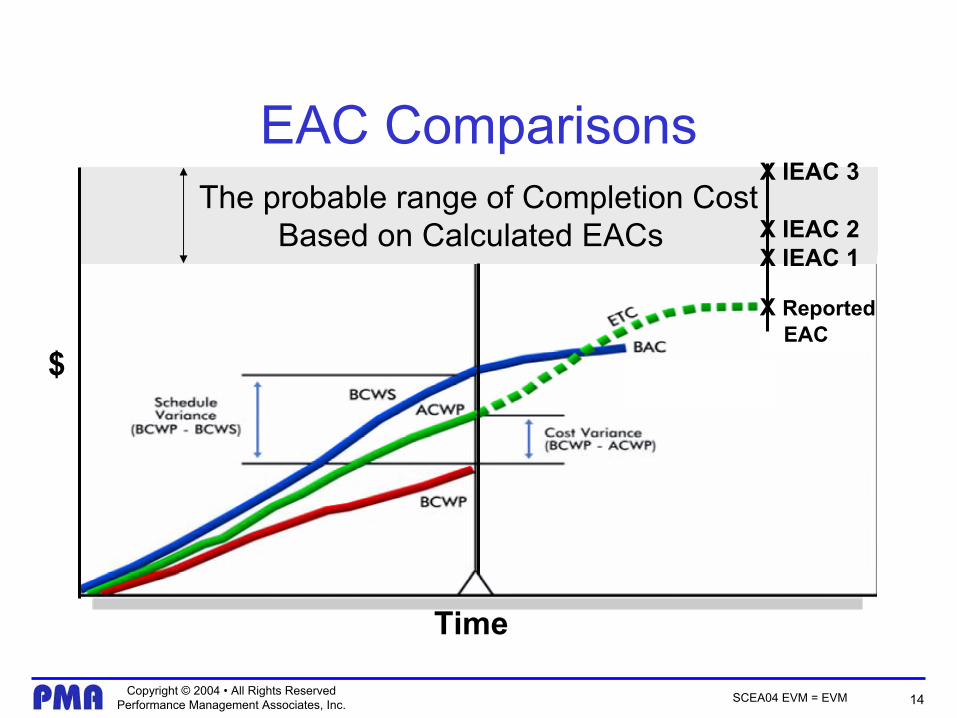
BCWS – Budgeted Cost for Work ScheduledBCWP – Budgeted Cost for Work PerformedACWP – Actual Cost of Work PerformedBAC – Budget at CompletionEAC – Estimate at CompletionETC – Estimate to Completion
Time
7Copyright © 2004 • All Rights Reserved
Performance Management Associates, Inc. SCEA04 EVM = EVM
Data Analysis
8Copyright © 2004 • All Rights Reserved
Performance Management Associates, Inc. SCEA04 EVM = EVM
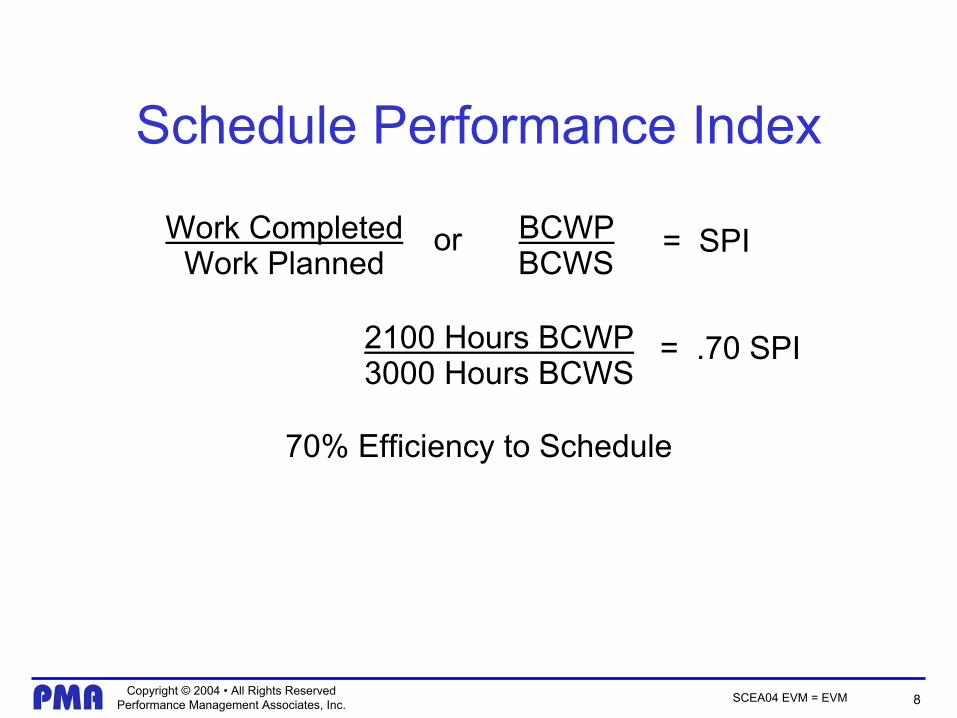
Schedule Performance Index
Work CompletedWork Planned
BCWPBCWS
or = SPI
2100 Hours BCWP3000 Hours BCWS
= .70 SPI
70% Efficiency to Schedule
9Copyright © 2004 • All Rights Reserved
Performance Management Associates, Inc. SCEA04 EVM = EVM
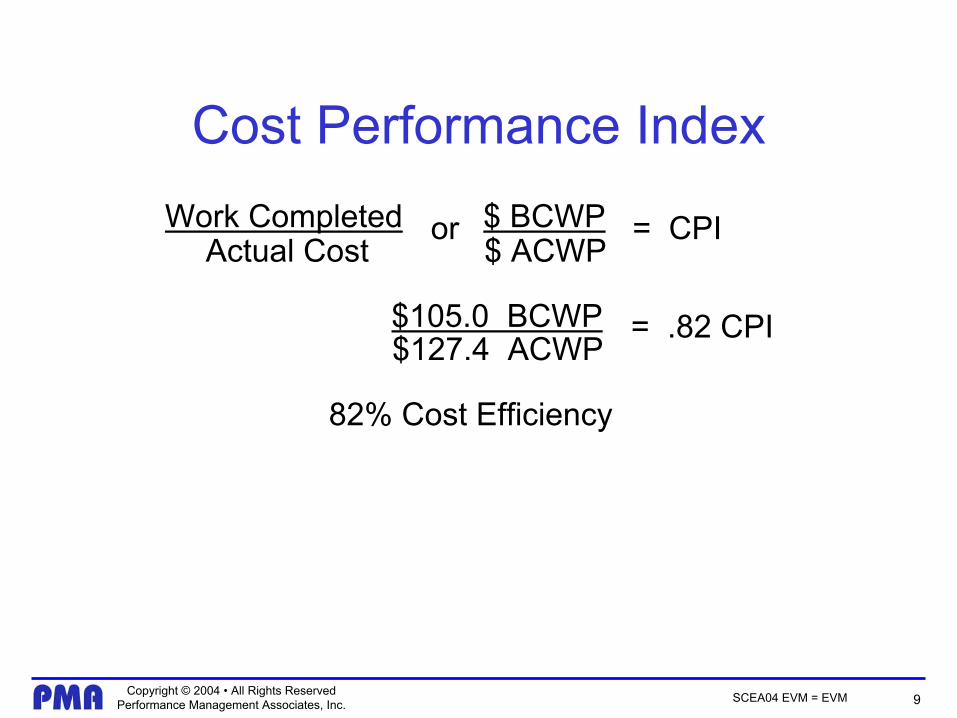
Cost Performance IndexWork Completed
Actual Cost$ BCWP$ ACWP
or = CPI
$105.0 BCWP$127.4 ACWP
= .82 CPI
82% Cost Efficiency
10Copyright © 2004 • All Rights Reserved
Performance Management Associates, Inc. SCEA04 EVM = EVM
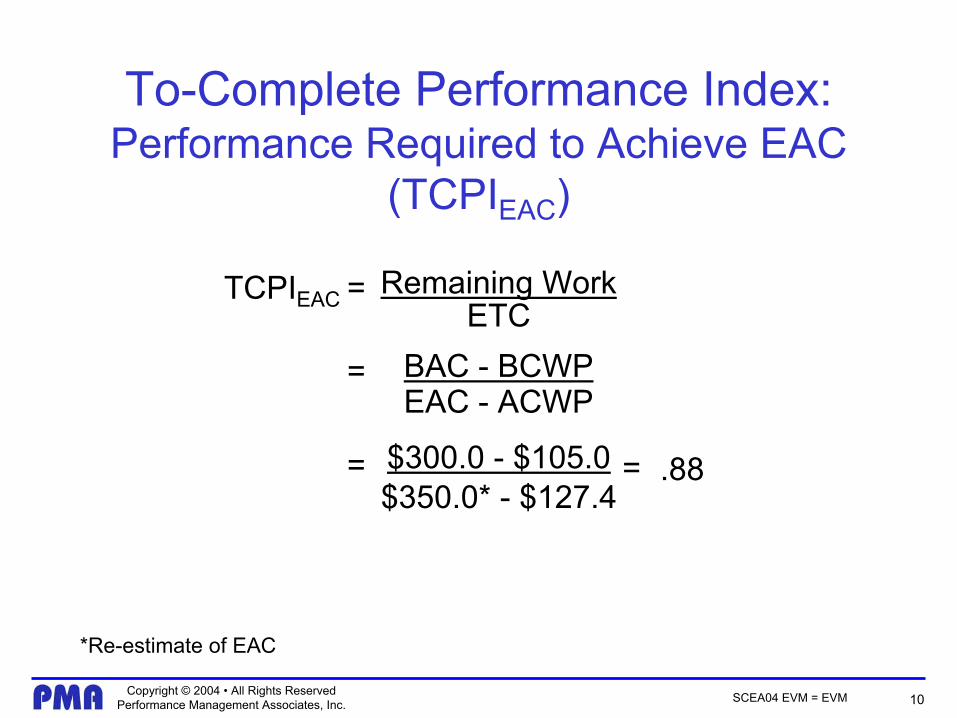
= Remaining WorkETC
TCPIEAC
= BAC - BCWPEAC - ACWP
= $300.0 - $105.0$350.0* - $127.4
.88=
*Re-estimate of EAC
To-Complete Performance Index:Performance Required to Achieve EAC
(TCPIEAC)
11Copyright © 2004 • All Rights Reserved
Performance Management Associates, Inc. SCEA04 EVM = EVM
Performance Factors
◆ Cumulative performance◆ Recent experience◆ Cost and schedule performance◆ Other?
12Copyright © 2004 • All Rights Reserved
Performance Management Associates, Inc. SCEA04 EVM = EVM
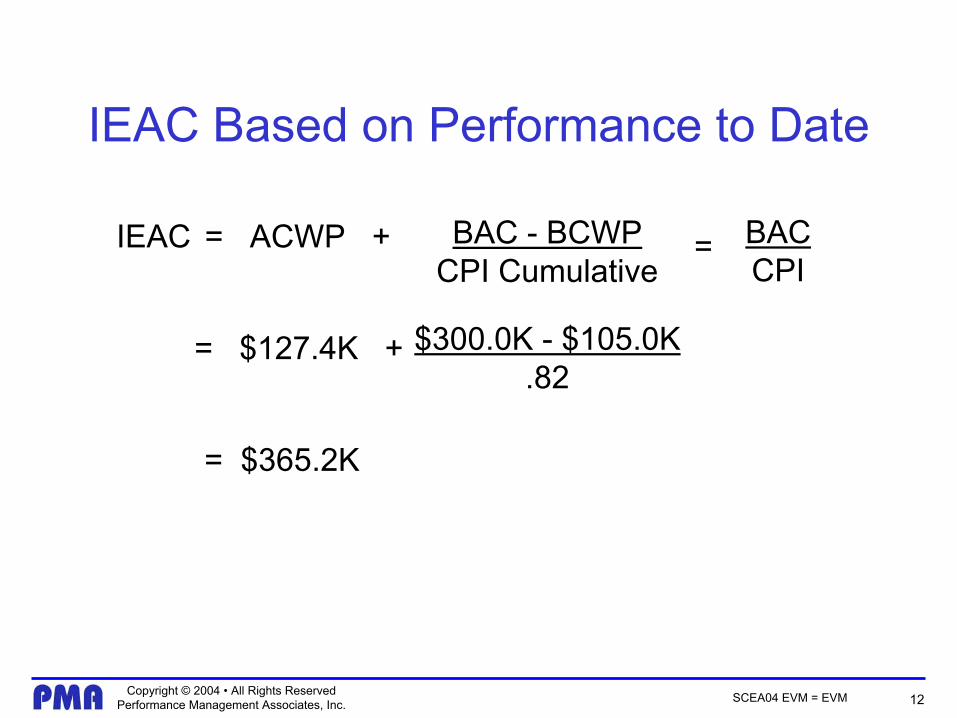
IEAC Based on Performance to Date
= ACWP +
= $127.4K +
= $365.2K
BAC - BCWPCPI Cumulative
$300.0K - $105.0K.82
IEAC BACCPI
=

13Copyright © 2004 • All Rights Reserved
Performance Management Associates, Inc. SCEA04 EVM = EVM
EAC FormulaeEAC (1) = ACWPc + (BCWR ÷ CPI6)
EAC (2) = ACWPc + (BCWR ÷ CPI12)
EAC (3) = BAC ÷ CPIc
EAC (4) = ACWPc + [BCWR ÷ (CPIc x SPIc)]
EAC (5) = ACWPc + (BCWR ÷ CPI3)
EAC (6) = ACWPc + (BCWR ÷ CPI6)
M
L
E M
E M
E M L
L
STAGE*
*E = EARLY M = MID L = LATE
In these formulae:• EAC is estimated cost at completion.• ACWPc is actual cost of work performed (cumulative).• BCWR is budgeted cost of work remaining (equal to BAC - BCWP).• c signifies cumulative.• Sub numbers (m, 3, 6, 12) refer to months; e.g. CPI6 is the average of six months current period CPIs.• A bar over CPI (CPI) refers to a CPI based on a sum of BCWPs divided by a sum of ACWPs.
CPI3 for example is based on the latest 3 months current BCWPs ÷ 3 months current ACWPs. CPI3 (no bar), on the other hand, is the average of the latest 3 months current CPIs.In general, CPI is a better figure to use than CPI.
?
14Copyright © 2004 • All Rights Reserved
Performance Management Associates, Inc. SCEA04 EVM = EVM
EAC ComparisonsThe probable range of Completion Cost
Based on Calculated EACs
X IEAC 3
X IEAC 2X IEAC 1
X ReportedEAC
$
Time
15Copyright © 2004 • All Rights Reserved
Performance Management Associates, Inc. SCEA04 EVM = EVM
Is There More?◆ Based on a study done by Michael Popp, there
is statistical evidence that program behavior can be counter intuitive▲The wider range of variation in CPI movement in
development contracts versus production ones is not as significant as anticipated
▲There is not a significant difference in behavior of small versus large contracts
▲There is clear evidence that, even as late as 70 – 80 % complete, cost performance can worsen significantly
▲Good programs do not improve either – “freebies”?
16Copyright © 2004 • All Rights Reserved
Performance Management Associates, Inc. SCEA04 EVM = EVM
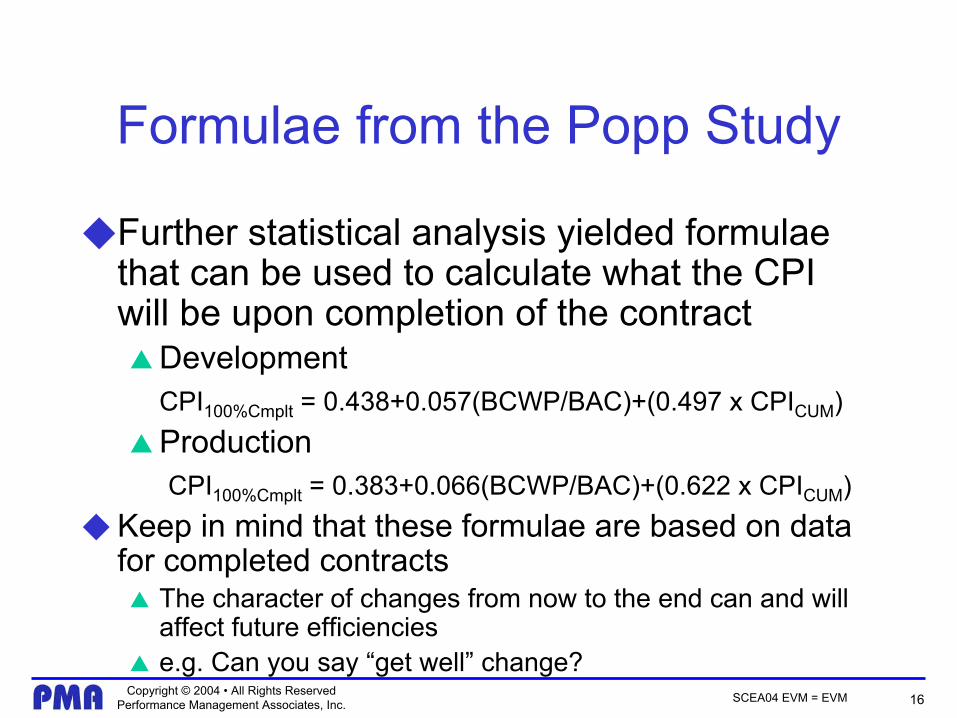
Formulae from the Popp Study
◆ Further statistical analysis yielded formulae that can be used to calculate what the CPI will be upon completion of the contract▲Development
CPI100%Cmplt = 0.438+0.057(BCWP/BAC)+(0.497 x CPICUM)▲Production
CPI100%Cmplt = 0.383+0.066(BCWP/BAC)+(0.622 x CPICUM)◆ Keep in mind that these formulae are based on data
for completed contracts▲ The character of changes from now to the end can and will
affect future efficiencies▲ e.g. Can you say “get well” change?
17Copyright © 2004 • All Rights Reserved
Performance Management Associates, Inc. SCEA04 EVM = EVM
OTHER CONSIDERATIONS: Do You Have Enough People Given
Your Performance ?◆ When you assess your CPI
in terms of hours, how do the authorized resources for remaining work compare with
◆ Is your estimate to complete (ETC) in your EVMS consistent with this?
CPI*Resources Planned
*Budgeted Resources for remaining work
18Copyright © 2004 • All Rights Reserved
Performance Management Associates, Inc. SCEA04 EVM = EVM
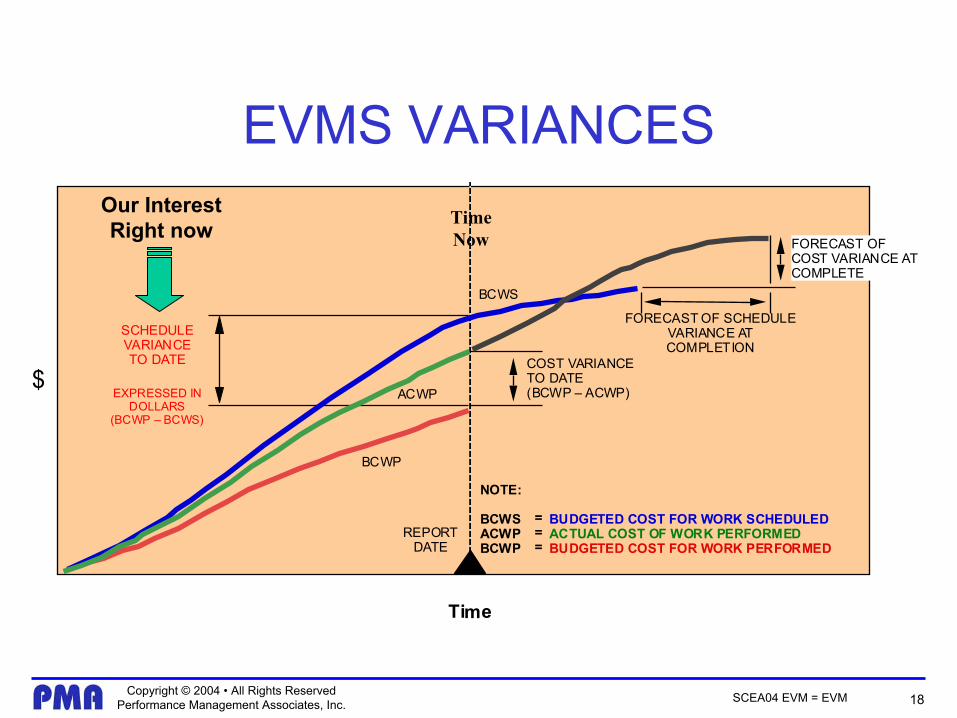
EVMS VARIANCES
Time
$
NOTE:
BCWSACWPBCWP
===
BUDGETED COST FOR WORK SCHEDULEDACTUAL COST OF WORK PERFORMEDBUDGETED COST FOR WORK PERFORMED
SCHEDULEVARIANCETO DATE
EXPRESSED INDOLLARS
(BCWP – BCWS)
COST VARIANCETO DATE(BCWP – ACWP)
FORECAST OF SCHEDULEVARIANCE ATCOMPLETION
FORECAST OFCOST VARIANCE ATCOMPLETE
BCWS
BCWP
ACWP
REPORTDATE
Our InterestRight now Time
Now
19Copyright © 2004 • All Rights Reserved
Performance Management Associates, Inc. SCEA04 EVM = EVM
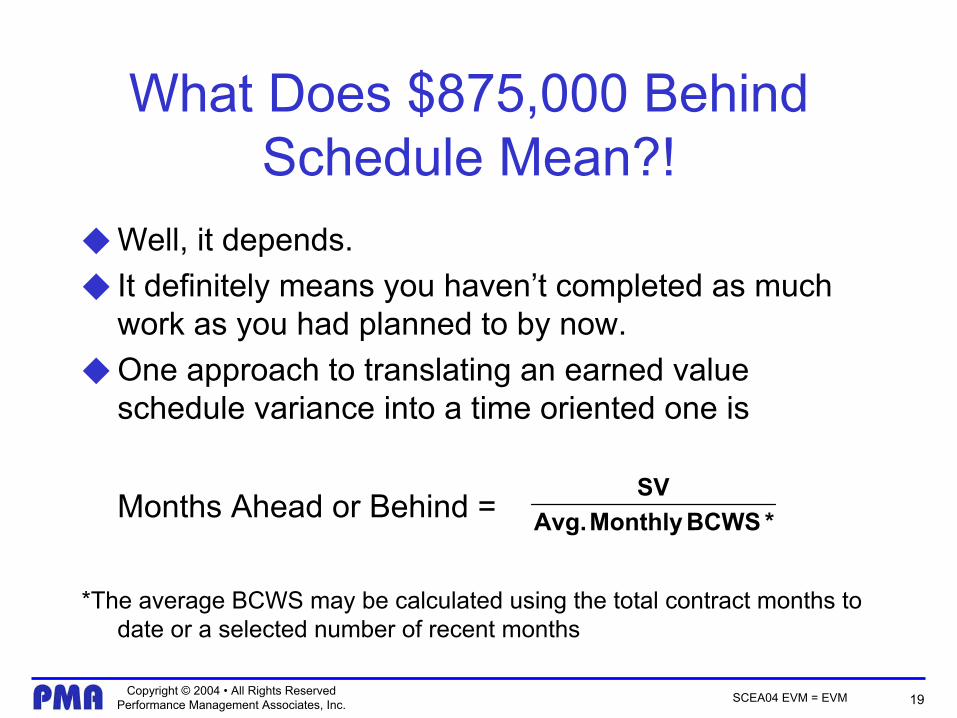
What Does $875,000 Behind Schedule Mean?!
◆ Well, it depends.◆ It definitely means you haven’t completed as much
work as you had planned to by now.◆ One approach to translating an earned value
schedule variance into a time oriented one is
Months Ahead or Behind =
*The average BCWS may be calculated using the total contract months to date or a selected number of recent months
*BCWS Monthly Avg.SV

20Copyright © 2004 • All Rights Reserved
Performance Management Associates, Inc. SCEA04 EVM = EVM
Per Average BCWS, $875K = How Many Months
◆ Inception to Date Average Monthly BCWS
◆ Most Recent 3 Months
◆ Most Recent Month
875.2404.9 = 2.16 months behind
875.2594.7 = 1.47 months behind
875.2728.4 = 1.20 months behind
21Copyright © 2004 • All Rights Reserved
Performance Management Associates, Inc. SCEA04 EVM = EVM
However◆ Depending on which activities are behind schedule
per the plan, you may or may not be behind schedule.
◆ Whatever the situation is, if $875K represents a significant variance as a percentage, you need to look at your physical schedules NOW.
22Copyright © 2004 • All Rights Reserved
Performance Management Associates, Inc. SCEA04 EVM = EVM
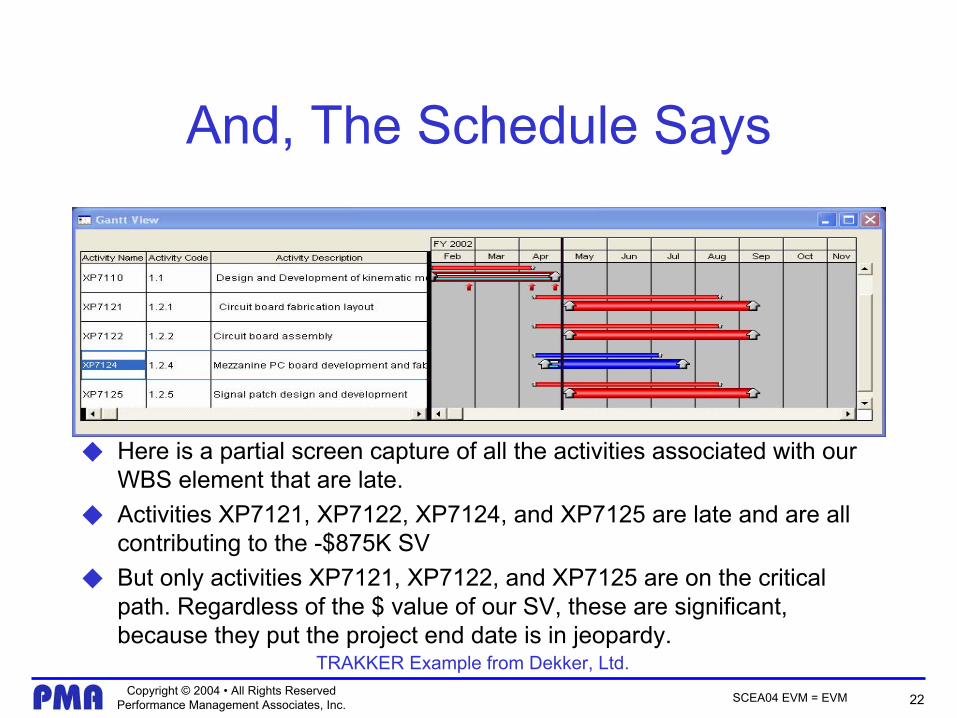
And, The Schedule Says
◆ Here is a partial screen capture of all the activities associated with our WBS element that are late.
◆ Activities XP7121, XP7122, XP7124, and XP7125 are late and are all contributing to the -$875K SV
◆ But only activities XP7121, XP7122, and XP7125 are on the critical path. Regardless of the $ value of our SV, these are significant, because they put the project end date is in jeopardy.
TRAKKER Example from Dekker, Ltd.
23Copyright © 2004 • All Rights Reserved
Performance Management Associates, Inc. SCEA04 EVM = EVM
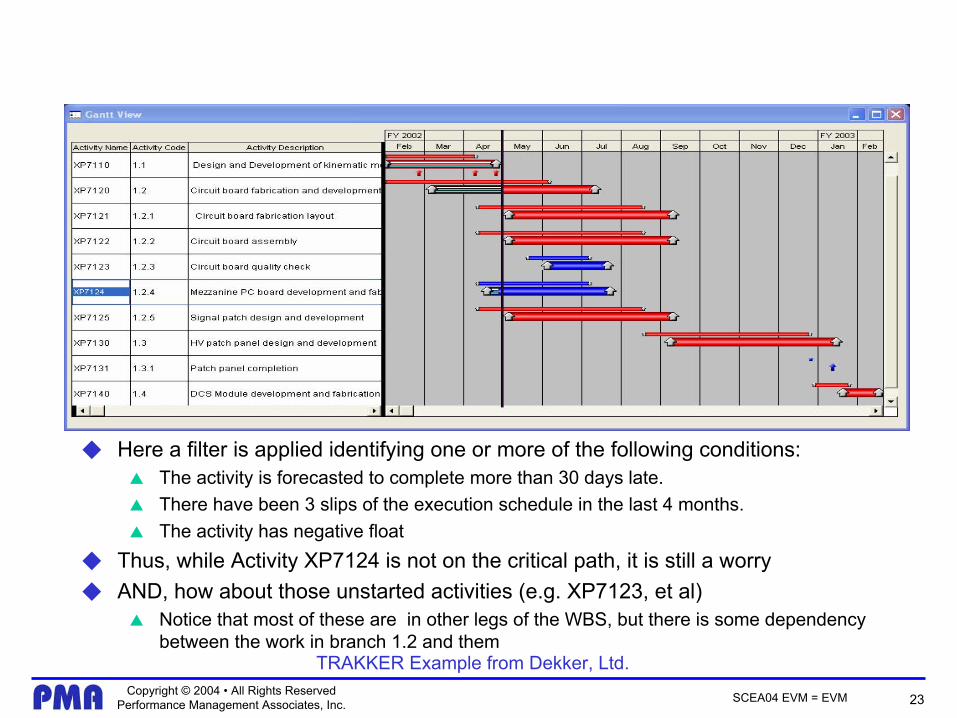
Are There Other Concerns?
◆ Here a filter is applied identifying one or more of the following conditions: ▲ The activity is forecasted to complete more than 30 days late.▲ There have been 3 slips of the execution schedule in the last 4 months.▲ The activity has negative float
◆ Thus, while Activity XP7124 is not on the critical path, it is still a worry◆ AND, how about those unstarted activities (e.g. XP7123, et al)
▲ Notice that most of these are in other legs of the WBS, but there is some dependency between the work in branch 1.2 and them
TRAKKER Example from Dekker, Ltd.
24Copyright © 2004 • All Rights Reserved
Performance Management Associates, Inc. SCEA04 EVM = EVM
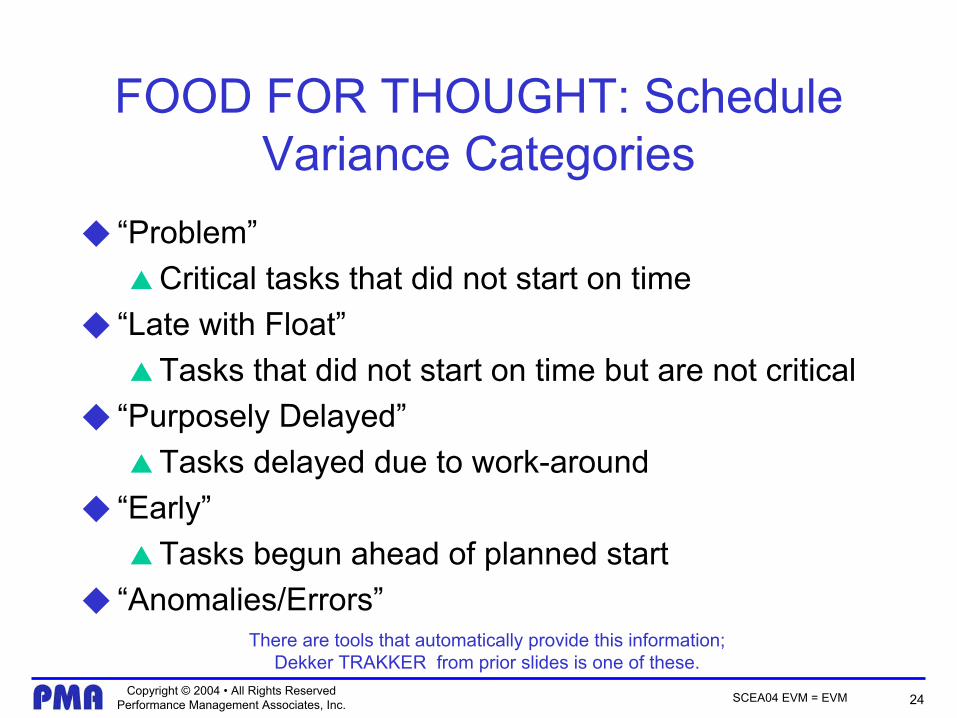
FOOD FOR THOUGHT: Schedule Variance Categories
◆ “Problem”▲Critical tasks that did not start on time
◆ “Late with Float”▲Tasks that did not start on time but are not critical
◆ “Purposely Delayed”▲Tasks delayed due to work-around
◆ “Early”▲Tasks begun ahead of planned start
◆ “Anomalies/Errors”There are tools that automatically provide this information;
Dekker TRAKKER from prior slides is one of these.
25Copyright © 2004 • All Rights Reserved
Performance Management Associates, Inc. SCEA04 EVM = EVM
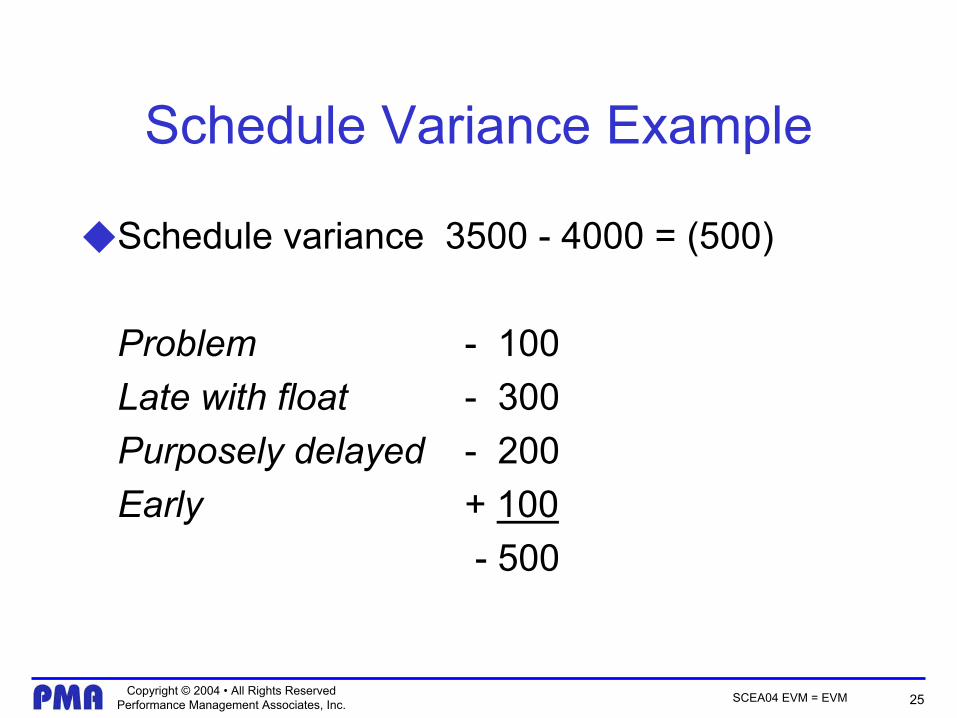
Schedule Variance Example
◆ Schedule variance 3500 - 4000 = (500)
Problem - 100Late with float - 300Purposely delayed - 200Early + 100
- 500

26Copyright © 2004 • All Rights Reserved
Performance Management Associates, Inc. SCEA04 EVM = EVM
The Schedule Performance Index(SPI)
◆ Let’s pause and talk about another EVMS concept◆ The SPI is a measure of how efficient we have been
in accomplishing our work relative to our plan for its accomplishment
◆ As a reminder, it is calculated per the formula
SPI = BCWSBCWP

27Copyright © 2004 • All Rights Reserved
Performance Management Associates, Inc. SCEA04 EVM = EVM
Are Your SPI and Your Schedule Data in Agreement
◆ It is possible to confirm that the schedule performance data are consistent with the SPI by use of one of these two formulas.
◆ Significant differences between the SPI and either of these calculations should be assessed.
Critical Path Length (CPL) + FloatCPL
or Project Length ± Time Ahead or BehindProject Length
28Copyright © 2004 • All Rights Reserved
Performance Management Associates, Inc. SCEA04 EVM = EVM
Earned Schedule and SPITime
◆ The last slide brings up a point not unlike that of Walt Lipke and Kym Henderson
◆ They have espoused a theory documented in a presentation called, “Earned Schedule” The Concept, Initial Evaluation and Potential Benefits
◆ Their position is that the traditional EVM schedule variance and SPI are limited in value, because as a program approaches completion, the SV and SPI march inexorably toward 0 and 1.0, respectively▲ Even if the program finishes late or early
29Copyright © 2004 • All Rights Reserved
Performance Management Associates, Inc. SCEA04 EVM = EVM
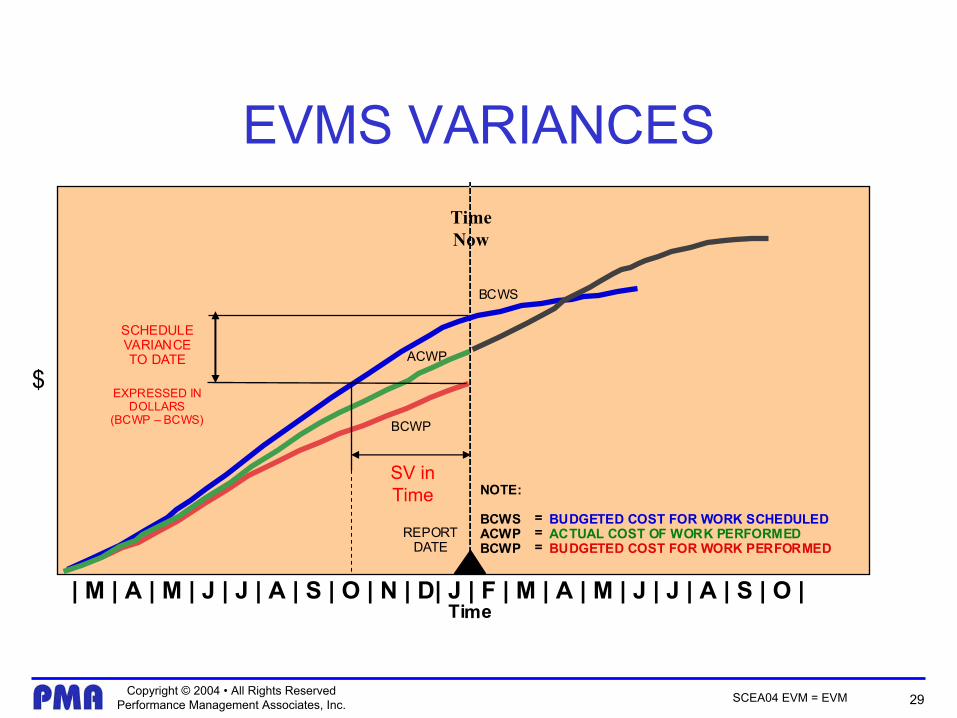
EVMS VARIANCES
Time
$
NOTE:
BCWSACWPBCWP
===
BUDGETED COST FOR WORK SCHEDULEDACTUAL COST OF WORK PERFORMEDBUDGETED COST FOR WORK PERFORMED
SCHEDULEVARIANCETO DATE
EXPRESSED INDOLLARS
(BCWP – BCWS)
BCWS
REPORTDATE
TimeNow
BCWP
ACWP
SV inTime
| M | A | M | J | J | A | S | O | N | D| J | F | M | A | M | J | J | A | S | O |
30Copyright © 2004 • All Rights Reserved
Performance Management Associates, Inc. SCEA04 EVM = EVM
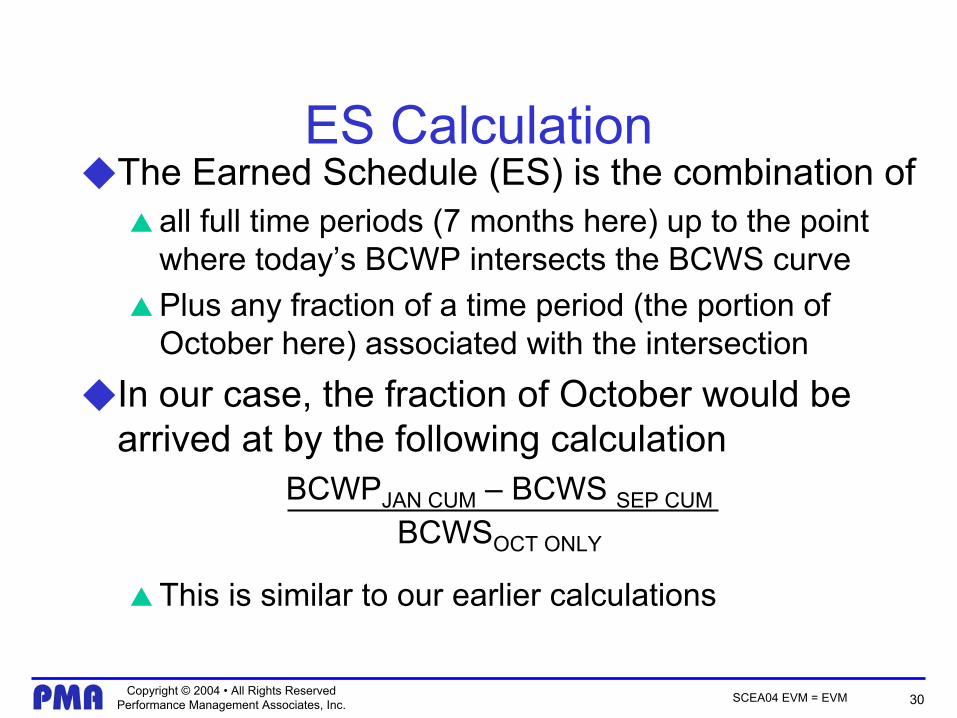
ES Calculation◆ The Earned Schedule (ES) is the combination of
▲all full time periods (7 months here) up to the point where today’s BCWP intersects the BCWS curve
▲Plus any fraction of a time period (the portion of October here) associated with the intersection
◆ In our case, the fraction of October would be arrived at by the following calculation
▲This is similar to our earlier calculations
BCWPJAN CUM – BCWS SEP CUM
BCWSOCT ONLY
31Copyright © 2004 • All Rights Reserved
Performance Management Associates, Inc. SCEA04 EVM = EVM
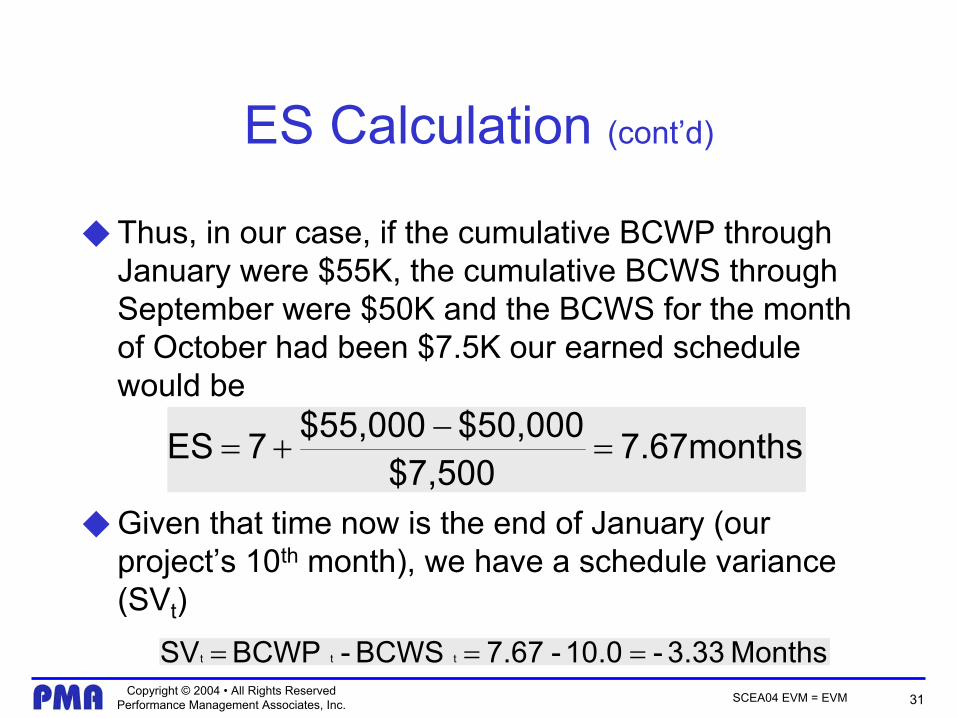
ES Calculation (cont’d)
◆ Thus, in our case, if the cumulative BCWP through January were $55K, the cumulative BCWS through September were $50K and the BCWS for the month of October had been $7.5K our earned schedule would be
◆ Given that time now is the end of January (our project’s 10th month), we have a schedule variance (SVt)
7.67months$7,500
$50,000$55,0007 ES =−+=
Months3.33-10.0-7.67BCWS-BCWPSV ttt ===
32Copyright © 2004 • All Rights Reserved
Performance Management Associates, Inc. SCEA04 EVM = EVM
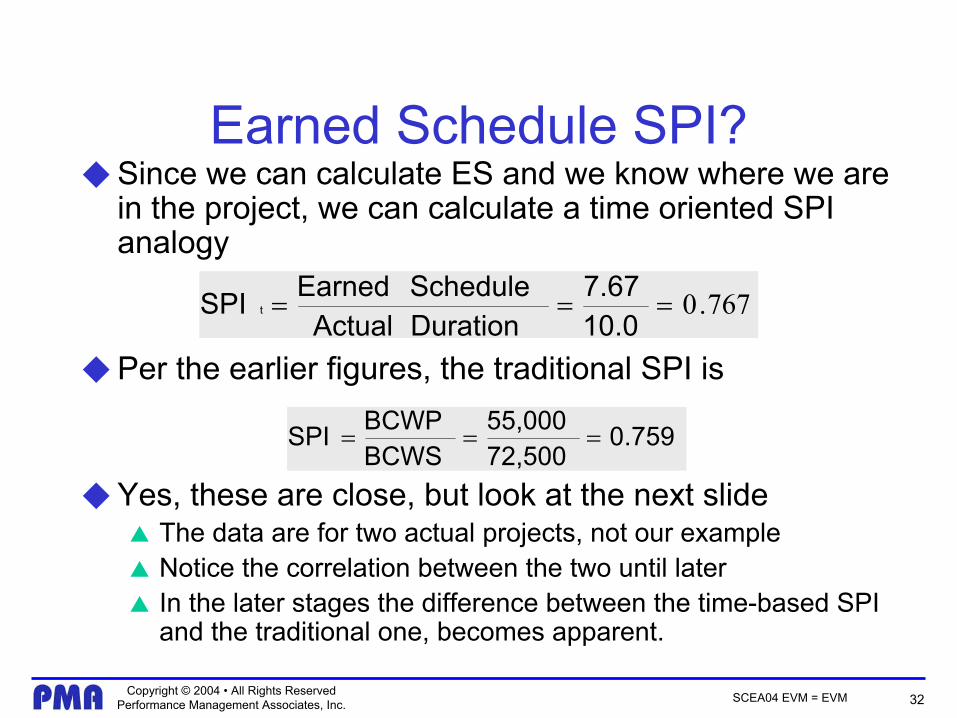
Earned Schedule SPI?◆ Since we can calculate ES and we know where we are
in the project, we can calculate a time oriented SPI analogy
◆ Per the earlier figures, the traditional SPI is
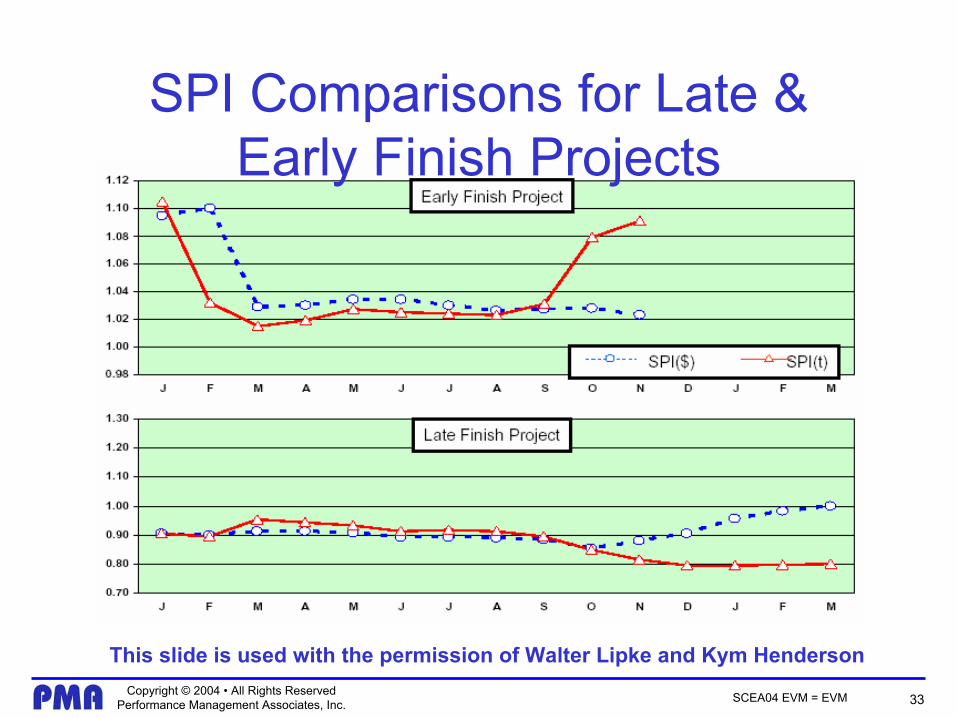
◆ Yes, these are close, but look at the next slide▲ The data are for two actual projects, not our example▲ Notice the correlation between the two until later▲ In the later stages the difference between the time-based SPI
and the traditional one, becomes apparent.
767.0===10.07.67
DurationActualScheduleEarned SPI t
0.75972,50055,000
BCWSBCWP SPI ===
33Copyright © 2004 • All Rights Reserved
Performance Management Associates, Inc. SCEA04 EVM = EVM
SPI Comparisons for Late & Early Finish Projects
This slide is used with the permission of Walter Lipke and Kym Henderson
34Copyright © 2004 • All Rights Reserved
Performance Management Associates, Inc. SCEA04 EVM = EVM
ES Observations
◆ This concept may have better predictive utility for late finish programs, however
◆ The concept developers say that more research is needed, including▲More project data for retrospective analysis,
especially for large scale projects▲Data from Earned Schedule “early adopters”
◆ Finally, there is no substitute for analysis of the integrated project schedule
35Copyright © 2004 • All Rights Reserved
Performance Management Associates, Inc. SCEA04 EVM = EVM
So, what can we conclude from all of this?
◆ EVM isn’t a panacea (hmmm, let me think about some of those DOD and DOE programs)
◆ EVM isn’t always applicable, and where it is◆ It isn’t simple to implement, BUT◆ It is a tool that can provide added value to the project
team by▲ offering earlier visibility into project issues, which ▲ leads to the opportunity to shift the direction of undesirable
trends earlier and therefore▲ increases the likelihood of project success

36Copyright © 2004 • All Rights Reserved
Performance Management Associates, Inc. SCEA04 EVM = EVM
Thank you.
Harry Sparrow
829 Chiles AvenueSt. Helena, CA 94574