evm degradation in lte systems by rf filtering - … · the evm of an lte signal is defined as the...
TRANSCRIPT

EVM Degradation in LTE Systems by RF Filtering
|1|© 2013 Kaelus. All rights reserved.
www.kaelus.com
EVM Degradation in LTE Systems by RF Filtering
Table of Contents 1. Introduction 2
2. Definition of LTE EVM and its Estimation from RF Filter S-parameters 2
2.1. 3GPP Definition of EVM of LTE Signals 2
2.2. Calculation of EVM from RF Filter S-parameters 3
2.3. Implications for RF Filter Design 3
3. Test bench for Measurement of Filter-Induced EVM Rise 4
3.1 Equipment Setup 4
3.2 Residual EVM of Test bench 4
3.3 Dynamic Range of Test bench 5
3.4 Device Under Test (DUT) 6
4. Screenshots from Vector Signal Analyzer 8
4.1 LTE Downlink Test Signal 8
4.2 LTE Downlink Results Screen 9
4.3 LTE Uplink Test Signal 10
4.4 LTE Uplink Results Screen 11
4.5 Equalization Channel Frequency Response 12
5. Measured Results from LTE Downlink Testing 13
5.1 Introduction 13
5.2 EVM Rise vs. Receiver Synchronization Method 13
5.3 EVM Rise vs. Signal Bandwidth 14
5.4 EVM Rise vs. Carrier Power 15
5.5 EVM Rise vs. Carrier Frequency 16
5.6 Comparison of Measured Results with 3GPP EVM Requirements 16
6. Measured Results from LTE Uplink Testing 17
6.1 Introduction 17
6.2 EVM Rise vs. Carrier Power 17
6.3 EVM Rise vs. Carrier Frequency 18
7. Conclusions 19
7.1 Difference in EVM Rise Results between LTE Downlink & Uplink Signals 19
7.2 Measured EVM Rise due to RF Filter Linear Distortion 19
7.3 Synchronization Method for LTE Downlink Measurements 19
7.4 Implications for Compliance with 3GPP EVM Requirements 19
8. References 20

EVM Degradation in LTE Systems by RF Filtering
|2|© 2013 Kaelus. All rights reserved.
www.kaelus.com
1. Introduction:
This report presents the results of an investigation into the EVM rise experienced by an LTE signal as it passes through an RF band pass filter of the type found in the front end of a typical cellular Node B. Section 2 defines the meaning of EVM for LTE signals, as set out in the 3GPP standard. A method is also presented for estimating the EVM performance of RF filters based on their measured S-parameters. Section 3 describes an experimental test bench that was used to perform a variety of LTE EVM measurements on an RF filter having high levels of amplitude, phase and group delay ripple across its pass band. Section 4 presents a number of screenshots from the LTE test bench, showing the RF spectra of some typical LTE signals, and the results screen of the Vector Signal Analyzer that was used for measuring EVM. Sections 5 & 6 present the experimental results of EVM testing on an RF filter using both downlink and uplink signals respectively, under a range of different conditions. The final section of the report presents some concluding remarks about the lessons learned in the course of this investigation.
2. Definition of LTE EVM and its Estimation from RF Filter S-parameters:
2.1 3GPP Definition of EVM of LTE Signals
The EVM of an LTE signal is defined as the magnitude of the difference between a complex transmitted data symbol and an ideal reference symbol, normalized to the ideal reference signal, and averaged over a 1 ms subframe. The above definition is similar to that of other cellular standards such as WCDMA. Unlike those standards, however, the EVM of an LTE signal is measured in intervals of 180 kHz referred to as Resource Blocks. The number of Resource Blocks varies depending on the bandwidth of the LTE carrier. For example, a 1.4 MHz LTE signal contains 6 Resource Blocks, whereas a 20 MHz LTE signal contains 100 Resource Blocks. The total EVM of an LTE signal is calculated as per 3GPP TS 36.104, Annex E.7 [1]:
where EVM is the rms EVM across all Resource Blocks in the LTE signal
EVMi is the EVM measured across the i th Resource Block N is the number of Resource Blocks in the LTE signal

EVM Degradation in LTE Systems by RF Filtering
|3|© 2013 Kaelus. All rights reserved.
www.kaelus.com
2.2 Calculation of EVM from RF Filter S-parameters
During the filter design process it is often desirable to be able to calculate the EVM of a filter in order to determine whether it meets the customer’s requirement specification. This can be achieved using a modification of the method described by Pimingsdorfer et al [2], which enables the EVM contribution of a filter to be estimated from its complex transmission coefficient S21. Using this method the EVM of the i th Resource Block can be calculated as follows:
Where ∆α is the effective magnitude ripple across the i th Resource Block of the
filter’s pass band, defined as the rms deviation of the filter’s insertion loss from the rms insertion loss, normalized to the rms insertion loss.
∆ø is the effective phase ripple across the i th Resource Block of the filter’s pass band, defined as the rms deviation of the filter’s phase response from the ideal linear (least squares) phase response.
The total EVM is then determined by calculating the rms value of the EVM of all Resource Blocks as per Equation 1. 2.3 Implications for RF Filter Design
When applying Equations 1 and 2 to measured or simulated filter S-parameters, it quickly becomes evident that the impact of RF filtering on the EVM performance of LTE systems should be almost negligible in practice. This is due to the fact that the bandwidth of a Resource Block tends to be very small relative to the bandwidth of a typical RF filter. As a result the amount of amplitude and phase distortion that is observed across one Resource Block tends to be small. This should lead to very low total EVM figures (typically less than 0.5%), even for filters with exceptionally steep roll-off characteristics. The accuracy of this prediction will be explored in the following sections.
EVM Degradation in LTE Systems by RF Filtering
|4|© 2013 Kaelus. All rights reserved.
www.kaelus.com
3. Test bench for Measurement of Filter–Induced EVM Rise:
3.1 Equipment Setup
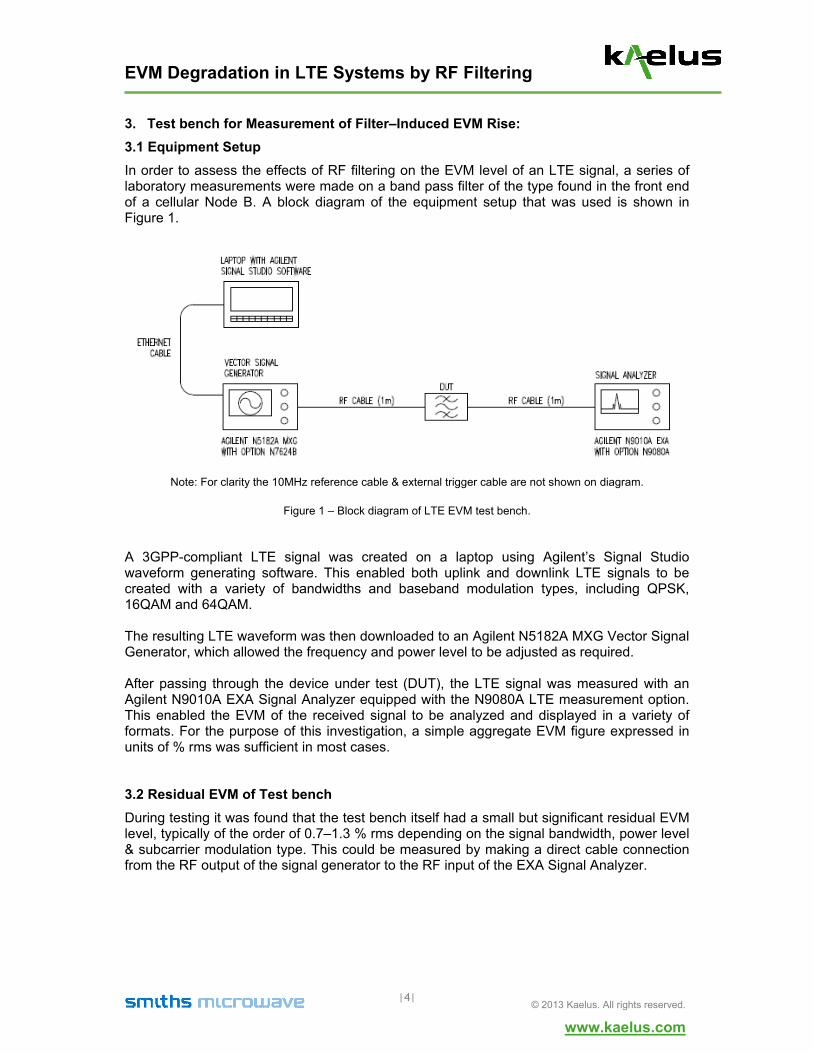
In order to assess the effects of RF filtering on the EVM level of an LTE signal, a series of laboratory measurements were made on a band pass filter of the type found in the front end of a cellular Node B. A block diagram of the equipment setup that was used is shown in Figure 1.
Note: For clarity the 10MHz reference cable & external trigger cable are not shown on diagram.
Figure 1 – Block diagram of LTE EVM test bench.
A 3GPP-compliant LTE signal was created on a laptop using Agilent’s Signal Studio waveform generating software. This enabled both uplink and downlink LTE signals to be created with a variety of bandwidths and baseband modulation types, including QPSK, 16QAM and 64QAM. The resulting LTE waveform was then downloaded to an Agilent N5182A MXG Vector Signal Generator, which allowed the frequency and power level to be adjusted as required. After passing through the device under test (DUT), the LTE signal was measured with an Agilent N9010A EXA Signal Analyzer equipped with the N9080A LTE measurement option. This enabled the EVM of the received signal to be analyzed and displayed in a variety of formats. For the purpose of this investigation, a simple aggregate EVM figure expressed in units of % rms was sufficient in most cases. 3.2 Residual EVM of Test bench
During testing it was found that the test bench itself had a small but significant residual EVM level, typically of the order of 0.7–1.3 % rms depending on the signal bandwidth, power level & subcarrier modulation type. This could be measured by making a direct cable connection from the RF output of the signal generator to the RF input of the EXA Signal Analyzer.

EVM Degradation in LTE Systems by RF Filtering
|5|© 2013 Kaelus. All rights reserved.
www.kaelus.com
In order to prevent the test bench residual EVM from introducing errors into measurements on the DUT, the residual EVM was measured at every frequency, power level, signal bandwidth and modulation scheme of interest. These residual levels were then subtracted from all subsequent EVM measurements on the DUT. Hence, the EVM results presented in this report are actually “EVM rise” results, i.e. change in EVM from residual level. A typical screenshot of the test bench residual EVM is shown in Figure 2. It shows the measured EVM for each of the 50 Resource Blocks in an LTE downlink signal with 10 MHz bandwidth and 64QAM modulation on all subcarriers. The total residual EVM is simply the rms value of the individual Resource Block EVMs, as described in Section 2.1.
Figure 2 – Residual EVM of LTE test bench for LTE downlink signal with 10 MHz bandwidth and 64QAM subcarrier modulation.
3.3 Dynamic Range of Test bench
One of the limitations of the LTE test bench was that the Agilent vector signal analyzer could only measure EVM over a relatively small range of signal power levels without adversely affecting the residual EVM of the test setup. For example, at a carrier power level of 0 dBm the test bench residual EVM was 0.53% for a 10 MHz LTE downlink signal with 64QAM subcarrier modulation. By contrast, at a carrier power of −30 dBm the same signal yielded a residual EVM of 7.8%. Below this power level the residual EVM became even worse, and was much more variable from measurement to measurement. This made it impossible to discern the contribution of the device under test to the overall system EVM. The low dynamic range of the Signal Analyzer may be explained by the fact that it is intended primarily for use as a transmitter tester for evaluating the quality of an LTE signal prior to transmission over a radio link. It is not intended to emulate the low noise figure and high sensitivity of an actual LTE receiver. Consequently, most of the results presented in this report were made at power levels around 0 dBm (except where otherwise indicated) where the residual EVM of the test bench was lowest.

EVM Degradation in LTE Systems by RF Filtering
|6|© 2013 Kaelus. All rights reserved.
www.kaelus.com
3.4 Device Under Test (DUT)
In order to assess the impact of RF filtering on EVM, a filter was needed that provided high levels of linear distortion. This term refers to filter-induced variations in signal amplitude, phase and/or group delay with frequency. The device under test (DUT) that was chosen for this investigation was a Triasx DDF0035F1V1 ceramband passes filter with a very steep roll-off above the Tx band. The pass band was tuned to 875–889.6 MHz, while the attenuation was over 80 dB at 891.6 MHz. This filter is used in an 850MHz network to prevent out of band transmitter interference falling into the uplink of co-located GSM base stations. Some network analyzer screenshots of the frequency response of this filter are shown in Figure 3 over the page. The key linear distortion characteristics are summarized in Table 1. Only the worst-case results are presented; these were measured in a 10 MHz bandwidth located at the extreme upper bandedge of the filter pass band, where the amplitude, phase & group delay variations were greatest.

EVM Degradation in LTE Systems by RF Filtering
|7|© 2013 Kaelus. All rights reserved.
www.kaelus.com
Insertion Loss & Return Loss:
Return Loss and Group Delay:
Figure 3 – Frequency response of filter used in LTE EVM testing.
Parameter Value Insertion loss variation per 10 MHz 0.71 dB p-p Phase ripple per 10 MHz 175.7° p-p RMS phase error per 10 MHz 49.5°Group delay variation per 10 MHz 445.5 ns p-p
Table 1 – Worst-case measured linear distortion of filter used in LTE EVM testing.

EVM Degradation in LTE Systems by RF Filtering
|8|© 2013 Kaelus. All rights reserved.
www.kaelus.com
4. Screenshots from Vector Signal Analyzer:
4.1 LTE Downlink Test Signal
The spectrum of a typical LTE downlink signal is shown in Figure 4. The signal has 10 MHz bandwidth and 64QAM modulation on all subcarriers. This screenshot was taken without the DUT present, using a direct cable connection from the signal generator to the signal analyzer.
Figure 4 – Spectrum of LTE downlink signal with 10 MHz bandwidth and 64QAM subcarrier modulation. The CCDF of the above signal is shown in Figure 5. The statistical properties of the signal are very similar to white noise (shown as grey curve on the same plot). However, the peak to average ratio is somewhat higher, having a maximum value of 11.1 dB. A high peak to average ratio is one of the defining characteristics of OFDMA, the modulation scheme used in the LTE downlink.
Figure 5 – CCDF of LTE downlink signal with 10 MHz bandwidth and 64QAM subcarrier modulation.

EVM Degradation in LTE Systems by RF Filtering
|9|© 2013 Kaelus. All rights reserved.
www.kaelus.com
4.2 LTE Downlink Results Screen
A screenshot of the Vector Signal Analyzer results screen is shown in Figure 6. It shows the key characteristics of an LTE downlink signal after passing through the DUT.
Figure 6 – Results of EVM testing on DUT using LTE downlink signal with 10 MHz bandwidth and 64QAM subcarrier modulation.
The top left quadrant of the above screenshot is the composite constellation of the received LTE signal. It contains several hundred distinct 64QAM constellations representing the user data symbols, all superimposed onto the same set of axes. It also contains the constellations of the various control signals. The top right quadrant of the above screenshot is a frame summary, showing the EVM, relative power level and modulation format of each type of signal in the LTE carrier. The bottom left quadrant shows the RF spectrum and total power of the received LTE signal. The bottom right quadrant is an error summary window, showing the various types of error in the received signal and the correction factors used by the receiver. For the purposes of this investigation, the most commonly used result was the aggregate EVM figure at the top of this window, which takes into account the EVM of every type of subcarrier in the LTE signal.

EVM Degradation in LTE Systems by RF Filtering
|10|© 2013 Kaelus. All rights reserved.
www.kaelus.com
4.3 LTE Uplink Test Signal
The RF spectrum of a typical LTE uplink signal is shown in Figure 7. The signal has 10 MHz bandwidth and 64QAM modulation on all subcarriers. This screenshot was taken without the DUT present, using a direct cable connection from the signal generator to the signal analyzer.
Figure 7 – RF spectrum of LTE uplink signal with 10 MHz bandwidth and 64QAM subcarrier modulation. The CCDF of the uplink signal is shown in Figure 8. The peak to average ratio is only 8.7 dB, in contrast to the downlink signal which reached 11.1 dB. This is because the LTE uplink uses SC-FDMA modulation, which is designed to reduce the PAR of the transmitted signal in order to improve power amplifier efficiency and thereby extend handset battery life.
Figure 8 - CCDF of LTE uplink signal with 10 MHz bandwidth and 64QAM subcarrier modulation.

EVM Degradation in LTE Systems by RF Filtering
|11|© 2013 Kaelus. All rights reserved.
www.kaelus.com
4.4 LTE Uplink Results Screen
A screenshot of the Vector Signal Analyzer results screen is shown in Figure 6. It shows the key characteristics of an LTE uplink signal after passing through the DUT. The information presented is virtually identical to the downlink example given in Section 4.2, although the instrument must be configured slightly differently in order to handle uplink signals. Note that the constellation diagram is still a composite constellation, containing dozens if not hundreds of individual constellations superimposed on top of each other. This is despite the fact that only a single user is transmitting; multiple data symbols are still sent simultaneously on separate subcarriers.
Figure 9 - Results of EVM testing on DUT using LTE uplink signal with 10 MHz bandwidth and 64QAM modulation.

EVM Degradation in LTE Systems by RF Filtering
|12|© 2013 Kaelus. All rights reserved.
www.kaelus.com
4.5 Equalization Channel Frequency Response
A screenshot of the Equalization Channel frequency response is presented in Figure 10. It shows the amplitude, phase and group delay characteristics of the DUT as determined by the LTE channel estimation process. The channel estimation process entails embedding a set of pilot tones of known amplitude and phase characteristics into the LTE signal. The receiver can then analyze the properties of the received pilot tones and determine the frequency response of the radio channel. The main motivation for this is to combat the effects of multipath fade in a built-up environment. However, it is also extremely effective at removing the effects of linear distortion introduced by RF filters, thereby preventing these components from degrading the EVM performance of the system. Consequently, the very low EVM rise results that are reported in the following sections are due almost entirely to the channel estimation feature of the LTE standard.
Figure 10 - Frequency response of DUT as determined by LTE equalizer.

EVM Degradation in LTE Systems by RF Filtering
|13|© 2013 Kaelus. All rights reserved.
www.kaelus.com
5. Measured Results from LTE Downlink Testing:
5.1 Introduction
This section presents the results of experiments performed with LTE downlink signals under a range of conditions. All experiments were performed with the same DUT, namely the ceramic band pass filter described in Section 3.3. 5.2 EVM Rise vs. Receiver Synchronization Method
The EVM rise experienced by LTE downlink signals after passing through the DUT was found to depend greatly on which synchronization option was chosen on the Agilent EXA Signal Analyzer. The options were:
• P-SS – Primary Synchronization Signal, or • RS – Reference Signal
P-SS synchronization gave relatively poor results, as shown below in Figure 11. While the measured EVM rise was small for filters with phase ripple less than 30° peak-to-peak, as the phase ripple increased beyond this level the EVM increased rapidly and the signal was quickly lost. RS synchronization gave excellent results. The measured EVM rise was less than 0.8% rms in most cases, irrespective of filter insertion loss variation, phase ripple or group delay variation. Furthermore, EVM rise was found to be almost completely independent of signal frequency, bandwidth, and subcarrier modulation type. For this reason all the downlink results presented in the following sections were performed using RS synchronization.
EVM of LTE Downlink Signal vs. Carrier Frequency for Different Sync Options (Signal Bandwidth = 10 MHz, Subcarrier Modulation = 64QAM, Source Power = 0 dBm)
Centre Frequency of LTE Carrier (MHz)
Figure 11 - EVM of LTE downlink signal vs. carrier frequency after passing through DUT, measured with both P-
SS and RS sync options on EXA Signal Analyzer.

EVM Degradation in LTE Systems by RF Filtering
|14|© 2013 Kaelus. All rights reserved.
www.kaelus.com
5.3 EVM Rise vs. Signal Bandwidth
An LTE signal can occupy one of several bandwidths, including 1.4, 3, 5, 10, 15 and 20 MHz. The results of EVM testing with a selection of these bandwidths are presented in Figure 12. In each test case the carrier frequency of the LTE signal was set so that the signal was aligned with the extreme upper band edge of the DUT, where the linear distortion was greatest. From Figure 12 it can be seen that the EVM rise was very low in all cases. By far the worst result was the 15 MHz bandwidth case, with an EVM rise of 1%. However, this was probably due to the fact that the bandwidth of the signal (15 MHz) was greater than the bandwidth of the DUT (14.6 MHz), causing part of the signal’s spectrum to be rejected by the DUT. As a result a higher EVM reading is not surprising. The EVM results for the other signal bandwidths show a clear trend: the wider the bandwidth of the signal, the lower the measured EVM rise. This can be explained by the fact that for a narrowband LTE signal, a greater proportion of the signal’s Resource Blocks lies near the band edge of the DUT, where the linear distortion is greatest. As a result the average Resource Block EVM level will be higher, leading to a higher EVM level for the signal as a whole. By contrast, wider bandwidth LTE signals have a lower proportion of their Resource Blocks near the band edge of the DUT. This means that the average Resource Block EVM level will be lower, yielding a lower overall EVM level.
EVM Rise of LTE Downlink Signal vs. Bandwidth (Subcarrier Modulation = 64QAM, Source Power = 0 dBm)
LTE Signal Bandwidth (MHz)
Figure 12 - EVM rise of LTE downlink signal for a range of signal bandwidths. Carrier frequency was adjusted
before each test to ensure that signal was located at extreme upper band edge of pass band of DUT.

EVM Degradation in LTE Systems by RF Filtering
|15|© 2013 Kaelus. All rights reserved.
www.kaelus.com
5.4 EVM Rise vs. Carrier Power
Figure 13 displays the results of a power sweep that was performed with a 10 MHz bandwidth LTE downlink signal, for three different types of subcarrier modulation. The measured EVM rise was low in all cases, and generally did not vary significantly with subcarrier modulation type. The best results were observed at carrier powers above −20 dBm, where the EVM rise was 0.2% or less. As the carrier power dropped below –20 dBm, the EVM increased steadily. The worst result was 0.8%, which was recorded at –30 dBm carrier power with 64QAM modulation. These results can be explained by the fact that as carrier power is reduced, the signal-to-noise ratio of the LTE signal decreases. Furthermore, it can be shown that for digitally modulated signals, EVM varies inversely with the square root of SNR [3]. Therefore a decrease in SNR will produce a commensurate rise in EVM. Note that EVM degradation due to poor SNR is not something that can be compensated for by the LTE channel estimation process. This is because the channel estimation process is designed to account for fixed (or at least, slowly varying), linear variations in the frequency response of the radio channel. It cannot account for fast, transient errors caused by random noise sources.
EVM Rise of LTE Downlink Signal vs. Carrier Power (Signal Bandwidth = 10 MHz, Centre Freq = 884.6 MHz)
Carrier Power (dBm)
Figure 13 - EVM rise of a 10 MHz LTE downlink signal for a range of carrier power levels and subcarrier
modulation types.
EVM Degradation in LTE Systems by RF Filtering
|16|© 2013 Kaelus. All rights reserved.
www.kaelus.com
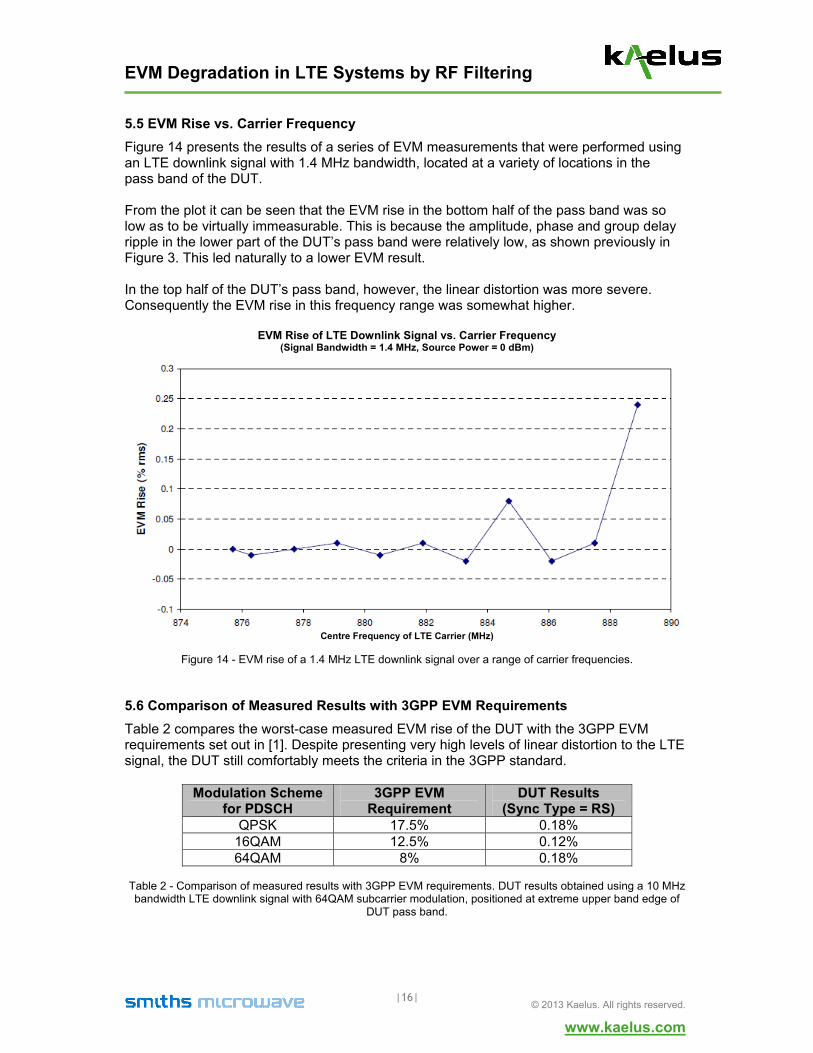
5.5 EVM Rise vs. Carrier Frequency
Figure 14 presents the results of a series of EVM measurements that were performed using an LTE downlink signal with 1.4 MHz bandwidth, located at a variety of locations in the pass band of the DUT. From the plot it can be seen that the EVM rise in the bottom half of the pass band was so low as to be virtually immeasurable. This is because the amplitude, phase and group delay ripple in the lower part of the DUT’s pass band were relatively low, as shown previously in Figure 3. This led naturally to a lower EVM result. In the top half of the DUT’s pass band, however, the linear distortion was more severe. Consequently the EVM rise in this frequency range was somewhat higher.
EVM Rise of LTE Downlink Signal vs. Carrier Frequency
(Signal Bandwidth = 1.4 MHz, Source Power = 0 dBm)
Centre Frequency of LTE Carrier (MHz)
Figure 14 - EVM rise of a 1.4 MHz LTE downlink signal over a range of carrier frequencies.
5.6 Comparison of Measured Results with 3GPP EVM Requirements
Table 2 compares the worst-case measured EVM rise of the DUT with the 3GPP EVM requirements set out in [1]. Despite presenting very high levels of linear distortion to the LTE signal, the DUT still comfortably meets the criteria in the 3GPP standard.
Modulation Scheme for PDSCH
3GPP EVM Requirement
DUT Results (Sync Type = RS)
QPSK 17.5% 0.18% 16QAM 12.5% 0.12% 64QAM 8% 0.18%
Table 2 - Comparison of measured results with 3GPP EVM requirements. DUT results obtained using a 10 MHz bandwidth LTE downlink signal with 64QAM subcarrier modulation, positioned at extreme upper band edge of
DUT pass band.

EVM Degradation in LTE Systems by RF Filtering
|17|© 2013 Kaelus. All rights reserved.
www.kaelus.com
6. Measured Results from LTE Uplink Testing:
6.1 Introduction
This section presents the results of experiments performed with LTE uplink signals under a range of conditions. All experiments were performed with the same DUT, namely the ceramic band pass filter described in Section 3.3. The measured EVM rise in LTE uplink signals was invariably found to be extremely low, less than 0.7% rms in all cases, irrespective of filter insertion loss variation, phase ripple or group delay variation. Furthermore, the EVM rise in LTE uplink signals was found to be almost completely independent of signal frequency and subcarrier modulation type. 6.2 EVM Rise vs. Carrier Power
Figure 15 displays the results of a power sweep that was performed with a 10 MHz bandwidth LTE uplink signal, for three different types of subcarrier modulation. The measured EVM rise was low in all cases, and did not appear to vary significantly with subcarrier modulation type. The best results were observed at carrier powers above –15 dBm, where the EVM rise was less than 0.2%. As the carrier power dropped below –15 dBm, the EVM increased steadily. The worst result was 0.61%, which was recorded at –30 dBm carrier power with 16QAM modulation. As discussed in Section 5.4, these results can be explained by the fact that as carrier power is reduced, the signal-to-noise ratio of the LTE signal decreases. This leads to an increase in the measured EVM, which cannot be compensated for by the LTE channel estimation process.
EVM Rise of LTE Uplink Signal vs. Carrier Power (Signal Bandwidth = 10 MHz, Centre Freq = 884.6 MHz)
Carrier Power (dBm)
Figure 15 - EVM rise of a 10 MHz LTE uplink signal for a range of carrier power levels and subcarrier
modulation types.

EVM Degradation in LTE Systems by RF Filtering
|18|© 2013 Kaelus. All rights reserved.
www.kaelus.com
6.3 EVM Rise vs. Carrier Frequency
Figure 16 presents the results of a series of EVM measurements that were performed using an LTE uplink signal with 10 MHz bandwidth, located at a variety of locations in the pass band of the DUT, using three different subcarrier modulation types. It is clear that the EVM rise at each of the measured frequencies was very low, under 0.2% in all cases. The results do not appear to vary significantly with subcarrier modulation type. Interestingly, the distribution of EVM values is somewhat different to those presented in Section 5.5, which involved a 1.4 MHz bandwidth downlink signal. The difference is presumably due to the different signal bandwidths that were used in the two experiments. It is also conceivable that the different modulation schemes used in the downlink and uplink directions influenced the result (OFDMA for the downlink, SC-FDMA for the uplink). Either way, the differences between the downlink & uplink results for this experiment were small, and the absolute EVM rises in both cases were so small as to be virtually insignificant from a system point of view.
EVM Rise of LTE Uplink Signal vs. Carrier Frequency (Signal Bandwidth = 10 MHz, Source Power = 0 dBm)
Centre Frequency of LTE Carrier (MHz)
Figure 16 - EVM rise of a 10 MHz LTE uplink signal over a range of carrier frequencies.

EVM Degradation in LTE Systems by RF Filtering
|19|© 2013 Kaelus. All rights reserved.
www.kaelus.com
7. Conclusions:
7.1 Difference in EVM Rise Results between LTE Downlink & Uplink Signals
The difference in the EVM rise that is observed with LTE downlink signals is virtually indistinguishable from that obtained with LTE uplink signals. As a result the conclusions presented below apply equally to both downlink and uplink signals, except where stated otherwise. 7.2 Measured EVM Rise due to RF Filter Linear Distortion
1. In general the observed EVM rise in an LTE signal that has passed through an RF filter is very low, typically only a few tenths of a percent. This is true even for filters with exceptionally high levels of in-band linear distortion.
2. The type of subcarrier modulation that is applied to an LTE signal has a negligible impact on the EVM rise caused by an RF filter.
3. The measured EVM rise in an LTE signal due to RF filtering is influenced very slightly by the bandwidth of the signal. The narrower the bandwidth of the signal, the greater the EVM rise. This trend is most noticeable when the signal is located close to the upper or lower band edge of the filter, where the linear distortion tends to be greatest.
4. The measured EVM rise in an LTE signal due to RF filtering is influenced very slightly by the location of the signal in the filter’s pass band. In general, LTE signals that are located at frequencies where the filter’s amplitude/phase/group delay ripple are high will suffer greater EVM rises than signals located in more linear regions of the pass band.
5. The measured EVM rise in an LTE signal due to an RF filter increases rapidly as the signal moves out of the filter’s pass band. This is true even if a small proportion of the signal’s spectrum lies outside the pass band.
6. The measured EVM rise in an LTE signal increases as the carrier power decreases. This is not caused by the presence of an RF filter, but is rather a consequence of the reduction in signal to noise ratio due to limited receiver dynamic range that occurs at lower power levels, which in turn adversely affects EVM performance.
7.3 Synchronization Method for LTE Downlink Measurements
For best results the EVM rise of an LTE downlink signal should be measured by synchronizing to the Reference Signal (RS), not the Primary Synchronization Signal (P-SS). If this is not possible then the measured EVM rise may be much larger than would otherwise be the case, and the linearity specifications of the RF filter may have to be tightened considerably. 7.4 Implications for Compliance with 3GPP EVM Requirements
The results of this investigation suggest that the contribution of RF filtering to the overall EVM performance of an LTE system is extremely low, typically only a few tenths of a percent. This is true even for filters with large amounts of linear distortion in their pass bands. Consequently the presence of RF filters in an LTE transceiver should not adversely affect the ability of the system to meet the EVM requirements set out in the 3GPP standard.

EVM Degradation in LTE Systems by RF Filtering
|20|© 2013 Kaelus. All rights reserved.
www.kaelus.com
8. References:
1. LTE: Evolved Universal Terrestrial Radio Access (E-UTRA) – Base Station (BS) radio transmission and reception; 3GPP TS 36.104 version 8.4.0 Release 8.
2. Impact of SAW RF and IF Filter Characteristics on UMTS Transceiver Performance; Pimingsdorfer, D. et al; 1999 IEEE Ultrasonics Symposium; pp. 365–368.
3. On the Error Vector Magnitude as a Performance Metric and Comparative Analysis; Shafik, R. A. et al; 2006 IEEE 2nd International Conference on Emerging Technologies; pp. 27–31.
Americas +1.303.768.8080 Asia Pacific, Africa +61.(0).7.3907.1200 China +86.21.6084.2200 Europe, Middle East, India +44 (0) 1383 437920 [email protected]
Rev_B_8.31.11