evidence from the frbny puerto rico small business … · evidence from the frbny puerto rico small...
TRANSCRIPT
IEvidence from the FRBNY Puerto Rico Small Business Survey | Regional Perspectives on Puerto Rico Small Business
Evidence from the FRBNY Puerto Rico Small Business Survey
REGIONAL PERSPECTIVES ON PUERTO RICO SMALL BUSINESS
Kausar Hamdani, SVP and Senior Advisor
Claire Kramer Mills, AVP and Community Affairs Officer
Javier Silva, Associate Director
Jessica Battisto, Analyst
Scott Lieberman, Sr. Analyst
Sanjay Sudhir, Analyst
Evidence from the FRBNY Puerto Rico Small Business Survey
REGIONAL PERSPECTIVES ON PUERTO RICO SMALL BUSINESS
Preface 2
Acknowledgments 3
Regional Data Highlights 4
About the Respondents 4
Credit Experience of Non-Applicants 8
Credit Experience of Applicants 10
Training and Growth 16
About the Data 20
Survey Questionnaire 22
Appendix 26
CONTENTS
2Evidence from the FRBNY Puerto Rico Small Business Survey | Regional Perspectives on Puerto Rico Small Business
PREFACE
In our first report, Evidence from the Federal Reserve Bank of New York Puerto Rico Small Business Survey 2016, we presented aggregated results for the Commonwealth. The picture that emerged highlighted interesting dynamics within the small business community. An obvious next step was to examine the survey data by geographic area. Firms located in different parts of the island may have differing growth opportunities, varying business needs or otherwise exhibit regional differences. Indeed, we had anticipated regional dif-ferences and allowed for that possibility in our survey methodology. (See About the Data for details.)
This report, Puerto Rico Small Business Regional Profiles 2016, presents the survey data through a regional lens. For practical reasons, the survey data were disag-gregated to group the island municipios into two areas: the greater Puerto Rico North Central Metro area and the Rest of Puerto Rico.
In the attached report, we present the results using a similar format as the first report, Evidence from the
Federal Reserve Bank of New York Puerto Rico Small Business Survey 2016. In other words, we use the same variables and visual layout to present the results for the greater Puerto Rico North Central Metro area and the Rest of Puerto Rico as we did for Puerto Rico as a whole. Our intention is to allow the interested reader to get a perspective on the small business com-munity for the island as a whole as well as its two sub-component parts.
The 2016 survey was a pilot effort. We thank our part-ners for making it an impressive success. The participa-tion of the small business community was exceptional, making us the envy of other survey colleagues. Going forward, as we broaden our network of distribution partners and retain our high response rates, we hope to have even better coverage, which may allow us to produce even more detailed and targeted reports.
We welcome feedback for future improvements and encourage new organizations to join our distribution partner network to make the 2017 Survey even better.
Kausar Hamdani, Ph.D. | SVP and Senior Advisor Claire Kramer Mills, Ph.D. | AVP and Community Affairs OfficerJavier Silva | Associate Director
3Evidence from the FRBNY Puerto Rico Small Business Survey | Regional Perspectives on Puerto Rico Small Business
ACKNOWLEDGMENTS
We wish to thank the many individual in Puerto Rico who helped make the Puerto Rico Small Business Survey a reality. They generously shared their time and expertise to sharpen the focus on local needs, and helped recruit respondents from their membership without whom this survey would not have been possible. The conversations deepened our knowledge of the island; make new friends and partners; and better understand the challenges being faced by the business community. That said, in no way do these individuals or their organizations bear responsibility for any remaining shortcomings.
We particularly wish to thank the following people and their organizations for valuable input into the survey questionnaire and assisted in recruiting respondents from their membership:
� Vanessa Alvarado, Executive Director, Sociedad para la Geren-cia de los Recursos Humanos Capítulo de Puerto Rico
� Teresa Berrios, Project Director, Minority Business Develop-ment Center
� Laura Cantero, Executive Director and Garbiela Alvarez, Strategic Development Manager, Grupo Guayacan, Inc.
� Yvette T. Collazo Reyes, District Director; Maria De Jesus, Deputy District Director; Angelique Adjutant, Public Affairs Officer; PR and USVI District Office, US Small Business Administration
� CPA Edna Jimenez, Executive Director; CPA Jose Orta, President Elect; CPA Luis Zayas, President; and, CPA Zulmarie Urrutia, past-President; Colegio de Contadores Públicos Autorizados de Puerto Rico
� Mario Marazzi, Executive Director, Instituto de Estadísticas de Puerto Rico
� Carmen Marti, Executive Director, Puerto Rico Small Business & Technology Development Centers
� Wanda Marrero, former Director, Research Division, Compañía de Comercio y Exportación
� Jorge Marti Peña, former Executive Vice President, Economic Development Bank for Puerto Rico
� Annette Montoto, President, Microfinanzas Puerto Rico
� Ramón A. Pérez Blanco, President, Hecho en Puerto Rico
� Vannessa Piñeiro Montes, Vice President and CRA Compliance Manager, Banco Popular de Puerto Rico
� Rubén Piñero, President, Centro Unido de Detallistas
� Giovanna Piovanetti, President, Corporación para el Financiamiento Empresarial del Comercio a las Comunidades
� Manuel Reyes, President, Camara de Mercadeo, Industria y Distribución de Alimentos
� Jose Villamil, President, Estudios Tecnicos, Inc.
� Javier Zapata, Deputy Director, Pathstone, Inc.
We also thank our colleagues at the Federal Reserve Bank of New York who are members of the Puerto Rico Working Group, especially Jason Bram, Research Officer, for their input. Our colleagues Jessica Battisto and Scott Lieberman of the Outreach & Education team provided excellent data assistance; Krista Schmidt of the Digital Strategy team helped vet the report for the website; and Namrata Kalola for the design, graphics and the layout of the volume. An e-version of this volume is available at www.nyfed.org/outreach-and-education.
The views presented here are those of the authors and do not necessarily reflect the position of the Federal Reserve Bank of New York or the Federal Reserve System.
4Evidence from the FRBNY Puerto Rico Small Business Survey | Regional Perspectives on Puerto Rico Small Business
REGIONAL DATA HIGHLIGHTS
Employing more than 80 percent of private sector work-ers, small businesses are a mainstay of Puerto Rico’s economy.1 The Federal Reserve Bank of New York’s inaugural Puerto Rico Small Business Survey Report, issued in November 2016, presented data on Puerto Rico’s small business sector, its credit demand and challenges, and training needs. While an aggregate view of the sector is helpful for understanding general trends, it is well understood that small firms are diverse and that a more micro perspective is critical for practitioners and service providers. Hence this new report, Regional Perspectives on Puerto Rico Small Business, takes a disaggregated look at the data through a regional lens. In this report, we divide the overall survey data into two regional groups: the greater Puerto Rico North Central Metro (PR-NCM) area and the Rest of Puerto Rico (RoPR). As the subsequent charts and graphs illustrate, there are notable similarities and differences between the areas.
Before reviewing regional patterns, here is a brief recap of key results for the overall Puerto Rico small business sector presented in the first report:
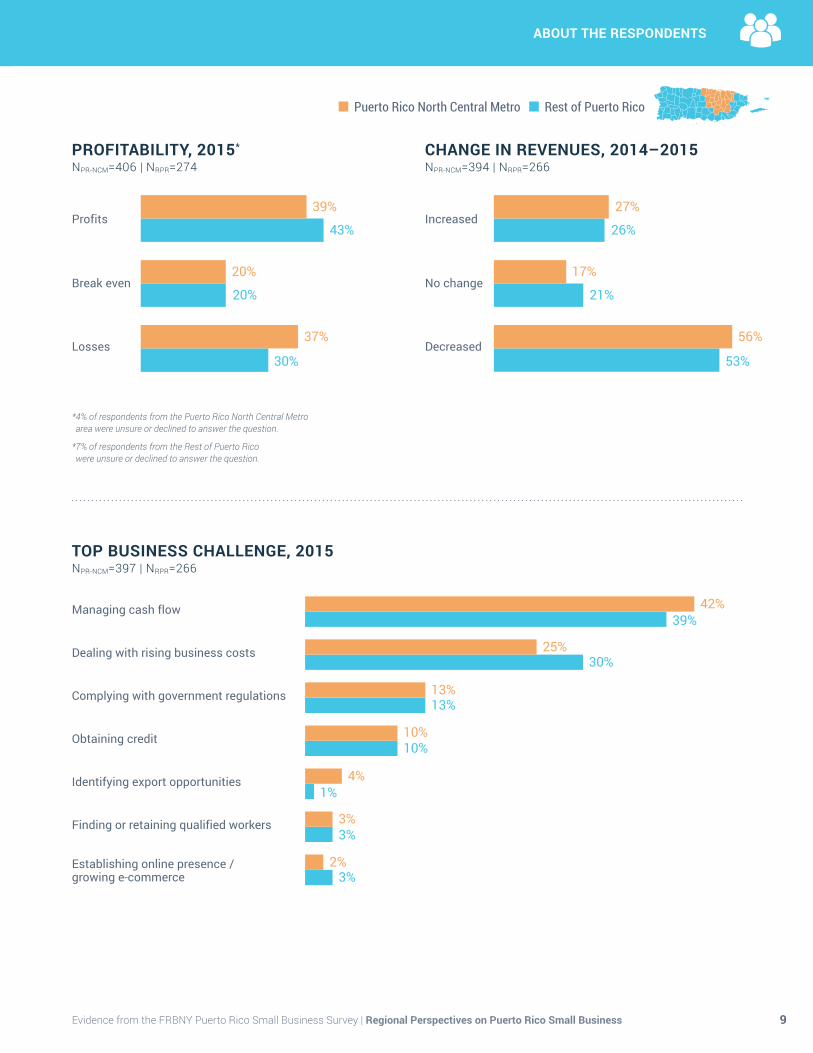
� Puerto Rico small businesses are mostly small firms, typically employing fewer than 10 workers. Additionally, 2015 was a challenging year, with 54 percent of firms reporting a decline in revenues from the previous year. The top ranked business challenge was managing cash flow.
� The demand for credit was robust. A majority of small firms applied for credit, primarily to meet operating expenses or to expand the business.
� Credit outcomes varied. Nearly 40 percent of all applicants received full funding; about 30 percent received partial funding; and roughly 30 percent received zero funding.
� The most frequently reported credit obstacles were insufficient collateral and low credit scores. The practical impact of credit denial was to delay or pass on a business opportunity or expansion, though some firms also tapped personal resources.
� Special topics for the 2016 survey focused on training and growth needs. Nearly half of all firms identified training programs to foster sales—to the federal government, via online commerce, and through exports—as their top priority. In keeping with reported funding gaps, 45 percent of firms cited improved access to capital and credit as the initiative that would have the largest growth impact on the sector.
Disaggregating the data by the two areas, the greater Puerto Rico North Central Metro (PR-NCM) area with the Rest of Puerto Rico (RoPR), here are key highlights:
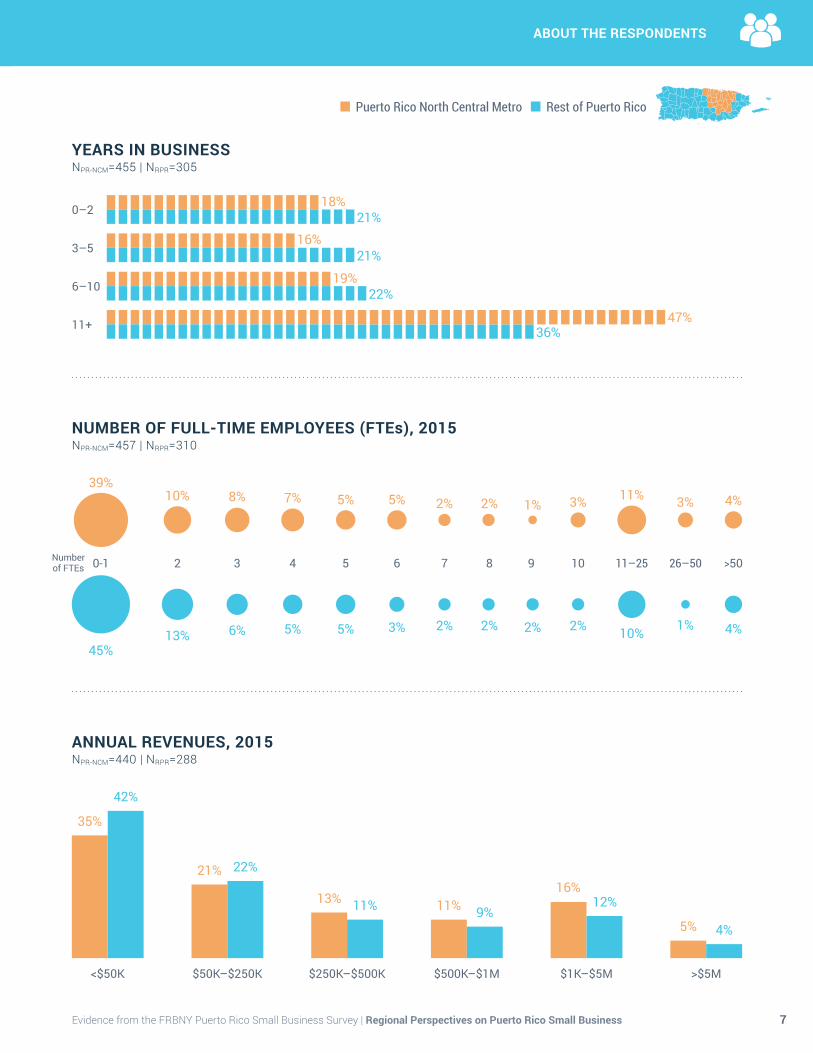
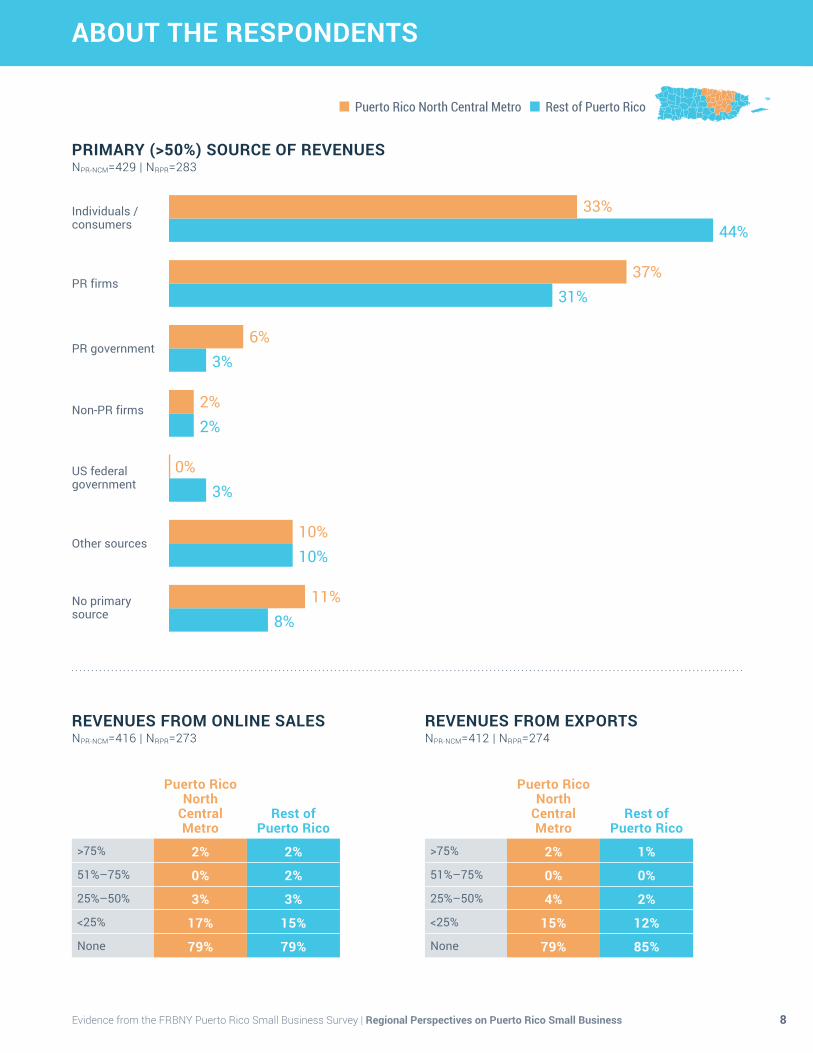
� Size, age and primary source of revenues may vary. While the distribution of firms by the number of full-time employees or total annual revenues is similar between the two areas, PR-NCM firms are longer established, with nearly half having been in business for eleven years or more. The primary sources of their revenues also differ. About 33 percent of PR-NCM firms serve primarily consumers and another 37 per-cent focus on B2B. In contrast, 44 percent of RoPR firms primarily focus on consumers and another 31 percent primarily focus on B2B.
� Business performance varied. Though a majority of firms across the island reported declining revenues in 2015, a higher share of PR-NCM firms (37 percent, versus 30 percent of RoPR firms) were not profitable in 2015.
� Demand for credit was similar. Both areas had similar credit application rates (54 percent for PR-NCM firms compared to 57 percent for RoPR firms) and similar reasons for applying for credit, namely to meet operating expenses and expand the business. Also, reflecting the regional composition of firms by size, 51 percent of RoPR firms applied for $25,000 or less in credit while PR-NCM firms sought larger amounts.
� Credit outcomes differed. Credit approval rates differed, perhaps reflecting relative differences in firm performance in the two areas. Specifically, only 36 percent of PR-NCM obtained full funding as com-pared to 43 percent for RoPR firms. Similarly, 35 percent of PR-NCM firms received zero funding as compared to 29 percent of RoPR firms.
1 “2016 Small Business Profiles for the States and Territories.” U.S. Small Business Administration Office of Advocacy. 2016.
5Evidence from the FRBNY Puerto Rico Small Business Survey | Regional Perspectives on Puerto Rico Small Business
REGIONAL DATA HIGHLIGHTS
� Reasons for not receiving full funding differed. While PR-NCM firms ranked insufficient collateral as their chief challenge, RoPR firms cited their industry, insufficient credit history, and low credit scores as the most common reasons for denial.
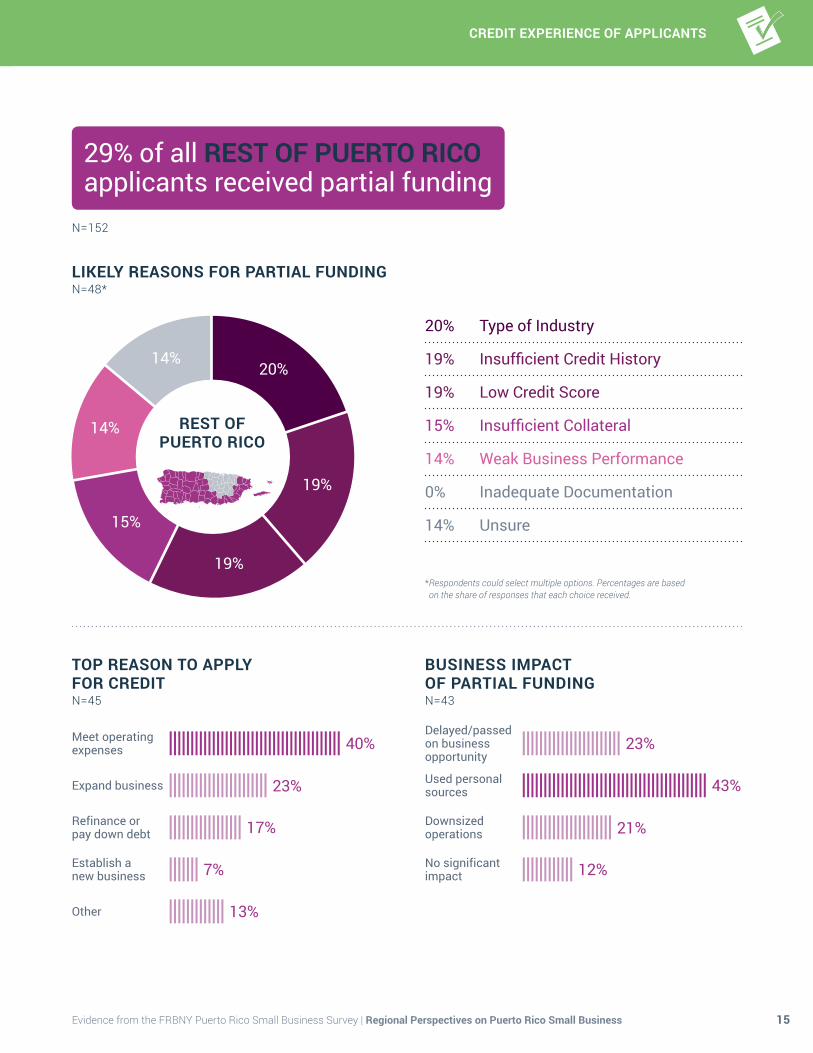
� Firm responses to partial funding may vary. The most common response to receiving less than full funding was for firms to use personal resources (35 percent in PR-NCM and 43 percent in RoPR). However, PR-NCM firms were also likely to downsize operations (31 percent) or delay business opportuni-ties (30 percent). In contrast, fewer RoPR firms were likely to downsize (21%) or delay business opportunities (23%).
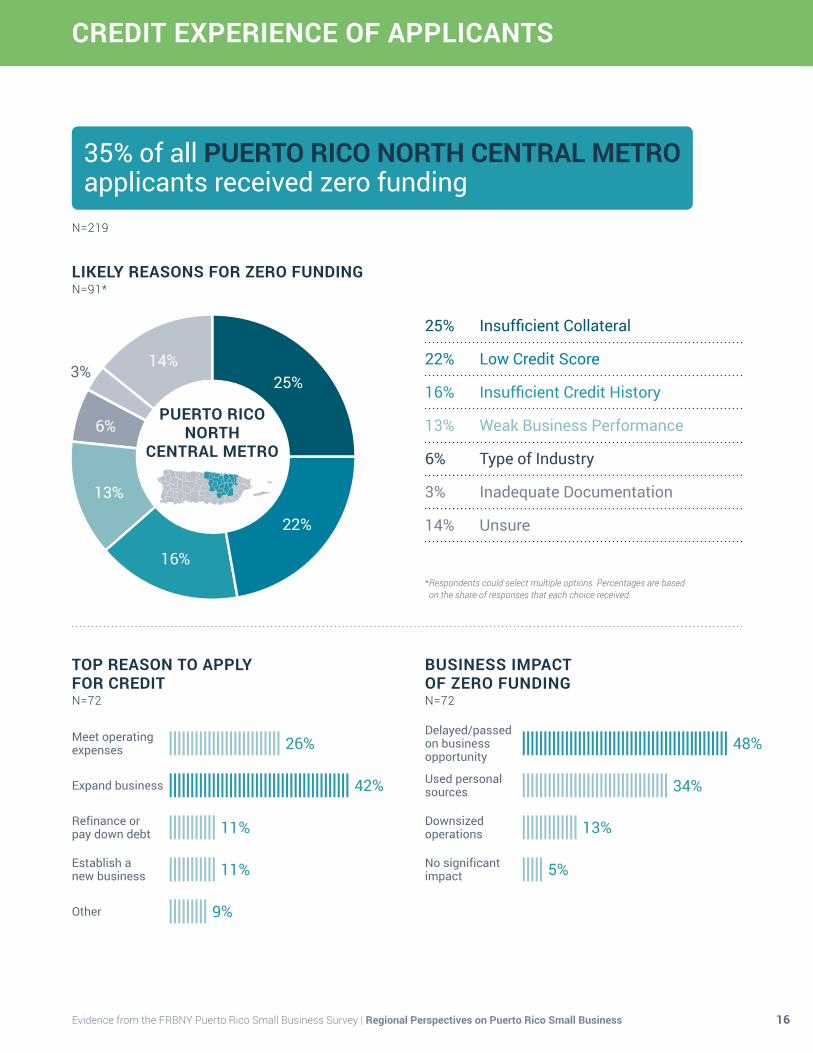
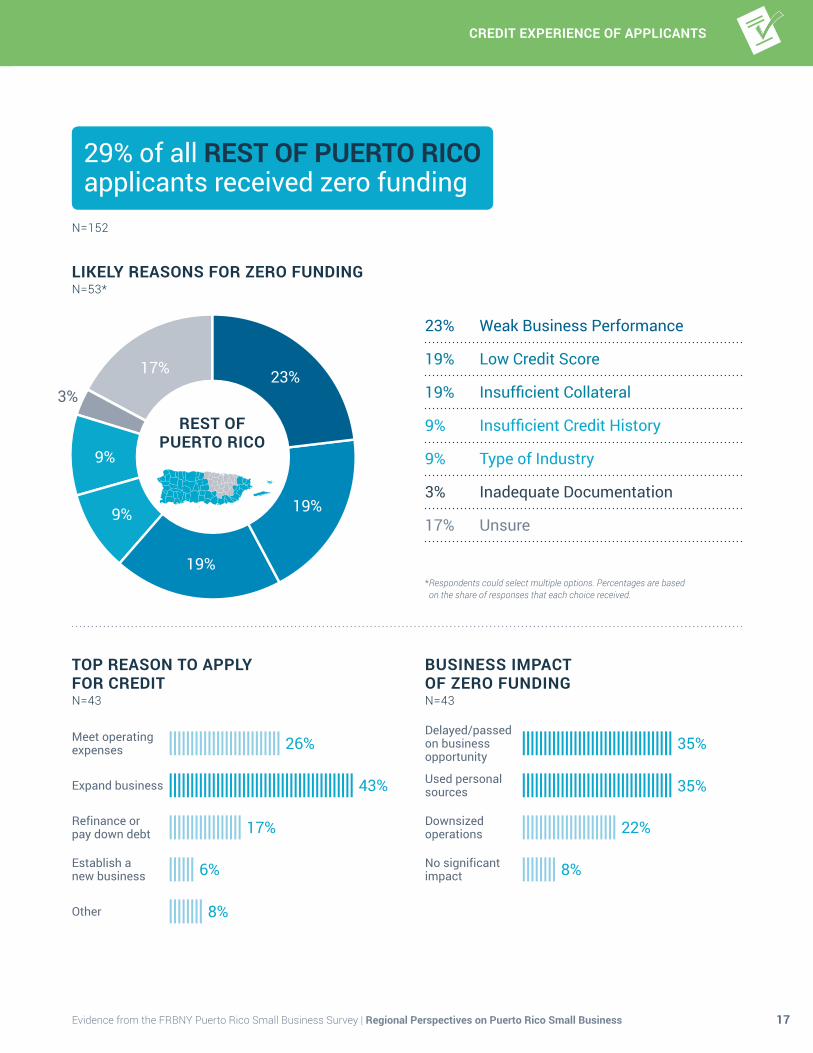
� Firm responses to zero funding differed by area. While the PR-NCM firms clearly decided to delay or pass on a business opportunity (48 percent) and only 34 percent used personal sources, the RoPR firms were more evenly divided (35 percent each) between delaying/ passing on a business opportunity or using personal sources.
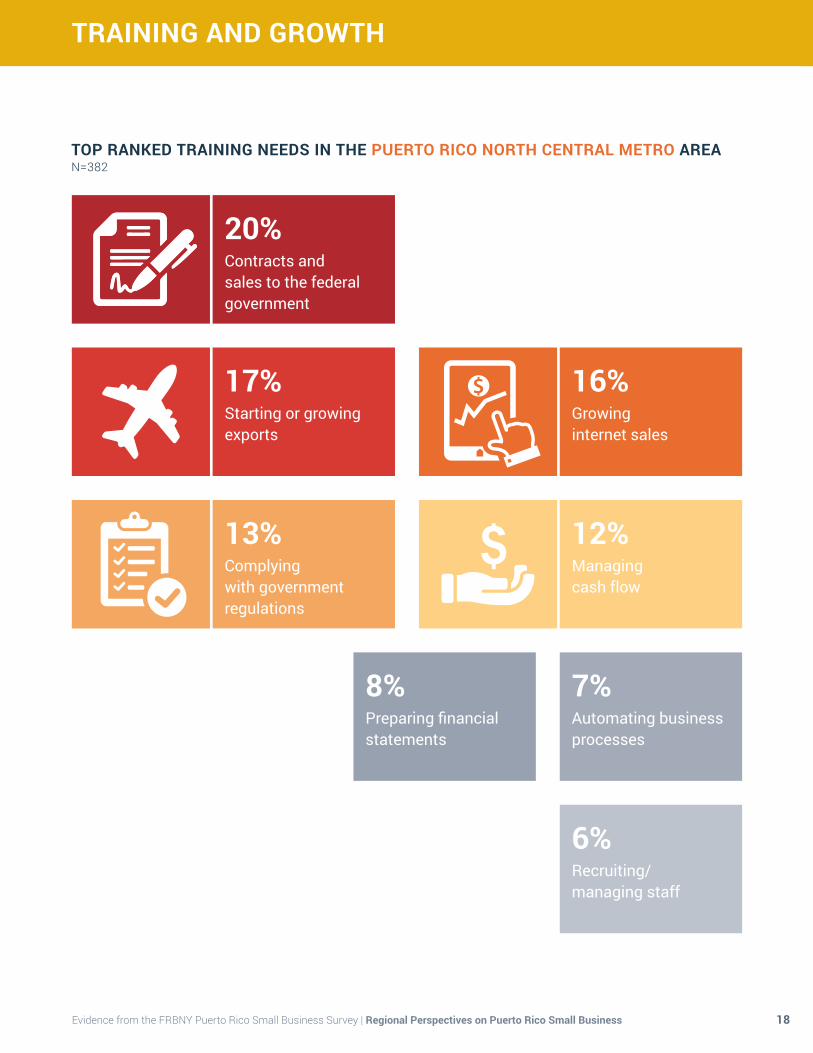
� Training and growth needs were very similar. Firms in both areas stressed the importance of training programs focused on sales and highlighted capital and credit access as their most important growth need.
ABOUT THE RESPONDENTS
6Evidence from the FRBNY Puerto Rico Small Business Survey | Regional Perspectives on Puerto Rico Small Business
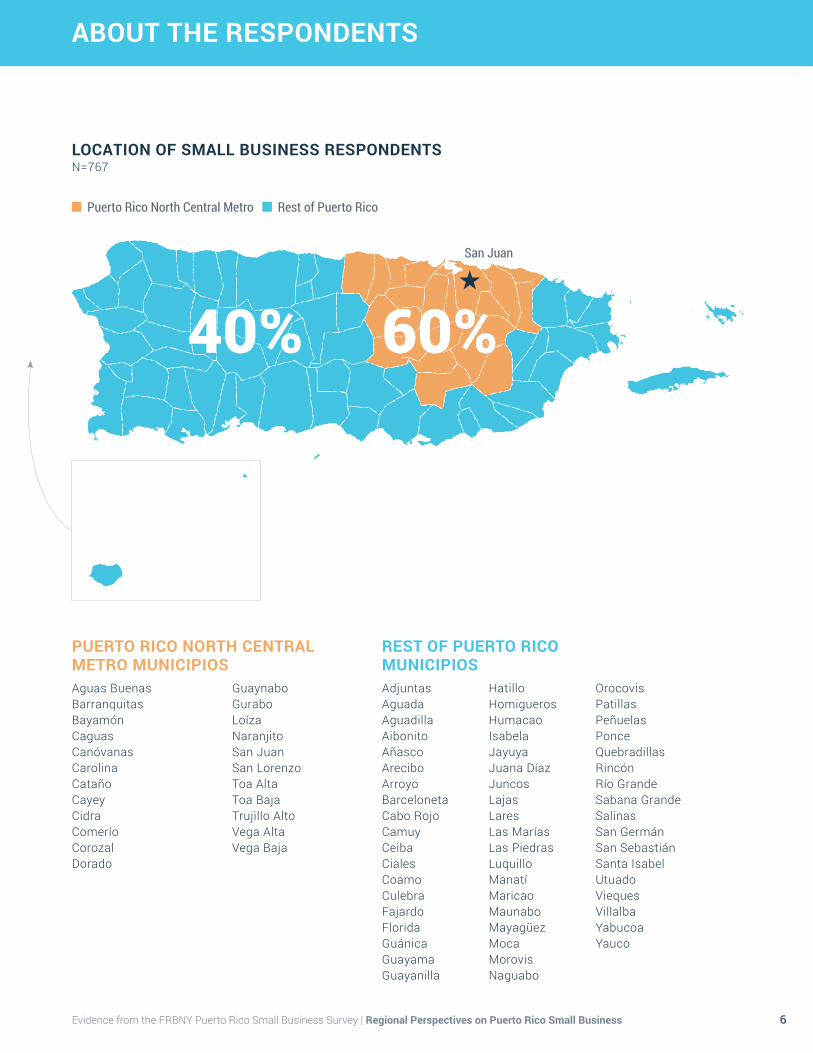
LOCATION OF SMALL BUSINESS RESPONDENTSN=767
PUERTO RICO NORTH CENTRAL METRO MUNICIPIOSAguas BuenasBarranquitasBayamónCaguasCanóvanasCarolinaCatañoCayeyCidraComeríoCorozalDorado
GuaynaboGuraboLoízaNaranjitoSan JuanSan LorenzoToa AltaToa BajaTrujillo AltoVega AltaVega Baja
REST OF PUERTO RICO MUNICIPIOSAdjuntasAguadaAguadillaAibonitoAñascoAreciboArroyoBarcelonetaCabo RojoCamuyCeibaCialesCoamoCulebraFajardoFloridaGuánicaGuayamaGuayanilla
HatilloHomiguerosHumacaoIsabelaJayuyaJuana DíazJuncosLajasLaresLas MaríasLas PiedrasLuquilloManatíMaricaoMaunaboMayagüezMocaMorovisNaguabo
OrocovisPatillasPeñuelasPonceQuebradillasRincónRío GrandeSabana GrandeSalinasSan GermánSan SebastiánSanta IsabelUtuadoVieques VillalbaYabucoaYauco
Puerto Rico North Central Metro Rest of Puerto Rico
San Juan
40% 60%
ABOUT THE RESPONDENTS
7Evidence from the FRBNY Puerto Rico Small Business Survey | Regional Perspectives on Puerto Rico Small Business
YEARS IN BUSINESSNPR-NCM=455 | NRPR=305
0–2 18%21%
3–516%
21%
6–10 19%22%
11+ 47%36%
ANNUAL REVENUES, 2015 NPR-NCM=440 | NRPR=288
<$50K
35%
42%
$50K–$250K
21% 22%
$250K–$500K
13% 11%
$500K–$1M
11% 9%
$1K–$5M
16%12%
>$5M
5% 4%
NUMBER OF FULL-TIME EMPLOYEES (FTEs), 2015NPR-NCM=457 | NRPR=310
0-1Number of FTEs 2 3 4 5 6 7 8 9 10 11–25 26–50 >50
6%13%45%
5% 5% 3% 2% 2% 2% 2% 10% 1% 4%
8%10%39%
7% 5% 5% 2% 2% 1% 3% 11% 3% 4%
Puerto Rico North Central Metro Rest of Puerto Rico
ABOUT THE RESPONDENTS
8Evidence from the FRBNY Puerto Rico Small Business Survey | Regional Perspectives on Puerto Rico Small Business
REVENUES FROM ONLINE SALESNPR-NCM=416 | NRPR=273
REVENUES FROM EXPORTSNPR-NCM=412 | NRPR=274
Puerto Rico North
Central Metro
Rest of Puerto Rico
>75% 2% 2%
51%–75% 0% 2%
25%–50% 3% 3%
<25% 17% 15%
None 79% 79%
Puerto Rico North
Central Metro
Rest of Puerto Rico
>75% 2% 1%
51%–75% 0% 0%
25%–50% 4% 2%
<25% 15% 12%
None 79% 85%
PRIMARY (>50%) SOURCE OF REVENUESNPR-NCM=429 | NRPR=283
Individuals / consumers
PR firms
PR government
Non-PR firms
US federal government
Other sources
No primary source
33%44%
37%31%
3%
10%
8%
0%
10%
11%
2%2%
3%6%
Puerto Rico North Central Metro Rest of Puerto Rico
ABOUT THE RESPONDENTS
9Evidence from the FRBNY Puerto Rico Small Business Survey | Regional Perspectives on Puerto Rico Small Business
CHANGE IN REVENUES, 2014–2015NPR-NCM=394 | NRPR=266
PROFITABILITY, 2015*
NPR-NCM=406 | NRPR=274
Profits Increased
Break even No change
Losses Decreased
39% 27%
43% 26%
20% 21%
20% 17%
37% 56%
30% 53%
* 4% of respondents from the Puerto Rico North Central Metro area were unsure or declined to answer the question.
* 7% of respondents from the Rest of Puerto Rico were unsure or declined to answer the question.
TOP BUSINESS CHALLENGE, 2015NPR-NCM=397 | NRPR=266
Managing cash flow
Dealing with rising business costs
Complying with government regulations
Obtaining credit
Identifying export opportunities
Finding or retaining qualified workers
Establishing online presence / growing e-commerce
42%39%
3%3%
13%13%
10%10%
4%1%
25%30%
2%3%
Puerto Rico North Central Metro Rest of Puerto Rico
CREDIT EXPERIENCE OF NON-APPLICANTS
10Evidence from the FRBNY Puerto Rico Small Business Survey | Regional Perspectives on Puerto Rico Small Business
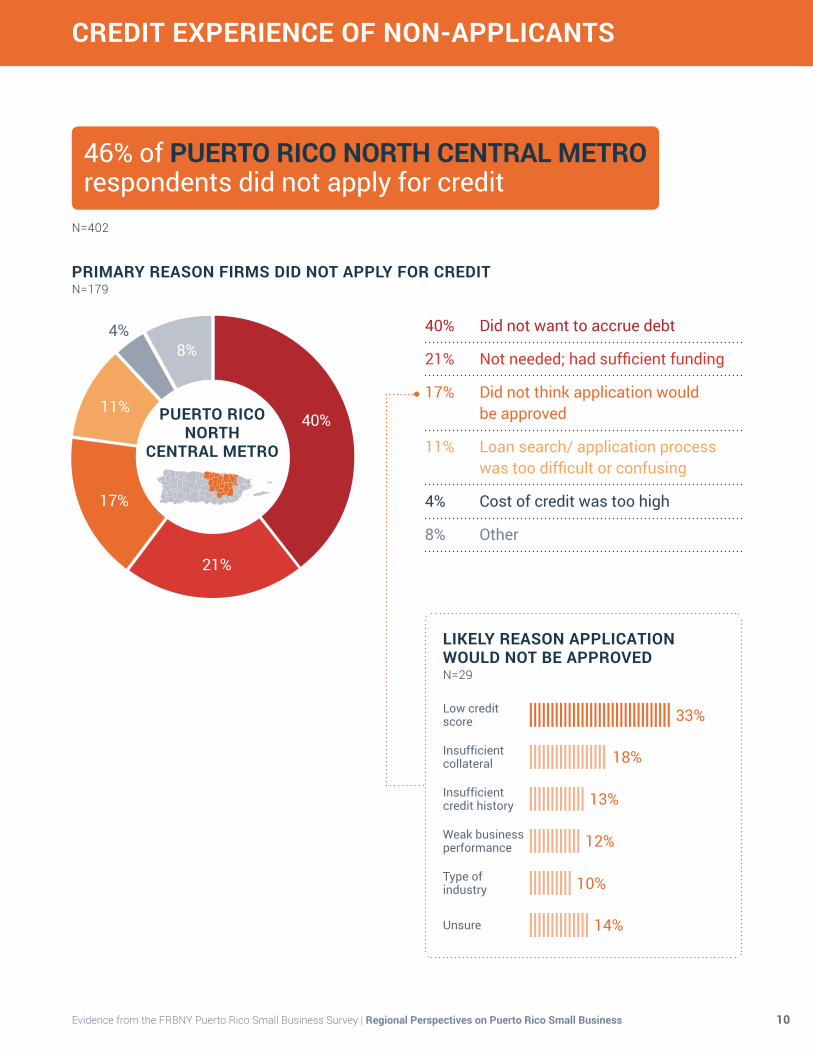
N=402
46% of PUERTO RICO NORTH CENTRAL METRO respondents did not apply for credit
PRIMARY REASON FIRMS DID NOT APPLY FOR CREDITN=179
40% Did not want to accrue debt
21% Not needed; had sufficient funding
17% Did not think application would be approved
11% Loan search/ application process was too difficult or confusing
4% Cost of credit was too high
8% Other
40%
21%
17%
11%
8%
LIKELY REASON APPLICATION WOULD NOT BE APPROVEDN=29
Low credit score
Insufficient collateral
Insufficient credit history
Weak business performance
Type of industry
Unsure
33%
18%
13%
12%
10%
14%
4%
PUERTO RICO
NORTH CENTRAL METRO
11
CREDIT EXPERIENCE OF NON-APPLICANTS
Evidence from the FRBNY Puerto Rico Small Business Survey | Regional Perspectives on Puerto Rico Small Business
N=275
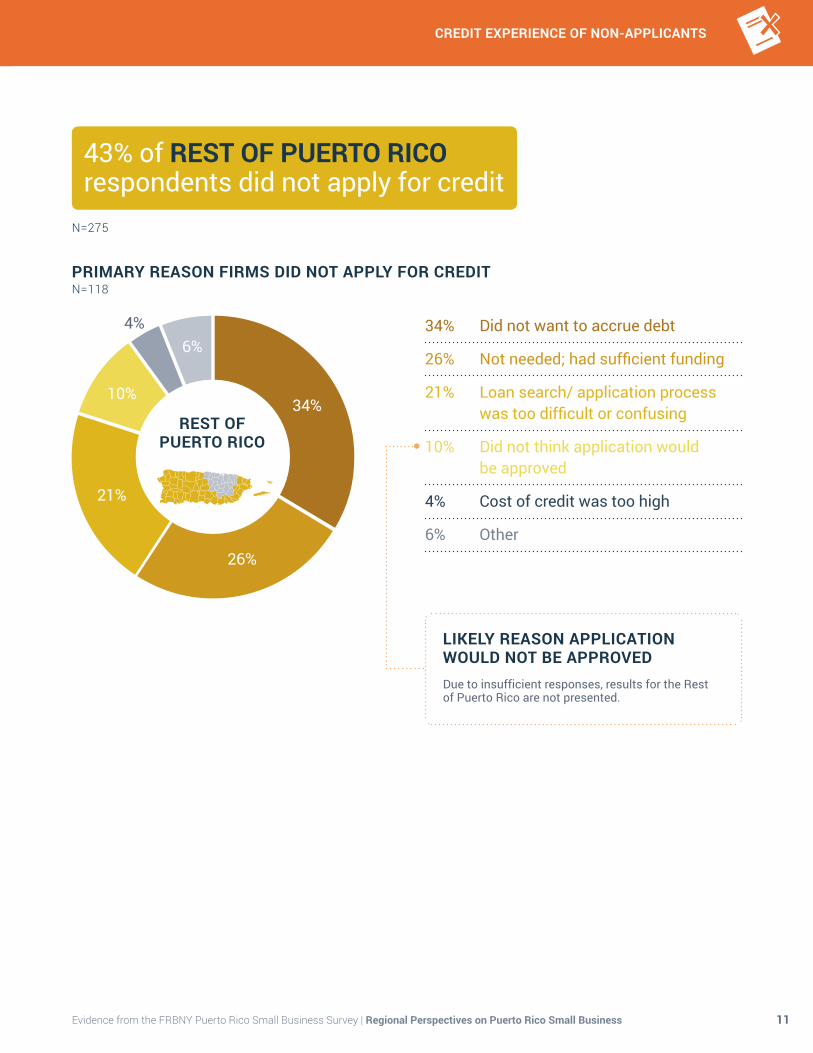
43% of REST OF PUERTO RICO respondents did not apply for credit
34% Did not want to accrue debt
26% Not needed; had sufficient funding
21% Loan search/ application process was too difficult or confusing
10% Did not think application would be approved
4% Cost of credit was too high
6% Other
34%
6%
26%
21%
10%
Due to insufficient responses, results for the Rest of Puerto Rico are not presented.
LIKELY REASON APPLICATION WOULD NOT BE APPROVED
4%
REST OF
PUERTO RICO
PRIMARY REASON FIRMS DID NOT APPLY FOR CREDITN=118
CREDIT EXPERIENCE OF APPLICANTS
12Evidence from the FRBNY Puerto Rico Small Business Survey | Regional Perspectives on Puerto Rico Small Business
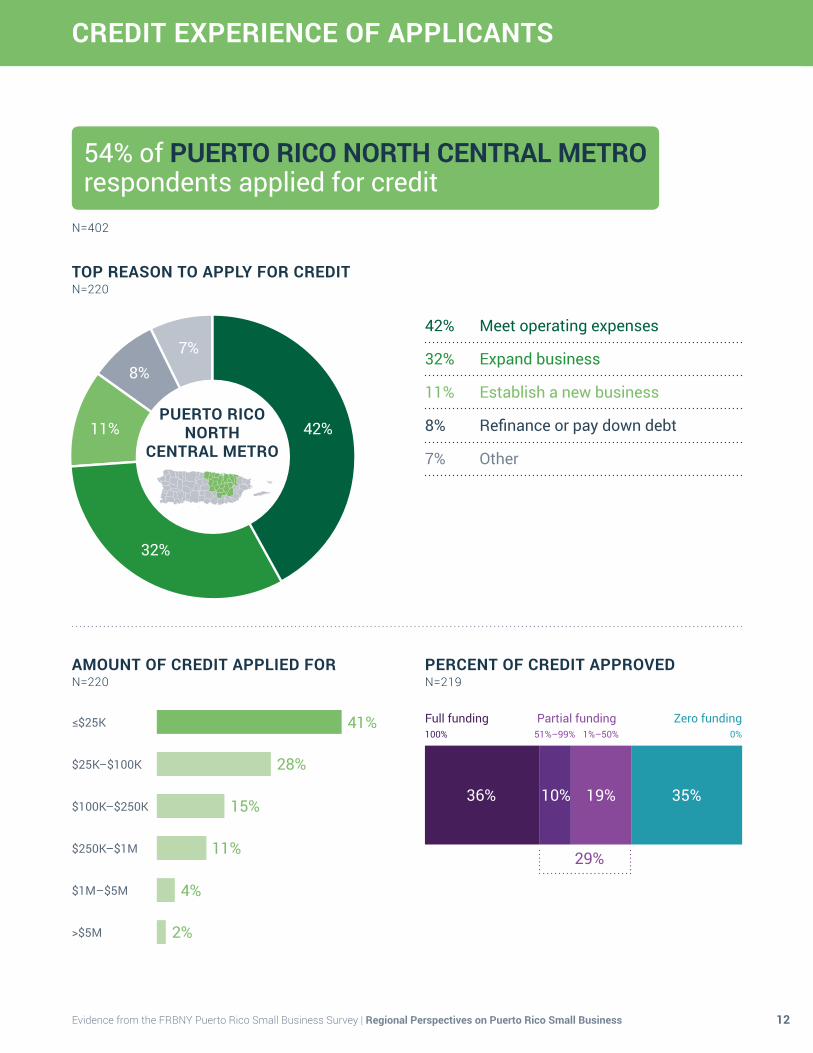
PERCENT OF CREDIT APPROVEDN=219
TOP REASON TO APPLY FOR CREDITN=220
42% Meet operating expenses
32% Expand business
11% Establish a new business
8% Refinance or pay down debt
7% Other
AMOUNT OF CREDIT APPLIED FORN=220
≤$25K
$25K–$100K
$100K–$250K
$250K–$1M
$1M–$5M
>$5M
41%
28%
15%
11%
4%
2%
Full funding Partial funding Zero funding
36% 35%19%10%
29%
51%–99%100% 1%–50% 0%
N=402
54% of PUERTO RICO NORTH CENTRAL METRO respondents applied for credit
42%
7%
32%
11%
8%
PUERTO RICO NORTH
CENTRAL METRO
13
CREDIT EXPERIENCE OF APPLICANTS
CREDIT EXPERIENCE OF APPLICANTS
Evidence from the FRBNY Puerto Rico Small Business Survey | Regional Perspectives on Puerto Rico Small Business
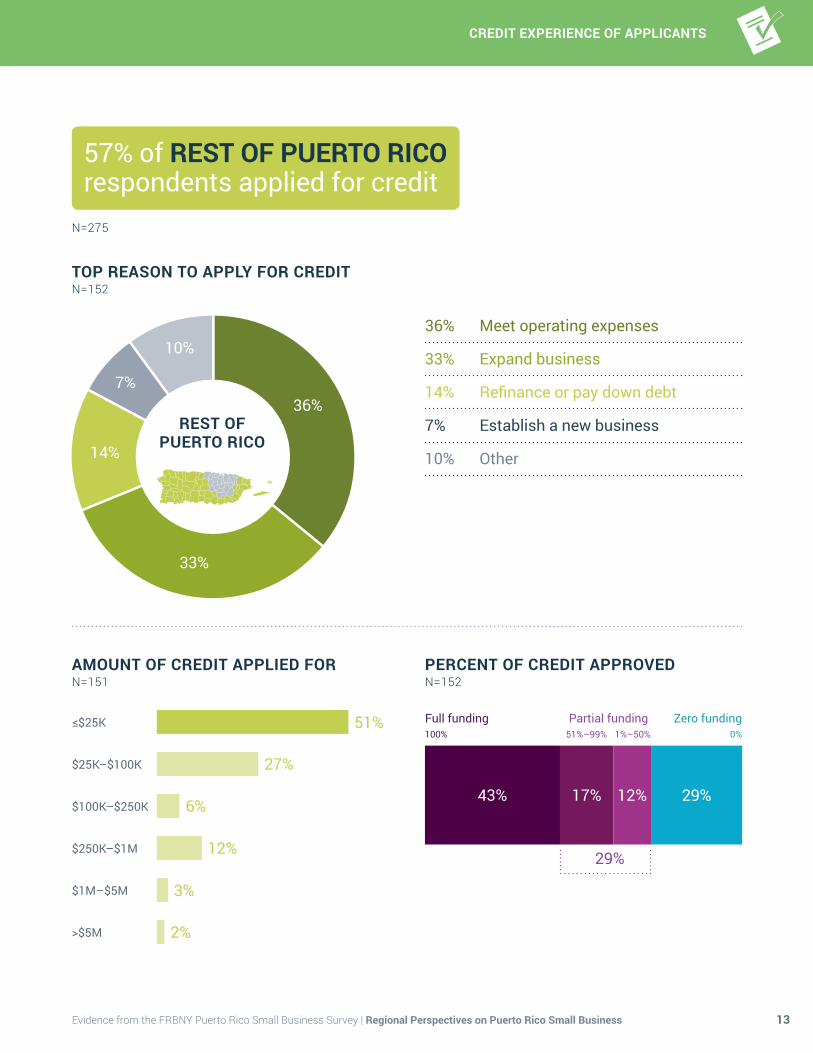
PERCENT OF CREDIT APPROVEDN=152
TOP REASON TO APPLY FOR CREDITN=152
36% Meet operating expenses
33% Expand business
14% Refinance or pay down debt
7% Establish a new business
10% Other
AMOUNT OF CREDIT APPLIED FORN=151
≤$25K
$25K–$100K
$100K–$250K
$250K–$1M
$1M–$5M
>$5M
51%
27%
6%
12%
3%
2%
Full funding Partial funding Zero funding
43% 29%12%17%
29%
51%–99%100% 1%–50% 0%
N=275
57% of REST OF PUERTO RICO respondents applied for credit
36%
10%
33%
14%
7%
REST OF PUERTO RICO
CREDIT EXPERIENCE OF APPLICANTS
14Evidence from the FRBNY Puerto Rico Small Business Survey | Regional Perspectives on Puerto Rico Small Business
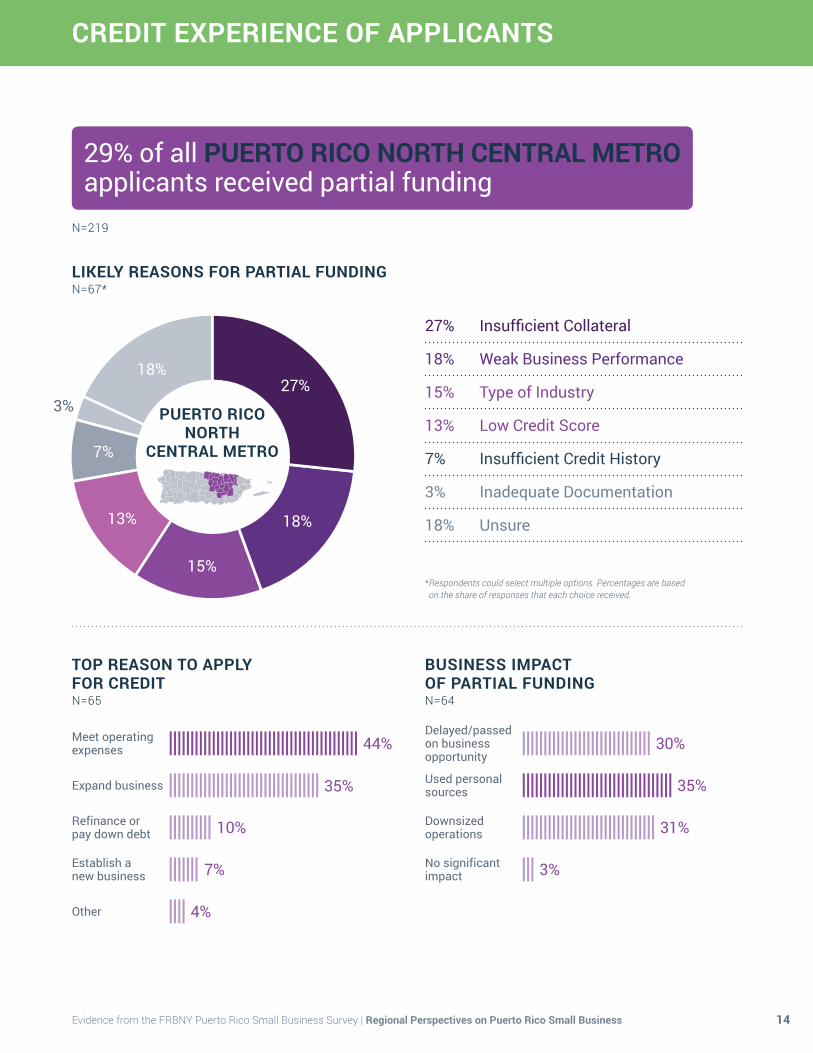
LIKELY REASONS FOR PARTIAL FUNDINGN=67*
27% Insufficient Collateral
18% Weak Business Performance
15% Type of Industry
13% Low Credit Score
7% Insufficient Credit History
3% Inadequate Documentation
18% Unsure
27%
15%
18%
13% 18%
7%
3%
TOP REASON TO APPLY FOR CREDITN=65
Meet operating expenses
Expand business
Refinance or pay down debt
Establish a new business
Other
35%
10%
7%
4%
44%
BUSINESS IMPACT OF PARTIAL FUNDINGN=64
30%
35%
3%
31%
* Respondents could select multiple options. Percentages are based on the share of responses that each choice received.
N=219
29% of all PUERTO RICO NORTH CENTRAL METRO applicants received partial funding
PUERTO RICO
NORTH CENTRAL METRO
Used personal sources
Delayed/passed on business opportunity
Downsized operations
No significant impact
15
CREDIT EXPERIENCE OF APPLICANTS
CREDIT EXPERIENCE OF APPLICANTS
Evidence from the FRBNY Puerto Rico Small Business Survey | Regional Perspectives on Puerto Rico Small Business
LIKELY REASONS FOR PARTIAL FUNDINGN=48*
20% Type of Industry
19% Insufficient Credit History
19% Low Credit Score
15% Insufficient Collateral
14% Weak Business Performance
0% Inadequate Documentation
14% Unsure
20%
19%
14%
15%
19%
14%
TOP REASON TO APPLY FOR CREDITN=45
Meet operating expenses
Expand business
Refinance or pay down debt
Establish a new business
Other
40%
17%
7%
13%
23%
BUSINESS IMPACT OF PARTIAL FUNDINGN=43
12%
21%
* Respondents could select multiple options. Percentages are based on the share of responses that each choice received.
N=152
29% of all REST OF PUERTO RICO applicants received partial funding
REST OF
PUERTO RICO
23%
43%Used personal sources
Delayed/passed on business opportunity
Downsized operations
No significant impact
CREDIT EXPERIENCE OF APPLICANTS
16Evidence from the FRBNY Puerto Rico Small Business Survey | Regional Perspectives on Puerto Rico Small Business
LIKELY REASONS FOR ZERO FUNDINGN=91*
25% Insufficient Collateral
22% Low Credit Score
16% Insufficient Credit History
13% Weak Business Performance
6% Type of Industry
3% Inadequate Documentation
14% Unsure
25%
16%
14%
13%
22%
6%
* Respondents could select multiple options. Percentages are based on the share of responses that each choice received.
N=219
BUSINESS IMPACT OF ZERO FUNDINGN=72
48%
34%
13%
5%
TOP REASON TO APPLY FOR CREDITN=72
26%
42%
11%
11%
9%
Meet operating expenses
Expand business
Refinance or pay down debt
Establish a new business
Other
Used personal sources
Delayed/passed on business opportunity
Downsized operations
No significant impact
35% of all PUERTO RICO NORTH CENTRAL METRO applicants received zero funding
PUERTO RICO
NORTH CENTRAL METRO
3%
17
CREDIT EXPERIENCE OF APPLICANTS
CREDIT EXPERIENCE OF APPLICANTS
Evidence from the FRBNY Puerto Rico Small Business Survey | Regional Perspectives on Puerto Rico Small Business
LIKELY REASONS FOR ZERO FUNDINGN=53*
23% Weak Business Performance
19% Low Credit Score
19% Insufficient Collateral
9% Insufficient Credit History
9% Type of Industry
3% Inadequate Documentation
17% Unsure
23%
19%
17%
9% 19%
9%
* Respondents could select multiple options. Percentages are based on the share of responses that each choice received.
N=152
29% of all REST OF PUERTO RICO applicants received zero funding
BUSINESS IMPACT OF ZERO FUNDINGN=43
35%
35%
22%
8%
TOP REASON TO APPLY FOR CREDITN=43
26%
43%
17%
6%
8%
Meet operating expenses
Expand business
Refinance or pay down debt
Establish a new business
Other
Used personal sources
Delayed/passed on business opportunity
Downsized operations
No significant impact
REST OF
PUERTO RICO
3%
TRAINING AND GROWTH
18Evidence from the FRBNY Puerto Rico Small Business Survey | Regional Perspectives on Puerto Rico Small Business
TOP RANKED TRAINING NEEDS IN THE PUERTO RICO NORTH CENTRAL METRO AREAN=382
6%
Recruiting/ managing staff
7%
Automating business processes
8%
Preparing financial statements
20% Contracts and sales to the federal government
16%
Growing internet sales
17% Starting or growing exports
12%
Managing cash flow
13% Complying with government regulations
19
TRAINING AND GROWTH
Evidence from the FRBNY Puerto Rico Small Business Survey | Regional Perspectives on Puerto Rico Small Business
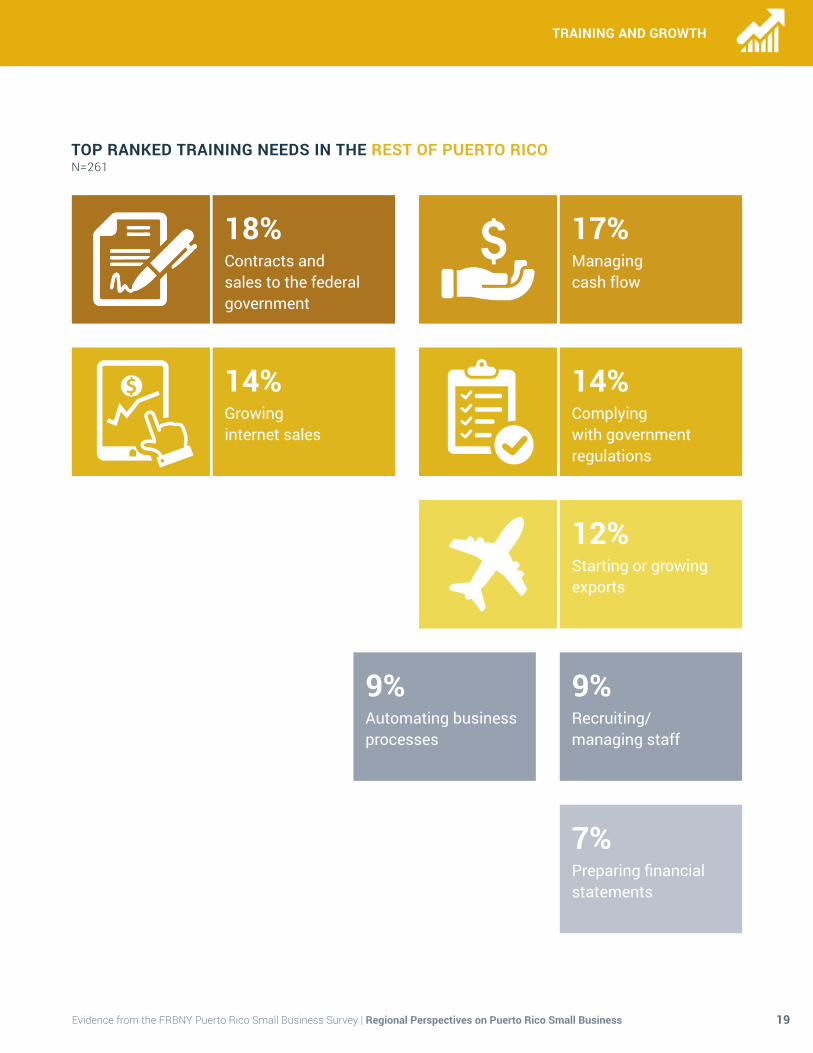
TOP RANKED TRAINING NEEDS IN THE REST OF PUERTO RICON=261
7%
Preparing financial statements
9%
Automating business processes
9%
Recruiting/ managing staff
18% Contracts and sales to the federal government
14%
Growing internet sales
12% Starting or growing exports
17%
Managing cash flow
14% Complying with government regulations
TRAINING AND GROWTH
20Evidence from the FRBNY Puerto Rico Small Business Survey | Regional Perspectives on Puerto Rico Small Business
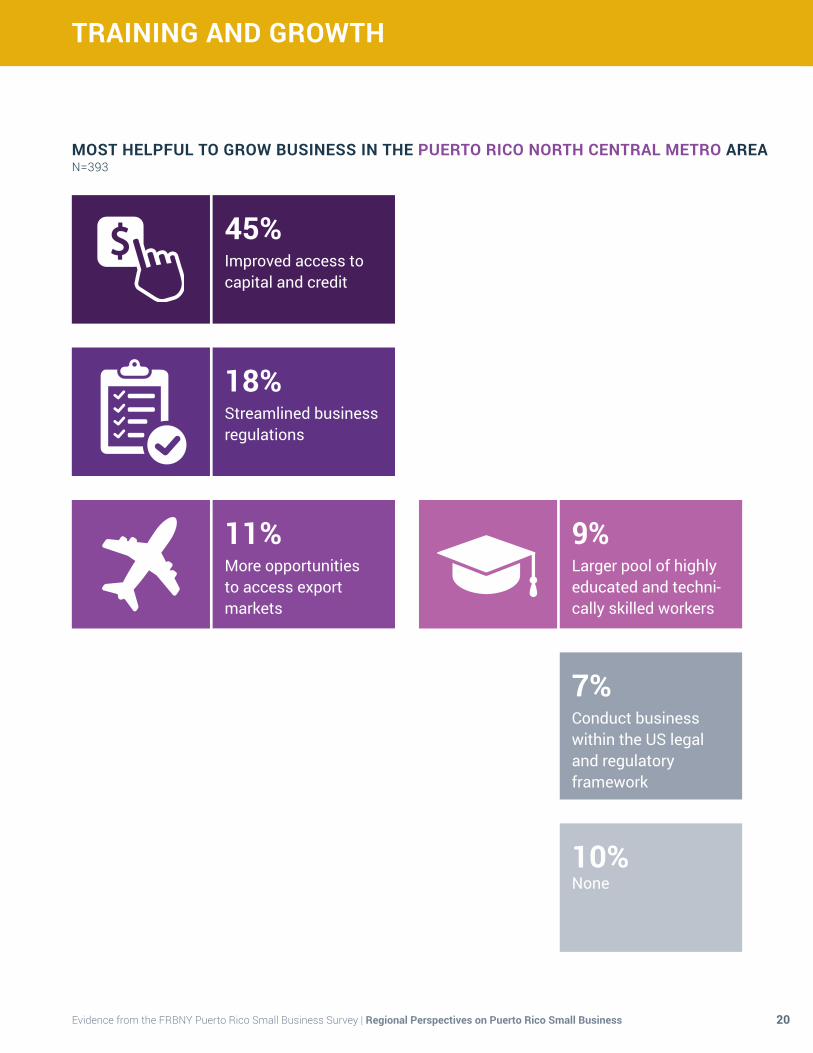
MOST HELPFUL TO GROW BUSINESS IN THE PUERTO RICO NORTH CENTRAL METRO AREAN=393
11%
More opportunities to access export markets
18% Streamlined business regulations
45%Improved access to capital and credit
7%
Conduct business within the US legal and regulatory framework
10% None
9%Larger pool of highly educated and techni-cally skilled workers
21
TRAINING AND GROWTH
Evidence from the FRBNY Puerto Rico Small Business Survey | Regional Perspectives on Puerto Rico Small Business
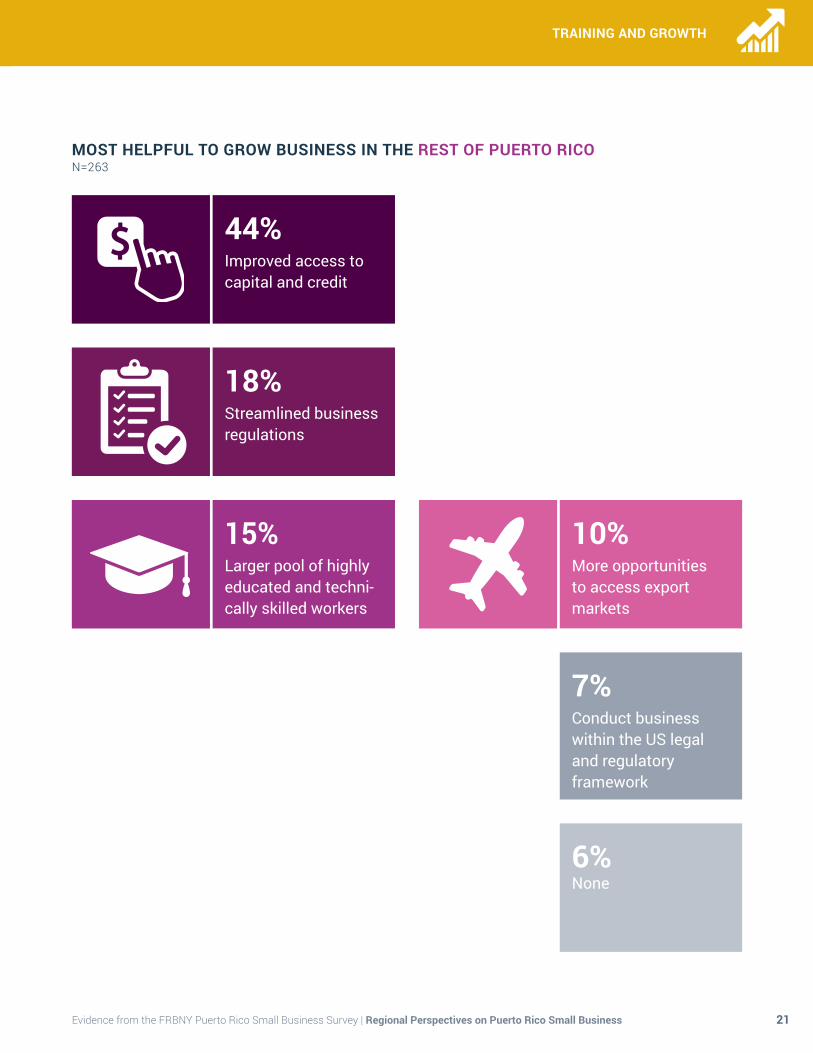
MOST HELPFUL TO GROW BUSINESS IN THE REST OF PUERTO RICON=263
10%
More opportunities to access export markets
18% Streamlined business regulations
44%Improved access to capital and credit
15%Larger pool of highly educated and techni-cally skilled workers
7%
Conduct business within the US legal and regulatory framework
6% None
ABOUT THE DATA
22Evidence from the FRBNY Puerto Rico Small Business Survey | Regional Perspectives on Puerto Rico Small Business
The Puerto Rico Small Business Survey is modeled after the Federal Reserve Bank of New York’s Small Business Credit Survey for the U.S. mainland2, and is customized to address local issues and interests in the Commonwealth. For more information on survey methodology, see Evidence from the Federal Reserve Bank of New York Puerto Rico Small Business Survey 2016 at http://nyfed.org/prsmallbiz2016.
Data Collection
The survey is a voluntary collaboration that results in a convenience sample of business establishments with fewer than 500 employees. The New York Fed fields the survey and undertakes the data analysis. Puerto Rico organizations—our network of distribution partners (see Acknowledgments for the list)—distribute the survey to their members and ask them to participate. The survey is conducted online and the
number of responses varies according to the number of firms that receive and complete a particular question.
1,295 firms responded to the survey, which was fielded between March 2016 and May 2016. Of the respon-dents, 767 businesses answered the three questions associated with the weighting dimensions—industry, geographic location, and employment size—and are therefore included in the report analysis.
Data Weighting
To control for biases and to ensure the survey closely matches the distribution of the small business popula-tion in Puerto Rico, we weight the survey responses on three dimensions: industry, geographic location, and the employment size of establishments. As with all surveys, there may remain some degree of selection, recall and non-response bias.
The Federal Reserve Bank of New York worked with the National Opinion Research Center (NORC), a nation-ally recognized survey organization that designed and calculated the weights. The weighting data for industry and geographic location come from the US Census Bureau’s County Business Patterns (CBP) Series, 2014. The CBP excludes most government employees, rail-road employees, and self-employed persons. Weighting data for employment size come from the Bureau of Labor Statistics’ Quarterly Census of Employment and Wages (QCEW), 2014. More specifically:
� For the industry weights, respondents are sorted into one of three major categories: Agriculture, Manufacturing, and Trades (NAICS: 11, 23, 31-33, 42, 44-45); Services (NAICS: 51, 52, 53, 54, 55, 61, 62, 71); and Other.
� For the geographic location weights, respondents were asked to provide a business ZIP code and were then sorted into one of two categories: The greater Puerto Rico North Central Metro area, defined as the San Juan municipio and the 22 surrounding municipios (Aguas Buenas, Barranquitas, Bayamón, Caguas, Canóvanas, Carolina, Cataño, Cayey, Cidra, Comerio, Corozal, Dorado, Guaynabo, Gurabo, Loiza, Naranjito, San Juan, San Lorenzo, Toa Alta, Toa Baja, Trujillo Alto, Vega Baja, Vega Alta); and the Rest of Puerto Rico, or the 55 Puerto Rican municipios not included in the Puerto Rico North Central Metro area.
� For the employment size weights, respondents are sorted into one of three categories: Fewer than 10, 10 to 49, and More than 49 full- and part-time employees.
As population totals are not consistent across the three weighting dimensions, counts by geographic location and employment size are calibrated to the count by industry. Please note that the Puerto Rico Small Business Survey Report does not use firm age as a weighting dimension, as is done in the mainland Small Business Credit Survey report, because such municipio-level data are not available.
2 See www.newyorkfed.org/smallbusiness/small-business-credit-survey-employer-firms-2015 Mainland includes Hawaii and Alaska.
23
ABOUT THE DATA
Evidence from the FRBNY Puerto Rico Small Business Survey | Regional Perspectives on Puerto Rico Small Business
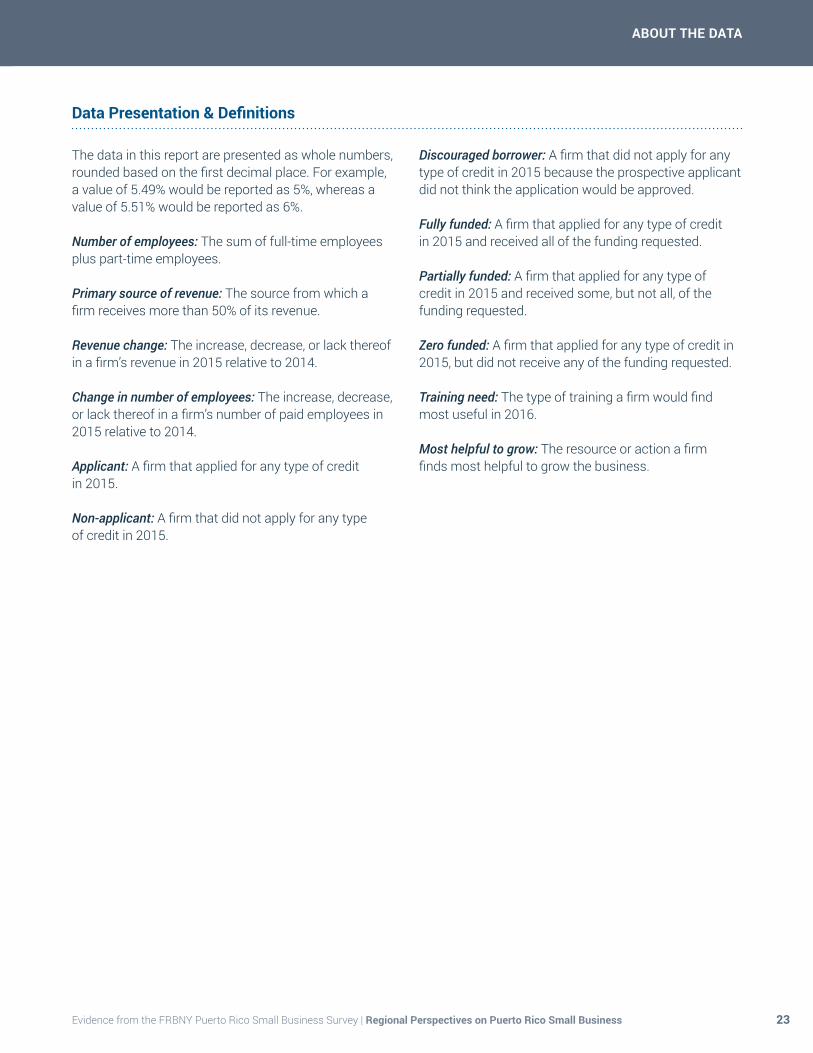
Data Presentation & Definitions
The data in this report are presented as whole numbers, rounded based on the first decimal place. For example, a value of 5.49% would be reported as 5%, whereas a value of 5.51% would be reported as 6%.
Number of employees: The sum of full-time employees plus part-time employees.
Primary source of revenue: The source from which a firm receives more than 50% of its revenue.
Revenue change: The increase, decrease, or lack thereof in a firm’s revenue in 2015 relative to 2014.
Change in number of employees: The increase, decrease, or lack thereof in a firm’s number of paid employees in 2015 relative to 2014.
Applicant: A firm that applied for any type of credit in 2015.
Non-applicant: A firm that did not apply for any type of credit in 2015.
Discouraged borrower: A firm that did not apply for any type of credit in 2015 because the prospective applicant did not think the application would be approved.
Fully funded: A firm that applied for any type of credit in 2015 and received all of the funding requested.
Partially funded: A firm that applied for any type of credit in 2015 and received some, but not all, of the funding requested.
Zero funded: A firm that applied for any type of credit in 2015, but did not receive any of the funding requested.
Training need: The type of training a firm would find most useful in 2016.
Most helpful to grow: The resource or action a firm finds most helpful to grow the business.
SURVEY QUESTIONNAIRE
24Evidence from the FRBNY Puerto Rico Small Business Survey | Regional Perspectives on Puerto Rico Small Business
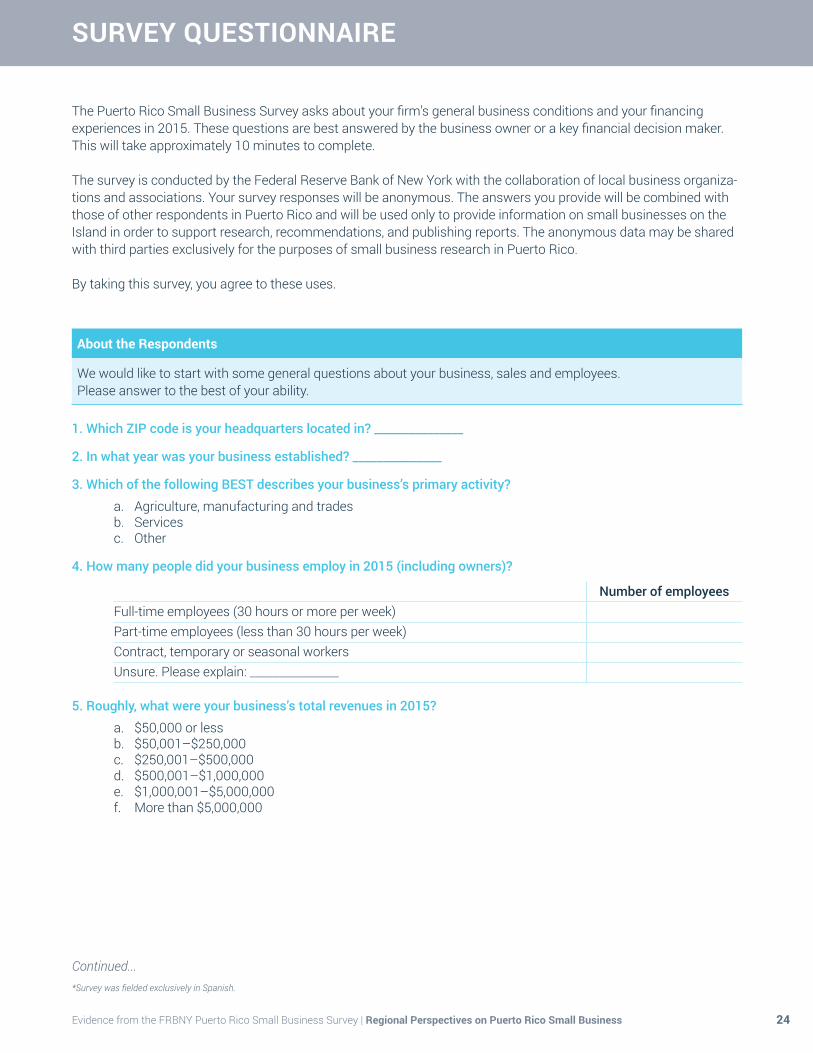
The Puerto Rico Small Business Survey asks about your firm’s general business conditions and your financing experiences in 2015. These questions are best answered by the business owner or a key financial decision maker. This will take approximately 10 minutes to complete.
The survey is conducted by the Federal Reserve Bank of New York with the collaboration of local business organiza-tions and associations. Your survey responses will be anonymous. The answers you provide will be combined with those of other respondents in Puerto Rico and will be used only to provide information on small businesses on the Island in order to support research, recommendations, and publishing reports. The anonymous data may be shared with third parties exclusively for the purposes of small business research in Puerto Rico.
By taking this survey, you agree to these uses.
About the Respondents
We would like to start with some general questions about your business, sales and employees. Please answer to the best of your ability.
1. Which ZIP code is your headquarters located in? _______________
2. In what year was your business established? _______________
3. Which of the following BEST describes your business’s primary activity?a. Agriculture, manufacturing and tradesb. Servicesc. Other
4. How many people did your business employ in 2015 (including owners)?
Number of employeesFull-time employees (30 hours or more per week)Part-time employees (less than 30 hours per week)Contract, temporary or seasonal workersUnsure. Please explain: _______________
5. Roughly, what were your business’s total revenues in 2015?a. $50,000 or lessb. $50,001–$250,000c. $250,001–$500,000d. $500,001–$1,000,000e. $1,000,001–$5,000,000f. More than $5,000,000
Continued...*Survey was fielded exclusively in Spanish.
25
SURVEY QUESTIONNAIRE
Evidence from the FRBNY Puerto Rico Small Business Survey | Regional Perspectives on Puerto Rico Small Business
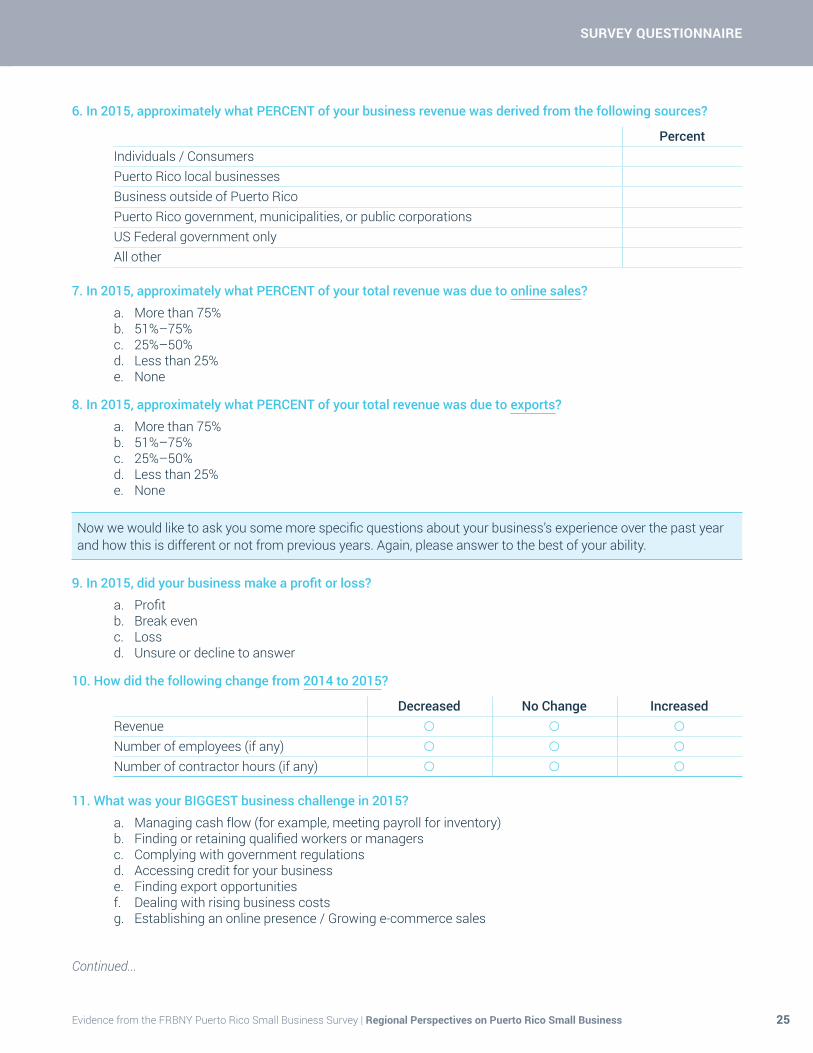
6. In 2015, approximately what PERCENT of your business revenue was derived from the following sources?
PercentIndividuals / ConsumersPuerto Rico local businessesBusiness outside of Puerto RicoPuerto Rico government, municipalities, or public corporationsUS Federal government onlyAll other
7. In 2015, approximately what PERCENT of your total revenue was due to online sales?a. More than 75%b. 51%–75%c. 25%–50%d. Less than 25%e. None
8. In 2015, approximately what PERCENT of your total revenue was due to exports?a. More than 75%b. 51%–75%c. 25%–50%d. Less than 25%e. None
Now we would like to ask you some more specific questions about your business’s experience over the past year and how this is different or not from previous years. Again, please answer to the best of your ability.
9. In 2015, did your business make a profit or loss?a. Profitb. Break evenc. Lossd. Unsure or decline to answer
10. How did the following change from 2014 to 2015?
Decreased No Change IncreasedRevenue
Number of employees (if any)
Number of contractor hours (if any)
11. What was your BIGGEST business challenge in 2015?a. Managing cash flow (for example, meeting payroll for inventory)b. Finding or retaining qualified workers or managersc. Complying with government regulationsd. Accessing credit for your businesse. Finding export opportunitiesf. Dealing with rising business costsg. Establishing an online presence / Growing e-commerce sales
Continued...
SURVEY QUESTIONNAIRE
26Evidence from the FRBNY Puerto Rico Small Business Survey | Regional Perspectives on Puerto Rico Small Business
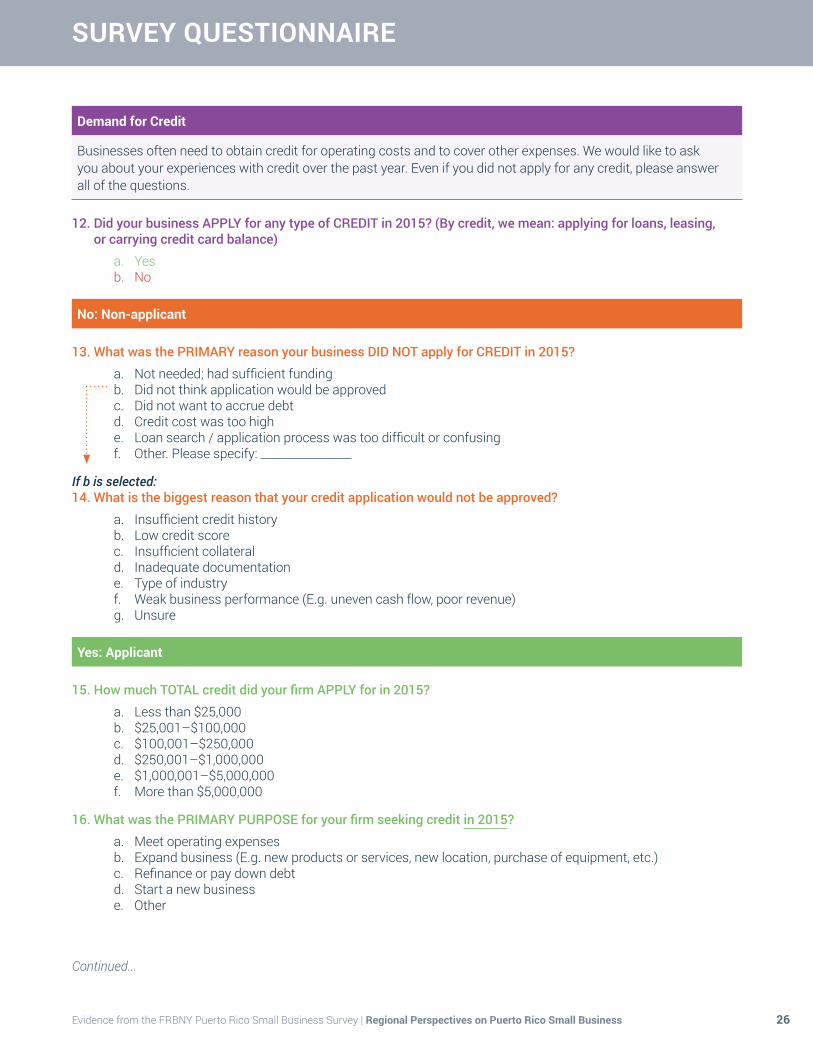
Demand for Credit
Businesses often need to obtain credit for operating costs and to cover other expenses. We would like to ask you about your experiences with credit over the past year. Even if you did not apply for any credit, please answer all of the questions.
12. Did your business APPLY for any type of CREDIT in 2015? (By credit, we mean: applying for loans, leasing, or carrying credit card balance)
a. Yesb. No
No: Non-applicant
13. What was the PRIMARY reason your business DID NOT apply for CREDIT in 2015?a. Not needed; had sufficient fundingb. Did not think application would be approvedc. Did not want to accrue debtd. Credit cost was too highe. Loan search / application process was too difficult or confusingf. Other. Please specify: ________________
If b is selected:14. What is the biggest reason that your credit application would not be approved?
a. Insufficient credit historyb. Low credit scorec. Insufficient collaterald. Inadequate documentatione. Type of industryf. Weak business performance (E.g. uneven cash flow, poor revenue)g. Unsure
Yes: Applicant
15. How much TOTAL credit did your firm APPLY for in 2015?a. Less than $25,000b. $25,001–$100,000c. $100,001–$250,000d. $250,001–$1,000,000e. $1,000,001–$5,000,000f. More than $5,000,000
16. What was the PRIMARY PURPOSE for your firm seeking credit in 2015?a. Meet operating expensesb. Expand business (E.g. new products or services, new location, purchase of equipment, etc.)c. Refinance or pay down debtd. Start a new businesse. Other
Continued...
27
SURVEY QUESTIONNAIRE
Evidence from the FRBNY Puerto Rico Small Business Survey | Regional Perspectives on Puerto Rico Small Business
17. Of the total dollar amount of credit, from all sources, that your firm applied for in 2015, what percent was approved?
a. All (100%)b. More than half (51%–99%)c. Half or less (1%–50%)d. Zero (0%)
Applicants: Partially or Zero Funded
18. What was the MOST important business impact, if any, of not receiving the full amount of credit for which your business applied in 2015?
a. Downsized business operations (E.g. cut staff, reduced products and services, reduced commercial space, etc.)
b. Delayed or passed on a business opportunity (E.g. new products or services, new location purchase of equipment)
c. Funded business from personal sources, friends and family, pawnshops, or high cost lenders, etc.d. No significant impact
19. What were the likely reasons your business did not receive 100% of the CREDIT applied for? Select all that apply.
a. Low credit scoreb. Insufficient credit historyc. Insufficient collaterald. Inadequate documentatione. Type of industryf. Weak business performance (E.g. uneven cash flow, poor revenue)g. Unsure
Training Needs and Business Growth
Finally, we have some questions about how we can help you in 2016. In particular, what services, training, and other assistance would your business find helpful?
20. Which types of TRAINING would your firm find most useful in 2016?a. Preparing financial statementsb. Complying with government regulations (licenses and permits)c. Managing cash flowd. Starting or growing exportse. Recruiting or managing stafff. Contracts and sales to the federal governmentg. Automating business processesh. Growing internet sales
21. Which of the following would be MOST helpful to grow your business?a. Larger pool of highly educated and technically skilled workersb. Improved access to capital and creditc. Streamlined business regulationsd. More opportunities to access export marketse. Conducting business within US legal and regulatory frameworkf. None
28Evidence from the FRBNY Puerto Rico Small Business Survey | Regional Perspectives on Puerto Rico Small Business
APPENDIX
Adjuntas
Aguada
Aguadilla
Aguas Buenas
Aibonito
Añasco
Arecibo
Arroyo
Barceloneta
Barranquitas
Baya
món
Cabo Rojo
Caguas
Camay
Canó
vana
s
Caro
lina
Cataño
Cayey
Ceiba
Ciales
Cidra
Coamo
Comerío
CorozalCulebra
Dorado
Fajardo
Florida
Guánica GuayamaGuayanilla
Guay
nabo
Gurabo
Hatillo
Hormigueros Humacao
Isabela
Jayuya
Juana Díaz
Juncos
Lajas
Lares
Las MaríasLas Piedras
Loíza
Luquillo
Manatí
Maticao
Maunabo
Mayagüez
Moca
Morovis
Naguabo
Naranjito
Orocovis
PatillasPeñuelas
Ponce
Quebradillas
RincónRío Grande
Sabana Grande
Salinas
San Germán
SanJuan
San Lorenzo
San Sebastián
Santa Isabel
Toa Alta
Toa Baja
Trujillo Alto
Utuado
Vega Alta
Vega Baja
ViequesVillalba
YabucoaYauco
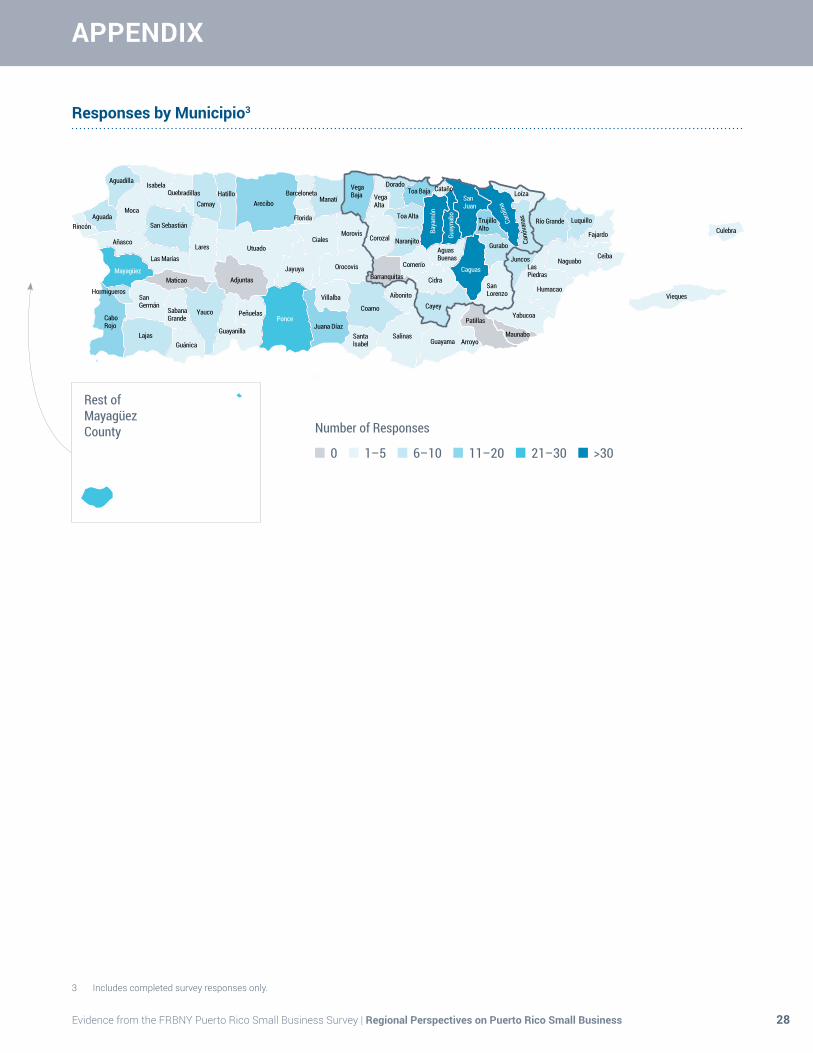
Responses by Municipio3
Number of Responses
0 1–5 6–10 11–20 21–30 >30
Rest of Mayagüez County
3 Includes completed survey responses only.