evidence for nonlinear binding of pahs to dissolved humic acids
TRANSCRIPT
Evidence for Nonlinear Binding ofPAHs to Dissolved Humic AcidsY A E L L A O R * A N D M E N A H E M R E B H U N
Faculty of Civil Engineering, Environmental and WaterResources Engineering, Technion, Haifa 32000, Israel
Binding of pyrene, fluoranthene, and phenanthrene todissolved humic acids (HA) was determined by thefluorescence quenching (FQ) and complexation-flocculation(CF) methods. Determinations by the CF method, usingvarying contaminant concentrations and a constant HAconcentration, yielded nonlinear Freundlich-type isotherms(n ) 0.65-0.84). Experiments using both the CF and theFQ methods with varying HA concentrations and a constantcontaminant concentration yielded curved “Stern-Volmer”-type plots that also indicate nonlinear binding. Thesefindings suggest that linear partitioning or site complexationin the presence of excess available sites cannot fullydescribe the interactions of hydrophobic compounds withdissolved humic material. Site-specific hydrophobicinteractions at limited interior or external molecular surfacesmay be considered.
IntroductionDissolved humic substances in subsurface and surface watersand in sedimentary porewaters have been shown to have aneffect on fate and transport of hydrophobic contaminants(e.g., refs 1-6). “Dissolved” humic substances can be viewedas truly dissolved anionic macromolecules or as submicroncolloids that are mobile in the subsurface environment, thusfacilitating the transport of bound contaminants. On the otherhand, “solid-phase” humic materials are integral constituentsof soil and sediment solid matrixes and result in retardationof readily sorbed contaminants. Operationally, dissolvedhumic materials will not precipitate upon centrifugation and/or will pass through a filter of a defined pore size (0.2-0.45µm; 1, 7-9). The term binding has been used to describe theinteractions of contaminants with dissolved humic materials,as contrasted with sorption, which has been used to describecontaminant interactions with solid-phase humic materials(6, 9). Although these two humic phases are operationallyseparated, the terminology does not necessarily representtwo different mechanisms. Binding coefficients of PAHs todissolved humic substances were found in several studies tobe much higher than sorption coefficients to solid-phasehumics (6, 9-11). It was suggested that in contrast to dissolvedhumic material, part of the sites in mineral-bound humicsubstances is not available, resulting in reduced contaminantsorption. It can be also that sorption kinetics are much slowerthan binding kinetics, such that true sorption equilibrium insolid-phase humic materials is not always achieved (9). Onthe other hand, Chiou et al. (12) found that dissolved humicmaterial was less effective as compared to the bulk organicmatter in concentrating organic solutes and suggested thatit is mainly due to the high polarity of dissolved humic
materials and to their smaller organic environment, makingthe partition interaction less favorable for the solute.
Early works suggested a partitioning model to describethe interactions between hydrophobic organic contaminantsand humic materials (e.g., ref 13). This uniform, concentra-tion-independent distribution of a solute into a three-dimensional matrix was suggested for both dissolved andsolid-phase humic materials. Evidence for partitioningmechanism was taken to include linear isotherms, absenceof competition in multisolute systems, and good relationshipsbetween sorption or binding coefficients and Kow (4, 10, 12).More recent studies, however, reported nonlinear sorptionand bisolute competition for various hydrophobic contami-nants with soil or sediment (solid-phase) organic matter,indicating that site-specific sorption mechanisms are im-portant in addition to partitioning. A dual-mode sorptionmodel including both a partitioning domain and a site-specific domain has been found to successfully describe anumber of sorption isotherms in solid-phase organic matter.This dual sorption nature has been attributed to (i) glassyand rubbery domains in organic matter (14-17); (ii) smallamount of high surface area carbonaceous organic material(HSACM) admixed in a larger amount of solvent-like organicmatter (18, 19); (iii) rigidity in organic matter due tointramolecular polar bonds or site-specific interactions atlimited interior or external molecular surfaces (20, 21).
None of the above models has been applied to dissolvedorganic matter, as such it is still widely believed that bindinginteractions to dissolved humic substances can be adequatelydescribed by a partitioning process or simply by sitecomplexation in which a substantial excess of HA is present(22). Yet, there are a few studies in which nonlinear bindingmay be evident. For example, binding isotherms for benzo-[e]pyrene and benzo[k]fluoranthene with dissolved AldrichHA (23) and for benzo[k]fluoranthene with water-solublesoil organic matter (23, 24) deviated from linearity, althoughit was suspected by the authors to be an experimental artifact.Other evidence include nonlinear binding of pentachlo-robenzene to dissolved HA (25) and lindane to dissolvedfulvic acid (26).
Although the mechanisms of binding to dissolved humicsubstances and sorption to solid-phase humic substancesmay not be entirely different, the method chosen for analysisis different by definition. For solid-phase humic substances,sorption analysis can be simply performed by separating thefree (dissolved) contaminant from the sorbed contaminantby filtration or centrifugation. On the other hand, a differentmethodology is needed for dissolved humic substances inorder to separate between two dissolved entities, thecontaminant and the humic material. Various methods havebeen developed, among which are the dialysis (27), reverse-phase separation (28), solubility enhancement (12), andfluorescence quenching (FQ) (22). The various techniquesmay yield significantly different results (29, 30). The FQmethod has become one of the most popular techniquesbecause of its simplicity and elegance, but it is limited tofluorescent compounds and has been shown to overestimatebinding coefficient values (29). This overestimation was alsosupported by the results obtained using the complexation-flocculation (CF) method, recently developed by Laor andRebhun (31).
Using the CF method, this paper reports nonlinear bindingisotherms obtained with three PAHs (Table 1) and dissolvedHAs of three sources. In addition, slightly curved Stern-Volmer-type plots obtained by both the CF and the FQmethods were found to give another evidence for binding
* Corresponding author present address: Institute of Soils, Water,and Environmental Sciences, The Volcani Center, AgriculturalResearch Organization, P.O. Box 6, Bet Dagan 50250, Israel. Phone:+972 3 9683698; fax: +972 3 9604017; e-mail: [email protected].
Environ. Sci. Technol. 2002, 36, 955-961
10.1021/es001996g CCC: $22.00 2002 American Chemical Society VOL. 36, NO. 5, 2002 / ENVIRONMENTAL SCIENCE & TECHNOLOGY 9 955Published on Web 01/26/2002
nonlinearity. Accumulation of nonlinear evidence, as firstreported in this paper, suggests that partitioning or sitecomplexation in the presence of excess available sites cannotfully describe the interactions of hydrophobic contaminantswith dissolved humic materials.
Materials and MethodsReagents and Chemicals. Phenanthrene (Aldrich, Milwaukee,WI. 98% pure), pyrene (Aldrich, 99% pure), and fluoranthene(Fluka, 97% pure) were used as received. Concentrated stocksolutions were prepared in methanol. Aqueous solutions wereprepared by transferring 0.1-0.8 mL of PAH stock into 1 Lof deionized distilled water (d2H2O) containing 0.5 mequiv/LNaHCO3. The solution was stirred for 1-2 h, and pH wasadjusted to 6 with 0.1 N H2SO4. All PAH analyses were madeby fluorescence spectrometer (Shimadzu RF-1501) withexcitation/emission wavelengths (nm/nm) of 249/365, 333/390, and 281/464 for phenanthrene, pyrene, and fluoran-thene, respectively.
Soil HA reference 1R102H and peat HA reference 1R103Hwere obtained from the IHSS collection. Stock solutions (150-180 mg/L OC (organic carbon)) were prepared by dissolvingHA in d2H2O, slowly elevating the pH to 10-11 (0.1 N NaOH),and stirring for 30 min. The pH was then adjusted to 8 (0.1N HCl); the solutions were stirred for 2 additional hours andthen filtered through 0.2 polycarbonate filter (Poeretics,Livermore, CA). Aldrich HA (Aldrich, sodium salt) wasprepared by first dissolving the HA in a small volume of 1N NaOH, then diluting with d2H2O, adjusting the pH to 6,and stirring for 3 h. The solution was finally filtered throughWhatman GF-A followed by 0.45 µm (Gelman GN-60). Totalorganic carbon (TOC) concentrations of the stock solutionswere determined by TOC analyzer (Shimadzu 5000A).
Aluminum sulfate (1.84 g/L Al2(SO4)3‚16H2O, AnalaR,England, 98% pure; besides 0.1% of inorganic impurities, therest is most likely due to the water of crystallization) wasused as a coagulant for binding experiments using the CFmethod.
Binding Analyses. Binding was determined in batchexperiments by both the FQ and the CF methods as detailedbefore (31). Briefly, 30 mL Corex tubes were filled withaqueous solution (pH 6) of PAH at concentrations between5 and 75% of their water solubilities. Dissolved HA was added,and the tubes were shaken (70 strokes/min) in the dark atroom temperature (23 ( 2 °C) for the desired time period.In FQ experiments, the fluorescence (and UV absorbancefor “inner-filter effect” corrections) was then measured toaccount for the free and bound PAH fraction at each HAconcentration. In CF experiments, alum and the desiredamount of base were added to the equilibrated HA-PAHsolution (after the binding stage); tubes were shaken 10 timesby hand and then 20 min on a reciprocal shaker at 40 strokes/min. After settling overnight, the supernatant was withdrawnfrom the top 2-3 cm of the tube for fluorescence measure-ments to account for the free PAHs as well as for UVmeasurements to account for any HA remaining in solutionafter flocculation (UV absorbance after flocculation wasalways very low, and inner-filter corrections were not needed).To directly compare the CF and FQ methods in oneexperiment, fluorescence and UV absorbance measurementswere made before the addition of alum (FQ method), the
cuvette content was immediately returned back into the Corextube, and alum was then added for CF analysis. Data obtainedby the FQ method were fitted to Stern-Volmer equation (eq4; below). Similarly, the results of the CF method were plottedas Ctotal/Cfree vs OC (eq 3), allowing a direct comparisonbetween the two methods. All analyses were performed induplicates or triplicates and compared with control tubescontaining the specific PAH concentration to account forany loss during the course of the experiment (usually between1 and 3% only; 31). Figures include average values of triplicates(except Figure 3, which shows average values of duplicates)and error bars for their standard deviations. Nonlinearregression analysis (Origin, version 6.0, Microcal, Northamp-ton, MA) was used to determine parameters of the Freundlichequation.
Mathematical and Graphical Presentation of BindingAnalysesTo facilitate a comparison between the results obtained bythe FQ and the CF methods, it is essential to visualize themathematical and graphical relationships between the twoways of presentation. If linear behavior is assumed, then:
where Cs is the humic-bound contaminant concentration(w/w), Cfree is the free contaminant concentration (w/v), andKdoc is the binding coefficient normalized to the dissolvedhumic OC content. Linear isotherm (Cs vs Cfree) is character-ized by a straight line with an intercept of zero, and its sloperepresents the value of Kdoc. Equation 1 can be expressed as
where Ctotal and Cbound are the total and bound contaminantconcentrations (w/v), respectively. Rearranging eq 2 yields
Plotting Ctotal/Cfree against [OC] yields a curve with an interceptof 1 and a slope that represents the value of Kdoc. Equation3 is identical to the form of Stern-Volmer equation used byGauthier et al. (22) to determine Kdoc values by the FQtechnique, provided that the fluorescence intensity is pro-portional to concentration of the free contaminant only:
where F0 and F are the fluorescence intensity of thecontaminant in the absence (F0) and in the presence (F) ofa quencher (OC).
If nonlinear Freundlich-type binding interactions areexpected, then
Similarly to the development in eqs 2 and 3, it can beexpressed as
and
TABLE 1. Chemical and Physical Properties of the PAHs Usedin This Study
MW Sw (mg/L) log Kow
pyrene 202.26 0.135 (32, 34) 5.18 (32)fluoranthene 202.26 0.265 (33) 5.22 (35)phenanthrene 178.24 1.290 (32, 33) 4.57 (32)
Cs ) KdocCfree (1)
Cbound
[OC])
Ctotal - Cfree
[OC]) KdocCfree (2)
Ctotal
Cfree) 1 + Kdoc[OC] (3)
F0
F) 1 + Kdoc[OC] (4)
Cs ) KFCfreen (5)
Ctotal - Cfree
[OC]) KFCfree
n (6)
Ctotal
Cfree) 1 + KF[OC]Cfree
n-1 (7)
956 9 ENVIRONMENTAL SCIENCE & TECHNOLOGY / VOL. 36, NO. 5, 2002
Equation 7 is nonlinear and is not identical to the form ofStern-Volmer equation (eq 4). Therefore, the use of Stern-Volmer equation to calculate Kdoc values is valid only if bindingis linear. Equation 4 was indeed derived by Gauthier et al.(22) simply from an equilibrium expression, which waseventually based on linear partitioning uptake or on sitecomplexation in the presence of excess HA.
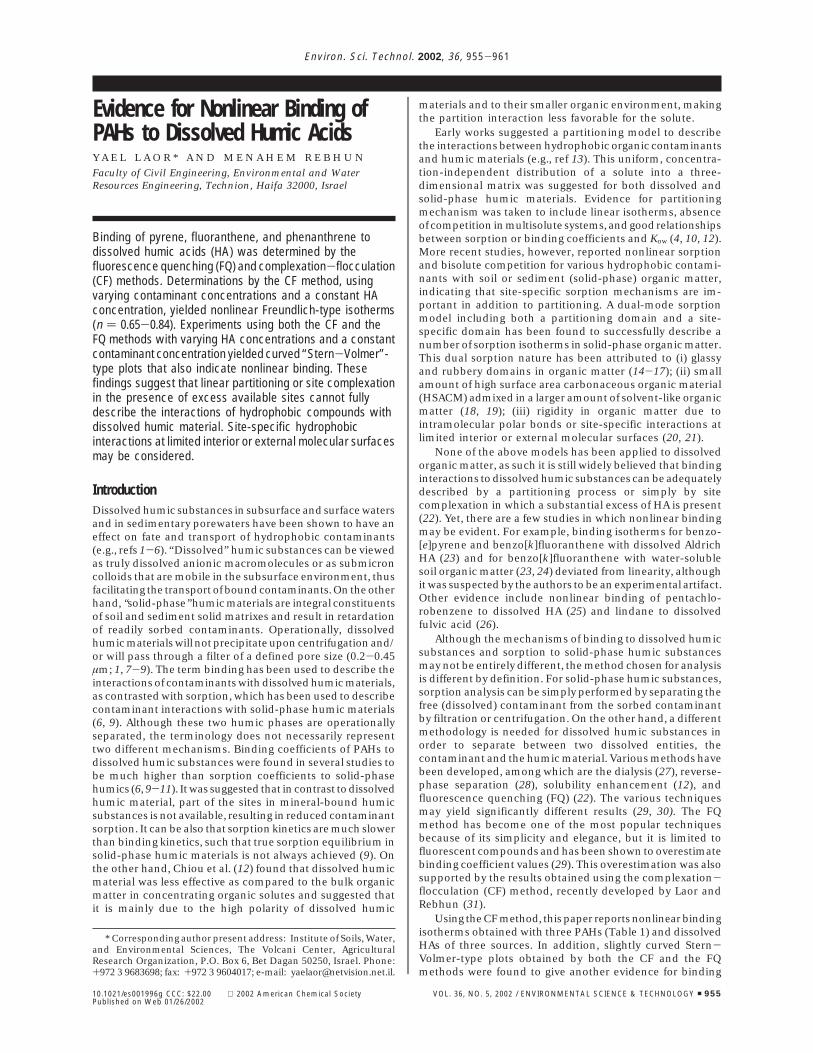
Figure 1 illustrates these two ways of presentation forlinear (panels a and b) and nonlinear (panels c and d)relationships. Each data point is numbered to illustrate thefact that the data point that is the closest to the origin on theCs vs Cfree plot is the farthest from the origin on the equivalentStern-Volmer plot. When binding is linear (Figure 1a,b), thedata fit a straight line with an intercept of 0 for Cs vs Cfree plotor of 1 for Ctotal/Cfree vs OC plot. When binding is nonlinear(Figure 1c,d), the Cs vs Cfree plot is curved toward the x-axis,and the Ctotal/Cfree vs OC plot is curved toward the y-axis.Note that binding experiments that are performed by varyingOC and maintaining a constant Ctotal can be represented eitheras Cs vs Cfree isotherms or as Stern-Volmer-type plots.However, for binding experiments that are performed byvarying Ctotal and maintaining a constant OC, only Cs vs Cfree
isotherms can be plotted since on Stern-Volmer-type plotssuch data will give a single data point in a linear case or willdistributed vertically in a nonlinear case.
In cases when Stern-Volmer-type plots are constructedfor a narrow Ctotal/Cfree (or F0/F) range, curvature toward they-axis (which indicates nonlinearity) may be masked. A“warning sign” for such curvature is that the intercept of thelinear regression line falls below 1. This can be observed buthas not been discussed in several studies in which the Ctotal/Cfree range was up to 1.5-3 only (e.g., phenanthrene withseveral HAs, 9; pyrene with Suwannee HA, 29; pyrene withsoil and peat HA, 31; and naphthalene with water-solublesoil organic matter, 36). By comparing Figure 1 panel a withpanel b and panel c with panel d, it becomes clear that whenStern-Volmer plots are constructed only for such a narrowCtotal/Cfree range, they represent only a small segment of theequivalent Cs vs Cfree isotherm. As such, it is critical to realizethat linear or nonlinear behavior can hardly be deduced frommost of these binding studies.
Results and DiscussionBinding Analyses Using Varying Ctotal and a Constant OCConcentration (CF Method). A nonlinear binding isotherm
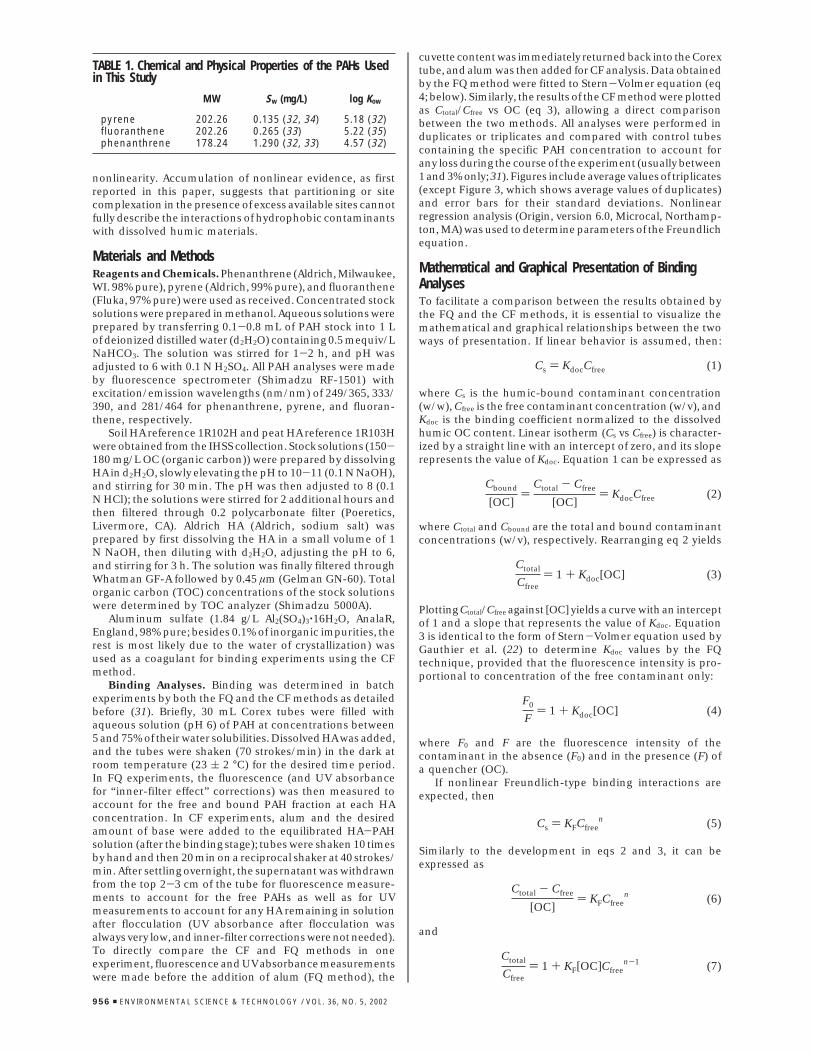
(n ) 0.65 ( 0.02) was obtained for pyrene with dissolved soilHA at contact times of 15 min and 20-24 h (Figure 2). Thiscontact time represents the “complexation” stage before alumis added (31). Nonlinearity can be clearly seen in the insetof Kdoc values calculated for each individual data point plottedagainst Cfree values. The strong decrease in apparent Kdoc
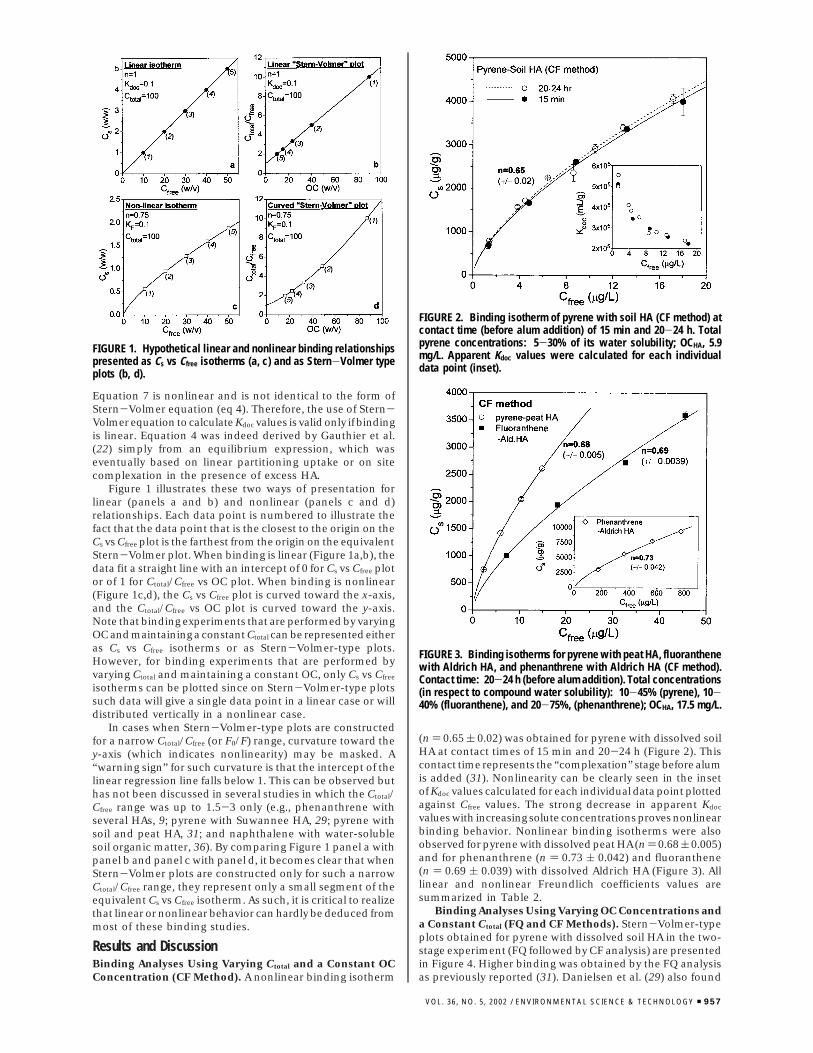
values with increasing solute concentrations proves nonlinearbinding behavior. Nonlinear binding isotherms were alsoobserved for pyrene with dissolved peat HA (n ) 0.68 ( 0.005)and for phenanthrene (n ) 0.73 ( 0.042) and fluoranthene(n ) 0.69 ( 0.039) with dissolved Aldrich HA (Figure 3). Alllinear and nonlinear Freundlich coefficients values aresummarized in Table 2.
Binding Analyses Using Varying OC Concentrations anda Constant Ctotal (FQ and CF Methods). Stern-Volmer-typeplots obtained for pyrene with dissolved soil HA in the two-stage experiment (FQ followed by CF analysis) are presentedin Figure 4. Higher binding was obtained by the FQ analysisas previously reported (31). Danielsen et al. (29) also found
FIGURE 1. Hypothetical linear and nonlinear binding relationshipspresented as Cs vs Cfree isotherms (a, c) and as Stern-Volmer typeplots (b, d).
FIGURE 2. Binding isotherm of pyrene with soil HA (CF method) atcontact time (before alum addition) of 15 min and 20-24 h. Totalpyrene concentrations: 5-30% of its water solubility; OCHA, 5.9mg/L. Apparent Kdoc values were calculated for each individualdata point (inset).
FIGURE 3. Binding isotherms for pyrene with peat HA, fluoranthenewith Aldrich HA, and phenanthrene with Aldrich HA (CF method).Contact time: 20-24 h (before alum addition). Total concentrations(in respect to compound water solubility): 10-45% (pyrene), 10-40% (fluoranthene), and 20-75%, (phenanthrene); OCHA, 17.5 mg/L.
VOL. 36, NO. 5, 2002 / ENVIRONMENTAL SCIENCE & TECHNOLOGY 9 957
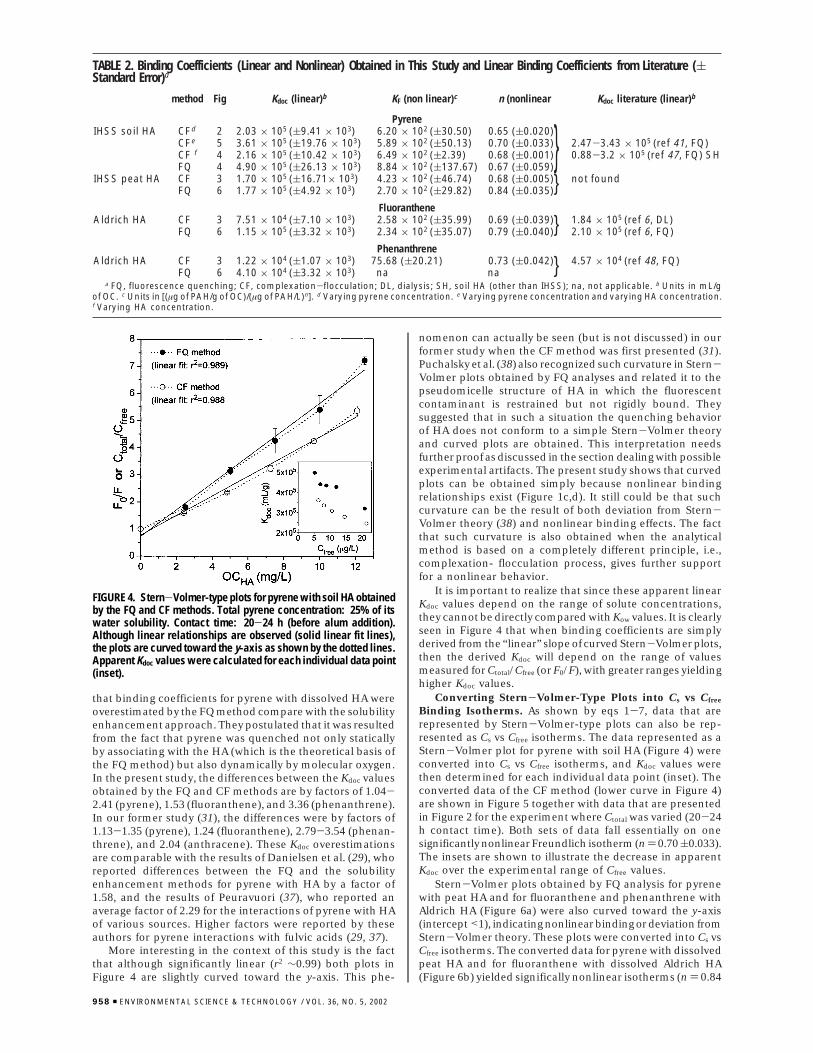
that binding coefficients for pyrene with dissolved HA wereoverestimated by the FQ method compare with the solubilityenhancement approach. They postulated that it was resultedfrom the fact that pyrene was quenched not only staticallyby associating with the HA (which is the theoretical basis ofthe FQ method) but also dynamically by molecular oxygen.In the present study, the differences between the Kdoc valuesobtained by the FQ and CF methods are by factors of 1.04-2.41 (pyrene), 1.53 (fluoranthene), and 3.36 (phenanthrene).In our former study (31), the differences were by factors of1.13-1.35 (pyrene), 1.24 (fluoranthene), 2.79-3.54 (phenan-threne), and 2.04 (anthracene). These Kdoc overestimationsare comparable with the results of Danielsen et al. (29), whoreported differences between the FQ and the solubilityenhancement methods for pyrene with HA by a factor of1.58, and the results of Peuravuori (37), who reported anaverage factor of 2.29 for the interactions of pyrene with HAof various sources. Higher factors were reported by theseauthors for pyrene interactions with fulvic acids (29, 37).
More interesting in the context of this study is the factthat although significantly linear (r2 ∼0.99) both plots inFigure 4 are slightly curved toward the y-axis. This phe-
nomenon can actually be seen (but is not discussed) in ourformer study when the CF method was first presented (31).Puchalsky et al. (38) also recognized such curvature in Stern-Volmer plots obtained by FQ analyses and related it to thepseudomicelle structure of HA in which the fluorescentcontaminant is restrained but not rigidly bound. Theysuggested that in such a situation the quenching behaviorof HA does not conform to a simple Stern-Volmer theoryand curved plots are obtained. This interpretation needsfurther proof as discussed in the section dealing with possibleexperimental artifacts. The present study shows that curvedplots can be obtained simply because nonlinear bindingrelationships exist (Figure 1c,d). It still could be that suchcurvature can be the result of both deviation from Stern-Volmer theory (38) and nonlinear binding effects. The factthat such curvature is also obtained when the analyticalmethod is based on a completely different principle, i.e.,complexation- flocculation process, gives further supportfor a nonlinear behavior.
It is important to realize that since these apparent linearKdoc values depend on the range of solute concentrations,they cannot be directly compared with Kow values. It is clearlyseen in Figure 4 that when binding coefficients are simplyderived from the “linear” slope of curved Stern-Volmer plots,then the derived Kdoc will depend on the range of valuesmeasured for Ctotal/Cfree (or F0/F), with greater ranges yieldinghigher Kdoc values.
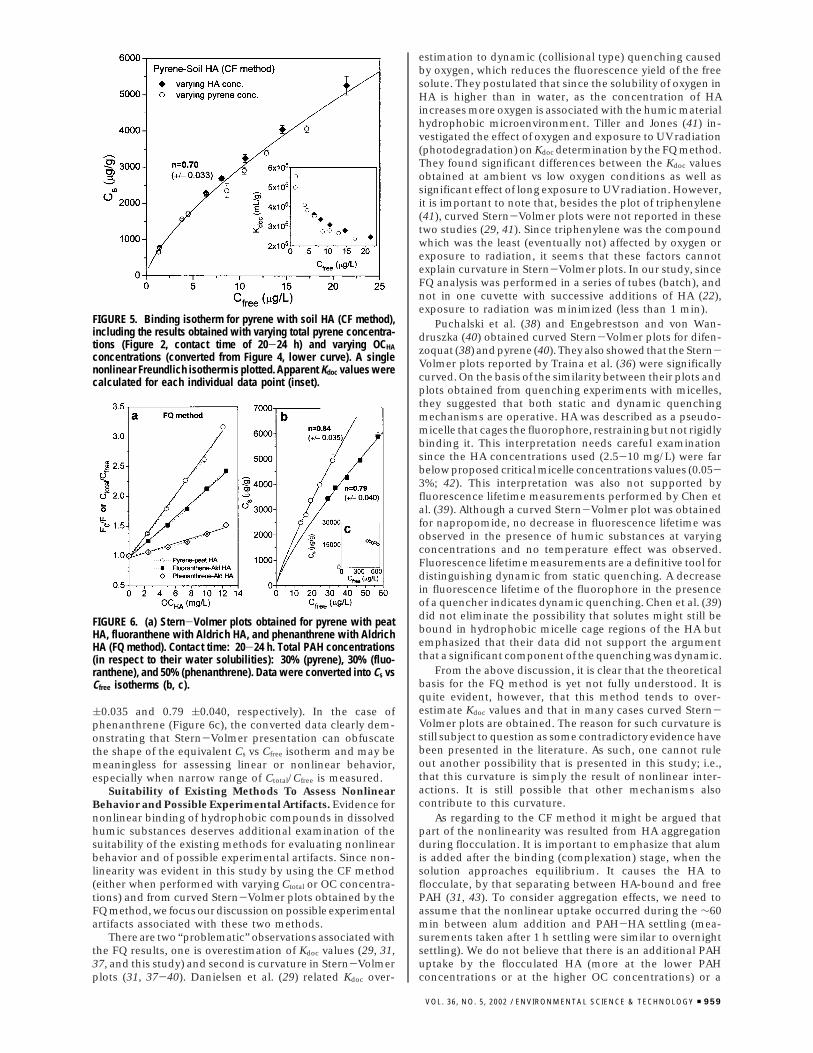
Converting Stern-Volmer-Type Plots into Cs vs Cfree
Binding Isotherms. As shown by eqs 1-7, data that arerepresented by Stern-Volmer-type plots can also be rep-resented as Cs vs Cfree isotherms. The data represented as aStern-Volmer plot for pyrene with soil HA (Figure 4) wereconverted into Cs vs Cfree isotherms, and Kdoc values werethen determined for each individual data point (inset). Theconverted data of the CF method (lower curve in Figure 4)are shown in Figure 5 together with data that are presentedin Figure 2 for the experiment where Ctotal was varied (20-24h contact time). Both sets of data fall essentially on onesignificantly nonlinear Freundlich isotherm (n ) 0.70 (0.033).The insets are shown to illustrate the decrease in apparentKdoc over the experimental range of Cfree values.
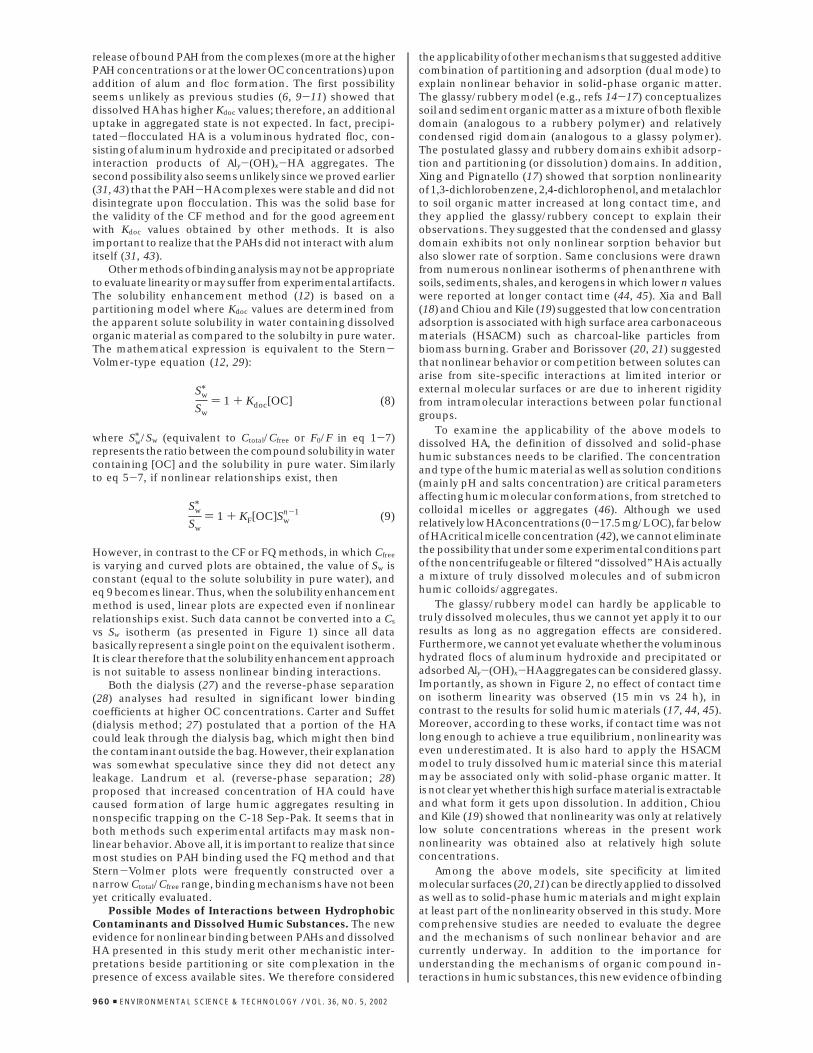
Stern-Volmer plots obtained by FQ analysis for pyrenewith peat HA and for fluoranthene and phenanthrene withAldrich HA (Figure 6a) were also curved toward the y-axis(intercept <1), indicating nonlinear binding or deviation fromStern-Volmer theory. These plots were converted into Cs vsCfree isotherms. The converted data for pyrene with dissolvedpeat HA and for fluoranthene with dissolved Aldrich HA(Figure 6b) yielded significally nonlinear isotherms (n ) 0.84
TABLE 2. Binding Coefficients (Linear and Nonlinear) Obtained in This Study and Linear Binding Coefficients from Literature ((Standard Error)a
method Fig Kdoc (linear)b KF (non linear)c n (nonlinear Kdoc literature (linear)b
PyreneIHSS soil HA CFd 2 2.03 × 10⁵ ((9.41 × 10³) 6.20 × 10² ((30.50) 0.65 ((0.020)}CFe 5 3.61 × 10⁵ ((19.76 × 10³) 5.89 × 10² ((50.13) 0.70 ((0.033) 2.47-3.43 × 10⁵ (ref 41, FQ)
CF f 4 2.16 × 10⁵ ((10.42 × 10³) 6.49 × 10² ((2.39) 0.68 ((0.001) 0.88-3.2 × 10⁵ (ref 47, FQ) SHFQ 4 4.90 × 10⁵ ((26.13 × 10³) 8.84 × 10² ((137.67) 0.67 ((0.059)
IHSS peat HA CF 3 1.70 × 10⁵ ((16.71× 10³) 4.23 × 10² ((46.74) 0.68 ((0.005)} not foundFQ 6 1.77 × 10⁵ ((4.92 × 10³) 2.70 × 10² ((29.82) 0.84 ((0.035)
FluorantheneAldrich HA CF 3 7.51 × 10⁴ ((7.10 × 10³) 2.58 × 10² ((35.99) 0.69 ((0.039)} 1.84 × 10⁵ (ref 6, DL)
FQ 6 1.15 × 10⁵ ((3.32 × 10³) 2.34 × 10² ((35.07) 0.79 ((0.040) 2.10 × 10⁵ (ref 6, FQ)
PhenanthreneAldrich HA CF 3 1.22 × 10⁴ ((1.07 × 10³) 75.68 ((20.21) 0.73 ((0.042)} 4.57 × 10⁴ (ref 48, FQ)
FQ 6 4.10 × 10⁴ ((3.32 × 10³) na naa FQ, fluorescence quenching; CF, complexation-flocculation; DL, dialysis; SH, soil HA (other than IHSS); na, not applicable. b Units in mL/g
of OC. c Units in [(µg of PAH/g of OC)/(µg of PAH/L)n]. d Varying pyrene concentration. e Varying pyrene concentration and varying HA concentration.f Varying HA concentration.
FIGURE 4. Stern-Volmer-type plots for pyrene with soil HA obtainedby the FQ and CF methods. Total pyrene concentration: 25% of itswater solubility. Contact time: 20-24 h (before alum addition).Although linear relationships are observed (solid linear fit lines),the plots are curved toward the y-axis as shown by the dotted lines.Apparent Kdoc values were calculated for each individual data point(inset).
958 9 ENVIRONMENTAL SCIENCE & TECHNOLOGY / VOL. 36, NO. 5, 2002
(0.035 and 0.79 (0.040, respectively). In the case ofphenanthrene (Figure 6c), the converted data clearly dem-onstrating that Stern-Volmer presentation can obfuscatethe shape of the equivalent Cs vs Cfree isotherm and may bemeaningless for assessing linear or nonlinear behavior,especially when narrow range of Ctotal/Cfree is measured.
Suitability of Existing Methods To Assess NonlinearBehavior and Possible Experimental Artifacts. Evidence fornonlinear binding of hydrophobic compounds in dissolvedhumic substances deserves additional examination of thesuitability of the existing methods for evaluating nonlinearbehavior and of possible experimental artifacts. Since non-linearity was evident in this study by using the CF method(either when performed with varying Ctotal or OC concentra-tions) and from curved Stern-Volmer plots obtained by theFQ method, we focus our discussion on possible experimentalartifacts associated with these two methods.
There are two “problematic” observations associated withthe FQ results, one is overestimation of Kdoc values (29, 31,37, and this study) and second is curvature in Stern-Volmerplots (31, 37-40). Danielsen et al. (29) related Kdoc over-
estimation to dynamic (collisional type) quenching causedby oxygen, which reduces the fluorescence yield of the freesolute. They postulated that since the solubility of oxygen inHA is higher than in water, as the concentration of HAincreases more oxygen is associated with the humic materialhydrophobic microenvironment. Tiller and Jones (41) in-vestigated the effect of oxygen and exposure to UV radiation(photodegradation) on Kdoc determination by the FQ method.They found significant differences between the Kdoc valuesobtained at ambient vs low oxygen conditions as well assignificant effect of long exposure to UV radiation. However,it is important to note that, besides the plot of triphenylene(41), curved Stern-Volmer plots were not reported in thesetwo studies (29, 41). Since triphenylene was the compoundwhich was the least (eventually not) affected by oxygen orexposure to radiation, it seems that these factors cannotexplain curvature in Stern-Volmer plots. In our study, sinceFQ analysis was performed in a series of tubes (batch), andnot in one cuvette with successive additions of HA (22),exposure to radiation was minimized (less than 1 min).
Puchalski et al. (38) and Engebrestson and von Wan-druszka (40) obtained curved Stern-Volmer plots for difen-zoquat (38) and pyrene (40). They also showed that the Stern-Volmer plots reported by Traina et al. (36) were significallycurved. On the basis of the similarity between their plots andplots obtained from quenching experiments with micelles,they suggested that both static and dynamic quenchingmechanisms are operative. HA was described as a pseudo-micelle that cages the fluorophore, restraining but not rigidlybinding it. This interpretation needs careful examinationsince the HA concentrations used (2.5-10 mg/L) were farbelow proposed critical micelle concentrations values (0.05-3%; 42). This interpretation was also not supported byfluorescence lifetime measurements performed by Chen etal. (39). Although a curved Stern-Volmer plot was obtainedfor napropomide, no decrease in fluorescence lifetime wasobserved in the presence of humic substances at varyingconcentrations and no temperature effect was observed.Fluorescence lifetime measurements are a definitive tool fordistinguishing dynamic from static quenching. A decreasein fluorescence lifetime of the fluorophore in the presenceof a quencher indicates dynamic quenching. Chen et al. (39)did not eliminate the possibility that solutes might still bebound in hydrophobic micelle cage regions of the HA butemphasized that their data did not support the argumentthat a significant component of the quenching was dynamic.
From the above discussion, it is clear that the theoreticalbasis for the FQ method is yet not fully understood. It isquite evident, however, that this method tends to over-estimate Kdoc values and that in many cases curved Stern-Volmer plots are obtained. The reason for such curvature isstill subject to question as some contradictory evidence havebeen presented in the literature. As such, one cannot ruleout another possibility that is presented in this study; i.e.,that this curvature is simply the result of nonlinear inter-actions. It is still possible that other mechanisms alsocontribute to this curvature.
As regarding to the CF method it might be argued thatpart of the nonlinearity was resulted from HA aggregationduring flocculation. It is important to emphasize that alumis added after the binding (complexation) stage, when thesolution approaches equilibrium. It causes the HA toflocculate, by that separating between HA-bound and freePAH (31, 43). To consider aggregation effects, we need toassume that the nonlinear uptake occurred during the ∼60min between alum addition and PAH-HA settling (mea-surements taken after 1 h settling were similar to overnightsettling). We do not believe that there is an additional PAHuptake by the flocculated HA (more at the lower PAHconcentrations or at the higher OC concentrations) or a
FIGURE 5. Binding isotherm for pyrene with soil HA (CF method),including the results obtained with varying total pyrene concentra-tions (Figure 2, contact time of 20-24 h) and varying OCHA
concentrations (converted from Figure 4, lower curve). A singlenonlinear Freundlich isotherm is plotted. Apparent Kdoc values werecalculated for each individual data point (inset).
FIGURE 6. (a) Stern-Volmer plots obtained for pyrene with peatHA, fluoranthene with Aldrich HA, and phenanthrene with AldrichHA (FQ method). Contact time: 20-24 h. Total PAH concentrations(in respect to their water solubilities): 30% (pyrene), 30% (fluo-ranthene), and 50% (phenanthrene). Data were converted into Cs vsCfree isotherms (b, c).
VOL. 36, NO. 5, 2002 / ENVIRONMENTAL SCIENCE & TECHNOLOGY 9 959
release of bound PAH from the complexes (more at the higherPAH concentrations or at the lower OC concentrations) uponaddition of alum and floc formation. The first possibilityseems unlikely as previous studies (6, 9-11) showed thatdissolved HA has higher Kdoc values; therefore, an additionaluptake in aggregated state is not expected. In fact, precipi-tated-flocculated HA is a voluminous hydrated floc, con-sisting of aluminum hydroxide and precipitated or adsorbedinteraction products of Aly-(OH)x-HA aggregates. Thesecond possibility also seems unlikely since we proved earlier(31, 43) that the PAH-HA complexes were stable and did notdisintegrate upon flocculation. This was the solid base forthe validity of the CF method and for the good agreementwith Kdoc values obtained by other methods. It is alsoimportant to realize that the PAHs did not interact with alumitself (31, 43).
Other methods of binding analysis may not be appropriateto evaluate linearity or may suffer from experimental artifacts.The solubility enhancement method (12) is based on apartitioning model where Kdoc values are determined fromthe apparent solute solubility in water containing dissolvedorganic material as compared to the solubilty in pure water.The mathematical expression is equivalent to the Stern-Volmer-type equation (12, 29):
where Sw/ /Sw (equivalent to Ctotal/Cfree or F0/F in eq 1-7)
represents the ratio between the compound solubility in watercontaining [OC] and the solubility in pure water. Similarlyto eq 5-7, if nonlinear relationships exist, then
However, in contrast to the CF or FQ methods, in which Cfree
is varying and curved plots are obtained, the value of Sw isconstant (equal to the solute solubility in pure water), andeq 9 becomes linear. Thus, when the solubility enhancementmethod is used, linear plots are expected even if nonlinearrelationships exist. Such data cannot be converted into a Cs
vs Sw isotherm (as presented in Figure 1) since all databasically represent a single point on the equivalent isotherm.It is clear therefore that the solubility enhancement approachis not suitable to assess nonlinear binding interactions.
Both the dialysis (27) and the reverse-phase separation(28) analyses had resulted in significant lower bindingcoefficients at higher OC concentrations. Carter and Suffet(dialysis method; 27) postulated that a portion of the HAcould leak through the dialysis bag, which might then bindthe contaminant outside the bag. However, their explanationwas somewhat speculative since they did not detect anyleakage. Landrum et al. (reverse-phase separation; 28)proposed that increased concentration of HA could havecaused formation of large humic aggregates resulting innonspecific trapping on the C-18 Sep-Pak. It seems that inboth methods such experimental artifacts may mask non-linear behavior. Above all, it is important to realize that sincemost studies on PAH binding used the FQ method and thatStern-Volmer plots were frequently constructed over anarrow Ctotal/Cfree range, binding mechanisms have not beenyet critically evaluated.
Possible Modes of Interactions between HydrophobicContaminants and Dissolved Humic Substances. The newevidence for nonlinear binding between PAHs and dissolvedHA presented in this study merit other mechanistic inter-pretations beside partitioning or site complexation in thepresence of excess available sites. We therefore considered
the applicability of other mechanisms that suggested additivecombination of partitioning and adsorption (dual mode) toexplain nonlinear behavior in solid-phase organic matter.The glassy/rubbery model (e.g., refs 14-17) conceptualizessoil and sediment organic matter as a mixture of both flexibledomain (analogous to a rubbery polymer) and relativelycondensed rigid domain (analogous to a glassy polymer).The postulated glassy and rubbery domains exhibit adsorp-tion and partitioning (or dissolution) domains. In addition,Xing and Pignatello (17) showed that sorption nonlinearityof 1,3-dichlorobenzene, 2,4-dichlorophenol, and metalachlorto soil organic matter increased at long contact time, andthey applied the glassy/rubbery concept to explain theirobservations. They suggested that the condensed and glassydomain exhibits not only nonlinear sorption behavior butalso slower rate of sorption. Same conclusions were drawnfrom numerous nonlinear isotherms of phenanthrene withsoils, sediments, shales, and kerogens in which lower n valueswere reported at longer contact time (44, 45). Xia and Ball(18) and Chiou and Kile (19) suggested that low concentrationadsorption is associated with high surface area carbonaceousmaterials (HSACM) such as charcoal-like particles frombiomass burning. Graber and Borissover (20, 21) suggestedthat nonlinear behavior or competition between solutes canarise from site-specific interactions at limited interior orexternal molecular surfaces or are due to inherent rigidityfrom intramolecular interactions between polar functionalgroups.
To examine the applicability of the above models todissolved HA, the definition of dissolved and solid-phasehumic substances needs to be clarified. The concentrationand type of the humic material as well as solution conditions(mainly pH and salts concentration) are critical parametersaffecting humic molecular conformations, from stretched tocolloidal micelles or aggregates (46). Although we usedrelatively low HA concentrations (0-17.5 mg/L OC), far belowof HA critical micelle concentration (42), we cannot eliminatethe possibility that under some experimental conditions partof the noncentrifugeable or filtered “dissolved” HA is actuallya mixture of truly dissolved molecules and of submicronhumic colloids/aggregates.
The glassy/rubbery model can hardly be applicable totruly dissolved molecules, thus we cannot yet apply it to ourresults as long as no aggregation effects are considered.Furthermore, we cannot yet evaluate whether the voluminoushydrated flocs of aluminum hydroxide and precipitated oradsorbed Aly-(OH)x-HA aggregates can be considered glassy.Importantly, as shown in Figure 2, no effect of contact timeon isotherm linearity was observed (15 min vs 24 h), incontrast to the results for solid humic materials (17, 44, 45).Moreover, according to these works, if contact time was notlong enough to achieve a true equilibrium, nonlinearity waseven underestimated. It is also hard to apply the HSACMmodel to truly dissolved humic material since this materialmay be associated only with solid-phase organic matter. Itis not clear yet whether this high surface material is extractableand what form it gets upon dissolution. In addition, Chiouand Kile (19) showed that nonlinearity was only at relativelylow solute concentrations whereas in the present worknonlinearity was obtained also at relatively high soluteconcentrations.
Among the above models, site specificity at limitedmolecular surfaces (20, 21) can be directly applied to dissolvedas well as to solid-phase humic materials and might explainat least part of the nonlinearity observed in this study. Morecomprehensive studies are needed to evaluate the degreeand the mechanisms of such nonlinear behavior and arecurrently underway. In addition to the importance forunderstanding the mechanisms of organic compound in-teractions in humic substances, this new evidence of binding
Sw/
Sw) 1 + Kdoc[OC] (8)
Sw/
Sw) 1 + KF[OC]Sw
n-1 (9)
960 9 ENVIRONMENTAL SCIENCE & TECHNOLOGY / VOL. 36, NO. 5, 2002
nonlinearity may have important implications for predictingcontaminant fate and transport. Apparent linear Kdoc valuesobtained from Stern-Volmer-type plots may still be usefulfor predictions in the range of contaminants and humicstested. However, if binding coefficients derived from relativelyhigh aqueous phase contaminant concentrations are ex-trapolated to a much lower range of concentrations, thenthe role of dissolved humic substances may be substantiallyunderestimated.
AcknowledgmentsWe thank Prof. Russell Christman, Dr. Ellen Graber, and Dr.Mikhail Borisover for fruitful discussions and helpful sug-gestions. We also thank three anonymous reviewers for theirvaluable comments. This research was supported by the IsraelWater Research Institute Project 015-033.
Literature Cited(1) McCarthy, J. F.; Jimenez, B. D. Environ. Sci. Technol. 1985, 19,
1072-1076.(2) Gschwend, P. M.; Wu, S. Environ. Sci. Technol. 1985, 19, 90-96.(3) Gschwend, P. M.; Reynolds, M. D. J. Contam. Hydrol. 1987, 1,
309.(4) Caron, G.; Suffet, I. H. In Aquatic Humic Substances, Influence
on Fate and Treatment of Pollutants; Suffet, I. H., MacCarthy,P., Eds.; American Chemical Society: Washington, DC, 1989; pp117-130.
(5) McCarthy, J. F.; Zachara, J. M. Environ. Sci. Technol. 1989, 23,496-502.
(6) Rav-Acha, Ch.; Rebhun, M. Water Res. 1992, 26, 1645-1654.(7) Schlautman, M. A.; Morgan, J. J. Environ. Sci. Technol. 1993, 27,
961-969.(8) Kosian, P. A.; Hoke, R. A.; Ankley, G. T.; Vandermeiden, F. M.
Environ. Toxicol. Chem. 1995, 14, 445-450.(9) Laor, Y.; Farmer, W. J.; Aochi, Y.; Strom, P. F. Water Res. 1998,
32, 1923-1931.(10) Murphy, E. M.; Zachara, J. M.; Smith, S. C. Environ. Sci. Technol.
1990, 24, 1507-1516.(11) Jones, K. D.; Tiller, C. L. Environ. Sci. Technol. 1999, 33, 580-
587.(12) Chiou, C. T.; Malcolm, R. L.; Brinton, T. I.; Kile, D. E. Environ.
Sci. Technol. 1986, 20, 502-508.(13) Schwarzenbach, R. P.; Gschwend, P. M.; Imboden, D. M.
Environmental Organic Chemistry; John Wiley: New York, 1993;pp 255-284.
(14) Young, T. M.; Weber, W. J., Jr. Environ. Sci. Technol. 1995, 29,92-97.
(15) Leboeuf, E. J.; Weber, W. J., Jr. Environ. Sci. Technol. 1997, 31,1697-1702.
(16) Xing, B.; Pignatello, J. J. Environ. Sci. Technol. 1997, 31, 792-799.
(17) Xing, B.; Pignatello, J. J. Environ. Toxicol. Chem. 1996, 15, 1282-1288.
(18) Xia, G.; Ball, W. P. Environ. Sci. Technol. 1999, 33, 262-269.(19) Chiou, C. T.; Kile, D. E. Environ. Sci. Technol. 1998, 32, 338-
343.
(20) Graber, E. R.; Borisover, M. D. Environ. Sci. Technol. 1998, 32,258-263.
(21) Graber, E. R.; Borisover, M. D. Environ. Sci. Technol. 1998, 32,3286-3292.
(22) Gauthier, T. D.; Shane, E. C.; Guerin, W. F.; Seitz, W. R.; Grant,C. L. Environ. Sci. Technol. 1986, 20, 1162-1166.
(23) Maxin, C. R.; Kogel-Knabner, I. Eur. J. Soil. Sci. 1995, 46, 193-204.
(24) Raber, B.; Kogel-Knabner, I.; Stein, C.; Klem, D. Chemosphere1998, 36, 79-97.
(25) Schlebaum, W.; Badora, A.; Schraa, G.; van Riemsdijk, W. H.Environ. Sci. Technol. 1998, 32, 2273-2277.
(26) Tramonti, V.; Zienius, R. H.; Gamble, D. S. Int. J. Environ. Anal.Chem. 1986, 24, 203-212.
(27) Carter, C. W.; Suffet, I. H. Environ. Sci. Technol. 1982, 16, 735-740.
(28) Landrum, P. F.; Nihart, S. R.; Eadle, B. J.; Gardner, W. S. Environ.Sci. Technol. 1984, 18, 187-192.
(29) Danielsen, K. M.; Chin, Y.-P.; Buterbaugh, J. S.; Gustafson, T.L.; Traina, S. J. Environ. Sci. Technol. 1995, 29, 2162-2165.
(30) Kukkonen, J.; Pellinen, J. Sci. Total Environ. 1994, 152, 19-29.(31) Laor, Y.; Rebhun, M. Environ. Sci. Technol. 1997, 31, 3558-
3564.(32) Karickhoff, S. W.; Brown, D. S.; Scott, T. A. Water Res. 1979, 13,
241-248.(33) Mackay, D.; Shiu, W. Y. J. Chem. Eng. Data 1977, 22, 399-402.(34) Mackay, D.; Shiu, W. Y. J. Phys. Chem. Ref. Data 1981, 10, 1175-
1199.(35) Mackay, D.; Bobra, A. M.; Shiu, W. Y.; Yalkowsky, S. H.
Chemosphere 1980, 9, 701-711.(36) Traina, S. J.; Spontak, D. A.; Logan, T. J. J. Environ. Qual. 1989,
18, 221-227.(37) Peuravuori, J. Anal. Chim. Acta 2001, 429, 65-73.(38) Puchalski, M. M.; Morra, M. J.; von Wandruszka, R. Environ. Sci.
Technol. 1992, 26, 1787-1792.(39) Chen, S.; Inskeep, W. P.; Williams, S. A.; Callis, P. R. Environ.
Sci. Technol. 1994, 28, 1582-1588.(40) Engebretson, R. R.; von Wandruszka, R. Environ. Sci. Technol.
1994, 28, 1934-1941.(41) Tiller, C. L.; Jones, K. D. Environ. Sci. Technol. 1997, 31, 424-
429.(42) Chien, Y.-Y.; Kim, E.-G.; Bleam, W. F. Environ. Sci. Technol.
1997, 31, 3204-3208.(43) Rebhun, M.; Meir, S.; Laor, Y. Environ. Sci. Technol. 1998, 32,
981-986.(44) Huang, W.; Young, T. M.; Schlautman, M. A.; Yu, H.; Weber, W.
J., Jr. Environ. Sci. Technol. 1997, 31, 1703-1710.(45) Huang, W.; Weber, W. J., Jr. Environ. Sci. Technol. 1998, 32,
3549-3555.(46) Engebretson, R. R.; Amos, T.; von Wandruszka, R. Environ. Sci.
Technol. 1996, 30, 990-997.(47) Gauthier, T. D.; Seitz, W. R.; Grant, C. L. Environ. Sci. Technol.
1987, 21, 243-248.(48) Sabbah, I. Ph.D. Dissertation, Technion, Israel, 1997.
Received for review December 20, 2000. Revised manuscriptreceived October 10, 2001. Accepted November 21, 2001.
ES001996G
VOL. 36, NO. 5, 2002 / ENVIRONMENTAL SCIENCE & TECHNOLOGY 9 961