evidence for contrasting causes of population change in two closely related, sympatric breeding...
TRANSCRIPT
This article was downloaded by: [New York University]On: 09 October 2014, At: 06:07Publisher: Taylor & FrancisInforma Ltd Registered in England and Wales Registered Number: 1072954 Registered office: Mortimer House,37-41 Mortimer Street, London W1T 3JH, UK
Bird StudyPublication details, including instructions for authors and subscription information:http://www.tandfonline.com/loi/tbis20
Evidence for contrasting causes of population changein two closely related, sympatric breeding speciesthe Whinchat Saxicola rubetra and Stonechat Saxicolatorquata in BritainIan Hendersona, John Calladineb, Dario Massiminoa, Jennifer A. Taylorc & Simon Gillingsa
a British Trust for Ornithology, The Nunnery, Thetford, Norfolk IP24 2QA, UKb British Trust for Ornithology Scotland, Cottrell Building, University of Stirling, Stirling FK99LA, UKc Lancaster Environment Centre, Lancaster University, Lancaster LA1 4YQ, UKPublished online: 08 Oct 2014.
To cite this article: Ian Henderson, John Calladine, Dario Massimino, Jennifer A. Taylor & Simon Gillings (2014): Evidence forcontrasting causes of population change in two closely related, sympatric breeding species the Whinchat Saxicola rubetra andStonechat Saxicola torquata in Britain, Bird Study
To link to this article: http://dx.doi.org/10.1080/00063657.2014.962482
PLEASE SCROLL DOWN FOR ARTICLE
Taylor & Francis makes every effort to ensure the accuracy of all the information (the “Content”) containedin the publications on our platform. However, Taylor & Francis, our agents, and our licensors make norepresentations or warranties whatsoever as to the accuracy, completeness, or suitability for any purpose of theContent. Any opinions and views expressed in this publication are the opinions and views of the authors, andare not the views of or endorsed by Taylor & Francis. The accuracy of the Content should not be relied upon andshould be independently verified with primary sources of information. Taylor and Francis shall not be liable forany losses, actions, claims, proceedings, demands, costs, expenses, damages, and other liabilities whatsoeveror howsoever caused arising directly or indirectly in connection with, in relation to or arising out of the use ofthe Content.
This article may be used for research, teaching, and private study purposes. Any substantial or systematicreproduction, redistribution, reselling, loan, sub-licensing, systematic supply, or distribution in anyform to anyone is expressly forbidden. Terms & Conditions of access and use can be found at http://www.tandfonline.com/page/terms-and-conditions
Evidence for contrasting causes of population changein two closely related, sympatric breeding species theWhinchat Saxicola rubetra and Stonechat Saxicolatorquata in Britain
IAN HENDERSON1*, JOHN CALLADINE2, DARIO MASSIMINO1, JENNIFER A. TAYLOR3 andSIMON GILLINGS11British Trust for Ornithology, The Nunnery, Thetford, Norfolk IP24 2QA, UK; 2British Trust for OrnithologyScotland, Cottrell Building, University of Stirling, Stirling FK9 9LA, UK; 3Lancaster Environment Centre, LancasterUniversity, Lancaster LA1 4YQ, UK
Capsule The recent population decline of Whinchats has accelerated, including core breeding areas ofBritain. Contrasting patterns of change with Stonechat suggest a large-scale environmental driver isaffecting the entire Whinchat population.Aims To explore broad geographical and landscape related differences in long-term patterns of populationchange in the Whinchat and Stonechat across Britain to identify candidate mechanisms of change.Methods The study uses 40 years of large-scale, long-term data from a series of three atlas studies tocompare trends in range and abundance in Whinchats and Stonechats relative to landscape andweather variables.Results For Whinchats there has been a long-term and accelerating decline in abundance, that includesstronghold areas of Britain. The Stonechat population has undergone a net gain in abundance withregional and altitudinal variations. These two very different patterns of change suggest the relativeubiquity of decline in Whinchats has a common source affecting the whole population.Conclusions The scale and magnitude of decline in Whinchats should stimulate a revision of the speciesconservation status in Britain, with renewed focus on studying the species’ ecology across its breedingand winter range in order to determine the likely large-scale drivers of its decline.
The Whinchat Saxicola rubetra is one of several sub-
Saharan migrant species that breed in Europe that
have suffered major long-term declines in abundance
(Sanderson et al. 2006, Ockendon et al. 2012). The
Whinchat has undergone an estimated 71% decline in
abundance in Europe since the 1980 (EBCC 2012). In
Britain, the species has declined by 60% in abundance
since 1995 (Risely et al. 2013), though the true period
of decline spans several decades (Holloway 1996). The
cause of the decline in Whinchats in the last decade
or so is poorly understood with changes in either land-
use or climate in either Europe or in Africa being
implicated (Vickery et al. 2014).In Europe, the Whinchat is a species of open,
invertebrate-rich grasslands, sometimes in the presence
of light scrub or other perches such as Bracken Pteridium
aquilinum (Stillman & Brown 1994, Fuller 2012, Grant
& Pearce-Higgins 2012). In winter, in Africa, the
species also uses open grassy steppes, wetlands and
crops, such as maize (Hulme & Cresswell 2012). In
both seasons their habitat is vulnerable to agricultural
improvements, pesticide use and the loss of marginal
habitats. In addition, in Europe, the Whinchat occupies
a cool temperate range by occurring at higher densities
in moist alluvial grassland habitats, meadows or bogs or
lush upland landscapes (Hagemeier & Blair 1997,
Müller et al. 2005). In Africa, low rainfall may
contribute to higher Whinchat mortality (Dejaifve
1994), such that, in both seasons, Whinchats are
potentially vulnerable to a drying climate.
In Britain, the broad geographic and topographic
breeding range of Whinchats strongly overlaps with the
closely related but less migratory Stonechat Saxicolatorquata. The broad-scale habitats they occupy are*Correspondence author. Email: [email protected]
© 2014 British Trust for Ornithology
Bird Study (2014), 1–13http://dx.doi.org/10.1080/00063657.2014.962482
Dow
nloa
ded
by [
New
Yor
k U
nive
rsity
] at
06:
07 0
9 O
ctob
er 2
014
frequently, superficially similar (Fuller & Glue 1977)
though Stonechats will use drier components, heathlands
and Mediterranean habitats (Hagemeier & Blair 1997).
Unlike the Whinchat, the overall population trend for
breeding Stonechats in Britain has shown a net increase
over the last two decades (Risely et al. 2013; www.BTO/
about-birds/birdtrends/2012). Their contrasting trends
suggest there has been an opposing demographic response
to common features of environmental change acting on
both species in summer, or they have been exposed to
different environmental drivers outside the breeding
season. For either species, ubiquitous population change
would imply that virtually the entire population has been
affected at once, whereas regionally contrasting trends
would imply context dependent exposure to
environmental change by different sub-populations.
Thus, a comparison of the direction and pattern of trends
in these two species had the potential to offer clues on
the drivers of change.
In Britain, two large-scale data sets are available for
analysing population change in birds. First, periodic
national atlas data are available from surveys carried out
at approximately 20 year intervals. To date, three ‘atlas’
surveys of breeding birds have been conducted since
1968 with the latest Bird Atlas 2007–11 (Balmer et al.2013) providing up-to-date data on range occupancy
and relative abundance change for a 40 year and 20
year period, respectively, at a 10 km scale of resolution.
Second, populations of common bird species are
monitored annually by the BTO/JNCC/RSPB Breeding
Bird Survey (BBS; Gregory et al. 2004), based on
approximately 2500 1 km squares (Risely et al. 2013).
Although this survey achieves light coverage in some
remote habitats in Britain (Cook et al. 2011), it
complements the geographic coverage of atlas studies
with a more rigid sampling protocol at a higher spatial
resolution (1 km scale). The BBS characteristics and
finer scale of survey allowed an analysis of change to be
measured in terms of elevation as well as latitude,
though without the more complete spatial coverage of
the atlas data. These two analyses complement each in
analysing different factors, but also provide a second
independent layer of evidence for assessing patterns of
change emanating from the two different survey methods.
In Britain, it is also possible to match national bird data
sets to landscape characteristics and weather patterns at
large spatial scales. Land-class data (Institute of
Terrestrial Ecology land classification; Bunce et al. 1998)and Land Cover Map data (Fuller et al. 2002) are
objective characterizations (generalizations) of the British
countryside. The data, along with weather data (Perry
et al. 2009), provide the environmental context against
which to analyse the population change characteristics
of these bird species. Our analysis is restricted to Britain
only, because comparable land classification data were
unavailable for Ireland as a geographic entity.
This paper set out to identify broad geographical,
altitudinal, weather and landscape related differences
in the 40 year and 20 year patterns of population
change observed in the Whinchat and Stonechat
across Britain. On national and regional level in the
last 20 years, the two species’ broadly sympatric
breeding ranges (Balmer et al. 2013) and habitat use
suggest that contrasting populations trends are not
readily explained by large-scale changes to habitat
extent per se. Even competition between the two
species has been raised as a potential source of change
(Phillips 1970) but a more likely explanation is that of
emerging climate niches that the birds may or may not
be able to exploit (Jiguet et al. 2009) or other aspect oftheir contrasting life-history traits. Thus, interactions
between warming weather patterns and habitat may
favour the resident/short-distance migrant Stonechat,
more so than in the Whinchat, due to the former’s
potential to exploit spring temperature amelioration, to
extend the breeding season forward. Interactions with
habitat might then be expected too, with geographic
variations in population trends relating to local climate
and landscape context. In contrast, as a late migrant to
Britain, Whinchats are less able to exploit variations
in spring temperatures and instead are exposed to
external drivers operating across the entire migrant
population until arriving Britain where habitats and
summer conditions may vary and change over the long
term. So it was important in this study to assess the
extent of population change in relation to regional,
landscape, latitude and elevation gradients, in order to
understand the context behind population change in
these two species. Key differences in the patterns of
change in population in these two species were used to
indicate plausible explanations for their contrasting
population trends, which for Whinchats, in particular,
may help direct conservation objectives.
METHODS
Periodic national atlas monitoring: survey scale2 km, analytical scale 10 km
Definitions and caveats
In Britain, three atlas surveys of breeding birds have been
conducted since 1968, referred to here as: the ‘first atlas
© 2014 British Trust for Ornithology, Bird Study, 1–13
2 I. Henderson et al.
Dow
nloa
ded
by [
New
Yor
k U
nive
rsity
] at
06:
07 0
9 O
ctob
er 2
014
period’ – mid-point ‘1970’ (the 1968–1972 atlas;
Sharrock 1976), the ‘second atlas period’ – mid-point
‘1990’ (the 1988–1991 atlas; Gibbons et al. 1993) andthe ‘third atlas period’ – mid-point ‘2010’ (the BirdAtlas 2007–11; Balmer et al. 2013). The time between
the first and second atlas is referred to as the ‘early 20
year period’ (broadly, 1970–1990), while the period
between the second and third atlas is referred to as the
‘late 20 year period’ (broadly, 1990–2010). The survey
methods are covered fully in each publication and
summarized in Balmer et al. (2013). In brief, survey
volunteer observers chose one or more survey squares
(a 2 km × 2 km ‘tetrad’) from a list. There they
counted all birds seen or heard following standardized
survey guidelines both for recording birds and for
adding supporting information, such as breeding
evidence. During the second and third atlas studies,
observers followed self-determined transect routes,
known as a Timed Transect Visit (TTV). Each TTV
lasted for 1 hour and in some cases 2 hours. For the
first atlas, birds were recorded on a ‘roving’ basis, with
no set transect route, though the period of observation
was recorded. During all atlases, visited tetrads
received casual records made on an ad hoc basis
outside of any allocated route or recording period.
Casual records did not contribute to the relative
abundance values because recording effort could not be
taken into account (Balmer et al. 2013).In Britain, atlas survey coverage is attempted in at
least eight tetrads per visited 10 km square, and in
virtually every 10 km square available. The survey
coverage of 10 km squares during the first and the
third atlas periods was broadly comparable and
complete, but was lower during the second atlas period
in some remote locations (Balmer et al. 2013). Thus,changes in occupancy between the second and third
atlas periods may be, potentially, biased towards ‘gains’
in remote areas of northern Britain. Only records of
‘confirmed’ or ‘probable’ breeding status at either the
beginning or end of any 20 year period of comparison
were used in change statistics. However, the first and
third atlases also required that birds were observed in
suitable breeding habitat for breeding evidence to be
considered as valid. As this stipulation was not applied
to the second atlas, some apparent losses between the
second and third atlases may be spurious, though this
would mainly have affected transient individuals in
coastal locations.
In this study it was convenient to divide Britain into
four broad ‘regions’: Scotland, Wales, ‘Northern
England’ (extending north and west of a line drawn
between the Humber and the Severn estuaries) and
‘Southern England’ (land extending south and east of
the same line, and including south-east and south-west
England); see Fig. 1a.
Range occupancy and relative abundance
Tetrad-level data outlined above were used to establish
the presence or absence of birds within each 10 km
square (‘range occupancy’), where presence in two
consecutive atlas periods represented stable occupancy
or no change. The tetrad-level data were also used to
calculate a frequency index of ‘relative abundance’,
from the proportion of occupied to unoccupied tetradsper 10 km square, including squares of stable range
occupancy but of varying relative abundance. Change
in the relative abundance between atlas periods was
calculated only for 10 km squares with breeding
evidence recorded in at least one atlas period, so
eliminating very long-term, un-occupied squares from
the analysis. In places where a species was very
common, there could conceivably have been variation
in density (within tetrads) without the frequency index
dropping below 1, introducing some loss of sensitivity.
However, for the two subject species in this paper, this
scenario is considered a rare or unlikely scenario.
Change in range occupancy at the 10 km scale was
analysed by χ2 tests, assuming an equal likelihood of
gains to losses, and excluding range-stable squares (no
change). Change in relative abundance was analysed
by Generalized Linear Model logistic regression (SAS
Incorporated 2002) testing both Poisson (log function)
and binomial error structures (logit function; where 1
= positive change and 0 = negative change), to include
as much information from range-stable squares as
possible depending on the quality of the model fits.
Parameter estimates are output as likelihood ratios
(LR) with Type 3 probability values for partial effects
accounting for other variables in the model, such as
the environmental variables described below.
Superficially, the distribution of ‘gains’ in Whinchats
appears close to random and is consistent with there
being no clear regional or sub-regional patterns of
colonization occurring against the national trend.
Instead, only sporadic gains are apparent, perhaps as a
consequence of stochastic variation in the detection of
birds (following false absences during the early atlas
period) or transient occurrences of territory settlement,
or habitat change occurring at smaller spatial scales
than the resolution of the analysis. These scenarios are
more likely to occur within the current range of the
© 2014 British Trust for Ornithology, Bird Study, 1–13
Populations trends for Whinchat & Stonechat 3
Dow
nloa
ded
by [
New
Yor
k U
nive
rsity
] at
06:
07 0
9 O
ctob
er 2
014
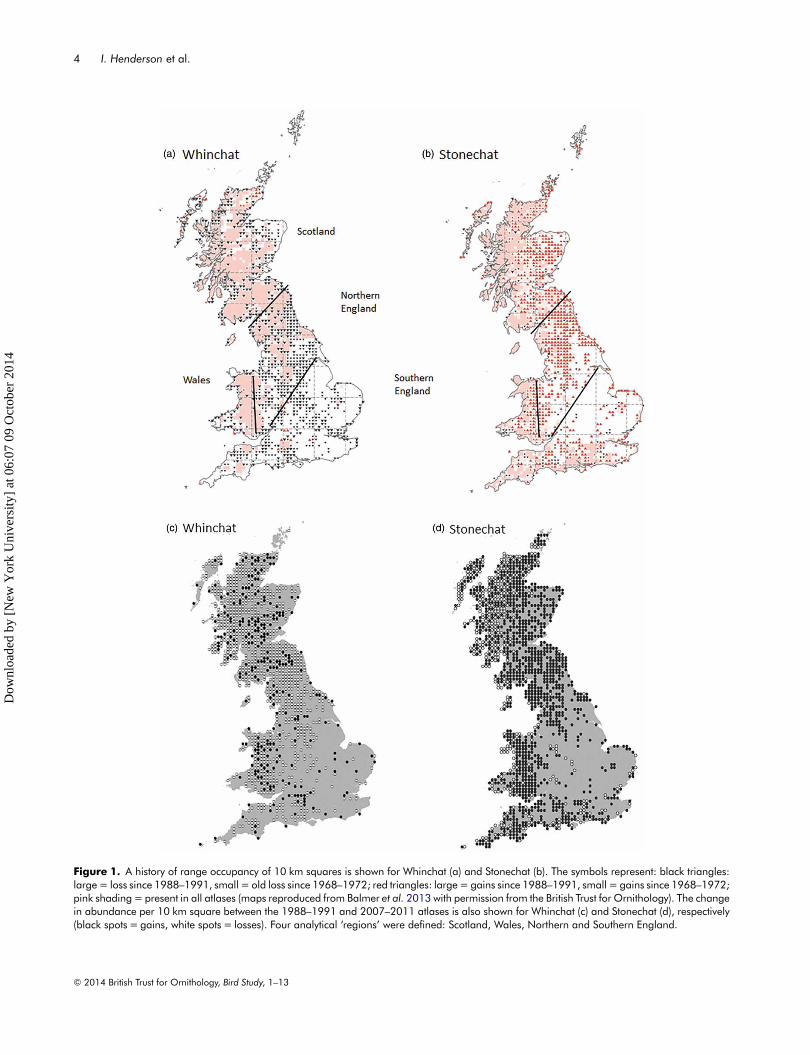
Figure 1. A history of range occupancy of 10 km squares is shown for Whinchat (a) and Stonechat (b). The symbols represent: black triangles:large= loss since 1988–1991, small = old loss since 1968–1972; red triangles: large= gains since 1988–1991, small = gains since 1968–1972;pink shading= present in all atlases (maps reproduced from Balmer et al. 2013 with permission from the British Trust for Ornithology). The changein abundance per 10 km square between the 1988–1991 and 2007–2011 atlases is also shown for Whinchat (c) and Stonechat (d), respectively(black spots = gains, white spots = losses). Four analytical ‘regions’ were defined: Scotland, Wales, Northern and Southern England.
© 2014 British Trust for Ornithology, Bird Study, 1–13
4 I. Henderson et al.
Dow
nloa
ded
by [
New
Yor
k U
nive
rsity
] at
06:
07 0
9 O
ctob
er 2
014
species, but tend towards a random distribution of gains
as squares switch between active or not (where no strong
biological influence or systematic sampling bias was
introduced between atlas survey periods). By
comparison, redistributions of territories to patches of
newly available habitat (perhaps with social
attraction), would be expected to show stronger levels
of aggregation than random. Regional or sub-regional
clumping is expected where strong influences of land-
use change and/or climate change occur.
To examine whether or not the Whinchat gains were
statistically random in distribution, we compared mean
nearest neighbour distances (NND) between the
centres of 255 gain squares (within a 300 km buffer)
and 255 randomly distributed squares (within a 300
km buffer) selected from the entire breeding
distribution of the species in the last 20 years (all
gains, losses and stable occupancy squares, avoiding
(40+ year) long-term historical absence). The 300 km
buffer was imposed to effectively regionalize the
analysis – to look for local rather than gross patterns of
variation across Britain as a whole. NND mean and
variance was compared between gain squares and
between 20 re-iterations of randomly generated
squares. For the gain squares mean and confidence
intervals (CIs) were calculated by bootstrapping (999
iterations with replacement), and compared to the
distribution of random squares, via t- and F-tests(Sokal & Rohlf 1995), for signs of similarity and
aggregation (and normality). A similar analysis was run
for Stonechat, but this time with emphasis on the
distribution of losses rather than gains.
Associations with environmental variables
Gains relative to losses were analysed against time (early
and late 20 year periods), weather variables and two
landscape data sets: (a) Land Cover Map data
(LCM2000; Fuller et al. 2002) and (b) land-class data
(Bunce et al. 1998). LCM2000 satellite image variables
(Fuller et al. 2002) quantify proportional estimates of
land cover per 1 km square in Britain (here
summarized for 10 broad land-use categories being:
coastal (Coast), improved grassland (IG), semi-natural
grassland (SNG), Moorland/Heather/Bracken (MHB),
broad-leaved woodland (BLW), conifer woodland
(CON), arable, sea, inland water and unclassed). By
proportion, more than one land-use category may
occur in any given 1 km square and that proportion
may change between survey periods. The land-class
system places every 1 km square in Britain into just
one of 32–40 categories (32 this study) on a
descriptive basis of its landscape and topographical
character (Bunce et al. 1998). The land-class character
of a square is less prone to change over time than
LCM2000. In the absence of quantitative data on
land-use change between all three atlas periods, we
were limited to using landscape characteristics data
representing the mid-point for the late 20 year period
(LCM2000 in 1998).
Weather variables were included in the analyses as a
potential influence on habitat condition or
productivity (spring/summer variables), or for
Stonechat alone, survival (winter variable). Weather
variables were available as monthly values for every 5
km2 tile in the Britain (UK Meteorological Office).
For our purposes, variables ‘total rainfall’, ‘mean
temperature’ and ‘minimum temperature’ were first
averaged per month at the 10 km2 scale. They were
then averaged across months as mean summer rainfall
(MSR: May, June, July), mean summer temperature
(MST: May, June, July) and mean minimum
temperature for spring (MMS: March, April, May).
The difference between the proportional distribution
of all squares in which birds were recorded during the
late 20 year period (gains, losses and stable occupancy)
across the 32 land-classes and the actual proportional
availability of each land-class was calculated as the
response variable ‘Preferred’ (% occurrence−%
availability). ‘Difference’ was calculated as the
difference in the proportional distribution of gains to
losses (% gains−% loss) between land-class categories.
Significant differences in the distribution of response
variables between land-classes was analysed by
generalized linear models with a normal error structure.
This analysis was intended to identify broadly
favourable landscape characteristics between regions,
for species occurrence and species relative gains in
occurrence.
The relationship between change in bird occurrence
and LCM2000 variables (per 10 km square) was run in
a separate model to the land-class data because the two
are related. In this analysis, the bird data modelled
change as gains (score 1) or losses (score 0) using a
binomial error structure and logit link function. The
modelled structure analysed the probability that
change = species (Whinchat or Stonechat) + land
cover LCM200 variables (MHB + BLW+CON+ IG +
SNG+Coast) plus weather variables (MST +MSR +
MMS). Interaction terms were added to identify
species-specific effects of land cover or weather.
Limited screening of variable permutations below the
© 2014 British Trust for Ornithology, Bird Study, 1–13
Populations trends for Whinchat & Stonechat 5
Dow
nloa
ded
by [
New
Yor
k U
nive
rsity
] at
06:
07 0
9 O
ctob
er 2
014
full model structure above was carried out, manually.
Overall, this analysis was intended to identify
important broad habitats and weather conditions that
might help explain observed patterns of change across
Britain in this species.
Assessment of changes in breeding densities andrange from BBS monitoring (1 km scale)
The BTO/JNCC/RSPB BBS is an extensive volunteer
survey used to monitor breeding bird populations in
the UK every year since 1994. The BBS is undertaken
on a random sample of 1 km squares, but stratified
regionally to obtain representative coverage of habitats
(Risely et al. 2013). The survey is structured in that
each square is visited twice, once between April and
mid-May (early visit), and once between mid-May and
the end of June (late visit). Birds are recorded along
two 1 km line transects with a recommended period of
time spent on each transect and with sightings
classified into three distance bands (0–25 m, 25–100
m, 100 m+). Each transect is split into 200 m sections,
in which habitat is recorded using a hierarchical
coding system (Crick 1992). To account for
heterogeneity in detectability, we used a distance-
sampling approach and fitted half normal distributions
to the BBS count data (Buckland 2001, R
Development Core Team 2009, Thomas et al. 2010).The habitat of each 200 m section and the visit (early
or late visit during the breeding season) were included
as covariates to account for their potential effect on
detectability. From this model, we obtained an
estimate of the average detection probability (p) in
each surveyed square, which was used as an offset in
the following analysis. Models were weighted by the
inverse of the sampling effort within each region to
account for spatial variation in the coverage of BBS
squares across the country. Thus, squares from regions
with low survey coverage received a greater weight in
order to prevent the results being potentially biased by
well-surveyed regions. However, data from Northern
Ireland could not be included due to very low coverage
in the early years of the BBS.
Using the maximum number of individuals detected
(dependent variable) from either of the two annual visits
in each year (1994–2011), for each 1 km square, species
abundance was modelled using generalized additive
models as a smooth function of northing, easting,
elevation and year. We specified a logarithmic link
function and quasi-Poisson error structure (McCullagh &
Nelder 1989). The maximum degrees of freedom for the
four-dimensional smooth were set to 16, to avoid over-
fitting and keep the relationships unimodal.
Heterogeneity in detectability was accounted for by using
the log of the species-specific estimates of detection
probability (log p) as an offset (Renwick et al. 2011).Three reference values were calculated along the
latitudinal and elevation gradients of each species. The
three values were located: (1) at the point on each
gradient where population density peaked (PD), (2) at
the leading edge of each gradient (i.e. the northern
front for latitude or higher limit for elevation) and (3)
at the trailing edge of each gradient (i.e. the southern
tail – for latitude or lower limit for elevation). The
reference values for leading and trailing edges were
defined according to where the population density
equalled PD * exp(−0.5) (Heegaard 2002, Maggini
et al. 2011). We used the model to quantify shifts in
latitude or elevation for the three reference values,
between 1994 and 2011, with 95% CIs estimated by
bootstrapping (n = 200). The same model could also
estimate the change in population density for each
species over time, irrespective of any gradient shifts in
latitude or elevation.
RESULTS
National atlases
Occupancy of range
The number of 10 km squares in which Whinchats were
recorded with breeding evidence declined from 1484 to
696 between 1970 and 2010, a change of −53.1% over
40 years. There was a significantly higher proportion of
losses to gains during both the early and later 20 year
periods for Britain as a whole (x23 = 6.1, P < 0.05 and
x23 = 31.7, P < 0.01 respectively; Fig. 1a), which
increased from a 66% (n = 548) to 82.6% (n = 586)
between the early and later 20 year periods (x21 = 9.9,
P < 0.01; Fig. 2a). The results indicate an accelerated
loss of occupancy of 10 km squares across Britain since
1990 (also highly significant in all regions:
x23 = 105.4, 217.0, 26.7, 36.0 for Scotland, Northern
England, Southern England, Wales, respectively
(P < 0.01); Fig. 2a). Apparent stable range occupancy
of 10 km squares in Britain accounted for 38% of all
squares (gains 12.6% and losses 49.4%; Fig. 1a).
For Stonechat, the number of occupied 10 km squares
with breeding evidence increased from 1060 to 1634
between 1970 and 2010 (54%; Fig. 1b). The
proportion of gains to losses was 37% (i.e. <50% and a
net loss) during the early period, but increased to 89%
© 2014 British Trust for Ornithology, Bird Study, 1–13
6 I. Henderson et al.
Dow
nloa
ded
by [
New
Yor
k U
nive
rsity
] at
06:
07 0
9 O
ctob
er 2
014
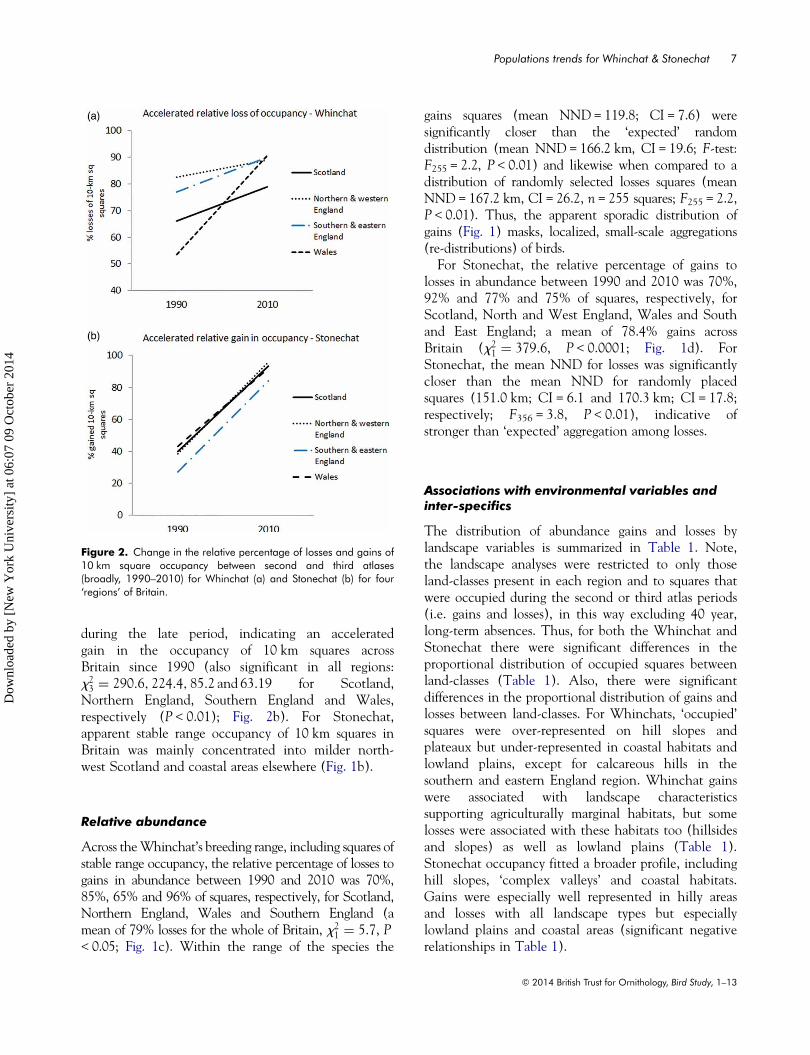
during the late period, indicating an accelerated
gain in the occupancy of 10 km squares across
Britain since 1990 (also significant in all regions:
x23 = 290.6, 224.4, 85.2 and 63.19 for Scotland,
Northern England, Southern England and Wales,
respectively (P < 0.01); Fig. 2b). For Stonechat,
apparent stable range occupancy of 10 km squares in
Britain was mainly concentrated into milder north-
west Scotland and coastal areas elsewhere (Fig. 1b).
Relative abundance
Across theWhinchat’s breeding range, including squares of
stable range occupancy, the relative percentage of losses to
gains in abundance between 1990 and 2010 was 70%,
85%, 65% and 96% of squares, respectively, for Scotland,
Northern England, Wales and Southern England (a
mean of 79% losses for the whole of Britain, x21 = 5.7, P< 0.05; Fig. 1c). Within the range of the species the
gains squares (mean NND= 119.8; CI = 7.6) were
significantly closer than the ‘expected’ random
distribution (mean NND= 166.2 km, CI = 19.6; F-test:F255 = 2.2, P < 0.01) and likewise when compared to a
distribution of randomly selected losses squares (mean
NND= 167.2 km, CI = 26.2, n = 255 squares; F255 = 2.2,
P < 0.01). Thus, the apparent sporadic distribution of
gains (Fig. 1) masks, localized, small-scale aggregations
(re-distributions) of birds.
For Stonechat, the relative percentage of gains to
losses in abundance between 1990 and 2010 was 70%,
92% and 77% and 75% of squares, respectively, for
Scotland, North and West England, Wales and South
and East England; a mean of 78.4% gains across
Britain (x21 = 379.6, P < 0.0001; Fig. 1d). For
Stonechat, the mean NND for losses was significantly
closer than the mean NND for randomly placed
squares (151.0 km; CI = 6.1 and 170.3 km; CI = 17.8;
respectively; F356 = 3.8, P < 0.01), indicative of
stronger than ‘expected’ aggregation among losses.
Associations with environmental variables andinter-specifics
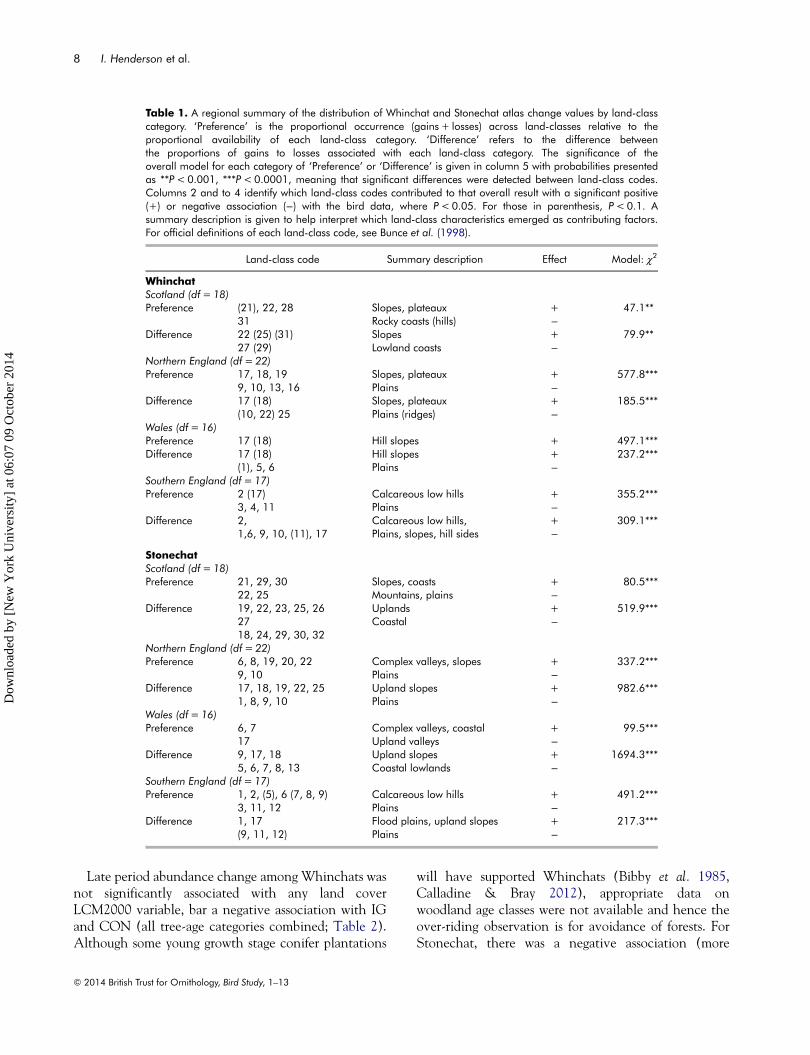
The distribution of abundance gains and losses by
landscape variables is summarized in Table 1. Note,
the landscape analyses were restricted to only those
land-classes present in each region and to squares that
were occupied during the second or third atlas periods
(i.e. gains and losses), in this way excluding 40 year,
long-term absences. Thus, for both the Whinchat and
Stonechat there were significant differences in the
proportional distribution of occupied squares between
land-classes (Table 1). Also, there were significant
differences in the proportional distribution of gains and
losses between land-classes. For Whinchats, ‘occupied’
squares were over-represented on hill slopes and
plateaux but under-represented in coastal habitats and
lowland plains, except for calcareous hills in the
southern and eastern England region. Whinchat gains
were associated with landscape characteristics
supporting agriculturally marginal habitats, but some
losses were associated with these habitats too (hillsides
and slopes) as well as lowland plains (Table 1).
Stonechat occupancy fitted a broader profile, including
hill slopes, ‘complex valleys’ and coastal habitats.
Gains were especially well represented in hilly areas
and losses with all landscape types but especially
lowland plains and coastal areas (significant negative
relationships in Table 1).
Figure 2. Change in the relative percentage of losses and gains of10 km square occupancy between second and third atlases(broadly, 1990–2010) for Whinchat (a) and Stonechat (b) for four‘regions’ of Britain.
© 2014 British Trust for Ornithology, Bird Study, 1–13
Populations trends for Whinchat & Stonechat 7
Dow
nloa
ded
by [
New
Yor
k U
nive
rsity
] at
06:
07 0
9 O
ctob
er 2
014
Late period abundance change among Whinchats was
not significantly associated with any land cover
LCM2000 variable, bar a negative association with IG
and CON (all tree-age categories combined; Table 2).
Although some young growth stage conifer plantations
will have supported Whinchats (Bibby et al. 1985,
Calladine & Bray 2012), appropriate data on
woodland age classes were not available and hence the
over-riding observation is for avoidance of forests. For
Stonechat, there was a negative association (more
Table 1. A regional summary of the distribution of Whinchat and Stonechat atlas change values by land-classcategory. ‘Preference’ is the proportional occurrence (gains + losses) across land-classes relative to theproportional availability of each land-class category. ‘Difference’ refers to the difference betweenthe proportions of gains to losses associated with each land-class category. The significance of theoverall model for each category of ‘Preference’ or ‘Difference’ is given in column 5 with probabilities presentedas **P<0.001, ***P<0.0001, meaning that significant differences were detected between land-class codes.Columns 2 and to 4 identify which land-class codes contributed to that overall result with a significant positive(+) or negative association (−) with the bird data, where P<0.05. For those in parenthesis, P<0.1. Asummary description is given to help interpret which land-class characteristics emerged as contributing factors.For official definitions of each land-class code, see Bunce et al. (1998).
Land-class code Summary description Effect Model: χ2
WhinchatScotland (df = 18)Preference (21), 22, 28 Slopes, plateaux + 47.1**
31 Rocky coasts (hills) −Difference 22 (25) (31) Slopes + 79.9**
27 (29) Lowland coasts −Northern England (df = 22)Preference 17, 18, 19 Slopes, plateaux + 577.8***
9, 10, 13, 16 Plains −Difference 17 (18) Slopes, plateaux + 185.5***
(10, 22) 25 Plains (ridges) −Wales (df = 16)Preference 17 (18) Hill slopes + 497.1***Difference 17 (18) Hill slopes + 237.2***
(1), 5, 6 Plains −Southern England (df = 17)Preference 2 (17) Calcareous low hills + 355.2***
3, 4, 11 Plains −Difference 2, Calcareous low hills, + 309.1***
1,6, 9, 10, (11), 17 Plains, slopes, hill sides −
StonechatScotland (df = 18)Preference 21, 29, 30 Slopes, coasts + 80.5***
22, 25 Mountains, plains −Difference 19, 22, 23, 25, 26 Uplands + 519.9***
27 Coastal −18, 24, 29, 30, 32
Northern England (df = 22)Preference 6, 8, 19, 20, 22 Complex valleys, slopes + 337.2***
9, 10 Plains −Difference 17, 18, 19, 22, 25 Upland slopes + 982.6***
1, 8, 9, 10 Plains −Wales (df = 16)Preference 6, 7 Complex valleys, coastal + 99.5***
17 Upland valleys −Difference 9, 17, 18 Upland slopes + 1694.3***
5, 6, 7, 8, 13 Coastal lowlands −Southern England (df = 17)Preference 1, 2, (5), 6 (7, 8, 9) Calcareous low hills + 491.2***
3, 11, 12 Plains −Difference 1, 17 Flood plains, upland slopes + 217.3***
(9, 11, 12) Plains −
© 2014 British Trust for Ornithology, Bird Study, 1–13
8 I. Henderson et al.
Dow
nloa
ded
by [
New
Yor
k U
nive
rsity
] at
06:
07 0
9 O
ctob
er 2
014
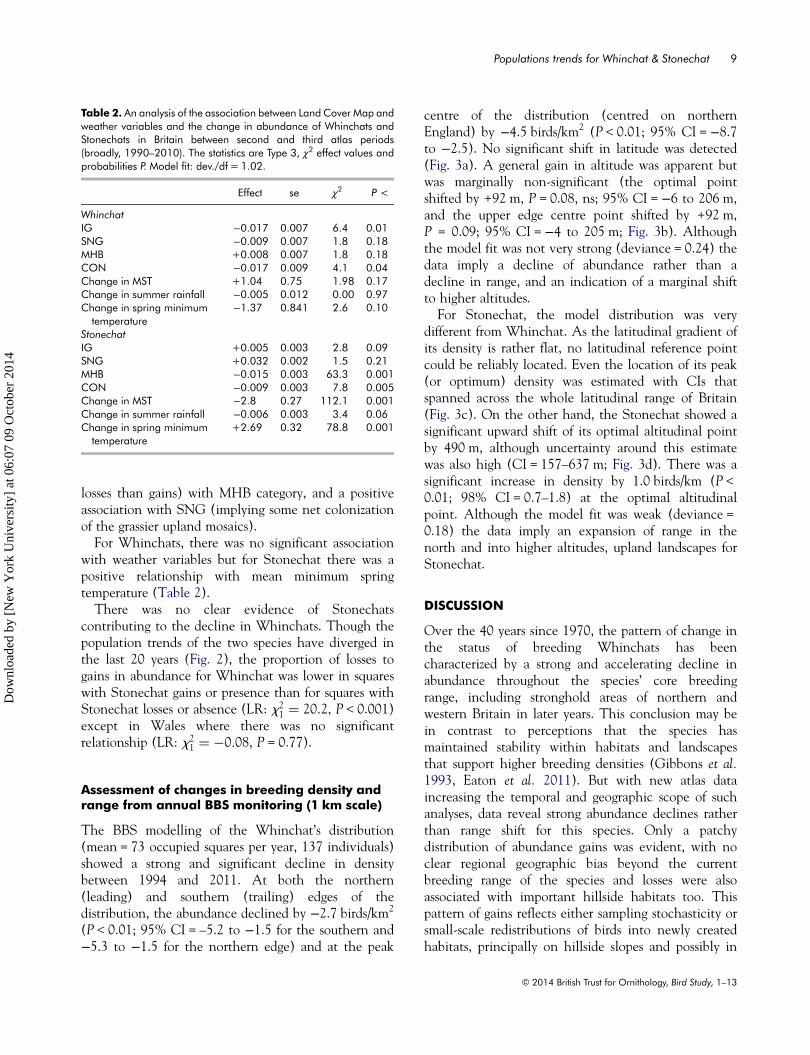
losses than gains) with MHB category, and a positive
association with SNG (implying some net colonization
of the grassier upland mosaics).
For Whinchats, there was no significant association
with weather variables but for Stonechat there was a
positive relationship with mean minimum spring
temperature (Table 2).
There was no clear evidence of Stonechats
contributing to the decline in Whinchats. Though the
population trends of the two species have diverged in
the last 20 years (Fig. 2), the proportion of losses to
gains in abundance for Whinchat was lower in squares
with Stonechat gains or presence than for squares with
Stonechat losses or absence (LR: x21 = 20.2, P < 0.001)
except in Wales where there was no significant
relationship (LR: x21 = −0.08, P = 0.77).
Assessment of changes in breeding density andrange from annual BBS monitoring (1 km scale)
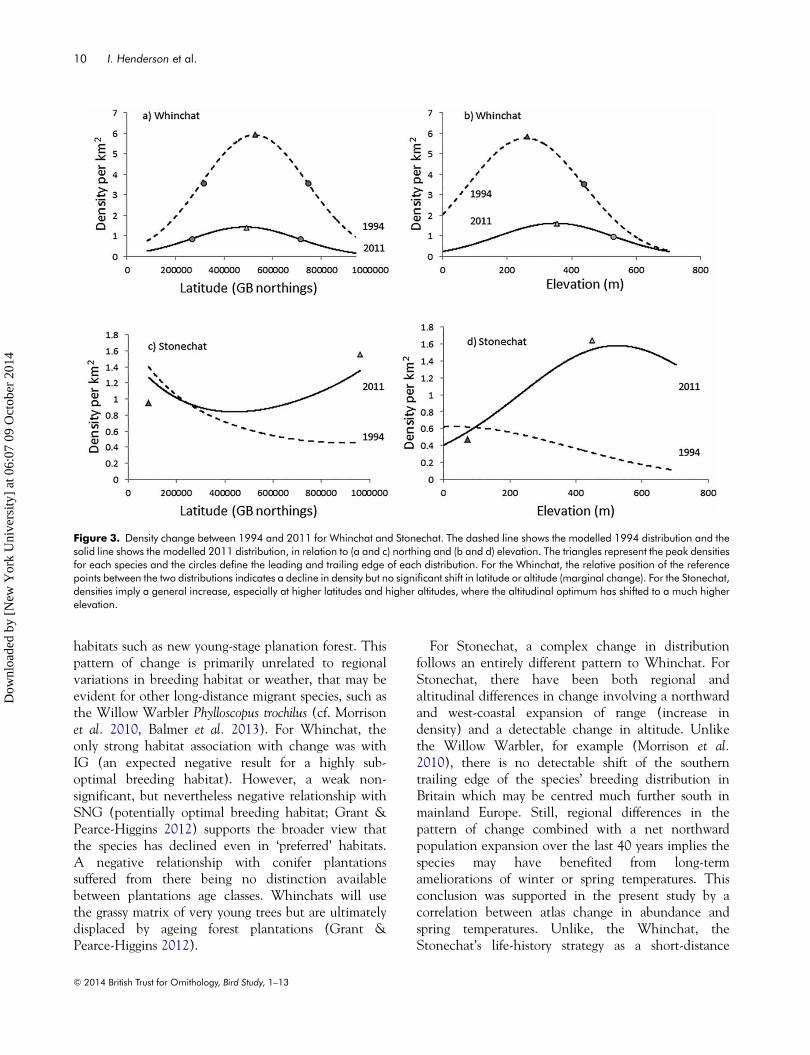
The BBS modelling of the Whinchat’s distribution
(mean = 73 occupied squares per year, 137 individuals)
showed a strong and significant decline in density
between 1994 and 2011. At both the northern
(leading) and southern (trailing) edges of the
distribution, the abundance declined by −2.7 birds/km2
(P < 0.01; 95% CI = –5.2 to −1.5 for the southern and
−5.3 to −1.5 for the northern edge) and at the peak
centre of the distribution (centred on northern
England) by −4.5 birds/km2 (P < 0.01; 95% CI =−8.7to −2.5). No significant shift in latitude was detected
(Fig. 3a). A general gain in altitude was apparent but
was marginally non-significant (the optimal point
shifted by +92 m, P = 0.08, ns; 95% CI =−6 to 206 m,
and the upper edge centre point shifted by +92 m,
P = 0.09; 95% CI =−4 to 205 m; Fig. 3b). Although
the model fit was not very strong (deviance = 0.24) the
data imply a decline of abundance rather than a
decline in range, and an indication of a marginal shift
to higher altitudes.
For Stonechat, the model distribution was very
different from Whinchat. As the latitudinal gradient of
its density is rather flat, no latitudinal reference point
could be reliably located. Even the location of its peak
(or optimum) density was estimated with CIs that
spanned across the whole latitudinal range of Britain
(Fig. 3c). On the other hand, the Stonechat showed a
significant upward shift of its optimal altitudinal point
by 490 m, although uncertainty around this estimate
was also high (CI = 157–637 m; Fig. 3d). There was a
significant increase in density by 1.0 birds/km (P <0.01; 98% CI = 0.7–1.8) at the optimal altitudinal
point. Although the model fit was weak (deviance =
0.18) the data imply an expansion of range in the
north and into higher altitudes, upland landscapes for
Stonechat.
DISCUSSION
Over the 40 years since 1970, the pattern of change in
the status of breeding Whinchats has been
characterized by a strong and accelerating decline in
abundance throughout the species’ core breeding
range, including stronghold areas of northern and
western Britain in later years. This conclusion may be
in contrast to perceptions that the species has
maintained stability within habitats and landscapes
that support higher breeding densities (Gibbons et al.1993, Eaton et al. 2011). But with new atlas data
increasing the temporal and geographic scope of such
analyses, data reveal strong abundance declines rather
than range shift for this species. Only a patchy
distribution of abundance gains was evident, with no
clear regional geographic bias beyond the current
breeding range of the species and losses were also
associated with important hillside habitats too. This
pattern of gains reflects either sampling stochasticity or
small-scale redistributions of birds into newly created
habitats, principally on hillside slopes and possibly in
Table 2. An analysis of the association between Land Cover Map andweather variables and the change in abundance of Whinchats andStonechats in Britain between second and third atlas periods(broadly, 1990–2010). The statistics are Type 3, χ2 effect values andprobabilities P. Model fit: dev./df = 1.02.
Effect se χ2 P <
WhinchatIG −0.017 0.007 6.4 0.01SNG −0.009 0.007 1.8 0.18MHB +0.008 0.007 1.8 0.18CON −0.017 0.009 4.1 0.04Change in MST +1.04 0.75 1.98 0.17Change in summer rainfall −0.005 0.012 0.00 0.97Change in spring minimumtemperature
−1.37 0.841 2.6 0.10
StonechatIG +0.005 0.003 2.8 0.09SNG +0.032 0.002 1.5 0.21MHB −0.015 0.003 63.3 0.001CON −0.009 0.003 7.8 0.005Change in MST −2.8 0.27 112.1 0.001Change in summer rainfall −0.006 0.003 3.4 0.06Change in spring minimumtemperature
+2.69 0.32 78.8 0.001
© 2014 British Trust for Ornithology, Bird Study, 1–13
Populations trends for Whinchat & Stonechat 9
Dow
nloa
ded
by [
New
Yor
k U
nive
rsity
] at
06:
07 0
9 O
ctob
er 2
014
habitats such as new young-stage planation forest. This
pattern of change is primarily unrelated to regional
variations in breeding habitat or weather, that may be
evident for other long-distance migrant species, such as
the Willow Warbler Phylloscopus trochilus (cf. Morrison
et al. 2010, Balmer et al. 2013). For Whinchat, the
only strong habitat association with change was with
IG (an expected negative result for a highly sub-
optimal breeding habitat). However, a weak non-
significant, but nevertheless negative relationship with
SNG (potentially optimal breeding habitat; Grant &
Pearce-Higgins 2012) supports the broader view that
the species has declined even in ‘preferred’ habitats.
A negative relationship with conifer plantations
suffered from there being no distinction available
between plantations age classes. Whinchats will use
the grassy matrix of very young trees but are ultimately
displaced by ageing forest plantations (Grant &
Pearce-Higgins 2012).
For Stonechat, a complex change in distribution
follows an entirely different pattern to Whinchat. For
Stonechat, there have been both regional and
altitudinal differences in change involving a northward
and west-coastal expansion of range (increase in
density) and a detectable change in altitude. Unlike
the Willow Warbler, for example (Morrison et al.2010), there is no detectable shift of the southern
trailing edge of the species’ breeding distribution in
Britain which may be centred much further south in
mainland Europe. Still, regional differences in the
pattern of change combined with a net northward
population expansion over the last 40 years implies the
species may have benefited from long-term
ameliorations of winter or spring temperatures. This
conclusion was supported in the present study by a
correlation between atlas change in abundance and
spring temperatures. Unlike, the Whinchat, the
Stonechat’s life-history strategy as a short-distance
Figure 3. Density change between 1994 and 2011 for Whinchat and Stonechat. The dashed line shows the modelled 1994 distribution and thesolid line shows the modelled 2011 distribution, in relation to (a and c) northing and (b and d) elevation. The triangles represent the peak densitiesfor each species and the circles define the leading and trailing edge of each distribution. For the Whinchat, the relative position of the referencepoints between the two distributions indicates a decline in density but no significant shift in latitude or altitude (marginal change). For the Stonechat,densities imply a general increase, especially at higher latitudes and higher altitudes, where the altitudinal optimum has shifted to a much higherelevation.
© 2014 British Trust for Ornithology, Bird Study, 1–13
10 I. Henderson et al.
Dow
nloa
ded
by [
New
Yor
k U
nive
rsity
] at
06:
07 0
9 O
ctob
er 2
014
migrant and earlier breeding species allows it to benefit
from milder winters and springs by exploiting emerging
climate niches (Jiguet et al. 2009, Zollinger 2011). If
anything, the climate niche of Whinchat in hillside
grassland mosaics may be being squeezed (Calladine &
Bray 2012).
There was no evidence of competition between
Whinchats and Stonechat (Phillips 1970) driving the
population decline in Whinchats. Behavioural
dominance does not imply competitive exclusion and
there has been no convincing demonstration of
competitive exclusion operating in these species. These
species’ broadly, superficially similar breeding ranges mask
important fine-scale differences in habitat preference and
patterns of change undoubtedly reduce competition
(Stonechat: taller, drier scrub and ruderal vegetation;
Whinchat: more open, even humid grassland, Bracken
often with light scrub; Urquhart & Browley 2002).
Instead, the patterns of change in the two species appear
entirely independent of one another. They are more
consistent with their respective life-history traits than
competition or a common cause of change pertaining to
the breeding population (such as predation) as plausible
drivers of large-scale population change.
In Britain, these two species are broadly sympatric in
distribution and in habitat occupancy. Their contrasting
population trends and different patterns of change do
not suggest the influence of a large-scale (national or
regional) common driver of change in landscape
structure or suitability (such as forestry) on the breeding
grounds in the last 20 years, because this would have
affected both species. The comparison between the two
species also controls for any possibility of systematic
biases in atlas coverage contributing to the observed
patterns of change. Still, the ubiquity of decline in
Whinchats indicates a large-scale environmental driver
is operating across the majority of the population at
once, not least in core areas of the breeding range in
Britain, with formerly high densities. This pattern of
change is not consistent with a pattern of range
contraction into core habitats, and the sporadic gains
suggest that only localized re-distributions of the
population have occurred. Whinchats are a late
breeding species with a short breeding season, otherwise
exposed to environmental complexities in Africa and
during migration over long distances (Vickery et al.2014). Given the geographic extent of the decline,
which has included core breeding habitats and
landscapes (unlike Stonechat), reduced survival during
the winter or on migration tends to emerge as the
strongest recent candidate source of population
‘pressure’. This is not to say that change could not have
been exacerbated by changes in habitat suitability
during the breeding season given subtle differences in
habitat use between Whinchats and Stonechats that
could be contributing to their contrasting trends. For
example, Whinchats may be more vulnerable to
disruptions in peak summer abundances of biomass on
the breeding grounds than Stonechat due to a short
breeding season. The Stonechats’ longer breeding
season may buffer against pressure points caused by food
shortage or even predation. Also the Whinchats’ finer
grassland habitat use may be more vulnerable to grazing
intensification and grassland improvement measures
than the courser, drier, ruderal vegetation used by
Stonechats (Fuller & Gough 1999).
The Whinchats’ present relationship, in Britain, with
incidentally ‘protected’ grassland mosaics, among
Bracken, less accessible hillside scrub mosaics such as
ffridd in Wales (Fuller et al. 2006), or within young
plantations, emphasizes an increasing reliance upon
rare habitats, protected mainly by circumstances of
topography (difficult terrain), legislation (protected or
military sites or habitats) or fencing (forest
plantations). Also on mainland Europe, the species
persists where strict agri-environment schemes (Birrer
et al. 2007) or mowing controls (Müller et al. 2005,
Grüebler et al. 2008, Broyer et al. 2014) are imposed.
Such change may not have been detected in the
present study due to the bird (atlas) data not matching
directly to the historical landscape data. Moreover,
Whinchats can still occur at outstanding densities (60
pairs/ha) in lowland wet grasslands under ‘traditional’
low intensity management (M. Tome, pers. comm.).
Their persistence in such high quality habitats implies
that large scale, low input grassland habitats still offer
legitimate conditions for viable breeding populations,
with evidence of this effect on Salisbury Plain in
lowland England where a 400-pair, strong population
persists on a very large, extensively managed and
largely protected grassland (Henderson 2011). Yet,
with the species is now disappearing from previously
occupied and apparently suitable habitats in Britain
(Brown & Grice 2005), and in contrast to Stonechats,
the winter or stop-over ecology of Whinchats emerges
again as a convincing source of recent population
decline in this species. If this is true then we can
expect the current declining population trend to affect
even the strongest existing breeding populations and
especially in small and/or increasingly isolated locations.
Whinchats are exposed to potential migratory and
African obstacles (Vickery et al. 2014). In at least one
© 2014 British Trust for Ornithology, Bird Study, 1–13
Populations trends for Whinchat & Stonechat 11
Dow
nloa
ded
by [
New
Yor
k U
nive
rsity
] at
06:
07 0
9 O
ctob
er 2
014
context there is evidence from Nigeria of conditions
currently being favourable for this species (Hulme &
Cresswell 2012), shifting the focus for population
decline on to the stop-over ecology of this species.
Unfortunately, no ecological work has yet been done
on the British population of Whinchats in Africa that
probably lies mainly to the west of Nigeria. There is an
urgent need to identify the wintering range of the
species breeding in different regions of Europe to help
rule out or pinpoint key determinants of survival
operating on different sub-populations.
At the beginning of the 20th century breeding
Whinchats were common and widespread throughout
the British lowlands (Witherby et al. (1938–1941)
1943, Alexander & Lack 1944). An initial phase of
large-scale decline (Parslow 1973) was recognized by
the time of the first national atlas of birds in 1968–
1970 (Sharrock 1976) and was concurrent with large-
scale, post-war programmes of land conversion for
agriculture. Similar patterns of decline and range
change have been observed in other countries such as
Switzerland (Britschgi et al. 2006), Germany (Fischer
et al. 2013) and France (Archaux 2007, Broyer 2009).
Evidently, gross habitat loss has probably shaped the
broad distribution of this species in Britain, and both
habitat availability and predation pressure are known
to impart local and potentially exacerbating constraints
on colonization and productivity (Grant & Pearce-
Higgins 2012). A reversal of trend may be possible
locally by re-installing suitable habitat management
methods at a suitable, probably large, spatial scale. But
once again, the ubiquity of the decline in Whinchats
in the last 20 years suggests a common external driver
operating on virtually the entire population,
simultaneously. Whinchats have become all but
extinct as a breeding bird in most lowland regions
(Balmer et al. 2013) of southern Britain and on this
evidence will remain vulnerable to rapid decline
especially on remaining relatively isolated colonies. On
the strength of its decline, the species was moved from
the green to the amber list of conservation concern
(Eaton et al. 2011). However the scale and magnitude
of decline appears more acute than assumed, which
perhaps should stimulate a revision of the species
conservation status.
ACKNOWLEDGEMENTS
Thank you to all volunteers and organizers contributing to the
BTO/JNCC/RSPB Breeding Bird Survey and the Bird Atlas2007–11, which was a joint project between BTO,
BirdWatch Ireland and the Scottish Ornithologists’ Club.
Maps are reproduced with permission from the British Trust
for Ornithology.
FUNDING
The study was funded by the British Trust for Ornithology.
REFERENCES
Alexander, W.B. & Lack, D. 1944. Changes in status among Britishbreeding birds. Br. Birds 38: 62–69.
Archaux, F. 2007. Are mountains refuges for farmland bird species? Acase study in the northern French Alps. Bird Study 54: 73–79.
Balmer, D.E., Gillings, S., Caffrey, B.J., Swann, R.L., Downie, I.S. &Fuller, R.J. 2013. Bird Atlas 2007–11: The Breeding and WinteringBirds of Britain and Ireland. BTO Books, Thetford.
Bibby, C.J., Philips, B.N. & Seddon, A.J.E. 1985. Birds of restockedconifer plantations in Wales. J. Appl. Ecol. 22: 619–633.
Birrer, S., Spiess, M., Herzog, F., Jenny, M., Kohli, L. & Lugrin, B.2007. The Swiss agri-environment scheme promotes farmland birds:but only moderately. J. Ornithol. 148: 295–303.
Britschgi, A., Spaar, R. & Arlettaz, R. 2006. Impact of grasslandfarming intensification on the breeding ecology of an indicatorinsectivorous passerine, the Whinchat Saxicola rubetra: lessonsfor overall Alpine meadowland management. Biol. Conserv. 130:193–205.
Brown, A.F. & Grice, P.V. 2005. Birds in England. T. & A.D. Poyser,London.
Broyer, J. 2009. Whinchat Saxicola rubetra reproductive successaccording to hay cutting schedule and meadow passerine densityin alluvial and upland meadows in France. J. Nat. Conserv. 17:160–167.
Broyer, J., Sukhanova, O. & Mischenko, A. 2014. Mowingmanagement and density dependence in meadow passerinehatching success. Bird Study 61: 394–403.
Buckland, S.T., Anderson, D.R., Burnham, K.P., Laake, J.L.,Borchers, D.L. & Thomas, L. 2001. Introduction to DistanceSampling, Oxford University Press, Oxford.
Bunce, R.G.H., Barr, C.J., Clarke, R.T., Howard, D.C. & Lane, A.M.J. 1998. ITE Land Classification of Great Britain 1998. NERC-Environmental Information Data Centre. doi:10.5285/971671a6-98b4-4d80-b165-21dace7373b9
Calladine, J. & Bray, J. 2012. The importance of altitude and aspect forbreeding Whinchats Saxicola rubetra in the uplands: limitations of theuplands as a refuge for a declining, formerly widespread species? BirdStudy 59: 43–51.
Cook, M., Waltho, C., Evans, I. & Wernham, C. 2011. Why birdmonitoring in Scotland needs more volunteers. In Marrs, S.J., Foster,S., Hendrie, C., Mackey, E.C. & Thompson, D.B.A. (eds) TheChanging Nature of Scotland, 139–144. TSO Scotland, Edinburgh.
Crick, H.Q.P. 1992. A bird-habitat coding system for use in Britain andIreland incorporating aspects of land-management and humanactivity. Bird Study 39: 1–12.
Dejaifve, P.A. 1994. Ecology and behaviour of a palearctic migrant inAfrica – the wintering of the Whinchat Saxicola rubetra in the Zaireand its winter distribution in Africa. Rev. Ecol. (Terre Vie) 49: 35–52.
Eaton, M.A., Balmer, D.E., Cuthbert, R., Grice, P.V., Hall, J., Hearn,R.D., Holt, C.A., Musgrove, A.J., Noble, D.G., Parsons, M.,Risely, K., Stroud, D.A. & Wotton, S. 2011. The State of the UK’s
© 2014 British Trust for Ornithology, Bird Study, 1–13
12 I. Henderson et al.
Dow
nloa
ded
by [
New
Yor
k U
nive
rsity
] at
06:
07 0
9 O
ctob
er 2
014
Birds 2011. RSPB, BTO, WWT, CCW, JNCC, NE, NIEA and SNH,Sandy, Bedfordshire.
EBCC. 2012. European Bird Census Council. Available from: http://www.ebcc.info
Fischer, K., Busch, R., Fahl, G., Kunz, M. & Knopf, M. 2013. Habitatpreferences and breeding success of Whinchats (Saxicola rubetra) inthe Westerwald mountain range. J. Ornithol. 154: 339–349.
Fuller, R.J. 2012. Avian responses to transitional habitats in temperatecultural landscapes: woodland edges and young-growth. In Fuller,R.J. (ed.) Birds and Habitats: Relationships in Changing Landscapes,125–149. Cambridge University Press, Cambridge.
Fuller, R.J. & Glue, D.E. 1977. The breeding biology of the Stonechatand Whinchat. Bird Study 24: 215–228.
Fuller, R.J. & Gough, S.J. 1999. Changes in sheep numbers in Britain:implications for bird populations. Biol. Conserv. 91: 73–89.
Fuller, R.M., Smith, G.M., Sanderson, J.M., Hill, R.A. & Thomson,A.G. 2002. The UK Land Cover Map 2000: construction of a parcel-based vector map from satellite images. Cartogr. J. 39: 15–25.
Fuller, R.J., Atkinson, P.W., Garnett, M.C., Conway, G.J., Bibby, C.J.& Johnstone, I.G. 2006. Breeding bird communities in theupland margins (ffridd) of Wales in the mid-1980s. Bird Study 53:177–186.
Gibbons, D.W., Reid, J.B. & Chapman, R.A. 1993. The New Atlas ofBreeding Birds in Britain and Ireland: 1988–1991. T.& A.D. Poyser,London.
Grant, M.C. & Pearce-Higgins, J.W. 2012. Spatial variation andhabitat relationships in moorland bird assemblages: a Britishperspective. In Fuller, R.J. (ed.) Birds and Habitat. Relationships inChanging Landscapes, 207–236. Cambridge University Press,Cambridge.
Gregory, R.D., Baillie, S.R. & Bashford, R.I. 2004. Monitoringbreeding birds in the United Kingdom. Bird numbers 1995. In:A. Anselin, ed. Proceedings of the international conference and 13thmeeting of the European Bird Census Council, Pärnu, Estonia. BirdCensus News, 13 (2000): 101–112.
Grüebler, M.U., Schuler, H., Müller, M., Spaar, R., Horch, P. &Naef-Daenzer, B. 2008. Female biased mortality caused byanthropogenic nest loss contributes to population decline and adultsex ratio of a meadow bird. J. Ornithol. 146: 14–23.
Hagemeier, W.J.M. & Blair, M.J. (eds) 1997. The EBCC Atlas ofEuropean Breeding Birds: Their Distribution and Abundance. Poyser,London.
Heegaard, E. 2002. The outer border and central border for species-environmental relationships estimated by non-parametricgeneralised additive models. Ecol. Model. 157: 131–139.
Henderson, I.G. 2011. Fighting for Whinchats on Salisbury plain. BTONews, 293, pp. 10–11.
Holloway, S. 1996. The Historical Atlas of Breeding Birds in Britain andIreland 1875–1900. T. & A.D. Poyser, London.
Hulme, M.F. & Cresswell, W. 2012. Density and behaviour ofWhinchats Saxicola rubetra on African farmland suggest that winterhabitat conditions do not limit European breeding populations. Ibis154: 680–692.
Jiguet, F., Gregory, R.D., Devictor, V., Green, R.E., Voríšek, P., VanStrien, A. & Couvet, D. 2009. Population trends of Europeancommon birds are predicted by characteristics of their climaticniche. Global Change Biol. 16: 497–505.
Maggini, R., Lehmann, A., Kéry, M., Schmid, H., Beniston, M.,Jenni, L. & Zbinden, N. 2011. Are Swiss birds tracking climate
change? Detecting elevational shifts using response curve shapes.Ecol. Model. 222: 21–32.
McCullagh, P. & Nelder, J.A. 1989. Generalized Linear Models.Chapman & Hall, London.
Morrison, C.A., Robinson, R.A., Clark, J.A. & Gill, J.A. 2010. Spatialand temporal variation in population trends in a long-distancemigratory bird. Diversity Distrib. 16: 620–627.
Müller, M., Spaar, R., Schifferli, L. & Jenni, L. 2005. Effects ofchanges in farming of subalpine meadows on a migrant bird, theWhinchat (Saxicola rubetra). J. Ornithol. 146: 14–23.
Ockendon, N., Hewson, C.M., Johnston, A. & Atkinson, P.W. 2012.Declines in British-breeding populations of Afro-Palaearctic migrantbirds are linked to bioclimatic wintering zone in Africa, possibly viaconstraints on arrival time advancement. Bird Study 59: 111–125.
Parslow, J. 1973. Breeding Birds of Britain and Ireland: A HistoricalSurvey. T.& A.D. Poyser, Berkhamsted.
Perry, M., Hollis, D. & Elms, M. 2009. The Generation of Daily GriddedDatasets of Temperature and Rainfall for the UK. ClimateMemorandum 24. National Climate Information Centre, Exeter.
Phillips, J.S. 1970. Inter-specific competition in Stonechat and Whinchat.Bird Study 17: 320–324.
R Development Core Team. 2009. R: A Language and Environment forStatistical Computing. R Foundation for Statistical Computing, Vienna,Austria.
Renwick, A.R., Massimino, D., Newson, S.E., Chamberlain, D.E.,Pearce-Higgins, J.W. & Johnston, A. 2011. Modelling changesin species’ abundance in response to projected climate change.Divers. Distrib. 18: 121–132.
Risely, K., Massimino, D., Newson, S.E., Eaton, M.A., Musgrove,A.J., Noble, D.G., Procter, D. & Baillie, S.R. 2013. The BreedingBird Survey 2012. BTO Research Report 645. British Trust forOrnithology, Thetford.
Sanderson, F.J., Donald, P.F., Pain, D.J., Burfield, I.J. & vanBommel, F.P.J. 2006. Long-term population declines in Afro-Palearctic migrant birds. Biol. Conserv. 131: 93–105.
SAS. 2002. Statistical Analysis System: Version 9.1. SAS Institute, Cary, NC.Sharrock, J.T.R. 1976. The Atlas of Breeding Birds in Britain and Ireland.
T. & A. D. Poyser, Berkhamsted.Sokal, R.R. & Rohlf, F.J. 1995. Biometry: The Principles and Practice of
Statistics in Biological Research, 3rd edn. W.H. Freeman, New York.Stillman, R.A. & Brown, A.F. 1994. Population sizes and habitat
associations of upland breeding birds in the south Pennines,England. Biol. Conserv. 69: 307–314.
Thomas, L., Buckland, S.T., Rexstad, E.A., Laake, J.L.,Strindberg, S., Hedley, S.L., Bishop, J.R.B., Marques, T.A.,Burnham, K.P. 2010. Distance software: design and analysis ofdistance sampling surveys for estimating population size. J. Appl.Ecol. 47: 5–14.
Urquhart, E. & Bowley, A. 2002. Stonechats. A Guide to the GenusSaxicola. Christopher Helm, London.
Vickery, J.A., Ewing, S.R., Smith, K.W., Pain, D.J., Bairlein, F.,Škorpilova, J. & Gregory, R.D. 2014. The decline of Afro-Palaearctic migrants and an assessment of potential causes. Ibis156: 1–22.
Witherby (Ed), H.F., Jourdain, F.C.R., Ticehurst, N.F., Tucker, B.W.(1936–1941). 1943. The Handbook of British Birds. H.F. &G. Witherby Ltd, London.
Zollinger, J.L. 2011. L’expansion du Tarier pâtre Saxicola torquatus aupied du Jura vaudois. Nos Oiseaux 58: 127–144.
(MS received 30 July 2014; revised MS accepted 2 September 2014)
© 2014 British Trust for Ornithology, Bird Study, 1–13
Populations trends for Whinchat & Stonechat 13
Dow
nloa
ded
by [
New
Yor
k U
nive
rsity
] at
06:
07 0
9 O
ctob
er 2
014