evaluation of wood sole plate anchorage …/media/files/reports/sole...evaluation of wood sole plate...
TRANSCRIPT

EVALUATION OF WOOD SOLE PLATE ANCHORAGE TO CONCRETE UNDER MONOTONIC AND CYCLIC LOADING
Prepared for
NAHB and FPL
Prepared by
NAHB Research Center
400 Prince Georges Boulevard
Upper Marlboro, MD 20774-8731
March 2010

Acknowledgements
This research was supported in part by funds provided by the Forest Products Laboratory, Forest
Service, USDA.
This research was supported in part by funds provided by the National Association of Home
Builders.
Disclaimer
Neither the NAHB Research Center, Inc., nor any person acting on its behalf, makes any warranty,
express or implied, with respect to the use of any information, apparatus, method, or process
disclosed in this publication or that such use may not infringe privately owned rights, or assumes
any liabilities with respect to the use of, or for damages resulting from the use of, any information,
apparatus, method or process disclosed in this publication, or is responsible for statements made
or opinions expressed by individual authors.

i March 2010
TABLE OF CONTENTS
PURPOSE ............................................................................................................................ 1
BACKGROUND ................................................................................................................... 1
METHODS AND MATERIALS ............................................................................................. 3
RESULTS ........................................................................................................................... 17
ANALYSIS .......................................................................................................................... 27
SUMMARY AND CONCLUSIONS ..................................................................................... 33
REFERENCES ................................................................................................................... 35
APPENDIX A – Load vs. deflection relationships ........................................................ 36
APPENDIX B – Example concrete design strength calculation ................................... 48
APPENDIX C – Concrete cylinder strengths ............................................................... 50
APPENDIX D – Summary of test results ..................................................................... 51

ii March 2010
LIST OF TABLES
Table 1 – Test matrix ............................................................................................................ 5
Table 2 – Materials and specimen construction ................................................................... 7
Table 3 – Results of single anchor monotonic testing (Configuration 2)............................. 18
Table 4 – Results of single anchor cyclic testing (Configuration 2) .................................... 21
Table 5 – Results of multiple anchor cyclic testing (Configuration 3) ................................. 22
Table 6 – Results of full scale shear wall testing (Configuration 1) .................................... 25
Table 7 – Concrete anchor design strengths per ACI 318-08 (VcbII lb) ............................... 27
Table 8 – Adjusted lateral design strengths per NDS-2005 (ZIIDesign lb).............................. 28
Table 9 – Ratio of calculated design values per ACI 318-08 to average test results .......... 28
Table 10 – Ratio of calculated design values per NDS-2005 to test results ....................... 28

iii March 2010
LIST OF FIGURES
Figure 1 – Location of crack generation in test specimens ................................................... 8
Figure 2 – Pre-cracked test specimen ................................................................................... 8
Figure 3 – Configuration 1 specimen construction .............................................................. 10
Figure 4 – Configuration 2 specimen construction .............................................................. 11
Figure 5 – Configuration 3 specimen construction .............................................................. 11
Figure 6 – Loading bracket detail ........................................................................................ 13
Figure 7 – Instrumentation of test set-up ............................................................................. 14
Figure 8 – Configuration 1 test set up ................................................................................. 15
Figure 9 – Configuration 2 test set-up ................................................................................. 16
Figure 10 – Configuration 3 test set-up ............................................................................... 16
Figure 11 – Plate splitting failure in monotonic test of 2x4 plate with round cut washer (no spall) .......................................................................................................... 19
Figure 12 – Minor spalling in monotonic test of 2x4 plate with round cut washer ................ 19
Figure 13 – Initial spall in monotonic test of 2x4 plate with plate washer ............................ 19
Figure 14 – Final large spall in monotonic test of 2x4 plate with plate washer .................... 19
Figure 15 – Typical yield shape of steel anchor bolt in monotonic test with plate washer .............................................................................................................. 19
Figure 16 – Out-of-plane translation of anchor bolt ............................................................. 19
Figure 17 – Comparison of behavior of un-cracked specimens under cyclic and monotonic loading ............................................................................................ 20
Figure 18 – Tensile failure of bolt in Configuration 2 test .................................................... 21
Figure 19 – Complete concrete breakout at anchor in Configuration 2 test ........................ 21
Figure 20 – Large spall at center bolt in Configuration 3 test .............................................. 23
Figure 21 – Tensile failure of bolts in Configuration 3 test .................................................. 23
Figure 22 – Complete concrete breakout at anchor in Configuration 3 test ........................ 23
Figure 23 – Large spall in first full-scale shear wall test ...................................................... 25
Figure 24 – Plate degradation in full-scale shear wall test with round cut washers ............. 25
Figure 25 – Large spall in third monotonic full-scale shear wall test ................................... 26
Figure 26 – Failure of full-scale shear wall specimen during cyclic testing ......................... 26
Figure 27 – Large spall in full-scale shear wall specimen during cyclic testing ................... 26
Figure 28 – Bolt yielding in full-scale shear wall specimen during cyclic testing ................. 26

iv March 2010
Figure 29 – Comparison of ACI 318-08 design values to un-cracked cyclic test results ..... 29
Figure 30 – Comparison of ACI 318-08 design values to cracked cyclic test results .......... 30
Figure 31 – Comparison of NDS-2005 allowable design values to un-cracked cyclic test results ........................................................................................................ 31
Figure 32 – Comparison of NDS-2005 allowable design values to cracked cyclic test results ............................................................................................................... 32

Sole Plate Anchorage to Concrete
1 March 2010
PURPOSE The purpose of this testing program is to evaluate the performance of cast-in-place foundation anchor bolt connections representative of those used in wood-frame residential construction. This testing program responds to the recent changes in the American Concrete Institute’s Building Code Requirements for Structural Concrete (ACI 318) [1] that significantly reduce the design capacity of near-edge concrete anchors. This reduction has brought into question the conventional practice of using 2x4 sole plates with 1/2-inch bolts spaced at 4 feet or 6 feet on center. However, the new provisions of ACI 318 are based on research of anchorage systems for commercial and industrial construction and use conservative extrapolation of this research to the design of residential systems. Because significant differences exist in construction practices between residential and commercial applications including bolt diameters, edge distances, embedment lengths, bearing capacity of the anchored material, concrete strength, line of bolts spaced apart vs. bolt clusters, etc., it is envisioned that results of this study will help improve accuracy of design methods for residential anchors by capturing representative failure modes, response variability, and applicable safety margins. Specific objectives of this study include:
1) By testing full-scale shear walls, evaluate the response of anchors as part of the wall assembly to be more representative of in-situ conditions.
2) Improve the level of design confidence by measuring the variability in shear anchor performance through testing of an increased number of specimens of the same configuration.
3) Evaluate the performance of multiple-bolt connections including load distribution between bolts in cracked and un-cracked concrete.
BACKGROUND ACI 318-08 Appendix D The design of concrete anchors to resist shear loads is governed by the requirements of Appendix D in the American Concrete Institutes Building Code Requirements for Structural Concrete (ACI 318-08). A basic design example for a residential concrete anchor using the appropriate sections of ACI 318-08 Appendix D is provided in Appendix B of this report to illustrate the design steps and the applicable parameters and criteria. The reports summarized in the remainder of this background section discuss specific design and performance issues with regard to wood anchor bolts and associated implications on ACI-318 provisions. J. Crandell (2008) [2] In this paper, the current state-of-the-art of concrete anchorage design is presented including a review of the background literature used to develop current codified design standards, discussion of ACI 318-08 Appendix D design standard and its relation to conventional wood frame construction. A thorough review of the past research and testing used in the development of the current ACI 318-08 anchor design provisions showed that these provisions utilize Concrete Capacity Design (CCD method). This methodology was originally developed in the mid-1990’s and was calibrated to test results to predict failures at the 5th percentile capacity. The test results were pulled from an international data base of concrete anchorage testing compiled specifically for the purpose of that study.

Sole Plate Anchorage to Concrete
2 March 2010
With regards to the current design standards outlined in ACI 318-08 Appendix D, several key design issues are identified. The first of these issues is the applicability of anchor strength values based on “cracked” concrete conditions. Currently, the base strength value associated with ACI 318-08 is for concrete anchors placed in cracked concrete. An increase in strength is allowed if an un-cracked concrete condition can be assumed. However, there is no guidance or research into whether or not this assumption is valid for typical residential foundation anchors. The second issue focuses on the significant reduction in anchor strength when used in Seismic Design Categories C-F (a reduction factor as low as 0.375 may be applicable). Alternatively, there is an allowance for use of a 0.75 reduction factor if the connection is designed to have a “ductile” failure mode. But again, there is little to no guidance outlining the applicability of this allowance in residential construction. Another key issue discussed is the apparent level of reliability used in the development of the design provisions. Review of the background literature revealed a reliability index, somewhere on the order of 4, that exceeds the index used for the design of anchors in nuclear power plants. This level of safety is far above that used for other elements of light-frame structures. Lastly, the report speaks to the fact that ACI’s small edge distance penalties are developed based on extrapolations from non-residential applications and are potentially overly conservative for typical wood sole plate configurations. The paper also compares the ACI-318 design values with the historic industry practices. As an example, for a 5/8” anchor bolt with 7” embedment and 1.75” edge distance, the ACI 318-08 design capacity in shear parallel to the edge is 510 lbs/bolt. In order to properly anchor a typical wood frame shear wall with a strength of 536 plf, the anchor bolts would need to be placed at 11” on center for high seismic zones. This is far smaller spacing than the typical 4’ to 6’ on center spacing that has performed satisfactorily in the past. Citing this as further evidence, the paper points to the need for more research into the performance of near edge anchors used in residential construction. W. A. Fennell, K. S. Moore, et al. (2009) [3] This report summarizes the testing of wood sill plate to concrete connections with cast-in-place anchor bolts conducted under the support of the Structural Engineers Association of California. The testing was undertaken to address the need for more test data on typical anchor bolted sill plate connections when subjected to seismic loading conditions. A series of 28 tests were conducted on 5/8” L-bolt style, cast-in-place, concrete anchors with an embedment of 7”. The bolts were tested in a pure shear configuration using one of two loading protocols. The first protocol was a monotonic loading at a constant displacement of 0.75”/ min. The second was a cyclic, displacement-based protocol modified from the CUREE loading protocol in ASTM E 2126-08 at a frequency of 0.2 Hz. All of the concrete specimens were 12” wide and had a single #4 top reinforcing bar down the center with a clear cover of 3” (similar to the reinforcement required in the turned-down edge of a residential slab-on-grade constructed in Seismic Design Categories D0, D1 and D2). Concrete strength ranged between 2,500 psi and 2,750 psi. The connected sill plate was pressure treated Douglas Fir No. 2 or Better lumber and varied in size from nominal 2x4 up to nominal 3x6, with corresponding edge distances of 1.75 inches or 2.75 inches. Square plate washers (3” x 3” x 0.229”) were used between the sill plate and the nut of the anchor bolt. One-third of tests also had a 10-mil polyethylene membrane between the sill plate and the concrete specimen to reduce friction.

Sole Plate Anchorage to Concrete
3 March 2010
The report compared the “peak” loads from testing, defined as the highest load prior to a 5% drop in load level, to both the allowable design and predicted ultimate strengths based on NDS 2005 and ACI 318-08 design equations. Testing also utilized impact-echo techniques (ASTM C 1383) during tests. Findings linked the initial peak strength with the onset of concrete side breakout (often prior to visible concrete spalling). Comparison of allowable design values based on wood bearing strength (NDS 2005) to “peak” test loads indicated an average factor of safety of over 4. When the “peak” test loads were compared to allowable concrete controlled design strengths from ACI 318-08 assuming ductile design, an average factor of safety of over 6 was estimated. The testing also exhibited several key behaviors, including “ductile” behavior, as shown by significant displacement of the connection before ultimate failure. A distinct difference was also noted between monotonic tests with and without the polyethylene membrane, indicating substantial frictional effects contributing as high as 40 percent to the total capacity for specimens without the membrane. However, these effects are negligible at very small displacements and were significantly less pronounced during cyclic tests. M. S. Hoehler and R. Eligehausen (2008) [4] This paper summarizes the testing of post-installed concrete anchors placed in cracked concrete and loaded in tension and subjected to different cyclic loading protocols. The test program was designed to investigate the behavior of post-installed anchors with various failure modes, as well as investigate the effect of various cyclic loading protocols on anchor performance. Three loading protocols were evaluated. The first was monotonic loading to establish baseline load-deflection curves and ultimate strengths. The second was cyclic loading with a series of approximately 30 cycles at 50%, 90% or 100% of the average ultimate anchor capacity, followed by monotonic loading to failure. The third protocol was a step-increasing pattern starting at 15% of the average ultimate anchor strength and increasing by 15% after 5 cycles. This pattern was repeated for a total of 6 steps, after which the anchor was loaded cyclically until failure. Both cyclic loading protocols were run at a frequency of 0.5 Hz. The first cyclic protocol was also run at 5 Hz for the 90% of load level. Results from the first cyclic loading protocol at 90% strength using frequencies of 0.5 Hz and 5 Hz indicated that the increase in frequency did not have a negative effect on the residual anchor strength, independent of the failure mode. Load-displacement curves from both cyclic loading protocols at 90% strength were in good agreement with envelope curves obtained during monotonic testing for all anchors tested. Residual strength of the tested anchors was also un-affected by the type of cyclic protocol.
METHODS AND MATERIALS General Testing was conducted at the NAHB Research Center Laboratory Facility located in Upper Marlboro, MD. All specimens were constructed in the laboratory and the concrete and anchors were purchased from local suppliers. Table 1 summarizes the test matrix for this program. A total of three primary configurations were tested:

Sole Plate Anchorage to Concrete
4 March 2010
1. Multiple anchors in a full-scale shear wall
2. Single anchors in cracked and un-cracked concrete 3. Multiple anchors both with concrete cracked and un-cracked at the anchor location
Table 1 includes a purpose statement for each test configuration. The testing was conducted using either a monotonic or cyclic protocol to obtain data relevant to both wind and seismic design procedures. The testing program focused on the performance of 1/2-inch-diameter bolts that represent typical practice in residential construction. It also complements and allows for comparison with results of the study conducted by Fennel et al (see Background section) that focused on 5/8-inch-diameter bolts. Because the response of anchor bolts in a wall assembly is complex, involving interaction between the sheathing, plate, bolt, and concrete, a series of full-size 8 foot by 8 foot shear wall tests were conducted (Configuration 1). The purpose of Configuration 1 was to accurately capture the performance of bolted connections as part of a wall assembly with the force delivered to the plate through the sheathing and framing connections. Configuration 1 also served to verify that the results of the component testing were reasonably representative of bolted connection response in a full-size wall assembly. The anchors were resisting only in-plane shear forces with uplift forces resisted by holddown rods in accordance with the ASTM E 72 -05 Standard Test Methods for Conducting Strength Tests of Panels for Building Construction [5] requirements. Configuration 2 was designed to provide data with regard to the performance of cracked and un-cracked single anchor bolts. For the cyclic tests of configurations with 2x4 sole plates a sample size of 16 was tested to achieve an improved statistical confidence of the results. The sample size of 16 was selected to provide a 5% precision at 75% confidence interval (CI) for a coefficient of variation (COV) of about 15%. Configuration 3 was designed to evaluate the response of multiple anchor bolts connecting a continuous sole plate member with the focus on capturing the load sharing mechanism between the cracked and un-cracked bolts.

Sole Plate Anchorage to Concrete
5 March 2010
Table 1 – Test matrix
Primary Configuration
Loading Bolt Layout Initial
Condition of Concrete
Bolt Size
Washers Sole Plate Size / Edge Distance
No. of Tests
Purpose
Configuration 1 –
8’ x 8’ Shear Wall System
Monotonic
Un-Cracked 1/2"
1-3/8” dia. x 1/8” thick round cut washer 2x4 / 1.75"
1 Understand bolt response in a wall assembly under monotonic loading by forcing the failure at
the anchorage connection
3”x3”x0.229” plate per
IRC 2
Cyclic ASTM E
2129 Method C (CUREE Protocol)
3”x3”x0.229” plate per
IRC
2x4 / 1.75"
2 Same as above under cyclic
loading
Configuration 2 –
Individual Anchor Bolt
Monotonic
Un-Cracked
1/2"
1-3/8” dia. x 1/8” thick round cut washer
2x4 / 1.75" 4
Measure the capacity of individual bolts under monotonic load in cracked vs un-cracked
concrete
3”x3”x0.229” plate per
IRC
2x6 / 2.75" 2
2x4 / 1.75" 6
Cracked 2x4 / 1.75" 6
Cyclic ASTM E
2129 Method C (CUREE Protocol)
Un-Cracked
3”x3”x0.229” plate per
IRC
2x4 / 1.75" 16 Same as above under cyclic
loading with an increased sample size for capturing a range of
variability
Cracked 2x4 / 1.75" 16
Un-Cracked 2x6 / 2.75" 2

Sole Plate Anchorage to Concrete
6 March 2010
Table 1 – Continued
Primary Configuration
Loading Bolt Layout Initial
Condition of Concrete
Bolt Size
Washers Sole Plate Size / Edge Distance
No. of Tests
Purpose
Configuration 3 –
Multiple System
(including bolts in cracked concrete)
Cyclic ASTM E
2129 Method C (CUREE Protocol)
Un-Cracked
1/2" 3”x3”x0.229”
plate per IRC
2x4 / 1.75” 6
Evaluate capacity of multiple bolts and the effect on variability;
and provide a baseline for configuration with multiple bolts with a bolt in cracked concrete
X = Location of Cracked
Concrete at Bolt 2x4 / 1.75" 6
Capture the load distribution between one cracked and two
un-cracked bolts

Sole Plate Anchorage to Concrete
7 March 2010
Specimen Construction Table 2 provides a summary of the materials for specimen construction. Type I Portland cement concrete with a specified 28-day compressive strength of 2,500 psi was used for all specimens. Specimens were allowed to cure for at least 28-days. A total of 30 concrete test cylinders were constructed from the same concrete and field cured as specified in ASTM C 31 – 08 Standard Practice for Making and Curing Concrete Test Specimens in the Field [6]. Three cylinders were tested at the 28-day mark. The remaining cylinders were tested periodically throughout the duration of the test program to provide a continuous evaluation of the actual concrete strength in the specimens. Appendix C provides a summary of the concrete cylinder strengths.
Table 2 – Materials and specimen construction Cast concrete block dimensions:
Configuration 1: 16 inches wide x 12 inches deep x 96 inches long Configuration 2: 16 inches wide x 12 inches deep x 48 inches long Configuration 3: 16 inches wide x 12 inches deep x 72 inches long The top surface of the concrete was trowelled to provide a smooth and level surface.
Concrete: Type I Portland Cement, f’c = 2,500 psi (specified, see Appendix C for actual compressive strength)
Steel reinforcement: (1) #4 bar top and bottom w/ 3-inch clear cover in all specimens (at least 5 inches away from the bolt and the location of concrete cone failure)
Anchor bolts: 1/2-inch diameter ASTM F1554 Grade 36 “L-style” bolts with cut threads, actual 0.5-inch diameter
Anchor bolt washers: 3-inch x 3-inch x 0.229-inch A36 steel plate washers or 1-3/8-inch dia. x 1/8-inch thick standard round cut washers, per test matrix Wood plate pre-drilled with a 9/16-inch drill bit to allow for a 1/16-inch oversized opening
Anchor bolt embedment length: 7 inches into concrete
Anchor bolt edge distance: 1-3/4 inches (2x4 sole plate) or 2-3/4 inches (2x6 sole plate), per test matrix Bolts were installed using a template to ensure intended edge distance and vertical position and alignment of the bolt (actual distance was measured before each test)
Sole plate material: 2x Southern Pine #2 Grade pressure treated lumber (CA-C preservative treatment), per test matrix Sole plate lumber was conditioned to about a 12% moisture content and had an average measured SG = 0.52
Framing lumber for Configuration 1 specimens:
2x4 Southern Pine #2 Lumber, studs spaced at 16 inches o.c.
Sheathing: Configuration 1 – 15/32 inch OSB panel nailed w/ 10d (3-inch x 0.148-inch) nails (both faces of wall). See Figure 3 for nail spacing
Stud-to-plate connection (2) 16d pneumatic (3.25-inch x 0.131-inch) nails per each stud (both studs in a double stud receive nails)

Sole Plate Anchorage to Concrete
8 March 2010
Where indicated by the test matrix (Table 1), the concrete at the anchor bolt was pre-cracked prior to testing. The crack was introduced by inserting metal splitting wedges into 1/2-inch-diameter PVC pipe inserts pre-installed into the concrete during specimen fabrication (see Figure 1). The PVC inserts were pre-split before installation in the direction of the crack and were lubricated to enable better crack control. The crack was introduced perpendicular to the direction of loading and was opened to an approximate width between 0.012 and 0.02 inches. The width of the crack was controlled by the depth of the splitting wedges driven into the PVC inserts.
Figure 1 – Location of crack generation in test specimens
This method is in accordance with the recommendations outlined by Eligehausen et al [7] to generate cracks for testing of anchors in cracked-concrete conditions. All specimens had one #4 horizontal steel reinforcing bar top and bottom with 3 inches of clear cover at the top, placed in the center of the specimens to control the crack width and keep the specimen as one unit. This amount of reinforcement is less than the amount recommended by Eligehausen, but was sufficient to control crack width for the purposes of this testing. The rebar was at least 5 inches away from the bolt and the cone failure of the concrete. A series of exploratory tests confirmed that the cone plane was sufficiently apart from the rebar. Figure 2 provides a photo of a pre-cracked specimen.
Figure 2 – Pre-cracked test specimen
Splitting Wedge Crack

Sole Plate Anchorage to Concrete
9 March 2010
Anchor bolts were confirmed to meet ASTM F1554-07 Standard Specification for Anchor Bolts, Steel, 36, 55 and 105-ksi Yield Strength [8] Grade 36 specifications by mill certifications provided by the manufacturer (mill certifications reported measured yield strengths of the steel ranging from 47.5 ksi to 67.7 ksi). All anchor bolts were cast in place during specimen fabrication using a template to ensure bolt’s position, edge distance, and alignment. The edge distance was measured and recorded for each bolt before testing. The wood sole plate was predrilled using a 9/16-inch drill bit to allow for a 1/16-inch oversized hole. Initial monotonic tests of Configuration 2 used standard round cut washers, however, the remainder of the tests used 3-inch by 3-inch by 0.229-inch steel plate washers to reduce splitting of the bottom plates. The use of plate washers is in accordance with Section R602.11.1 of the 2006 International Residential Code for Seismic Design Categories D0, D1 & D2 and Section 305.2.3.1 of ICC 600-2008 Standard for Residential Construction in High-Wind Regions. The anchor bolt nuts in all configurations were installed to finger tight plus an additional 1/4-turn using a wrench. A two-layer, 10-mil polyethylene membrane with white lithium grease between layers was placed between the concrete specimen and the sole plate to reduce the contribution of friction at the wood-to-concrete interface on the strength of the connection. The shear wall specimens were constructed using Southern Pine #2 grade 2x4 studs spaced at 16-inches on center, sheathed on both sides with wood structural panels. Two anchor bolts were used per specimen. The nailing schedule was initially selected at 3.5 inches on center on the panel edges and 12 inches in the panel field with the design indicating adequate shear wall capacity to reach failure of the anchor bolts. The first two tests with this nailing schedule demonstrated that the capacity of the anchor bolts was narrowly balanced with the capacity of the shear wall such that the failure of concrete bolts could not be consistently achieved. Therefore, the nailing schedule was changed to a non-standard pattern shown in Figure 3 to provide a stronger and stiffer wall specimen to consistently force the failure at the anchor bolts.

Sole Plate Anchorage to Concrete
10 March 2010
Figure 3 – Configuration 1 specimen construction
Figures 4 and 5 show the specimen construction for Configurations 2 and 3, respectively. All concrete blocks were cast with two rows of anchors along the two edges of the specimen to enable multiple tests on a single block. Bolt rows were spaced at least 10.5 inches apart to prevent interaction between the concrete at adjacent anchors. The 12-inch specimen depth allowed for the development of the full cone failure in the concrete. Configuration 2 specimens were designed to enable four individual anchor tests per concrete specimen. Configuration 3 specimens were designed to provide two group anchor tests per concrete specimen. The 12-inch distance to the end of the specimens in both configurations is typical of residential construction and in accordance with the requirements of Section R403.1.6 of the 2006 IRC.

Sole Plate Anchorage to Concrete
11 March 2010
Figure 4 – Configuration 2 specimen construction
Figure 5 – Configuration 3 specimen construction

Sole Plate Anchorage to Concrete
12 March 2010
Test Setup and Protocol Specimens were tested using a racking shear testing apparatus controlled via a computer-based system. Instrument readings including load and deflection measurements were recorded using a computer-based data acquisition system. All tests were displacement controlled. For Configuration 1 (8’x8’ shear walls), monotonic loading was applied at the top of the wall in tension at a rate of 1-inch per minute. This rate resulted in the ultimate load (intended to observe ultimate behavior at the anchorage) being achieved in not less than 1 minute and not more than 3 minutes in accordance with ASTM E 488-96 Standard Test Methods for Strengths of Anchors in Concrete and Masonry Elements [9]. Configuration 1 loading was applied to the top of the wall using a 4-inch x 6-inch steel box beam bolted through both top plates with 5/8-inch through bolts at approximately 1 foot on center. The wall specimens were fully restrained against uplift using ASTM E 72 type restraints (at both ends of the specimens for cyclic tests) limiting the anchor response primarily to in-plane shear. Cyclic loading for Configuration 1 was applied in accordance with the Method C basic loading protocol (CUREE protocol) outlined in ASTM E 2126-08 Standard Test Methods for Cyclic (Reversed) Load Test for Shear Resistance of Vertical Elements of the Lateral Force Resisting Systems for Buildings [10] a displacement controlled protocol was selected based on guidance in CUREE Publication No. W-02 Development of a Testing Protocol for Woodframe Structures [11] regarding testing where bolt yielding is the expected failure mode. The cyclic loading protocol had a frequency of 0.2 Hz and was developed using a reference deformation of 3.2 inches. The reference deformation was obtained from the monotonic shear wall tests by adjusting the top of wall deformation at 80% post peak strength by a γ-factor of 0.9. A γ-factor of 0.9 was chosen to ensure that the shear wall specimen underwent a full cyclic protocol (minimum of 8 steps). The γ-factor accounts for any difference in deformation capacity between monotonic and cyclic tests. Initial tests of Configuration 2 were conducted to measure cyclic degradation of the anchor bolt and sole plate. All initial test specimens achieved a full cyclic protocol with a γ-factor of 1.0 (i.e., all 8 full cycles were applied before failure occurred). The following horizontal displacements were measured in Configuration 1 using Linear Variable Digital Transformers (LVDT’s) (Figure 7):
1) Displacement of the concrete specimen relative to the set-up base 2) Bottom plate slip relative to the concrete specimen
The following displacements were measured in Configuration 1 using string potentiometers (Figure 7):
1) Movement at the top of the wall 2) Movement at the plate relative to the concrete specimen
For Configurations 2 and 3, monotonic loading was applied at a rate of 1-inch per minute. This resulted in the ultimate load being achieved in not less than 1 minute and not more than 3 minutes in accordance with ASTM E 488-96. Cyclic loading of Configurations 2 and 3 was applied using the CUREE Basic Loading Protocol in ASTM E 2126-08 at a frequency of 0.2 Hz. The protocol was developed using a reference deformation of the sole plate of 1.6 inches, obtained from the monotonic tests of Configuration 2. A γ-factor of 1.0 was applied to the monotonic deformation at 80% post peak strength. (Initial tests of Configuration 2 to measure cyclic degradation achieved a full cyclic protocol before failing.)

Sole Plate Anchorage to Concrete
13 March 2010
Displacements in monotonic and cyclic testing of Configurations 2 and 3 were applied to the sole plate using a steel loading bracket. Figure 6 provides a schematic of the loading bracket used for Configuration 2 tests. The bracket used in the Configuration 3 tests was identical except that it was longer and had three slots to accommodate the two additional anchors. The brackets consisted of steel channels with steel bearing tabs at each end of the sole plate that applied the load in both directions through end-grain bearing. The loading cylinder was restrained to prevent uplift of the cylinder. The concrete block was secured from lateral movement with restraint fixtures at each end located in the bottom third of the block (Figure 7). The concrete blocks were also restrained against uplift with a steel tube hold-down fixture oriented along the length of the specimen (Figure 9).
Figure 6 – Loading bracket detail
Slip displacement between the sole plate and the concrete specimen was captured using a LVDT. Movement of the concrete specimen relative to the base of the racking shear apparatus was also captured. Figure 7 shows the locations of the load and deflection measurements for the various configurations and Figures 8 through 10 provide photographs of the various test set-ups.

Sole Plate Anchorage to Concrete
14 March 2010
Figure 7 – Instrumentation of test set-up

Sole Plate Anchorage to Concrete
March 2010 15
Figure 8 – Configuration 1 test set up

Sole Plate Anchorage to Concrete
16 March 2010
Figure 9 – Configuration 2 test set-up
Figure 10 – Configuration 3 test set-up

Sole Plate Anchorage to Concrete
March 2010 17
RESULTS Appendix A to this report includes the load-deflection relationships for all specimens. Appendix D to this report provides a summary of the test results from each configuration for every specimen tested. It includes the specimen name, description, peak load or loads (for cyclic), bolt edge distance, specific gravity of the sole plate and primary failure mode.
Single bolt tests (Configuration 2) Testing of single bolt specimens (Configuration 2) was conducted in two phases. The purpose of the first phase was to determine the ultimate capacity of anchor bolts under monotonic loading in un-cracked and cracked concrete conditions. Results of the first phase of Configuration 2 testing are summarized in Table 3 including the average peak load. Failure modes for each test are included in Appendix D of this report and further summarized below. The first four tests of Configuration 2 included specimens with a 2x4 sole plate and standard round cut washers. The primary failure mode was splitting of the wood sole plate (Figures 11 & 12). Only two of the four specimens exhibited any visible damage to the concrete and then only in the form of minor spalling at the surface (Figure 12). Based on observations of specimens after the test, the bolts typically exhibited a deformed mode shape corresponding to Yield Mode IIIs based on the NDS design nomenclature. The average peak load achieved by specimens with round cut washers was 5,128 lb. Two tests were conducted using a 2x6 sole plate and flat plate washers. The specimens with 2x6 sole plates reached an average peak strength of 9,184 lb with splitting along the length of the plate as the primary failure mode. Concrete failure could not be achieved prior to the sole plate splitting because of the increased strength of the anchor bolt with the greater concrete edge distance. Therefore, no more tests of 2x6 sole plates were conducted. Six tests of un-cracked specimens were conducted with 2x4 sole plates and flat plate washers. The primary failure mode was a small initial spall in the face of the concrete at the anchor, followed by further concrete spalling at the same location. Figures 13 and 14 show the initial and final spalling, respectively, of the same specimen from a single test. Following the initial spall, the specimens continued to resist load until failure was reached. The average peak load achieved in the un-cracked concrete specimens was 7,080 lb. Six tests were conducted using 2x4 sole plates with plate washers and a pre-cracked concrete specimen. The primary failure mode observed was also small initial spalling of the concrete face followed by larger spalling at failure and was similar to the behavior exhibited by the un-cracked specimens. The average peak load achieved with the pre-cracked concrete specimens was 6,519 lb, only 7.9 percent lower than the average peak load of the un-cracked concrete specimens. This low reduction in strength indicates that the ductile performance of the overall connection makes it relatively tolerant to the effects of minor cracking. Figure 15 shows the typical shape of the anchor bolt after the test (the wood plate removed to facilitate inspection of the bolt). This deformed shape corresponds with a Yield Mode IVs based on NDS nomenclature and was observed in the majority of monotonic tests with 2x4 sole plates and plate washers. Some deformation of the bolt in the direction perpendicular to the edge of the concrete was also observed (see Figure 16). This movement is indicative of the lack of out-of-plane restraint placed on the sole plate during testing.

Sole Plate Anchorage to Concrete
18 March 2010
Table 3 – Results of single anchor monotonic testing (Configuration 2)
Sample Size
Initial Condition
of Concrete
Bolt Size
Washers
Sole Plate Size / Edge
Distance
Avg. Peak
Load (lb)
4
Un-cracked
1/2"
Round cut washer
2x4 / 1.75" 5,128
2
3”x3”x0.229” plate per IRC
2x6 / 2.75" 9,184
6 2x4 / 1.75" 7,080
6 Cracked 2x4 / 1.75" 6,519

Sole Plate Anchorage to Concrete
March 2010 19
Figure 11 – Plate splitting failure in monotonic test
of 2x4 plate with round cut washer (no spall)
Figure 12 – Minor spalling in monotonic test of 2x4
plate with round cut washer
Figure 13 – Initial spall in monotonic test of 2x4
plate with plate washer
Figure 14 – Final large spall in monotonic test of 2x4
plate with plate washer
Figure 15 – Typical yield shape of steel anchor bolt
in monotonic test with plate washer
Figure 16 – Out-of-plane translation of anchor bolt
≈ 1/2"

Sole Plate Anchorage to Concrete
20 March 2010
The second phase of the single bolt (Configuration 2) testing was conducted to evaluate the cyclic performance of single anchor bolts in un-cracked and cracked concrete conditions. A larger sample size was chosen to improve the statistical significance of the results. Results of the second phase of Configuration 2 testing are summarized in Table 4 including the peaks loads from both the positive and negative envelope curves and the average total peak load. Results from both cyclic testing of un-cracked and cracked specimens exhibited a coefficient of variation of 0.13, indicating a 5% precision at a 75% confidence interval. Results from the cyclic testing were analyzed in accordance with ASTM E 2126-08 by developing positive and negative envelope curves and calculating the absolute maximum load for both. The peak load is defined by E 2126-08 as the average of the absolute maximum values. Configuration 2 specimens tested cyclically with an un-cracked concrete condition achieved an average peak load of 5,560 lb, about a 20 percent reduction compared to results of monotonically tested specimens. However, it should be noted that the magnitude of the reduction is in part due to the definition of peak load in ASTM E 2126 that averages the peaks in the positive and negative directions. The behavior of the anchors is such that the peak in one direction is always about 1,000 lb higher than in the opposite direction due to (1) cumulative damage and (2) slack in the system. The Configuration 2 specimens exhibited performance behavior similar to those specimens tested under monotonic loading. Figure 17 provides an example comparison between the behavior of un-cracked specimens loaded under monotonic and cyclic loading protocols. Typically, the positive envelope curves of the cyclically tested specimens matched the basic shape of the load-displacement curves from monotonic testing.
Figure 17 – Comparison of behavior of un-cracked specimens under cyclic and monotonic loading

Sole Plate Anchorage to Concrete
March 2010 21
Failure in the Configuration 2 cyclic specimens was observed as large spalling of the concrete and yielding of the anchor bolt at two locations; just below the concrete surface and at the plate washer. This was followed by tensile failure of the anchor bolt at the interface between the nut and the plate washer (see Figure 18). The only instances when this tensile failure did not occur were when the entire anchor bolt broke out of the face of the concrete (see Figure 19). The tensile failure was due to the plate washer preventing the bolt from tearing through the sole plate at larger displacements, forcing the bolt to elongate and then fail in tension. It should be noted that even at large displacements, the sole plate exhibited only minor uplift. Configuration 2 specimens with a pre-cracked concrete condition that were tested cyclically reached an average peak load of 5,157 lb, a 7.2 percent reduction from the un-cracked specimen tests. Two additional tests were performed using 2x6 sole plates with plate washers to evaluate how the greater edge distance affected the cyclic performance of the anchor bolt. The behavior was similar to the monotonic testing of 2x6 sole plates. No visible concrete failure was observed. Instead, the specimens failed by tensile failure of the anchor bolt after significant degradation of the sole plate.
Table 4 – Results of single anchor cyclic testing (Configuration 2)
Sample Size
Initial Condition
of Concrete
Bolt Size
Washers
Sole Plate Size / Edge
Distance
Avg. Load in (+) Dir
(lb)
Avg. Load in (-) Dir
(lb)
Avg. Peak
Load (lb)
16 Un-
cracked
1/2" 3”x3”x0.229”
plate per IRC
2x4 / 1.75"
6,201 4,920 5,560
16 Cracked 5,630 4,685 5,157
2 Un-
cracked 2x6 / 2.75” 5,953 5,991 5,972
Figure 18 – Tensile failure of bolt in Configuration 2
test
Figure 19 – Complete concrete breakout at anchor in
Configuration 2 test

Sole Plate Anchorage to Concrete
22 March 2010
Multiple bolt tests (Configuration 3) Configuration 3 was tested to evaluate the capacity and load sharing behavior of a multiple bolt connection with the center bolts in un-cracked or pre-cracked concrete condition. Results of Configuration 3 testing are summarized in Table 5 including the peaks loads from the positive and negative envelope curves, the average total peak load and the average peak load on a per bolt basis. Peak loads were derived in accordance with ASTM E 2126-08 by calculating the average absolute maximum load from the positive and negative envelope curves. The average peak load achieved by Configuration 3 tests without a pre-cracked concrete condition at the center bolt was 13,876 lb, or 4,625 lb per anchor bolt. The per bolt capacity is 17 percent less than expected based on the results of Configuration 2 cyclic testing of single anchors, indicating a multiple bolt effect. The average peak load of Configuration 3 specimens with a cracked concrete condition at the center bolt was 14,928 lb, or 4,976 lb per bolt. The per bolt capacity is 10 percent less than expected based on Configuration 2 testing. Interestingly, specimens with the center bolt pre-cracked showed a slight increase in capacity. This is in line with results of Configuration 2 tests, which indicated a tolerance to minor cracking due to the ductility of the connection. Therefore, in multiple bolt configurations like those typical for anchorage in residential construction, cracking at an individual bolt does not have a negative effect on capacity due to load sharing. All of the Configuration 3 tests exhibited similar failure behavior to Configuration 2 tests. All three anchor bolts in a specimen exhibited initial spalling during the same loading cycle, followed by a continuing increase in load. Large spalling occurred next, generally at the center bolt location in both the un-cracked and cracked specimens (Figure 20). Several tests also exhibited large spalling at least one of the end bolt locations as well. Ultimate failure occurred as either tensile failure of one, two or all three bolts (Figure 21), or complete concrete break out of a single bolt (Figure 22). Table 5 – Results of multiple anchor cyclic testing (Configuration 3)
Sample Size
Initial Condition
of Concrete at Center
Bolt
Bolt Size
Washers Sole Plate Size / Edge Distance
Avg. Peak Load in (+)
Dir (lb)
Avg. Peak Load in (-)
Dir (lb)
Avg. Peak Load (lb)
Avg. Peak Load per
Bolt (lb)
6 Un-cracked
1/2" 3”x3”x0.229” plate per
IRC 2x4 / 1.75"
15,104 12,649 13,876 4,625
6 Cracked 15,787 14,068 14,928 4,976

Sole Plate Anchorage to Concrete
March 2010 23
Figure 20 – Large spall at center bolt in
Configuration 3 test
Figure 21 – Tensile failure of bolts in Configuration 3
test
Figure 22 – Complete concrete breakout at anchor in Configuration 3 test

Sole Plate Anchorage to Concrete
24 March 2010
Full-scale shear wall tests (Configuration 1) Configuration 1 was tested to evaluate the response of concrete anchors in a full scale wall assembly under monotonic and cyclic loading. Table 6 summarizes the results of the Configuration 1 testing, including the peaks loads from the positive and negative envelope curves, the average total peak load and the average peak load on a per bolt basis. The first specimen was tested monotonically with round cut washers and a standard 3.5-inch / 12-inch nailing pattern. The specimen reached a peak load of 15,758 lb at a displacement of 1.63 inches at the bottom plate. Large spalls at both bolt locations developed at failure (Figure 23), along with significant plate degradation and splitting at the washer (Figure 24). Significant yielding was also present in the anchor bolts just below the surface of the concrete. The second specimen was tested monotonically with flat plate washers and the same nailing pattern. The second Configuration 1 specimen achieved a greater load than the first, but did not reach bolt failure due to insufficient wall strength. The bottom plate only displaced a total of 1.4 inches. The nailing pattern of the sheathing in the third test of Configuration 1 was modified to increase the stiffness and capacity of the wall. The third specimen achieved a peak load of 19,387 lb at a bottom plate displacement of 1.67 inches. This capacity corresponds to a 37 percent increase over results from the single anchor tests of Configuration 2 when compared on a per bolt basis. This level of increase suggests a significant contribution of friction at the compression post of the shear wall. The friction reducing membrane was installed with all shear wall specimens but was not capable of completely eliminating friction at locations of high concentrated forces. (It should be noted that the high frictional force at the compression post would also be present in braced wall panels or shear wall segments in residential walls during a loading event such as a hurricane or an earthquake. The contribution of friction at compression posts would be less significant in longer walls without any openings where there are fewer compression posts relative to the number of bolts in the wall as compared to the tested specimens.) The primary failure mode was initial spalling of the concrete at both bolts, followed by tensile failure of both anchors due to the in-plane lateral displacement of the sole plate. Figure 26 shows the large concrete spall at the uplift end of the wall. The bottom plate at the uplift end also moved perpendicular to the face of the concrete approximately 1/2-inch. No perpendicular movement occurred at the compression end of the wall. The fourth and fifth specimens in Configuration 1 were tested cyclically. The peak load for the fourth Configuration 1 specimen was 18,475 lb. Behavior was similar to the failure behavior exhibited by the third Configuration 1 specimen including small initial spalls, larger spalls at failure, tensile failure of the anchor bolts and out-of-plane translation of the bottom plate. The peak load reached by the fifth specimen was lower, at 14,697 lb (an approximate increase of 30 percent over the single anchor cyclic test results). The specimen failed, however, by sole plate splitting and tensile rupture of the anchor bolts shortly after initial spalling occurred. Larger spalling of the concrete was not developed.

Sole Plate Anchorage to Concrete
March 2010 25
Table 6 – Results of full scale shear wall testing (Configuration 1)
Sample Size
Initial Condition
of Concrete
Bolt Size
Washers
Sole Plate Size / Edge
Distance
Avg. Peak
Load in (+) Dir
(lb)
Avg. Peak
Load in (-) Dir (lb)
Peak Load (lb)
Peak Load
per Bolt (lb)
1
Un-cracked 1/2"
Round cut washer
2x4 / 1.75"
--- --- 15,758 7,879
1
3”x3”x0.229” plate per
IRC
2x4 / 1.75"
--- --- 19,5361 9,768
1 2x4 / 1.75"
--- --- 19,387 9,693
1 2x4 / 1.75"
19,408 17,543 18,4752 9,237
1 2x4 / 1.75"
14,781 14,614 14,6972 7,348
1. Wall specimen failed before concrete anchor bolts 2. Peak load defined as average absolute maximum load from positive and negative envelope
curves per ASTM E 2926-08
Figure 23 – Large spall in first full-scale shear wall
test
Figure 24 – Plate degradation in full-scale shear wall
test with round cut washers

Sole Plate Anchorage to Concrete
26 March 2010
Figure 25 – Large spall in third monotonic full-scale
shear wall test
Figure 26 – Failure of full-scale shear wall specimen during cyclic testing (sheathing removed post-test
to allow for inspection)
Figure 27 – Large spall in full-scale shear wall
specimen during cyclic testing (sheathing removed post-test to allow for inspection)
Figure 28 – Bolt yielding in full-scale shear wall
specimen during cyclic testing

Sole Plate Anchorage to Concrete
March 2010 27
ANALYSIS Results from testing were compared to design capacities based on concrete anchor design (ACI 318) and wood connection design (NDS). Where multiple anchors were tested in a group, the total peak load was divided by the number of anchors to provide the strength per anchor. Design strengths of concrete anchors in shear were calculated per Appendix D of ACI 318-08. The nominal concrete breakout strength is determined from the basic breakout strength of the anchor loaded perpendicular to the free edge of the concrete which takes into account anchor edge distance. The breakout strength is adjusted by applicable factors to account for cracked concrete condition, seismic design category, and non-ductile behavior in the connection. The design concrete anchor strength is further reduced by a factor (Φ) of 0.7 in accordance with LRFD design methodology. The strength of an anchor bolt in shear parallel to the edge of the concrete is defined as twice the strength of the same anchor bolt in shear perpendicular to the edge. Table 7 provides a summary of design concrete breakout strengths with the various reductions applied over the range of concrete specimens strengths tested. Appendix B to this report provides an example calculation of the design concrete breakout strength for the typical anchor tested.
Table 7 – Concrete anchor design strengths per ACI 318-08 (VcbII lb)1
Concrete Strength
(psi)
SDC A or B, un-cracked
SDC A or B, cracked
SDC C-F, un-cracked, ductile
connection
SDC C-F, cracked, ductile
connection
SDC C-F, un-cracked, non-
ductile connection
SDC C-F, cracked, non-
ductile connection
3,000 1,865 1,332 1,398 999 699 499
3,200 1,926 1,376 1,444 1,032 722 516
3,400 1,985 1,418 1,489 1,063 744 532
3,600 2,043 1,459 1,532 1,094 766 548
1. ACI 318-08 employs an LRFD design approach. As such, the concrete anchor design strengths presented here include a strength reduction factor, Φ
Adjusted lateral design strengths of the wood sole plate connection were calculated per National Design Specification for Wood Construction 2005 Edition (NDS-2005) [12] using the Yield Mode Equations. Nominal design values represent the lowest connection capacity based on all yield modes. (Typically, the Yield Mode IIIs design value controls for a wood to concrete bolted connection.) The reference lateral design strengths were multiplied by the load duration factor (Cd = 1.6). It should be noted that the typical yield mode exhibited during testing was Yield Mode IV. Table 8 provides a summary of the allowable design values based on the NDS-2005 over a range of concrete specimen strengths. The NDS-2005 does not provide concrete dowel bearing strengths for concrete with greater than 2,500 psi compressive strengths. Therefore, the same design value applies for all tested specimens. Also, lateral design values were not adjusted by group reduction factor (Cg) because design of shear wall anchorage assumes the shear load is distributed uniformly to each bolt by the sheathing to sole plate nailing.

Sole Plate Anchorage to Concrete
28 March 2010
Table 8 – Adjusted lateral design strengths per NDS-2005 (ZIIDesign lb)
Concrete Strength (psi) Theoretical ZIIDesign1
Allowable ZIIDesign2
2,500 1,060 1,088
3,000 1,091 1,088
3,500 1,115 1,088
1. Theoretical design strengths calculated using measured sole plate SG of 0.52 and concrete dowel bearing strengths (Fe) equal to 3 times the tested compressive strength (f’c)
2. Allowable design strengths are based on ASD design methodology per NDS-2005 and assume SG of 0.55 and concrete compressive strength (f’c) of 2,500 psi
When compared to multiple anchor tests, the adjusted design values were multiplied by the group action factor (Cg) per Section 10.3.6 of NDS-2005. Tables 9 and 10 summarize the comparisons between test results and calculated design values using ACI 318-08 and NDS-2005, respectively. Comparison is made on a per bolt basis as a ratio of the average peak test load to the calculated lateral design strength based on the average tested concrete strength of 3,300 psi. Comparison to calculated design values per ACI 318-08 is made to illustrate the relative effect of reductions for cracked concrete and non-ductile connection behavior.
Table 9 – Ratio of average test results to ACI 318-08 calculated design values
Configuration SDC A or B, un-cracked
SDC A or B, cracked
SDC C-F, un-cracked, ductile
connection
SDC C-F, cracked, ductile
connection
SDC C-F, un-cracked, non-
ductile connection
SDC C-F, cracked, non-
ductile connection
Full-scale shear wall (2 bolts)
1
4.52 6.3
2 5.7
3 7.9
3 11.3
3 15.8
3
Single bolt – Un-cracked
concrete 3.6
2 3.8
3 7.6
3
Single bolt – Pre-cracked
concrete 4.7
2 4.9
3 9.8
3
Multiple bolt system –
Un-cracked (3 bolts)
1
3.23 6.3
3
Multiple bolt system –
Pre-cracked (3 bolts)
1
4.73 9.5
3
1. Peak loads were adjusted to a per bolt basis 2. Ratio between design value and average peak strength from monotonic testing 3. Ratio between design value and average peak strength from cyclic testing
Table 10 – Ratio of test results to NDS-2005 calculated design values
Configuration Ratio of Allowable ZIIDesign
to test results
Full-scale shear wall (2 bolts)1,2
6.8 – 8.9
Single bolt – Un-cracked concrete 6.0 – 6.5
Single bolt – Pre-cracked concrete 4.7 – 5.1
Multiple bolt system (3 bolts)1 4.3 – 4.6
1. Peak loads were adjusted to a per bolt basis 2. Some friction effects present due to overturning

Sole Plate Anchorage to Concrete
March 2010 29
Figures 29 and 30 provide a comparison of ACI 318-08 design values with and without penalties for cracked concrete and ductile performance to average envelope curves from single anchor cyclic tests of un-cracked and cracked concrete, respectively. Figures 31 and 32 provide a comparison of NDS-2005 design values to average envelope curves from single anchor cyclic tests of uncracked and cracked concrete, respectively. The average peak load of the full-scale shear walls on a per bolt basis is also given for comparison. This per bolt performance was calculated by dividing the peak load resisted in the wall by the number of anchors and includes some contribution from friction effects due to overturning at the compression toe of the wall. (These friction effects due to overturning will also be present in actual construction.)
0
1,000
2,000
3,000
4,000
5,000
6,000
7,000
8,000
9,000
10,000
0 0.5 1 1.5 2 2.5 3
Lo
ad
(lb
)
Displacement (in)
Average Envelope Curves (Config. 2, Un-cracked, Cyclic)
ACI 318-08 Design Value
(SDC A-B, un-crckd, ductile)
ACI 318-08 Design Value(SDC C-F, un-crckd, non-ductile)
5th Percentile
Peak Test Value x Φ
5th Percentile
Peak Test Value
Avg. Peak Load per Bolt
Full -Scale Shear Walls
(Cyclic)
Figure 29 – Comparison of ACI 318-08 design values to un-cracked cyclic test results

Sole Plate Anchorage to Concrete
30 March 2010
0
1,000
2,000
3,000
4,000
5,000
6,000
7,000
8,000
9,000
10,000
0 0.5 1 1.5 2 2.5 3
Lo
ad
(lb
)
Displacement (in)
Average Envelope Curves (Config. 2, Cracked, Cyclic)
Avg. Peak Load per BoltFull -Scale Shear Walls(Cyclic)
5th Percentile
Peak Test Value
5th PercentilePeak Test Value x Φ
ACI 318-08 Design Value(SDC A-B, crckd, ductile)
ACI 318-08 Design Value(SDC C-F, crckd, non-ductile)
Figure 30 – Comparison of ACI 318-08 design values to cracked cyclic test results

Sole Plate Anchorage to Concrete
March 2010 31
0
1,000
2,000
3,000
4,000
5,000
6,000
7,000
8,000
9,000
10,000
0 0.5 1 1.5 2 2.5 3
Lo
ad
(lb
)
Displacement (in)
Average Envelope Curves (Config. 2, Un-cracked, Cyclic)
NDS-2005 Allowable
Design Value (ASD)
Avg. Peak Load per BoltFull -Scale Shear Walls
(Cyclic)
Figure 31 – Comparison of NDS-2005 allowable design values to un-cracked cyclic test results

Sole Plate Anchorage to Concrete
32 March 2010
0
1,000
2,000
3,000
4,000
5,000
6,000
7,000
8,000
9,000
10,000
0 0.5 1 1.5 2 2.5 3
Lo
ad
(lb
)
Displacement (in)
Average Envelope Curves (Config. 2, Cracked, Cyclic)
Avg. Peak Load per BoltFull -Scale Shear Walls
(Cyclic)
NDS-2005 Allowable Design Value (ASD)
Figure 32 – Comparison of NDS-2005 allowable design values to cracked cyclic test results

Sole Plate Anchorage to Concrete
March 2010 33
SUMMARY AND CONCLUSIONS This testing program was designed to evaluate the performance of cast-in-place foundation anchor bolt connections representative of residential construction. Results of this study provide information toward understanding the representative failure modes, response variability and applicable safety margins of these connections. Below is a summary of the conclusions:
Monotonic Tests of Individual Anchor Bolts
1) The tested capacity of 1/2-inch diameter anchor bolts with round cut washers and 2x4 sole plate averaged about 5,100 lb. For specimens with round cut washers, the primary failure mode was splitting of the wood plate. Some spalling of concrete was also observed in two of four specimens tested, but was not the limiting factor for the specimens’ capacity. Visual observation of the bolt failures suggests that the primary response for bolts with round cut washers was Mode IIIs based on the NDS design nomenclature.
2) Testing of 2x6 sole plates with plate washers resulted in an average bolt capacity of 9,100 lb, limited by the splitting of the sole plate. Therefore, for 2x6 construction, the edge distance of 2.75 inches is sufficient to prevent spalling of concrete and the capacity of the anchor bolt is not limited by the concrete cone failure.
3) The use of plate washers forced the connection to develop a Mode IV yield response – an S-shaped bolt with two hinges.
4) The tested capacity of 1/2-inch diameter bolts in 2x4 sole plates with plate washers in un-cracked concrete averaged about 7,100 lb.
5) A crack at the location of the bolt resulted in a reduction in capacity of about 8 percent for a single bolt. (Note: see conclusions on tests of multiple bolts with regard to load sharing between cracked and un-cracked bolts).
Cyclic Tests of Individual Anchor Bolts 6) Cyclic testing of 2x6 sole plates with plate washers resulted in an average bolt capacity of
5,972 lb. Similar to the monotonic testing of 2x6 sole plates, the primary failure mode degradation of the sole plate, followed by tensile failure of the anchor bolt.
7) The tested capacity of 1/2-inch bolts under cyclic loading averaged about 5,550 lb in un-cracked and 5,160 in cracked concrete, about a 20 percent reduction compared to monotonic tests. (However, it should be noted that the magnitude of the reduction is in part due to the definition of peak load in ASTM E 2126 that averages the peaks in the positive and negative directions. The behavior of the anchors is such that the peak in one direction is always about 1,000 lb higher than in the opposite direction due to (1) cumulative damage and (2) slack in the system.)
8) The coefficient of variation (COV) for both sets of cyclic tests with single anchor bolts was 0.13, indicating a 5% precision at a 75% confidence interval.
9) Similar to monotonic tests, the reduction due to cracked concrete was about 7 percent under cyclic loading. (Note: see conclusions on tests of multiple bolts with regard to load sharing between cracked and un-cracked bolts).
10) The deformation capacity of cyclically-tested specimens was comparable to those tested monotonically.

Sole Plate Anchorage to Concrete
34 March 2010
Cyclic Tests of Multiple Anchor Bolts (3 bolts in a row)
11) The per-bolt tested capacity of ½-inch diameter bolts under cyclic loading averaged about 4,600 lb in un-cracked configuration and 4,980 lb with a crack at the center bolt, a 17 percent and a 10 percent reduction based on single bolt testing, respectively. Therefore, these results suggest a modest multiple bolt effect.
12) There was a slight increase (about 8 percent) in capacity in configurations with a crack at the center bolt, suggesting that cracking at an individual bolt does not have a negative effect on capacity due to load sharing between the bolts.
Tests of Anchor Bolts in Full-Size Shear Walls
13) For all walls the capacity of anchor bolts was substantially higher (30 percent or more) compared to the results of individual tests. This level of increase suggests a significant contribution of friction at the compression posts of braced wall panels or shear wall segments.
14) The tested capacity of 1/2-inch diameter anchor bolts with round cut washers under monotonic loading averaged about 7,880 lb, compared to 5,100 lb based on individual bolt tests.
15) The tested capacity of 1/2-inch diameter bolts with plate washers under monotonic loading averaged about 9,730 lb, compared to 7,100 lb based on individual bolts.
16) The tested capacity of 1/2-inch diameter bolts with plate washers under cyclic loading averaged 8,290 lb, compared to 5,550 lb based on individual tests.
General
17) The ultimate failure behavior for all tests of 1/2-inch diameter bolts with 2x4 sole plates included spalling of concrete, bending of the bolt, and crushing (and in some cases splitting) of the wood sole plate.
18) Because of the bending of the bolt and the crushing of the wood, the connection demonstrated significant displacement capacity (i.e., ductile behavior) under both monotonic and cyclic loading.
19) The overall ductile performance of the connection made it relatively tolerant to the effects of minor cracking.
20) Comparison to the ACI-318 design values suggests that the penalties for cracked concrete and non-ductile behavior are overly conservative.

Sole Plate Anchorage to Concrete
March 2010 35
REFERENCES [1] American Concrete Institute. 2008. ACI 318-08 Building Codes Requirements for Structural Concrete (ACI 318-08) and Commentary. ACI. Farmington Hills, MI. [2] J. H. Crandell. 2008. State-of-the-Art Review of Concrete Anchorage Design for Light-Frame Construction Applications. ARES Consulting. West River, MD. [3] W.A. Fennell, et al. 2009. Report on laboratory testing of anchor bolts connecting wood sill plates to concrete with minimum edge distances. Structural Engineers Association of California (SEAOC) Seismology Committee. Sacremento, CA. [4] M.S. Hoehler & R. Eligehausen. 2008. Behavior of Anchors in Cracked Concrete under Tension Cycling at Near-Ultimate Loads. ACI Structural Journal. Farmington Hills, MI. [5] ASTM International. 2005. ASTM E 72-05 Standard Test Methods for Conducting Strength Tests of Panels for Building Construction. ASTM International. West Conshohocken, PA. [6] ASTM International. 2008. ASTM C 31 – 08 Standard Practice for Making and Curing Concrete Test Specimens in the Field. ASTM International. West Conshohocken, PA. [7] R. Eligehausen, et al. 2004. Testing Anchors in Cracked Concrete – Guidance for testing laboratories: how to generate cracks. Concrete International. [8] ASTM International. 2007. ASTM F 1554-07 Standard Specification for Anchor Bolts, Steel, 36, 55 and 105-ksi Yield Strength. ASTM International. West Conshohocken, PA. [9] ASTM International. 1996. ASTM E 488-96 Standard Test Methods for Strengths of Anchors in Concrete and Masonry Elements. ASTM International. West Conshohocken, PA. [10] ASTM International. 2008. ASTM E 2126-08 Standard Test Methods for Cyclic (Reversed) Load Test for Shear Resistance of Vertical Elements of the Lateral Force Resisting Systems for Buildings. ASTM International. West Conshohocken, PA. [11] Department of Civil and Environmental Engineering Stanford University. 2002. CUREE Publication NO. W-02 Development of a Testing Protocol for Woodframe Structures. CUREE. Richmond, CA. [12] American Forest and Paper Association. 2005. AF&PA NDS-2005 National Design Specification for Wood Construction. AF&PA. Washington, DC.

Sole Plate Anchorage to Concrete
36 March 2010
APPENDIX A – Load vs. deflection relationships
Table A1 – Load-deflection curves of Configuration 2 monotonic tests of 2x4 with round cut washer

Sole Plate Anchorage to Concrete
March 2010 37
Table A2 – Load-deflection curves of Configuration 2 monotonic tests of 2x6 with plate washer
Table A3 – Load-deflection curves of Configuration 2 monotonic tests of 2x4 with plate washer & un-cracked concrete

Sole Plate Anchorage to Concrete
38 March 2010
Table A4 – Load-deflection curves of Configuration 2 monotonic tests of 2x4 with plate washer & cracked concrete
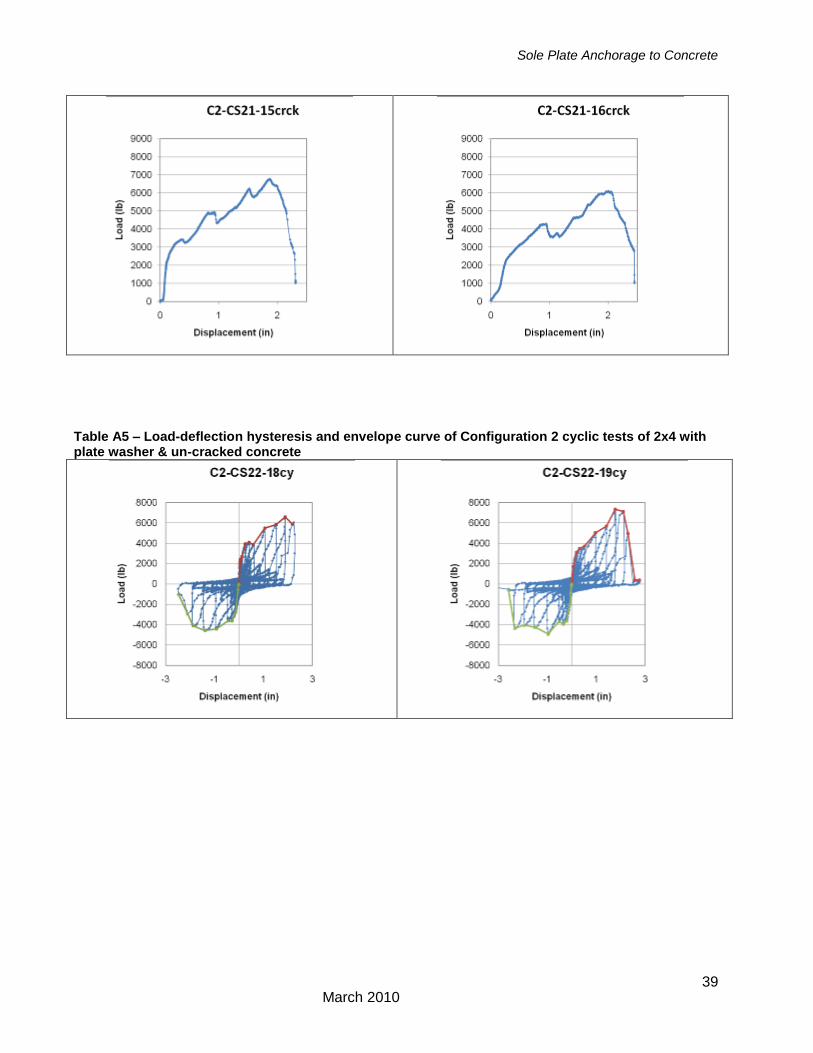
Sole Plate Anchorage to Concrete
March 2010 39
Table A5 – Load-deflection hysteresis and envelope curve of Configuration 2 cyclic tests of 2x4 with plate washer & un-cracked concrete

Sole Plate Anchorage to Concrete
40 March 2010

Sole Plate Anchorage to Concrete
March 2010 41

Sole Plate Anchorage to Concrete
42 March 2010
Table A6 – Load-deflection hysteresis and envelope curve of Configuration 2 cyclic tests of 2x4 with plate washer & cracked concrete

Sole Plate Anchorage to Concrete
March 2010 43

Sole Plate Anchorage to Concrete
44 March 2010

Sole Plate Anchorage to Concrete
March 2010 45
Table A7 – Load-deflection hysteresis and envelope curve of Configuration 3 cyclic tests of 2x4 with plate washer & un-cracked concrete at center bolt

Sole Plate Anchorage to Concrete
46 March 2010
Table A8 – Load-deflection hysteresis and envelope curve of Configuration 3 cyclic tests of 2x4 with plate washer & cracked concrete at center bolt

Sole Plate Anchorage to Concrete
March 2010 47
Table A9 – Load-deflection curves of Configuration 1 monotonic tests of full-scale shear walls
Table A10 – Load-deflection hysteresis and envelop curve of Configuration 1 cyclic tests of full-scale shear wall

Sole Plate Anchorage to Concrete
48 March 2010
APPENDIX B – Example concrete design strength calculation Nominal shear strength perpendicular to the edge: Vcb = (Avc / Avco) ψED,v ψC,v ψh,v Vb [Section D.6.2.1] Where: Avco = 4.5(v)
2
Where: Ca1 = concrete edge distance = 1.75” = 4.5 (1.75”)
2
= 13.781 in2
Avc = Avco with 12” deep specimen
ψC,v = 1.4 (un-cracked concrete)
= 1.0 (cracked concrete)
ψh,v = 1.0 when ha > 1.5Ca1 [Section D.6.2.8] Where: ha = depth of specimen
Vb = 5.1
1
2.0
)('7 aca
a
e Cfdd
l
Where:
da = dia. of bolt Lc = lesser hcf or 8dA
= 8(0.5”) = 4.0” γ = 1.0 normal weight concrete F’c = strength of concrete = 3,200 psi Ca1 = 1.75”
Vb = 5.1
2.0
)"75.1(200,30.1"5."5.0
"47 psi
=982lb
Nominal shear strength parallel to the edge: VcbII = 2x Vcbperp [Section D.6.2.1 (c)] with ψED,v = 1.0 VcbII (un-cracked concrete) = (13.781 in
2 / 13.781 in
2)(1.0)(1.4)(1.0)(982
lb)(x2)
= 2,750lb
VcbII (cracked concrete) = (13.781 in
2 / 13.781 in
2)(1.0)(1.0)(1.0)(982
lb)(x2)
= 1,964lb
Design strength parallel to the edge:
ΦVn = ΦVcb

Sole Plate Anchorage to Concrete
March 2010 49
Where: Φ = 0.7 [Section D.4.4 (c)] ΦVn (un-cracked concrete) = 0.7(2,750
lb)
=1,925lb
ΦVn (cracked concrete) = 0.7(1,964
lb)
=1,375lb
When designing for Seismic Design Category C,D,E or F per Section D.3.3.3: 0.75 ΦVn Un-cracked concrete
= 0.75(1,925lb)
= 1,443lb
Cracked concrete = 0.75(1,375
lb)
= 1,031lb
If non-ductile behavior is assumed per Section D.3.3.6: 0.5(0.75 ΦVn) Un-cracked concrete = 0.5(1,443
lb)
= 721lb
Cracked concrete = 0.5(1,031
lb)
= 516lb

Sole Plate Anchorage to Concrete
50 March 2010
APPENDIX C – Concrete cylinder strengths
Test Cylinder Number
Cylinder label
Date Tested Failure Type
Compressive Strength (psi)
Notes:
1 28-1 8/4/2009 5 1,836 7 day test
2 28-10 8/12/2009 5 1,957 7 day test
3 28-2 8/24/2009 5 2,914 28 day test
4 28-3 8/24/2009 5 2,629 28 day test
5 28-4 8/24/2009 3 2,781 28 day test
6 28-11 9/3/2009 5 3,250
7 28-12 9/3/2009 5 3,126
8 28-13 9/3/2009 5 3,218
9 CS1 9/15/2009 5 3,571
10 CS16 9/21/2009 5 3,386
11 CS20 9/23/2009 5 3,248
12 CS22 9/25/2009 5 2,973
13 CS21 9/25/2009 5 2,973
14 CS27 10/8/2009 5 3,679
15 CS34 10/14/2009 5 3,567
16 CS29 10/14/2009 5 3,194
17 CS10 10/27/2009 5 3,499
18 CS7 10/27/2009 5 3,221
19 CS7 10/27/2009 5 3,223
20 CS11 11/6/2009 5 3,425
21 CS12 11/6/2009 5 3,651
22 CS13 11/6/2009 5 3,532
23 CS14 11/6/2009 5 3,474
24 CS1 11/6/2009 5 3,089
25 CS9 11/6/2009 5 3,164
26 CS8 11/6/2009 5 3,520
27 CS9 11/6/2009 5 3,608
28 CS2 11/17/2009 5 3,629
29 CS3 12/15/2009 5 3,510
30 CS5 12/18/2009 5 3,486
Average concrete strength = 3,305

Sole Plate Anchorage to Concrete
March 2010 51
APPENDIX D – Summary of test results
Test Name Test Description Peak Load (lb)
Max Load (+)
(lb)
Max Load (-)
(lb)
Edge Dist (in)
SG of plate
Failure Mode
C2-CS16-1 1/2" / 2x4; mono; un-cracked; cut washer
5,099 1.75 0.56 Plate Split
C2-CS16-2 1/2" / 2x4; mono; un-cracked; cut washer
5,070 1.813 0.56 Plate Split
C2-CS17-9 1/2" / 2x4; mono; un-cracked; cut washer
5,421 1.75 0.57 Plate Split (Small spall visually observed at about 5500lb, then plate split)
C2-CS15-10 1/2" / 2x4; mono; un-cracked; cut washer
4,923 1.75 0.57 Plate Split (Small spall visually observed at about 4500lb, then plate split)
Avg. 5,128 Std Dev 210 COV 0.04
C2-CS16-3 1/2" / 2x4; mono; un-cracked; plate washer
6,972 1.813 0.56 Concrete Spall
C2-CS16-4 1/2" / 2x4; mono; un-cracked; plate washer
8,233 1.813 0.56 Concrete Spall
C2-CS16-5 1/2" / 2x4; mono; un-cracked; plate washer
7,618 1.875 0.56 Concrete Spall (Small spall visually observed at about 5000lb)
C2-CS17-6 1/2" / 2x4; mono; un-cracked; plate washer
6,592 1.875 0.57 Tension failure of Bolt (Small spall visually observed at about 5500lb)
C2-CS17-7 1/2" / 2x4; mono; un-cracked; plate washer
6,885 1.875 0.57 Concrete Spall
C2-CS17-8 1/2" / 2x4; mono; un-cracked; plate washer
6,182 1.688 0.57 Concrete Spall
Avg. 7,080 Std Dev 737 COV 0.10
C2-CS34-51 1/2" / 2x6; mono; un-cracked; plate washer
9,404 2.75 0.55 Plate Split
C2-CS34-52 1/2" / 2x6; mono; un-cracked; plate washer
8,965 2.875 0.55 Plate Split
Avg. 9,184 Std Dev 310 COV 0.03
C2-CS20-11crck 1/2" / 2x4; mono;
cracked; plate washer 5,304 1.81 0.53
Concrete Spall (Small spall visually observed at about 3000lb on tension side of crack only, final large spall was both sides of initial crack)

Sole Plate Anchorage to Concrete
52 March 2010
C2-CS20-12crck 1/2" / 2x4; mono;
cracked; plate washer 6,241 1.75 0.53
Concrete Spall (Small spall visually observed at about 3500lb, 2nd spall at 4200lb, final large spall at failure)
C2-CS20-13crck 1/2" / 2x4; mono;
cracked; plate washer 7,765 1.75 0.53 Tension failure of Bolt (Small spall visually observed at 4000lb)
C2-CS20-14crck 1/2" / 2x4; mono;
cracked; plate washer 6,943 1.75 0.53 Concrete Spall (Small spall visually observed at about 5000lb)
C2-CS21-15crck 1/2" / 2x4; mono;
cracked; plate washer 6,767 1.75 0.53
Concrete Spall (Small spall visually observed at about 3500lb, 2nd spall at 5000lb, final large spall at failure)
C2-CS21-16crck 1/2" / 2x4; mono;
cracked; plate washer 6,094 1.75 0.50 Concrete Spall (Small spall visually observed at about 4500lb)
Avg. 6,519 Std Dev 840 COV 0.13
C2-CS34-51 1/2" / 2x6; mono; un-cracked; plate washer
9,404 2.75 0.55 Plate Split
C2-CS34-52 1/2" / 2x6; mono; un-cracked; plate washer
8,965 2.875 0.55 Plate Split
Avg. 9,184 Std Dev 310 COV 0.03
C2-CS22-18cy 1/2" / 2x4; cyclic; un-cracked; plate washer
5,577 6,583 -4,572 1.75 0.50 Concrete Spall, Plate Degredation, then Tension Failure of Bolt
C2-CS22-19cy 1/2" / 2x4; cyclic; un-cracked; plate washer
6,148 7,373 -4,923 1.75 0.50 Concrete Spall, then Tension Failure of Bolt (Small spall visually observed at about 3500lb)
C2-CS22-20cy 1/2" / 2x4; cyclic; un-cracked; plate washer
6,003 7,873 -4,133 1.75 0.58 Concrete Spall (Small spall visually observed at about 3500lb, then entire bolt spalled out at failure)
C2-CS22-21cy 1/2" / 2x4; cyclic; un-cracked; plate washer
5,885 6,729 -5,040 1.75 0.58 Concrete Spall, then Tension Failure of Bolt (Small spall visually observed at about 4000lb)
C2-CS23-23cy 1/2" / 2x4; cyclic; un-cracked; plate washer
5,563 6,905 -4,221 1.75 0.58 Concrete Spall, then Tension Failure of Bolt (Small spall visually observed at about 3500lb)
C2-CS23-25cy 1/2" / 2x4; cyclic; un-cracked; plate washer
5,387 5,207 -5,567 1.75 0.50 Concrete Spall, then Tension Failure of Bolt (Small spall visually observed at about 4500lb)
C2-CS24-26cy 1/2" / 2x4; cyclic; un-cracked; plate washer
5,050 5,119 -4,982 1.75 0.50 Concrete Spall (Small spall visually observed at about 3500lb, then entire bolt spalled out at failure)
C2-CS24-27cy 1/2" / 2x4; cyclic; un-cracked; plate washer
5,358 5,705 -5,011 1.75 0.50 Concrete Spall, then Tension Failure of Bolt (Small spall visually observed at about 4200lb)
C2-CS24-28cy 1/2" / 2x4; cyclic; un-cracked; plate washer
5,841 6,290 -5,392 1.75 0.50 Concrete Spall, then Tension Failure of Bolt abt 1" below concrete surface (Small spall visually observed at about 3500lb)
C2-CS24-29cy 1/2" / 2x4; cyclic; un-cracked; plate washer
4,611 5,265 -3,957 1.875 0.50 Concrete Spall, then Tension Failure of Bolt (Small spall visually observed at about 4500lb)
C2-CS24-30cy 1/2" / 2x4; cyclic; un-cracked; plate washer
5,065 4,504 -5,626 1.75 0.50 Concrete Spall (Small spall visually observed at about 4500lb, then entire bolt spalled out at failure)

Sole Plate Anchorage to Concrete
March 2010 53
C2-CS24-31cy 1/2" / 2x4; cyclic; un-cracked; plate washer
7,261 8,048 -6,475 1.75 0.53 Concrete Spall, then Tension Failure of Bolt (Small spall visually observed at about 4500lb)
C2-CS24-32cy 1/2" / 2x4; cyclic; un-cracked; plate washer
5,577 6,436 -4,718 1.75 0.53 Concrete Spall (Small spall visually observed at about 4200lb, then entire bolt spalled out at failure)
C2-CS24-33cy 1/2" / 2x4; cyclic; un-cracked; plate washer
6,368 6,407 -6,328 1.75 0.50 Plate Failured (Small spall visually observed at about 4900lb)
C2-CS14-49cy 1/2" / 2x4; cyclic; un-cracked; plate washer
4,333 5,207 -3,460 1.75 0.47 Concrete Spall & Plate Split (Small spall visually observed at about 3500lb)
C2-CS14-50cy 1/2" / 2x4; cyclic; un-cracked; plate washer
4,933 5,558 -4,309 1.75 0.47 Concrete Spall, Plate Split, then Tension Failure of Bolt (Small spall visually observed at about 3800lb)
Avg. 5,560
Std Dev 714
COV 0.13
C2-CS26-34crk cy 1/2" / 2x4; cyclic;
cracked; plate washer 6,251 6,846 -5,655 1.8125 0.52
Concrete Spall, then Tension Failure of Bolt (Small spall visually observed at about 4100lb)
C2-CS26-35crk cy 1/2" / 2x4; cyclic;
cracked; plate washer 6,148 6,378 -5,919 1.75 0.52
Concrete Spall, then Tension Failure of Bolt (Small spall visually observed at about 4000lb)
C2-CS26-36crk cy 1/2" / 2x4; cyclic;
cracked; plate washer 5,124 6,671 -3,577 1.75 0.52
Concrete Spall, then Tension Failure of Bolt (Small spall visually observed at about 3500lb)
C2-CS26-37crk cy 1/2" / 2x4; cyclic;
cracked; plate washer 4,026 3,977 -4,074 1.75 0.54
Concrete Spall, then Tension Failure of Bolt (Small spall visually observed at about 3500lb)
C2-CS27-38crk cy 1/2" / 2x4; cyclic;
cracked; plate washer 4,480 4,826 -4,133 1.8750 0.54
Concrete Spall, then Tension Failure of Bolt (Small spall visually observed at about 3500lb)
C2-CS27-39crk cy 1/2" / 2x4; cyclic;
cracked; plate washer 5,694 5,646 -5,743 1.75 0.54
Concrete Spall, then Tension Failure of Bolt (Small spall visually observed at about 3700lb)
C2-CS27-40crk cy 1/2" / 2x4; cyclic;
cracked; plate washer 4,450 4,417 -4,484 1.8125 0.54
Concrete Spall, then Tension Failure of Bolt (Small spall visually observed at about 3500lb)
C2-CS27-41crk cy 1/2" / 2x4; cyclic;
cracked; plate washer 5,036 5,470 -4,601 1.75 0.49
Concrete Spall, then Tension Failure of Bolt (Small spall visually observed at about 5000lb, 1 cycle more than usual)
C2-CS28-42crk cy 1/2" / 2x4; cyclic;
cracked; plate washer 5,182 5,353 -5,011 1.75 0.49
Concrete Spall, then Tension Failure of Bolt (Small spall visually observed at about 3700lb)
C2-CS28-43crk cy 1/2" / 2x4; cyclic;
cracked; plate washer 5,651 5,558 -5,743 1.75 0.49
Concrete Spall, then Tension Failure of Bolt (Small spall visually observed at about 4100lb)
C2-CS28-44crk cy 1/2" / 2x4; cyclic;
cracked; plate washer 5,826 6,583 -5,070 1.75 0.49
Concrete Spall, then Tension Failure of Bolt (Small spall visually observed at about 4100lb)
C2-CS28-45crk cy 1/2" / 2x4; cyclic;
cracked; plate washer 5,607 5,734 -5,479 1.75 0.49
Concrete Spall, then Tension Failure of Bolt (Small spall visually observed at about 4000lb)
C2-CS29-46crk cy 1/2" / 2x4; cyclic;
cracked; plate washer 5,124 5,734 -4,513 1.75 0.49
Concrete Spall, then Tension Failure of Bolt (Small spall visually observed at about 3400lb)
C2-CS29-47crk cy 1/2" / 2x4; cyclic;
cracked; plate washer 4,450 5,822 -3,079 1.8750 0.48
Concrete Spall (Small spall visually observed at about 4500lb, then entire bolt spalled out at failure)
C2-CS29-48crk cy 1/2" / 2x4; cyclic;
cracked; plate washer 4,289 4,739 -3,840 1.75 0.48
Concrete Spall, then Tension Failure of Bolt (Small spall visually observed at about 3200lb)

Sole Plate Anchorage to Concrete
54 March 2010
C2-CS30-58crk cy 1/2" / 2x4; cyclic;
cracked; plate washer 5,182 6,319 -4,045 1.81 0.55
Concrete Spall, then Tension Failure of Bolt (Small spall visually observed at about 5500lb)
Avg. 5,157 Std Dev 677 COV 0.13
C2-CS34-53cy 1/2" / 2x6; cyclic; un-cracked; plate washer
5,709 6,026 -5,391 2.875 0.55 Tension Failure of Bolt (No visible spalling)
C2-CS34-54cy 1/2" / 2x6; cyclic; un-cracked; plate washer
6,236 5,880 -6,591 2.75 0.54 Tension Failure of Bolt (No visible spalling)
Avg. 5,972
Std Dev 372
COV 0.06
C3-CS6-56cy (3) 1/2" / 2x4; cyclic;
plate washer 13,733 15,310 -12,155
1.75 / 1.625 / 1.625
0.52 Concrete Spall at #2, then #1, then #3 (Small spall visually observed at about 11000lb for #1, #2 & #3, then complete spall of #1)
C3-CS7-57cy (3) 1/2" / 2x4; cyclic;
plate washer 13,658 15,103 -12,214
1.75 / 1.75 / 1.75
0.53 Concrete Spall at #1, #2, & #3 , then Tension Failure of #1  (Small spall visually observed at about 10800lb for #1, #2 & #3)
C3-CS7-59cy (3) 1/2" / 2x4; cyclic;
plate washer 13,688 15,103 -12,273
1.75 / 1.75 / 1.75
0.54 Concrete Spall at #1, #2, & #3 (Small spall visually observed at about 10500lb for #1, #2 & #3, then large, not complete, spall of #2)
C3-CS8-67cy (3) 1/2" / 2x4; cyclic;
plate washer 12,927 14,459 -11,394
1.875 / 1.8125 / 1.625
0.48 Concrete Spall at #1, #2, & #3 , then Tension Failure of #2, then Tension Failure of #1 & #3 (Small spall visually observed at about 10500lb for #1, #2 & #3)
C3-CS8-68cy (3) 1/2" / 2x4; cyclic;
plate washer 14,406 16,041 -12,770
1.75 / 1.75 / 1.75
0.49 Concrete Spall at #1, #2, & #3 , then Tension Failure of #1  (Small spall visually observed at about 14500lb for #1, #2 & #3, then large spall of #2 before tension failure)
C3-CS9-69cy (3) 1/2" / 2x4; cyclic;
plate washer 14,845 14,605 -15,085
1.75 / 1.8125 / 1.8125
0.56 Concrete Spall at #1, #2, & #3 , then Tension Failure of #1, then Tension Failure of #2 & #3 (Small spall visually observed at about 14250lb for #1, #2 & #3, then large spall of #1 & #3)
Avg. 13,876 Std Dev 667 COV 0.05
C3-CS10-60crk cy (3) 1/2" / 2x4; cyclic;
cntr bolt cracked; plate washer
15,182 16,012 -14,351 1.75 / 1.75 / 1.75
0.53 Concrete Spall at #1, #2, & #3, & Plate Split (Small spall visually observed at about 12500lb for #1, #2 & #3, then complete spall of #2)
C3-CS10-61crk cy (3) 1/2" / 2x4; cyclic;
cntr bolt cracked; plate washer
13,980 14,283 -13,678 1.75 / 1.75 / 1.75
0.48 Concrete Spall at #1, #2, & #3, then Tension Failure of #1, #2 & #3, & Plate Split (Small spall visually observed at about 13800lb for #1, #2 & #3, #1 spall at concrete surface)
C3-CS12-63crk cy (3) 1/2" / 2x4; cyclic;
cntr bolt cracked; plate washer
14,024 14,488 -13,561 1.875 / 1.75 / 1.75
0.48 Concrete Spall at #1, #2, & #3, then Tension Failure of #1, #2 & #3, & Plate Split (Small spall visually observed at about 10100lb for #1, #2 & #3, then large spall of #2 & #3 before tension failure)
C3-CS13-64crk cy (3) 1/2" / 2x4; cyclic;
cntr bolt cracked; plate washer
14,962 15,983 -13,941 1.75 / 1.75 / 1.75
0.51 Concrete Spall at #1, #2, & #3, then Tension Failure of #3, & Plate Split

Sole Plate Anchorage to Concrete
March 2010 55
C3-CS13-65crk cy (3) 1/2" / 2x4; cyclic;
cntr bolt cracked; plate washer
16,953 17,915 -15,992 1.75 / 1.75 / 1.75
0.48 Concrete Spall at #1, #2, & #3, then Tension Failure of #3 (Small spall visually observed at about 12500lb for #1, #2 & #3)
C3-CS11-66crk cy (3) 1/2" / 2x4; cyclic;
cntr bolt cracked; plate washer
14,464 16,041 -12,887 1.75 / 1.75 / 1.75
0.56 Concrete Spall at #1, #2, & #3, then Tension Failure of #1, #2 & #3 (Small spall visually observed at about 11500lb for #1, #2 & #3, then complete spall of #1)
Avg. 14,928
Std Dev 1104
COV 0.07
C1-CS2-70 (2) 1/2" / 2x4; full scale shear wall; cut washer
15,758 1.75 / 1.75
0.58 Plate Split (Small spall visually observed at about 12500lb, then plate split)
C1-CS2-71 (2) 1/2" / 2x4; full scale
shear wall; plate washer 19,534
1.75 / 1.8125
0.50 None – ran out of travel in cylinder
C1-CS2-72 (2) 1/2" / 2x4; full scale
shear wall; plate washer 19,388
1.75 / 1.75
0.48 Concrete Spall, then Tension Failure of Bolt (Small spall visually observed at about 15000lb)
C1-CS2-73cy (2) 1/2" / 2x4; full scale
shear wall; plate washer 18,476 19,408 -17,543
1.8125 / 1.75
0.49 Concrete Spall, then Tension Failure of Bolt (Small spall visually observed at about 16000lb)
C1-CS2-74cy (2) 1/2" / 2x4; full scale
shear wall; plate washer 14,698 14,781 -14,614
1.625 / 1.75
0.48 Concrete Spall, then Tension Failure of Bolt (Small spall visually observed at about 14000lb)