evaluation of wavelength selection methods … · evaluation of wavelength selection methods for 2d...
TRANSCRIPT
ISSN 0104-6632 Printed in Brazil
www.abeq.org.br/bjche Vol. 30, No. 02, pp. 289 - 298, April - June, 2013
*To whom correspondence should be addressed
This is an extended version of the manuscript presented at the SINAFERM 2011 - 18nt National Symposium on Bioprocesses 2011, Caxias do Sul, Brazil
Brazilian Journal of Chemical Engineering
EVALUATION OF WAVELENGTH SELECTION METHODS FOR 2D FLUORESCENCE SPECTRA
APPLIED TO BIOPROCESSES CHARACTERIZATION
S. S. Masiero*, J. O. Trierweiler*, M. Farenzena, M. Escobar,
L. F. Trierweiler and C. Ranzan
Grupo de Intensificação Modelagem Simulação Controle e Otimização de Processos, (GIMSCOP), Departamento de Engenharia Química, Universidade Federal do Rio Grande do Sul,
Phone: + (55) (51) 3308 3444/3308 4072, Fax: + (55) (51) 3308 3277, Rua Luiz Englert, s/n, CEP: 90040-040, Porto Alegre - RS, Brasil.
E-mail: {sarasm,jorge}@enq.ufrgs.br
(Submitted: February 28, 2012 ; Revised: September 7, 2012 ; Accepted: October 16, 2012)
Abstract - In biotechnological processes, the productivity and costs depend strongly on the control of the operating conditions. For this reason, sensors that allow the monitoring of variables of interest become quite important. 2D fluorescence spectroscopy is one promising option among those that are being applied for this purpose. In the present work, three methods were evaluated to select the best excitation/emission wavelength pairs of 2D fluorescence spectra to infer product, substrate and cellular concentrations throughout a fermentation using a multiple linear chemometric model: Exhaustive Search (ES), Stepwise Regression and Genetic Algorithm (GA). The Stepwise Regression presented unsatisfying results, while GA always led to good R2 values in short computational times. However, for the proposed problem, the ES showed the best performance, finding the global optimum in a few minutes. Keywords: Fermentation; 2D fluorescence spectroscopy; Wavelength; Variable selection.
INTRODUCTION
Due to the high dependence of biological systems (microorganisms and produced metabolites) on the physical and chemical characteristics of the cultivation medium, bioprocesses can become quite complex (Scheper et al., 1996, Scheper et al., 1999). Therefore, the maintenance of product quality and reduction in production costs of these processes are highly associated with monitoring and controlling the operating conditions. For this purpose, there is still a need for sensor development in order to achieve reliable online monitoring and, consequently, to decrease the time delay between data analysis and
appropriate control actions (Hulhoven, 2006, Surribas et al., 2006).
For classical properties such as temperature, pressure, pH and dissolved oxygen, measurement methods are already well established, enabling their online monitoring. On the other hand, the measure-ment of biological variables such as metabolites, substrate and cellular concentrations demands further improvement (Haack et al., 2004). Several authors have studied different techniques that enable the inference of the variable of interest using chemometric models (Schügerl, 2001; Ferreira et al., 2003; Benoudjita et al., 2004; Becker et al., 2007). Among these, the advantages of 2D fluorescence
290 S. S. Masiero, J. O. Trierweiler, M. Farenzena, M. Escobar, L. F. Trierweiler and C. Ranzan
Brazilian Journal of Chemical Engineering
spectroscopy have been highlighted in many recent studies (Boehl et al., 2003; Hantelmann et al., 2006; Ganzlin et al., 2007; Rhee and Kang, 2007; Ödman et al., 2009; Jain et al., 2011; Bogomolov et al., 2011; Rossi et al., 2012). In this technique, the fluorescence emission of metabolites present in the cultivation medium is monitored when they are excited with UV-Visible radiation in a specific wavelength range. The molecules that emit fluores-cence are called fluorophores. This non-invasive technique can be considered an evolution of the fluorescence sensor that could monitor only the fluorophore NAD(P)H and then would obtain information on cellular metabolism. Once the 2D fluorescence spectroscopy is capable of monitoring all fluorophores, it can yield information not only about cellular metabolism, but also about the cultivation medium (Scheper et al. 1999, Ganzlin et al. 2007).
Since biomass contains a number of natural fluorophores like NAD(P)H, flavins and aromatic amino acids, its concentration can be directly correlated with the trajectories of the fluorescence of these analytes during the cultivation. On the other hand, substrates and products like glucose, ethanol and glycerol do not exhibit any fluorescence. In this case, their concentrations can still be indirectly predicted using the signals of available fluorophores (Rossi et al., 2012). In the literature, there are several examples of successful indirect prediction models based on 2D fluorescence spectroscopy (Skibsted et al., 2001; Solle et al., 2003; Lee et al., 2005; Surribas et al., 2006; Rossi et al., 2012). However, the metabolism of a microorganism can shift during the cultivation as a result of environmental changes, such as sequential uptake of different substrates, availability of oxygen or accumulation of inhibitors. As a consequence, the relation between the predicted variables and the respective analytes can also change. For processes in which these shifts are relevant, a segmented modeling approach applying multiple calibration has been studied (Ödman et al., 2009).
Therefore, the 2D fluorescence spectra, which contain a great amount of information, need to be correlated with the variables of interest through a chemometric model. This task is not trivial because the matrix data has a high degree of collinearity. This linear dependency is a consequence of the fact that the same fluorophore can absorb radiation in a range of excitation wavelengths as well as emit fluores-cence in a range of reemission wavelengths with different intensities. Usually, PCA and PLS techniques
are used in order to convert the spectrum data into prediction models for the desired variables (Solle et al. 2003). A drawback of these techniques is that the whole spectrum is needed to obtain the principal components or latent variables, since each predictor is a linear combination of the spectrum variables. This inconvenient can be overcome when methods for direct selection of variables are employed. Thus, a limited number of excitation/ emission wavelength pairs that can satisfactorily represent the system can be truly selected, enabling the construction of simpler sensors to monitor only those selected wavelength pairs. It makes the large-scale application of 2D fluorescence more feasible.
Regarding the discussion above, the aim of this work is to evaluate three different methods (i.e., Exhaustive Search, Stepwise Regression, and Genetic Algorithm) to select directly those wavelength pairs in order to infer product (ethanol), substrate (glucose) and cellular (biomass) concentrations throughout a fermentation using a multiple linear chemometric model. These results are further compared to those obtained using full-data PLS, which is the conventional technique employed to solve this kind of problem.
MATERIALS AND METHODS Experimental Data
In this work, batch fermentation data, provided by Professor B. Hitzmann of the Institut für Technische Chemie, University of Hannover, and first presented in the work of Solle et al. (2003), were used for evaluating the selection methods. In that experiment, a fermentation with S. cerevisiae H620 using supplemental glucose Schatzmann medium was carried out in a 1.5 L bioreactor at a constant temperature of 30 °C and controlled pH of 5.5. Throughout the batch, 2D fluorescence spectra were recorded every 6 minutes with a BioView®-spectrometer (Delta Light & Optics, Denmark) as described by Stärk et al. (2002). Each spectrum contains 150 excitation/emission wavelength pairs that are the parameters to be selected by the studied methods.
In addition, 10 samples were withdrawn along the fermentation for off-line analysis of the variable of interest (i.e., ethanol, glucose and biomass concen-trations) by high-performance liquid chromatography (HPLC). The measured values of these variables are given in Table 1.
Evaluation of Wavelength Selection Methods for 2D Fluorescence Spectra Applied to Bioprocesses Characterization 291
Brazilian Journal of Chemical Engineering Vol. 30, No. 02, pp. 289 - 298, April - June, 2013
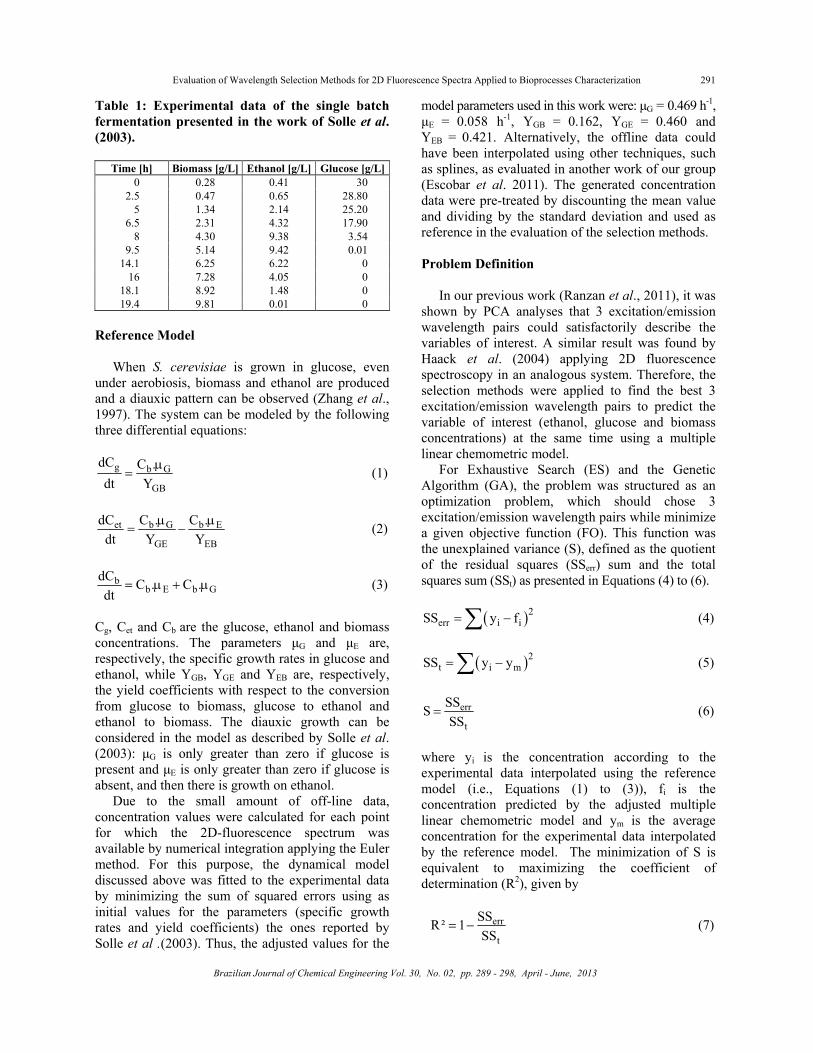
Table 1: Experimental data of the single batch fermentation presented in the work of Solle et al. (2003).
Time [h] Biomass [g/L] Ethanol [g/L] Glucose [g/L]0 0.28 0.41 30
2.5 0.47 0.65 28.80 5 1.34 2.14 25.20
6.5 2.31 4.32 17.90 8 4.30 9.38 3.54
9.5 5.14 9.42 0.01 14.1 6.25 6.22 0
16 7.28 4.05 0 18.1 8.92 1.48 0 19.4 9.81 0.01 0
Reference Model
When S. cerevisiae is grown in glucose, even under aerobiosis, biomass and ethanol are produced and a diauxic pattern can be observed (Zhang et al., 1997). The system can be modeled by the following three differential equations:
g b G
GB
dC C .dt Y
μ= (1)
et b G b E
GE EB
dC C . C .dt Y Y
μ μ= − (2)
b
b E b GdC C . C .dt
= μ + μ (3)
Cg, Cet and Cb are the glucose, ethanol and biomass concentrations. The parameters μG and μE are, respectively, the specific growth rates in glucose and ethanol, while YGB, YGE and YEB are, respectively, the yield coefficients with respect to the conversion from glucose to biomass, glucose to ethanol and ethanol to biomass. The diauxic growth can be considered in the model as described by Solle et al. (2003): μG is only greater than zero if glucose is present and μE is only greater than zero if glucose is absent, and then there is growth on ethanol.
Due to the small amount of off-line data, concentration values were calculated for each point for which the 2D-fluorescence spectrum was available by numerical integration applying the Euler method. For this purpose, the dynamical model discussed above was fitted to the experimental data by minimizing the sum of squared errors using as initial values for the parameters (specific growth rates and yield coefficients) the ones reported by Solle et al .(2003). Thus, the adjusted values for the
model parameters used in this work were: μG = 0.469 h-1, μE = 0.058 h-1, YGB = 0.162, YGE = 0.460 and YEB = 0.421. Alternatively, the offline data could have been interpolated using other techniques, such as splines, as evaluated in another work of our group (Escobar et al. 2011). The generated concentration data were pre-treated by discounting the mean value and dividing by the standard deviation and used as reference in the evaluation of the selection methods. Problem Definition
In our previous work (Ranzan et al., 2011), it was shown by PCA analyses that 3 excitation/emission wavelength pairs could satisfactorily describe the variables of interest. A similar result was found by Haack et al. (2004) applying 2D fluorescence spectroscopy in an analogous system. Therefore, the selection methods were applied to find the best 3 excitation/emission wavelength pairs to predict the variable of interest (ethanol, glucose and biomass concentrations) at the same time using a multiple linear chemometric model.
For Exhaustive Search (ES) and the Genetic Algorithm (GA), the problem was structured as an optimization problem, which should chose 3 excitation/emission wavelength pairs while minimize a given objective function (FO). This function was the unexplained variance (S), defined as the quotient of the residual squares (SSerr) sum and the total squares sum (SSt) as presented in Equations (4) to (6).
( )2err i iSS y f= −∑ (4)
( )2t i mSS y y= −∑ (5)
err
t
SSSSS
= (6)
where yi is the concentration according to the experimental data interpolated using the reference model (i.e., Equations (1) to (3)), fi is the concentration predicted by the adjusted multiple linear chemometric model and ym is the average concentration for the experimental data interpolated by the reference model. The minimization of S is equivalent to maximizing the coefficient of determination (R2), given by
err
t
SSR² 1SS
= − (7)
292 S. S. Masiero, J. O. Trierweiler, M. Farenzena, M. Escobar, L. F. Trierweiler and C. Ranzan
Brazilian Journal of Chemical Engineering
For the Stepwise method, according to the interactive tool for Stepwise Regression of the Statistical toolbox of Matlab used in this work, the criterion was the root-mean-square error (RMSE), which is presented in Equation (8).
( )2i iy fRMSE
n
−= ∑ (8)
n is the number of data points used of the reference model, which coincides with the number of 2D fluorescence spectra recorded.
However, in order to better compare the results, all results are presented in the form of the determination coefficient (R2). Selection Methods
In this work, three selection methods were
evaluated: (i) Exhaustive Search (ES), (ii) Stepwise Regression and (iii) Genetic Algorithm (GA). All methods were run in Matlab® for Windows with a Core2Quad computer.
(i) Exhaustive Search (ES)
The ES was evaluated by a simple algorithm implemented in Matlab®, where all possible combinations of three excitation/emission wavelength pairs were tested. Thus, the achievement of the best three pair combination, meaning the lowest S, is ensured. Because the three models, for ethanol, glucose and biomass concentrations should be evaluated at the same time, the individual S’s were summed in order to have only one function to be minimized. (ii) Stepwise Regression
Stepwise Regression is considered to be an
efficient method for variable selection (Jouan-
Rimbaud et al., 1995b). It proceeds as an automatic sequence of linear regressions, where in each step the best variable according to a specified criterion can be included in the model or the worst can be eliminated (Benoudjita et al., 2004). In the function Stepwise from the Statistical toolbox of Matlab, which was used in this study, the criterion that decides which variable should be included or eliminated from model is the F-Test. Unlike with ES, the three models could not be evaluated at the same time and the number of excitation/emission wavelengths in the model could not be fixed due to the way the method is implemented. Thus, for each variable of interest, the final number of pairs and which pairs were chosen by the method could differ from the others. (iii) Genetic Algorithm (GA)
The GA is a stochastic optimization method in which a new set of possible solutions is evaluated at each step, called a generation. Its randomness remains in the fact that the first set of solutions, called the initial population, is produced randomly and the further generations are produced from the combinations of that initial population (Neumann and Witt 2010).
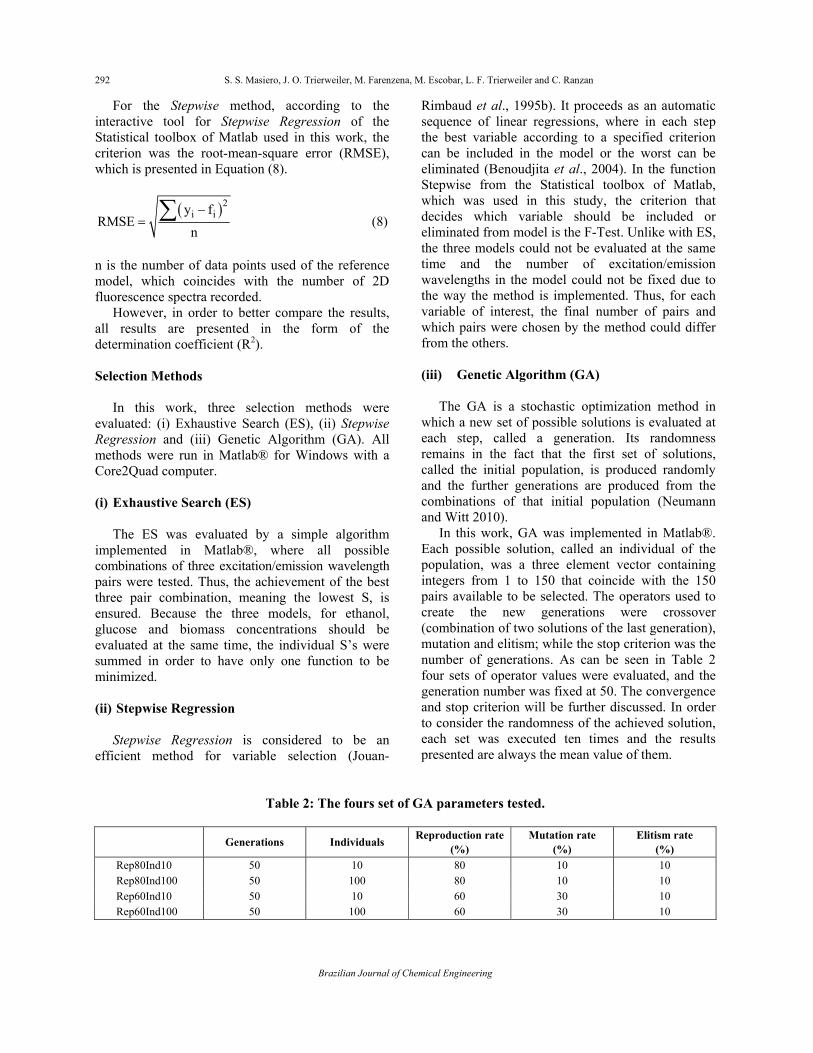
In this work, GA was implemented in Matlab®. Each possible solution, called an individual of the population, was a three element vector containing integers from 1 to 150 that coincide with the 150 pairs available to be selected. The operators used to create the new generations were crossover (combination of two solutions of the last generation), mutation and elitism; while the stop criterion was the number of generations. As can be seen in Table 2 four sets of operator values were evaluated, and the generation number was fixed at 50. The convergence and stop criterion will be further discussed. In order to consider the randomness of the achieved solution, each set was executed ten times and the results presented are always the mean value of them.
Table 2: The fours set of GA parameters tested.
Generations Individuals Reproduction rate (%)
Mutation rate (%)
Elitism rate (%)
Rep80Ind10 50 10 80 10 10 Rep80Ind100 50 100 80 10 10 Rep60Ind10 50 10 60 30 10 Rep60Ind100 50 100 60 30 10
Evaluation of Wavelength Selection Methods for 2D Fluorescence Spectra Applied to Bioprocesses Characterization 293
Brazilian Journal of Chemical Engineering Vol. 30, No. 02, pp. 289 - 298, April - June, 2013
RESULTS AND DISCUSSION
Table 3 presents the summary of the results for the evaluated methods of variable selection. The same table also includes the results of the PLS technique that will be further discussed.
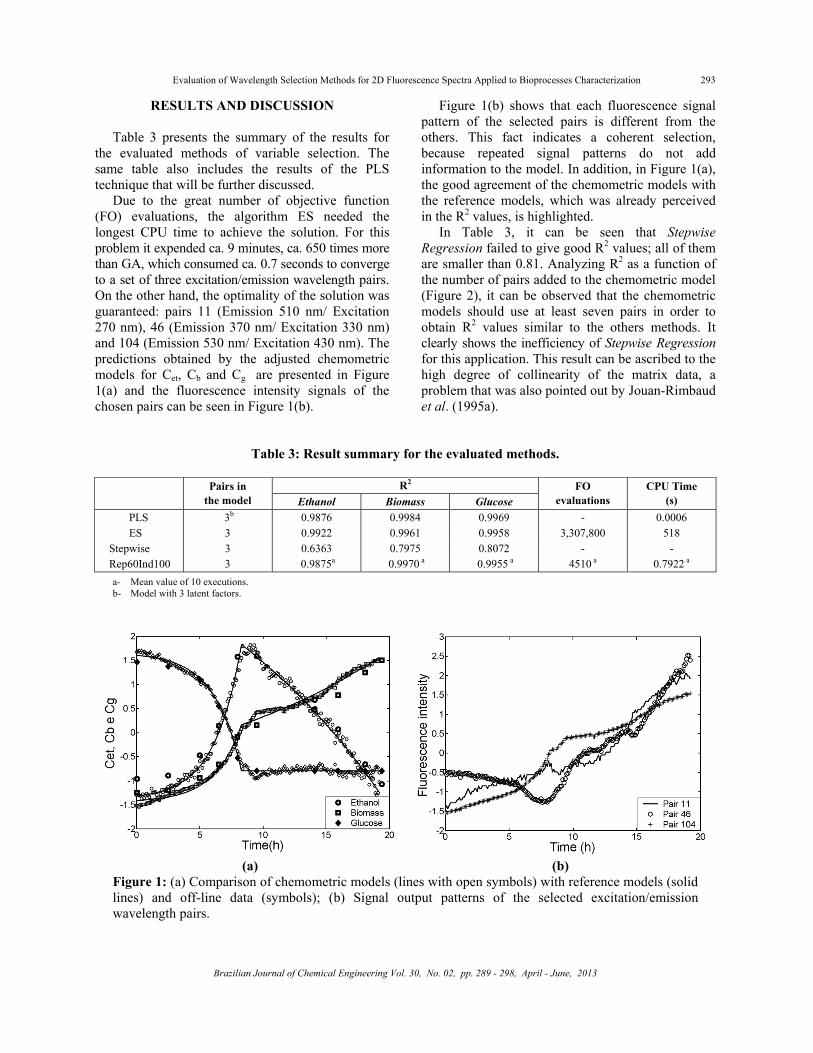
Due to the great number of objective function (FO) evaluations, the algorithm ES needed the longest CPU time to achieve the solution. For this problem it expended ca. 9 minutes, ca. 650 times more than GA, which consumed ca. 0.7 seconds to converge to a set of three excitation/emission wavelength pairs. On the other hand, the optimality of the solution was guaranteed: pairs 11 (Emission 510 nm/ Excitation 270 nm), 46 (Emission 370 nm/ Excitation 330 nm) and 104 (Emission 530 nm/ Excitation 430 nm). The predictions obtained by the adjusted chemometric models for Cet, Cb and Cg are presented in Figure 1(a) and the fluorescence intensity signals of the chosen pairs can be seen in Figure 1(b).
Figure 1(b) shows that each fluorescence signal pattern of the selected pairs is different from the others. This fact indicates a coherent selection, because repeated signal patterns do not add information to the model. In addition, in Figure 1(a), the good agreement of the chemometric models with the reference models, which was already perceived in the R2 values, is highlighted.
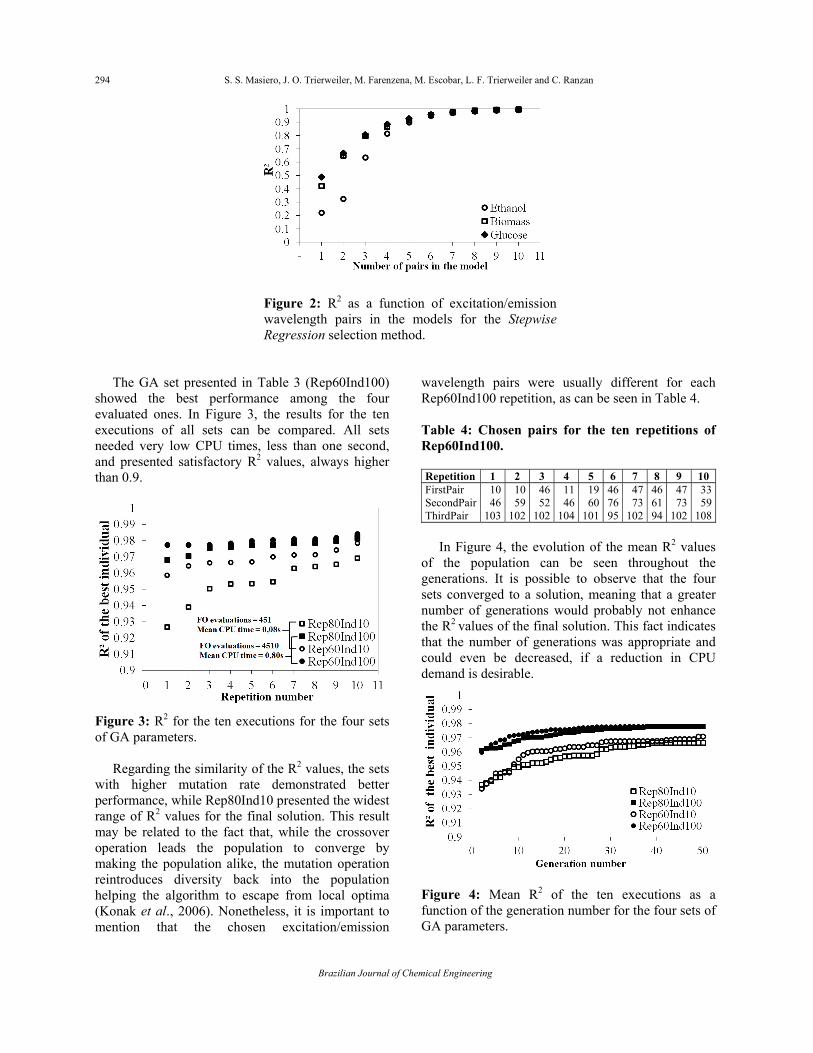
In Table 3, it can be seen that Stepwise Regression failed to give good R2 values; all of them are smaller than 0.81. Analyzing R2 as a function of the number of pairs added to the chemometric model (Figure 2), it can be observed that the chemometric models should use at least seven pairs in order to obtain R2 values similar to the others methods. It clearly shows the inefficiency of Stepwise Regression for this application. This result can be ascribed to the high degree of collinearity of the matrix data, a problem that was also pointed out by Jouan-Rimbaud et al. (1995a).
Table 3: Result summary for the evaluated methods.
R2 Pairs in
the model Ethanol Biomass Glucose FO
evaluations CPU Time
(s) PLS 3b 0.9876 0.9984 0.9969 - 0.0006 ES 3 0.9922 0.9961 0.9958 3,307,800 518
Stepwise 3 0.6363 0.7975 0.8072 - - Rep60Ind100 3 0.9875a 0.9970 a 0.9955 a 4510 a 0.7922 a a- Mean value of 10 executions. b- Model with 3 latent factors.
(a) (b)
Figure 1: (a) Comparison of chemometric models (lines with open symbols) with reference models (solid lines) and off-line data (symbols); (b) Signal output patterns of the selected excitation/emission wavelength pairs.
294 S. S. Masiero, J. O. Trierweiler, M. Farenzena, M. Escobar, L. F. Trierweiler and C. Ranzan
Brazilian Journal of Chemical Engineering
Figure 2: R2 as a function of excitation/emission wavelength pairs in the models for the Stepwise Regression selection method.
The GA set presented in Table 3 (Rep60Ind100) showed the best performance among the four evaluated ones. In Figure 3, the results for the ten executions of all sets can be compared. All sets needed very low CPU times, less than one second, and presented satisfactory R2 values, always higher than 0.9.
Figure 3: R2 for the ten executions for the four sets of GA parameters.
Regarding the similarity of the R2 values, the sets with higher mutation rate demonstrated better performance, while Rep80Ind10 presented the widest range of R2 values for the final solution. This result may be related to the fact that, while the crossover operation leads the population to converge by making the population alike, the mutation operation reintroduces diversity back into the population helping the algorithm to escape from local optima (Konak et al., 2006). Nonetheless, it is important to mention that the chosen excitation/emission
wavelength pairs were usually different for each Rep60Ind100 repetition, as can be seen in Table 4.
Table 4: Chosen pairs for the ten repetitions of Rep60Ind100. Repetition 1 2 3 4 5 6 7 8 9 10 FirstPair 10 10 46 11 19 46 47 46 47 33SecondPair 46 59 52 46 60 76 73 61 73 59ThirdPair 103 102 102 104 101 95 102 94 102 108
In Figure 4, the evolution of the mean R2 values
of the population can be seen throughout the generations. It is possible to observe that the four sets converged to a solution, meaning that a greater number of generations would probably not enhance the R2 values of the final solution. This fact indicates that the number of generations was appropriate and could even be decreased, if a reduction in CPU demand is desirable.
Figure 4: Mean R2 of the ten executions as a function of the generation number for the four sets of GA parameters.
Evaluation of Wavelength Selection Methods for 2D Fluorescence Spectra Applied to Bioprocesses Characterization 295
Brazilian Journal of Chemical Engineering Vol. 30, No. 02, pp. 289 - 298, April - June, 2013
The better CPU performance of GA may not be relevant in the specific case under study, but this result become quite important when problems with more variables or with more complex prediction models need to be solved. Another example, in which low CPU times are necessary, is the calibration method for bioprocess analyzers based on 2D fluorescence spectroscopy proposed by Oliveira et al. (2008). They used only one off-line sample and employed the data of the theoretical model simulation in order to calibrate the chemometric model. At the same time, the results of the chemometric and theoretical model were periodically compared to calibrate the parameters of the theoretical model. This procedure continued in a cycle throughout the cultivation. According to their results, the new method presented better prediction than the usual method using a great amount of off-line analyses for calibration.
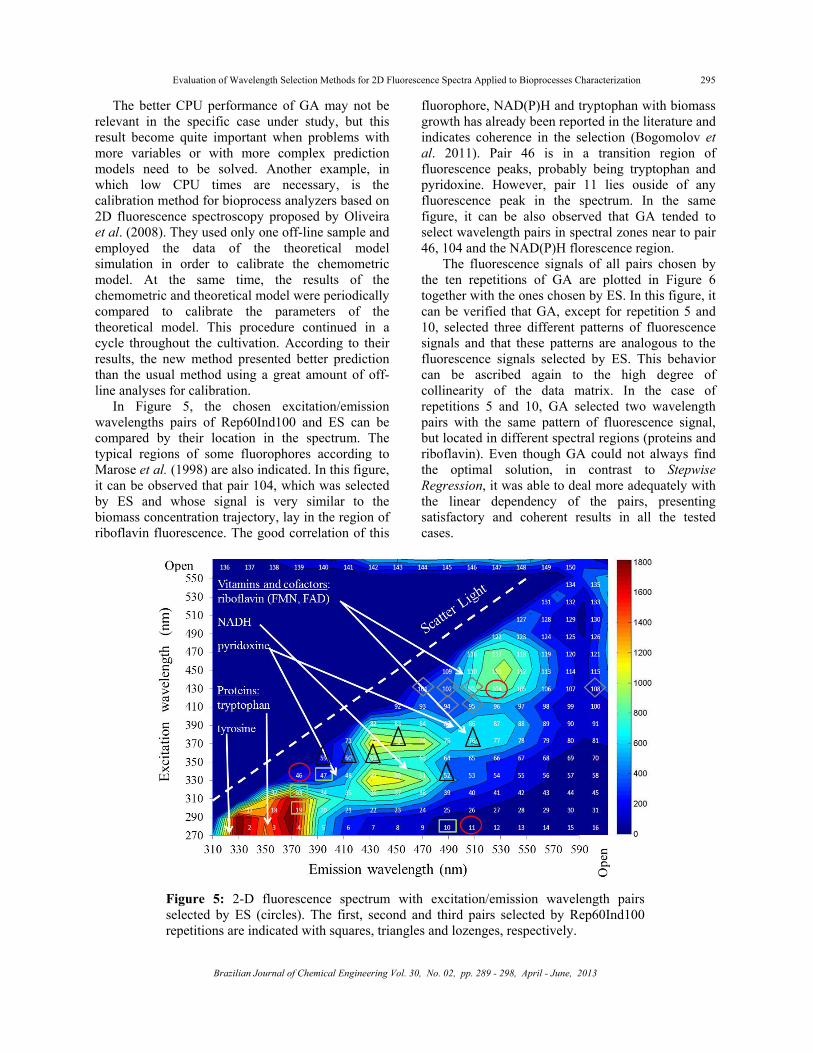
In Figure 5, the chosen excitation/emission wavelengths pairs of Rep60Ind100 and ES can be compared by their location in the spectrum. The typical regions of some fluorophores according to Marose et al. (1998) are also indicated. In this figure, it can be observed that pair 104, which was selected by ES and whose signal is very similar to the biomass concentration trajectory, lay in the region of riboflavin fluorescence. The good correlation of this
fluorophore, NAD(P)H and tryptophan with biomass growth has already been reported in the literature and indicates coherence in the selection (Bogomolov et al. 2011). Pair 46 is in a transition region of fluorescence peaks, probably being tryptophan and pyridoxine. However, pair 11 lies ouside of any fluorescence peak in the spectrum. In the same figure, it can be also observed that GA tended to select wavelength pairs in spectral zones near to pair 46, 104 and the NAD(P)H florescence region.
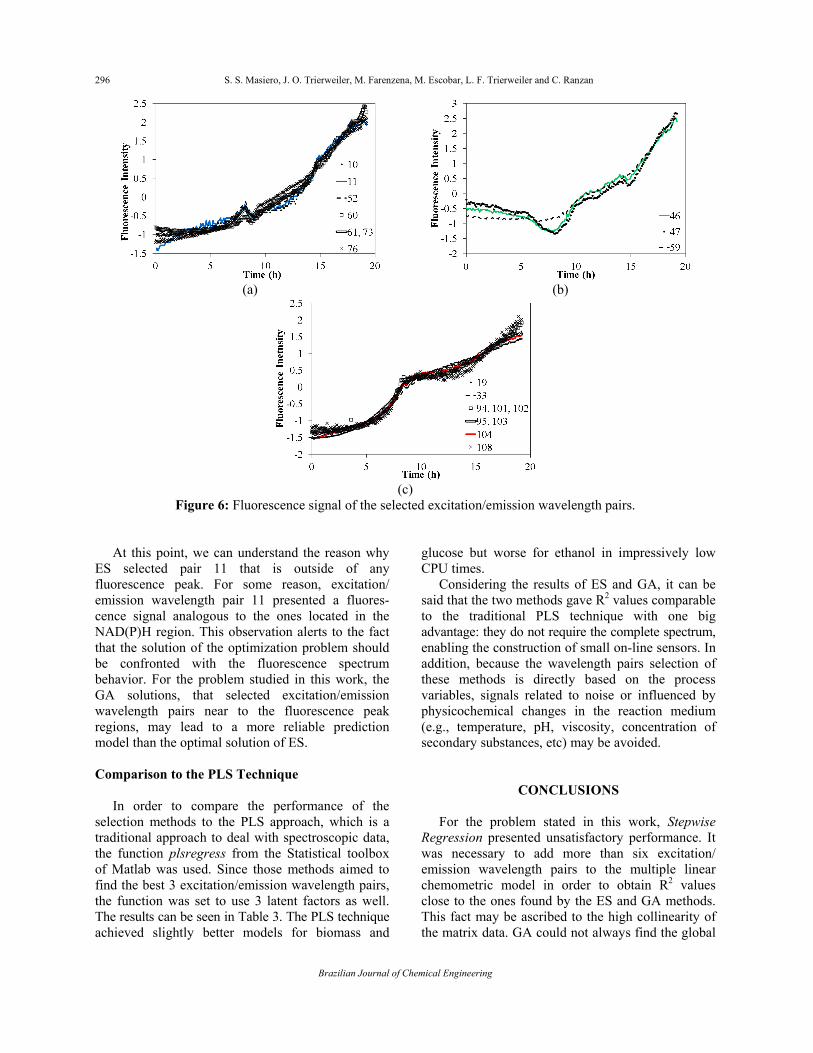
The fluorescence signals of all pairs chosen by the ten repetitions of GA are plotted in Figure 6 together with the ones chosen by ES. In this figure, it can be verified that GA, except for repetition 5 and 10, selected three different patterns of fluorescence signals and that these patterns are analogous to the fluorescence signals selected by ES. This behavior can be ascribed again to the high degree of collinearity of the data matrix. In the case of repetitions 5 and 10, GA selected two wavelength pairs with the same pattern of fluorescence signal, but located in different spectral regions (proteins and riboflavin). Even though GA could not always find the optimal solution, in contrast to Stepwise Regression, it was able to deal more adequately with the linear dependency of the pairs, presenting satisfactory and coherent results in all the tested cases.
Figure 5: 2-D fluorescence spectrum with excitation/emission wavelength pairs selected by ES (circles). The first, second and third pairs selected by Rep60Ind100 repetitions are indicated with squares, triangles and lozenges, respectively.
296 S. S. Masiero, J. O. Trierweiler, M. Farenzena, M. Escobar, L. F. Trierweiler and C. Ranzan
Brazilian Journal of Chemical Engineering
(a) (b)
(c)
Figure 6: Fluorescence signal of the selected excitation/emission wavelength pairs.
At this point, we can understand the reason why
ES selected pair 11 that is outside of any fluorescence peak. For some reason, excitation/ emission wavelength pair 11 presented a fluores-cence signal analogous to the ones located in the NAD(P)H region. This observation alerts to the fact that the solution of the optimization problem should be confronted with the fluorescence spectrum behavior. For the problem studied in this work, the GA solutions, that selected excitation/emission wavelength pairs near to the fluorescence peak regions, may lead to a more reliable prediction model than the optimal solution of ES. Comparison to the PLS Technique
In order to compare the performance of the selection methods to the PLS approach, which is a traditional approach to deal with spectroscopic data, the function plsregress from the Statistical toolbox of Matlab was used. Since those methods aimed to find the best 3 excitation/emission wavelength pairs, the function was set to use 3 latent factors as well. The results can be seen in Table 3. The PLS technique achieved slightly better models for biomass and
glucose but worse for ethanol in impressively low CPU times.
Considering the results of ES and GA, it can be said that the two methods gave R2 values comparable to the traditional PLS technique with one big advantage: they do not require the complete spectrum, enabling the construction of small on-line sensors. In addition, because the wavelength pairs selection of these methods is directly based on the process variables, signals related to noise or influenced by physicochemical changes in the reaction medium (e.g., temperature, pH, viscosity, concentration of secondary substances, etc) may be avoided.
CONCLUSIONS
For the problem stated in this work, Stepwise Regression presented unsatisfactory performance. It was necessary to add more than six excitation/ emission wavelength pairs to the multiple linear chemometric model in order to obtain R2 values close to the ones found by the ES and GA methods. This fact may be ascribed to the high collinearity of the matrix data. GA could not always find the global
Evaluation of Wavelength Selection Methods for 2D Fluorescence Spectra Applied to Bioprocesses Characterization 297
Brazilian Journal of Chemical Engineering Vol. 30, No. 02, pp. 289 - 298, April - June, 2013
optimum and each call returned a different solution due to the random character of the method. Nevertheless, it was able to achieve solutions with satisfactory R2 values in low CPU times and few evaluations of the objective function, dealing well with the linear dependency of the variables. The ES method showed the best performance, finding the global optimum in a few minutes. However, the coherence of the optimal solution should be verified by confronting it with the 2D fluorescence spectrum behavior. It also ought to be mentioned that this method could take excessive computational effort for a problem with more variables, for a more complex prediction model or when the optimization is performed in cycles.
In conclusion, it can be said that ES and GA should be considered as good alternatives for solving or at least for pre-screening possible candidates in analogous problems of variable selection. When compared to the traditional PLS technique, these two methods present an advantage. They can provide prediction models based on only a few wavelengths pairs and do not need the complete spectrum, thus enabling the construction of small on-line sensors.
NOMENCLATURE Cb Biomass concentration g.L-1
Cet Ethanol concentration g.L-1
Cg Glucose concentration g.L-1
ES Exhaustive search GA Genetic algorithm NAD(P)H Nicotinamide adenine
dinucleotide phosphate Pair 11 Emission 510 nm/
Excitation 270 nm Pair 46 Emission 370 nm/
Excitation 330 nm Pair 104 Emission 530 nm/
Excitation 430 nm R2 Determination coefficient RMSE Root mean square error S Unexplained variance SSerr Residual squares SSt Total squares sum YEB Ethanol to biomass yield g.g-1
YGB Glucose to biomass yield g.g-1
YGE Glucose to ethanol yield g.g-1
μE Specific growth rates in ethanol
s-1
μG Specific growth rates in glucose
s-1
REFERENCES
Becker, T., Hitzmann, B., Muffler, K., Pörtner, R., Reardon, K., Stahl, F. and Ulber, R., Future Aspects of Bioprocess Monitoring. White Biotechnology, 249-293, Springer Berlin/Heidelberg (2007).
Benoudjita, N., Coolsb, E., Meurensb, M. and Verleysena M., Chemometric calibration of infrared spectrometers: Selection and validation of variables by non-linear models. Chemometrics and Intelligent Laboratory Systems, 70, 47-53 (2004).
Boehl, D., Solle, D., Hitzmann, B. and Scheper T., Chemometric modelling with two-dimensional fluorescence data for Claviceps purpurea biopro-cess characterization. Journal of Biotechnology, 105, 179-188 (2003).
Bogomolov, A., Grasser, T. and Hessling M., In-line monitoring of Saccharomyces cerevisiae fer-mentation with a fluorescence probe: New approaches to data collection and analysis. Journal of Chemometrics, 25, 389-399 (2011).
Escobar, M. d. S., Waller, D. B., Masiero, S. S., Ranzan, C., Trierweiler, L. F., Farenzena, M. and Trierweiler, J. O., Aplicação de Splines para a Obtenção de Modelos Quimiométricos Voltados à Caracterização de Bioprocessos. In XVIII Simpósio Nacional de Bioprocessos – SINAFERM 2011. Caxias do Sul, Brasil (2011). (In Portuguese).
Ferreira, L. S., Souza Jr., M. B., Trierweiler, J. O., Hitzmann, B. and Folly, R. O. M., Analysis of experimental biosensor/FIA lactose measurements. Brazilian Journal Chemical Engineering, 20, 7-13 (2003).
Ganzlin, M., Marose, S., Lu, X., Hitzmann, B., Scheper, T. and Rinas, U., In situ multi-wavelength fluorescence spectroscopy as effective tool to simultaneously monitor spore germination, metabolic activity and quantitative protein production in recombinant Aspergillus niger fed-batch cultures. Journal of Biotechnology, 132, 461-468 (2007).
Haack, M. B., Eliasson, A. and Olsson, L., On-line cell mass monitoring of Saccharomyces cerevisiae cultivations by multi-wavelength fluorescence. Journal of Biotechnology, 114, 199-208 (2004).
Hantelmann, K., Kollecker, M., Hüll, D., Hitzmann, B. and Scheper, T., Two-dimensional fluorescence spectroscopy: A novel approach for controlling fed-batch cultivations. Journal of Biotechnology, 121, 410-417 (2006).
Hulhoven, X., Bioprocess software sensors develop-ment facing modelling and model uncertainties. In Faculté des sciences - Ecole Interfacultaire des
298 S. S. Masiero, J. O. Trierweiler, M. Farenzena, M. Escobar, L. F. Trierweiler and C. Ranzan
Brazilian Journal of Chemical Engineering
Bioingénieurs. Bruxelles: Université Libre de Bruxelles (2006).
Jain, G., Jayaraman, G., Kökpinar, Ö., Rinas, U. and Hitzmann, B., On-line monitoring of recombinant bacterial cultures using multi-wavelength fluores-cence spectroscopy. Biochemical Engineering Journal, 58-59, 133-139 (2011).
Jouan-Rimbaud, D., Massart, D.-L., Leardi, R. and De Noord, O. E., Genetic algorithms as a tool for wavelength selection in multivariate calibration. Analytical Chemistry, 67, 4295-4301 (1995a).
Jouan-Rimbaud, D., Walczak, B., Massart, D. L., Last, I. R. and Prebble, K. A., Comparison of multivariate methods based on latent vectors and methods based on wavelength selection for the analysis of near-infrared spectroscopic data. Analytica Chimica Acta, 304, 285-295 (1995b).
Konak, A., Coit, D. W. and Smith, A. E., Multi-objective optimization using genetic algorithms: A tutorial. Reliability Engineering and System Safety, 91, 992-1007 (2006).
Lee, K. I., Yim, Y. S., Chung, S. W., Wei, J. and Rhee, J. I., Application of artificial neural networks to the analysis of two-dimensional fluorescence spectra in recombinant E. coli fermentation processes. Journal of Chemical Technology and Biotechnology, 80, 1036-1045 (2005).
Marose, S., Lindemann, C. and Scheper, T., Two-dimensional fluorescence spectroscopy: A new tool for on-line bioprocess monitoring. Biotech-nology Progress, 14, 63-74 (1998).
Neumann, F. and Witt, C., Stochastic Search Algorithms. In Bioinspired Computation in Combinatorial Optimization, 21-32, Springer Berlin Heidelberg (2010).
Oliveira, F. R. P., Goldberg, K., Liese, A. and Hitzmann, B., Chemometric modelling for process analyzers using just a single calibration sample. Chemometrics and Intelligent Laboratory Systems, 94, 118-122 (2008).
Ranzan, C., Trierweiler, L. F., Hitzmann, B. and Trierweiler, J. O., Modelagem quimiométrica para caracterização de bioprocessos através de espectroscopia fluorescente-2D. In XVIII Simpósio Nacional de Bioprocessos, Caxias do Sul, RS, Brasil (2011). (In Portuguese).
Rhee, J. I. and Kang, T.-H., On-line process monitoring and chemometric modeling with 2D fluorescence spectra obtained in recombinant E. coli fermentations. Process Biochemistry, 42, 1124-1134 (2007).
Rossi, D., Solle, D., Hitzmann, B. and Ayub, M., Chemometric modeling and two-dimensional fluorescence analysis of bioprocess with a new
strain of Klebsiella pneumoniae to convert residual glycerol into 1,3-propanediol. Journal of Industrial Microbiology & Biotechnology, 39, 701-708 (2012).
Scheper, T., Hitzmann, B., Stärk, E., Ulber, R., Faurie, R., Sosnitza, P. and Reardon, K. F., Bioanalytics: Detailed insight into bioprocesses. Analytica Chimica Acta, 400, 121-134 (1999).
Scheper, T. H., Hilmer, J. M., Lammers, F., Müller, C. and Reinecke, M., Biosensors in bioprocess monitoring. Journal of Chromatography A, 725, 3-12 (1996).
Schügerl, K., Progress in monitoring, modeling and control of bioprocesses during the last 20 years. Journal of Biotechnology, 85, 149-173 (2001).
Skibsted, E., Lindemann, C., Roca, C. and Olsson, L., On-line bioprocess monitoring with a multi-wavelength fluorescence sensor using multivariate calibration. Journal of Biotechnology, 88, 47-57 (2001).
Solle, D., Geissler, D., Stärk, E., Scheper, T. and Hitzmann, B., Chemometric modelling based on 2D-fluorescence spectra without a calibration measurement. Bioinformatics, 19, 173-177 (2003).
Stärk, E., Hitzmann, B., Schügerl, K., Zeng, A. P., Aunins, J., Bader, A., Bell, W., Biebl, H., Biselli, M., Carrondo, M., Castilho, L., Chang, H., Cruz, P., Fuchs, C., Han, S., Han, M. R., Heinzle, E., Köster, D., Jasmund, I., Jelinek, N., Lang, S., Laatsch, H., Lee, J., Miirkl, H., Maranga, L., Medronho, R., Meiners, M., Nath, S., Noll, T., Schmidt, S., Tholey, A., Wagner-Döbler, I., Wandrey, C., Wittmann, C., Yim, S. C. and Märkl, H., In-Situ-Fluorescence-Probes: A Useful Tool for Non-Invasive Bioprocess Monitoring. In Tools and Applications of Biochemical Engineering Science, 21-38, Springer Berlin/Heidelberg (2002).
Surribas, A., Geissler, D., Gierse, A., Scheper, T., Hitzmann, B., Montesinos, J. L. and Valero, F., State variables monitoring by in situ multi-wavelength fluorescence spectroscopy in heterologous protein production by Pichia pastoris. Journal of Biotechnology, 124, 412-419 (2006).
Zhang, Z., Scharer, J. M. and Moo-Young, M., Mathematical model for aerobic culture of a recombinant yeast. Bioprocess and Biosystems Engineering, 17, 235-240 (1997).
Ödman, P., Johansen, C. L., Olsson, L., Gernaey, K. V. and Lantz, A. E., On-line estimation of biomass, glucose and ethanol in Saccharomyces cerevisiae cultivations using in-situ multi-wavelength fluorescence and software sensors. Journal of Biotechnology, 144, 102-112 (2009).