evaluation of series t22 wet tantalum capacitors · periodical meas. i-t, c, df, esr, 6 pcs....
TRANSCRIPT

To be published on nepp.nasa.gov. 1
NASA Electronic Parts and Packaging (NEPP) Program NEPP Task: “Reliability of Advanced Tantalum Capacitors”
Evaluation of Series T22 Wet Tantalum Capacitors
Alexander Teverovsky ASRC Federal Space and Defense [email protected]
Work performed at NASA Goddard Space Flight Center
2017
https://ntrs.nasa.gov/search.jsp?R=20180001977 2018-09-08T21:05:03+00:00Z

To be published on nepp.nasa.gov. 2
Introduction Series T22 of hermetically sealed wet tantalum capacitors (see Fig.1) is designed for avionics and aerospace applications and features a relatively small case size (LxWxH = 0.35x0.28x0.29) and compatibility with surface mount assembly technology [1]. Considering that heat release in vacuum occurs mostly by thermal conduction through the leads, this design allows using higher ripple currents in space systems. The manufacturer specifies that the part can operate in a typical for tantalum capacitors temperature range from -55 °C to +85 °C, and to +125 °C with voltage derating.
All parts are screened by 48 hr burning-in at 85 °C and rated voltage, can endure 300 thermal shock cycles, 3 V of reverse bias, 100 g mechanical shock, and 27.8 g rms of random vibration testing (RVT) per MIL-PRF-39006. Capacitors are capable of withstanding 2000 hr life testing at +85 °C and rated voltage (VR) or at +125 °C and 2/3VR.
Figure 1. Overall views of capacitors.
Design of the parts allows using these wet electrolytic capacitors similar to regular chip tantalum capacitors, so in the following evaluations characteristics of the parts were measured similar to chip tantalum capacitors. In particular, alternative current (AC) characteristics included capacitance (C) and dissipation factor (DF) measured at 120 Hz and equivalent series resistance (ESR) measured at 100 kHz.
The parts are designed without internal Teflon sealing that is used for CLR style capacitors typically used for space systems. This raises concerns about their hermeticity and the capability of withstanding high internal gas pressure [2]. To address these issues, in addition to highly accelerated life testing (HALT) at 125 °C and rated voltage, and step stress random vibration testing (RVT), the parts were evaluated by high temperature storage (2500 hr) testing at 150 °C (HTS150) with measurements of electrical characteristics through the testing and the hermeticity leak rate before and after the testing. Also, the parts soldered onto printed wired boards (PWB) were stressed by 1000 temperature cycles between -55 °C and +125 °C and their quality was assessed by additional HALT at different temperatures.
Contents Introduction ................................................................................................................................................................... 2 Contents ......................................................................................................................................................................... 2 Design ............................................................................................................................................................................ 3 Experiment .................................................................................................................................................................... 5 Initial characteristics ...................................................................................................................................................... 6 Leak testing ................................................................................................................................................................... 7 Random vibration testing............................................................................................................................................... 8 High temperature storage............................................................................................................................................. 11 Leakage currents at different temperatures and voltages ............................................................................................. 14 Accelerated life testing ................................................................................................................................................ 15 Temperature cycling .................................................................................................................................................... 15 Conclusion ................................................................................................................................................................... 16 Acknowledgment ......................................................................................................................................................... 16 References ................................................................................................................................................................... 16

To be published on nepp.nasa.gov. 3
Design X-ray, external and internal views of the parts are shown in Figures 2 to 6. During assembly, a rectangular tantalum slug with a riser wire that is welded to the anode terminal through a glass seal is inserted into a tantalum case that has a hole in a side wall to fill the case with electrolyte. A Teflon separator is used to prevent contacts between the slug and the case. The internal surface of the can is covered with a thin layer of tantalum powder that is oxidized to provide reverse bias capability to the part. After welding of the lid with the attached slug to the can, the part is filled with the gelled sulfuric acid electrolyte through a side wall aperture. Then the aperture is covered with a small plate/plug and the can is sealed by the laser welding around the plate. After the case is marked and varnished on four sides, two nickel L-shaped leads are attached through an external Teflon separator and welded to form a cathode and anode terminals suitable for surface mounting. There is an option for these leads to be finished by Sn/Pb alloy as required for space applications to avoid problems with tin whiskers.
a) b) c)
Figure 2. Typical side X-ray views of the parts (a, c). Figure (b) is an optical side view showing welding of the plug. Arrows show location of the plug.
a) b) c)
Figure 3. A 125 V capacitor with a partially removed side showing remnants of the gel (a), internal view of the part after cleaning (b), and cross-sectioning through the middle area (c).

To be published on nepp.nasa.gov. 4
a) b) c)
Figure 4. A disassembled 125V capacitor. (a) an internal view of the can showing Teflon separator. (b) an internal view of the plug. (c) anode subassembly.
a) b) Figure 5. An internal (a) and cross-sectional (b) views of a 50 V capacitor.
a) b) Figure 6. Anode (a) and cathode (b) welding of the Sn/Pb plated L-shaped Ni leads.

To be published on nepp.nasa.gov. 5
Experiment Two types of T22 series capacitors, 10 µF 125 V and 68 µF 50 V, were used in this study. Characteristics of the parts are shown in Table 1. Similar to wet tantalum capacitors, only two AC parameters, C and ESR at 120 Hz, are specified. However, these capacitors are functionally similar to solid chip capacitors, for which three parameters, C and DF at 120 Hz and ESR at 100 kHz, are specified. In this study, we measured all three AC characteristics of capacitors. A limit for dissipation factor at a frequency f = 120 Hz was calculated as DF = ESR120*C*(2πf). Other characteristics shown in Table 1 are from the data sheet for the part.
Table 1. Characteristics of used parts
Part type C, µF VR, V DCL at 25C, µA
DCL at 85C, µA
ESR at 120 Hz,
ohm
DF at 120Hz,
%
Ripple current at
40kHz. Arms T22C106K125EZS 10 125 1 5 5.5 4.1 0.83
T22C686K050EZS 68 50 1 5 1.5 7.7 1.65
The test plan that included HTS150, RVT, hermeticity leak testing, HALT, and temperature cycling (TC) is shown in Fig. 7. Due to a limited number of available samples, TC was carried out after accelerated life testing.
Figure 7. Test plan.
Electrical measurements included AC characteristics: C, DF, and ESR, and direct current (DC) characteristics: monitoring of current relaxation (I-t characteristics) for 1200 sec during polarization at rated voltages followed by depolarization at 0 V.
During high temperature storage at 150 ºC AC and DC characteristics of the parts were measured initially, after 24 hr, 100 hr, 300 hr, 500 hr, 750 hr, 1000 hr, 1500 hr, 2000 hr, and finally after 2500 hr of testing.
Random vibration testing was carried out in two directions, along the tantalum riser wire and perpendicular to it, consequently at levels starting from 10.76 g rms (Cond. II-C per MIL-PRF-202, TM 214) to 44 g rms (Cond. II-J), which exceeds the manufacturer specified level of 27.8 grms (Cond. II-G).
Before life testing the parts were manually soldered onto a PWB that was designed according to the requirements for contact pads for these capacitors (the size of contact pads 7.5x9.5 mm with a gap of 2.5 mm). Board material is FR4, and the thickness 1.6 mm.
Temperature cycling was carried out according to MIL-PRF-39006 requirements, except for the number of cycles was increased from 300 to 1000 cycles.
Initial meas.C, DF, ESR, I-t
32 pcs
Hermeticity leak test, 6 pcs
HTS 150Cperiodical meas.
I-t, C, DF, ESR, 6 pcs
Hermeticity leak test, 6 pcs
Monitored step stress RVT
6 pcs
Accelerated life test, 770 hr 125C, VR,
20pcs
Temperature cycling1000c -55 to +125C
I-V characteristics and Monitored
HALT
To be published on nepp.nasa.gov. 6
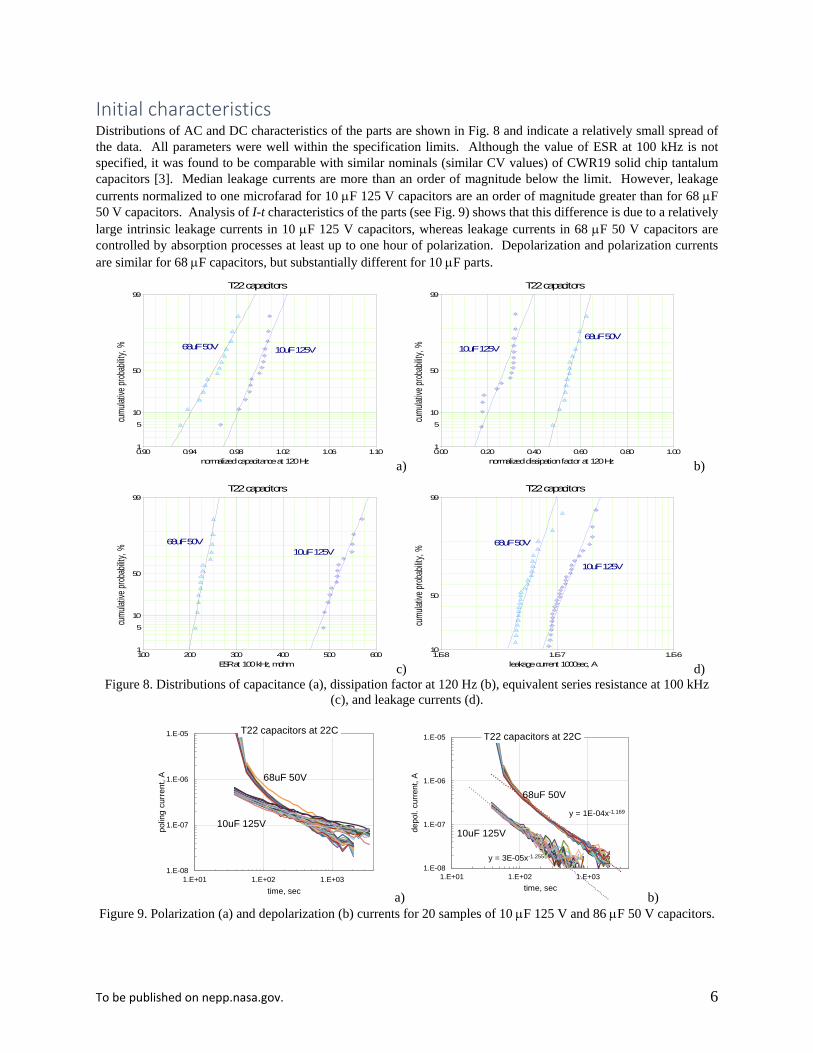
Initial characteristics Distributions of AC and DC characteristics of the parts are shown in Fig. 8 and indicate a relatively small spread of the data. All parameters were well within the specification limits. Although the value of ESR at 100 kHz is not specified, it was found to be comparable with similar nominals (similar CV values) of CWR19 solid chip tantalum capacitors [3]. Median leakage currents are more than an order of magnitude below the limit. However, leakage currents normalized to one microfarad for 10 µF 125 V capacitors are an order of magnitude greater than for 68 µF 50 V capacitors. Analysis of I-t characteristics of the parts (see Fig. 9) shows that this difference is due to a relatively large intrinsic leakage currents in 10 µF 125 V capacitors, whereas leakage currents in 68 µF 50 V capacitors are controlled by absorption processes at least up to one hour of polarization. Depolarization and polarization currents are similar for 68 µF capacitors, but substantially different for 10 µF parts.
a) b)
c) d) Figure 8. Distributions of capacitance (a), dissipation factor at 120 Hz (b), equivalent series resistance at 100 kHz
(c), and leakage currents (d).
a) b) Figure 9. Polarization (a) and depolarization (b) currents for 20 samples of 10 µF 125 V and 86 µF 50 V capacitors.
T22 capacitors
normalized capacitance at 120 Hz
cumu
lative
prob
abilit
y, %
0.90 1.100.94 0.98 1.02 1.061
5
10
50
99
68uF 50V 10uF 125V
T22 capacitors
normalized dissipation factor at 120 Hz
cumu
lative
prob
abilit
y, %
0.00 1.000.20 0.40 0.60 0.801
5
10
50
99
68uF 50V10uF 125V
T22 capacitors
ESR at 100 kHz, mohm
cumu
lative
prob
abilit
y, %
100 600200 300 400 5001
5
10
50
99
68uF 50V10uF 125V
T22 capacitors
leakage current 1000sec, A
cumu
lative
prob
abilit
y, %
1.E-8 1.E-61.E-710
50
99
68uF 50V
10uF 125V
1.E-08
1.E-07
1.E-06
1.E-05
1.E+01 1.E+02 1.E+03
polin
g cu
rren
t, A
time, sec
T22 capacitors at 22C
68uF 50V
10uF 125Vy = 1E-04x-1.169
y = 3E-05x-1.255
1.E-08
1.E-07
1.E-06
1.E-05
1.E+01 1.E+02 1.E+03
depo
l. cu
rrent
, A
time, sec
T22 capacitors at 22C
68uF 50V
10uF 125V

To be published on nepp.nasa.gov. 7
According to the data sheet [1], the maximum power dissipation for T22 capacitors is 0.9 W in free air. It is assumed that at this power the temperature of the part will increase to less than 50 ºC. This means that the thermal resistance of soldered capacitors is less than 55.5 K/W, which is below the values that are typically used for solid chip capacitors [4, 5] and close to large size (T3 and T4) leaded military grade wet tantalum capacitors [6]. It appears that surface mount capacitors would have a lesser thermal resistance than leaded parts, so additional experiments and analysis of the thermal resistance are necessary to get more accurate values.
Maximum ripple current for the part is calculated based on the specified values of maximum ripple currents at 40 kHz and multiplying coefficients (CM) that have the same values as in MIL-PRF-39006. However, using suggested coefficients might result in errors. For example, at 120 Hz CM = 0.6, so maximum allowable dissipation power for 10 µF capacitors is Pmax = 5.5×(0.6×0.83)2 = 1.36 W. For 68 µF capacitors Pmax = 1.5× (0.6×1.65)2 = 1.47 W. In both cases the power exceeds the maximum of 0.9 W. At 100 kHz CM = 1.1, and based on distributions of ESR, maximum values are 0.6 ohm for 10 µF and 0.3 ohm for 68 µF capacitors. Respectively, maximum dissipated power is 1 W for 68 µ F and 0.5 W for 10 µF capacitors.
Leak testing Hermeticity leak testing was carried out using Pernicka Corp. cumulative helium leak detector, CHLD, technique. The parts were pressurized in helium at 60 psia for 20 hours, removed from the pressure chamber and set aside for 0.5 hour before measurements. After the initial leak testing has been measured, the parts were stored on the bench at room conditions for 20 hours and then retested. For control purposes, periodically measurements had been made with an empty chamber. Another group of capacitors was tested after HTS testing at 150 ºC for 2500 hours.
Result of these measurements are shown in Table 2 and indicate that all parts passed the leak test criteria of 1E-9 atm*cc/sec not only initially, but also after HTS150 when the internal pressure in the parts increased to 3.86 atm [2].
Comparison of the data obtained during initial measurements and after 20 hours of storage at room conditions show that in the latter case the leak rate decreased more than an order of magnitude and is comparable with the background level measured in empty chamber. Most likely, the measured leak rate is due to helium desorbed from the external Teflon separator and varnishing on the case. Actual leakage rate is likely below ~ 1E-11 atm*cc/sec, and the effect of mechanical stresses developed during HTS150 did not create defects in the case and/or seal.
Table 2. Results of hermeticity leak measurements (in atm*cc/sec)
Part Type Sample Initial He Leak Rate (limit 1E-9) Retest in 20hr after HTS at
150 ºC for 2500hr Empty chamber 2.5 to 3.7 E-11 1.5 to 2 E-11 2.4 to 3.2E-11
10 µF 125V
SN1 4.36E-10 3.16E-11 6.76E-10 SN2 4.66E-10 3.19E-11 3.13E-10 SN3 4.03E-10 3.53E-11 7.25E-10 SN4 3.21E-10 2.41E-11 3.03E-10 SN5 2.85E-10 3.68E-11 2.66E-10
Empty chamber 3.35E-11 - 3.3 to 4.8E-11
68 µF 50V
SN1 2.87E-10 3.16E-11 2.69E-10 SN2 2.58E-10 3.11E-11 2.48E-10 SN3 2.74E-10 3.45E-11 2.57E-10 SN4 2.8E-10 3.22E-11 2.33E-10 SN5 2.9E-10 4.34E-11 2.55E-10
Empty chamber 2.83E-11 1.55E-11 2.53E-11

To be published on nepp.nasa.gov. 8
Random vibration testing Monitored random vibration step stress testing was carried out using blocks of six capacitors molded in epoxy (see Fig. 10a) and a V780-HPAK vibration system with a Bruel and Kjaer LDS controller (see Fig. 10b). Each step continued for 15 min consecutively at 10.76 g rms (Cond. II-C per MIL-PRF-202, TM 214), 19.64 g rms (Cond. II-E), 34.02 g rms (Cond. II-H), and 43.92 g rms (Cond. II-J) first along the anode’s axis, and then in a perpendicular direction. Measurements and analysis of test results were carried out as described in [7]. Leakage currents were monitored during the testing by sampling every 100 msec voltages across 10 kohm resistors connected to each capacitor. Vibration was initiated after 5 minutes of electrification to apply the stress after current stabilization.
Testing of 68 µF 50 V capacitors did not reveal any anomalies. To increase the level of stress, duration of testing at 44 g rms was increased to 1 hour. However, no anomalies or current spiking was observed (see Fig.11) suggesting that the parts are robust enough to sustain vibration at 44 g rms.
Figure 10. Capacitors molded into epoxy (a) and a head of a shaker with mounted capacitors (b).
Figure 11. Monitored RVT for six 68 µF 50 V capacitors during one hour testing at 44 grms.
Testing of 125 V capacitors showed some spiking of currents up to a few microamperes at a relatively low levels of stress, and starting 34 g rms one part had substantially increased currents and spiking (see Fig. 12). The same situation was observed at both directions of vibration testing.
a)
0.E+00
1.E-06
2.E-06
3.E-06
4.E-06
5.E-06
6.E-06
0 500 1000 1500 2000 2500 3000 3500 4000 4500
curr
ent,
A
time, sec
T22C686K050EZS at 44 grms perpendicular to the slug axis
SN1
SN2
SN3
SN4
SN5
SN6
0.E+00
1.E-06
2.E-06
3.E-06
4.E-06
5.E-06
6.E-06
0 200 400 600 800 1000 1200 1400
curr
ent,
A
time, sec
T22C106K125EZS DC1634 at 10.7 grms perpendicular to the slug axis
SN1
SN2
SN3
SN4
SN5
SN6

To be published on nepp.nasa.gov. 9
b)
c)
d)
e)
f)
0.E+00
1.E-06
2.E-06
3.E-06
4.E-06
5.E-06
6.E-06
0 200 400 600 800 1000 1200 1400
curr
ent,
A
time, sec
T22C106K125EZS DC1634 at 19.6 grms perpendicular to the slug axis
SN1
SN2
SN3
SN4
SN5
SN6
0.E+00
1.E-06
2.E-06
3.E-06
4.E-06
5.E-06
6.E-06
0 200 400 600 800 1000 1200 1400
curr
ent,
A
time, sec
T22C106K125EZS DC1634 at 34.02 grms perpendicular to the slug axis
SN1
SN2
SN3
SN4
SN5
SN6
0.E+00
1.E-06
2.E-06
3.E-06
4.E-06
5.E-06
6.E-06
0 200 400 600 800 1000 1200 1400
curr
ent,
A
time, sec
T22C106K125EZS DC1634 at 44 grms perpendicular to the slug axis
SN1
SN2
SN3
SN4
SN5
SN6
0.E+00
1.E-06
2.E-06
3.E-06
4.E-06
5.E-06
6.E-06
0 200 400 600 800 1000 1200 1400 1600
curr
ent,
A
time, sec
T22C106K125EZS DC1634 at 10.7 grms along the slug axis
SN1
SN2
SN3
SN4
SN5
SN6
0.E+00
1.E-06
2.E-06
3.E-06
4.E-06
5.E-06
6.E-06
0 200 400 600 800 1000 1200 1400 1600
curr
ent,
A
time, sec
T22C106K125EZS DC1634 at 19.6 grms along the slug axis
SN1
SN2
SN3
SN4
SN5
SN6

To be published on nepp.nasa.gov. 10
g)
h) Figure 12. Results of RVT for 10 µF 125 V capacitors.
Post-RVT measurements of I-t characteristics for 68 µF 50 V capacitors were identical to the initial ones (see Fig 13 c, d). However, the same sample of 10 µF 125 V capacitors that exhibited excessive currents during the testing had a spike (see Fig 13 a) possibly indicating a scintillation at the damaged site of the oxide. After the scintillation event, leakage currents were normal suggesting a full self-healing of the oxide.
a) b)
c) d) Figure 13. Polarization (a, c) and depolarization (b, d) currents for 10 µF 125 V (a, b) and 68 µF 50 V (c, d)
capacitors after random vibration testing.
Results show that the parts are robust enough to withstand the manufacturer specified level of random vibration of 27 g rms. However, the margin for the 50 V capacitors is greater, and these parts can likely operate reliably even at a greater levels of stress.
0.E+00
1.E-06
2.E-06
3.E-06
4.E-06
5.E-06
6.E-06
0 200 400 600 800 1000 1200 1400 1600
curr
ent,
A
time, sec
T22C106K125EZS DC1634 at 34.02 grms along the slug axis
SN1
SN2
SN3
SN4
SN5
SN6
0.E+00
1.E-06
2.E-06
3.E-06
4.E-06
5.E-06
6.E-06
0 200 400 600 800 1000 1200 1400 1600
curr
ent,
A
time, sec
T22C106K125EZS DC1634 at 44 grms along the slug axis
SN1
SN2
SN3
SN4
SN5
SN6
1.E-08
1.E-07
1.E-06
1.E-05
1.E+00 1.E+01 1.E+02 1.E+03 1.E+04
curr
ent,
A
time, sec
T22 10uF 125V after RVT
SN1SN2SN3SN4SN5SN6
y = 1E-05x-1.036
1.E-09
1.E-08
1.E-07
1.E-06
1.E-05
1.E+00 1.E+01 1.E+02 1.E+03 1.E+04
curr
ent,
A
time, sec
T22 10uF 125V after RVT
y = 3E-05x-0.894
1.E-08
1.E-07
1.E-06
1.E-05
1.E+00 1.E+01 1.E+02 1.E+03 1.E+04
curr
ent,
A
time, sec
T22 68uF 50V after RVT
SN1SN2SN3SN4SN5SN6
y = 5E-05x-1.075
1.E-08
1.E-07
1.E-06
1.E-05
1.E+00 1.E+01 1.E+02 1.E+03 1.E+04
curr
ent,
A
time, sec
T22 68uF 50V after RVT

To be published on nepp.nasa.gov. 11
High temperature storage The purpose of HTS testing is to make sure that the part can sustain increased internal pressure for a long period of time. One of the reason of increased pressure for space level parts is operation in vacuum and the second, more critical, is gas generation caused by excessive leakage currents associated with defects in the dielectric. One of the indicators of the robustness of parts to high internal pressures is the absence of electrolyte leak, and another is stability of electrical characteristics.
For aluminum electrolytic capacitors the leak of electrolyte during storage is considered the major reason of failures and results in decreasing of capacitance and increasing of ESR. Another reasons for increasing ESR is degradation of the electrolyte. Dissolution of aluminum oxide that might be especially significant at the defective areas can result in increased leakage currents [8, 9]. Reconditioning by applying voltage through limiting resistors to restore oxide and reduce leakage currents is recommended after long term storage by some manufacturers of aluminum electrolytic capacitors [10].
Contrary to aluminum electrolytic capacitors, wet tantalum capacitors are hermetically sealed so the loss of electrolyte during storage at relatively low temperatures is negligibly small for normal quality parts [2]. However, there is a lack of literature data regarding the effect of HTS on performance of wet tantalum capacitors. To get a better understanding of processes during storage, characteristics of T22 capacitors were measured periodically during HTS. Variations of capacitance, DF, and ESR during 2500 hours of storage at 150 ºC is shown in Fig. 14.
a) b)
c) d)
9.5
9.6
9.7
9.8
9.9
10
10.1
10.2
0 500 1000 1500 2000 2500
capa
cita
nce,
uF
time, hr
T22 10uF 125V HTS 150C
6262.5
6363.5
6464.5
6565.5
6666.5
67
0 500 1000 1500 2000 2500
capa
cita
nce,
uF
time, hr
T22 68uF 50V HTS 150C
1
1.1
1.2
1.3
1.4
1.5
1.6
1.7
1.8
0 500 1000 1500 2000 2500
DF,
%
time, hr
T22 10uF 125V HTS 150C
3
3.5
4
4.5
5
5.5
0 500 1000 1500 2000 2500
DF,
%
time, hr
T22 68uF 50V HTS 150C

To be published on nepp.nasa.gov. 12
e) f) Figure 14. Variations of AC characteristics with time of storage at 150 ºC. Dashed lines correspond to reference
capacitors that were stored at room conditions.
A decrease of capacitance was relatively small for 10 µF, ~0.47%, but for 68 µF capacitors it was larger, ~3.5%. Dissipation factors increased noticeably, by ~ 15.4% for 10 µF and by ~ 10.6% for 68 µF capacitors. There was some spread of data during ESR measurements, but on average ESR values slightly increased for both types, 10 µF (2.4%) and 68 µF (3.2%) capacitors.
A small, but consistent decrease of capacitance for 68 µF capacitors might be due to increasing ESR or additional oxidation of the cathode and anode tantalum pentoxide layers. However, ESR variations seemed to stabilize after ~500 hours, whereas capacitance continued decreasing, so additional oxidation seems to be more probable.
Increasing DF is likely due to formation of additional states at the Ta2O5/electrolyte interface that are capable of fast capture and release of electrons as a reaction to AC signal. This is also in agreement with some increase of the absorption/depolarization currents (see Fig. 15).
Repeat measurements of AC characteristics after 0.5 year of storage at room conditions showed no significant changes compared to the post HTS results. This indicates that the observed variations are likely irreversible and might be due to some relatively small variations in electrical characteristics of the electrolyte used and generation of additional surface states responsible for increasing DF and absorption currents.
a) b) Figure 15. Variations of leakage currents measured at room temperature after 1000 sec during HTS150 for 10 µF
125 V (a) and 68 µF 50 V (b) capacitors.
During HTS150, polarization currents measured after 1000 sec did not change significantly for 125 V capacitors, but increased approximately 2 orders of magnitude for 50 V parts (see Fig.15). To reveal a more detailed picture of the degradation process, Fig. 16a shows examples of kinetics of current relaxation for both types of capacitors. For 125 V capacitors I-t characteristics follow a power law with the exponent ~ 0.6 that remains practically constant with time of HTS. The curves are shifted upward (increasing currents approximately 2 times) already after 24 hours of storage, and then remain practically unchanged. Depolarization currents (Fig 16c) also did not change significantly.
450460470480490500510520530540550
0 500 1000 1500 2000 2500
ES
R, m
ohm
time, hr
T22 10uF 125V HTS 150C
190
200
210
220
230
240
250
0 500 1000 1500 2000 2500
ES
R, m
ohm
time, hr
T22 68uF 50V HTS 150C
1.E-9
1.E-8
1.E-7
1.E-6
0 500 1000 1500 2000 2500
DC
L, A
time, hr
T22 10uF 125V HTS 150C
polarization
depolarization
1.E-8
1.E-7
1.E-6
1.E-5
0 500 1000 1500 2000 2500
DC
L, A
time, hr
T22 68uF 50V HTS 150C
polarization
depolarization

To be published on nepp.nasa.gov. 13
Much more significant changes in current relaxation were observed for 50 V capacitors (Fig. 16b). Initially, variations of current with time also followed a power law with the exponent close to 1, which is typical for high quality tantalum capacitors. However, after ~ 1000 hours of storage, currents leveled off after 1000 sec under bias, and the level of the steady-state currents increased up to 10 µA by the end of testing. Depolarization currents are gradually rising with time increasing eventually approximately two times after 2500 hours of testing (Fig. 16d).
a) b)
c) d) Figure 16. I-t characteristics for polarization (a, b) and depolarization (c, d) currents during HTS150 for 10 µF 125
V (a, c) and 68 µF 50V (b, d) capacitors.
Variations of currents with time of electrification measured after 0.5 year storage following HTS stress are shown in Fig. 17. During first 1000 sec of electrification there was no significant changes compared to the post-HTS measurements for both types of capacitors. However, after approximately 0.5 hour under bias, currents in 50 V capacitors started decreasing and reduced more than an order of magnitude after 44 hours. It is possible that eventually they can reach the initial level.
a) b) Figure 17. Relaxation of leakage currents at rated voltages for 10 µF 125 V (a) and 68 µF 50 V (b) capacitors after
HTS150 and 0.5 year of storage at room conditions.
y = 6E-06x-0.556
1.E-8
1.E-7
1.E-6
1.E-5
1.E-4
1.E+0 1.E+1 1.E+2 1.E+3 1.E+4
curr
ent,
A
time, sec
T22 10uF 125V SN6 HTS150
init 24hr96hr 290hr482hr 770hr1005hr 1526hr2013hr 2500hr
y = 3E-05x-0.937
1.E-9
1.E-8
1.E-7
1.E-6
1.E-5
1.E-4
1.E+0 1.E+1 1.E+2 1.E+3 1.E+4
curr
ent,
A
time, sec
T22 68uF 50V SN6 at HTS150
init 24hr96hr 290hr482hr 770hr1005hr 1526hr2013hr 2500hr
y = 1E-05x-1.066
1.E-9
1.E-8
1.E-7
1.E-6
1.E-5
1.E-4
1.E+0 1.E+1 1.E+2 1.E+3 1.E+4
curr
ent,
A
time, sec
T22 10uF 125V SN6 HTS150
init24hr290hr482hr770hr1005hr1526hr2013hr2500hr
y = 4E-05x-1.047
1.E-9
1.E-8
1.E-7
1.E-6
1.E-5
1.E-4
1.E+0 1.E+1 1.E+2 1.E+3 1.E+4
curr
ent,
A
time, sec
T22 68uF 50V SN6 at HTS150
init 24hr96hr 290hr770hr 1005hr1526hr 2013hr2500hr
1.E-8
1.E-7
1.E-6
1.E-5
1.E-4
1.E+0 1.E+1 1.E+2 1.E+3 1.E+4
curr
ent,
A
time, sec
T22 10uF 125V after HTS150 and 0.5y at RC
SN1 SN2SN3 SN4SN5 SN6
1.E-8
1.E-7
1.E-6
1.E-5
1.E-4
1.E+1 1.E+2 1.E+3 1.E+4 1.E+5 1.E+6
curr
ent,
A
time, sec
T22 68uF 50V after HTS150 and0.5y at RC

To be published on nepp.nasa.gov. 14
Similar results of HTS150 testing were observed for other types of wet tantalum capacitors, including military grade parts, and might be due to discharging of dip electron traps resulting in increasing transient currents. Another reason is generation of deep traps in the bulk of Ta2O5 dielectric as a result of hydration of the oxide. These traps might form a pass for conduction, but trapping of injected electrons increases the barrier at the electrolyte/oxide interface with time under bias and thus reduces leakage currents. Although the same type of electrolyte is used in both part types, anodization processes are likely different and so are the thickness of the dielectrics (~0.13 µm for 50 V and ~ 0.4 µm for 125 V capacitors). This difference might result in different behavior of leakage currents during HTS150 and accelerated life testing as shown below.
Leakage currents at different temperatures and voltages To evaluate the effect of voltage and temperature on leakage currents, I-t characteristics were measured for 20 samples of each part type at 0.33VR, 0.5VR, 0.75VR, 1VR, and 1.1VR at room temperature and at the same voltages, except 1.1VR, at 55 ºC, 85 ºC, 105 ºC, and 125 ºC. Examples of these measurements are shown in Fig. 18 and indicate high reproducibility of currents and high quality of the dielectric. At room temperature the currents were mostly due to absorption processes, but starting at 55 ºC intrinsic components prevails after 1000 sec of electrification.
a) b) c)
Figure 18. Relaxations of leakage currents at rated voltages for 20 samples of T22 capacitors measured at 22 ºC (a), 85 ºC (b), and 125 ºC (c).
Based on 1000 sec reading, variations of leakage currents with voltage and temperature are displayed in Fig.19. For both parts, currents are increasing with voltage near exponentially. More analysis is necessary to evaluate applicability of Schottky or Poole-Frenkel models to the conduction process. Temperature dependencies of currents (Fig. 19c) at rated voltages can be closely approximated with Arrhenius functions and indicate activation energies in the range from 0.63 to 0.68 eV, which is close to the values observed for various types of wet tantalum capacitors [2].
a) b) c)
Figure 19. Variations of leakage currents with voltage at different temperatures measured after 1000 sec for 10 µF 125 V (a) and 68 µF 50 V (b) capacitors. Figure (c) shows temperature dependencies of leakage currents at rated voltages in
Arrhenius coordinates.
1.E-08
1.E-07
1.E-06
1.E-05
1.E+01 1.E+02 1.E+03 1.E+04
curr
ent,
A
time, sec
T22 capacitors at 22C
68uF 50V
10uF 125V
1.E-08
1.E-07
1.E-06
1.E-05
1.E+01 1.E+02 1.E+03 1.E+04
curr
ent,
A
time, sec
T22 at VR, 85C
68uF 50V
10uF 125V
1.E-07
1.E-06
1.E-05
1.E-04
1.E+01 1.E+02 1.E+03 1.E+04
curr
ent,
Atime, sec
T22 at VR, 125C
68uF 50V
10uF 125V
1.E-08
1.E-07
1.E-06
1.E-05
0 50 100 150
curr
ent,
A
voltage, V
T22 10uF 125V 22C pol85C pol105C pol125C pol
1.E-08
1.E-07
1.E-06
1.E-05
0 20 40 60
curr
ent,
A
voltage, V
T22 68uF 50V 22C pol85C pol105C pol125C pol
0.68 eV
0.63 eV
1.E-08
1.E-07
1.E-06
1.E-05
0.0022 0.0024 0.0026 0.0028 0.003 0.0032 0.0034
curr
ent,
A
1/T, 1/K
T22 capacitors at rated voltages
68uF 50V
10uF 125V

To be published on nepp.nasa.gov. 15
Accelerated life testing Twenty samples of each type manually soldered onto PWB have been subjected to life testing at 125 ºC and rated voltages. Note that the stress voltage exceeded the specified conditions of 2/3VR for this temperature. The voltage acceleration factor can be presented as exponential function of the voltage ratio:
−×= 1exp
VRVBAF test
V
, (1)
At B ~9.8 [11], AFV ≈ 130, so 1000 hours testing at VR would be equivalent to 13 years of test at 2/3VR.
The initial plan was to test parts for 1000 hours; however, due to multiple failures in 125 V capacitors, the testing was terminated after 770 hours.
Results of measurements during accelerated life testing are shown in Fig. 20. Leakage currents for 50 V capacitors decreased gradually with time from ~ 6 µA after 5 min to ~ 0.6 µA after 770 hours. However, increasing currents were observed after ~100 hours of testing for 125 V capacitors. Most 125 V capacitors (90%) failed catastrophically with electrolyte leaking out through apparently cracked glass sealed outlet at different times between 200 to 700 hours. Although the test conditions were outside the specified range (maximum voltage at 125 ºC is 83.3 V), this result indicated the need for voltage derating to use these parts for hi-rel applications. Currently, maximum use voltage for wet tantalum capacitors is set at 60% VR, and this derating should be enforced for 125 V capacitors. However, no failures during accelerated life testing were observed for 50 V capacitors indicating that contrary to 125 V parts, these capacitors can operate reliably at high temperatures even at the rated voltage. This allows easing derating requirements for 50 V capacitors.
a) b) Figure 20. Variations of leakage currents with time during HALT at 125 ºC and rated voltages for 10 µF 125 V (a)
and 68 µF 50 V (b) capacitors.
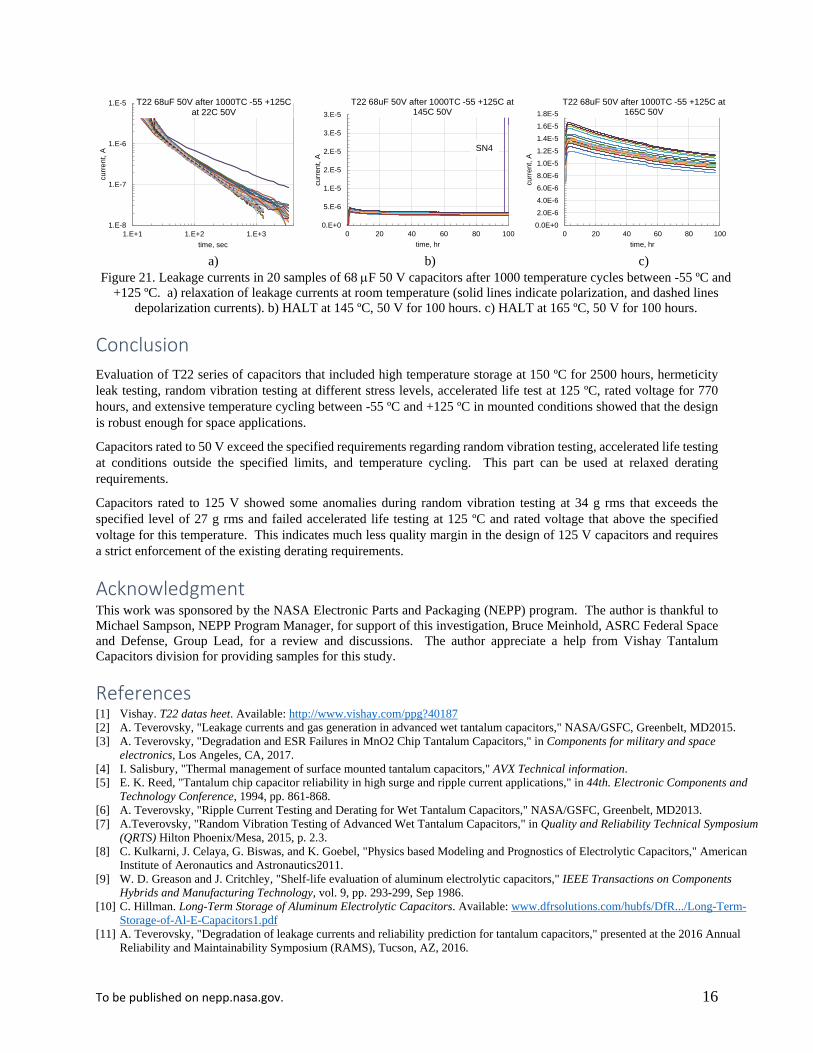
Temperature cycling Boards with soldered capacitors after life test had been subjected to 1000 TC from -55 ºC to +125 ºC. Visual examinations of capacitors after TC testing did not reveal any anomalies. Measurements of I-t characteristics were carried out for 1 hour at room temperature, 85 ºC, and 105 ºC. No failures were observed and currents decreased gradually with time of testing. At room temperature polarization and depolarization currents were similar (see Fig. 21a) and did not change significantly compared to the initial measurements.
After that HALT step stress testing was carried out at 50 V and temperatures of 125 ºC, 145 ºC, and 165 ºC hours for 100 hours at each step. The parts passed 125 ºC step, but one out of 20 samples failed after 95 hours at 145 ºC (Fig. 21b). Most likely this failure is not related to stresses during TC, and was caused by a presence of a relatively minor defect in the oxide that could be revealed at extremely stressful conditions only. The rest of the group (19 samples) passed the last step of HALT at 165 ºC and 50 V with currents decreasing with time. These results indicate high robustness and quality of T22 capacitors that might be sufficient for space applications.
0.E+00
5.E-06
1.E-05
2.E-05
2.E-05
0 200 400 600 800
curr
ent,
A
time, hr
T22 10uF 125V at 125C, 125V
1.E-07
1.E-06
1.E-05
1.E-04
1.E-2 1.E-1 1.E+0 1.E+1 1.E+2 1.E+3
curr
ent,
A
time, hr
T22 68uF 50V at 125C, 50V
To be published on nepp.nasa.gov. 16
a) b) c)
Figure 21. Leakage currents in 20 samples of 68 µF 50 V capacitors after 1000 temperature cycles between -55 ºC and +125 ºC. a) relaxation of leakage currents at room temperature (solid lines indicate polarization, and dashed lines
depolarization currents). b) HALT at 145 ºC, 50 V for 100 hours. c) HALT at 165 ºC, 50 V for 100 hours.
Conclusion Evaluation of T22 series of capacitors that included high temperature storage at 150 ºC for 2500 hours, hermeticity leak testing, random vibration testing at different stress levels, accelerated life test at 125 ºC, rated voltage for 770 hours, and extensive temperature cycling between -55 ºC and +125 ºC in mounted conditions showed that the design is robust enough for space applications.
Capacitors rated to 50 V exceed the specified requirements regarding random vibration testing, accelerated life testing at conditions outside the specified limits, and temperature cycling. This part can be used at relaxed derating requirements.
Capacitors rated to 125 V showed some anomalies during random vibration testing at 34 g rms that exceeds the specified level of 27 g rms and failed accelerated life testing at 125 ºC and rated voltage that above the specified voltage for this temperature. This indicates much less quality margin in the design of 125 V capacitors and requires a strict enforcement of the existing derating requirements.
Acknowledgment This work was sponsored by the NASA Electronic Parts and Packaging (NEPP) program. The author is thankful to Michael Sampson, NEPP Program Manager, for support of this investigation, Bruce Meinhold, ASRC Federal Space and Defense, Group Lead, for a review and discussions. The author appreciate a help from Vishay Tantalum Capacitors division for providing samples for this study.
References [1] Vishay. T22 datas heet. Available: http://www.vishay.com/ppg?40187 [2] A. Teverovsky, "Leakage currents and gas generation in advanced wet tantalum capacitors," NASA/GSFC, Greenbelt, MD2015. [3] A. Teverovsky, "Degradation and ESR Failures in MnO2 Chip Tantalum Capacitors," in Components for military and space
electronics, Los Angeles, CA, 2017. [4] I. Salisbury, "Thermal management of surface mounted tantalum capacitors," AVX Technical information. [5] E. K. Reed, "Tantalum chip capacitor reliability in high surge and ripple current applications," in 44th. Electronic Components and
Technology Conference, 1994, pp. 861-868. [6] A. Teverovsky, "Ripple Current Testing and Derating for Wet Tantalum Capacitors," NASA/GSFC, Greenbelt, MD2013. [7] A.Teverovsky, "Random Vibration Testing of Advanced Wet Tantalum Capacitors," in Quality and Reliability Technical Symposium
(QRTS) Hilton Phoenix/Mesa, 2015, p. 2.3. [8] C. Kulkarni, J. Celaya, G. Biswas, and K. Goebel, "Physics based Modeling and Prognostics of Electrolytic Capacitors," American
Institute of Aeronautics and Astronautics2011. [9] W. D. Greason and J. Critchley, "Shelf-life evaluation of aluminum electrolytic capacitors," IEEE Transactions on Components
Hybrids and Manufacturing Technology, vol. 9, pp. 293-299, Sep 1986. [10] C. Hillman. Long-Term Storage of Aluminum Electrolytic Capacitors. Available: www.dfrsolutions.com/hubfs/DfR.../Long-Term-
Storage-of-Al-E-Capacitors1.pdf [11] A. Teverovsky, "Degradation of leakage currents and reliability prediction for tantalum capacitors," presented at the 2016 Annual
Reliability and Maintainability Symposium (RAMS), Tucson, AZ, 2016.
1.E-8
1.E-7
1.E-6
1.E-5
1.E+1 1.E+2 1.E+3
curr
ent,
A
time, sec
T22 68uF 50V after 1000TC -55 +125C at 22C 50V
0.E+0
5.E-6
1.E-5
2.E-5
2.E-5
3.E-5
3.E-5
0 20 40 60 80 100
curr
ent,
A
time, hr
T22 68uF 50V after 1000TC -55 +125C at 145C 50V
SN4
0.0E+0
2.0E-6
4.0E-6
6.0E-6
8.0E-6
1.0E-5
1.2E-5
1.4E-5
1.6E-5
1.8E-5
0 20 40 60 80 100
curr
ent,
A
time, hr
T22 68uF 50V after 1000TC -55 +125C at 165C 50V