evaluation of portland cement concrete pavement … of portland cement concrete pavement with high...
TRANSCRIPT

June 2009Keith W. AndersonJeff S. UhlmeyerKurt WilliamsMark RussellJim Weston
WA-RD 728.1
Office of Research & Library Services
WSDOT Research Report
Evaluation of Portland Cement Concrete Pavement with High Slag Content Cement

Experimental Feature Report __________________________________________________________
Post-Construction and Performance Report Experimental Feature 07-03
Evaluation of Portland Cement Concrete Pavement With High Slag Content Cement Contract 7064 SR-543 I-5 To International Boundary Widening MP 0.20 to MP 1.09
Experimental Feature Report __________________________________________________________
1. REPORT NO. 2. GOVERNMENT ACCESSION NO. 3. RECIPIENT'S CATALOG NO.
WA-RD 728.1
4. TITLE AND SUBTITLE 5. REPORT DATE
Evaluation of Portland Cement Concrete Pavement With High Slag Content Cement
June 2009
6. PERFORMING ORGANIZATION CODE WA 07-03 7. AUTHOR(S) 8. PERFORMING ORGANIZATION REPORT NO.
Keith W. Anderson, Jeff S. Uhlmeyer, Kurt Williams, Mark Russell, and Jim Weston
. PERFORMING ORGANIZATION NAME AND ADDRESS 10. WORK UNIT NO.
Washington State Department of Transportation Materials Laboratory, MS-47365 11. CONTRACT OR GRANT NO.
Olympia, WA 98504-7365 12. SPONSORING AGENCY NAME AND ADDRESS 13. TYPE OF REPORT AND PERIOD COVERED
Washington State Department of Transportation Transportation Building, MS 47372
Post-Construction and Performance Report
Olympia, Washington 98504-7372 14. SPONSORING AGENCY CODE
Project Manager: Kim Willoughby, 360-705-7978 15. SUPPLEMENTARY NOTES
This study was conducted in cooperation with the U.S. Department of Transportation, Federal Highway Administration. 16. ABSTRACT
The performance of a section of concrete pavement built with 30 percent Ground Granulated Blast Furnace
Slag (GGBFS) is compared to a control section of concrete pavement built with 25 percent GGBFS to determine if the higher slag content pavement is more resistant to wear from studded tires. This report details the construction of the pavement, construction quality control tests, and initial base line wear, friction, and smoothness results.
17. KEY WORDS 18. DISTRIBUTION STATEMENT
Ground Granulated Blast Furnace Slag, GGBFS, concrete performance, studded tires
No restrictions. This document is available to the public through the National Technical Information Service, Springfield, VA 22616
19. SECURITY CLASSIF. (of this report) 20. SECURITY CLASSIF. (of this page) 21. NO. OF PAGES 22. PRICE
None None 34
June 2009 ii

Experimental Feature Report __________________________________________________________
DISCLAIMER
The contents of this report reflect the views of the authors, who are responsible for the
facts and the accuracy of the data presented herein. The contents do not necessarily reflect the
official views or policies of the Washington State Department of Transportation or the Federal
Highway Administration. This report does not constitute a standard, specification, or regulation.
June 2009 iii

Experimental Feature Report __________________________________________________________
TABLE OF CONTENTS
Introduction..................................................................................................................................... 1 Background..................................................................................................................................... 1 Properties of Concrete with Slag Cement....................................................................................... 1 Project Description.......................................................................................................................... 2 Construction.................................................................................................................................... 2 Construction Problems.................................................................................................................... 5 Test Section..................................................................................................................................... 5 Construction Test Results ............................................................................................................... 7 Post-Construction Test Results ..................................................................................................... 10 Evaluation Plan ............................................................................................................................. 11 Bibliography ................................................................................................................................. 11 Appendix A................................................................................................................................... 12 Appendix B ................................................................................................................................... 23 Appendix C ................................................................................................................................... 25
LIST OF FIGURES Figure 1. Project vicinity map........................................................................................................ 2 Figure 2. Project lane configuration and test section location. ...................................................... 6 Figure 3. Strength versus time for 30 percent slag mix. .............................................................. 10
LIST OF TABLES
Table 1. Mix design SS6012P25 with 25 percent slag cement...................................................... 3 Table 2. Mix design SS6012P30 with 30 percent slag cement...................................................... 3 Table 3. Mix design SSP012635 with 35 percent slag cement...................................................... 4 Table 4. Mix design SS80124P24, 24 hour mix. ........................................................................... 4 Table 5. Mix design SS7014P48, 48 hour mix. ............................................................................. 5 Table 6. Compressive and flexural strengths for mix design SS6012P25 cylinders. .................... 7 Table 7. Compressive and flexural strengths for mix design SS6012P30 cylinders. .................... 8 Table 8. Compressive and flexural strengths for mix design SS80124P24 cylinders. .................. 8 Table 9. Compressive and flexural strengths for mix design SS7014P48 cylinders. .................... 9 Table 10. Compressive strengths for 30 percent slag mix design cylinders with time.................. 9 Table 11. Average wear, ride and friction results for April 2009................................................ 10
June 2009 iv
Experimental Feature Report __________________________________________________________
Introduction This experimental feature will investigate the performance of high slag mixes and their
affect on the pavements ability to resist studded tire wear. Concrete mixes with higher slag
content produce higher strength pavements which may be more resistant to studded tire damage.
Class F fly ash has been used by WSDOT for many years in portland cement concrete
pavement. WSDOT has experienced shortages of fly ash at various times when the main
supplier in Washington State, the TransAlta coal fired power plant in Centralia, shuts down in
the spring due to hydroelectric power being cheaper than power produced by coal. Ground
Granulated Blast Furnace Slag (GGBFS) is being imported into Washington State and can be
substitute for portland cement because it has cementitious properties just like fly ash.
Background GGBFS is a by-product of iron manufacturing. Slag is what is left after the molten iron is
poured out of a blast furnace. The slag is formed from a combination of the limestone and/or
dolomite that is used as a flux in the making of iron, the siliceous and aluminous residues from
the iron ore and the coke ash. Slag with cementitious properties is made by rapidly cooling the
molten slag to produce granules with a high content of glass. These granules are dried and
ground to produce a cememtitious material.
Properties of Concrete with Slag Cement Concrete with slag cement will have a slower rate of strength gain than concrete made
with 100 percent portland cement; however, the later age strength of slag cement are comparable
too or higher than same concrete with all hydraulic cement. The optimum amount of slag to
achieve the highest strength development appears to be between 40 and 60 percent (Richardson,
2006). While other sources note the optimum blend of GGBFS and portland cement that
produces the greatest 28 day compressive strength to be between 40 and 70 percent, this
proportion is dependent on the grade of slag used (ACI 233R-03). As the replacement level of
slag increases the 28 day compressive strength of concrete generally increases, up to
approximately 50 percent slag as a percent of the cementitious materials (SCA No. 14, 2003).
Scaling can be a problem when higher percentages of slag cement are used in paving concrete
June 2009 1
Experimental Feature Report __________________________________________________________
mixes, however, at the 35 percent level used on this project, there are no problems reported in the
literature.
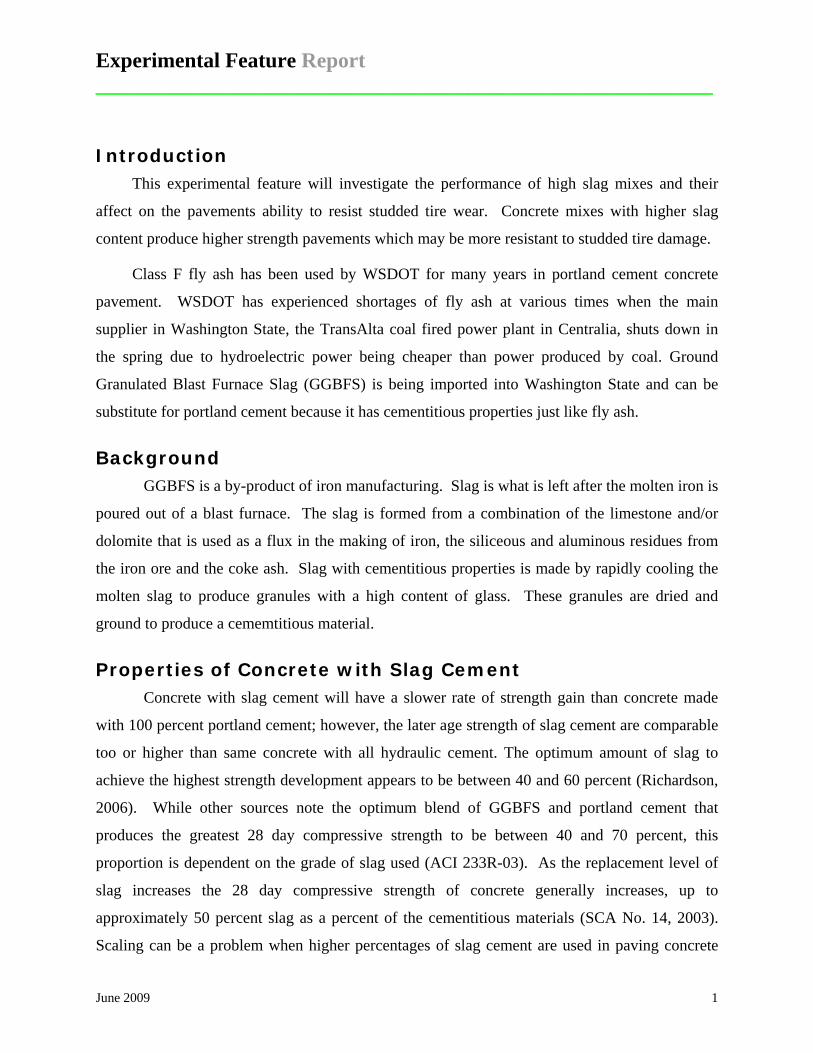
Project Description Contract 7064, SR 543, I-5 to International Boundary Widening and Border Crossing
Improvements, is located at the northern limits of I-5 near the Canadian border as shown in
Figure 1. The project converted the existing two lane facility into a four lane roadway to provide
a separate truck route to address congestion and safety issues on SR 543. In addition, a new
interchange at "D" Street was constructed. The total length of the project is 0.89 miles.
Figure 1. Project vicinity map.
Construction Construction of the concrete pavement began on June 13 and was completed on October
19, 2007. Four mix designs were used, one with 25 percent slag cement, one with 30 percent
June 2009 2
Experimental Feature Report __________________________________________________________
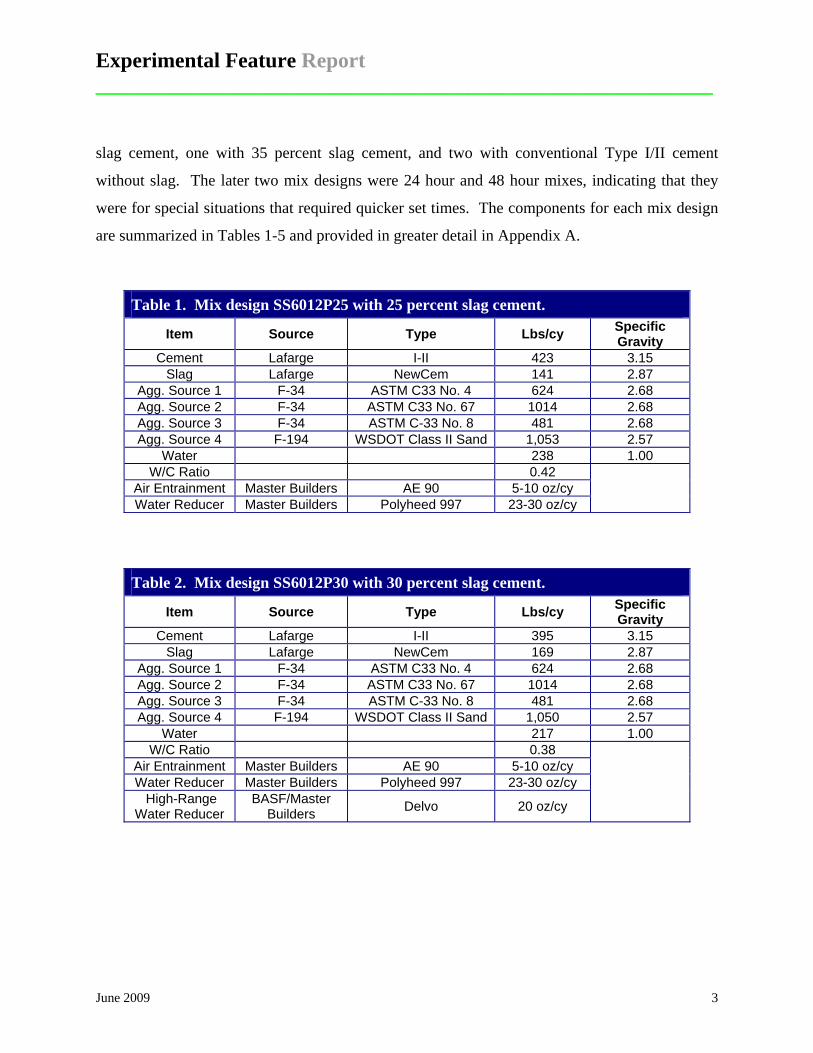
slag cement, one with 35 percent slag cement, and two with conventional Type I/II cement
without slag. The later two mix designs were 24 hour and 48 hour mixes, indicating that they
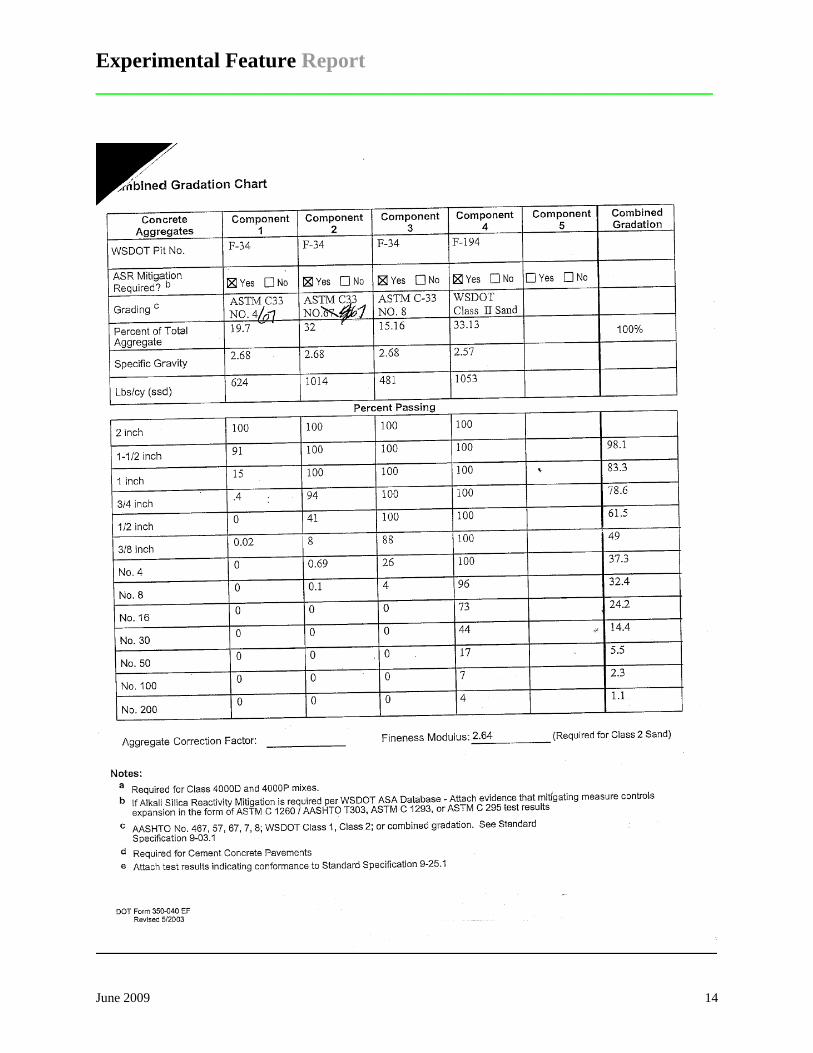
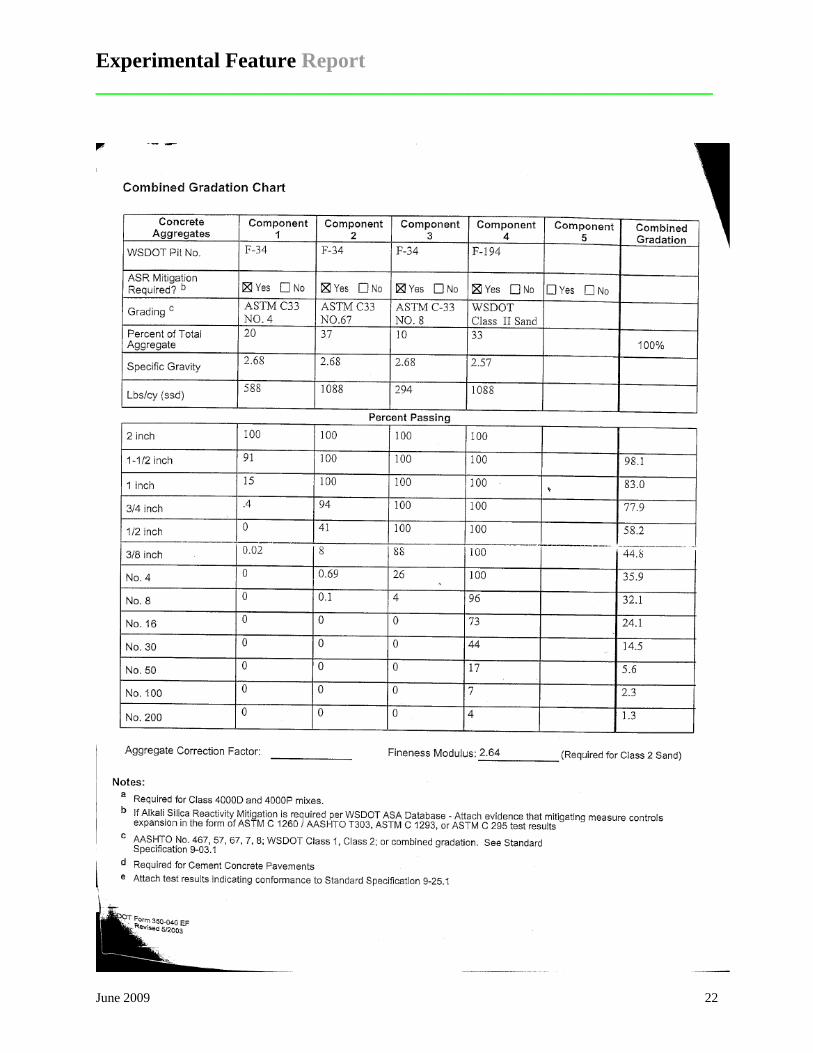
were for special situations that required quicker set times. The components for each mix design
are summarized in Tables 1-5 and provided in greater detail in Appendix A.
Table 1. Mix design SS6012P25 with 25 percent slag cement.
Item Source Type Lbs/cy Specific Gravity
Cement Lafarge I-II 423 3.15 Slag Lafarge NewCem 141 2.87
Agg. Source 1 F-34 ASTM C33 No. 4 624 2.68 Agg. Source 2 F-34 ASTM C33 No. 67 1014 2.68 Agg. Source 3 F-34 ASTM C-33 No. 8 481 2.68 Agg. Source 4 F-194 WSDOT Class II Sand 1,053 2.57
Water 238 1.00 W/C Ratio 0.42
Air Entrainment Master Builders AE 90 5-10 oz/cy Water Reducer Master Builders Polyheed 997 23-30 oz/cy
Table 2. Mix design SS6012P30 with 30 percent slag cement.
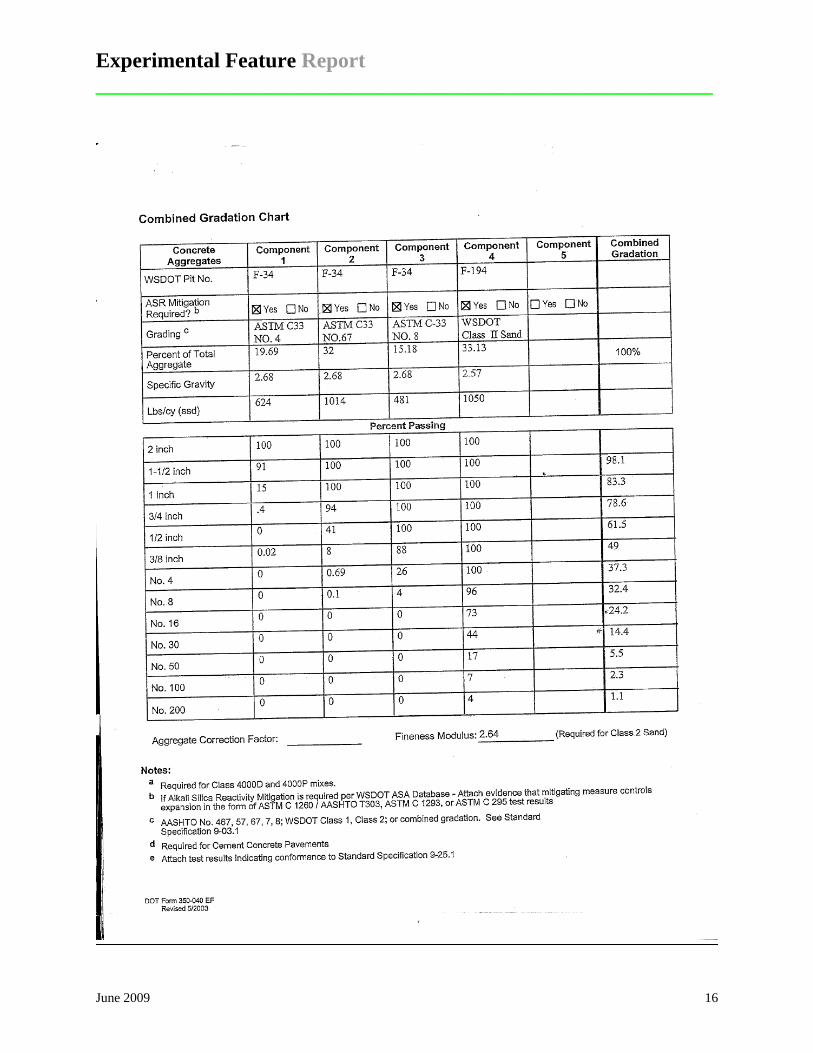
Item Source Type Lbs/cy Specific Gravity
Cement Lafarge I-II 395 3.15 Slag Lafarge NewCem 169 2.87
Agg. Source 1 F-34 ASTM C33 No. 4 624 2.68 Agg. Source 2 F-34 ASTM C33 No. 67 1014 2.68 Agg. Source 3 F-34 ASTM C-33 No. 8 481 2.68 Agg. Source 4 F-194 WSDOT Class II Sand 1,050 2.57
Water 217 1.00 W/C Ratio 0.38
Air Entrainment Master Builders AE 90 5-10 oz/cy Water Reducer Master Builders Polyheed 997 23-30 oz/cy High-Range
Water Reducer BASF/Master
Builders Delvo 20 oz/cy
June 2009 3

Experimental Feature Report __________________________________________________________
Table 3. Mix design SSP012635 with 35 percent slag cement.
Item Source Type Lbs/cy Specific Gravity
Cement Lafarge I-II 369 3.15 Slag Lafarge NewCem 195 2.87
Agg. Source 1 F-34 ASTM C33 No. 4 624 2.68 Agg. Source 2 F-34 ASTM C33 No. 67 1014 2.68 Agg. Source 3 F-34 ASTM C-33 No. 8 481 2.68 Agg. Source 4 F-194 WSDOT Class II Sand 1,048 2.57
Water 217 1.00 W/C Ratio 0.38
Air Entrainment Master Builders AE-90 5-10 oz/cy Water Reducer Master Builders Polyheed 997 23-30 oz/cy
The 25, 30 and 35 percent slag mix designs were similar except for the higher quantities
of slag and lower quantities of water and resultant lower water/cement ratios in the 30 and 35
percent mixes. The 30 percent mix also used a high-range water reducer not used in either of the
25 or 35 percent slag mixes.
Table 4. Mix design SS80124P24, 24 hour mix.
Item Source Type Lbs/cy Specific Gravity
Cement Lafarge I-II 752 3.15 Agg. Source 1 F-34 ASTM C33 No. 4 588 2.68 Agg. Source 2 F-34 ASTM C33 No. 67 1088 2.68 Agg. Source 3 F-34 ASTM C-33 No. 8 294 2.68 Agg. Source 4 F-194 WSDOT Class II Sand 1088 2.57
Water 263 1.00 W/C Ratio 0.35
Air Entrainment Master Builders AE 90 5-10 oz/cy High-Range
Water Reducer Master Builders Glenuim 3030 NS 15-60 oz/cy
June 2009 4

Experimental Feature Report __________________________________________________________
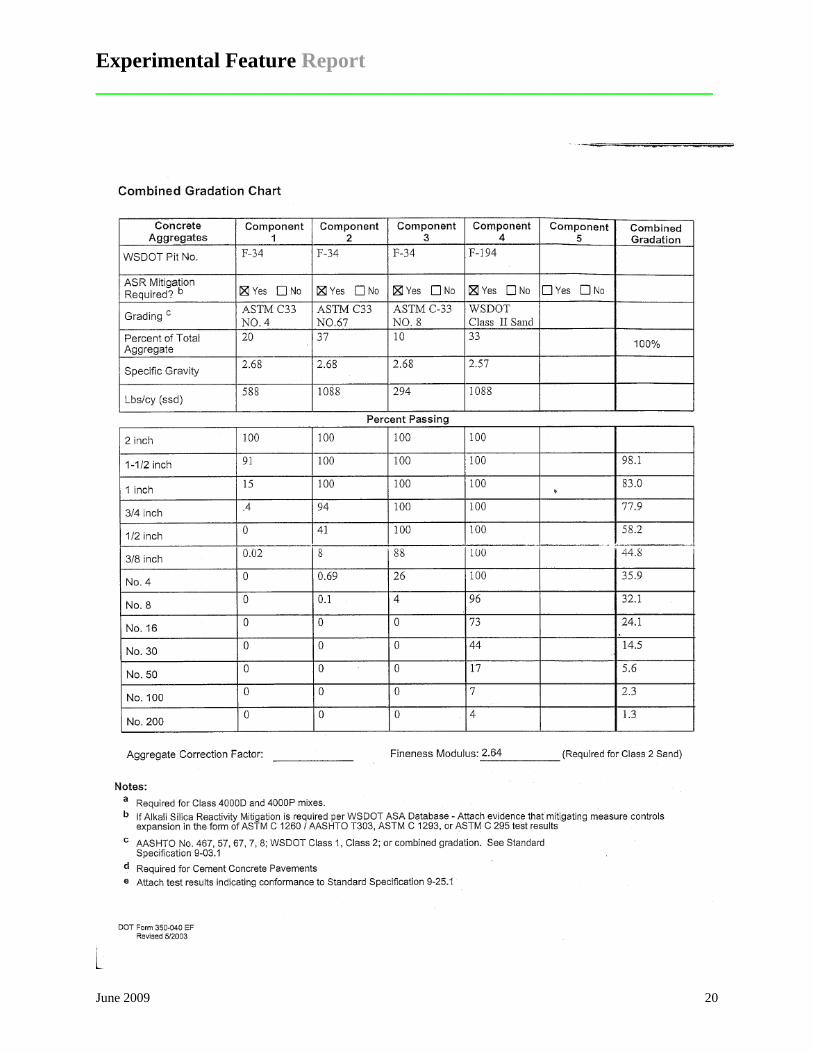
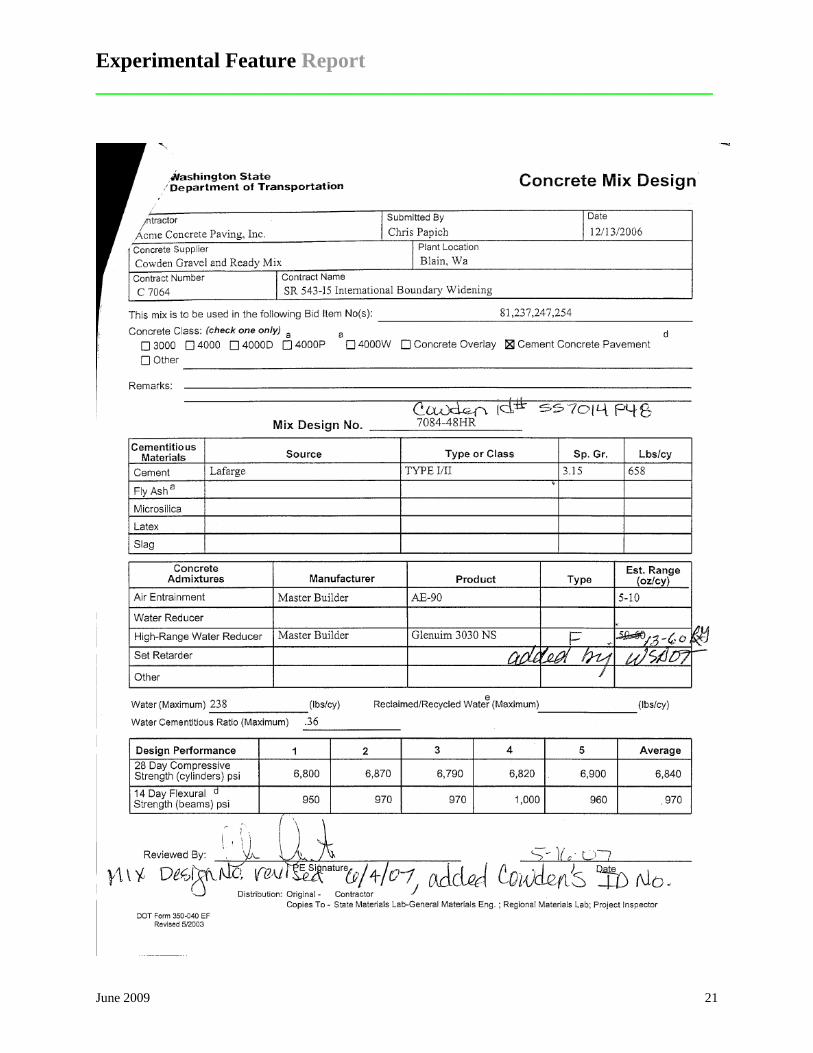
Table 5. Mix design SS7014P48, 48 hour mix.
Item Source Type Lbs/cy Specific Gravity
Cement Lafarge I-II 658 3.15 Agg. Source 1 F-34 ASTM C33 No. 4 588 2.68 Agg. Source 2 F-34 ASTM C33 No. 67 1088 2.68 Agg. Source 3 F-34 ASTM C-33 No. 8 294 2.68 Agg. Source 4 F-194 WSDOT Class II Sand 1088 2.57
Water 238 1.00 W/C Ratio 0.36
Air Entrainment Master Builders AE 90 5-10 oz/cy High-Range
Water Reducer Master Builders Glenuim 3030 NS 13-60 oz/cy
The two fast setting mix designs were also very similar with the only differences in the
quantity of cement and the water/cement ratio.
Construction Problems There were significant problems with the mix delivered to the job site to the extent that
the project engineer recommended that the planned use of 35 percent slag content cement be
abandoned (see Appendix B). The problems with the concrete mix delivered appear to be most
attributed to the contractors delivery method of utilizing an off site concrete batch plant with
concrete mixer trucks with a one way delivery time of approximately one hour. As a result the
there were several instances when the concrete began to take a set prior to being processed
through the paver. The variability of the compressive strength test results for the 25 percent slag
mix design noted in the section that follows corroborates this observation.
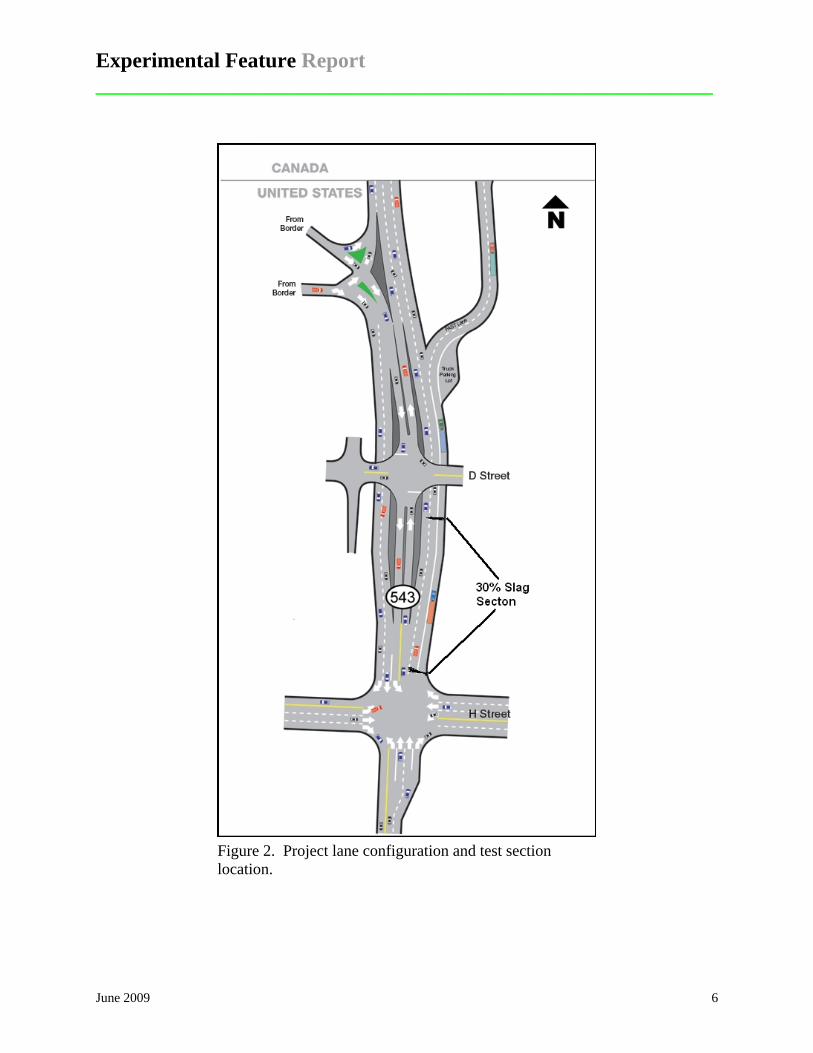
Test Section The test section of 30 % slag runs from Milepost 0.57 to Milepost 0.77 in the northbound
outside lane and truck lane as shown on the map in Figure 2. The truck lane is the outside lane
that exits to the right after the D Street Overcrossing. The remainder of the mainline paving used
the 25% slag mix design.
June 2009 5
Experimental Feature Report __________________________________________________________
Figure 2. Project lane configuration and test section location.
June 2009 6
Experimental Feature Report __________________________________________________________
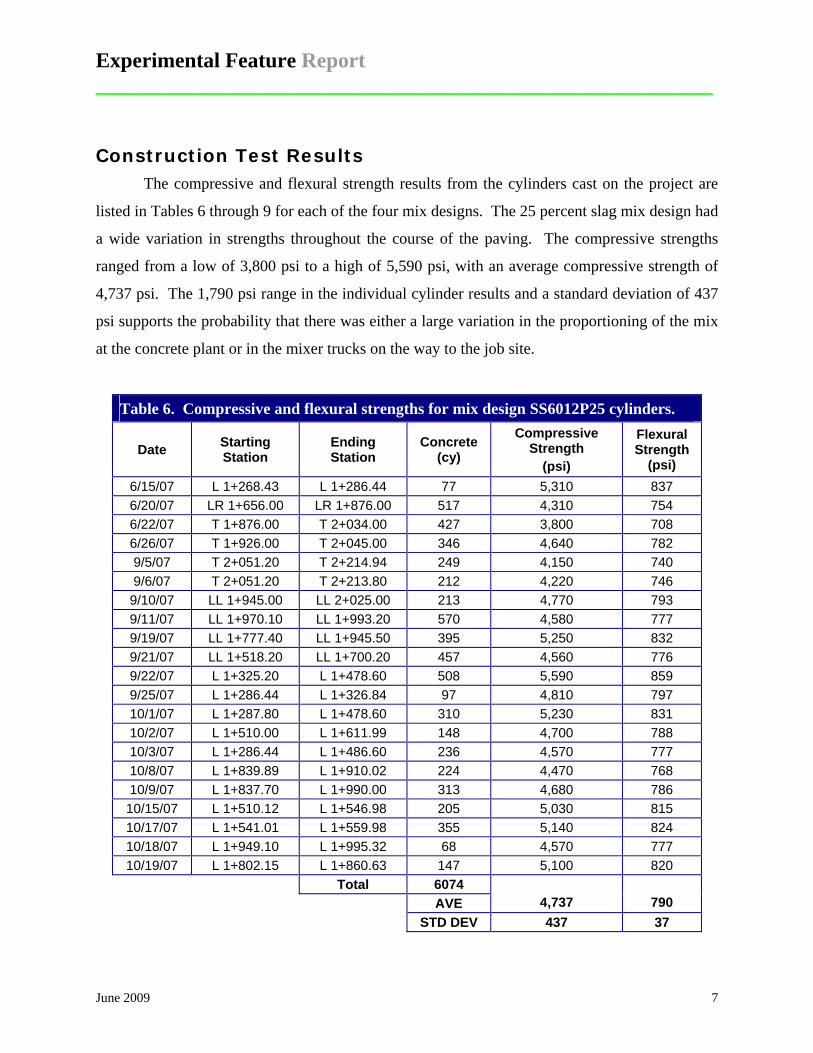
Construction Test Results The compressive and flexural strength results from the cylinders cast on the project are
listed in Tables 6 through 9 for each of the four mix designs. The 25 percent slag mix design had
a wide variation in strengths throughout the course of the paving. The compressive strengths
ranged from a low of 3,800 psi to a high of 5,590 psi, with an average compressive strength of
4,737 psi. The 1,790 psi range in the individual cylinder results and a standard deviation of 437
psi supports the probability that there was either a large variation in the proportioning of the mix
at the concrete plant or in the mixer trucks on the way to the job site.
Table 6. Compressive and flexural strengths for mix design SS6012P25 cylinders.
Date Starting Station
Ending Station
Concrete (cy)
Compressive Strength
(psi)
Flexural Strength
(psi) 6/15/07 L 1+268.43 L 1+286.44 77 5,310 837 6/20/07 LR 1+656.00 LR 1+876.00 517 4,310 754 6/22/07 T 1+876.00 T 2+034.00 427 3,800 708 6/26/07 T 1+926.00 T 2+045.00 346 4,640 782 9/5/07 T 2+051.20 T 2+214.94 249 4,150 740 9/6/07 T 2+051.20 T 2+213.80 212 4,220 746
9/10/07 LL 1+945.00 LL 2+025.00 213 4,770 793 9/11/07 LL 1+970.10 LL 1+993.20 570 4,580 777 9/19/07 LL 1+777.40 LL 1+945.50 395 5,250 832 9/21/07 LL 1+518.20 LL 1+700.20 457 4,560 776 9/22/07 L 1+325.20 L 1+478.60 508 5,590 859 9/25/07 L 1+286.44 L 1+326.84 97 4,810 797 10/1/07 L 1+287.80 L 1+478.60 310 5,230 831 10/2/07 L 1+510.00 L 1+611.99 148 4,700 788 10/3/07 L 1+286.44 L 1+486.60 236 4,570 777 10/8/07 L 1+839.89 L 1+910.02 224 4,470 768 10/9/07 L 1+837.70 L 1+990.00 313 4,680 786 10/15/07 L 1+510.12 L 1+546.98 205 5,030 815 10/17/07 L 1+541.01 L 1+559.98 355 5,140 824 10/18/07 L 1+949.10 L 1+995.32 68 4,570 777 10/19/07 L 1+802.15 L 1+860.63 147 5,100 820
Total 6074 AVE 4,737 790
STD DEV 437 37
June 2009 7

Experimental Feature Report __________________________________________________________
The 30 percent slag mix had a 240 psi range in compressive strength values with a low of
4,910 psi and a high of 5,150 psi and an average of 5,040 psi. The standard deviation of 110 psi
was the lowest of the four mix designs used and indicates that the concrete supplier may have
been more careful with this mix because of its experimental nature.
Table 7. Compressive and flexural strengths for mix design SS6012P30 cylinders.
Date Starting Station
Ending Station
Concrete (cy)
Compressive Strength
(psi)
Flexural Strength
(psi) 6/19/07 L 1+286.44 L 1+406.00 4,990 741 6/19/07 LR 1+406.00 LR 1+538.00 5,150 753 6/19/07 LR 1+538.00 LR 1+ 656.00 873 4,910 735 6/19/07 5,110 750
Total 873 AVE 5,040 745
STD DEV 110 8 The 24 and 48 hour mixes followed the pattern of the 25 percent slag mix with a lot of
variability in the compressive strengths and moderate to high standard deviations.
Table 8. Compressive and flexural strengths for mix design SS80124P24 cylinders.
Date Starting Station
Ending Station
Concrete (cy)
Compressive Strength
(psi)
Flexural Strength
(psi) 9/12/07 L 1+255+80 L 1+275.64 51 6,680 991 9/13/07 L 1+ 255.80 L1+261.40 67 6,610 986 9/14/07 L 1+264.80 L 1+291.80 80 7,680 1062 10/4/07 I/S H Street & SR 543 149 7,870 1075 10/5/07 L 1+247.83 L 1+250.21 48 7,550 1053 10/12/07 L 1+231.12 L 1+247.09 42 6,920 1008
Total 437 Average 7,218 1029 STD DEV 547 39
June 2009 8

Experimental Feature Report __________________________________________________________
Table 9. Compressive and flexural strengths for mix design SS7014P48 cylinders.
Date Starting Station
Ending Station
Concrete (cy)
Compressive Strength
(psi)
Flexural Strength
(psi) 9/20/07 LL 1+692.10 LL 1+778.90 289 6,470 943 10/10/07 50 6,640 956 10/11/07 H 1+232.55 H 1+245.90 143 7,050 985
Total 482 Average 6,720 961 STD DEV 298 22
Additional cylinders were cast and broken at 2, 5, 14, 28, 180 and 365 days to provide an
idea of the progressive strength gain of the 30 percent slag mix (Table 10). The strength versus
time graph (Figure 3) shows that the mix gains most of its strength by 28 days. The same test
series was not done for the 25 percent mix, therefore, the difference in strength gain for the two
mixes could be not observed.
Table 10. Compressive strengths for 30 percent slag mix design cylinders with time.
Test Date Compressive Strength (psi)
2 day 2580 6 day 3380
14 days 4140 28 days 5110 180 days 5330
1 year 5780
June 2009 9

Experimental Feature Report __________________________________________________________
Strength Versus Time for 30 Percent Slag Mix
0
1000
2000
3000
4000
5000
6000
7000
0 50 100 150 200 250 300 350 400
Time (days)
Com
pres
sive
Str
engt
h (p
si)
Figure 3. Strength versus time for 30 percent slag mix.
Post-Construction Test Results Wear and ride measurements on the 30 percent slag and control sections were conducted
on April 21, 2009 with results summarized in Table 11. Friction measurements made on April
22, 2009 are also summarized in Table 11.
Table 11. Average wear, ride and friction results for April 2009.
Section Direction Lane Wear (mm)
Ride (IRI)
Friction (FN)
30% Slag NB 1 2.4 93 50.5 Control NB 1 2.5 180 53.8 Control NB 2 3.0 148 52.9 Control SB 1 2.7 106 50.5 Control SB 2 3.0 117 41.5
June 2009 10
Experimental Feature Report __________________________________________________________
The wear measurements seem a bit high for a new pavement and the ride measurements
are definitely high, especially Lanes 1 and 2 of the northbound control section. The high ride
measurements correlate with the problems cited during construction with the consistency and
workability of the mix. The friction measurements are excellent with only the SB Lane 2 being
slightly on the low side for a new pavement.
Evaluation Plan The experimental feature work plan (Appendix C) for this project calls for wear, ride, and
friction testing for five years on a twice yearly basis in the spring and fall to bracket the season
when studded tires are legal. Pavement condition will be monitored on a yearly basis using data
from the Washington State Pavement Management System (WSPMS). The lane configuration of
the finished project is shown in Figure 2.
Bibliography Richardson, David N, “Strength and Durability Characteristics of a 70% Ground Granulated
Blast Furnace Slag (GGBFS) Concrete Mix,” Missouri Transportation Institute and Missouri Department of Transportation, Report No. OR06-008, February 2006. http://168.166.124.22/RDT/reports/Ri99035/or06008.pdf
American Concrete Pavement Association (ACPA), (2003), R&T Update – Concrete pavement
Research & Technology – Slag Cement and Concrete Pavements, American Concrete Pavement Association, 5420 Old Orchard Rd. Suite A100, Skokie, IL 60077 Website: www.pavement.com Retrieved on October 11, 2007, from http://www.pavement.com/Downloads/RT/RT4.03.pdf
Slag Cement Association (SCA No. 14), (2003), COMPRESSIVE AND
FLEXURAL STRENGTH – Slag Cement in Concrete No. 14, Slag Cement Association 14090 Southwest Freeway Suite 300, Sugar Land, TX 77478, Retrieved September 27, 2007, from http://www.slagcement.org/image/123800_c_sU128801_s_i185541/No14_Compress_Strength.pdf
June 2009 11

Experimental Feature Report __________________________________________________________
Appendix A
Mix Designs
June 2009 12

Experimental Feature Report __________________________________________________________
June 2009 13
Experimental Feature Report __________________________________________________________
June 2009 14

Experimental Feature Report __________________________________________________________
June 2009 15
Experimental Feature Report __________________________________________________________
June 2009 16

Experimental Feature Report __________________________________________________________
June 2009 17

Experimental Feature Report __________________________________________________________
June 2009 18

Experimental Feature Report __________________________________________________________
June 2009 19
Experimental Feature Report __________________________________________________________
June 2009 20
Experimental Feature Report __________________________________________________________
June 2009 21
Experimental Feature Report __________________________________________________________
June 2009 22

Experimental Feature Report __________________________________________________________
Appendix B
Project Engineer E-Mail
June 2009 23

Experimental Feature Report __________________________________________________________
E-mail was reproduced exactly from the original.
Damitio, Chris
From: Damitio, Chris
Sent: Thursday, June 21, 2007 1:33 PM
To: Williams, Kurt R; Foster, Marco
Cc: Fuller, Patrick
Subject: Slag-SR543
Kurt,
We got the ride numbers back on the sections we paved the first couple of days and they are horrible. We haven’t run the $’s yet but one section was at 3” per .1 mile with .7 being the standard. Overall I found he mud to be extremely stiff and at the slower production rates we were seeing I think it was setting up prior to going through the paver. Granted I think we had the “B” team and equipment from Acme here it was a common observation from both the Acme and DOT team that the mud was “hot”. I think another factor may be Cowden as the supplier. In my view they have shown a lack of detail in QC and this may have lead to inconsistencies or properties that were unexpected. Appearance wise the pavement looks good and the only cracking evident at this time is at the joints but the workability is a big question in my mind. I would like to recommend we skip the 35% test section unless Acme can show us how the ride is going to improve. I am concerned that the added slag may be creating a workability challenge that is difficult to react to unless all suppliers, pavers, personnel and equipment are at the top of their game. CHRIS 788-7403
June 2009 24

Experimental Feature Report __________________________________________________________
Appendix C
Experimental Feature Work Plan
June 2009 25

Experimental Feature Report __________________________________________________________
Washington State Department of Transportation
WORK PLAN
Use of Higher Slag Content in Concrete Pavements
SR-543, I-5 to International Boundary Widening Contract 7064
Milepost 0.20 to Milepost 1.09
Prepared by
Kurt Williams, P.E. Assistant Construction Engineer, Roadway
Washington State Department of Transportation
Jeff Uhlmeyer, P.E. Pavement Design Engineer
Washington State Department of Transportation
June 2009 26
Experimental Feature Report __________________________________________________________
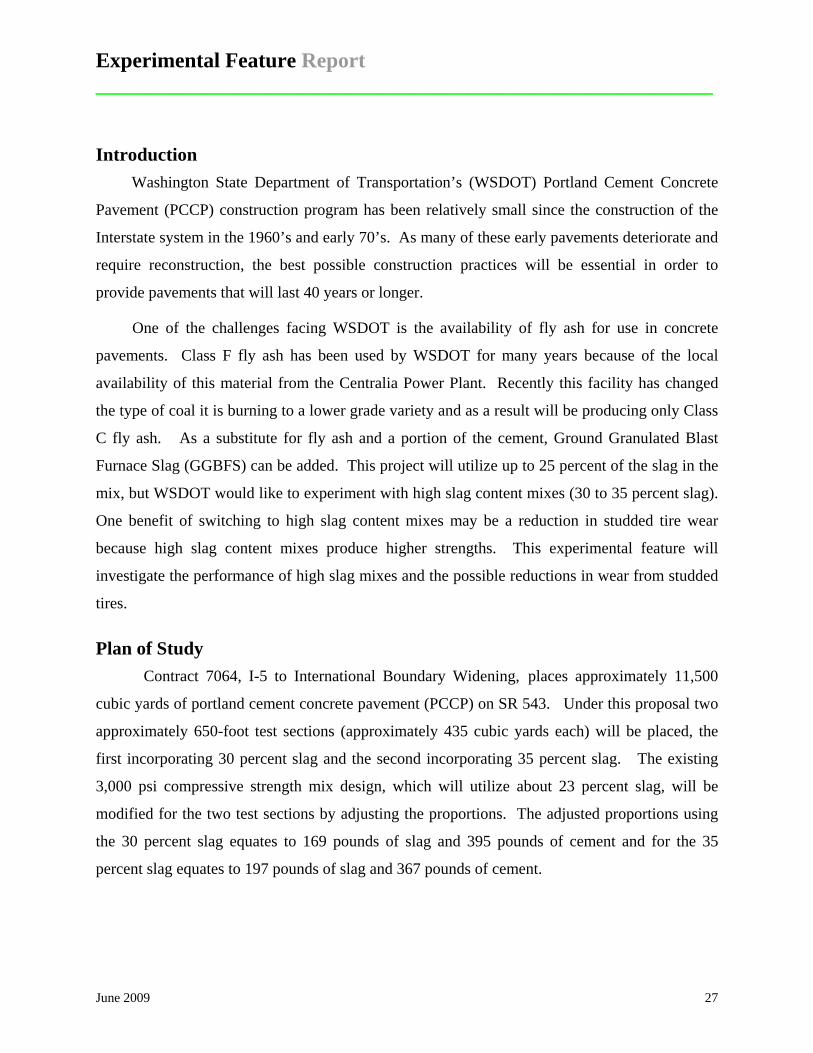
Introduction Washington State Department of Transportation’s (WSDOT) Portland Cement Concrete
Pavement (PCCP) construction program has been relatively small since the construction of the
Interstate system in the 1960’s and early 70’s. As many of these early pavements deteriorate and
require reconstruction, the best possible construction practices will be essential in order to
provide pavements that will last 40 years or longer.
One of the challenges facing WSDOT is the availability of fly ash for use in concrete
pavements. Class F fly ash has been used by WSDOT for many years because of the local
availability of this material from the Centralia Power Plant. Recently this facility has changed
the type of coal it is burning to a lower grade variety and as a result will be producing only Class
C fly ash. As a substitute for fly ash and a portion of the cement, Ground Granulated Blast
Furnace Slag (GGBFS) can be added. This project will utilize up to 25 percent of the slag in the
mix, but WSDOT would like to experiment with high slag content mixes (30 to 35 percent slag).
One benefit of switching to high slag content mixes may be a reduction in studded tire wear
because high slag content mixes produce higher strengths. This experimental feature will
investigate the performance of high slag mixes and the possible reductions in wear from studded
tires.
Plan of Study Contract 7064, I-5 to International Boundary Widening, places approximately 11,500
cubic yards of portland cement concrete pavement (PCCP) on SR 543. Under this proposal two
approximately 650-foot test sections (approximately 435 cubic yards each) will be placed, the
first incorporating 30 percent slag and the second incorporating 35 percent slag. The existing
3,000 psi compressive strength mix design, which will utilize about 23 percent slag, will be
modified for the two test sections by adjusting the proportions. The adjusted proportions using
the 30 percent slag equates to 169 pounds of slag and 395 pounds of cement and for the 35
percent slag equates to 197 pounds of slag and 367 pounds of cement.
June 2009 27
Experimental Feature Report __________________________________________________________
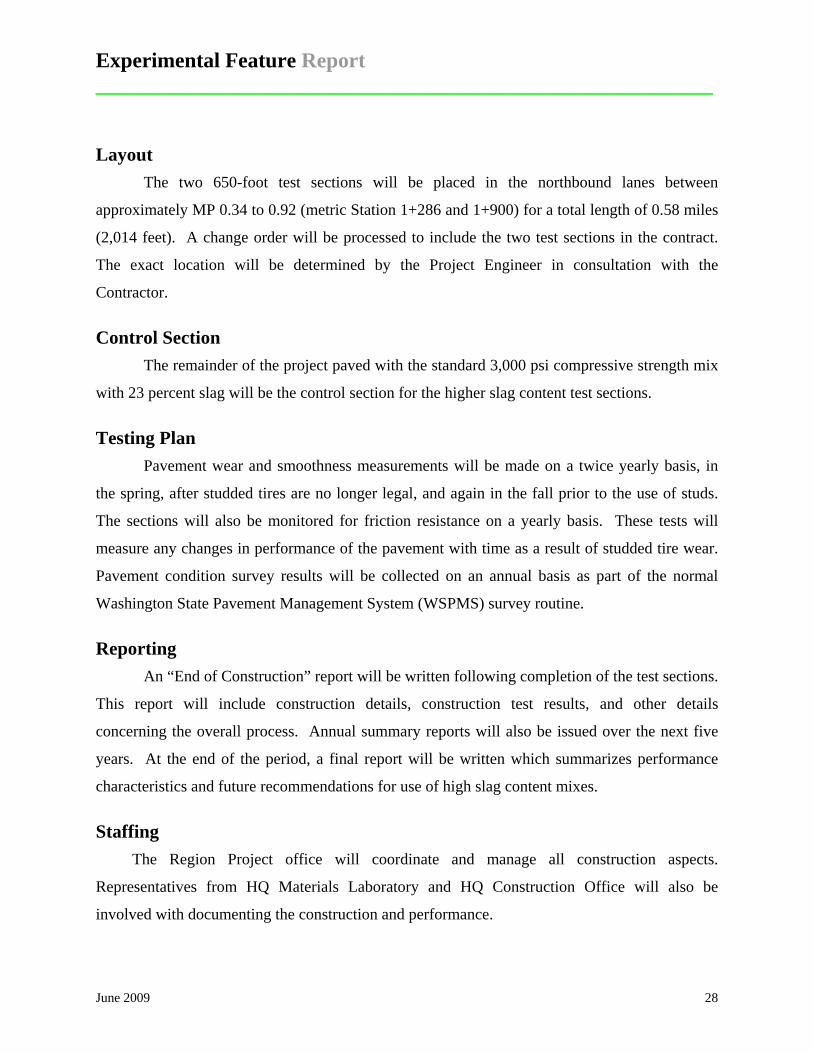
Layout The two 650-foot test sections will be placed in the northbound lanes between
approximately MP 0.34 to 0.92 (metric Station 1+286 and 1+900) for a total length of 0.58 miles
(2,014 feet). A change order will be processed to include the two test sections in the contract.
The exact location will be determined by the Project Engineer in consultation with the
Contractor.
Control Section The remainder of the project paved with the standard 3,000 psi compressive strength mix
with 23 percent slag will be the control section for the higher slag content test sections.
Testing Plan Pavement wear and smoothness measurements will be made on a twice yearly basis, in
the spring, after studded tires are no longer legal, and again in the fall prior to the use of studs.
The sections will also be monitored for friction resistance on a yearly basis. These tests will
measure any changes in performance of the pavement with time as a result of studded tire wear.
Pavement condition survey results will be collected on an annual basis as part of the normal
Washington State Pavement Management System (WSPMS) survey routine.
Reporting An “End of Construction” report will be written following completion of the test sections.
This report will include construction details, construction test results, and other details
concerning the overall process. Annual summary reports will also be issued over the next five
years. At the end of the period, a final report will be written which summarizes performance
characteristics and future recommendations for use of high slag content mixes.
Staffing The Region Project office will coordinate and manage all construction aspects.
Representatives from HQ Materials Laboratory and HQ Construction Office will also be
involved with documenting the construction and performance.
June 2009 28
Experimental Feature Report __________________________________________________________
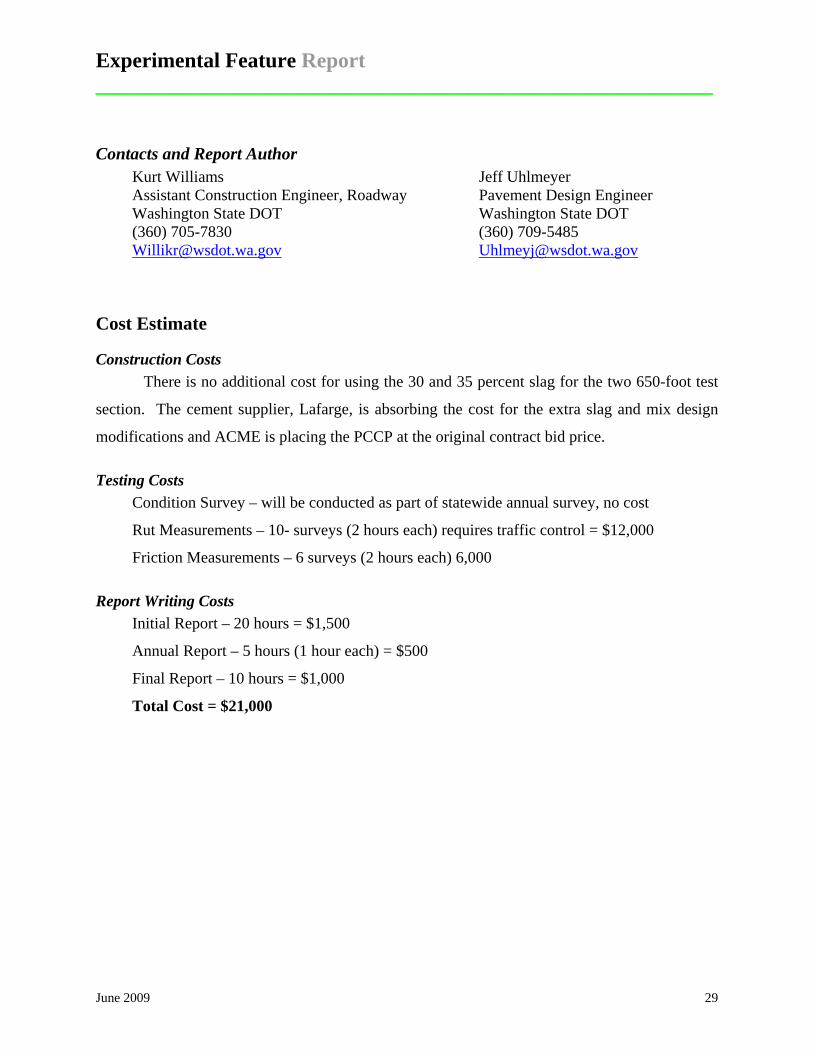
Contacts and Report Author Kurt Williams Jeff Uhlmeyer Assistant Construction Engineer, Roadway Pavement Design Engineer Washington State DOT Washington State DOT (360) 705-7830 (360) 709-5485 [email protected] [email protected]
Cost Estimate
Construction Costs There is no additional cost for using the 30 and 35 percent slag for the two 650-foot test
section. The cement supplier, Lafarge, is absorbing the cost for the extra slag and mix design
modifications and ACME is placing the PCCP at the original contract bid price.
Testing Costs Condition Survey – will be conducted as part of statewide annual survey, no cost
Rut Measurements – 10- surveys (2 hours each) requires traffic control = $12,000
Friction Measurements – 6 surveys (2 hours each) 6,000
Report Writing Costs Initial Report – 20 hours = $1,500
Annual Report – 5 hours (1 hour each) = $500
Final Report – 10 hours = $1,000
Total Cost = $21,000
June 2009 29
Experimental Feature Report __________________________________________________________
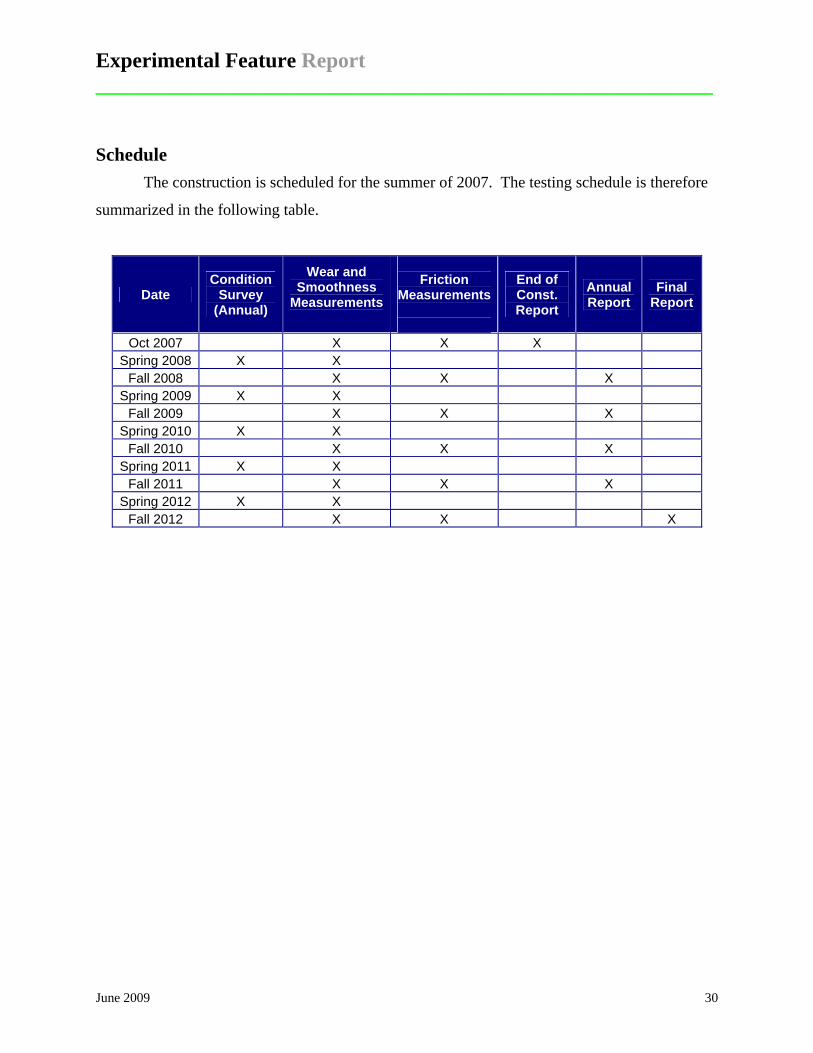
Schedule The construction is scheduled for the summer of 2007. The testing schedule is therefore
summarized in the following table.
Date Condition
Survey (Annual)
Wear and Smoothness
Measurements
Friction
Measurements
End of Const. Report
Annual Report
Final Report
Oct 2007 X X X Spring 2008 X X
Fall 2008 X X X Spring 2009 X X
Fall 2009 X X X Spring 2010 X X
Fall 2010 X X X Spring 2011 X X
Fall 2011 X X X Spring 2012 X X
Fall 2012 X X X
June 2009 30