evaluation of leaching protocols for testing of high ... · evaluation of leaching protocols for...
TRANSCRIPT
Evaluation of Leaching Protocols for Testing ofHigh-Carbon Coal Fly Ash–Soil Mixtures
Jason Becker1; Ahmet H. Aydilek, M.ASCE2; Allen P. Davis, F.ASCE3; and Eric A. Seagren, A.M.ASCE4
Abstract: Beneficial reuse of coal combustion byproducts, e.g., in highway construction, requires an evaluation of metal leaching potential.Metal leaching from high-carbon fly ash in soil mixes typical of highway embankment construction was evaluated using different soil-fly ashmixtures and three common leaching tests: the water leach test (WLT), the Toxicity Characteristic Leaching Procedure (TCLP), and thecolumn leach test (CLT). The effect of test methodology and pH on Cu, As, and Cr leaching was examined. TCLP concentrations forCu and As exceeded those from WLTs in the majority of mixtures due to lower pH conditions, while Cr was higher in the WLT for alkalinefly ash mixtures. Maximum CLT concentrations were higher than TCLP and WLT concentrations for the majority of mixtures, but usuallydecreased rapidly, suggesting that leachate concentrations might initially exceed regulatory limits, but only for a short time. A comparison ofleaching results is discussed as a framework for the development of a flexible, integrated leaching protocol incorporating elements of batchand column leach tests to provide more accurate, site-specific leaching predictions given time and cost constraints.DOI: 10.1061/(ASCE)EE.1943-7870.0000668. © 2013 American Society of Civil Engineers.
CE Database subject headings: Fly ash; Chromium; Copper; Arsenic; Coal; Soils; Mixtures; Recycling.
Author keywords: Leaching; Fly ash; Batch leach test; Column leach test; Chromium; Arsenic; Copper.
Introduction
More than 50% of the electricity demand in the United States is metfrom coal-fired power plants, which burn over 1 billion t of coalannually (Kim 2006). This generation of electricity results in theproduction of approximately 134 million t of coal combustionby-products (CCBs) that require proper handling and disposal orbeneficial reuse. Fly ashes, silt-sized nonplastic materials, comprise47% of CCBs. Recent changes in the U.S. Clean Air Act have re-sulted in the production of fly ashes with higher carbon contents,unsuitable for use as a concrete additive. As a result, approximately60% of these fly ashes are currently placed in landfills as a wasteproduct. There is a renewed emphasis on incorporating such flyashes into construction activities, such as the creation of highwayand roadway embankments. However, the risks of groundwatercontamination and related environmental harm need to be ad-dressed before beneficial reuse of high-carbon fly ash can becomewidespread.
Two major environmental concerns related to the reuse of fly ashare leaching of heavy metals and the consequences from pH excur-sions. Heavy metals and metalloids such as As, Cr, Cu, Pb, Se, Cd,
and Zn can be present in fly ash up to several hundred parts permillion (Bin Shafique et al. 2002; Ram et al. 2007; Shah et al.2008). Numerous fly ash leaching studies have been completed,and the general consensus is that both fly ash composition andpH have important effects on leaching behavior and resulting aque-ous metal speciation (Fytianos et al. 1998; Bin Shafique et al. 2006;Jegadessan et al. 2008; Jo et al. 2008; Morar et al. 2012).
Currently, the U.S. EPA and several state environmental agen-cies require that the CCBs be subjected to the EPA ToxicityCharacteristic Leaching Procedure (TCLP) to determine if thematerial can be used in field construction applications without con-cern for groundwater and surface water contamination. However,objections have been raised by various parties that the TCLP testingconditions are typically harsher than those encountered in the field,the test is not material specific, and it neither represents the actualleachate produced in the field nor simulates a site-specific transportcondition (Kosson et al. 2002; Baba and Kaya 2004; Ram et al.2007). Furthermore, the test method is used as a regulatory protocolto determine if a material is hazardous or not; however, more than20 years of research based on TCLP and column tests clearly showsthat CCBs are generally nonhazardous (Creek and Shackelford 1992;Kyper 1992; Chichester and Landsberger 1996; Edil 1998; Ghoshand Subbarao 1998; Qiao et al. 2006; Bin Shafique et al. 2006).
Clearly, there is a need to define the effect of testing conditionson leached metal concentrations and determine the most appropri-ate leaching test for evaluating the potential environmental impactsof CCB reuse. The test conditions must realistically predict leach-ing, but also be cost effective and timely (Kosson et al. 2002;Baba and Kaya 2004). In response to this need, a study was under-taken to compare the methodologies and leaching results of threeleaching tests commonly used today: the ASTM D3987 (ASTM2012a) water leach test (WLT), the TCLP, and the flow-throughcolumn leach test (CLT). The primary goal was to understandthe impact of different methodologies and test parameters on leach-ing behavior and provide a comparison between leachate metalconcentrations and applicable regulatory limits. The specific focus
1Staff Engineer, URS Corporation, Houston, TX; formerly, GraduateResearch Assistant, Dept. of Civil and Environmental Engineering, Univ.of Maryland, 1163 Glenn Martin Hall, College Park, MD 20742.
2Associate Professor, Dept. of Civil and Environmental Engineering,Univ. of Maryland, 1163 Glenn Martin Hall, College Park, MD 20742(corresponding author). E-mail: [email protected]
3Professor, Dept. of Civil and Environmental Engineering, Univ. ofMaryland, College Park, MD 20742.
4Associate Professor, Dept. of Civil and Environmental Engineering,Michigan Technological Univ., 1400 Townsend Dr., Houghton, MI 49931.
Note. This manuscript was submitted on January 5, 2012; approved onOctober 17, 2012; published online on October 18, 2012. Discussion periodopen until October 1, 2013; separate discussions must be submitted for in-dividual papers. This paper is part of the Journal of Environmental En-gineering, Vol. 139, No. 5, May 1, 2013. © ASCE, ISSN 0733-9372/2013/5-642-653/$25.00.
642 / JOURNAL OF ENVIRONMENTAL ENGINEERING © ASCE / MAY 2013
J. Environ. Eng. 2013.139:642-653.
Dow
nloa
ded
from
asc
elib
rary
.org
by
Uni
v O
f M
aryl
and
on 0
5/07
/13.
Cop
yrig
ht A
SCE
. For
per
sona
l use
onl
y; a
ll ri
ghts
res
erve
d.

was on high-carbon CCBs mixed with soils for use in roadwayembankments. Various conditions that affect results from each testare discussed and recommendations are provided for interpretationof the test results.
Materials and Methods
Materials
Mixtures of two fly ashes and two soils were used to evaluate theeffects of a range of chemical and physical properties on metalleaching. The soils were selected from among those commonlyused in the construction of embankments in Maryland. Soil clas-sification showed that they are sandy soils, with varying percent-ages of clay. The first soil, designated as Soil C, has a higher fines(clayey) content, while the sandy soil (Soil S) is more uniformlygraded. Fly ashes were added to the soils at 10 and 20% by massto bracket the range most commonly applied in on-site embank-ment construction. Both soils and fly ashes underwent testing todetermine specific gravity [ASTM D859 (ASTM 2010a)], pH[ASTM D4972 (ASTM 2007)], loss on ignition (LOI) [ASTMD7348 (ASTM 2008)], and Atterberg limits [ASTM D4318(ASTM 2010b)]. Soil C yielded liquid and plastic limits of 37and 21%, respectively, whereas all other materials were nonplastic.Specific gravity of all materials ranged between 2.3 and 2.8. Totalelemental analyses (TEAs) were performed by the University ofWisconsin Soil and Plant Analysis Laboratory on soils and flyashes to aid in selecting the metal analytes of interest. Analyseswere performed using inductively coupled plasma optical emissionspectrometer employing a laboratory-developed standard operatingprocedure to evaluate element concentrations. Table 1 provides asummary of the physical and chemical properties of the materialsused in this study.
The fly ashes used in this study, Brandon Shores (B) andColumbia (W), were provided by power plants in Maryland andWisconsin, respectively. They represent a noncementitious (lowCaO) fly ash (B) and self-cementitious (high CaO) fly ash (W). Thehigher calcium content reported in the TEA (14.4%) for theColumbia fly ash is correlated with its self-cementitious propertyupon hydration. This is also reflected in a higher pH for the Columbiafly ash compared with the Brandon Shores fly ash (12.1 versus 4.98).
In the WLTs and CLTs, the leaching solution was 0.02 M NaClin deionized water. The solution ionic strength was selected to sim-ulate that of groundwater flowing through a constructed embank-ment (Morar et al. 2012). TCLP extraction fluid #1, an acetatebuffer solution, was used as the extraction solution in the TCLPtests. The solution was selected as outlined in EPA Method1311 (U.S. EPA SW-846) on the basis of the pH of the soil–fly ashmixture after heating and addition of HCl.
As part of the sample preparation, the soils were oven dried(120°C, ≥24 h). For the column tests, the soils were sieved usinga No. 4 sieve (4.76 mm). For the batch tests, additional sievingthrough a No. 12 (2 mm) sieve was performed to account forthe smaller size of the testing equipment. To maximize the degreeof homogeneity, the soil–fly ash mixtures were mixed by glovedhand and metal spoons in 5-gallon buckets. All mixture sampleswere labeled using the following format: soil (C for clayey or Sfor sandy)—fly ash used (W for Columbia or B for BrandonShores)—percent fly ash by mass (10 or 20).
Water Leach Test
WLTs were performed on 12 mixtures according to ASTM D3987(ASTM 2012a) with two modifications. One, the size of the extrac-tion vessel was downsized to a 60-mL centrifuge tube to fit the
laboratory equipment. Two, a 0.02-M NaCl (Fisher Scientific)leaching solution was used instead of the deionized water specifiedby the standard method. A 2.5-g aliquot of sample mixture wastransferred to an acid-washed centrifuge tube, and 50 mL of leach-ing solution was added, corresponding to a 20∶1 liquid-to-solid(L∶S) ratio. The tubes were rotated at 29 revolutions per minute(rpm) for 18 h to allow for equilibration. After rotation, the liquidleachate and solid phases were separated by centrifugation and thenby filtration through a 0.2-μm membrane filter. Electrical conduc-tivity (EC) and pH measurements were taken immediately afterfiltration. The samples were then acidified to pH less than 2 withtrace metal grade HNO3 (Fisher Scientific) and refrigerated at 4°Cuntil the metals analysis could be performed.
A limited number of modified WLTs were performed to exam-ine the effect of pH on leaching behavior of the fly ash–soilmixtures. This method of evaluating leaching potential has beenproposed as a central part of an integrated testing frameworkby Kosson et al. (2002) and recommended as the new prelimi-nary EPA Method 1313 [Leaching Environmental AssessmentFramework (LEAF) 2012]. These tests followed the WLT proce-dures described previously, except the 0.02-M NaCl solutionwas buffered at target pH values. The biological buffers BESand CAPSO (>99% Sigma Aldrich) were used to maintain apH of 7 and 9, respectively, due to their minimal interference withmetals. The buffered solutions were prepared by dissolving 2.13 gof BES or 2.47 g of CAPSO in 100 mL of the original WLT ex-traction fluid. The pH was adjusted to the target value by titration
Table 1. Chemical Properties and Classification of Materials Used
Material B fly ash W fly ash Soil C Soil S
P (%) 0.04 0.16 0.04 0.02K (%) 0.37 0.25 0.27 0.05Ca (%) 0.22 14.4 0.06 0.03Mg (%) 0.1 2.41 0.19 0.04S (%) 0.08 0.81 0.01 0.01Zn (mg=kg) 53.9 92.2 58.2 15B (mg=kg) 21.3 600 3.25 2.86Mn (mg=kg) 33.9 91.6 220 38.2Fe (mg=kg) 6,400 24,400 42,200 10,800Cu (mg=kg) 59.6 189 27.2 1.28Al (mg=kg) 21,300 91,800 49,400 28,800Na (mg=kg) 539 11,200 75 33Cd (mg=kg) 0.42 1.14 <0.4 <0.4Co (mg=kg) 20.9 19.5 13.1 4.62Cr (mg=kg) 49.5 64.6 65.9 15.5Mo (mg=kg) 11.7 4.54 0.79 <0.4Ni (mg=kg) 21.3 2.31 13.1 <0.3Pb (mg=kg) 23 15.8 10.1 <2Li (mg=kg) 35.7 38.7 19.3 4.02As (mg=kg) 24.2 15 6.3 <3V (mg=kg) 78.8 187 116 16.5Ag (mg=kg) 0.001 <0.001 <0.001 <0.001Sb (mg=kg) 0.05 0.06 0.02 0.02Tl (mg=kg) <0.001 <0.001 <0.001 <0.001pH 4.98 12.1 6.07 7.99Loss onignition (%)
5.5 0.4 8.6 7.1
Classification Off-specification Class C SP-SC (poorlygraded sandwith clay)
SW-SC(well-gradedsand with clayand gravel)
Note: Classification of fly ashes and soils was based on ASTMC618 (ASTM2012b) classification and Unified Soil Classification System, respectively.Chemical properties include metal concentrations based on TEA.B = Brandon Shores, W = Columbia.
JOURNAL OF ENVIRONMENTAL ENGINEERING © ASCE / MAY 2013 / 643
J. Environ. Eng. 2013.139:642-653.
Dow
nloa
ded
from
asc
elib
rary
.org
by
Uni
v O
f M
aryl
and
on 0
5/07
/13.
Cop
yrig
ht A
SCE
. For
per
sona
l use
onl
y; a
ll ri
ghts
res
erve
d.

with 4 N NaOH (Fisher Scientific). Preliminary tests were con-ducted to confirm that the buffers provided satisfactory bufferingcapacity.
Toxicity Characteristic Leaching Procedure
The TCLP test was conducted as outlined in EPA Method1311 (U.S. EPA SW-846), except that the size of the extractionvessel was downsized as described for the WLT (George et al.2007). Sample preparation, mixing, and postmixing handlingfollowed the steps described previously for the WLT except thatthe leachate collected after centrifugation was vacuum-filteredthrough TCLP glass fiber filters (Fisher Scientific). EC and pHmeasurements were taken immediately after filtration, and the fil-tered leachate was preserved for later metals analysis, as describedfor the WLT.
Column Leach Test
Column tests were used to more realistically simulate field leachingconditions. All specimens were compacted at 2% dry of optimummoisture content (OMC) in an acrylic tube having a 102-mm insidediameter and 305-mm height. By compacting to the dry of OMC,higher hydraulic conductivities could be achieved, allowing enoughcolumn effluent to be collected in a reasonable amount of time.Standard Proctor effort [ASTM C618 (ASTM 2012c)] was usedduring compaction, consisting of eight layers with 29 blows perlayer to achieve a minimum target dry unit weight of 15.7 kN=m3,a value used for designing highway embankments in Maryland.The Brandon Shores fly ash mixtures were used directly after com-paction. However, due to their high calcium content, Columbia flyash mixtures were then cured for 7 days at 95% relative humidityand 23°C. After compaction, the column reactors were fabricatedby placing porous stones at each end of the sample, and thencapping the column with latex end plates, which were held in placethrough threaded rods and sealed with silicone sealant. The endcaps included ports for influent and effluent tubing attached toplastic connectors. Influent solution was provided in a downflowdirection through a peristaltic pump and 6.35-mm Masterflexplastic tubing at a rate of 60 mL=h (average porewater velocity ¼0.74 cm=h) to simulate typical groundwater velocities in the field(Gelhar et al. 1992; Morar et al. 2012). The influent solution(0.02 M NaCl) was stored in buckets and was continuously mixedby magnetic stirrer.
A total of 10 CLTs were performed. In each test, sampling ofthe column effluent was conducted 4–5 times a day for the first3 days to capture the initial fluctuations in leachate characteristics.Sampling frequency was subsequently decreased to once every2 days as the testing progressed. Acid-washed plastic bottles wereused to collect 30 to 50 mL of leachate at each sampling time. Allsamples were analyzed for pH and EC, and then preserved formetals analysis as described for the WLT. The influent solutionpH was measured twice daily and adjusted using 1 N NaOH to staywithin a pH range of 6.5–7. The CLTs were run until the EC andpH values appeared to stabilize, and at least 25 pore volumes offlow (typically 35–65) had occurred.
The batch leach concentrations were compared to the maximumcolumn effluent concentrations; this value typically occurred withinthe first or second pore volume of flow. Additionally, a volume-weighted mean concentration was calculated using the highestL∶S ratio common to all columns. The target L∶S ratio was 5, whichcorresponds approximately to 25 years of leaching conditions (Ramet al. 2007) assuming typical dilution factors from normal ground-water flow.
Analytical Methods
The pH of leachate samples collected from the WLTs, TCLPs, andCLTs was measured using a combination pH probe (Orion Model91560) and meter (Orion Model 520A), with calibration beforeeach use. A conductance meter (YSI Model 35) was used for mea-surements of EC.
Based on the TEA of the fly ashes and soils, and human andenvironmental health concerns, chromium, copper, and arsenicwere selected as the target elements in the leaching tests. Chro-mium and arsenic are hazardous to human health, while copperhas known toxicity to fish and other aquatic life (Horne and Dunson1995). The two metals (Cr and Cu) and the As metalloid (sub-sequently collectively noted as metals) also allowed anionic andcationic species to be examined across a wide pH range. Metal con-centrations in samples from the leaching tests were determined induplicate using an atomic absorption spectrophotometer (PerkinElmer Model 5100ZL) equipped with a graphite furnace module.A separate FIAS-400 hydride generator was used to determine con-centrations of arsenic. Five to six metal standards were preparedbased on a linear range between absorbance and concentration.The standards were made using 1,000 parts per million (ppm)certified stock solutions (Fisher Scientific) and the same back-ground matrix as the samples. Calibration curves with an R2 ≥ 0.99were used. Two standards were measured before and after sampleanalysis to check calibration accuracy and instrument precision.Dilutions with the appropriate solution matrices were made whennecessary to ensure absorbance values were within the range ofthe standards. The detection limits in the 0.02 M NaCl leachingsolution for As, Cr, and Cu as determined by the EPA MethodDetection Limit procedure (Standard Method 1030C) were 0.22,0.35, and 1.0 μg=L, respectively. Method detection limits werehigher for the TCLP extraction fluid #1 matrix at 0.49, 1.8, and1.4 μg=L for As, Cr, and Cu, respectively.
Results and Discussion
Leaching results were compared to two regulatory limits: thefederal EPA drinking water maximum contaminant levels (MCLs)and the Maryland State aquatic toxicity chronic limits. Specifically,the MCL was used for Cr and As because of their toxicity tohumans and concerns for human health, while the more stringentsurface water toxicity limit was used for Cu because of its hightoxicity to aquatic life.
Leaching Test Results: Copper
Cu concentrations in the WLT leachate (Table 2) were below theMaryland chronic Cu aquatic toxicity limit of 9 μg=L in 75% ofthe fly ash–soil mixtures, with exceptions being the C-W-10 andC-W-20 samples at 12 and 14 μg=L, respectively. The differencesin leaching behavior are likely the combined result of the fly ashand soil composition (metal content and alkalinity) and other fac-tors, such as pH (Bin Shafique et al. 2002; Palumbo et al. 2007).WLTs with Columbia fly ash exhibited pH values greater than 11,whereas those for Brandon Shores were between 6 and 7. Also, theColumbia fly ash has approximately three times the Cu content asthe Brandon Shores fly ash (189 versus 60 mg=kg) and this islikely partially responsible for the Columbia fly ash mixturesgenerally having up to six times the leachate Cu concentrationsof similar Brandon Shores fly ash mixtures. Three out of four sandysoil mixtures (S-W-10, S-B-10, and S-B-20) exceeded the Mary-land Cu chronic aquatic toxicity limit in the more harsh TCLP ex-tract. Clayey soil mixtures were all below the limit.
644 / JOURNAL OF ENVIRONMENTAL ENGINEERING © ASCE / MAY 2013
J. Environ. Eng. 2013.139:642-653.
Dow
nloa
ded
from
asc
elib
rary
.org
by
Uni
v O
f M
aryl
and
on 0
5/07
/13.
Cop
yrig
ht A
SCE
. For
per
sona
l use
onl
y; a
ll ri
ghts
res
erve
d.

Based on replicated CLTs using the same sandy soil–BrandonShores fly ash mixture and conducted under identical conditions(Fig. 1), Cu leaching exhibited a first-flush behavior, with concen-trations decreasing from 12–20 μg=L to less than 5 μg=L after 1–2pore volumes of flow. The replicate clayey soil–Brandon Shores
fly ash CLTs also exhibited a similar first flush behavior (datanot shown); however, lower initial Cu concentrations (∼7 μg=L)were observed in the clayey soil–Brandon Shores fly ash columnscompared to the sandy soil–Brandon Shores fly ash columns(∼20 μg=L) despite the clayey soil C having approximately
Table 2. pH Measurements and Cu, Cr, and As Concentrations of Leachate from WLTs and TCLPs
Soil Fly ashFly ash
content (%)
WLT TCLP
Leachate pH
Metal concentration (μg=L)
Leachate pH
Metal concentration (μg=L)
Cu Cr As Cu Cr As
S W 10 11.6 7.6 57 0.90 5.2 11 20 <0.4920 11.6 4.4 66 0.64 5.5 5.3 30 1.3
B 10 6.7 1.7 <0.35 0.29 4.9 29 8.0 1.020 6.0 3.9 <0.35 0.72 4.8 26 17 3.0
C W 10 11.3 12 69 1.2 5.2 7.6 25 <0.4920 11.5 14 100 0.63 5.5 7.3 54 <0.49
B 10 6.2 1.9 1.4 0.40 4.8 1.8 2.5 1.120 6.6 3.9 1.2 0.38 4.8 4.7 7.3 0.49
S None 0 5.8 1.4 0.90 <0.22 4.8 <1.4 <1.8 <0.49C None 0 8.7 2.6 0.36 <0.22 4.8 <1.4 <1.8 1.7None W 100 11.9 2.0 45 0.35 6.3 <1.4 140 30
B 100 8.8 2.6 2.8 23 4.9 93 45 85U.S. EPA drinking water MCL 1,300 100 10 1,300 100 10
Maryland State aquatic toxicity acute limits 13 570=16 340 13 570=16 340Maryland State aquatic toxicity chronic limits 9 74=11 150 9 74=11 150
Notes: Concentrations are averages of four replicates for fly ash–soil mixtures, three replicates for fly ash, and two replicates for soil. W fly ash = Columbia flyash, B fly ash = Brandon Shores fly ash. MCL = maximum contaminant level. Regulatory limits for chromium given as ½Cr III�=½Cr VI�.
0
1
2
3
4
5
6
7
8
0
5
10
15
20
25
0 10 20 30 40 50 60 70
pH
Dis
solv
ed C
op
per
(u
g/L
)
Pore Volumes
S-B-10 S-B-20 S-B-10 pH S-B-20 pH Influent pH
0
1
2
3
4
5
6
7
8
0
5
10
15
20
25
0 10 20 30 40 50 60 70 80
pH
Dis
solv
ed C
op
per
(u
g/L
)
Pore Volumes
S-B-10 S-B-20 S-B-10 pH S-B-20 pH Influent pH
(a)
(b)
Fig. 1. Copper leachate concentrations and pH from duplicate column leach tests conducted using the same S-B mixture and performed underidentical conditions: (a) first set CLT, (b) second set CLT; each symbol represents the average of two sample replicate metal measurements; con-centrations less than 1.0 μg=L are reported as half of the detection limit; dashed lines represent the Maryland chronic aquatic toxicity limit of 9 μg=L
JOURNAL OF ENVIRONMENTAL ENGINEERING © ASCE / MAY 2013 / 645
J. Environ. Eng. 2013.139:642-653.
Dow
nloa
ded
from
asc
elib
rary
.org
by
Uni
v O
f M
aryl
and
on 0
5/07
/13.
Cop
yrig
ht A
SCE
. For
per
sona
l use
onl
y; a
ll ri
ghts
res
erve
d.
21 times the Cu content as the sandy soil S. The likely explanationis adsorption of Cu onto the mineral surface of the clayey soil C atthe pH range of 4–6 for the Brandon Shores fly ash, contributing tothe net reduced leaching. In column studies of fly ash and soil underacidic conditions, Ariese et al. (2002) observed that a large portionof the leached metals were retained by the soils, reducing aqueousconcentrations by adsorption or other binding mechanisms.
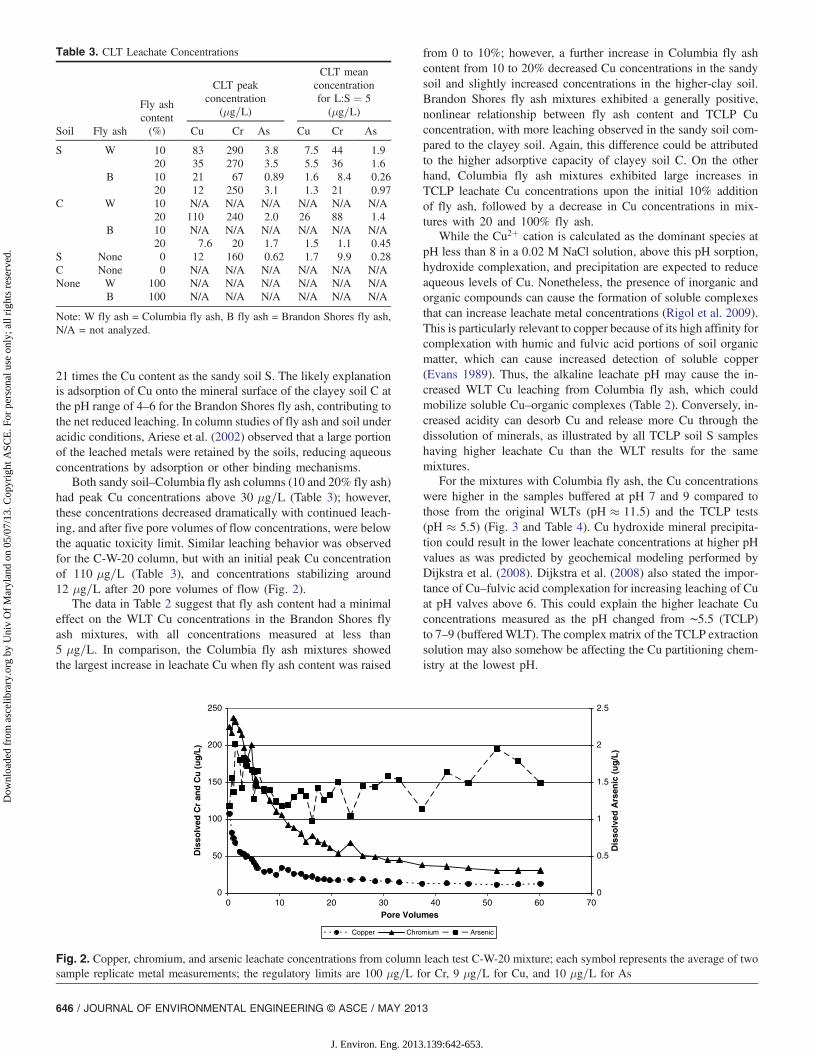
Both sandy soil–Columbia fly ash columns (10 and 20% fly ash)had peak Cu concentrations above 30 μg=L (Table 3); however,these concentrations decreased dramatically with continued leach-ing, and after five pore volumes of flow concentrations, were belowthe aquatic toxicity limit. Similar leaching behavior was observedfor the C-W-20 column, but with an initial peak Cu concentrationof 110 μg=L (Table 3), and concentrations stabilizing around12 μg=L after 20 pore volumes of flow (Fig. 2).
The data in Table 2 suggest that fly ash content had a minimaleffect on the WLT Cu concentrations in the Brandon Shores flyash mixtures, with all concentrations measured at less than5 μg=L. In comparison, the Columbia fly ash mixtures showedthe largest increase in leachate Cu when fly ash content was raised
from 0 to 10%; however, a further increase in Columbia fly ashcontent from 10 to 20% decreased Cu concentrations in the sandysoil and slightly increased concentrations in the higher-clay soil.Brandon Shores fly ash mixtures exhibited a generally positive,nonlinear relationship between fly ash content and TCLP Cuconcentration, with more leaching observed in the sandy soil com-pared to the clayey soil. Again, this difference could be attributedto the higher adsorptive capacity of clayey soil C. On the otherhand, Columbia fly ash mixtures exhibited large increases inTCLP leachate Cu concentrations upon the initial 10% additionof fly ash, followed by a decrease in Cu concentrations in mix-tures with 20 and 100% fly ash.
While the Cu2þ cation is calculated as the dominant species atpH less than 8 in a 0.02 M NaCl solution, above this pH sorption,hydroxide complexation, and precipitation are expected to reduceaqueous levels of Cu. Nonetheless, the presence of inorganic andorganic compounds can cause the formation of soluble complexesthat can increase leachate metal concentrations (Rigol et al. 2009).This is particularly relevant to copper because of its high affinity forcomplexation with humic and fulvic acid portions of soil organicmatter, which can cause increased detection of soluble copper(Evans 1989). Thus, the alkaline leachate pH may cause the in-creased WLT Cu leaching from Columbia fly ash, which couldmobilize soluble Cu–organic complexes (Table 2). Conversely, in-creased acidity can desorb Cu and release more Cu through thedissolution of minerals, as illustrated by all TCLP soil S sampleshaving higher leachate Cu than the WLT results for the samemixtures.
For the mixtures with Columbia fly ash, the Cu concentrationswere higher in the samples buffered at pH 7 and 9 compared tothose from the original WLTs (pH ≈ 11.5) and the TCLP tests(pH ≈ 5.5) (Fig. 3 and Table 4). Cu hydroxide mineral precipita-tion could result in the lower leachate concentrations at higher pHvalues as was predicted by geochemical modeling performed byDijkstra et al. (2008). Dijkstra et al. (2008) also stated the impor-tance of Cu–fulvic acid complexation for increasing leaching of Cuat pH valves above 6. This could explain the higher leachate Cuconcentrations measured as the pH changed from ∼5.5 (TCLP)to 7–9 (buffered WLT). The complex matrix of the TCLP extractionsolution may also somehow be affecting the Cu partitioning chem-istry at the lowest pH.
Table 3. CLT Leachate Concentrations
Soil Fly ash
Fly ashcontent(%)
CLT peakconcentration
(μg=L)
CLT meanconcentrationfor L∶S ¼ 5
(μg=L)
Cu Cr As Cu Cr As
S W 10 83 290 3.8 7.5 44 1.920 35 270 3.5 5.5 36 1.6
B 10 21 67 0.89 1.6 8.4 0.2620 12 250 3.1 1.3 21 0.97
C W 10 N/A N/A N/A N/A N/A N/A20 110 240 2.0 26 88 1.4
B 10 N/A N/A N/A N/A N/A N/A20 7.6 20 1.7 1.5 1.1 0.45
S None 0 12 160 0.62 1.7 9.9 0.28C None 0 N/A N/A N/A N/A N/A N/ANone W 100 N/A N/A N/A N/A N/A N/A
B 100 N/A N/A N/A N/A N/A N/A
Note: W fly ash = Columbia fly ash, B fly ash = Brandon Shores fly ash,N/A = not analyzed.
0
50
100
150
200
250
0 10 20 30 40 50 60 70Pore Volumes
Dis
solv
ed C
r an
d C
u (
ug
/L)
0
0.5
1
1.5
2
2.5
Dis
solv
ed A
rsen
ic (
ug
/L)
Copper Chromium Arsenic
Fig. 2. Copper, chromium, and arsenic leachate concentrations from column leach test C-W-20 mixture; each symbol represents the average of twosample replicate metal measurements; the regulatory limits are 100 μg=L for Cr, 9 μg=L for Cu, and 10 μg=L for As
646 / JOURNAL OF ENVIRONMENTAL ENGINEERING © ASCE / MAY 2013
J. Environ. Eng. 2013.139:642-653.
Dow
nloa
ded
from
asc
elib
rary
.org
by
Uni
v O
f M
aryl
and
on 0
5/07
/13.
Cop
yrig
ht A
SCE
. For
per
sona
l use
onl
y; a
ll ri
ghts
res
erve
d.

Leaching Test Results: Arsenic
All aqueous WLT and TCLP As concentrations were measuredbelow the EPA MCL of 10 μg=L for all fly ash–soil mixtures(Table 2). WLTAs concentrations were generally less than 1 μg=Lfor all mixtures. However, both 100% fly ash TCLP samplesexceeded the MCL with concentrations of 30 and 85 μg=L for
Columbia and Brandon Shores fly ashes, respectively. These resultsare expected given the higher total As content of the BrandonShores fly ash compared to the Columbia fly ash (24.2 versus15.0 mg=kg). Similar to the WLT results, TCLP As leachate con-centrations for all fly ash–soil mixtures exhibited a small rangecompared to Cu and Cr, ranging from less than 0.49 to 3.0 μg=L.
Maximum leachate As concentrations did not exceed 40% ofthe EPA MCL for any of the CLT studies (Table 3). Arsenic leach-ing in the sandy soil–Brandon Shores fly ash CLTs followed firstflush behavior with an initial concentration of approximately3 μg=L. In contrast, As concentrations increased with time in thesandy soil–Columbia fly ash columns, albeit still remaining below4 μg=L for the experimental duration (Fig. 4). Arsenic can becomemore solubilized under alkaline conditions, such as observed withColumbia fly ash (Fig. 4), and remain dissolved in greater quan-tities because of electrostatic repulsion between anionic As speciesand negatively charged soil and fly ash particles (Daniels andDas 2006; Wang et al. 2006; Palumbo et al. 2007; Jegadeesanet al. 2008; Morar et al. 2012). In contrast, leaching of arsenic inthe C-B-20 columns (Fig. 5) with pH ≤ 7 peaked after severalpore volumes of flow and then rapidly decreased. The relativelylow levels of As leaching (<5 μg=L) in all of the CLTs couldbe the result of the strong attraction of As species to soil/clayparticles (increased adsorption) and possible precipitation ofarsenic as some type of mixed iron oxide. High levels of As reten-tion by soils have been found in highly organic soils, whichmay have also contributed to the lower aqueous levels detected(Balasoiu et al. 2001).
The data in Table 2 reveal that Brandon Shores fly ash mixturesgenerally had increasing WLT As concentrations as the fly ashcontent was raised from 0 to 100% fly ash, although the relation-ship was nonlinear. The Columbia fly ash mixtures for both soilsshowed an increase in WLTAs concentration from 0 to 10%, but itdecreased as the fly ash content was raised further. This initial in-crease in As concentration typically corresponded to the largest pHchange, supporting the importance of pH in controlling As leach-ing. The largest increase in As concentration in all of the TCLPtests occurred with the increase from 20 to 100% fly ash content,and could be the result of the absence of soil particles that affectadsorption or release agents that could assist in As precipitation.
Previous studies have found that As is found in fly ash primarilyas arsenate [As(V)], possibly due to the highly oxidizing envi-ronment of coal combustion (Cullen and Reimer 1989; Shahet al. 2008). Alkaline pH conditions favor increasingly negatively
1
10
100
4 5 6 7 8 9 10 11 12 13
Dis
solv
ed C
op
per
(u
g/L
)
pH
S-W-10 WLT S-W-20 WLT S-W-10 TCLP S-W-20 TCLP
Fig. 3. Effect of pH on leachate copper concentrations for S-W mixtures in WLT and TCLP
Table 4. pH Measurements and Cu, Cr, and As Concentrations forBuffered Water Leach Tests
Mixture Buffer pHCu
(μg=L)Cr
(μg=L)As
(μg=L)
S-B-10 BES 6.99 43 0.18 0.63BES 6.99 42 0.18 0.25
CAPSO 9.01 1.2 1.7 4.8CAPSO 9.00 3.2 6.2 4.3
S-W-10 BES 7.23 67 22 2.7BES 7.20 63 11 2.3
CAPSO 9.29 51 54 2.9CAPSO 9.28 50 52 2.8
S-B-20 BES 6.95 47 0.18 1.8BES 6.97 46 0.18 1.7
CAPSO 9.09 2.5 3.4 8.9CAPSO 9.11 5.5 3.9 14
S-W-20 BES 7.34 79 29 8.8BES 7.32 79 29 10
CAPSO 9.46 87 20 3.6CAPSO 9.44 81 21 4.8
C-W-10 BES 7.24 55 34 0.44BES 7.25 53 31 0.31
CAPSO 9.35 53 74 0.47CAPSO 9.31 55 77 0.33
C-W-20 BES 7.44 28 54 0.79BES 7.42 25 50 1.2
CAPSO 9.45 64 112 0.5CAPSO 9.49 72 117 0.76
C-B-10 BES 7.06 32 1.67 0.11BES 7.05 12 1.3 0.11
CAPSO 8.77 2.0 4.7 0.36CAPSO 8.77 2.7 4.5 0.52
C-B-20 BES 7.04 27 1.7 0.11BES 7.03 24 1.6 0.11
CAPSO 8.81 2.6 6.0 0.77CAPSO 8.79 2.6 7.4 1.1
Note: S = Soil S, C = Soil C, B = Brandon Shores fly ash, W = Columbiafly ash.
JOURNAL OF ENVIRONMENTAL ENGINEERING © ASCE / MAY 2013 / 647
J. Environ. Eng. 2013.139:642-653.
Dow
nloa
ded
from
asc
elib
rary
.org
by
Uni
v O
f M
aryl
and
on 0
5/07
/13.
Cop
yrig
ht A
SCE
. For
per
sona
l use
onl
y; a
ll ri
ghts
res
erve
d.

charged As species, such as HAsO2−4 and AsO3−
4 for As(V).Arsenite [As(III)] can become more significant at higher pH valuesand in reducing environments. Importantly, retention of As(III) bysoils is less than that of As(V) (Balasoiu et al. 2001). Therefore, asthe pH is increased, changes in As speciation result in differentbinding interactions between soil/fly ash particle surfaces leadingto differences in net leaching behavior, as was observed in thecurrent study.
Consistent with the previous discussion, the sandy soil–BrandonShores fly ash mixtures showed relatively constant As levelsfrom pH 5–7, but increasing As concentrations as the pH rose from7 to 9, although this was not clearly observed in the clayey soil–Brandon Shores fly ash mixtures (Tables 2 and 4). In the latter case,the finer particles of clayey soil C may have promoted more adsorp-tion through the increased surface area of the soil particles. In con-trast, As leaching for sandy soil–Columbia fly ash mixturesincreased from pH 5 to 7–9, then decreased with additional pH in-crease to 11 (Fig. 6). The decrease in Columbia fly ash As leachingcould be attributed to higher levels of soil retention of As if presentin the As(V) form as AsO3−
4 , which becomes more significant at pHgreater than 11, compared to As(III). Similar results were foundby Wang et al. (2009), where increased calcium levels resultedin decreased As leaching under alkaline conditions through theformation of less soluble Ca-As compounds, especially at highpH values where AsO3−
4 becomes increasingly dominant. Thus,
precipitation of the As anions at these pH values is also believedto result in reduced leaching. All TCLPAs leaching was at concen-trations less than 3 μg=L, reflecting the limited solubility of Asspecies under low pH conditions.
Leaching Test Results: Chromium
Except for the C-W-20 mixture, all WLT Cr levels were below the100 μg=L drinking water MCL (Table 2). In the same tests, Crconcentrations ranged from 57 to 100 μg=L for Columbia fly ashmixtures compared with less than 0.35 to 1.4 μg=L for BrandonShores mixtures. Higher Cr leaching observed with the Columbiafly ash mixtures may be attributed to the fact that all of theColumbia samples had pH values greater than 10, similar to theresults obtained by Fytianos et al. (1998) and Palumbo et al. (2007).TCLP Cr concentrations were below 100 μg=L in all soil–fly ashmixtures (Table 2). In addition, the lower pH range (4.8 to 6.3) ofthe TCLP favors the dominance of cationic species of Cr(III); thesecations would likely remain dissolved because of the positivelycharged particle surfaces commonly found in this pH range.
In contrast to Cu and As, several of the CLTs exhibited a laggedleaching response for Cr. Decreases in pH resulted specifically inincreased Cr concentrations. For example, the first set of CLTs pre-pared with sandy soils and Brandon Shores fly ash (Fig. 7) showeda lagged Cr leaching response in which Cr concentrations remained
0
2
4
6
8
10
12
14
0
0.5
1
1.5
2
2.5
3
3.5
4
0 5 10 15 20 25 30 35 40 45
pH
Dis
solv
ed A
rsen
ic (
ug
/L)
Pore Volumes
S-W-10 S-W-20 S-W-10 pH S-W-20 pH Influent pH
Fig. 4. Arsenic leachate concentrations and pH from column leach test S-W mixtures; each symbol represents the average of two sample replicatemetal measurements; concentrations less than 0.22 μg=L are reported as half of the detection limit
0
1
2
3
4
5
6
7
8
0.0
0.2
0.4
0.6
0.8
1.0
1.2
1.4
1.6
1.8
0 5 10 15 20 25 30 35 40 45
pH
Dis
solv
ed A
rsen
ic (
ug
/L)
Pore Volumes
C-B-20 #1 C-B-20 #2 C-B-20 1 pH C-B-20 2 pH Influent pH
Fig. 5. Arsenic leachate concentrations and pH from column leach test C-B mixtures; each symbol represents the average of two sample replicatemetal measurements; concentrations less than 0.22 μg=L are reported as half of the detection limit
648 / JOURNAL OF ENVIRONMENTAL ENGINEERING © ASCE / MAY 2013
J. Environ. Eng. 2013.139:642-653.
Dow
nloa
ded
from
asc
elib
rary
.org
by
Uni
v O
f M
aryl
and
on 0
5/07
/13.
Cop
yrig
ht A
SCE
. For
per
sona
l use
onl
y; a
ll ri
ghts
res
erve
d.

consistently below 50 μg=L except for two specific excursions ofelevated Cr. A lagged Cr leaching response could be caused by Crbeing located in less easily solubilized fractions of the soil and flyash particles. Edil et al. (1992) also observed that while the majorityof CLTs exhibited first-flush leaching, Cr had a different leachingresponse. A sharp spike in Cr to 250 μg=L in the first S-B-20 col-umn replicate was the only time the CLT leachate concentrations
exceeded the MCL. A similar spike in Cr concentration to 35 μg=Lwas observed in the second S-B-20 column replicate, which cor-responded to the first major drop in pH. With similar trends inpH over the test duration, both S-B-20 columns showed similarleaching behavior, although Cr magnitudes were frequently lowerby a factor of 10 in the second column. The discrepancies betweenthe CLTs could be explained by the development of preferential
0.1
1
10
4 5 6 7 8 9 10 11 12 13
Dis
solv
ed A
rsen
ic (
ug
/L)
pH
S-W-10 WLT S-W-20 WLT S-W-10 TCLP S-W-20 TCLP
Fig. 6. Effect of pH on arsenic concentrations for S-W mixtures; both water leach test and Toxicity Characteristic Leaching Procedure data arepresented; anionic repulsion could result in the higher concentrations seen in the pH range of 7–10; highly alkaline conditions could cause theprecipitation of As, leading to lower levels in the leachate as seen on the right side of the figure
0
1
2
3
4
5
6
7
8
0
50
100
150
200
250
300
0 10 20 30 40 50 60 70
pH
Dis
solv
ed C
hro
miu
m (
ug
/L)
Pore Volumes
S-B-10 S-B-20 S-B-10 pH S-B-20 pH Influent pH
0
5
10
15
20
25
30
35
40
0 10 20 30 40 50 60 70 80Pore Volumes
Dis
solv
ed C
hro
miu
m (
ug
/L)
0
1
2
3
4
5
6
7
8
pH
S-BS-10 S-BS-20 S-BS-10 pH S-BS-20 pH Influent pH
(a)
(b)
Fig. 7. Chromium leachate concentrations and pH from (a) the first set of column leach test S-B mixtures, and (b) the second set of column leach testS-B mixtures; each symbol represents the average of two sample replicate metal measurements; concentrations less than 0.35 μg=L are reported ashalf of the detection limit; the dashed line represents EPA MCL of 100 μg=L
JOURNAL OF ENVIRONMENTAL ENGINEERING © ASCE / MAY 2013 / 649
J. Environ. Eng. 2013.139:642-653.
Dow
nloa
ded
from
asc
elib
rary
.org
by
Uni
v O
f M
aryl
and
on 0
5/07
/13.
Cop
yrig
ht A
SCE
. For
per
sona
l use
onl
y; a
ll ri
ghts
res
erve
d.

flow paths or fly ash heterogeneity, leading to increased Cr releasefrom portions of the soil/fly ash column with higher naturalchromium levels. In contrast, columns with both soils andColumbia fly ash had initial Cr concentrations that exceededthe MCL, but quickly dropped below 100 μg=L within five porevolumes (not shown).
Fly ash content appeared to have minimal effect on WLT Crleachate concentrations in the Brandon Shores fly ash mixtures(Table 2). However, Columbia fly ash mixtures showed an increasein Cr concentrations to 20% fly ash, decreasing in 100% fly ash.This may have been due to the soil providing more organic matterwith charged surfaces that could complex with aqueous Cr, whichwould result in the increased Cr leaching in the soil–fly ash mix-tures, especially at high pH. The higher LOI of the soils as com-pared to the Columbia fly ash (7.1 to 8.6% versus 0.4%) supportsthese observations.
The TCLP leaching results presented in Table 2 indicate an ap-proximately linear relationship between leachate Cr concentrationsand fly ash content. This supports the results of Zandi and Russell(2007) in which Cr leaching was shown to be controlled by themetal content in the fly ash. Higher fly ash contents can provideadditional metal ions available for leaching, and typically resultin higher leachate metal concentrations, although the relationshipis not always linear.
With increasing pH, Cr(III) typically forms increasingly nega-tive species with minimum solubility at approximately pH 6–7 asCrðOHÞ3 (Rai et al. 1989). At pH values above 10, Cr(III) can formdissolved anionic species such as CrðOHÞ−4 , which will demon-strate decreased adsorption (Shah et al. 2008) due to unavailabilityof positively charged surface species for complexation (Daniels andDas 2006; Jegadeesan et al. 2008). Sauer et al. (2012) also foundincreased leachate Cr concentrations at higher pH valves as a resultof Cr forming oxyanions, such as CrO−2
4 , which had lower adsorp-tion in the 7–11 pH range. This anionic behavior could explainthe higher unbuffered WLT Cr concentrations from the alkalineColumbia fly ash mixtures. Fly ash leaching of Cr is generally mag-nified at acidic pH values compared with negligible leaching underneutral or slightly alkaline conditions as the acidic conditions ag-gressively attack Cr-containing compounds (Fytianos et al. 1998;Jo et al. 2008). These findings are consistent with the increased
Cr leaching under TCLP conditions observed in the current studyfor the Brandon Shores fly ash mixtures (Fig. 8).
The buffered WLT Cr concentrations for the Brandon Shores flyash mixtures increased from pH 7 to 9, with a similar but less pro-nounced effect noted with the Columbia ash (Table 4). The speci-ation of Cr, in the Cr(III) or Cr(VI) form, becomes important withchanges in pH because of differences in chemical properties such assolubility and adsorptivity that can impact leachate metal concen-trations (as well as toxicity). The weaker trend with the Columbiaash can be explained if Cr is present primarily in the Cr(VI) form,which has high solubilities over a pH range of 2–12 and, thus, aque-ous concentrations would be similar at different pH values (Rai et al.1989). However, the Brandon Shores data (Fig. 8) suggest that Cr isin the Cr(III) form, with higher concentrations at the pH extremescorresponding to increased Cr(III) solubility.
Comparison of Results for Different LeachingTest Procedures
Significant differences were noted in the leachate metal concentra-tions obtained in the three leaching tests performed. When compar-ing results from leaching test methodologies, it is important toconsider the impact of chemical factors, such as pH differences,L∶S ratios, and hydraulic conditions (flow through or static). Withrespect to pH, the TCLP leached greater Cu in all soil S mixturescompared with the WLT, especially for Brandon Shores fly ash,while soil C mixtures exhibited TCLP Cu concentrations that wereapproximately the same as the WLT for the Brandon Shores fly ashand approximately 40–50% lower for the Columbia ash. Leachateconcentrations from the TCLP were generally higher comparedwith those from the WLT for both Cu and As, with the exceptionof C-B-10 and five of the Columbia fly ash mixtures. The differ-ences between the TCLP and WLT Cr concentrations were lowerfor the Brandon Shores fly ash mixtures because of the smallerdifferences in pH (only approximately 1 pH unit) compared tothe Columbia fly ash mixtures (≈6 pH units), which had WLT Crconcentrations roughly double those of the TCLP.
When comparing the batch and CLT results, both pH and con-tact time become important. Ariese et al. (2002) concluded frompH-stat experiments on several different fly ashes at pH 3 and 5
0.1
1
10
100
4 5 6 7 8 9 10
Dis
solv
ed C
hro
miu
m (
ug
/L)
pH
S-B-10 WLT S-B-20 WLT S-B-10 TCLP S-B-20 TCLP
Fig. 8. Effect of pH on leachate chromium concentrations for S-B mixtures; both water leach test and Toxicity Characteristic Leaching Procedure dataare presented; the increased leaching of Cr at more acidic pH values (≈5) and more alkaline pH values (≈9) is similar to the solubility of Cr(III)
650 / JOURNAL OF ENVIRONMENTAL ENGINEERING © ASCE / MAY 2013
J. Environ. Eng. 2013.139:642-653.
Dow
nloa
ded
from
asc
elib
rary
.org
by
Uni
v O
f M
aryl
and
on 0
5/07
/13.
Cop
yrig
ht A
SCE
. For
per
sona
l use
onl
y; a
ll ri
ghts
res
erve
d.

that extraction time (7 versus 24 h) had little effect on leachateconcentrations, indicating equilibrium was possibly reached earlyon. This observation is consistent with the first-flush leachingbehavior seen in the majority of the CLT results, with highest trans-formation and transport of metal ions occurring in the beginningof the leaching test. Ariese et al. (2002) also found that leachateCu concentrations were higher under more acidic conditions, con-firming that different testing conditions, such as leachate pH, canaffect metal leachate concentrations. For example, elevated levelsof Cr were measured at alkaline pH values in this study, and leach-ate Cu and Cr concentrations at pH 5 from the same pH-stat testsby Ariese et al. (2002) were similar to the TCLP results from thecurrent study.
Bin Shafique et al. (2006) and Ram et al. (2007) report thatmaximum leachate metal concentrations were higher in CLTs com-pared to WLT concentrations, as was observed in the current studyfor all tested mixtures (Tables 2 and 3). The maximum Cu, Cr, andAs CLT concentrations were also higher than the TCLP concentra-tions except for Cu and As in the S-B-10 and Cu in the S-B-20mixtures, although the CLT maximum only occurs for a small time(volume) increment, while the TCLP represents composited test-ing. Again, this was possibly due to the favorable conditions for Cudissolution/desorption under acidic TCLP conditions. The higherL∶S ratios of batch leach tests should result in lower concentrations,as generally found in these tests. High CLT metal concentrationsare common initially because of the low L∶S ratio. Based on theseresults, both test duration and L∶S ratio are important parameters incomparing the results of CLTs and batch tests, while the pH of theTCLP distinguishes it from other testing methods.
Work done by Bin Shafique et al. (2006) and Ram et al. (2007)compared WLT and CLT results to estimate conservative scalingfactors (e.g., 10 for Cr) between WLT and initial CLT leachatemetal concentrations. In the current study, the ratio of CLT maxi-mum concentration to WLT concentration ranged from 3.1 to 5.5for As, 1.9 to 12.4 for Cu, and 2.4 to 714 for Cr. These ratios, how-ever, are noticeably reduced when CLT mean concentrations areused: 0.9–2.5 for As, 0.3–1.9 for Cu, and 0.5–60 for Cr (seeTables 2 and 3). These results show that while different experimen-tal conditions can provide insight into different leaching behaviors,multiple leaching tests can be useful in obtaining a more detailed,substantiated understanding of leaching.
Practical Implications
In the framework of Eighmy and Chesner (2001) for evaluatingthe use of recycled materials in highway construction, the Stage 2laboratory evaluation of environmental, health, and safety issuesrequires development of a testing program for obtaining data thatdemonstrate the suitability of the proposed material for its intendedapplication. One of the key properties to evaluate is inorganicleaching. Two of the most important parameters to consider whenselecting a protocol for assessing metal leaching from fly ash arepH and the L∶S ratio. While sorption processes should be accountedfor in determining leachate metal concentrations, large fluctuationsin pH can facilitate the dissolution of metal-containing minerals,especially under acidic conditions. Changes in pH over time affectthe amount of metals released into solution, precipitates and com-plexes formed, readsorption of dissolved metals, and mobility ofmetals in the environment.
The higher L∶S ratios employed in batch tests can berepresentative of more dilute leaching, while CLTs can simulateleaching behavior exhibited in the soil solution in areas immedi-ately close to the fly ash–soil mixtures. Jo et al. (2008) stated that
initial CLT leaching would likely overestimate leaching risk ifmetal concentrations are compared to EPAMCLs. Results from thisstudy provided mixed support of this claim with four of six mix-tures exhibiting maximum (typically initial) Cr concentrations inthe CLTs that exceeded the EPA MCL, but in none of the mixturesdid this occur for As or Cu. While CLTs can provide more realisticleaching estimations given more site-specific and flow-throughconditions, the WLT is a rapid method to gain reasonable estima-tion of metal leaching. Batch leach tests require significantly lesstime to run and a simpler experimental setup. These tests, however,can misrepresent actual field conditions by having pH values or L∶Sratios not typically seen in the field. The increased TCLP metalleaching observed for some mixtures in this paper alludes to theoverly aggressive nature of the TCLP leaching solution, confirmingthe findings of Baba and Kaya (2004).
Furthermore, the flow-through nature of CLTs compared to thestatic, contained system in the TCLP and WLT provides differentcontact times, soil–fly ash interactions, and L∶S ratios that can alterthe chemical reactions and equilibration processes that affect finalpH and aqueous metal concentrations. CLTs can be more easilyadjusted to fit certain site-specific conditions, including changesto the influent flow rate and the physical properties of the flyash medium such as unit weight, moisture content, and porosity.This is particularly useful regarding fly ash reuse for highwayembankments because of variations in climate/geology and engi-neering specifications for embankment construction. This wouldallow for leaching results to be obtained that better reflect environ-mental conditions in a certain area, and more accurately assesspotential risks and alternatives for CCB disposal and reuse.
The new preliminary EPA method 1313 (LEAF 2012) currentlyunder development for determining liquid–solid partitioning curvesas a function of pH is partially based on the work of Kosson et al.(2002). Kosson et al. (2002) proposed a testing framework withthree tiers of testing that become increasingly extensive and providemore realistic leaching predictions. Specifically, the tiered ap-proach incorporates characterization of the leaching profile forthe material of interest under equilibrium and mass-transfer limitedconditions, coupled with management scenario assumptions toprovide release assessments. Thus, the combining of batch andcolumn leaching tests into an integrated leaching framework hasthe benefit of allowing various stakeholders to obtain a material-specific leaching evaluation (through column tests) based onspecific management scenarios, with quality control verificationpossible through simplified (batch) testing.
Conclusions
Three different leaching tests were performed on fly ashes, soils,and fly ash–soil mixtures to evaluate the As, Cu, and Cr leachingbehavior of these materials and provide comparisons and contrastsamong leach test methodologies. Leachate metal concentrationswere compared to stringent U.S. EPA and state regulatory waterquality limits to evaluate the potential leaching risks. Key conclu-sions based on these results are:• In the batch and column tests, leachate metal concentrations for
the fly ash/soil mixes evaluated in this study exceeded the cor-responding regulatory limits for all three metals at some point.Caution should be exercised when applying leaching results tothe development of CCB regulations and disposal guidelines.Batch tests do not always represent field conditions, while initialCLT leaching is not representative of the long-term leach-ing risks.
JOURNAL OF ENVIRONMENTAL ENGINEERING © ASCE / MAY 2013 / 651
J. Environ. Eng. 2013.139:642-653.
Dow
nloa
ded
from
asc
elib
rary
.org
by
Uni
v O
f M
aryl
and
on 0
5/07
/13.
Cop
yrig
ht A
SCE
. For
per
sona
l use
onl
y; a
ll ri
ghts
res
erve
d.

• The chemical composition of the soil and fly ash is a key factorin determining leaching behavior by influencing metal availabil-ity and speciation. For example, mixtures with a higher initialmetal content can exhibit increased leaching (e.g., Cu leachingfrom Columbia fly ash), while mixtures with a higher CaOcontent (e.g., the Columbia fly ash) may have more significantpH fluctuations. Mixtures with extreme pH variation can in turninfluence metal speciation and leaching.
• Batch leach tests have an important role in the characteriza-tion of leaching behavior. Test parameters should be adjustedto most accurately reflect site-specific conditions, such as in-creasing the L∶S ratio to simulate higher average porosity ordecreasing the pH for slightly acidic soils. An integratedtesting approach that utilizes the strengths of each type ofleaching test while incorporating flexibility is encouraged toprovide reasonable and useful leaching results within budgetand time constraints.
• There is often, although not always, a nonlinear relationshipbetween leachate metal concentrations and fly ash content.For this reason, predictions of leaching based on simple dilutionfactors correcting for fly ash content are often not accurate andan integrated testing protocol is useful for selecting the mostappropriate disposal or reuse option.
Acknowledgments
The funding for this project was provided by the MarylandDepartment of Natural Resources Power Plant Research Program(PPRP) and by the U.S. Federal Highway Administration RecycledMaterials Resource Center (RMRC). All the support is gratefullyacknowledged. Any opinions, findings, or recommendations ex-pressed in this material are those of the authors and do not neces-sarily reflect the views of PPRP and RMRC.
References
APHA, AWWA, and WEF. (2006). “Standard methods for the examinationof water and wastewater, American Public Health Association,American Water Works Association, and Water Environment Federa-tion, Washington, DC.
Ariese, F., et al. (2002). “Leaching studies of inorganic and organic com-pounds from fly ash.” Int. J. Environ. Anal. Chem., 82(11–12),751–770.
ASTM (2007). “Standard test method for pH of soils.” Annual Bookof ASTM Standards, Vol. 11.08, D4972, ASTM International,West Conshohocken, PA.
ASTM (2008). “Standard test method for loss on ignition (LOI) of solidcombustion residues.” Annual Book of ASTM Standards, Vol. 05.06,D7348, ASTM International, West Conshohocken, PA.
ASTM (2010a). “Standard test method for silica in water.” Annual Bookof ASTM Standards, Vol. 11.01, D859, ASTM International, WestConshohocken, PA.
ASTM (2010b). “Standard test methods for liquid limit, plastic limit, andplasticity index of soils.” Annual Book of ASTM Standards, Vol. 04.08,D4318, ASTM International, West Conshohocken, PA.
ASTM (2012a). “Standard practice for shake extraction of solid waste withwater.” Annual Book of ASTM Standards, Vol. 11.04, D3987, ASTMInternational, West Conshohocken, PA.
ASTM (2012b). “Standard specification for coal fly ash and raw or calcinednatural pozzolan for use in concrete.” Annual Book of ASTM Stan-dards, Vol. 04.02, C618, ASTM International, West Conshohocken, PA.
ASTM (2012c). “Standard test methods for laboratory compaction charac-teristics of soil using standard effort.” Annual Book of ASTM Stan-dards, Vol. 04.02, C618, ASTM International, West Conshohocken, PA.
Baba, A., and Kaya, A. (2004). “Leaching characteristics of solid wastesfrom thermal power plants of western Turkey and comparison oftoxicity methodologies.” J. Environ. Manage., 73(3), 199–207.
Balasoiu, C., Zagury, G., and Deschenes, L. (2001). “Partitioning andspeciation of chromium, copper, and arsenic in CCA-contaminatedsoils: Influence of soil composition.” Sci. Total Environ., 280(1–3),239–255.
Bin Shafique, S., Benson, C., and Edil, T. (2002). “Leaching of heavymetals from fly ash stabilized soils used in highway pavements.”Geo Engineering Rep. 02-14, Univ. of Wisconsin, Madison, Wisconsin.
Bin Shafique, S., Benson, C., Edil, T., and Hwang, K. (2006). “Leachateconcentrations from water leach and column leach tests on fly ash-stabilized soils.” Environ. Eng. Sci., 23(1), 53–67.
Chichester, D. L., and Landsberger, S. (1996). “Determination of leachingdynamics of metals from municipal solid waste incinerator fly ash usinga column test.” J. Air Waste Manage. Assoc., 46(7), 643–649.
Creek, D. N., and Shackelford, C. D. (1992). “Permeability and leachingcharacteristics of fly ash liner materials.” Transportation ResearchRecord 1345, Transportation Research Board, Washington, DC.
Cullen, W., and Reimer, K. (1989). “Arsenic speciation in the environ-ment.” Chem. Rev., 89(4), 713–764.
Daniels, J. L., and Das, G. P. (2006). “Leaching behavior of lime-fly ashmixtures.” Environ. Eng. Sci., 23(1), 42–52.
Dijkstra, J. J., Meeussen, J., Van der Sloot, H., and Comans, R. (2008).“A consistent geochemical modeling approach for the leaching and re-active transport of major and trace elements in MSWI bottom ash.”Appl. Geochem., 23(6), 1544–1562.
Edil, T. B. (1998). “Geotechnics of industrial by-products.” Recycled ma-terials in geotechnical applications, Geotechnical Special Publication,ASCE, New York, 1–18.
Edil, T. B., Sandstorm, L. K., and Berthouex, P. M. (1992). “Interaction ofinorganic leachate with compacted pozzolanic fly ash.” J. Geotech.Eng., 118(9), 1410–1430.
Eighmy, T. T., and Chesner, W. H. (2001). “Framework for evaluating useof recycled materials in the highway environment.” Publication No.FHWA-RD-00-140, U.S. Dept. of Transportation, Federal HighwayAdministration, McLean, VA.
Evans, L. J. (1989). “Chemistry of metal retention by soils.” Environ. Sci.Technol., 23(9), 1046–1056.
Fytianos, K., Tsaniklidi, B., and Voudrias, E. (1998). “Leachability ofheavy metals in Greek fly ash from coal combustion.” Environ. Int.,24(4), 477–486.
Gelhar, L. W., Welty, C., and Rehfeldt, K. R. (1992). “A critical review ofdata on field-scale dispersion in aquifers.” Water Resour. Res., 28(7),1955–1974.
George, A., Dugwell, D. R., and Kandiyoti, R. (2007). “Development of aminiaturized techniques for measuring the leachability of toxic traceelements from coal-biomass co-combustion ash residues.” EnergyFuels, 21(2), 728–734.
Ghosh, A., and Subbarao, C. (1998). “Hydraulic conductivity andleachate characteristics of stabilized fly ash.” J. Environ. Eng.,124(9), 812–820.
Horne, M. T., and Dunson, W. A. (1995). “Effects of low pH, metals, andwater hardness on larval amphibians.” Arch. Environ. Contam. Toxicol.,29(4), 500–505.
Jegadeesan, G., Al-Abed, S., and Pinto, P. (2008). “Influence of tracemetal distribution on its leachability from coal fly ash.” Fuel,87(10–11), 1887–1893.
Jo, H. Y., Min, S. H., Lee, T. Y., Ahn, H. S., Lee, S. H., and Hong, J. K.(2008). “Environmental feasibility of using coal ash as a fill material toraise the ground level.” J. Hazard. Mater., 154(1–3), 933–945.
Kim, A. (2006). “The effect of alkalinity of Class F PC fly ash on metalrelease.” Fuel, 85(10–11), 1403–1410.
Kossen, D. S., van der Sloot, H. A., Sanchez, F., and Garabrants, A. C.(2002). “An integrated framework for evaluating leaching in wastemanagement and utilization of secondary materials.” Environ. Eng.Sci., 19(3), 159–204.
Kyper, T. N. (1992). “Institutional constraints to the use of coal fly ash incivil engineering construction.” Utilization of waste materials in civilengineering construction, ASCE, New York, 32–43.
652 / JOURNAL OF ENVIRONMENTAL ENGINEERING © ASCE / MAY 2013
J. Environ. Eng. 2013.139:642-653.
Dow
nloa
ded
from
asc
elib
rary
.org
by
Uni
v O
f M
aryl
and
on 0
5/07
/13.
Cop
yrig
ht A
SCE
. For
per
sona
l use
onl
y; a
ll ri
ghts
res
erve
d.

Leaching Environmental Assessment Framework (LEAF). (2012). “Method1313: Liquid-solid partitioning as a function of pH for constituents insolid materials using a parallel batch extraction procedure.” ⟨http://vanderbilt.edu/leaching/downloads/test-methods/⟩ (Sep. 12, 2012).
Morar, D., Aydilek, A. H., Seagren, E. A., and Demirkan, M. M. (2012).“Metal leaching from fly ash-sand reactive barriers.” J. Environ. Eng.,138(8), 815–825.
Palumbo, A., et al. (2007). “Comparing metal leaching and toxicityfrom high pH, low pH, and high ammonia fly ash.” Fuel, 86(10–11),1623–1630.
Qiao, X. C., Poon, C. S., and Cheeseman, C. (2006). “Use of flue gas de-sulphurisation (FGD) waste and rejected fly ash in waste stabilization/solidification systems.” Waste Manage., 26(2), 141–149.
Ram, L., et al. (2007). “Leaching behavior of lignite fly ash with shake andcolumn tests.” Environ. Geol., 51(7), 1119–1132.
Rai, D., Eary, L. E., and Zachara, J. M. (1989). “Environmental chemistryof chromium.” Sci. Total Environ., 86(1–2), 15–23.
Rigol, A., Mateu, J., González-Núñez, R., Rauret, G., and Vidal, M.(2009). “pHstat vs. single extraction tests to evaluate heavy metals
and arsenic leachability in environmental samples.” Anal. Chem. Acta,632(1), 69–79.
Sauer, J., Benson, C., Aydilek, A., and Edil, T. (2012). “Trace elementsleaching from organic soils stabilized with high carbon fly ash.”J. Geotech. Geoenviron. Eng., 138(8), 968–980.
Shah, P., Strezov, V., Prince, K., and Nelson, P. (2008). “Speciation ofAs, Cr, Se and Hg under coal fired power station conditions.” Fuel,87(10–11), 1859–1869.
U.S. EPA (2012). “EPA Method 1311.” SW-846 ⟨http://www.epa.gov.osw/hazard/testmethods/sw846/pdfs/1311.pdf⟩ (Feb. 5, 2012).
Wang, J., Ban, H., Teng, X., Wang, H., and Ladwig, K. (2006). “Impacts ofpH and ammonia on the leaching of Cu(II) and Cd(II) from coal flyash.” Chemosphere, 64(11), 1892–1898.
Wang, T., Wang, J., Tang, Y., Shi, H., and Ladwig, K. (2009). “Leachingcharacteristics of arsenic and selenium from coal fly ash: Role ofcalcium.” Energy Fuels, 23(6), 2959–2966.
Zandi, M., and Russell, N. V. (2007). “Design of a leaching test frameworkfor coal fly ash accounting for environmental conditions.” Environ.Monit Assess., 131(1–3), 509–526.
JOURNAL OF ENVIRONMENTAL ENGINEERING © ASCE / MAY 2013 / 653
J. Environ. Eng. 2013.139:642-653.
Dow
nloa
ded
from
asc
elib
rary
.org
by
Uni
v O
f M
aryl
and
on 0
5/07
/13.
Cop
yrig
ht A
SCE
. For
per
sona
l use
onl
y; a
ll ri
ghts
res
erve
d.