evaluation of kentucky’s read to achieve program sy...
TRANSCRIPT
EVALUATION OF KENTUCKY’S READ TO ACHIEVE PROGRAM SY 2014–2015
Report prepared for the
Collaborative Center for Literacy Development
August 1, 2015
Evaluation Team:
Hannah Morgan, Research Assistant
Jessica Hearn, PhD, Director
Evaluation Center, College Of Education, University Of Kentucky
143D Taylor Education Building, Lexington, KY 40506
Email: [email protected]
i
ACKNOWLE DGEME NT S
The authors of this report gratefully acknowledge the invaluable contributions of the following individuals:
Jo Davis and Susan Cantrell, CCLD for their help in planning and guiding the evaluation; Judith Halasek, RTA
program coordinator; Nancy Hulan, Western Kentucky University for her help in planning and conducting
interviews; and Meg Gravil, Project Manager.
ii
TABLE OF CONTENTS Abbreviation & Definition Guide (alpha sort) .............................................................................................................. vii
Executive Summary ....................................................................................................................................................... 1
RTA teachers’ Preparation, Roles, and Responsibilities ............................................................................................ 1
RTA Students Literacy Services and Experiences ...................................................................................................... 2
Student Outcomes .................................................................................................................................................... 2
RTA Intervention Program Comparisons ................................................................................................................... 2
Pilot study to identify top performing RTA schools and quality literacy instruction ................................................ 3
Barriers and Benefits of the RTA program ................................................................................................................ 3
Conclusion ................................................................................................................................................................. 3
Recommendations .................................................................................................................................................... 4
Chapter 1: Introduction ................................................................................................................................................. 5
Background ............................................................................................................................................................... 5
Changes to Program Requirements .......................................................................................................................... 7
Prior Evaluation Findings ........................................................................................................................................... 8
Overview of the Current Study.................................................................................................................................. 8
Evaluation Report Organization ................................................................................................................................ 9
Chapter2: Evaluation Methods .................................................................................................................................... 10
Data Sources............................................................................................................................................................ 10
Surveys ................................................................................................................................................................. 10
State Sponsored Assessment Databases ............................................................................................................. 10
State Sponsored Intervention Database .............................................................................................................. 11
Semi-Structured Phone Interviews ...................................................................................................................... 11
Structured Observations ...................................................................................................................................... 11
Chapter 3: Read to Achieve Teachers .......................................................................................................................... 12
Demographics ......................................................................................................................................................... 12
Hiring ....................................................................................................................................................................... 13
Colleagues’ Perspectives ......................................................................................................................................... 13
Collaboration and Literacy Teams ........................................................................................................................... 14
Formal Collaborative Teams ................................................................................................................................ 14
RTA and Classroom Teacher Communication ...................................................................................................... 16
Classroom Teacher Involvement ......................................................................................................................... 17
Chapter 4: Read to Achieve Students .......................................................................................................................... 18
RTA Student Demographics..................................................................................................................................... 18
iii
RTA Program Entry .................................................................................................................................................. 19
Program Experience ................................................................................................................................................ 21
Program Exit ............................................................................................................................................................ 22
Parental Outreach ................................................................................................................................................... 24
Chapter 5: Student Outcomes ..................................................................................................................................... 25
Results ..................................................................................................................................................................... 25
Limitations ............................................................................................................................................................... 27
Chapter 6: Schools with Differing Characteristics ....................................................................................................... 28
Urbanicity ................................................................................................................................................................ 28
Regions .................................................................................................................................................................... 29
Library Media Centers ............................................................................................................................................. 30
Chapter 7: RTA Approved Intervention Program Comparisons ................................................................................... 31
Program Use ............................................................................................................................................................ 31
Implications of RTA Program Changes .................................................................................................................... 31
Funding .................................................................................................................................................................... 32
RTA Teacher Program Training and Confidence in Implementation ....................................................................... 33
Reading Recovery ................................................................................................................................................ 33
CIM ...................................................................................................................................................................... 34
EIR ........................................................................................................................................................................ 34
Reading Mastery .................................................................................................................................................. 34
Training and Change in Confidence ......................................................................................................................... 35
Program Characteristics .......................................................................................................................................... 35
chapter 8: Pilot Implementation Study ....................................................................................................................... 37
Methodology ........................................................................................................................................................... 37
Identifying top performing schools. .................................................................................................................... 37
Observation materials and procedure ................................................................................................................. 37
Results ..................................................................................................................................................................... 38
Teacher perceptions of factors of a successful program ........................................................................................ 40
Chapter 9: Barriers and Benefits ................................................................................................................................. 42
RTA Teacher Perspectives ....................................................................................................................................... 42
Benefits ................................................................................................................................................................ 42
Barriers ................................................................................................................................................................ 42
Administrator Perspectives ..................................................................................................................................... 43
Benefits ................................................................................................................................................................ 43
iv
Barriers ................................................................................................................................................................ 44
Classroom Teacher Perspectives ............................................................................................................................. 45
Benefits ................................................................................................................................................................ 45
Barriers ................................................................................................................................................................ 46
Conclusion ................................................................................................................................................................... 48
Summary of Findings ............................................................................................................................................... 48
RTA Grant Program Description .......................................................................................................................... 48
RTA Program Outcomes ...................................................................................................................................... 49
RTA Program Implementation ............................................................................................................................. 50
Implementation and Evaluation Challenges ........................................................................................................... 50
Implications of changes to grant-approved programs ........................................................................................ 50
Implications of changes to student tracking ........................................................................................................ 50
Data availability ................................................................................................................................................... 50
Recommendations and Future Considerations ....................................................................................................... 51
Appendix A: RTA Teacher Survey (Fall) ....................................................................................................................... A1
Appendix B: RTA Teacher Survey (Winter) ................................................................................................................. A6
Appendix C: RTA Teacher Survey (Spring) ................................................................................................................ A12
Appendix D: Traditional Classroom Teacher Survey ................................................................................................. A17
Appendix E: Administrator Survey ............................................................................................................................ A26
Appendix F: Phone Interview Prompts ..................................................................................................................... A33
v
LIST OF TABLES Table 1. RTA funding in millions of dollars and number of schools participating 2005–2015....................................... 6
Table 2. Classroom teachers and administrators’ perceptions of RTA teachers ......................................................... 14
Table 3. RTA student demographics ............................................................................................................................ 18
Table 4. Reported diagnostic assessments from phone interviews (N = 20) and RTA teacher survey (N = 321) ........ 19
Table 5. Percentage of students starting and ending by month ................................................................................. 20
Table 6. Mean student growth of RTA students with MAP assessment data ............................................................. 26
Table 7. Urbanicity codes and definitions ................................................................................................................... 28
Table 8. RTA school average fall to spring MAP growth by urbanicity (N = 204) ........................................................ 29
Table 9. RTA school average fall to spring MAP growth by region .............................................................................. 29
Table 10. RTA school average fall to spring MAP growth by quality of library media center ..................................... 30
Table 11. List of “other” programs being used by RTA teachers ................................................................................. 32
Table 12. Average RTA teacher caseload and program contact hours by program .................................................... 35
Table 13. Frequency of intervention by program (as percentages) ............................................................................ 36
Table 14. Percentage of responses by duration by program ....................................................................................... 36
Table 15. Teacher observation scores by item ............................................................................................................ 39
Table 16. Administrator perceptions of strengths of RTA (N = 335) ........................................................................... 43
Table 17. Administrator perceptions of barriers of RTA (N = 239) .............................................................................. 44
Table 18. Classroom teacher perceptions of strengths (N = 804) ............................................................................... 45
Table 19. Classroom teacher perceptions of barriers of RTA (N = 712) ...................................................................... 46
vi
LIST OF F IGURES Figure 1. Map of RTA school districts ............................................................................................................................ 5
Figure 2. Sources of additional funding (N = 144) ......................................................................................................... 7
Figure 3. RTA teacher education level (N = 321) ......................................................................................................... 12
Figure 4. Percentage of teachers by years of experience as a RTA teacher (N = 321) ................................................ 12
Figure 5. Qualifications Administrators looked for when hiring RTA Teachers (N = 98) ............................................. 13
Figure 6. Classroom teacher involvement in RTA program (N = 1,005) ...................................................................... 15
Figure 7. Frequency of RTA and classroom teacher communication .......................................................................... 16
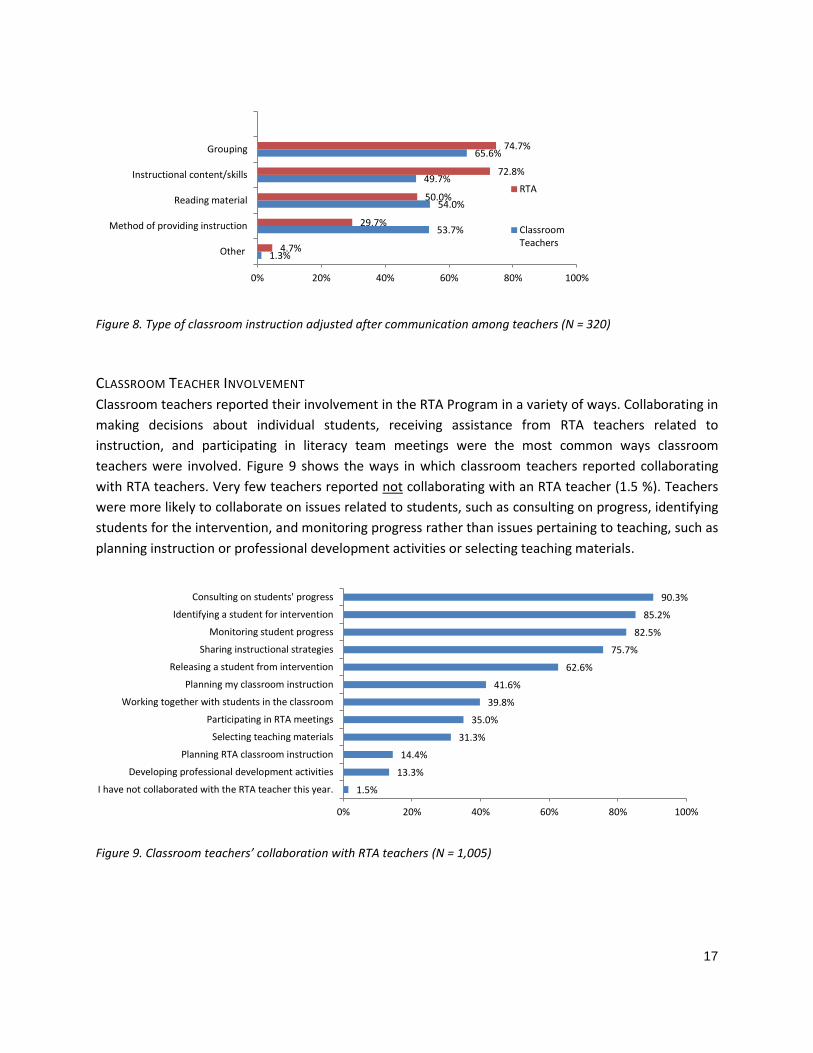
Figure 8. Type of classroom instruction adjusted after communication among teachers (N = 320) .......................... 17
Figure 9. Classroom teachers’ collaboration with RTA teachers (N = 1,005) .............................................................. 17
Figure 10. Overview of RTA student sample selection ................................................................................................ 18
Figure 11. RTA program entrance selection criteria (N = 321) .................................................................................... 19
Figure 12. Types of intervention groups used by RTA teachers .................................................................................. 21
Figure 13. Time when intervention is received (N = 321) ............................................................................................ 22
Figure 14. Person responsible for determining RTA student program exit ................................................................. 22
Figure 15. Exit criteria reported by RTA teachers (N =320) ......................................................................................... 23
Figure 16. RTA program exit results (N = 10,445) ........................................................................................................ 23
Figure 17. RTA Schools by urbanicity (N = 321) ........................................................................................................... 28
Figure 18. Map of Kentucky Regions ........................................................................................................................... 29
Figure 19. Program use reported by RTA teachers by grade in winter 2015 ............................................................... 31
Figure 20. Percentage of Administrators supplementing RTA grant funding by program .......................................... 33
Figure 21. Percentage of “new” teachers by intervention, fall 2014 (N = 321) ........................................................... 34
Figure 22. Hours of training received by RTA teachers in the Fall and Spring (N=321) ............................................... 35
Figure 23. Results by intervention program ................................................................................................................ 36
Figure 24. Example of residuals ................................................................................................................................... 37
Figure 25. Average ELLCO scores by subscale ............................................................................................................. 40
vii
ABBREVIATION & DEFINITION GUIDE (ALPHA SORT) Administrator – principal or other school leader
CIITS – Continuous Instructional Improvement Technology System
Comprehensive Intervention Model (CIM) – a systematic design for identifying struggling readers, followed by a coordinated plan for layering and matching interventions in classroom and small group settings.
Cooperative Integrated Reading and Composition (CIRC) – a small group reading and writing program for students in 2nd to 6th grades with three elements: story-related activities, direct instruction, and integrated language arts/writing1
Early Intervention in Reading (EIR) – whole classroom or small group program to help struggling students especially with phonemic awareness, phonics, and contextual analysis2
ELLCO – Early Language and Literacy Classroom Observation
Infinite Campus – provider and manager of the Kentucky Student Information System which supports Kentucky school districts to provide a secure and seamless integration for collecting data3
FRPM – Free and Reduced Priced Meals
KDE – Kentucky Department of Education
K-PREP – Kentucky Performance Rating for Educational Progress
LEP – Limited English proficiency
MAP – Measures of Academic Progress
NCES – National Center for Education Statistics
Peer Assisted Learning Strategies (PALS) – A version of class wide peer tutoring where teachers identify students who need additional help and pair them with students who can help them learn needed skills4
Reading Mastery – direct instruction program designed to provide explicit, systematic instruction in English language reading5
Reading Recovery – short term intervention of one-on-one tutoring for low-achieving first-graders6
RTA – Read to Achieve
SES – Socio-economic status
SPED – Special education
STAR – Standardized Test for Assessment of Reading
1 Source: What Works Clearing House Intervention Report (http://ies.ed.gov/ncee/wwc/interventionreport.aspx?sid=109)
2 Source: What Works Clearing House Intervention Report (http://ies.ed.gov/ncee/wwc/interventionreport.aspx?sid=156)
3 Source: Kentucky Student Information Systems (KSIS) (http://education.ky.gov/districts/tech/sis/Pages/default.aspx)
4 Source: PALS Peer Assisted Learning Strategies (https://kc.vanderbilt.edu/pals/index.html)
5 Source: What Works Clearinghouse Intervention Report (http://ies.ed.gov/ncee/wwc/interventionreport.aspx?sid=417)
6 Source: Reading Recovery Council of North America (http://readingrecovery.org/reading-recovery/teaching-children/basic-facts)
1
EXECUTIVE SUMMARY The Read to Achieve Grant Program (RTA) was established in 2005 by the Kentucky General Assembly to
help ensure students’ reading proficiency by the end of the primary grades. The RTA fund imparts
renewable, two-year grants to schools primarily for the hiring of an intervention teacher who provides
short-term, intensive instruction to students who struggle with reading. As part of the RTA grant,
schools received $48,500 at the start of the 2014–15 school year. On average, administrators reported
spending 94 percent of grant monies on teachers’ salaries and, for many schools, the RTA grant did not
cover the full cost of the program. Three-quarters of administrators reported supplementing the grant
funds in order to pay for the RTA intervention program or teacher.
This executive summary includes the major findings from the evaluation and provides recommendations
for future implementation of RTA. The evaluation was guided by the following questions:
(1) RTA teachers:
Who are the RTA teachers and what is the relationship among RTA and traditional
classroom teachers?
What are classroom teachers and administrator perceptions of RTA teachers’ roles and
responsibilities as a part of the school system?
How are RTA funds allocated?
(2) RTA students:
Who are they and what is a typical RTA student experience?
(3) Outcomes: How do RTA students’ performance on assessments change and compare to national
norms?
(4) How do the grant approved reading intervention programs compare to one another?
What are teachers’ levels of training and confidence by program?
How do the programs compare (e.g., frequency of intervention or length of
intervention)?
(5) Pilot study: Can we identify high performing RTA schools?
(6) What are the perceived barriers and benefits of the RTA program?
Perceptions across RTA teachers, classroom teachers, and administrators
RTA TEACHERS’ PREPARATION, ROLES, AND RESPONSIBILITIES
Data to explore the RTA teachers level of preparation, roles, and responsibilities was collected though
surveys, interviews and observations.
There were 321 RTA teachers (one in each RTA school) across Kentucky
The majority of RTA teachers (95.6%) are highly qualified with Ranks 1 & 2, Masters, Doctorate, or National Board Certification.
On average, RTA teachers had 17 years of total teaching experience and almost five years’ of RTA teaching experience. However, it should be noted that for one-third of RTA teachers, the 2014–15 school year was their first year as a RTA teacher.
2
Administrators report that they looked for the teacher’s overall teaching experience (81.6%), past effectiveness (79.6%), and evidence of literacy leadership (65.3%) when hiring new RTA teachers.
Initial data indicate communication between RTA and classroom teachers is beneficial to both parties. Few teachers reported not collaborating with an RTA teacher and classroom teachers report adjusting classroom instruction as a result of communication. Teachers were more likely to collaborate on issues related to students, such as consulting on progress, identifying students for the intervention, and monitoring progress.
RTA STUDENTS LITERACY SERVICES AND EXPERIENCES
There were 10,445 students served by the RTA program during the 2014–15 school year. This is
1,300 less students than last year.
First-graders were the most widely served group (43.6%), followed by second-graders (23.0%),
kindergarteners (18.9%), and third graders (14.5%).
RTA teachers indicated program selection was based on a universal performance screener
(95.3%) and/or a classroom teacher referral (90.3%), and about one-third (32.4%) of RTA
teachers reported using multiple assessments.
Nearly half of RTA teachers (45.2%) reported beginning interventions three weeks after the start
of the school year and over one-third reported beginning interventions one to two weeks after
the start of the school year.
The intervention was mostly provided through one-on-one instruction or in small groups of four
to five students. Students most often received the intervention during literacy or other content
area time. The RTA teacher most often determined when the students are ready to exit the RTA
program.
STUDENT OUTCOMES
RTA students’ MAP reading scores were significantly higher at spring administration compared
to fall administration.
Overall, RTA student fall to spring growth on the MAP Assessment was 17.1 points for
kindergarteners, 15.8 points for 1st graders, 17.1 for 2nd graders, and 13.4 points for 3rd graders.
Second and 3rd grade RTA students’ growth was greater than the average predicted growth
indicating 2nd and 3rd grade RTA students are making gains and closing the achievement gap.
Kindergarten and 1st grade students are showing growth in reading across the school year, but
this growth is comparable to national norms.
RTA student gains from fall to spring vary somewhat by urbanicity with suburban students
gaining the least with 14.22 and urban students gaining the most at 16.79.
RTA INTERVENTION PROGRAM COMPARISONS
During the 2014–15 school year, the RTA grant limited the choice of interventions to only approved
programs. Therefore, data collected for the current evaluation compares the RTA grant-approved
intervention programs: EIR, Reading Recovery, CIM, or Reading Mastery.
3
The majority of schools (73.1%) indicate they use Reading Recovery.
Over the year, RTA teachers’ caseloads averaged 33 students.
On average, RTA teachers served the most students using EIR, followed by CIM and Reading
Mastery. Reading Recovery tended to serve fewer students due to its one-on-one nature.
Most interventions occurred daily and lasted an average of 30 minutes.
Reading Recovery had the highest percentage (54.6%) of students who successfully exited the
program.
Most teachers (77.2%) received their training through face-to-face sessions. However, webinars (36.9%) and graduate classes (16.3%) were also reported.
Nearly all teachers (91.6 %) reported feeling Very Confident or Fairly Confident implementing their intervention.
PILOT STUDY TO IDENTIFY TOP PERFORMING RTA SCHOOLS AND QUALITY LITERACY INSTRUCTION
The data used to determine top performing schools included all students in the school, not only
RTA intervention students. This means “top performing” does not necessarily reflect the quality
of the RTA funded interventions.
Nineteen classrooms were observed to pilot the feasibility of using the ELLCO as a means to
capture classroom literacy practices across classrooms. The process was time intensive and the
recommendation is to develop an instrument that would capture extent of use of best-practices
across various classrooms instead of observing.
Data used for analysis was from 2013. Since the schools receiving funding potentially change
each year, not all current RTA schools had received a RTA grant in 2013; these schools were
included in the analyses as RTA schools even if they did not have a RTA program in 2013.
Proficiency on the K-PREP was used as the outcome variable despite the fact that K-PREP is
administered to third, fourth, and fifth-grade students and does not reflect proficiency of the
intended RTA Grant Program beneficiaries (K-3 students).
BARRIERS AND BENEFITS OF THE RTA PROGRAM
The greatest benefit was that it helped students who might not otherwise receive intervention and that the program helped raise student confidence and scores.
Administrators reported that the training and support for teachers, as well as, the small group instruction was a benefit.
Both teachers and administrators reported that cost (needing more money) was a barrier, that there were too many students who needed help, and that time and space were limited to help so many.
CONCLUSION
The results of the evaluation indicate that RTA teachers are highly qualified and teachers and
administration value the work RTA teachers do. There is strong evidence of collaboration and work in
literacy teams and the RTA teachers are an integral part of the school system. Literacy teams meet
frequently and work together to meet the needs of the students. Students are receiving intensive
4
(almost daily) services and show gains in skill. Students are exiting the program; however, a large
percentage still continue in the intervention or are moved to a different intervention.
RECOMMENDATIONS
This evaluation indicates that RTA is serving a large number of students in Kentucky. Administrators are
using RTA funds to hire qualified teachers who are involved in the school, as well as, providing almost
daily direct instruction to struggling readers. While there are many students being served through the
interventions, there need to be more students reaching proficiency and exiting the program. The
evaluation suggests the following recommendations:
Focus on RTA Grant Program implementation. Assurance of RTA implementation fidelity will
result in more meaningful results.
Continue training efforts. With so many new teachers, training will improve consistency.
Expand the RTA Grant Program at RTA schools. Overwhelmingly, stakeholders expressed
student need exceeding program capacity. RTA teachers were not always able to reach all
students who needed the intervention services. Increasing the number of available slots,
increasing the time available for RTA interventions to occur, and/or increasing the number of
literacy specialists are three possible solutions.
Continue parental involvement. There is evidence of parental outreach. Teachers and
administrators can seek to understand what more parents may need.
Consider the use of a universal literacy assessment at RTA schools. To ensure all RTA schools
are considered when assessing student outcomes it is important to have a universal measure
that would allow measurement before program participation and after program completion.
Explore program factors related to student outcomes. School collaboration, RTA teacher
experience, and the intervention program used may be additional areas to explore. Additionally,
comparing high performing and low performing RTA schools may allow for a better
understanding of factors related to student success.
Examine alternate observation measures. Finding a new measure, or modifying the current
measure, to assess the quality of literacy specifically in intervention settings will provide more
meaningful results.
5
CHAPTER 1: INTRODUCTION
BACKGROUND
The Read to Achieve Grant Program (RTA) was established in 2005 by the Kentucky General Assembly to
help ensure students’ reading proficiency by the end of the primary grades. The RTA fund imparts
renewable, two-year grants to schools primarily for the hiring of an intervention teacher who provides
short-term intensive instruction to students who struggle with reading. The Read to Achieve Act of 2005
replaced former legislation that created the Early Reading Incentive Grant Program, which had been in
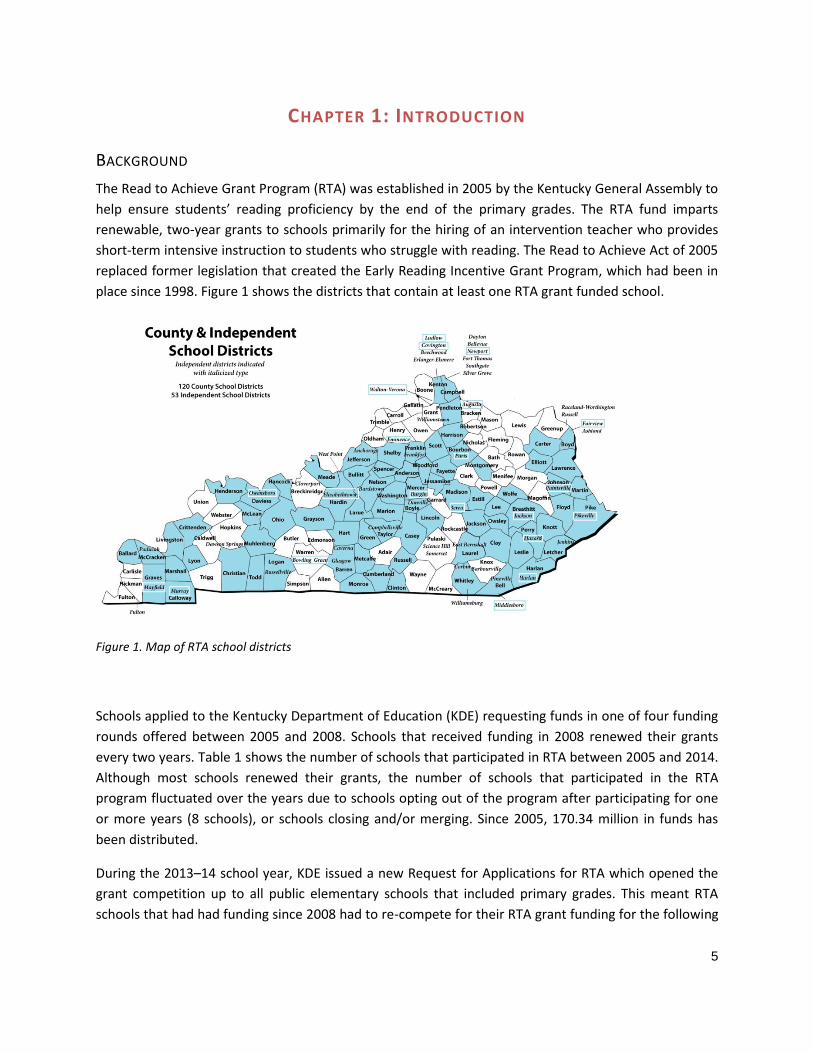
place since 1998. Figure 1 shows the districts that contain at least one RTA grant funded school.
Figure 1. Map of RTA school districts
Schools applied to the Kentucky Department of Education (KDE) requesting funds in one of four funding
rounds offered between 2005 and 2008. Schools that received funding in 2008 renewed their grants
every two years. Table 1 shows the number of schools that participated in RTA between 2005 and 2014.
Although most schools renewed their grants, the number of schools that participated in the RTA
program fluctuated over the years due to schools opting out of the program after participating for one
or more years (8 schools), or schools closing and/or merging. Since 2005, 170.34 million in funds has
been distributed.
During the 2013–14 school year, KDE issued a new Request for Applications for RTA which opened the
grant competition up to all public elementary schools that included primary grades. This meant RTA
schools that had had funding since 2008 had to re-compete for their RTA grant funding for the following
6
academic year (2014-2015). The new (current) cohort of RTA schools included 67 new schools. In
addition, some previously funded schools did not have successful grant proposals.
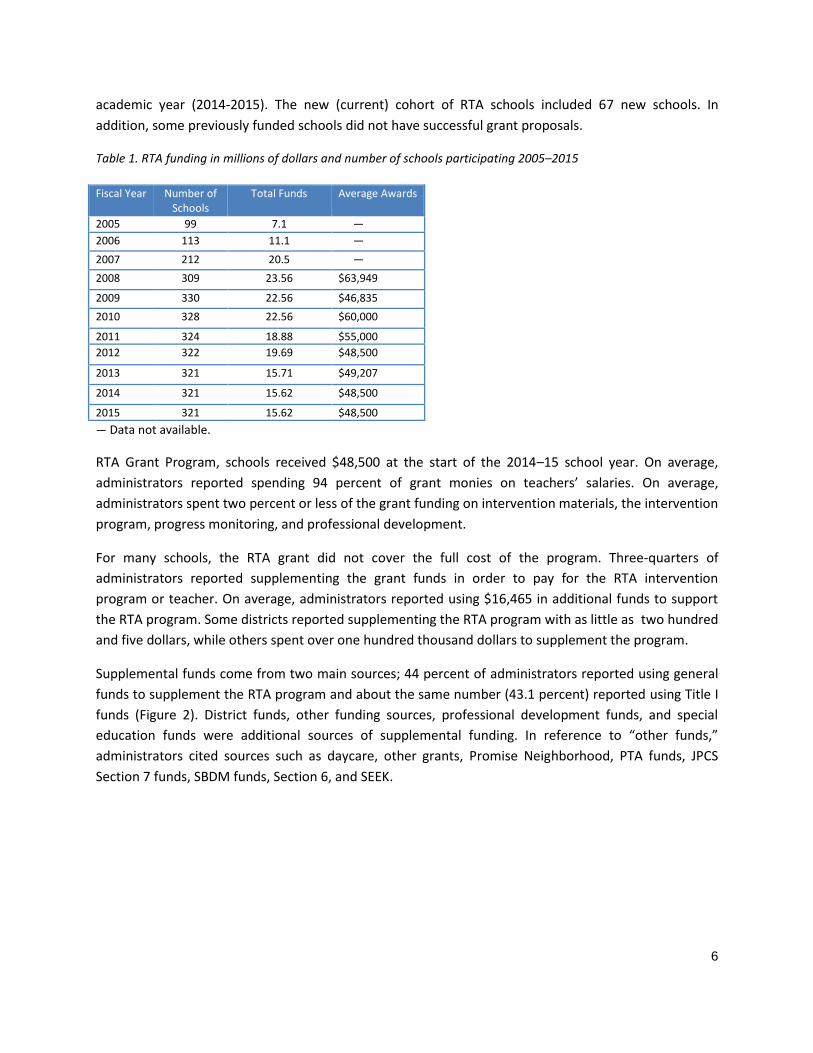
Table 1. RTA funding in millions of dollars and number of schools participating 2005–2015
Fiscal Year Number of Schools
Total Funds Average Awards
2005 99 7.1 —
2006 113 11.1 —
2007 212 20.5 —
2008 309 23.56 $63,949
2009 330 22.56 $46,835
2010 328 22.56 $60,000
2011 324 18.88 $55,000
2012 322 19.69 $48,500
2013 321 15.71 $49,207
2014 321 15.62 $48,500
2015 321 15.62 $48,500
— Data not available.
RTA Grant Program, schools received $48,500 at the start of the 2014–15 school year. On average,
administrators reported spending 94 percent of grant monies on teachers’ salaries. On average,
administrators spent two percent or less of the grant funding on intervention materials, the intervention
program, progress monitoring, and professional development.
For many schools, the RTA grant did not cover the full cost of the program. Three-quarters of
administrators reported supplementing the grant funds in order to pay for the RTA intervention
program or teacher. On average, administrators reported using $16,465 in additional funds to support
the RTA program. Some districts reported supplementing the RTA program with as little as two hundred
and five dollars, while others spent over one hundred thousand dollars to supplement the program.
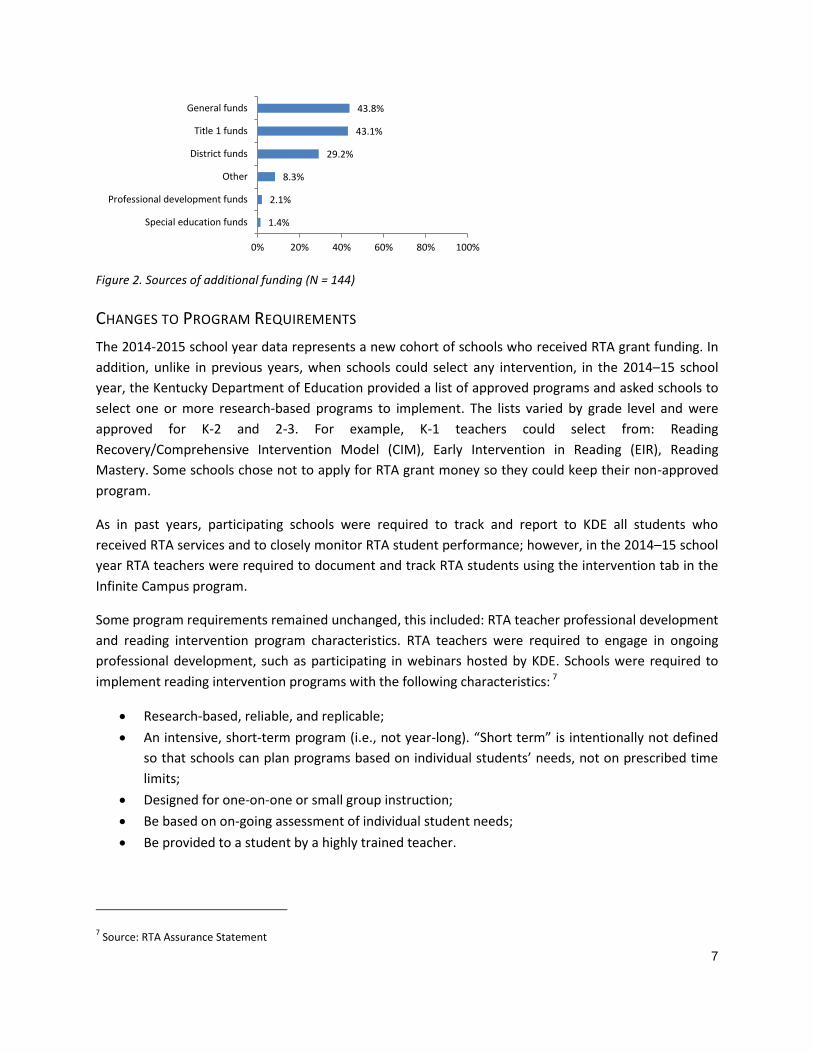
Supplemental funds come from two main sources; 44 percent of administrators reported using general
funds to supplement the RTA program and about the same number (43.1 percent) reported using Title I
funds (Figure 2). District funds, other funding sources, professional development funds, and special
education funds were additional sources of supplemental funding. In reference to “other funds,”
administrators cited sources such as daycare, other grants, Promise Neighborhood, PTA funds, JPCS
Section 7 funds, SBDM funds, Section 6, and SEEK.
7
Figure 2. Sources of additional funding (N = 144)
CHANGES TO PROGRAM REQUIREMENTS
The 2014-2015 school year data represents a new cohort of schools who received RTA grant funding. In
addition, unlike in previous years, when schools could select any intervention, in the 2014–15 school
year, the Kentucky Department of Education provided a list of approved programs and asked schools to
select one or more research-based programs to implement. The lists varied by grade level and were
approved for K-2 and 2-3. For example, K-1 teachers could select from: Reading
Recovery/Comprehensive Intervention Model (CIM), Early Intervention in Reading (EIR), Reading
Mastery. Some schools chose not to apply for RTA grant money so they could keep their non-approved
program.
As in past years, participating schools were required to track and report to KDE all students who
received RTA services and to closely monitor RTA student performance; however, in the 2014–15 school
year RTA teachers were required to document and track RTA students using the intervention tab in the
Infinite Campus program.
Some program requirements remained unchanged, this included: RTA teacher professional development
and reading intervention program characteristics. RTA teachers were required to engage in ongoing
professional development, such as participating in webinars hosted by KDE. Schools were required to
implement reading intervention programs with the following characteristics: 7
Research-based, reliable, and replicable;
An intensive, short-term program (i.e., not year-long). “Short term” is intentionally not defined
so that schools can plan programs based on individual students’ needs, not on prescribed time
limits;
Designed for one-on-one or small group instruction;
Be based on on-going assessment of individual student needs;
Be provided to a student by a highly trained teacher.
7 Source: RTA Assurance Statement
1.4%
2.1%
8.3%
29.2%
43.1%
43.8%
0% 20% 40% 60% 80% 100%
Special education funds
Professional development funds
Other
District funds
Title 1 funds
General funds
8
As part of the Read to Achieve Act of 2005, the Collaborative Center for Literacy Development (CCLD)
was charged by the General Assembly to create a research agenda to evaluate the impact of the Read to
Achieve programs on student achievement in reading.
PRIOR EVALUATION FINDINGS
Prior evaluations have focused on implementation, as well as, achievement outcomes. The results of
these studies have shown that most RTA students show more progress than their age-group peers
regardless of socio-economic or geographic factors. The implementation evaluation provided evidence
of fidelity with program expectations and that, overall, RTA was well implemented. In addition, reported
perceptions of administration and teachers emphasized how important RTA was in meeting the needs of
struggling readers.
Previous RTA evaluation reports highlighted the fact that there are other sources and methods of
intervention delivery in RTA schools, in addition to RTA teachers and programs. For example, schools
may use intervention programs and materials not funded by RTA. There may also be teachers who teach
RTA intervention, but are not funded by RTA. Finally, it is possible students may receive multiple
interventions during the same year or even at the same time. It is difficult to separate the effects of
these sources from the effects of RTA on students’ reading achievement. Therefore, this evaluation uses
methods that are primarily descriptive in nature and does not attempt to connect students’ reading
achievement causally to RTA.
OVERVIEW OF THE CURRENT STUDY
The evaluation used a mixed-methods approach to provide a holistic perspective on all the components.
Achievement data were collected from all 321 RTA schools. In addition, RTA teachers, classroom
teachers, and school administrators completed surveys that captured the nature of the intervention and
the collaboration within each school. The key research questions that guided this evaluation were:
(1) RTA teachers:
Who are the RTA teachers and what is the relationship among RTA and traditional
classroom teachers?
What are classroom teachers and administrator perceptions of RTA teachers’ roles and
responsibilities as a part of the school system?
How are RTA funds allocated?
(2) RTA students:
Who are they and what is a typical RTA student experience?
(3) Outcomes: How do RTA students’ performance on assessments change and compare to national
norms?
(4) How do the grant approved programs compare to one another?
What are teachers’ level of training and confidence by program?
How do the programs compare (frequency of intervention, length of intervention)?
(5) Pilot study: Can we identify high performing RTA schools?
9
(6) What are the perceived barriers and benefits of the RTA program?
Perceptions across RTA teachers, classroom teachers, and administrators
EVALUATION REPORT ORGANIZATION
This report includes 9 chapters, in addition to the introductory chapter. Chapter 2 describes the
evaluation methods used to answer the evaluation questions. Chapter 3 describes the Read to Achieve
teachers and teachers’ and administrator perceptions of RTA teachers as part of the system of education
in the school. Chapter 4 explores the Read to Achieve students and parental outreach. Chapter 5
explores student outcomes and Chapter 6 examines the differing characteristics including urbanicity,
library media centers, and geographic location of the schools. Chapter 7 compares the reading
intervention programs. Chapter 8 describes the pilot implementation study intended to quantify the
quality of instruction. Chapter 9 discusses the barriers and benefits of the RTA program as identified by
RTA teachers, classroom teachers, and school administrators. Chapter 10 provides conclusions and
recommendations.
10
CHAPTER2: EVALUATION METHODS This chapter addresses how the evaluation was designed and conducted. The evaluation was a quasi-
experimental, mixed methods approach to provide a holistic, contextual, perspective of the project
(Creswell & Plano Clark 2007; Creswell 2003). The evaluation was guided by legislative requirements in
addition to questions related to RTA program implementation.
DATA SOURCES
The evaluation uses many data sources in order to answer the identified research questions.
Quantitative and qualitative data were used to provide an accurate, complete depiction of the RTA
intervention. Data sources included: surveys, state sponsored assessment databases, a state sponsored
intervention database, semi-structured phone interviews, and structured observations. Data collection
instruments are described below.
SURVEYS
All 321 RTA teachers were asked to complete three separate online surveys at three points during the
2014–15 school year: September, January, and May. The September and May surveys yielded a 100
percent response rate (N = 321). The response rate for the January survey was 99.7 percent (N = 320).
The survey questions can be found in Appendices A, B, and C.
RTA teachers were asked to forward a link to an online survey or hand out a hard copy survey to
classroom teachers of grades K-3 at their schools in May 2015. Respondents had the option of
responding to the 28 questions survey online or by mail; 936 teachers completed the survey online and
69 teachers opted to respond to the survey by mail. Teachers from three-quarters (74.5 percent) of RTA
schools had at least one classroom teacher respond; on average, four teachers responded per school.
The survey questions can be found in Appendix D.
School-level administrators (e.g. principals) at all RTA schools were asked to complete an 18 question
online survey in April 2015. Survey questions covered topics such as funding, RTA teacher ratings, and
perceived benefits and challenges. In total, 144 Administrators from 139 schools responded. The survey
questions can be found in Appendix E.
STATE SPONSORED ASSESSMENT DATABASES
Student assessment scores for Kentucky students in kindergarten through third grade were provided by
KDE and were obtained from the CIITS database (N = 218,131). The CIITS database has demographic
information and state mandated assessment data (K-PREP) on all Kentucky students. If schools use MAP
or STAR assessments to evaluate early elementary students, the CIITS database also contains those
assessment scores. Data used was from the 2014–15 school year.
11
In addition to the CIITS database, KPREP assessment data was also obtained from the KDE. K-PREP data
and student demographic information from the 2012–13 school year was used to identify the top ten
RTA schools.8
STATE SPONSORED INTERVENTION DATABASE
As part of the RTA grant, schools were asked to record and track student information in a KDE sponsored
online portal—Infinite Campus. Using a special section of the portal (referred to as the “Intervention
Tab”), RTA teachers recorded information related to student entry/exit dates, length, duration, and the
intervention program used. Data for RTA students in kindergarten through third grade were obtained for
the 2014–15 school year (N = 10,442).
SEMI-STRUCTURED PHONE INTERVIEWS
Phone interviews were conducted with RTA teachers (N = 10) and first-grade traditional classroom
teachers (N = 10) at schools identified as top performers.9 Interviews were conducted by two
researchers over a two week period in May 2015. Each interview lasted approximately 20 minutes. The
interview prompts can be found in Appendix F.
STRUCTURED OBSERVATIONS
Using the Early Language and Literacy Classroom Observation K-3 tool, three researchers observed nine
elementary schools across the state of Kentucky. To establish inter-rater reliability, all the researchers
observed the first school. After the initial reliability observation, observations were conducted by one
researcher per school during a three week period at the end of April and beginning of May 2015.
Researchers observed a traditional first-grade classroom as well as a RTA teacher’s classroom.
Observations lasted around two hours per classroom and were scheduled during literacy instruction.
8 In order to begin scheduling school observations before the end of the school year, data available at the time were used
rather than more recent data. 9 Chapter 8 describes how top performing schools were identified.
12
CHAPTER 3: READ TO ACHIEVE TEACHERS RTA teachers are a major component of the RTA program. They are tasked with implementing the RTA
Grant Program approved intervention programs, are often the main contact
between grant administrators and schools, and have direct, day-to-day
interactions with the intended beneficiaries of the grant (the students).
Since RTA teachers play such a vital role in the RTA Grant Program, it is
important to understand who they are, the amount of training they
received, how they were hired, and how they are perceived by their
colleagues.
DEMOGRAPHICS
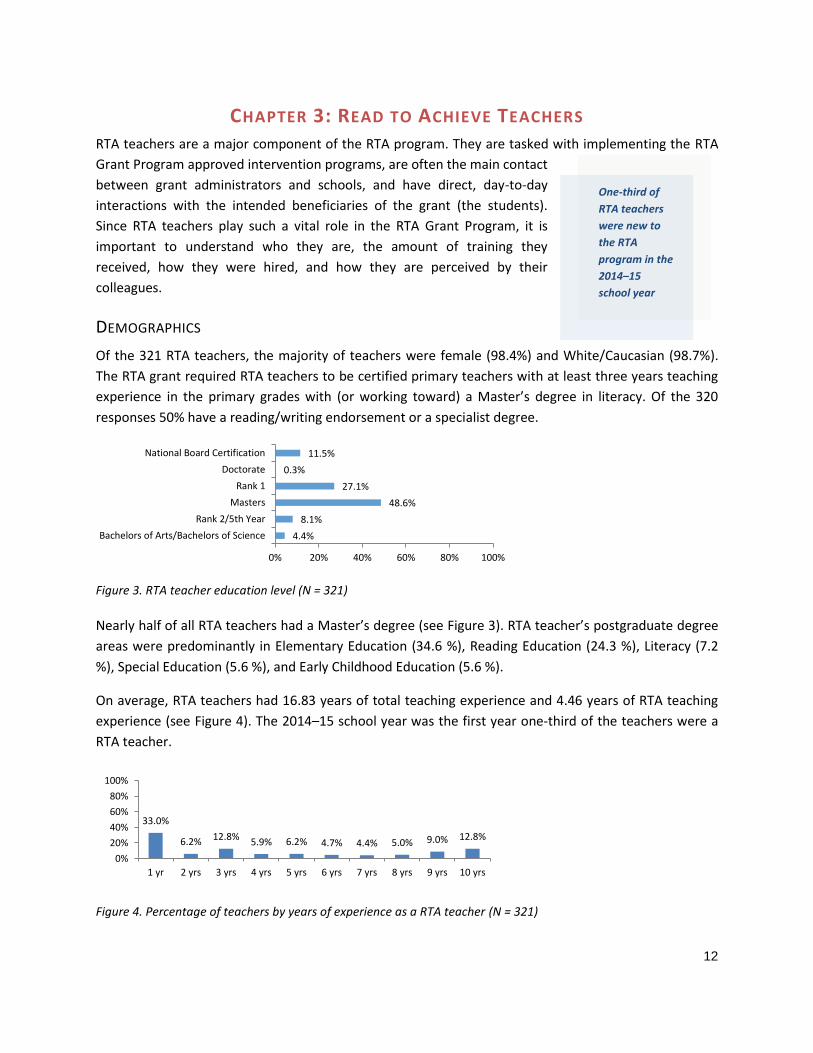
Of the 321 RTA teachers, the majority of teachers were female (98.4%) and White/Caucasian (98.7%).
The RTA grant required RTA teachers to be certified primary teachers with at least three years teaching
experience in the primary grades with (or working toward) a Master’s degree in literacy. Of the 320
responses 50% have a reading/writing endorsement or a specialist degree.
Figure 3. RTA teacher education level (N = 321)
Nearly half of all RTA teachers had a Master’s degree (see Figure 3). RTA teacher’s postgraduate degree
areas were predominantly in Elementary Education (34.6 %), Reading Education (24.3 %), Literacy (7.2
%), Special Education (5.6 %), and Early Childhood Education (5.6 %).
On average, RTA teachers had 16.83 years of total teaching experience and 4.46 years of RTA teaching
experience (see Figure 4). The 2014–15 school year was the first year one-third of the teachers were a
RTA teacher.
Figure 4. Percentage of teachers by years of experience as a RTA teacher (N = 321)
4.4%
8.1%
48.6%
27.1%
0.3%
11.5%
0% 20% 40% 60% 80% 100%
Bachelors of Arts/Bachelors of Science
Rank 2/5th Year
Masters
Rank 1
Doctorate
National Board Certification
33.0%
6.2% 12.8% 5.9% 6.2% 4.7% 4.4% 5.0% 9.0% 12.8%
0%
20%
40%
60%
80%
100%
1 yr 2 yrs 3 yrs 4 yrs 5 yrs 6 yrs 7 yrs 8 yrs 9 yrs 10 yrs
One-third of
RTA teachers
were new to
the RTA
program in the
2014–15
school year
13
HIRING
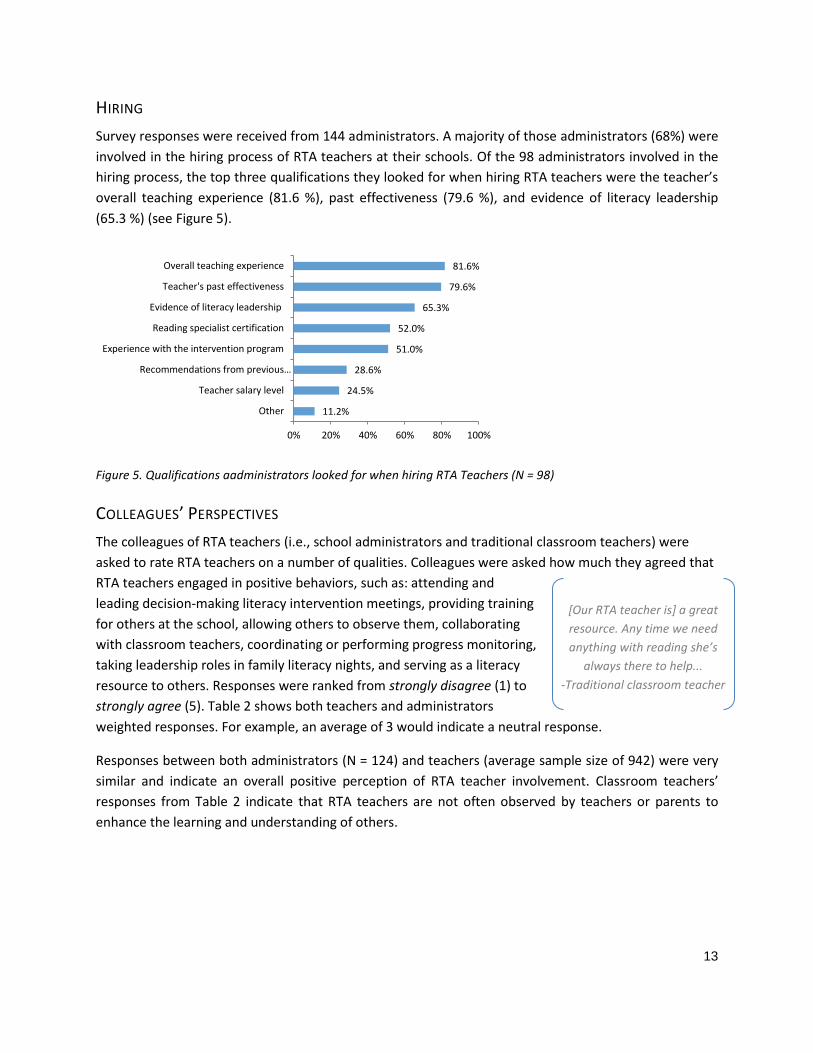
Survey responses were received from 144 administrators. A majority of those administrators (68%) were
involved in the hiring process of RTA teachers at their schools. Of the 98 administrators involved in the
hiring process, the top three qualifications they looked for when hiring RTA teachers were the teacher’s
overall teaching experience (81.6 %), past effectiveness (79.6 %), and evidence of literacy leadership
(65.3 %) (see Figure 5).
Figure 5. Qualifications aadministrators looked for when hiring RTA Teachers (N = 98)
COLLEAGUES’ PERSPECTIVES
The colleagues of RTA teachers (i.e., school administrators and traditional classroom teachers) were
asked to rate RTA teachers on a number of qualities. Colleagues were asked how much they agreed that
RTA teachers engaged in positive behaviors, such as: attending and
leading decision-making literacy intervention meetings, providing training
for others at the school, allowing others to observe them, collaborating
with classroom teachers, coordinating or performing progress monitoring,
taking leadership roles in family literacy nights, and serving as a literacy
resource to others. Responses were ranked from strongly disagree (1) to
strongly agree (5). Table 2 shows both teachers and administrators
weighted responses. For example, an average of 3 would indicate a neutral response.
Responses between both administrators (N = 124) and teachers (average sample size of 942) were very
similar and indicate an overall positive perception of RTA teacher involvement. Classroom teachers’
responses from Table 2 indicate that RTA teachers are not often observed by teachers or parents to
enhance the learning and understanding of others.
11.2%
24.5%
28.6%
51.0%
52.0%
65.3%
79.6%
81.6%
0% 20% 40% 60% 80% 100%
Other
Teacher salary level
Recommendations from previous…
Experience with the intervention program
Reading specialist certification
Evidence of literacy leadership
Teacher's past effectiveness
Overall teaching experience
[Our RTA teacher is] a great
resource. Any time we need
anything with reading she’s
always there to help...
-Traditional classroom teacher
14
Table 2. Classroom teachers and administrators’ perceptions of RTA teachers
Teachers Average N= 942
Administrators N = 124
Mean Mean
Attends decision-making literacy intervention meetings 4.43 4.55
Leads decision making literacy intervention meetings 4.10 4.20
Provides training for others in their school and/or district 3.85 3.98
Lessons are observed 3.39 4.24
Collaborates with classroom teachers 4.38 4.56
Coordinates and/or performs progress monitoring duties for their intervention students as well as other RTI students at their school
4.43 4.60
Take leadership role for family literacy nights 4.14 4.09
Serves as a literacy resource to others 4.40 4.40
Both administrators and classroom teachers generally reported strongly agree or agree with statements
related to RTA teacher qualities. Still, over one-fifth of administrators and classroom teachers strongly
disagreed, disagreed, or neither agreed nor disagreed with statements related to RTA teacher
leadership, including: leading decision making literacy intervention meetings, providing training for
others in their school and/or district, and taking a leadership role for family literacy nights. Additionally,
Table 2 shows that many traditional classroom teachers strongly disagreed, disagreed, or neither agreed
nor disagreed that RTA teachers’ lessons were observed by parents or teachers to enhance the learning
and/or understanding of others.
COLLABORATION AND LITERACY TEAMS
Although RTA teachers are important stakeholders in the RTA Grant Program, students spend only a
small portion of the day with them receiving the intervention. During the remainder of the school day
students spend time in their traditional classrooms; therefore, it is important to understand how
traditional and RTA teachers interact and collaborate.
FORMAL COLLABORATIVE TEAMS
Generally, classroom and RTA teachers report collaborating with one another. Ninety-one percent of the
321 RTA schools have a form ally identified literacy or RTA team. Nearly all (99.3%) of the RTA teachers
are on the team. Principals are part of the team in 95.2% of the groups and traditional classroom
teachers (84%) are reported as participants. Other interventionists were reported in 59.1% of the cases,
a data coordinator (56%), and a parent (15.1%). Counselors, Special Education teachers, Title I teachers,
and Curriculum Specialists are a few examples of the types of “other interventionists” RTA teachers
indicated were part of the literacy/RTA team.
The frequency of literacy/RTA team meetings varied across the 291 responses. The majority of
responses (36.4%) indicated they met once a month or as needed (24.1%). Some reported meeting once
a week (9.6%), two times per month (10%) or four times per year (8.9%). Teachers interviewed
15
expressed how important regular meetings were to them. Teachers reported many benefits of regular
meetings. Verbatim teacher responses are below:
We talk about whether their goals have been met, where they’re falling short, and just collaborate to see what we need to be doing together as a group. That’s one of the meetings we always do very faithfully. It gives us a lot of insight into what’s still going on. (Teacher; AY 14)
We talk about what needs to be done and what we can improve on. ... Being able to see [the principal] and sit down and talk to him and seeing everybody and hearing how your students are doing in other classrooms, it’s really helpful for how you drive your instruction. (Teacher; AY 14)
There were 291 responses to the question of who leads the RTA meetings. Principals or other administrators tended to lead team meetings (47%), although RTA teachers reported leading team meetings at over one-third (33%) of schools. Data coordinators led 11 percent of the groups and others were mentioned 8 percent of the time. The traditional classroom teacher was reported as leading team meetings in one percent of the responses.
[The] collaboration, those monthly meetings, is where we really get into the meat. We have all the interventionists in there and all the classroom teachers for that grade level attend those meetings also with our district RTI coordinator. So, that’s where we make our decisions for what each student needs. That is really the backbone of our program.” (Teacher; AY 14)
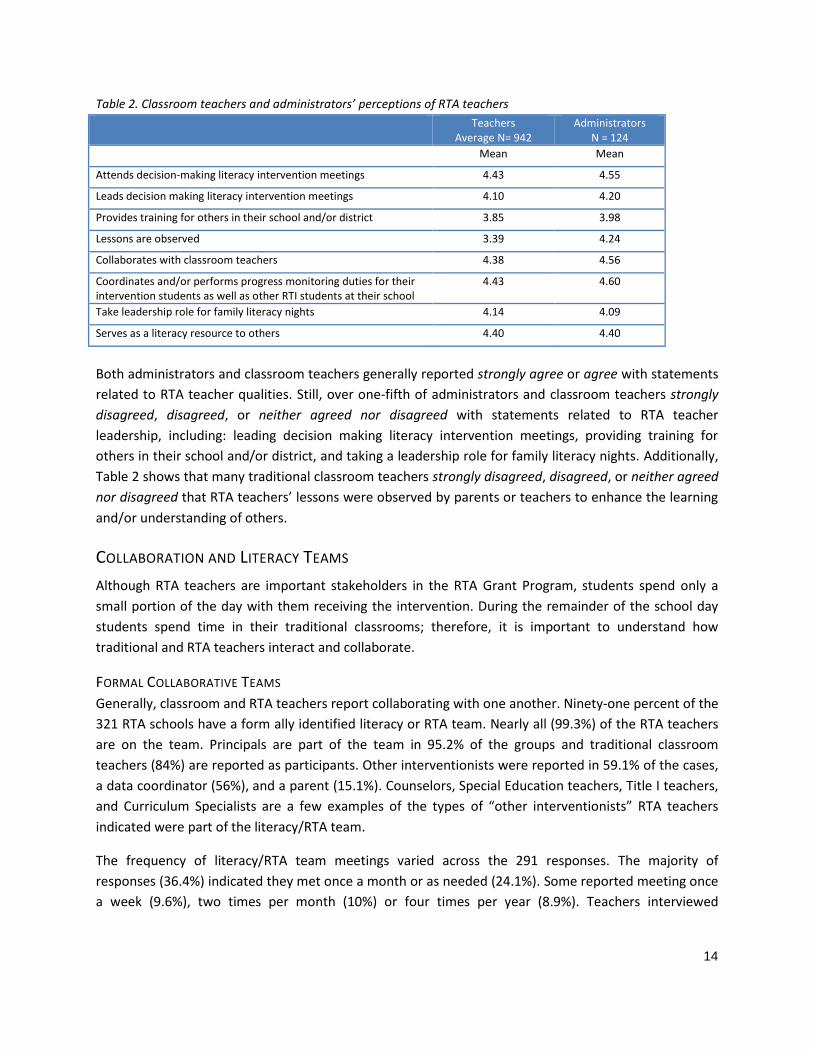
RTA teachers assist the program in a variety of ways. Figure 6 shows the different ways they are contributing with both the teachers and the school as a whole. Their greatest involvement is with making decisions about individual students
Figure 6. Classroom teacher involvement in RTA program (N = 1,005)
6.4%
8.8%
14.0%
26.4%
26.8%
41.0%
57.0%
64.5%
0% 20% 40% 60% 80% 100%
Collaborated in developing and/or providing professionaldevelopment
Assisted in selecting teaching materials
Observation of RTA teacher
Participated in professional development conducted by RTAteacher
Collaborated in planning RTA instruction
Participated in Literacy team meetings
Received assistance from RTA teacher related to yourinstruction
Collaborated in making decisions about individual students'
16
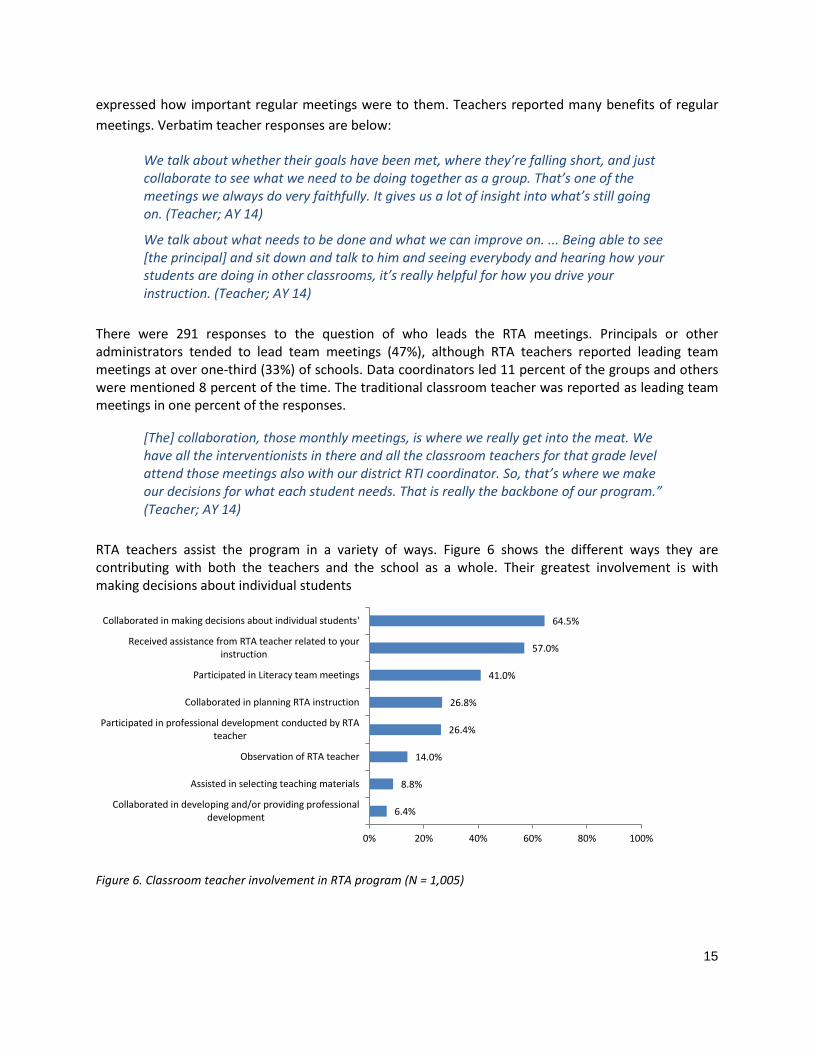
RTA TEACHER AND CLASSROOM TEACHER COMMUNICATION
In addition to formal meetings, teachers interviewed at “top performing”
RTA schools also reported frequent informal check-ins. Check-ins might
happen when returning a student to a classroom, over lunch, during
planning time, or via email. RTA and classroom teachers reported sharing
student records and data and emphasized more frequent communication
if a student was new to the program. Some RTA teachers expressed
frustration over the lack of time available for meeting with classroom
teachers, citing a significant caseload as a barrier.
Figure 7. Frequency of RTA and classroom teacher communication
Across all RTA schools, RTA teachers and classroom teachers tended to communicate on a regular basis
although the reported frequency varied by teacher type (RTA or classroom); 61 % of RTA teachers
reported communicating once a week whereas 40 % of classroom teachers reported the same (see
Figure 7). The differences in perception may be because RTA teachers may communicate weekly with
classroom teachers, but not the same teacher(s) each week.
Initial data indicate communication between RTA and classroom teachers is beneficial to both parties;
teachers adjusted their classroom instruction as a result of communication. RTA teachers were receptive
to classroom teachers’ feedback and suggestions; nearly all (96.5 %) adjusted their classroom instruction
based on communication with classroom teachers. Many classroom teachers were equally receptive to
RTA teachers; 82 % adjusted their classroom instruction after communicating with RTA teachers. Data
suggest different types of teachers had differing areas of expertise; RTA teachers adjusted their
grouping and instructional content/skills most often while classroom teachers tended to adjust their
reading material and method of providing instruction (see Figure 8).
9.7%
61.0%
29.2%
19.3%
39.7% 33.6%
0%
20%
40%
60%
80%
100%
Once a Month Once a Week Daily
RTA teachers (N = 318)
Classroom teachers (N = 906)
[The RTA teacher] tells me
strategies that she uses in RR
and I try to mock those
strategies in my class.
-Traditional classroom teacher
17
Figure 8. Type of classroom instruction adjusted after communication among teachers (N = 320)
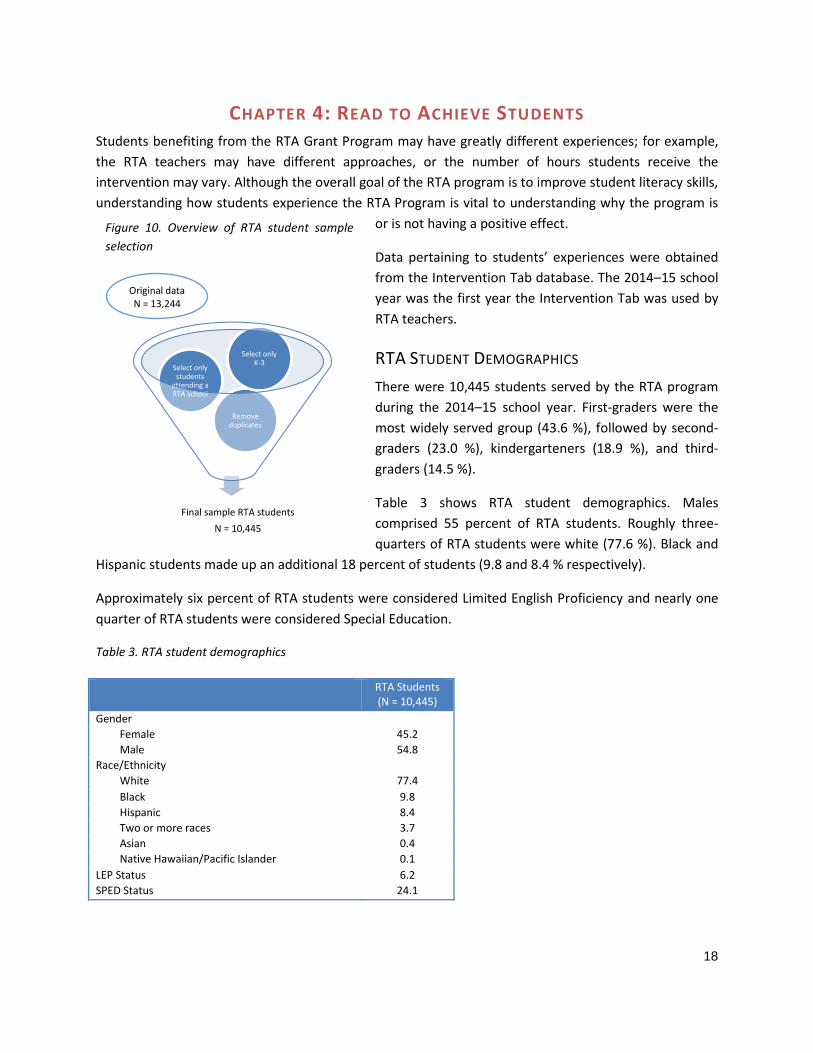
CLASSROOM TEACHER INVOLVEMENT
Classroom teachers reported their involvement in the RTA Program in a variety of ways. Collaborating in
making decisions about individual students, receiving assistance from RTA teachers related to
instruction, and participating in literacy team meetings were the most common ways classroom
teachers were involved. Figure 9 shows the ways in which classroom teachers reported collaborating
with RTA teachers. Very few teachers reported not collaborating with an RTA teacher (1.5 %). Teachers
were more likely to collaborate on issues related to students, such as consulting on progress, identifying
students for the intervention, and monitoring progress rather than issues pertaining to teaching, such as
planning instruction or professional development activities or selecting teaching materials.
Figure 9. Classroom teachers’ collaboration with RTA teachers (N = 1,005)
1.3%
53.7%
54.0%
49.7%
65.6%
4.7%
29.7%
50.0%
72.8%
74.7%
0% 20% 40% 60% 80% 100%
Other
Method of providing instruction
Reading material
Instructional content/skills
Grouping
RTA
ClassroomTeachers
1.5%
13.3%
14.4%
31.3%
35.0%
39.8%
41.6%
62.6%
75.7%
82.5%
85.2%
90.3%
0% 20% 40% 60% 80% 100%
I have not collaborated with the RTA teacher this year.
Developing professional development activities
Planning RTA classroom instruction
Selecting teaching materials
Participating in RTA meetings
Working together with students in the classroom
Planning my classroom instruction
Releasing a student from intervention
Sharing instructional strategies
Monitoring student progress
Identifying a student for intervention
Consulting on students' progress
18
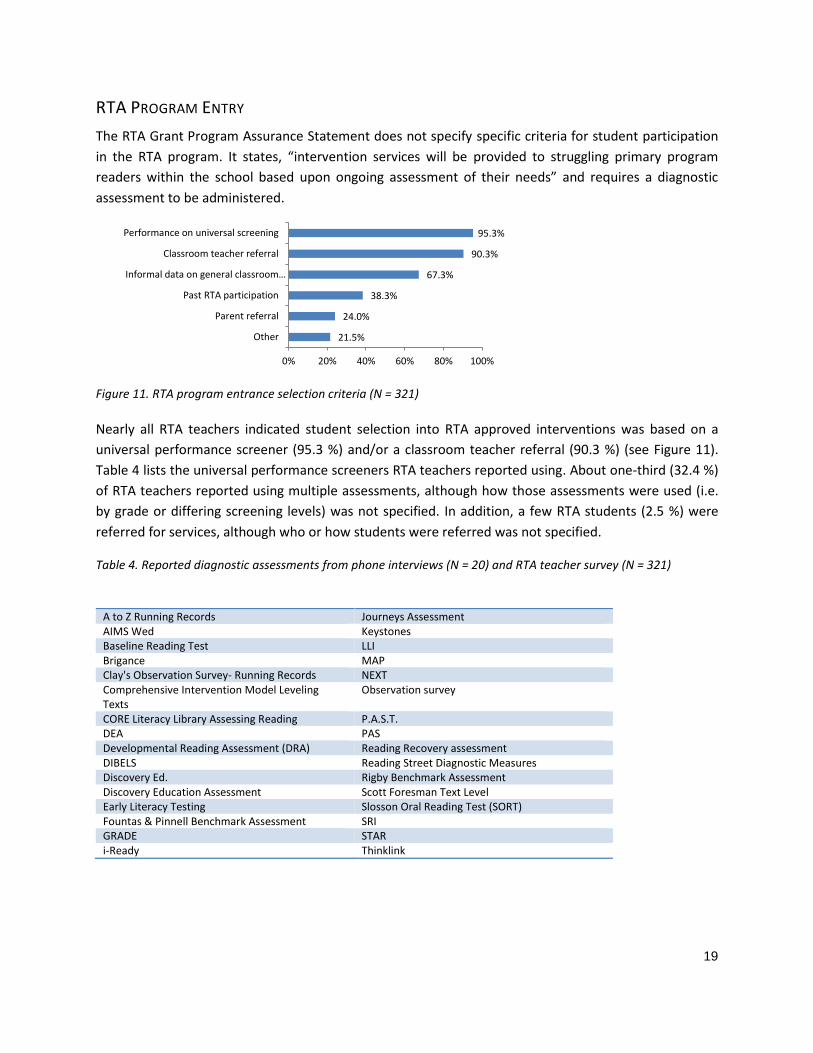
CHAPTER 4: READ TO ACHIEVE STUDENTS Students benefiting from the RTA Grant Program may have greatly different experiences; for example,
the RTA teachers may have different approaches, or the number of hours students receive the
intervention may vary. Although the overall goal of the RTA program is to improve student literacy skills,
understanding how students experience the RTA Program is vital to understanding why the program is
or is not having a positive effect.
Data pertaining to students’ experiences were obtained
from the Intervention Tab database. The 2014–15 school
year was the first year the Intervention Tab was used by
RTA teachers.
RTA STUDENT DEMOGRAPHICS
There were 10,445 students served by the RTA program
during the 2014–15 school year. First-graders were the
most widely served group (43.6 %), followed by second-
graders (23.0 %), kindergarteners (18.9 %), and third-
graders (14.5 %).
Table 3 shows RTA student demographics. Males
comprised 55 percent of RTA students. Roughly three-
quarters of RTA students were white (77.6 %). Black and
Hispanic students made up an additional 18 percent of students (9.8 and 8.4 % respectively).
Approximately six percent of RTA students were considered Limited English Proficiency and nearly one
quarter of RTA students were considered Special Education.
Table 3. RTA student demographics
RTA Students (N = 10,445)
Gender
Female 45.2
Male 54.8
Race/Ethnicity
White 77.4
Black 9.8
Hispanic 8.4
Two or more races 3.7
Asian 0.4
Native Hawaiian/Pacific Islander 0.1
LEP Status 6.2
SPED Status 24.1
Figure 10. Overview of RTA student sample
selection
Original data N = 13,244
Final sample RTA students
N = 10,445
Remove duplicates
Select only students
attending a RTA school
Select only K-3
19
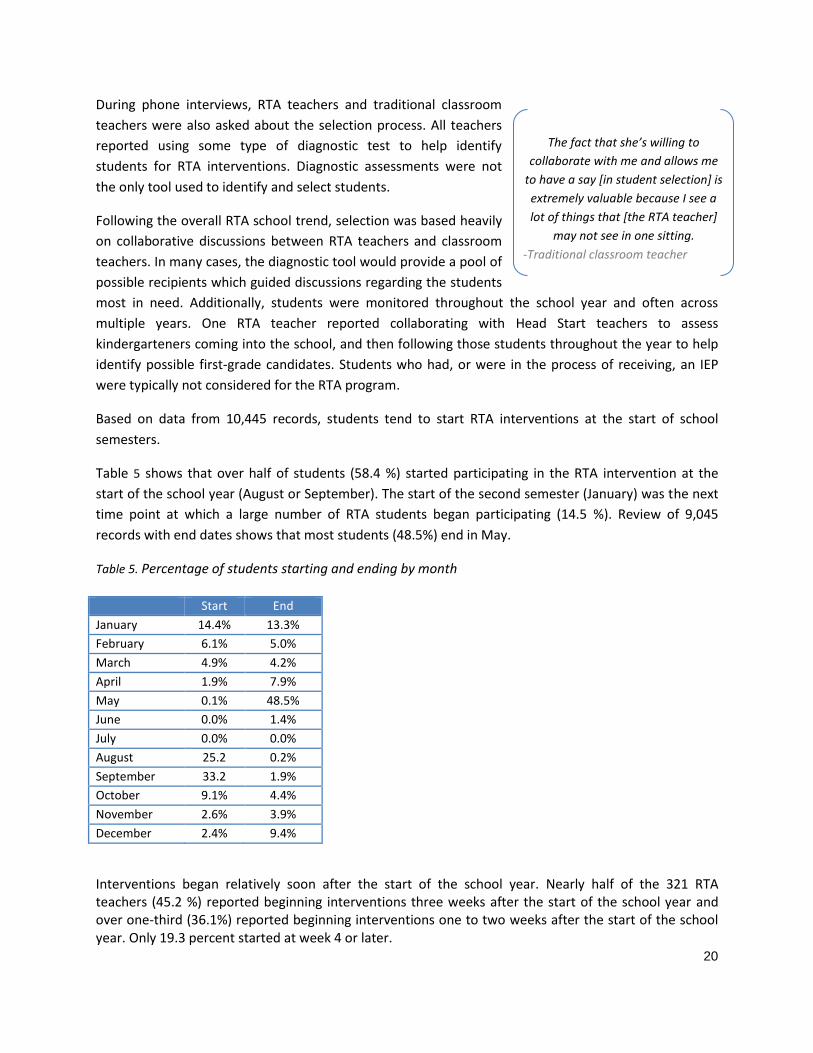
RTA PROGRAM ENTRY
The RTA Grant Program Assurance Statement does not specify specific criteria for student participation
in the RTA program. It states, “intervention services will be provided to struggling primary program
readers within the school based upon ongoing assessment of their needs” and requires a diagnostic
assessment to be administered.
Figure 11. RTA program entrance selection criteria (N = 321)
Nearly all RTA teachers indicated student selection into RTA approved interventions was based on a
universal performance screener (95.3 %) and/or a classroom teacher referral (90.3 %) (see Figure 11).
Table 4 lists the universal performance screeners RTA teachers reported using. About one-third (32.4 %)
of RTA teachers reported using multiple assessments, although how those assessments were used (i.e.
by grade or differing screening levels) was not specified. In addition, a few RTA students (2.5 %) were
referred for services, although who or how students were referred was not specified.
Table 4. Reported diagnostic assessments from phone interviews (N = 20) and RTA teacher survey (N = 321)
21.5%
24.0%
38.3%
67.3%
90.3%
95.3%
0% 20% 40% 60% 80% 100%
Other
Parent referral
Past RTA participation
Informal data on general classroom…
Classroom teacher referral
Performance on universal screening
A to Z Running Records Journeys Assessment AIMS Wed Keystones Baseline Reading Test LLI Brigance MAP Clay's Observation Survey- Running Records NEXT Comprehensive Intervention Model Leveling Texts
Observation survey
CORE Literacy Library Assessing Reading P.A.S.T. DEA PAS Developmental Reading Assessment (DRA) Reading Recovery assessment DIBELS Reading Street Diagnostic Measures Discovery Ed. Rigby Benchmark Assessment Discovery Education Assessment Scott Foresman Text Level Early Literacy Testing Slosson Oral Reading Test (SORT) Fountas & Pinnell Benchmark Assessment SRI GRADE STAR i-Ready Thinklink
20
During phone interviews, RTA teachers and traditional classroom
teachers were also asked about the selection process. All teachers
reported using some type of diagnostic test to help identify
students for RTA interventions. Diagnostic assessments were not
the only tool used to identify and select students.
Following the overall RTA school trend, selection was based heavily
on collaborative discussions between RTA teachers and classroom
teachers. In many cases, the diagnostic tool would provide a pool of
possible recipients which guided discussions regarding the students
most in need. Additionally, students were monitored throughout the school year and often across
multiple years. One RTA teacher reported collaborating with Head Start teachers to assess
kindergarteners coming into the school, and then following those students throughout the year to help
identify possible first-grade candidates. Students who had, or were in the process of receiving, an IEP
were typically not considered for the RTA program.
Based on data from 10,445 records, students tend to start RTA interventions at the start of school
semesters.
Table 5 shows that over half of students (58.4 %) started participating in the RTA intervention at the
start of the school year (August or September). The start of the second semester (January) was the next
time point at which a large number of RTA students began participating (14.5 %). Review of 9,045
records with end dates shows that most students (48.5%) end in May.
Table 5. Percentage of students starting and ending by month
Start End
January 14.4% 13.3%
February 6.1% 5.0%
March 4.9% 4.2%
April 1.9% 7.9%
May 0.1% 48.5%
June 0.0% 1.4%
July 0.0% 0.0%
August 25.2 0.2%
September 33.2 1.9%
October 9.1% 4.4%
November 2.6% 3.9%
December 2.4% 9.4%
Interventions began relatively soon after the start of the school year. Nearly half of the 321 RTA teachers (45.2 %) reported beginning interventions three weeks after the start of the school year and over one-third (36.1%) reported beginning interventions one to two weeks after the start of the school year. Only 19.3 percent started at week 4 or later.
The fact that she’s willing to
collaborate with me and allows me
to have a say [in student selection] is
extremely valuable because I see a
lot of things that [the RTA teacher]
may not see in one sitting.
-Traditional classroom teacher
21
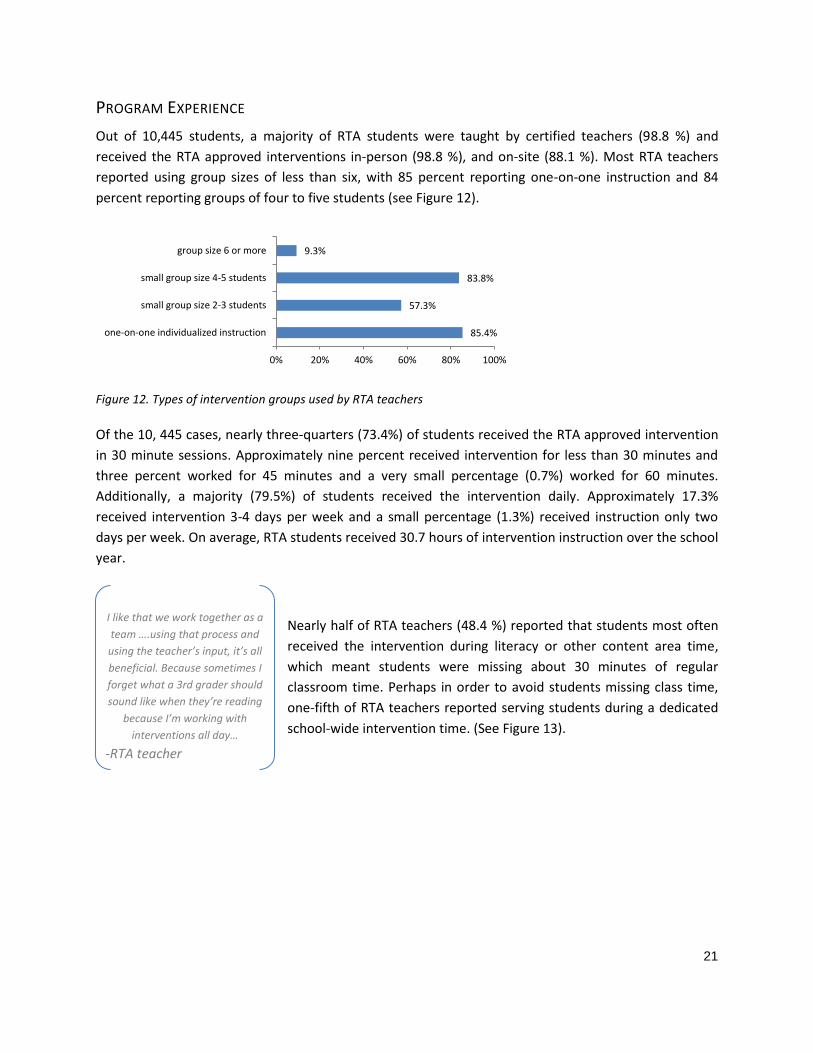
PROGRAM EXPERIENCE
Out of 10,445 students, a majority of RTA students were taught by certified teachers (98.8 %) and
received the RTA approved interventions in-person (98.8 %), and on-site (88.1 %). Most RTA teachers
reported using group sizes of less than six, with 85 percent reporting one-on-one instruction and 84
percent reporting groups of four to five students (see Figure 12).
Figure 12. Types of intervention groups used by RTA teachers
Of the 10, 445 cases, nearly three-quarters (73.4%) of students received the RTA approved intervention
in 30 minute sessions. Approximately nine percent received intervention for less than 30 minutes and
three percent worked for 45 minutes and a very small percentage (0.7%) worked for 60 minutes.
Additionally, a majority (79.5%) of students received the intervention daily. Approximately 17.3%
received intervention 3-4 days per week and a small percentage (1.3%) received instruction only two
days per week. On average, RTA students received 30.7 hours of intervention instruction over the school
year.
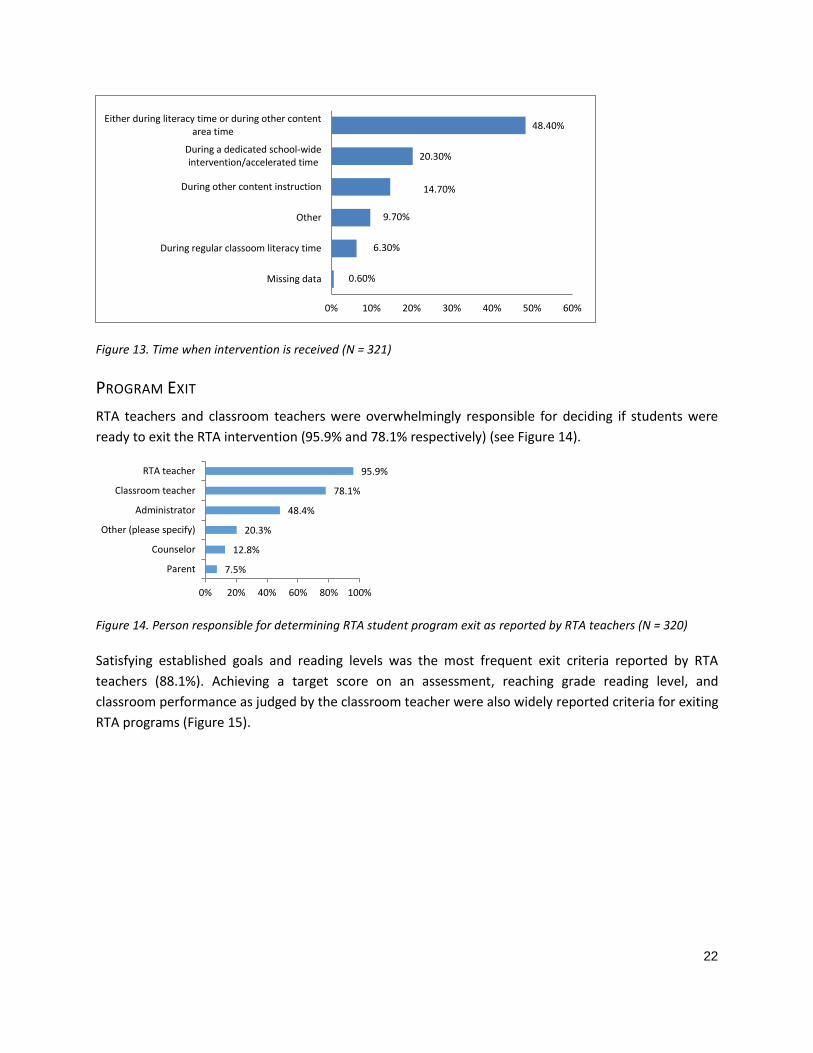
Nearly half of RTA teachers (48.4 %) reported that students most often
received the intervention during literacy or other content area time,
which meant students were missing about 30 minutes of regular
classroom time. Perhaps in order to avoid students missing class time,
one-fifth of RTA teachers reported serving students during a dedicated
school-wide intervention time. (See Figure 13).
85.4%
57.3%
83.8%
9.3%
0% 20% 40% 60% 80% 100%
one-on-one individualized instruction
small group size 2-3 students
small group size 4-5 students
group size 6 or more
I like that we work together as a
team ….using that process and
using the teacher’s input, it’s all
beneficial. Because sometimes I
forget what a 3rd grader should
sound like when they’re reading
because I’m working with
interventions all day…
-RTA teacher
22
Figure 13. Time when intervention is received (N = 321)
PROGRAM EXIT
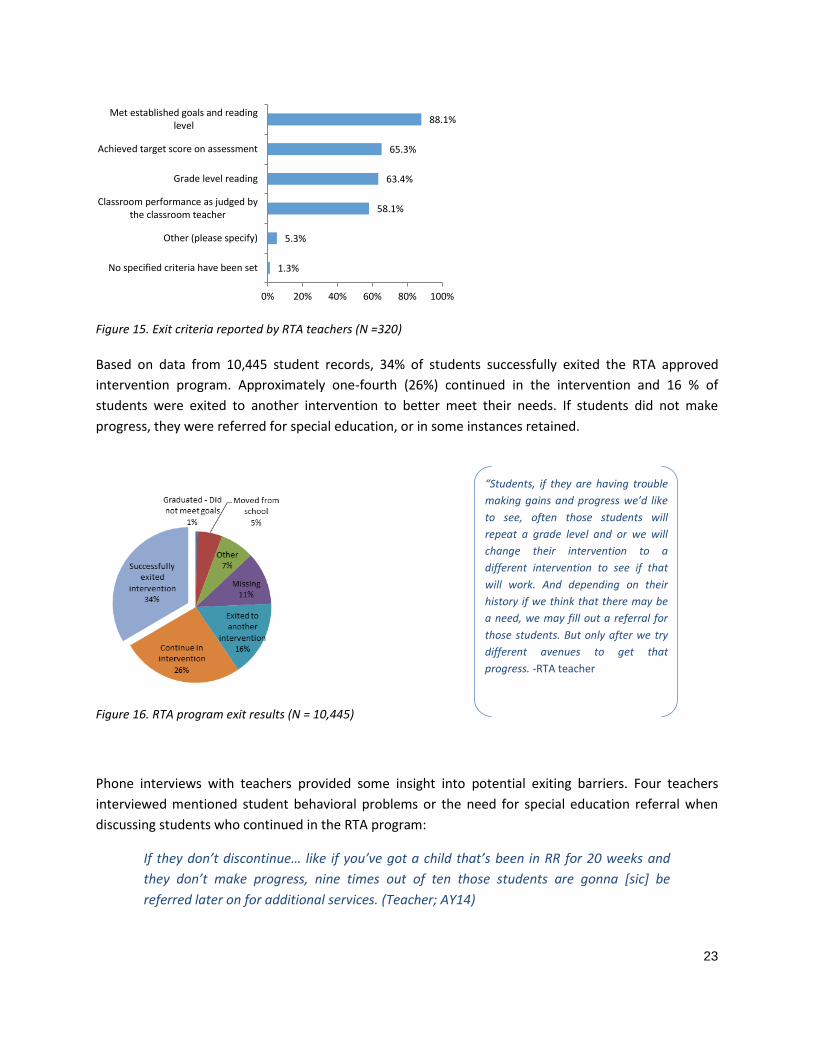
RTA teachers and classroom teachers were overwhelmingly responsible for deciding if students were
ready to exit the RTA intervention (95.9% and 78.1% respectively) (see Figure 14).
Figure 14. Person responsible for determining RTA student program exit as reported by RTA teachers (N = 320)
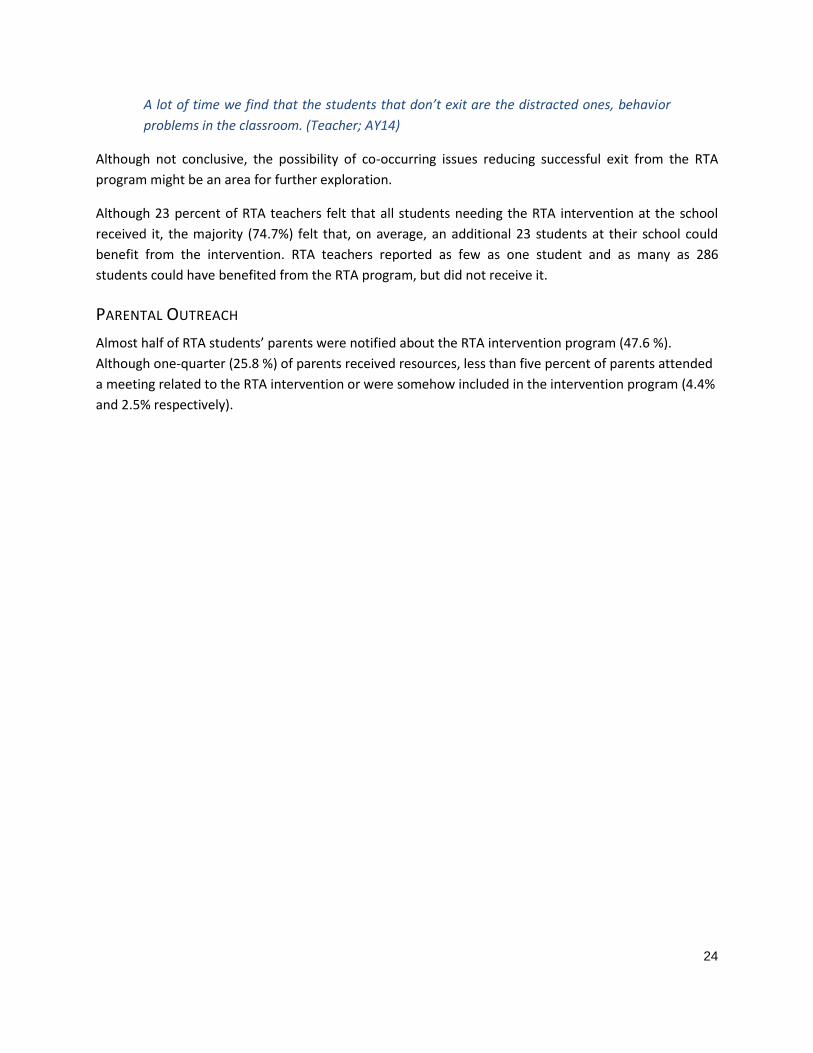
Satisfying established goals and reading levels was the most frequent exit criteria reported by RTA
teachers (88.1%). Achieving a target score on an assessment, reaching grade reading level, and
classroom performance as judged by the classroom teacher were also widely reported criteria for exiting
RTA programs (Figure 15).
0.60%
6.30%
9.70%
14.70%
20.30%
48.40%
0% 10% 20% 30% 40% 50% 60%
Missing data
During regular classoom literacy time
Other
During other content instruction
During a dedicated school-wideintervention/accelerated time
Either during literacy time or during other contentarea time
7.5%
12.8%
20.3%
48.4%
78.1%
95.9%
0% 20% 40% 60% 80% 100%
Parent
Counselor
Other (please specify)
Administrator
Classroom teacher
RTA teacher
23
Figure 15. Exit criteria reported by RTA teachers (N =320)
Based on data from 10,445 student records, 34% of students successfully exited the RTA approved
intervention program. Approximately one-fourth (26%) continued in the intervention and 16 % of
students were exited to another intervention to better meet their needs. If students did not make
progress, they were referred for special education, or in some instances retained.
Figure 16. RTA program exit results (N = 10,445)
Phone interviews with teachers provided some insight into potential exiting barriers. Four teachers
interviewed mentioned student behavioral problems or the need for special education referral when
discussing students who continued in the RTA program:
If they don’t discontinue… like if you’ve got a child that’s been in RR for 20 weeks and
they don’t make progress, nine times out of ten those students are gonna [sic] be
referred later on for additional services. (Teacher; AY14)
1.3%
5.3%
58.1%
63.4%
65.3%
88.1%
0% 20% 40% 60% 80% 100%
No specified criteria have been set
Other (please specify)
Classroom performance as judged bythe classroom teacher
Grade level reading
Achieved target score on assessment
Met established goals and readinglevel
“Students, if they are having trouble
making gains and progress we’d like
to see, often those students will
repeat a grade level and or we will
change their intervention to a
different intervention to see if that
will work. And depending on their
history if we think that there may be
a need, we may fill out a referral for
those students. But only after we try
different avenues to get that
progress. -RTA teacher
24
A lot of time we find that the students that don’t exit are the distracted ones, behavior
problems in the classroom. (Teacher; AY14)
Although not conclusive, the possibility of co-occurring issues reducing successful exit from the RTA
program might be an area for further exploration.
Although 23 percent of RTA teachers felt that all students needing the RTA intervention at the school
received it, the majority (74.7%) felt that, on average, an additional 23 students at their school could
benefit from the intervention. RTA teachers reported as few as one student and as many as 286
students could have benefited from the RTA program, but did not receive it.
PARENTAL OUTREACH
Almost half of RTA students’ parents were notified about the RTA intervention program (47.6 %).
Although one-quarter (25.8 %) of parents received resources, less than five percent of parents attended
a meeting related to the RTA intervention or were somehow included in the intervention program (4.4%
and 2.5% respectively).
25
CHAPTER 5: STUDENT OUTCOMES
As the 2014–15 school year was the first year of the revamped RTA Grant Program, assessing its effect
on third-grade (or later) proficiency levels on the K-PREP literacy test was unfeasible due to data
availability.10 The MAP assessment is generally considered a reliable predictor of K-PREP scores; as a
proxy, growth on MAP scores from fall to spring was examined.11 Only students with MAP assessment
data were used in this analysis; 58 percent of RTA students had MAP assessment data.
RESULTS
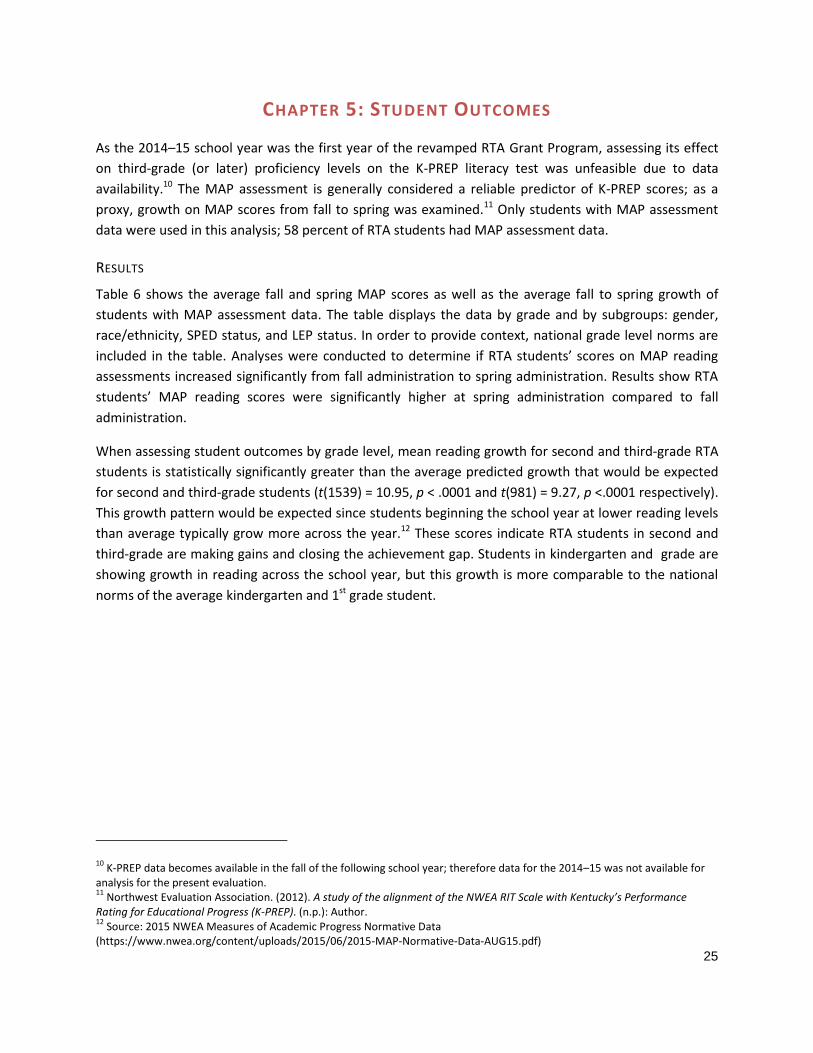
Table 6 shows the average fall and spring MAP scores as well as the average fall to spring growth of
students with MAP assessment data. The table displays the data by grade and by subgroups: gender,
race/ethnicity, SPED status, and LEP status. In order to provide context, national grade level norms are
included in the table. Analyses were conducted to determine if RTA students’ scores on MAP reading
assessments increased significantly from fall administration to spring administration. Results show RTA
students’ MAP reading scores were significantly higher at spring administration compared to fall
administration.
When assessing student outcomes by grade level, mean reading growth for second and third-grade RTA
students is statistically significantly greater than the average predicted growth that would be expected
for second and third-grade students (t(1539) = 10.95, p < .0001 and t(981) = 9.27, p <.0001 respectively).
This growth pattern would be expected since students beginning the school year at lower reading levels
than average typically grow more across the year.12 These scores indicate RTA students in second and
third-grade are making gains and closing the achievement gap. Students in kindergarten and grade are
showing growth in reading across the school year, but this growth is more comparable to the national
norms of the average kindergarten and 1st grade student.
10 K-PREP data becomes available in the fall of the following school year; therefore data for the 2014–15 was not available for
analysis for the present evaluation. 11
Northwest Evaluation Association. (2012). A study of the alignment of the NWEA RIT Scale with Kentucky’s Performance Rating for Educational Progress (K-PREP). (n.p.): Author. 12
Source: 2015 NWEA Measures of Academic Progress Normative Data (https://www.nwea.org/content/uploads/2015/06/2015-MAP-Normative-Data-AUG15.pdf)
26
Table 6. Mean student growth of RTA students with MAP assessment data
N Mean Fall MAP (SD)
Mean Spring MAP (SD)
Mean Growth (SD)
Mean Fall MAP (SD)
Mean Spring MAP (SD)
Mean Growth (SD)
Kindergarten 1,114 135.4 (7.62) 152.5 (9.45) 17.1 (9.16) 141.0 (13.54) 158.1 (12.85) 17.1 (8.11)
Male 619 134.6 (8.04) 151.8 (9.70) 17.1 (9.58)
Female 495 136.4 (6.94) 153.4 (9.08) 16.9 (8.60)
White 865 135.7 (7.41) 152.8 (9.31) 17.2 (9.31)
Black 94 134.0 (8.11) 149.9 (9.19) 15.8 (8.82)
Hispanic 99 134.5 (8.50) 152.2 (9.56) 17.7 (7.75)
Asian ‡ ‡ ‡ ‡
Native Pacific Islander
‡ ‡ ‡ ‡
Two or more races 51 135.1 (7.50) 151.7 (11.46) 16.5 (9.18)
SPED 279 134.7 (7.74) 150.8 (9.84) 16.1 (9.64)
LEP 57 132.6 (8.35) 151.4 (9.56) 18.8 (7.30)
1st grade 2,426 153.3 (9.38) 169.1 (10.45) 15.8 (9.02) 160.7 (13.08) 177.5 (14.54) 16.8 (8.09)
Male 1336 152.9 (9.56) 168.9 (10.51) 16.1 (9.40)
Female 1090 153.8 (9.12) 169.3 (10.25) 15.5 (8.53)
White 1905 153.7 (9.37) 169.6 (10.56) 15.9 (9.20)
Black 192 152.5 (8.68) 167.8 (8.44) 15.3 (8.00)
Hispanic 231 151.1 (9.36) 166.8 (10.37) 15.7 (8.71)
Asian 10 148.0 (11.45) 164.3 (13.27) 16.3 (12.14)
Native Pacific Islander
‡ ‡ ‡ ‡
Two or more races 80 152.2 (9.67) 167.8 (10.75) 15.6 (7.85)
SPED 595 151.6 (9.96) 166.6 (11.29) 15.0 (9.31)
LEP 179 148.7 (9.91) 165.8 (10.21) 17.1 (9.28)
2nd grade 1,540 156.5 (9.09) 173.6 (12.64) 17.1 (11.13) 174.7 (15.52) 188.7 (15.21) 14.0 (8.20)
Male 875 155.4 (8.98) 172.5 (13.07) 17.1 (11.86)
Female 665 157.9 (9.05) 175.1 (11.92) 17.1 (10.11)
White 1157 156.7 (9.19) 174.2 (12.63) 17.5 (11.28)
Black 152 156.2 (8.69) 171.0 (12.20) 14.8 (11.14)
Hispanic 133 156.2 (8.38) 171.4 (12.25) 15.2 (10.27)
Asian 10 165.0 (14.12) 182.6 (17.95) 17.6 (9.40)
Native Pacific Islander
‡ ‡ ‡ ‡
Two or more races 83 154.7 (8.40) 173.0 (12.21) 18.3 (10.02)
SPED 371 153.5 (7.75) 169.6 (12.52) 16.1 (11.73)
LEP 104 155.5 (7.98) 171.8 (11.38) 16.3 (9.47)
3rd grade 982 173.8 (10.98) 187.1 (12.24) 13.4 (10.29) 188.3 (15.85) 198.6 (15.10) 10.3 (7.59)
Male 499 172.1 (11.59) 186.6 (13.05) 14.5 (11.46)
Female 483 175.5 (10.05) 187.6 (11.34) 12.1 (8.79)
White 782 174.0 (10.91) 187.6 (12.26) 13.6 (10.30)
Black 70 172.2 (10.72) 184.5 (12.37) 12.3 (11.27)
Hispanic 76 172.4 (11.94) 184.0 (11.75) 11.7 (9.03)
Asian ‡ ‡ ‡ ‡
Native Pacific Islander
† † † †
Two or more races 49 175.0 (10.58) 188.3 (11.38) 13.3 (10.87)
SPED 233 168.8 (11.13) 182.5 (13.41) 13.7 (11.83)
LEP 41 173.0 (11.08) 185.0 (11.03) 12.0 (9.89)
‡ Reporting standards not met; N is < 5 which is too small to report.
† Not applicable
27
LIMITATIONS
It is important to address the limitations of the present evaluation in order to interpret the results in
context. First, conclusively determining the effect the RTA Grant Program has on student outcomes is, in
part, dependent on implementation; findings suggest the RTA Grant Program was not implemented
completely as intended (i.e., some RTA teachers may have used unapproved interventions). Without
implementation fidelity, the risk of confounding factors greatly increase and it becomes difficult to
determine the driving force behind student growth (or lack thereof).
Secondly, the sample of RTA students was restricted to those students with MAP data which represents
58 percent of RTA students. Limiting the sample, although necessary, introduces additional biases based
on which schools may choose to use MAP data versus those which to not. Therefore, results may differ if
all RTA students are included in the analyses.
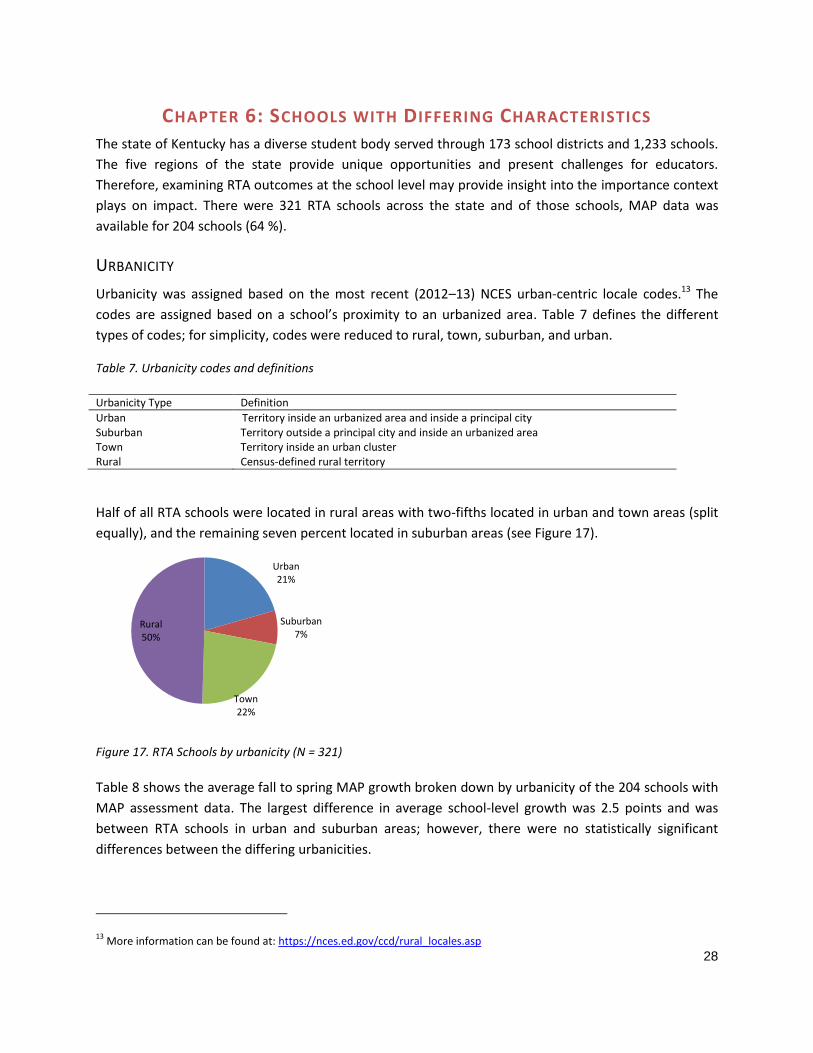
28
CHAPTER 6: SCHOOLS WITH DIFFERING CHARACTERISTICS The state of Kentucky has a diverse student body served through 173 school districts and 1,233 schools.
The five regions of the state provide unique opportunities and present challenges for educators.
Therefore, examining RTA outcomes at the school level may provide insight into the importance context
plays on impact. There were 321 RTA schools across the state and of those schools, MAP data was
available for 204 schools (64 %).
URBANICITY
Urbanicity was assigned based on the most recent (2012–13) NCES urban-centric locale codes.13 The
codes are assigned based on a school’s proximity to an urbanized area. Table 7 defines the different
types of codes; for simplicity, codes were reduced to rural, town, suburban, and urban.
Table 7. Urbanicity codes and definitions
Urbanicity Type Definition
Urban Territory inside an urbanized area and inside a principal city Suburban Territory outside a principal city and inside an urbanized area Town Territory inside an urban cluster Rural Census-defined rural territory
Half of all RTA schools were located in rural areas with two-fifths located in urban and town areas (split
equally), and the remaining seven percent located in suburban areas (see Figure 17).
Figure 17. RTA Schools by urbanicity (N = 321)
Table 8 shows the average fall to spring MAP growth broken down by urbanicity of the 204 schools with
MAP assessment data. The largest difference in average school-level growth was 2.5 points and was
between RTA schools in urban and suburban areas; however, there were no statistically significant
differences between the differing urbanicities.
13 More information can be found at: https://nces.ed.gov/ccd/rural_locales.asp
Urban 21%
Suburban 7%
Town 22%
Rural 50%
29
Table 8. RTA school average fall to spring MAP growth by urbanicity (N = 204)
Number of Schools
Mean Std Dev
Urban 36 16.79 4.170
Suburban 24 14.22 3.796
Town 53 15.70 3.241
Rural 91 16.45 4.516
REGIONS
Average school growth was compared by region. Five regions were used: central, Louisville, northern,
eastern, and western. Figure 18 shows the regions of Kentucky by school district as well as the
percentage of RTA schools in each region.
Figure 18. Map of Kentucky Regions
Most of the 204 RTA schools with available MAP scores were located in the Central Region. The
Louisville region has the fewest schools. Table 9 shows average fall to spring MAP growth by region for
RTA schools with MAP assessment data. The largest difference in average school-level growth was 1.5
points and was between RTA schools in the Central Region and the Louisville Region; however, there
were no statistically significant differences between the differing regions.
Table 9. RTA school average fall to spring MAP growth by region
Regions Number of Schools (%)
Mean Std Dev
Central 61 (29.9%) 16.62 3.683
Louisville 22 (10.8%) 15.12 3.166
Northern 23 (11.3%) 15.36 3.368
Eastern 57 (27.9%) 15.90 5.361
Western 41 (20.1%) 16.27 3.574
33%
24%
19%
16% 8%
30
LIBRARY MEDIA CENTERS
School library media centers were examined as a proxy for school resources and to explore a possible
correlation with student success.
Nearly all RTA schools (282 schools) had a library media center program. Of those with a library media
program, about three-quarters of RTA teachers reported the quality of the centers as strong. Table 10
shows RTA school average fall to spring MAP growth by the RTA teacher rated quality of the school’s
library media center program. Of those who chose to respond (N = 175), the majority report a strong
program. Although RTA schools with strong library media programs had slightly more growth, on
average, than schools with a weak program (16.0 points compared to 15.9) the difference does not
reach statistical significance.
Table 10. RTA school average fall to spring MAP growth by quality of library media center
Library Media Center Quality Number of responses
Mean Std Dev
Strong program 141 16.04 4.024
Weak program 34 15.90 4.075
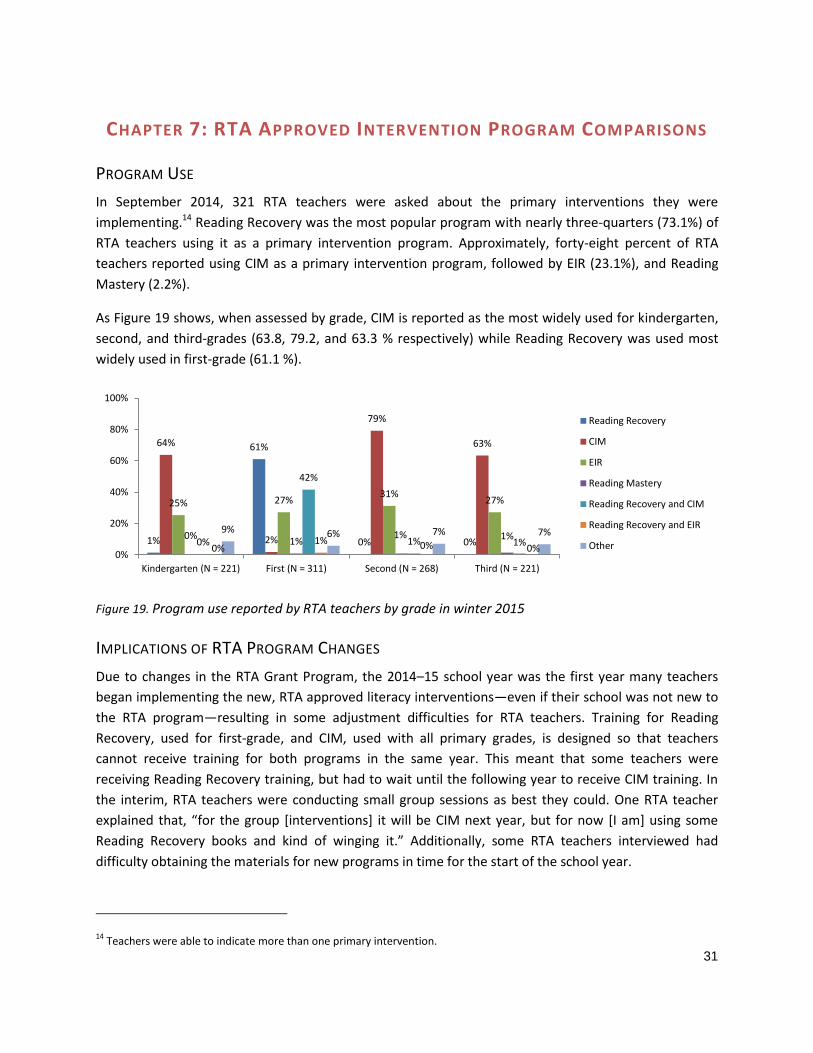
31
CHAPTER 7: RTA APPROVED INTERVENTION PROGRAM COMPARISONS
PROGRAM USE
In September 2014, 321 RTA teachers were asked about the primary interventions they were
implementing.14 Reading Recovery was the most popular program with nearly three-quarters (73.1%) of
RTA teachers using it as a primary intervention program. Approximately, forty-eight percent of RTA
teachers reported using CIM as a primary intervention program, followed by EIR (23.1%), and Reading
Mastery (2.2%).
As Figure 19 shows, when assessed by grade, CIM is reported as the most widely used for kindergarten,
second, and third-grades (63.8, 79.2, and 63.3 % respectively) while Reading Recovery was used most
widely used in first-grade (61.1 %).
Figure 19. Program use reported by RTA teachers by grade in winter 2015
IMPLICATIONS OF RTA PROGRAM CHANGES
Due to changes in the RTA Grant Program, the 2014–15 school year was the first year many teachers
began implementing the new, RTA approved literacy interventions—even if their school was not new to
the RTA program—resulting in some adjustment difficulties for RTA teachers. Training for Reading
Recovery, used for first-grade, and CIM, used with all primary grades, is designed so that teachers
cannot receive training for both programs in the same year. This meant that some teachers were
receiving Reading Recovery training, but had to wait until the following year to receive CIM training. In
the interim, RTA teachers were conducting small group sessions as best they could. One RTA teacher
explained that, “for the group [interventions] it will be CIM next year, but for now [I am] using some
Reading Recovery books and kind of winging it.” Additionally, some RTA teachers interviewed had
difficulty obtaining the materials for new programs in time for the start of the school year.
14 Teachers were able to indicate more than one primary intervention.
1%
61%
0% 0%
64%
2%
79%
63%
25% 27% 31%
27%
0% 1%
1% 1% 0%
42%
1% 1% 0%
1% 0% 0%
9% 6% 7% 7%
0%
20%
40%
60%
80%
100%
Kindergarten (N = 221) First (N = 311) Second (N = 268) Third (N = 221)
Reading Recovery
CIM
EIR
Reading Mastery
Reading Recovery and CIM
Reading Recovery and EIR
Other
32
Both RTA teacher survey and interview data suggest the RTA approved intervention programs were not
the only interventions being used. Table 11 shows non-RTA approved intervention programs RTA
teachers reported having used. A lack of training, or comfort with another program previously used, is
one possible reason teachers were straying from the grant-approved programs; however, more
information is needed to determine conclusively why some teachers were using alternative programs.
Despite some difficulty adjusting to new grant requirements, many teachers were enthusiastic about
starting new intervention programs and felt confident in implementing them; one RTA said,
“I’ve seen a big difference this year with the RR as compared to last year with the other program we
used. I can see that the kids are improving. It’s going really well. I can see the kids progressing through
their levels. And that is one major thing I can see between this program and the one we used last year.”
Table 11. List of “other” programs being used by RTA teachers
Program Number of RTA teachers reporting use
K 1st 2nd 3rd
Leveled Literacy Intervention (LLI) 5 6 7 4
My Sidewalks 4 2 2 1
Guided Reading1 3 1 2 1
Orton-Gillingham 2 1
Fountas and Pinnell 1 1 2 2
Soar to Success 1 1 4
Intervention by Design 1 1 1
Road to The Code 1
Small group reading interventions 1 1 1
Earobics 1
ELLG 1
Early Success 2 2
EIR, RR/CIM, Reading Mastery 1
Reading 1
RR/LLI/CIM 1
Literacy Interventions 1
1Some RTA teachers may be using the term “Guided Reading” to mean CIM
FUNDING
School administrators reported financial information pertaining to the RTA Grant Program. Of the 144
administrators who participated in the survey, 94 administrators were associated with schools using
Reading Recovery and CIM, two were associated with schools using only Reading Recovery, four were
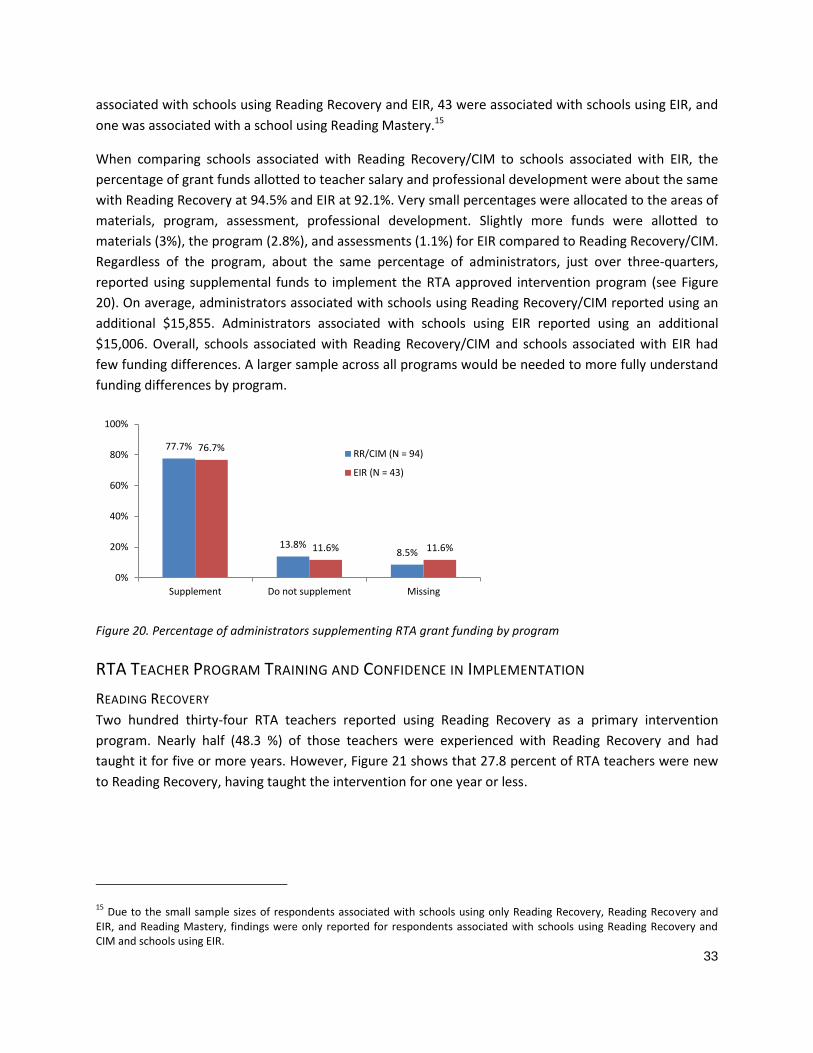
33
associated with schools using Reading Recovery and EIR, 43 were associated with schools using EIR, and
one was associated with a school using Reading Mastery.15
When comparing schools associated with Reading Recovery/CIM to schools associated with EIR, the
percentage of grant funds allotted to teacher salary and professional development were about the same
with Reading Recovery at 94.5% and EIR at 92.1%. Very small percentages were allocated to the areas of
materials, program, assessment, professional development. Slightly more funds were allotted to
materials (3%), the program (2.8%), and assessments (1.1%) for EIR compared to Reading Recovery/CIM.
Regardless of the program, about the same percentage of administrators, just over three-quarters,
reported using supplemental funds to implement the RTA approved intervention program (see Figure
20). On average, administrators associated with schools using Reading Recovery/CIM reported using an
additional $15,855. Administrators associated with schools using EIR reported using an additional
$15,006. Overall, schools associated with Reading Recovery/CIM and schools associated with EIR had
few funding differences. A larger sample across all programs would be needed to more fully understand
funding differences by program.
Figure 20. Percentage of administrators supplementing RTA grant funding by program
RTA TEACHER PROGRAM TRAINING AND CONFIDENCE IN IMPLEMENTATION
READING RECOVERY
Two hundred thirty-four RTA teachers reported using Reading Recovery as a primary intervention
program. Nearly half (48.3 %) of those teachers were experienced with Reading Recovery and had
taught it for five or more years. However, Figure 21 shows that 27.8 percent of RTA teachers were new
to Reading Recovery, having taught the intervention for one year or less.
15 Due to the small sample sizes of respondents associated with schools using only Reading Recovery, Reading Recovery and
EIR, and Reading Mastery, findings were only reported for respondents associated with schools using Reading Recovery and CIM and schools using EIR.
77.7%
13.8% 8.5%
76.7%
11.6% 11.6%
0%
20%
40%
60%
80%
100%
Supplement Do not supplement Missing
RR/CIM (N = 94)
EIR (N = 43)
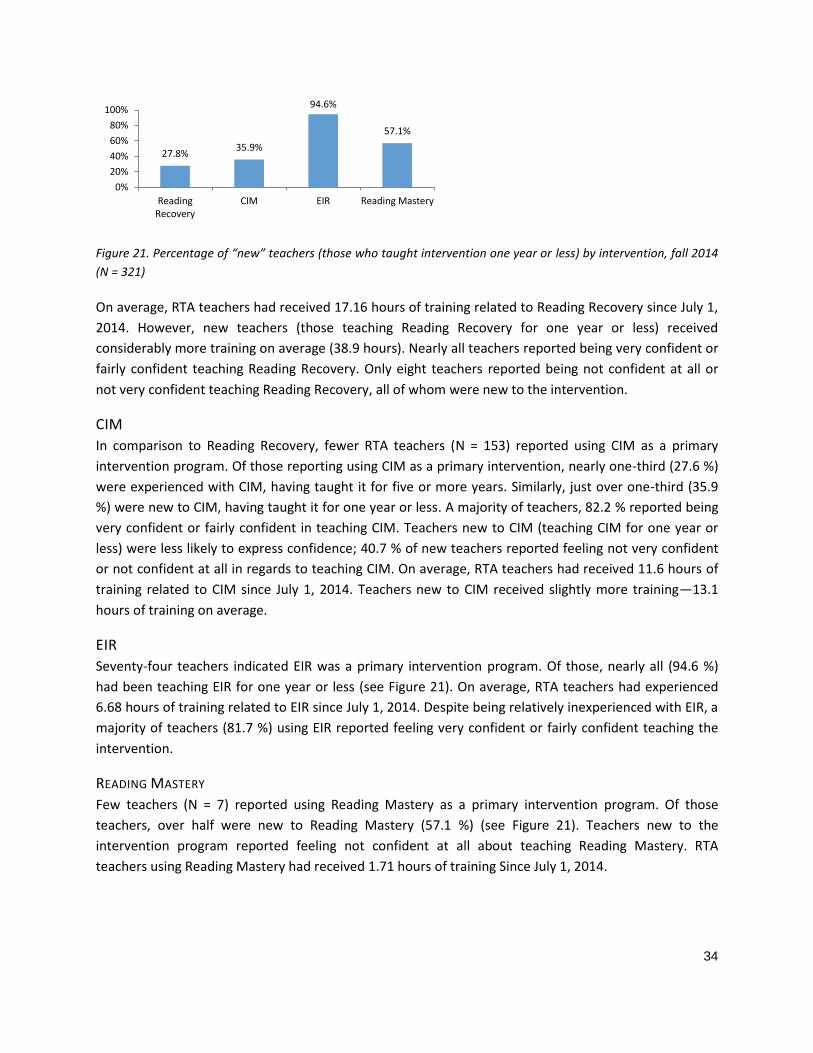
34
Figure 21. Percentage of “new” teachers (those who taught intervention one year or less) by intervention, fall 2014
(N = 321)
On average, RTA teachers had received 17.16 hours of training related to Reading Recovery since July 1,
2014. However, new teachers (those teaching Reading Recovery for one year or less) received
considerably more training on average (38.9 hours). Nearly all teachers reported being very confident or
fairly confident teaching Reading Recovery. Only eight teachers reported being not confident at all or
not very confident teaching Reading Recovery, all of whom were new to the intervention.
CIM
In comparison to Reading Recovery, fewer RTA teachers (N = 153) reported using CIM as a primary
intervention program. Of those reporting using CIM as a primary intervention, nearly one-third (27.6 %)
were experienced with CIM, having taught it for five or more years. Similarly, just over one-third (35.9
%) were new to CIM, having taught it for one year or less. A majority of teachers, 82.2 % reported being
very confident or fairly confident in teaching CIM. Teachers new to CIM (teaching CIM for one year or
less) were less likely to express confidence; 40.7 % of new teachers reported feeling not very confident
or not confident at all in regards to teaching CIM. On average, RTA teachers had received 11.6 hours of
training related to CIM since July 1, 2014. Teachers new to CIM received slightly more training—13.1
hours of training on average.
EIR
Seventy-four teachers indicated EIR was a primary intervention program. Of those, nearly all (94.6 %)
had been teaching EIR for one year or less (see Figure 21). On average, RTA teachers had experienced
6.68 hours of training related to EIR since July 1, 2014. Despite being relatively inexperienced with EIR, a
majority of teachers (81.7 %) using EIR reported feeling very confident or fairly confident teaching the
intervention.
READING MASTERY
Few teachers (N = 7) reported using Reading Mastery as a primary intervention program. Of those
teachers, over half were new to Reading Mastery (57.1 %) (see Figure 21). Teachers new to the
intervention program reported feeling not confident at all about teaching Reading Mastery. RTA
teachers using Reading Mastery had received 1.71 hours of training Since July 1, 2014.
27.8% 35.9%
94.6%
57.1%
0%
20%
40%
60%
80%
100%
ReadingRecovery
CIM EIR Reading Mastery
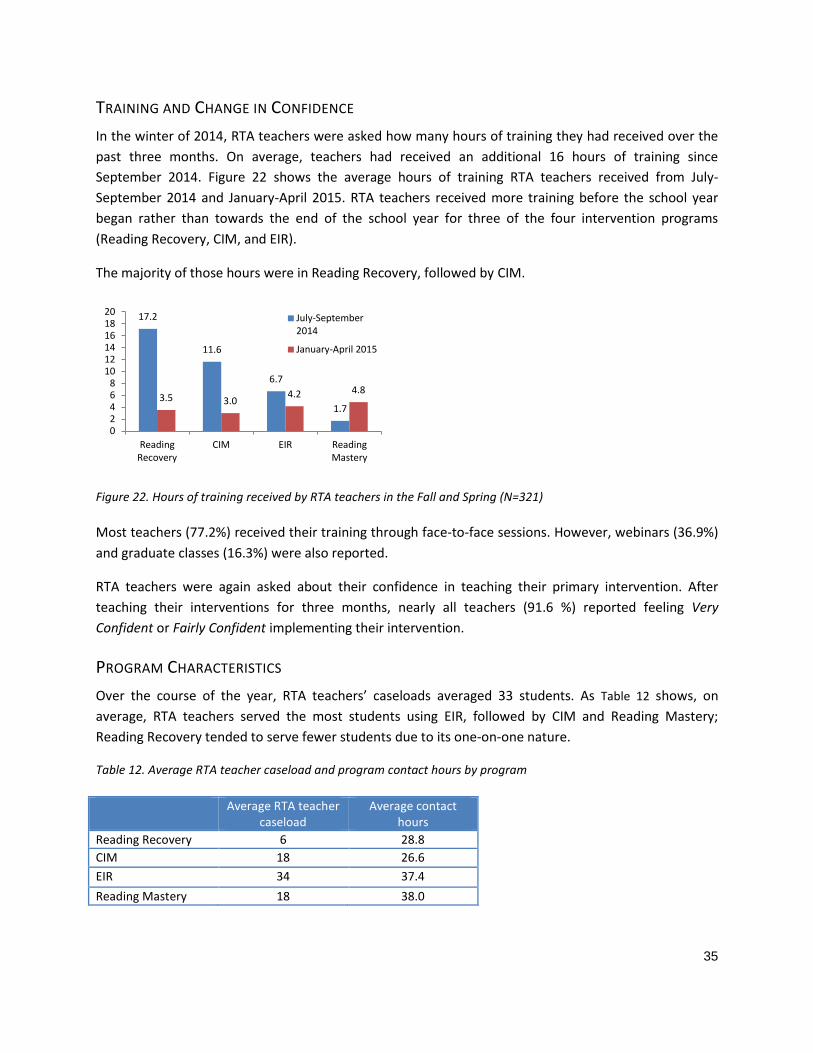
35
TRAINING AND CHANGE IN CONFIDENCE
In the winter of 2014, RTA teachers were asked how many hours of training they had received over the
past three months. On average, teachers had received an additional 16 hours of training since
September 2014. Figure 22 shows the average hours of training RTA teachers received from July-
September 2014 and January-April 2015. RTA teachers received more training before the school year
began rather than towards the end of the school year for three of the four intervention programs
(Reading Recovery, CIM, and EIR).
The majority of those hours were in Reading Recovery, followed by CIM.
Figure 22. Hours of training received by RTA teachers in the Fall and Spring (N=321)
Most teachers (77.2%) received their training through face-to-face sessions. However, webinars (36.9%)
and graduate classes (16.3%) were also reported.
RTA teachers were again asked about their confidence in teaching their primary intervention. After
teaching their interventions for three months, nearly all teachers (91.6 %) reported feeling Very
Confident or Fairly Confident implementing their intervention.
PROGRAM CHARACTERISTICS
Over the course of the year, RTA teachers’ caseloads averaged 33 students. As Table 12 shows, on
average, RTA teachers served the most students using EIR, followed by CIM and Reading Mastery;
Reading Recovery tended to serve fewer students due to its one-on-one nature.
Table 12. Average RTA teacher caseload and program contact hours by program
Average RTA teacher caseload
Average contact hours
Reading Recovery 6 28.8
CIM 18 26.6
EIR 34 37.4
Reading Mastery 18 38.0
17.2
11.6
6.7
1.7 3.5 3.0
4.2 4.8
02468
101214161820
ReadingRecovery
CIM EIR ReadingMastery
July-September2014
January-April 2015
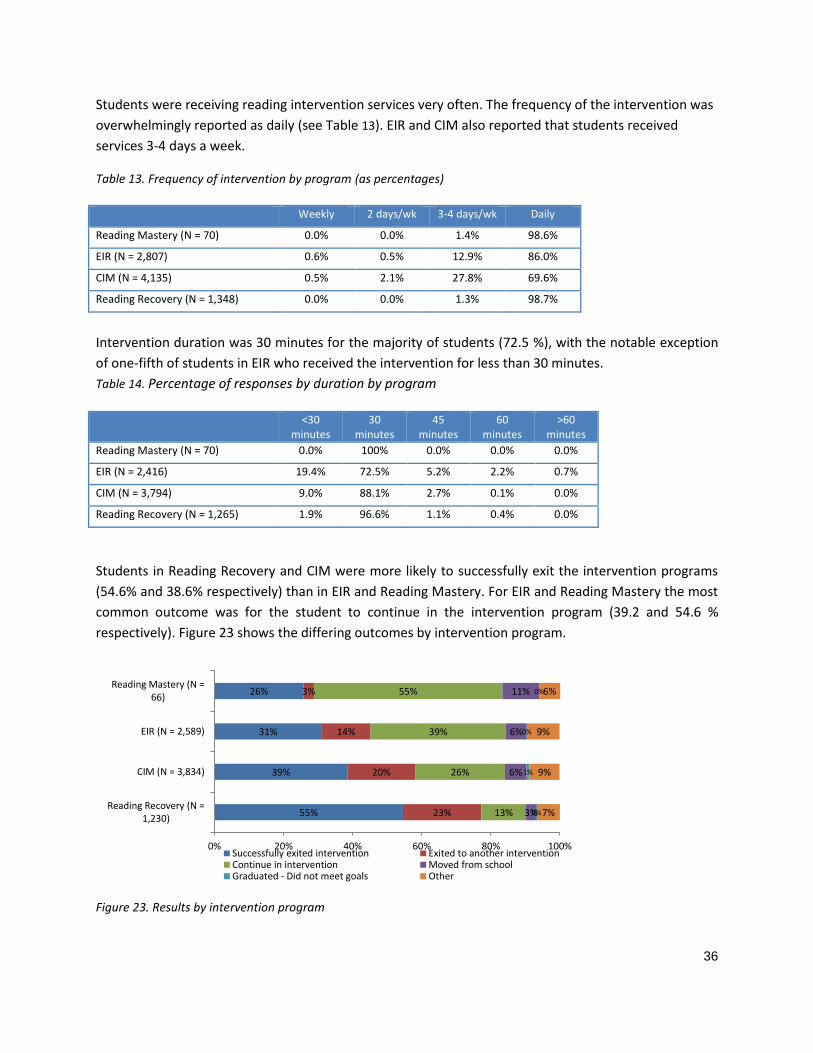
36
Students were receiving reading intervention services very often. The frequency of the intervention was
overwhelmingly reported as daily (see Table 13). EIR and CIM also reported that students received
services 3-4 days a week.
Table 13. Frequency of intervention by program (as percentages)
Weekly 2 days/wk 3-4 days/wk Daily
Reading Mastery (N = 70) 0.0% 0.0% 1.4% 98.6%
EIR (N = 2,807) 0.6% 0.5% 12.9% 86.0%
CIM (N = 4,135) 0.5% 2.1% 27.8% 69.6%
Reading Recovery (N = 1,348) 0.0% 0.0% 1.3% 98.7%
Intervention duration was 30 minutes for the majority of students (72.5 %), with the notable exception
of one-fifth of students in EIR who received the intervention for less than 30 minutes.
Table 14. Percentage of responses by duration by program
<30 minutes
30 minutes
45 minutes
60 minutes
>60 minutes
Reading Mastery (N = 70) 0.0% 100% 0.0% 0.0% 0.0%
EIR (N = 2,416) 19.4% 72.5% 5.2% 2.2% 0.7%
CIM (N = 3,794) 9.0% 88.1% 2.7% 0.1% 0.0%
Reading Recovery (N = 1,265) 1.9% 96.6% 1.1% 0.4% 0.0%
Students in Reading Recovery and CIM were more likely to successfully exit the intervention programs
(54.6% and 38.6% respectively) than in EIR and Reading Mastery. For EIR and Reading Mastery the most
common outcome was for the student to continue in the intervention program (39.2 and 54.6 %
respectively). Figure 23 shows the differing outcomes by intervention program.
Figure 23. Results by intervention program
55%
39%
31%
26%
23%
20%
14%
3%
13%
26%
39%
55%
3%
6%
6%
11%
0%
1%
0%
0%
7%
9%
9%
6%
0% 20% 40% 60% 80% 100%
Reading Recovery (N =1,230)
CIM (N = 3,834)
EIR (N = 2,589)
Reading Mastery (N =66)
Successfully exited intervention Exited to another interventionContinue in intervention Moved from schoolGraduated - Did not meet goals Other
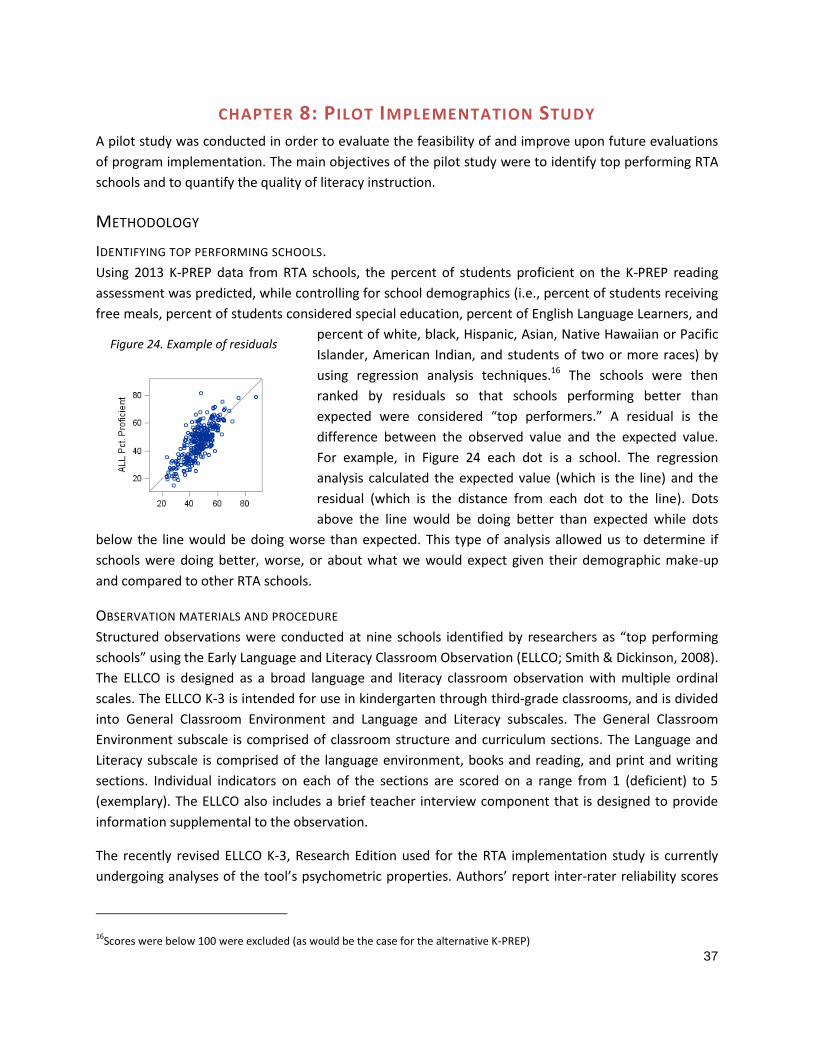
37
CHAPTER 8: PILOT IMPLEMENTATION STUDY A pilot study was conducted in order to evaluate the feasibility of and improve upon future evaluations
of program implementation. The main objectives of the pilot study were to identify top performing RTA
schools and to quantify the quality of literacy instruction.
METHODOLOGY
IDENTIFYING TOP PERFORMING SCHOOLS.
Using 2013 K-PREP data from RTA schools, the percent of students proficient on the K-PREP reading
assessment was predicted, while controlling for school demographics (i.e., percent of students receiving
free meals, percent of students considered special education, percent of English Language Learners, and
percent of white, black, Hispanic, Asian, Native Hawaiian or Pacific
Islander, American Indian, and students of two or more races) by
using regression analysis techniques.16 The schools were then
ranked by residuals so that schools performing better than
expected were considered “top performers.” A residual is the
difference between the observed value and the expected value.
For example, in Figure 24 each dot is a school. The regression
analysis calculated the expected value (which is the line) and the
residual (which is the distance from each dot to the line). Dots
above the line would be doing better than expected while dots
below the line would be doing worse than expected. This type of analysis allowed us to determine if
schools were doing better, worse, or about what we would expect given their demographic make-up
and compared to other RTA schools.
OBSERVATION MATERIALS AND PROCEDURE
Structured observations were conducted at nine schools identified by researchers as “top performing
schools” using the Early Language and Literacy Classroom Observation (ELLCO; Smith & Dickinson, 2008).
The ELLCO is designed as a broad language and literacy classroom observation with multiple ordinal
scales. The ELLCO K-3 is intended for use in kindergarten through third-grade classrooms, and is divided
into General Classroom Environment and Language and Literacy subscales. The General Classroom
Environment subscale is comprised of classroom structure and curriculum sections. The Language and
Literacy subscale is comprised of the language environment, books and reading, and print and writing
sections. Individual indicators on each of the sections are scored on a range from 1 (deficient) to 5
(exemplary). The ELLCO also includes a brief teacher interview component that is designed to provide
information supplemental to the observation.
The recently revised ELLCO K-3, Research Edition used for the RTA implementation study is currently
undergoing analyses of the tool’s psychometric properties. Authors’ report inter-rater reliability scores
16Scores were below 100 were excluded (as would be the case for the alternative K-PREP)
Figure 24. Example of residuals
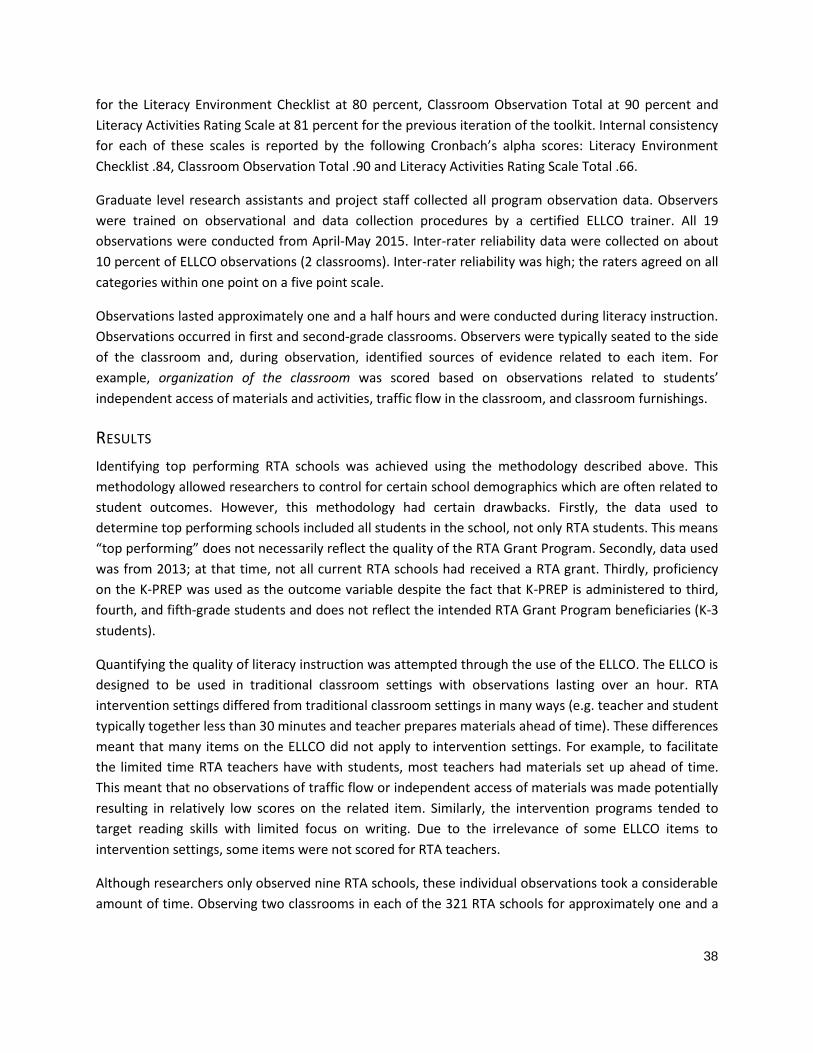
38
for the Literacy Environment Checklist at 80 percent, Classroom Observation Total at 90 percent and
Literacy Activities Rating Scale at 81 percent for the previous iteration of the toolkit. Internal consistency
for each of these scales is reported by the following Cronbach’s alpha scores: Literacy Environment
Checklist .84, Classroom Observation Total .90 and Literacy Activities Rating Scale Total .66.
Graduate level research assistants and project staff collected all program observation data. Observers
were trained on observational and data collection procedures by a certified ELLCO trainer. All 19
observations were conducted from April-May 2015. Inter-rater reliability data were collected on about
10 percent of ELLCO observations (2 classrooms). Inter-rater reliability was high; the raters agreed on all
categories within one point on a five point scale.
Observations lasted approximately one and a half hours and were conducted during literacy instruction.
Observations occurred in first and second-grade classrooms. Observers were typically seated to the side
of the classroom and, during observation, identified sources of evidence related to each item. For
example, organization of the classroom was scored based on observations related to students’
independent access of materials and activities, traffic flow in the classroom, and classroom furnishings.
RESULTS
Identifying top performing RTA schools was achieved using the methodology described above. This
methodology allowed researchers to control for certain school demographics which are often related to
student outcomes. However, this methodology had certain drawbacks. Firstly, the data used to
determine top performing schools included all students in the school, not only RTA students. This means
“top performing” does not necessarily reflect the quality of the RTA Grant Program. Secondly, data used
was from 2013; at that time, not all current RTA schools had received a RTA grant. Thirdly, proficiency
on the K-PREP was used as the outcome variable despite the fact that K-PREP is administered to third,
fourth, and fifth-grade students and does not reflect the intended RTA Grant Program beneficiaries (K-3
students).
Quantifying the quality of literacy instruction was attempted through the use of the ELLCO. The ELLCO is
designed to be used in traditional classroom settings with observations lasting over an hour. RTA
intervention settings differed from traditional classroom settings in many ways (e.g. teacher and student
typically together less than 30 minutes and teacher prepares materials ahead of time). These differences
meant that many items on the ELLCO did not apply to intervention settings. For example, to facilitate
the limited time RTA teachers have with students, most teachers had materials set up ahead of time.
This meant that no observations of traffic flow or independent access of materials was made potentially
resulting in relatively low scores on the related item. Similarly, the intervention programs tended to
target reading skills with limited focus on writing. Due to the irrelevance of some ELLCO items to
intervention settings, some items were not scored for RTA teachers.
Although researchers only observed nine RTA schools, these individual observations took a considerable
amount of time. Observing two classrooms in each of the 321 RTA schools for approximately one and a
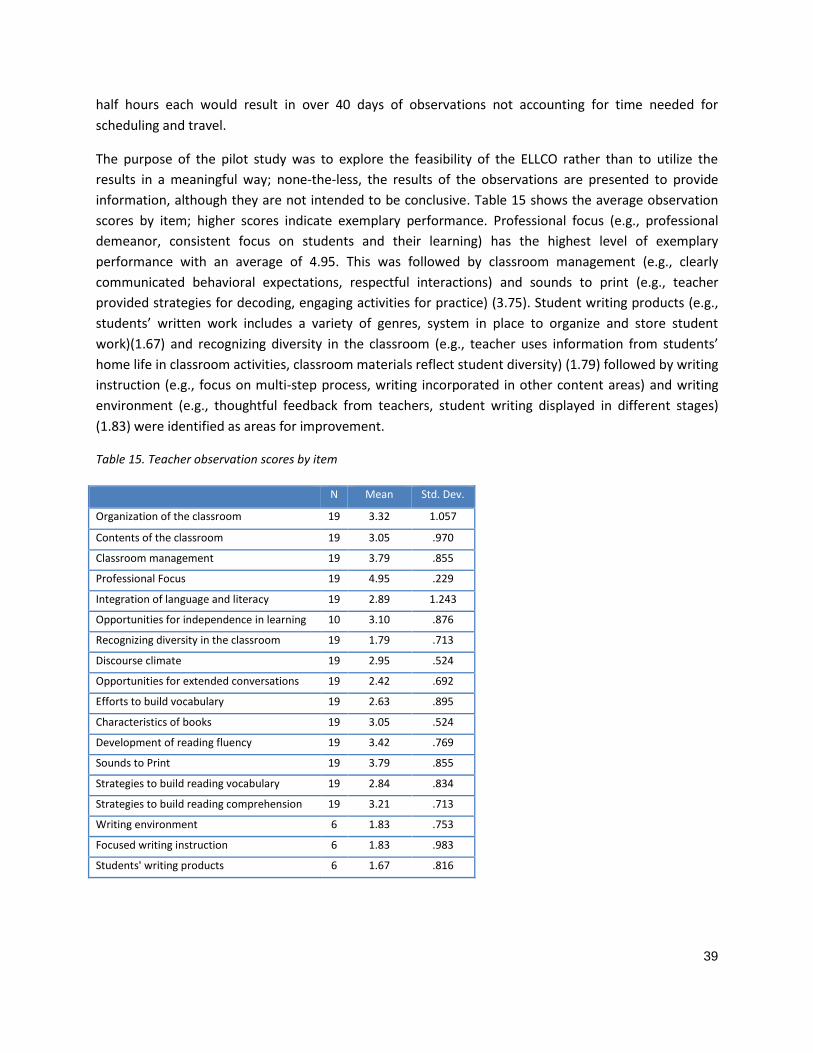
39
half hours each would result in over 40 days of observations not accounting for time needed for
scheduling and travel.
The purpose of the pilot study was to explore the feasibility of the ELLCO rather than to utilize the
results in a meaningful way; none-the-less, the results of the observations are presented to provide
information, although they are not intended to be conclusive. Table 15 shows the average observation
scores by item; higher scores indicate exemplary performance. Professional focus (e.g., professional
demeanor, consistent focus on students and their learning) has the highest level of exemplary
performance with an average of 4.95. This was followed by classroom management (e.g., clearly
communicated behavioral expectations, respectful interactions) and sounds to print (e.g., teacher
provided strategies for decoding, engaging activities for practice) (3.75). Student writing products (e.g.,
students’ written work includes a variety of genres, system in place to organize and store student
work)(1.67) and recognizing diversity in the classroom (e.g., teacher uses information from students’
home life in classroom activities, classroom materials reflect student diversity) (1.79) followed by writing
instruction (e.g., focus on multi-step process, writing incorporated in other content areas) and writing
environment (e.g., thoughtful feedback from teachers, student writing displayed in different stages)
(1.83) were identified as areas for improvement.
Table 15. Teacher observation scores by item
N Mean Std. Dev.
Organization of the classroom 19 3.32 1.057
Contents of the classroom 19 3.05 .970
Classroom management 19 3.79 .855
Professional Focus 19 4.95 .229
Integration of language and literacy 19 2.89 1.243
Opportunities for independence in learning 10 3.10 .876
Recognizing diversity in the classroom 19 1.79 .713
Discourse climate 19 2.95 .524
Opportunities for extended conversations 19 2.42 .692
Efforts to build vocabulary 19 2.63 .895
Characteristics of books 19 3.05 .524
Development of reading fluency 19 3.42 .769
Sounds to Print 19 3.79 .855
Strategies to build reading vocabulary 19 2.84 .834
Strategies to build reading comprehension 19 3.21 .713
Writing environment 6 1.83 .753
Focused writing instruction 6 1.83 .983
Students' writing products 6 1.67 .816
40
Figure 25 shows the mean scores by subscale. Classroom structure and books and reading were the two
strongest areas (3.8 and 3.3 respectively). Print and writing and curriculum were areas for potential
improvement (1.8 and 2.5 respectively).
Figure 25. Average ELLCO scores by subscale
TEACHER PERCEPTIONS OF FACTORS OF A SUCCESSFUL PROGRAM
During phone interviews classroom and RTA teachers were asked why they thought their school was a
“top performer.” Teachers mentioned communication and collaboration between classroom and RTA
teachers as well as intervening early (e.g., kindergarten) and consistency. Below are verbatim quotes
from classroom and RTA teachers describing the factors they view as being important to a successful
RTA program.
I think the key to a successful RTA program is communication and the buy- in from teachers. The
more training the RTA teacher has the more the teachers are willing to accept what they say. (RTA
teacher, AY14).
I can’t say what other schools are doing or not doing, all I can say is… consistency is huge. If you’re
going to teach sounds a certain way you need to stick to teaching sounds that way and make sure
they understand it and make sure it’s on their level. And it’s got to make sense to them and they’ve
got to do it every day. And be able to apply those same skills and strategies in every setting they are
in so that it will stick and they’ll use it. (RTA teacher, AY14).
I think it has a lot to do with how we work collaboratively. With our primary team, everybody is on
board and everybody wants those students to succeed. Nobody is stand-offish, everybody is pulling
their weight to do whatever we need to do to get those kids where they need to be. The RTA teacher
will pull extra students, besides first-graders she works with - multiple grade levels. And we as a team
will do that too. We’ll pull kids and give them that extra one on one and everybody is willing to do
that. And I think that is a major reason why they are so successful. (Classroom teacher, AY14).
…we start early with the kindergarten and 1st
grade literacy blocks … starting students right where
they are. We have some students in kindergarten that may be ready to read a simple text and we
have some students that are still working on their letters at the beginning of the year. And with the
reading interventions the early identification of students that may need a special education referral
or may have a learning disability kind of helps too because we try to catch that within the first 2 or 3
years so we can build on that success or get them caught up to where they need to be. (RTA teacher,
AY14).
3.8
2.5 2.7 3.3
1.8
0
1
2
3
4
5
ClassroomStructure (N = 19)
Curriculum (N = 19) LanguageEnvironment (N =
19)
Books and Reading(N = 19)
Print and Writing(N = 6)
41
I think it’s that constant, those meetings, that constant collaboration and that talk between our RTA
district person, me, our other interventionist. We’re all on the same page and if we’re not on the
same page we get on the same page. (Classroom teacher, AY14).
42
CHAPTER 9: BARRIERS AND BENEFITS
RTA TEACHER PERSPECTIVES
BENEFITS
During phone interviews, RTA teachers (N = 10) were asked about the benefits of the RTA Grant
Program. A review of responses revealed frequently cited benefits. Identifying and assisting students
that might normally “fall through the cracks” was one frequently cited benefit (N = 4). RTA teachers also
mentioned boosting student confidence (N = 6) and improving student performance (N = 3). An
additional benefit RTA teachers cited was the extra support they provided to classroom teachers (N = 5).
VERBATIM RTA TEACHER RESPONSES OF BENEFITS
The RTA program gives the students the things that they need to be successful on their grade
level. It gives them confidence and the skills they need (RTA teacher, AY14).
Getting those kids that would normally fall through the cracks and getting them up to where they
need to be and making them to be better readers in the long run. (RTA teacher, AY14).
Whatever I can do to help [classroom teachers]; they have so many students…they can come to
me for resources or ideas on how to help the children. (RTA teacher, AY14).
I feel like I’ve tried to be a leader in leading our school and showing them the importance of
intervention. It’s opened up a lot of teachers’ eyes to what they can do in the classroom for their
students and what areas they need to work on. (RTA teacher, AY14).
BARRIERS
RTA teachers (N = 10) had the opportunity to share their perceptions of challenges of the RTA Grant
Program. Over half of teachers (N = 6) reported program need exceeding available resources. RTA
teachers wished for more money and more time in the day so that they would be able to reach all
students who needed the additional help. Additionally, RTA teachers reported perceptions of other
teachers as a challenge (N = 3). One teacher explained, “I personally think that not everybody
understands what I do, and I understand that they’re in their classroom and they’ve never done it and I
had never done it before. But I kind of get the feeling that they think ‘Oh you have an easy job, you just
sit there and work with a small group or one on one.’ They don’t understand all the parameters that I
have to follow… I don’t know that the principal is aware of what I have to do—what I’m required to do.”
Additional perceived challenges included: scheduling issues (N = 3) and inconsistency in the form of
transient students or unforeseeable absences (e.g., snow days) (N = 2).
I had a little boy who knew 2 words on the [entry test] at the beginning of the year, then he scored 20 on
the test…when he was tested a couple of weeks ago…it just boosts their confidence. They’re more apt to
read independently. This child is just one I’ll never forget because he had no confidence; he did not want
to read. He has shown a lot of growth this year. - RTA teacher
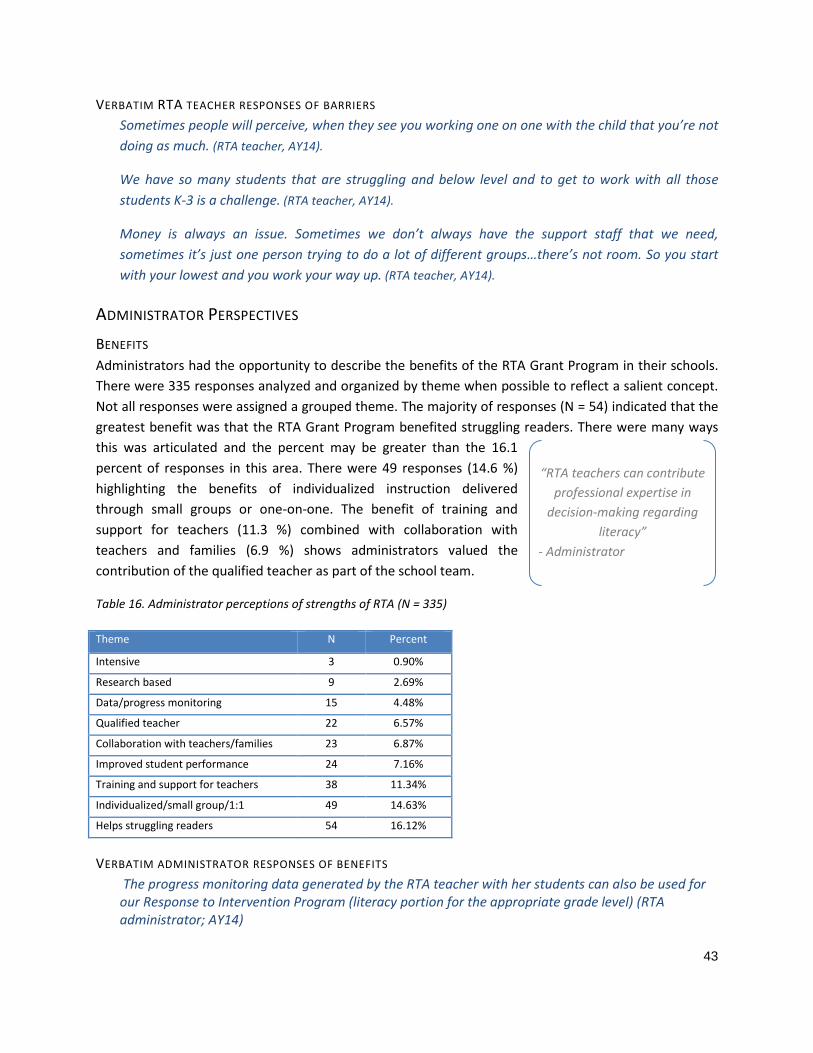
43
VERBATIM RTA TEACHER RESPONSES OF BARRIERS
Sometimes people will perceive, when they see you working one on one with the child that you’re not
doing as much. (RTA teacher, AY14).
We have so many students that are struggling and below level and to get to work with all those
students K-3 is a challenge. (RTA teacher, AY14).
Money is always an issue. Sometimes we don’t always have the support staff that we need,
sometimes it’s just one person trying to do a lot of different groups…there’s not room. So you start
with your lowest and you work your way up. (RTA teacher, AY14).
ADMINISTRATOR PERSPECTIVES
BENEFITS
Administrators had the opportunity to describe the benefits of the RTA Grant Program in their schools.
There were 335 responses analyzed and organized by theme when possible to reflect a salient concept.
Not all responses were assigned a grouped theme. The majority of responses (N = 54) indicated that the
greatest benefit was that the RTA Grant Program benefited struggling readers. There were many ways
this was articulated and the percent may be greater than the 16.1
percent of responses in this area. There were 49 responses (14.6 %)
highlighting the benefits of individualized instruction delivered
through small groups or one-on-one. The benefit of training and
support for teachers (11.3 %) combined with collaboration with
teachers and families (6.9 %) shows administrators valued the
contribution of the qualified teacher as part of the school team.
Table 16. Administrator perceptions of strengths of RTA (N = 335)
Theme N Percent
Intensive 3 0.90%
Research based 9 2.69%
Data/progress monitoring 15 4.48%
Qualified teacher 22 6.57%
Collaboration with teachers/families 23 6.87%
Improved student performance 24 7.16%
Training and support for teachers 38 11.34%
Individualized/small group/1:1 49 14.63%
Helps struggling readers 54 16.12%
VERBATIM ADMINISTRATOR RESPONSES OF BENEFITS
The progress monitoring data generated by the RTA teacher with her students can also be used for our Response to Intervention Program (literacy portion for the appropriate grade level) (RTA administrator; AY14)
“RTA teachers can contribute
professional expertise in
decision-making regarding
literacy”
- Administrator
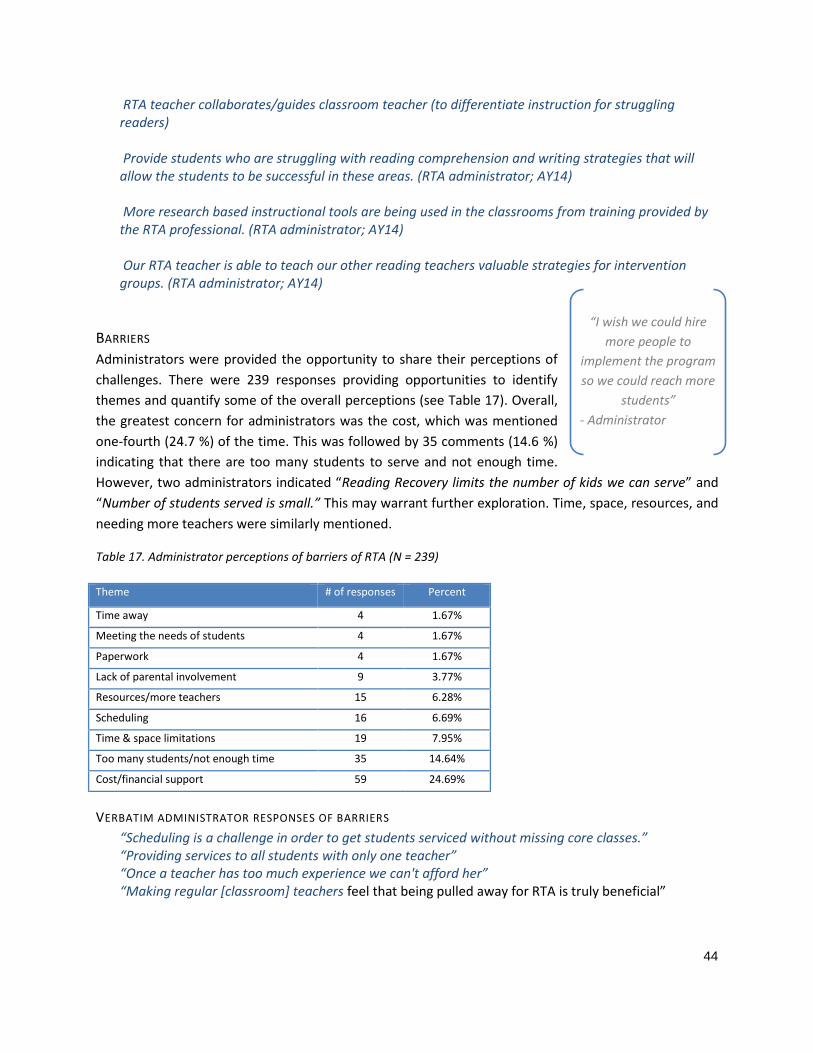
44
RTA teacher collaborates/guides classroom teacher (to differentiate instruction for struggling readers) Provide students who are struggling with reading comprehension and writing strategies that will allow the students to be successful in these areas. (RTA administrator; AY14) More research based instructional tools are being used in the classrooms from training provided by the RTA professional. (RTA administrator; AY14) Our RTA teacher is able to teach our other reading teachers valuable strategies for intervention groups. (RTA administrator; AY14)
BARRIERS
Administrators were provided the opportunity to share their perceptions of
challenges. There were 239 responses providing opportunities to identify
themes and quantify some of the overall perceptions (see Table 17). Overall,
the greatest concern for administrators was the cost, which was mentioned
one-fourth (24.7 %) of the time. This was followed by 35 comments (14.6 %)
indicating that there are too many students to serve and not enough time.
However, two administrators indicated “Reading Recovery limits the number of kids we can serve” and
“Number of students served is small.” This may warrant further exploration. Time, space, resources, and
needing more teachers were similarly mentioned.
Table 17. Administrator perceptions of barriers of RTA (N = 239)
Theme # of responses Percent
Time away 4 1.67%
Meeting the needs of students 4 1.67%
Paperwork 4 1.67%
Lack of parental involvement 9 3.77%
Resources/more teachers 15 6.28%
Scheduling 16 6.69%
Time & space limitations 19 7.95%
Too many students/not enough time 35 14.64%
Cost/financial support 59 24.69%
VERBATIM ADMINISTRATOR RESPONSES OF BARRIERS
“Scheduling is a challenge in order to get students serviced without missing core classes.” “Providing services to all students with only one teacher” “Once a teacher has too much experience we can't afford her” “Making regular [classroom] teachers feel that being pulled away for RTA is truly beneficial”
“I wish we could hire
more people to
implement the program
so we could reach more
students”
- Administrator
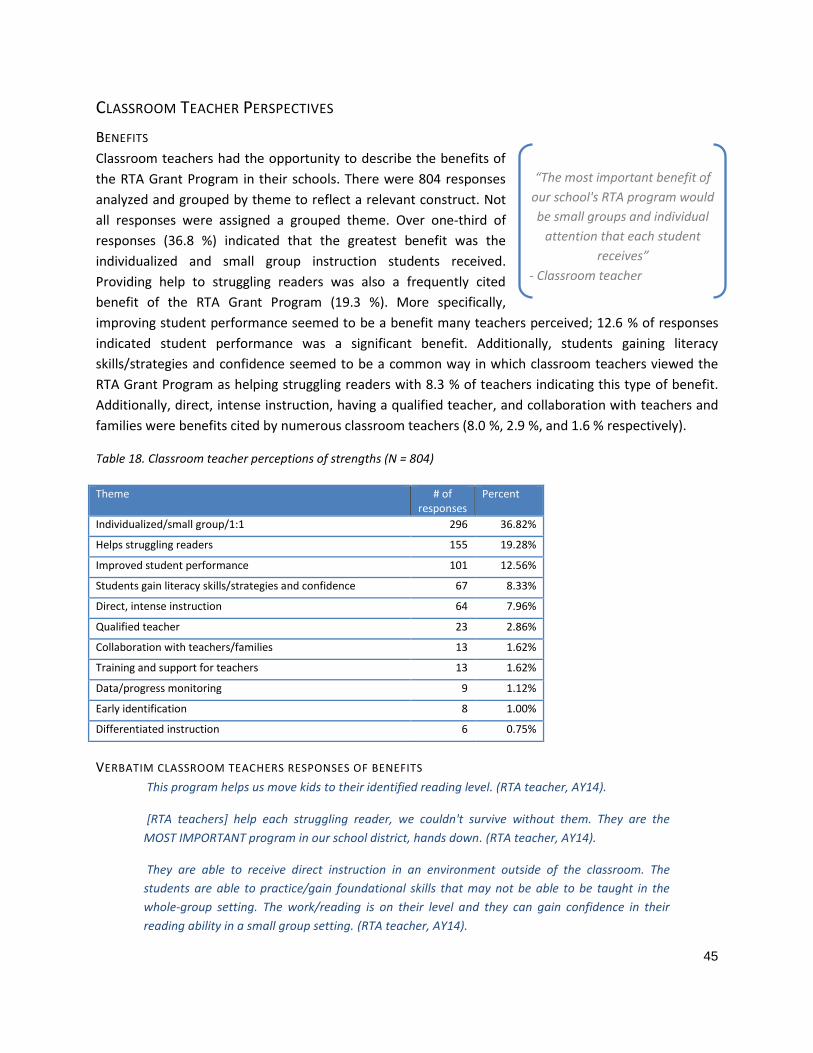
45
CLASSROOM TEACHER PERSPECTIVES
BENEFITS
Classroom teachers had the opportunity to describe the benefits of
the RTA Grant Program in their schools. There were 804 responses
analyzed and grouped by theme to reflect a relevant construct. Not
all responses were assigned a grouped theme. Over one-third of
responses (36.8 %) indicated that the greatest benefit was the
individualized and small group instruction students received.
Providing help to struggling readers was also a frequently cited
benefit of the RTA Grant Program (19.3 %). More specifically,
improving student performance seemed to be a benefit many teachers perceived; 12.6 % of responses
indicated student performance was a significant benefit. Additionally, students gaining literacy
skills/strategies and confidence seemed to be a common way in which classroom teachers viewed the
RTA Grant Program as helping struggling readers with 8.3 % of teachers indicating this type of benefit.
Additionally, direct, intense instruction, having a qualified teacher, and collaboration with teachers and
families were benefits cited by numerous classroom teachers (8.0 %, 2.9 %, and 1.6 % respectively).
Table 18. Classroom teacher perceptions of strengths (N = 804)
Theme # of responses
Percent
Individualized/small group/1:1 296 36.82%
Helps struggling readers 155 19.28%
Improved student performance 101 12.56%
Students gain literacy skills/strategies and confidence 67 8.33%
Direct, intense instruction 64 7.96%
Qualified teacher 23 2.86%
Collaboration with teachers/families 13 1.62%
Training and support for teachers 13 1.62%
Data/progress monitoring 9 1.12%
Early identification 8 1.00%
Differentiated instruction 6 0.75%
VERBATIM CLASSROOM TEACHERS RESPONSES OF BENEFITS
This program helps us move kids to their identified reading level. (RTA teacher, AY14).
[RTA teachers] help each struggling reader, we couldn't survive without them. They are the
MOST IMPORTANT program in our school district, hands down. (RTA teacher, AY14).
They are able to receive direct instruction in an environment outside of the classroom. The
students are able to practice/gain foundational skills that may not be able to be taught in the
whole-group setting. The work/reading is on their level and they can gain confidence in their
reading ability in a small group setting. (RTA teacher, AY14).
“The most important benefit of
our school's RTA program would
be small groups and individual
attention that each student
receives”
- Classroom teacher
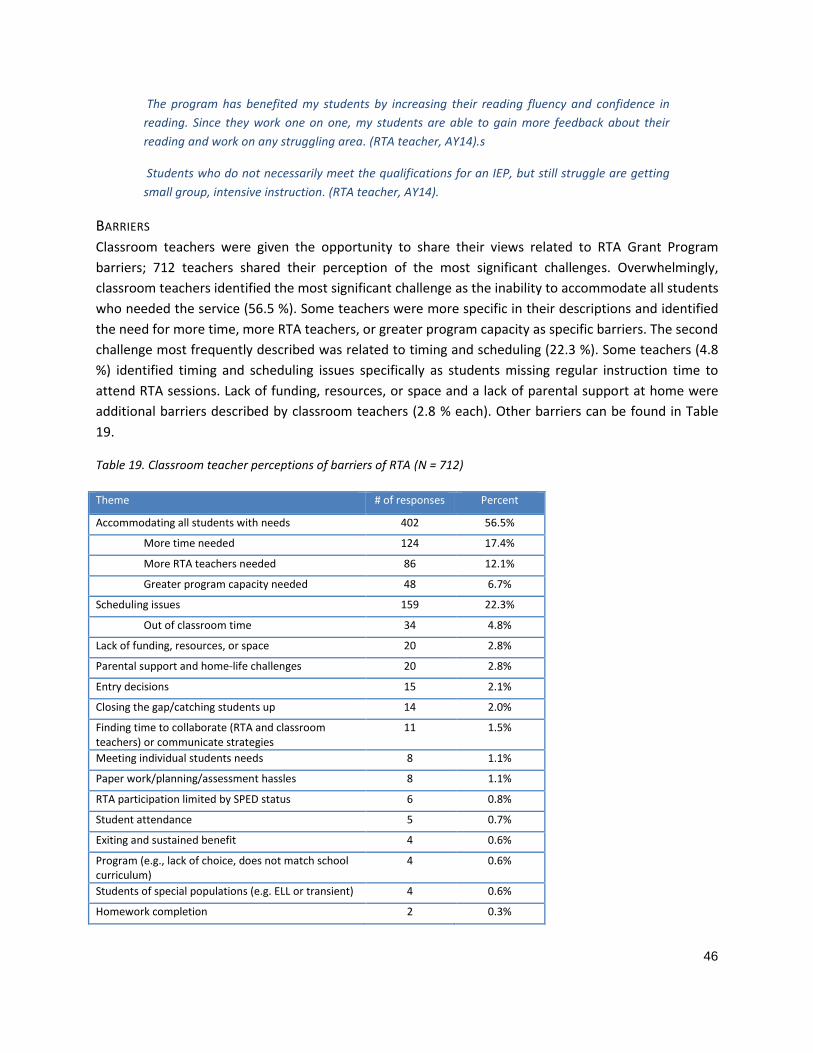
46
The program has benefited my students by increasing their reading fluency and confidence in
reading. Since they work one on one, my students are able to gain more feedback about their
reading and work on any struggling area. (RTA teacher, AY14).s
Students who do not necessarily meet the qualifications for an IEP, but still struggle are getting
small group, intensive instruction. (RTA teacher, AY14).
BARRIERS
Classroom teachers were given the opportunity to share their views related to RTA Grant Program
barriers; 712 teachers shared their perception of the most significant challenges. Overwhelmingly,
classroom teachers identified the most significant challenge as the inability to accommodate all students
who needed the service (56.5 %). Some teachers were more specific in their descriptions and identified
the need for more time, more RTA teachers, or greater program capacity as specific barriers. The second
challenge most frequently described was related to timing and scheduling (22.3 %). Some teachers (4.8
%) identified timing and scheduling issues specifically as students missing regular instruction time to
attend RTA sessions. Lack of funding, resources, or space and a lack of parental support at home were
additional barriers described by classroom teachers (2.8 % each). Other barriers can be found in Table
19.
Table 19. Classroom teacher perceptions of barriers of RTA (N = 712)
Theme # of responses Percent
Accommodating all students with needs 402 56.5%
More time needed 124 17.4%
More RTA teachers needed 86 12.1%
Greater program capacity needed 48 6.7%
Scheduling issues 159 22.3%
Out of classroom time 34 4.8%
Lack of funding, resources, or space 20 2.8%
Parental support and home-life challenges 20 2.8%
Entry decisions 15 2.1%
Closing the gap/catching students up 14 2.0%
Finding time to collaborate (RTA and classroom teachers) or communicate strategies
11 1.5%
Meeting individual students needs 8 1.1%
Paper work/planning/assessment hassles 8 1.1%
RTA participation limited by SPED status 6 0.8%
Student attendance 5 0.7%
Exiting and sustained benefit 4 0.6%
Program (e.g., lack of choice, does not match school curriculum)
4 0.6%
Students of special populations (e.g. ELL or transient) 4 0.6%
Homework completion 2 0.3%
47
VERBATIM CLASSROOM TEACHER RESPONSES OF BARRIERS
There are so many students who could benefit from services yet there are limited slots. (RTA teacher, AY14).
Finding the time to pull students that is not during protected reading/math time. Often these students are below average across the board and have to miss instructional content for this program. (RTA teacher, AY14).
Meeting the needs of all the students that need extra assistance to the degree that they need it. Many are very behind to start with. (RTA teacher, AY14).
Time to collaborate and communicate between the classroom teacher and the RTA teacher. (RTA teacher, AY14).
The lack of flexibility to choose a child that you KNOW would benefit more/move along faster but cannot because of the criteria that is used in the selection process. Student attendance and work ethic should be a factor. (RTA teacher, AY14).
Getting parents involved and to read on a consistent basis with their child outside of school. (RTA teacher, AY14).
48
CONCLUSION The Read to Achieve Grant Program, established since 2005, is intended to help ensure students’
reading proficiency by the end of the primary grades by providing schools with funds used primarily for
hiring an intervention teacher who provides short-term, intensive instruction to students struggling with
reading. The purpose of the evaluation of the 2014–15 RTA Grant Program was to more fully understand
what the RTA Grant Program looked like beyond the grant mandated requirements and to determine if
it was having a positive effect on participants’ literacy skills. The three main focuses of the evaluation
included: describing the RTA Grant Program, assessing RTA Grant Program outcomes, and exploring RTA
Grant Program implementation. A summary of findings is presented as well as recommendations for
future evaluations.
SUMMARY OF FINDINGS
RTA GRANT PROGRAM DESCRIPTION
In describing the RTA Grant Program, RTA teacher demographics, qualifications, experience, and RTA
teachers’ colleagues’ perceptions were described. RTA teachers were highly qualified with Ranks 1 & 2,
Masters, Doctorate, or National Board Certification. On average, RTA teachers had 17 years of total
teaching experience and almost five years’ of RTA teaching experience. However, it should be noted that
one-third of RTA teachers were new to the RTA program in the 2014–15 school year. Administrators and
classroom teachers were satisfied with RTA teachers; however, about one-fifth of administrators and
classroom teachers did not necessarily agree that RTA teachers were strong in tasks related to
leadership (e.g., leading decision making literacy intervention meetings or providing training for others
in their school).
The RTA Grant Program was also described by exploring school collaboration and the relationship
between classroom teachers and RTA teachers. Nearly all RTA schools had a formal collaborative team.
Teams were generally led by principals (or other administrator) or RTA teachers and typically met
monthly. Qualitative data indicated teachers had positive feelings towards regular meetings and found
them valuable. RTA teacher and classroom teachers communicated informally as well. Initial data
indicated communication between teachers was beneficial to both parties with feedback and
suggestions resulting in teachers adjusting their instruction.
Funding was also considered in the RTA Grant Program description. Schools received $48,500 at the
start of the 2014–15 school year. On average, administrators reported spending 94 % of grant monies on
teachers’ salaries and for many schools, the RTA grant did not cover the full cost of the program. Three-
quarters of administrators reported supplementing the grant funds in order to pay for the RTA
intervention program or teacher.
The RTA program was also described in the form of typical RTA student experiences. There were 10,445
students served by the RTA Grant Program during the 2014–15 school year. First-graders were the most
widely served, followed by second-graders, kindergarteners, and third- graders. RTA student
demographics resembled those of non-RTA students. RTA teachers indicated program selection was
49
based on a universal performance screener and/or a classroom teacher referral (about one-third of RTA
teachers reported using multiple assessments). Only a few RTA students were referred for services
rather than being identified by specific assessments.
Once selected for the RTA approved intervention program, students tended to begin interventions one
to three weeks after the start of the school year. The intervention was mostly provided through one-on-
one instruction or in small groups of four to five students. Students most often received the intervention
during literacy or other content area time.
Intervention program exit was most often determined by the RTA teacher. Frequently cited exit criteria
included meeting established goals and/or achieving a target score on an assessment. Not all students
exited the program successfully; more students continued in the intervention program or exited to
another intervention than successfully exited. Qualitative interview data suggest exiting barriers may
include student behavior or the need for special education.
The RTA Grant Program was also described in terms of differences between RTA approved intervention
programs (i.e., EIR, Reading Recovery, CIM, or Reading Mastery). The majority of schools indicated they
used Reading Recovery. Over the year, RTA teachers’ caseloads averaged 33 students. On average, RTA
teachers served the most students using EIR, followed by CIM and Reading Mastery. Reading Recovery
tended to serve fewer students due to its one-on-one nature. Most interventions occurred daily and
lasted an average of 30 minutes. Reading Recovery had the highest percentage of students who
successfully exited the intervention program.
Stakeholders’ perceptions of RTA Grant Program barriers and benefits also helped to describe the RTA
program. RTA teachers, classroom teachers, and administrators reported similar benefits and barriers.
The greatest benefit reported was that the RTA Grant Program helped students who might not
otherwise receive intervention and that the program helped raise student confidence and scores.
Administrators reported that the training and support for teachers, as well as, the small group
instruction was a benefit. Both teachers and administrators reported that cost was a barrier, that there
were too many students who needed help, and that time and space were limited to help so many.
RTA PROGRAM OUTCOMES
RTA program outcomes were assessed at the student- and school-levels. Students’ average fall to spring
growth on the MAP assessment was reported by grade and by subgroup. RTA students’ MAP reading
scores were significantly higher at spring administration compared to fall administration. Overall, RTA
student fall to spring growth on the MAP Assessment was 17.1 points for kindergarteners, 15.8 points
for first-graders, 17.1 for second-graders, and 13.4 points for third-graders. Second and third-grade RTA
students’ growth was greater than the average predicted growth indicating second and third-grade RTA
students are making gains and closing the achievement gap. School characteristics (i.e. urbanicity,
region, and strength of library media centers) did not influence RTA outcomes.
50
RTA PROGRAM IMPLEMENTATION
A pilot study was conducted in order to explore the feasibility of assessing RTA Grant Program
implementation through classroom observations. Results indicated future considerations for assessing
implementation include: relevance of data used to determine top performing schools, the fit of the
instrument for intervention settings, and the cost of individual observations.
IMPLEMENTATION AND EVALUATION CHALLENGES
The RTA Grant Program initiated significant changes in the 2014–15 school year; RTA schools were
required to select one of five programs and document and track RTA students using the Infinite Campus
program. Program changes created some barriers to implementation and evaluation.
IMPLICATIONS OF CHANGES TO GRANT-APPROVED PROGRAMS
Perhaps due to the new cohort of RTA schools, one-third of RTA teachers were new to RTA. Additionally,
many RTA teachers with RTA experience were new to their school’s intervention program. The newness
of RTA teachers seemed to have multiple effects. Firstly, many RTA teachers reported using intervention
programs not approved by the RTA Grant Program. Secondly, many teachers were unable to receive
intervention program sanctioned training due to intervention program requirements. These findings
weaken assumptions of RTA Grant Program implementation fidelity. A key component of the 2014–15
RTA program is the implementation of the select, grant-approved intervention programs and without
implementation fidelity, the validity of reported outcomes is weakened.
IMPLICATIONS OF CHANGES TO STUDENT TRACKING
The use of Infinite Campus to track students resulted in challenges related to data analysis. As one might
expect with the roll out of any new system, the data entered was not perfect; some students were
entered more than once. In some instances, it seemed students were entered when they began the
program and then again when they ended. In other cases, students appeared to receive the intervention
in the fall and spring, but each semester was entered separately. On still other occasions it appeared
students switched schools. Additionally, students flagged as participating in RTA in the CIITS database
did not always match students tracked in Infinite Campus.17 Similarly, students flagged as participating in
RTA in the CIITS database were not always matched to schools receiving the RTA grant. These data
quality issues weaken the validity of reported conclusions. As stakeholders become more accustomed to
Infinite Campus, data quality is expected to improve.
DATA AVAILABILITY
The present evaluation relied heavily on MAP assessment data when considering student outcomes;
however, the cons associated with using MAP data were considerable. Only about two-thirds of RTA
schools used the MAP assessment meaning not all RTA schools were included in the evaluation of
student outcomes. Additionally, MAP is frequently, although not always, used at two time points—fall
and spring. Although this allowed for the consideration of student growth, there is no way to assure that
17 There were 121 students identified as a RTA student in the CIITS database, but with without corresponding data in the
Intervention Tab; these students are not included in the analysis.
51
students’ fall assessment scores reflect pre-intervention literacy skills and that spring assessment scores
reflect post-intervention literacy skills. Additionally, since students receive the RTA intervention at
differing points during the school year, time from intervention program completion and assumed post-
intervention assessment (spring MAP assessment) may vary. Despite the drawbacks of using MAP data,
it still was the best available option. This is due to the fact that RTA schools are able to select their own
literacy assessment resulting in the use of a wide variety of assessments. Similarly, only MAP
assessment, STAR assessment, and K-PREP assessment data are currently available on Infinite Campus.
Although K-PREP would be available for all RTA schools it is not collected until third-grade, which means
that there is no universal student achievement data available for all RTA schools for K-2 students (a
majority of the RTA participants). It is also important to note that K-PREP data is collected at one time
point and will not allow analysis of growth over a single school year.
Additionally, data reflecting a key student demographic—poverty—is not easily accessible. Free and
Reduced Priced Meal (FRPM) data is often used as a proxy for student socio-economic status (SES);
however, FRPM data is no longer available at the student-level.
RECOMMENDATIONS AND FUTURE CONSIDERATIONS
Based on the key findings of the evaluation and ability to synthesize the information due to challenges
encountered, the following recommendations are provided:
Focus on RTA Grant Program implementation. Assurance of RTA implementation fidelity will
result in more meaningful results.
Continue training efforts. With so any new teachers, training will improve consistency.
Expand the RTA Grant Program at RTA schools. Overwhelmingly, stakeholders expressed
student need exceeding program capacity. RTA teachers were not always able to reach all
students who needed the intervention services. Increasing the number of available slots,
increasing the time available for RTA interventions to occur, and/or increasing the number of
literacy specialists are three possible solutions.
Continue parental involvement. There is evidence of parental outreach. Teachers and
administrators can seek to understand what more parents may need.
Consider the use of a universal literacy assessment at RTA schools. To ensure all RTA schools
are considered when assessing student outcomes it is important to have a universal measure
that would allow measurement before program participation and after program completion.
Explore program factors related to student outcomes. School collaboration, RTA teacher
experience, and the intervention program used may be additional areas to explore. Additionally,
comparing high performing and low performing RTA schools may allow for a better
understanding of factors related to student success.
Examine alternate observation measures. Finding a new measure, or modifying the current
measure, to assess the quality of literacy specifically in intervention settings will provide more
meaningful results.
A1
Appendix A: RTA TEACHER SUR VEY (FALL)
A2
A3
A4
A5
A6
Appendix B: RTA TEACHER SUR VEY (W INTER)
A7
A8
A9
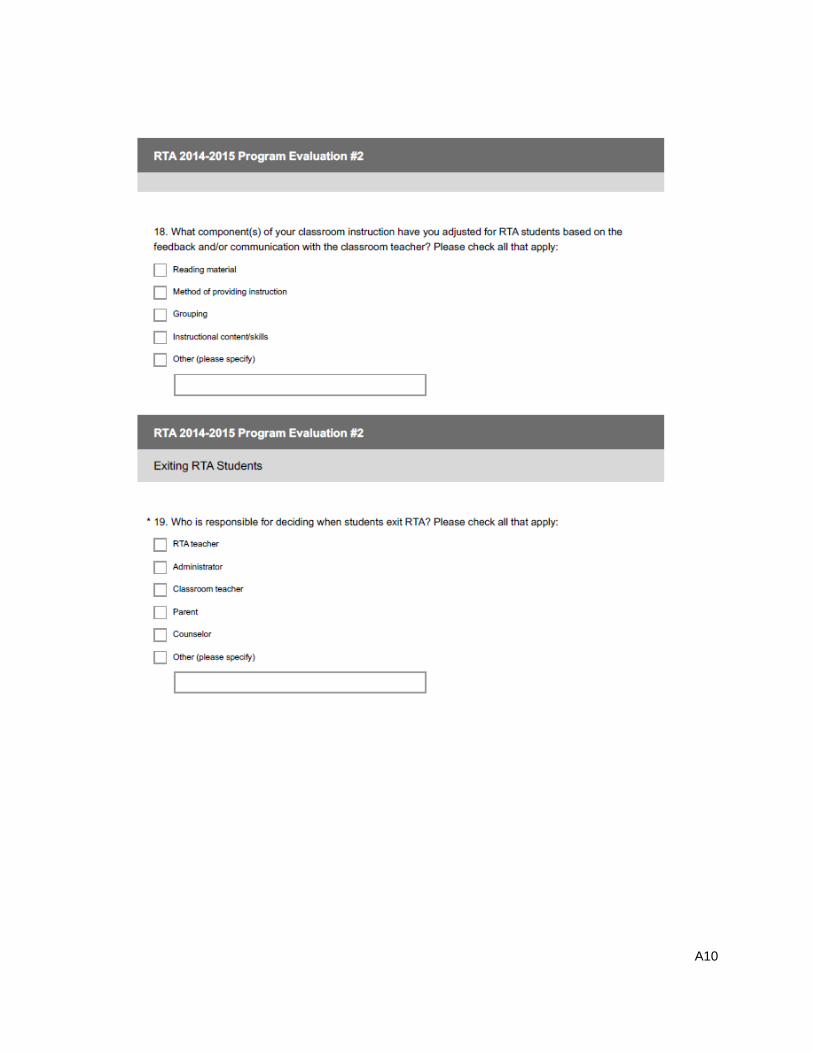
A10
A11
A12
Appendix C: RTA TEACHER SUR VEY (SPRI NG)
A13
A14
A15
A16
A17
Appendix D: TRADIT IO NAL CLASSROO M TEACHE R SU RVE Y
A18
A19
A20
A21
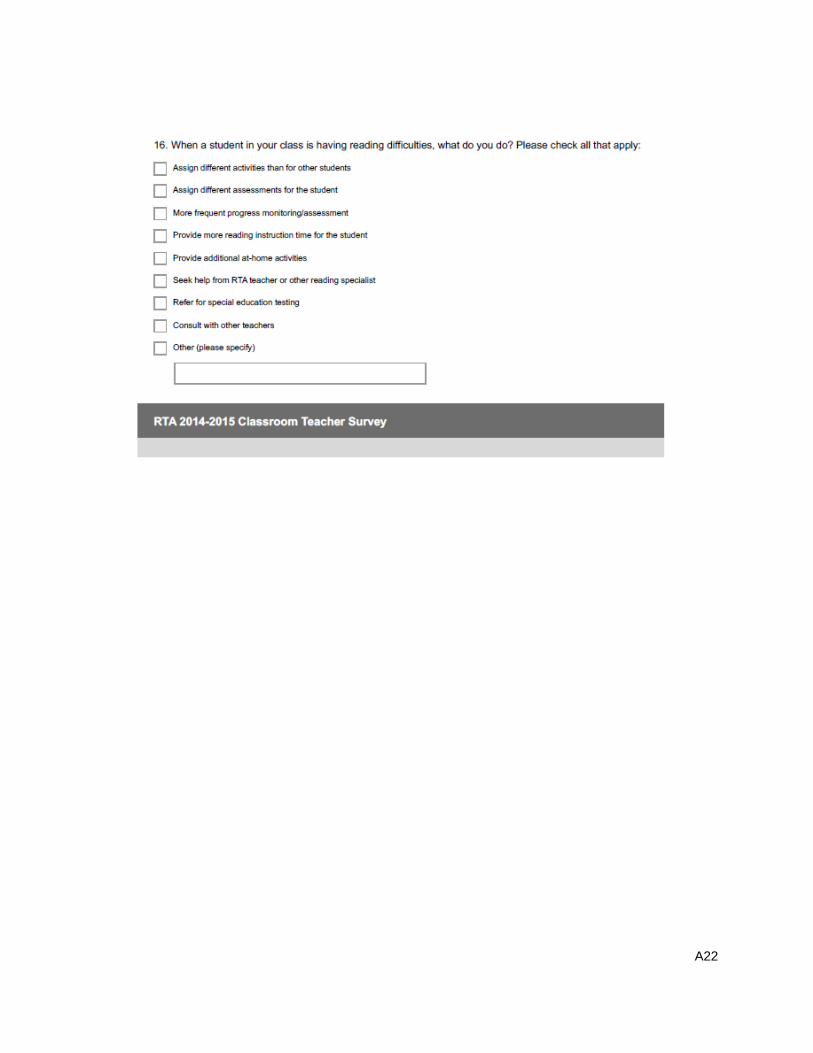
A22
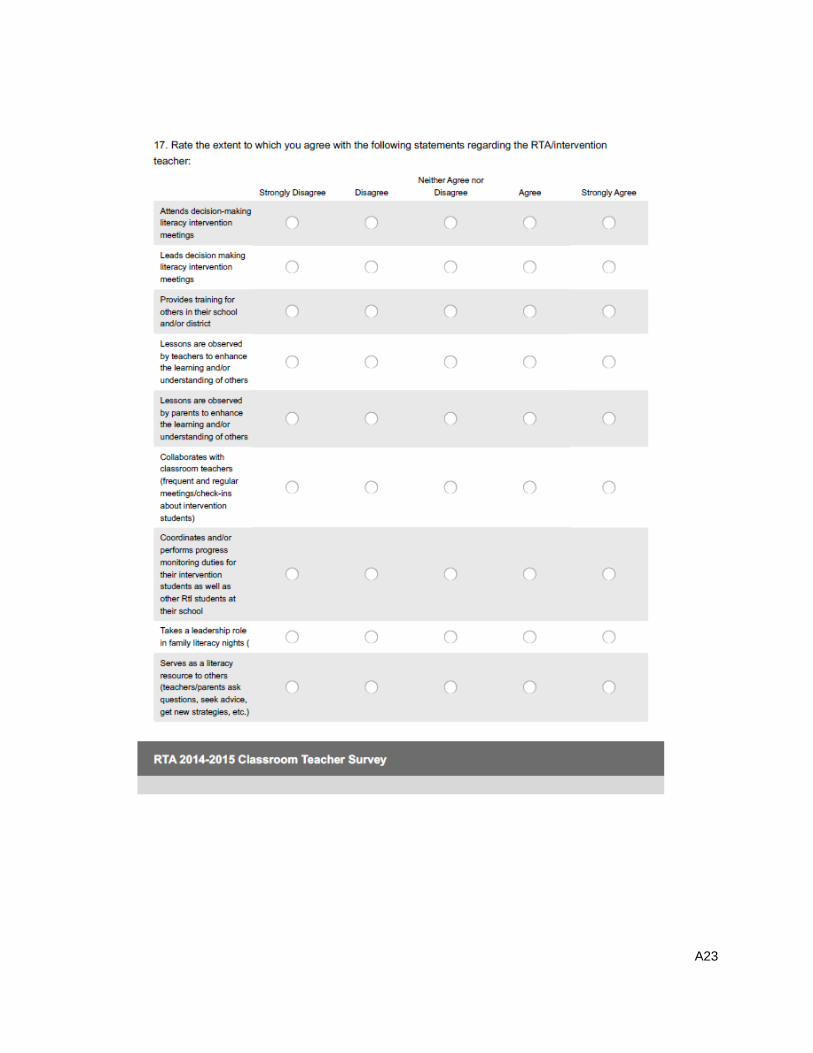
A23
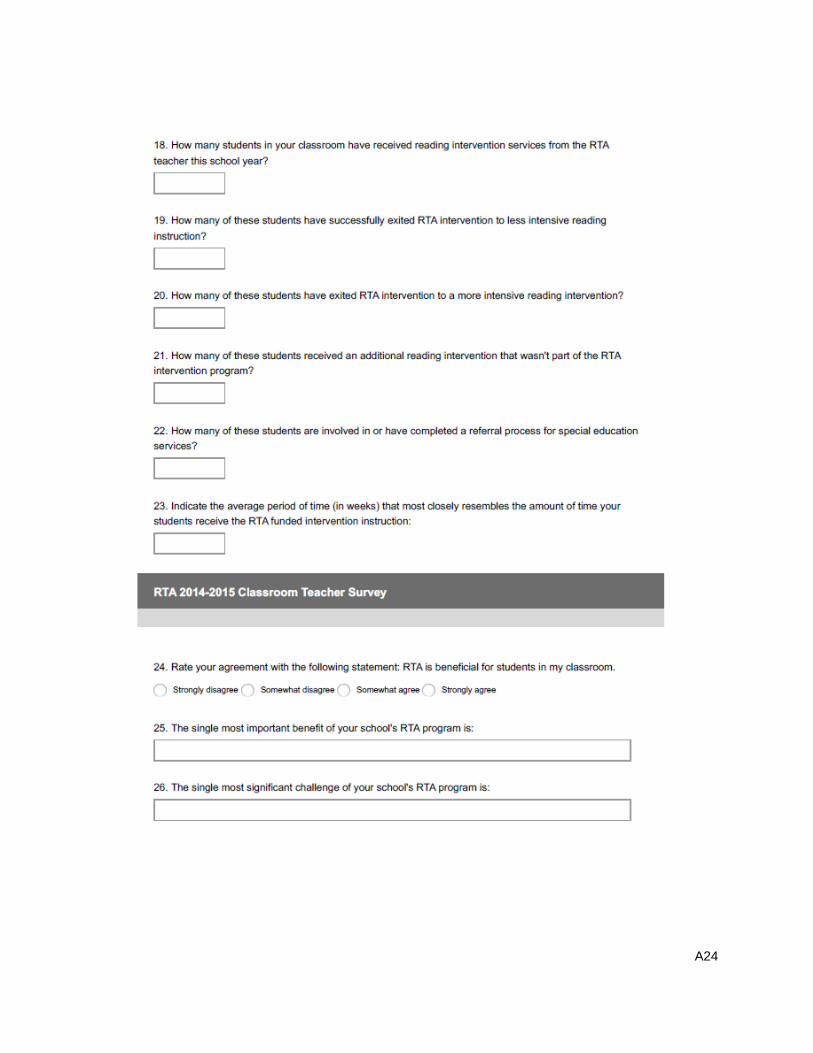
A24
A25
A26
Appendix E: ADMINI ST RATOR SUR VEY
A27
A28
A29
A30
A31
A32
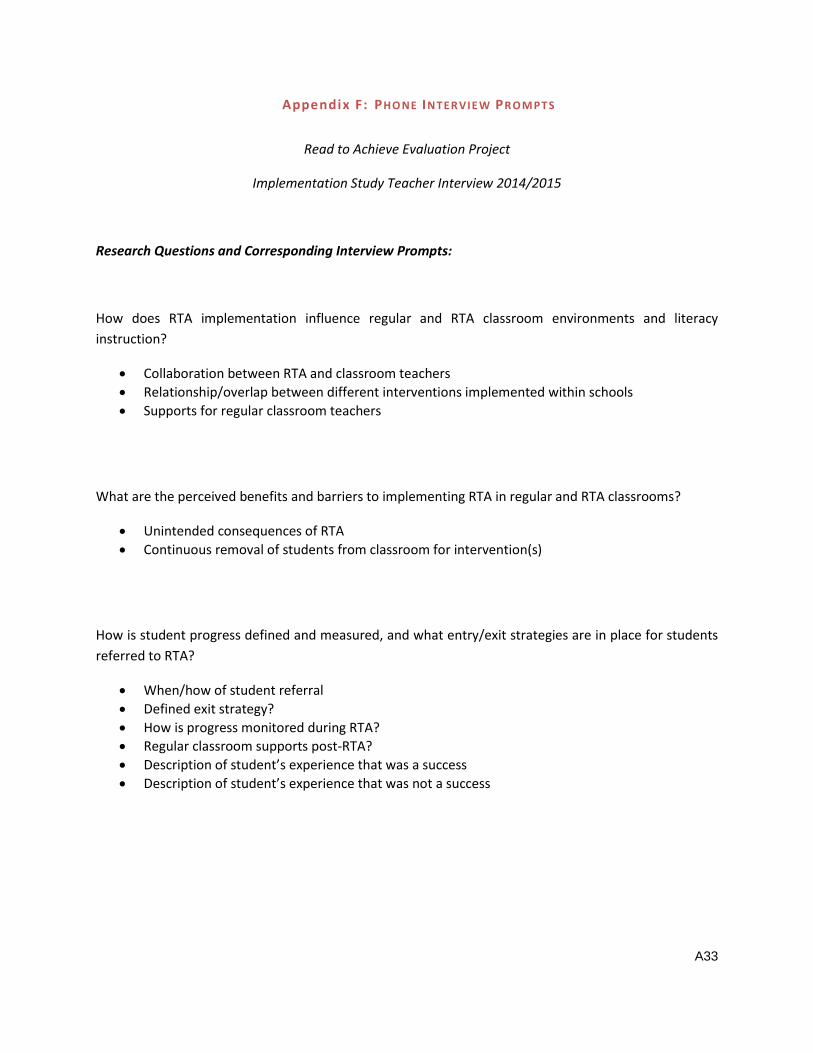
A33
Appendix F: PHO NE INTER VIE W PR OMPT S
Read to Achieve Evaluation Project
Implementation Study Teacher Interview 2014/2015
Research Questions and Corresponding Interview Prompts:
How does RTA implementation influence regular and RTA classroom environments and literacy
instruction?
Collaboration between RTA and classroom teachers
Relationship/overlap between different interventions implemented within schools
Supports for regular classroom teachers
What are the perceived benefits and barriers to implementing RTA in regular and RTA classrooms?
Unintended consequences of RTA
Continuous removal of students from classroom for intervention(s)
How is student progress defined and measured, and what entry/exit strategies are in place for students
referred to RTA?
When/how of student referral
Defined exit strategy?
How is progress monitored during RTA?
Regular classroom supports post-RTA?
Description of student’s experience that was a success
Description of student’s experience that was not a success