evaluation of in vitro cytotoxicity and genotoxicity of copper–zinc alloy nanoparticles in human...
TRANSCRIPT
Food and Chemical Toxicology 73 (2014) 105–112
Contents lists available at ScienceDirect
Food and Chemical Toxicology
journal homepage: www.elsevier .com/locate / foodchemtox
Evaluation of in vitro cytotoxicity and genotoxicity of copper–zinc alloynanoparticles in human lung epithelial cells
http://dx.doi.org/10.1016/j.fct.2014.07.0400278-6915/� 2014 Elsevier Ltd. All rights reserved.
⇑ Corresponding author. Tel.: +90 224 2941869; fax: +90 224 2941899.E-mail address: [email protected] (T. Çavas�).
Ümit Kumbıçak a, Tolga Çavas� b,⇑, Nilüfer Çinkılıç b, Zübeyde Kumbıçak a, Özgür Vatan b, Dilek Yılmaz b
a Department of Molecular Biology and Genetics, Faculty of Science and Art, Nevs�ehir University, 50300 Nevs�ehir, Turkeyb Cell Culture and Genetic Toxicology Laboratory, Department of Biology, Faculty of Sciences and Arts, Uludag University, 16059 Nilüfer, Bursa, Turkey
a r t i c l e i n f o a b s t r a c t
Article history:Received 15 March 2014Accepted 31 July 2014Available online 10 August 2014
Keywords:NanotoxicologyCopper–zinc alloy nanoparticlesBEAS-2B cellsCytotoxicityGenotoxicity
In the present study, in vitro cytotoxic and genotoxic effect of copper–zinc alloy nanoparticles (Cu–ZnANPs) on human lung epithelial cells (BEAS-2B) were investigated. XTT test and clonogenic assay wereused to determine cytotoxic effects. Cell death mode and intracellular reactive oxygen species formationswere analyzed using M30, M65 and ROS Elisa assays. Genotoxic effects were evaluated usingmicronucleus, comet and c-H2AX foci assays. Cu–Zn ANPs were characterized by transmission electronmicroscopy (TEM), dynamic light scattering (DLS) and zeta potential measurements. Characterizationof Cu–Zn ANPs showed an average size of 200 nm and zeta potential of �22 mV. TEM analyses furtherrevealed the intracellular localization of Cu–Zn ANPs in cytoplasm within 24 h. Analysis of micronucleus,comet and c-H2AX foci counts showed that exposure to Cu–Zn ANPs significantly induced chromosomaldamage as well as single and double stranded DNA damage in BEAS-2B cells. Our results further indicatedthat exposure to Cu–Zn ANPs significantly induced intracellular ROS formation. Evaluation of M30:M65ratios suggested that cell death was predominantly due to necrosis.
� 2014 Elsevier Ltd. All rights reserved.
1. Introduction
In the last decade, significant progress has been achieved in thenano-scale science and technology. Today, nanomaterials andnanoparticles are widely used in different areas such as health, cos-metics, clothing, food, energy, space exploration, and defenseindustries (Arora et al., 2012; Ferreira et al., 2013). Among differenttypes of nanoparticles, metals constitute one of the most widelystudied groups due to their widespread usage. Most widely studiedmetal nanoparticles include gold, silver, titanium, and iron parti-cles (Hussain et al., 2005; Schrand et al., 2010; Love et al., 2012).The widespread production and utilization of nanoparticles alsomakes them available for humans and the environment. Chemical,physical, and functional properties of nano-sized particles oftendiffer compared with particles of larger size or dissolved speciesof the same element (Roduner, 2006). Similarly they can show dif-ferent effects on biological systems then they exhibit on a macro-scale (Nel et al., 2006; Midander et al., 2009). It is known that,nanoparticles may lead the cell death via damaging DNA or organ-elles (Buzea et al., 2007; Manke et al., in press). Thus the evaluationof potential effects of nanoparticles is crucial.
In the recent years Copper and zinc containing nanoparticlesalso received considerable attention due to their unique antibacte-rial, antifungal, UV filtering and semiconductor properties as wellas their high catalytic and photochemical activities (Meruvuet al., 2011; Trickler et al., 2012). In vivo studies demonstratedthe toxicity of Cu and Zn containing nanoparticles on differentorganisms such as fish (Ates� et al., in press), drosophila (Hanet al., 2014), amphipods (Hanna et al., 2013), rats (Amara et al.,in press), mice (Adamcakova-Dodd et al., 2014) and bacteria(Rousk et al., 2012). In vitro toxicity of Cu Zn nanoparticles havealso been shown by several authors (Akhtar et al., 2012; Changet al., 2012; Sahu et al., 2013). In general, Cu and zinc Zn containingnanoparticles were found to be comparatively more toxic thanother metal nanoparticles (Karlsson et al., 2008, 2013). Forinstance, Lanone et al. (2009) compared 24 different nanoparticleson the toxicity in the human lung cell line (A549) and macrophagecell line (THP-1) and found that copper and zinc containing nano-particles were the most toxic ones, whereas titanium, aluminum,cerium, and zirconium containing nanoparticles were moderatelytoxic and tungsten carbide nanoparticles were non-toxic.
Metals can be mixed in different proportions to create newmetallic systems with different characteristics (Ferrando et al.,2008). In this manner, combination of copper and zinc elementsconstitute a well-known example of metal alloys (Singh et al.,2009). Cu–Zn ANPs are one of the most commonly used alloys
106 Ü. Kumbıçak et al. / Food and Chemical Toxicology 73 (2014) 105–112
especially in biomedical applications and in consumer products,due to their specific properties (Tripathi et al., 2012; Bondarenkoet al., 2013; Karlsson et al., 2013). They are also used during pro-duction stages of microbateries, microelectronic circuits, nanoc-ables and nanoliquids (Tripathi et al., 2012). It is known thatalloys can possess different effecs than their components(Bardack et al., 2014). Numerous genotoxicity studies have demon-strated DNA damaging potential of copper and zinc containingnanoparticles on human skin keratinocytes (Alarifi et al., 2013),lung epithelial cells (Ahamed et al., 2010), peripheral blood lym-phocytes (Gumus et al., 2014) and kidney cells (Wahab et al.,2013). However, Cytotoxicity and genotoxicity data on the Cu–ZnANPs is scarce.
In the present study, we aimed to evaluate the in vitro cytotoxicand genotoxic effects of Cu–Zn ANPs on human lung epitheliumcells (BEAS-2B). We used XTT and clonogenic assays to assess cyto-toxicity and comet, micronucleus (MN) and gamma H2AX foci for-mation assays to evaluate genotoxicity. Additionally, we measuredthe intracellular production of reactive oxygen species (ROS) by theoxidation sensitive fluoroprobe 2,7-dichlorofluorescin diacetate(DCFH-DA) and applied M30 and M65 assays to evaluate apoptoticand necrotic responses, respectively.
2. Materials and methods
2.1. Chemicals
Cu–Zn ANPs (40%Zn–60%Cu: <150 nm) at >99% purity were purchased fromSigma–Aldrich. Other chemicals and their sources were as follows: RPMI-1640medium and supplemental growth factors (Lonza, Basel, Switzerland); PBS, cyto-chalasin-B, giemsa, low melting point agarose, normal melting point agarose, EDTAand Triton X-100 (Sigma–Aldrich, St. Louis, MO); anti phospho c-H2AX primary andaleuxafuor 488 labeled secondary antibodies (Thermo Scientific and Invitrogen).Hydrogen peroxide (H2O2) was used as positive control at a single concentrationof 147 lM. Sterile distilled water was used as solvent control at a maximum con-centration of 0.5% (v/v).
2.2. Characterization of nanoparticles
A stock suspension of Cu–Zn ANPs (final concentration 1 mg/ml) was preparedin distilled water. Prior to each treatment, it was ultrasonicated (Bandelin Sonifier)for 20 min and diluted to prepare the desired ANPs concentrations. Particle mor-phology, size, and agglomeration states were characterized by using transmissionelectron microscopy (TEM), dynamic light scattering (DLS), and zeta potential anal-yses. Average hydrodynamic size, size distribution, and zeta potential of particles insuspension were determined by dynamic light scattering (DLS) using a MalvernZetasizer.
2.3. Cell culture
Since inhalation is considered as one of the main routes of exposure to copperand zinc, healthy human lung epithelial cell line (BEAS-2B) was selected for outstudies. Suitability of this cell line for genotoxicity assessment of different typesof chemicals including nanoparticles has also been previously demonstrated(Capasso et al., 2014; Kim et al., 2011). BEAS-2B cells were kindly provided by Dr.E. Ulukaya (University of Uludag). The cells were grown in RPMI-1640 medium sup-plemented with 10% fetal calf serum (FCS), penicillin–streptomycin (50 lg/ml),2 mM L-glutamine, and 1% sodium pyruvate. Cells were maintained at 37 �C in ahumidified atmosphere containing 5% CO2 and grown in 75 cm2 flasks and subcul-tured once a week.
2.4. Selection of the doses
BEAS-2B cells were exposed to serial concentrations of Cu–Zn ANPs (0.1, 0.5, 1,5, 8, 12, 16, 20, 25, 50 and 100 lg/ml) to determine cytotoxicity and IC50 value.According to determined IC50 value, non-cytotoxic and low cytotoxic doses (0.1,0.2, 0.4, 0.8, 1.6 and 3.2 lg/ml) of Cu–Zn ANPs were selected for genotoxicity exper-iments. Furthermore, two additional toxic doses (6.4 and 12.8 lg/ml) were alsoused to obtain and analyze cell death pathways in M30 and M65 tests.
2.5. Cellular uptake
BEAS-2B cells exposed to 2 lg/ml of ANPs solution for 24 h were examinedunder TEM to evaluate possible cellular internalization of Cu–Zn ANPs.
2.6. Cytotoxicity
XTT and clonogenic assays were used to test the potential effects of Cu–Zn ANPson viability of BEAS-2B cells. To determine the cytotoxicity of Cu–Zn ANPs, BEAS-2Bcells were exposed to serial concentrations of Cu–Zn ANPs. Untreated cells served asa control group.
XTT assay was performed by using a Cell Viability Assay Kit, which detects thecellular metabolic activities due to colorimetric features. During the assay, the yel-low tetrazolium salt XTT is reduced to a highly colored formazan dye by dehydro-genase enzymes in metabolically active cells. This conversion only occurs in viablecells and thus, the amount of formazan produced is proportional to viable cells inthe sample (Scudiero et al., 1988; Berridge et al., 2005). Five thousand cells wereseeded in into a flat-bottom 96-well plate (which contains 100–200 ll/well culturemedium) in triplicate and allowed to grow for 24 h. Cells were than treated withserial concentrations of Cu–Zn ANPs (0.1, 0.5, 1, 5, 8, 12, 16, 20, 25, 50 and100 lg/ml) for 24 h. Three wells containing 100 ll of growth medium were usedfor blank absorbance readings. Then 50 ll of the Activated-XTT Solutions wereadded to each well. Finally, the plate was incubated for 2 h and absorbance wasread at 450 nm. Experiments were repeated for three times.
Clonogenic assay, which measures the reduction in plating efficiency in thetreatment and control groups, was also used to assess cytotoxicity (Wise et al.,2010). Fifty thousand cells were seeded in T25 tissue culture treated flasks andallowed to grow for 48 h. The cultures were then treated for 24 h with serial con-centrations (0.1, 0.5, 1, 5, 8, 12, 16, 20, 25, 50 and 100 lg/ml) of Cu–Zn ANPs. Fol-lowing exposure period, the treatment medium was collected, the cells wererinsed with PBS; and then removed with 0.25% trypsin/1 mM EDTA solution. Cellswere centrifuged at 1000 rpm, 4 �C for 5 min. The pellet was re-suspended in5 ml of medium, counted with Cedex XS (Roche) cell counter, and re-seeded at col-ony forming density (500 cells per well) into four pieces of a 60 � 15 mm petridishes. Colonies were allowed to grow for 7 days, fixed with 100% methanol, stainedwith crystal violet, and counted. Experiments were repeated for three times.
2.7. Cytokinesis-block micronucleus test
Cytokinesis-block micronucleus test was used to detect chromosomal damagesoccurred due aneugenic or clastogenic effects (Fenech, 1993). BEAS-2B cells wereseeded in T25 tissue culture treated flasks at a density of 3 � 104 cells/flask andallowed to grow for 48 h. Cells were then treated with different concentrations(0.1, 0.2, 0.4, 0.8, 1.6 and 3.2 lg/ml) of Cu–Zn ANPs and H2O2 for 24 h. After treat-ment, cells were further cultured with cytochalasin-B for 24 h. Then, cells weretrypsinized centrifuged and resuspended in 0.075 M KCl, and incubated for 2 min.Cells were then fixed 2 times in freshly prepared methanol: glacial acetic acid(3:1). Afterwards, the cell solution was dropped onto pre-cleaned slides and thenucleus was stained by 5% giemsa for 10 min. Slides were investigated under lightmicroscope and the numbers of binucleated (BNC) cells with micronuclei (MNBNC)were recorded based on observation of 2.000 cells per treatment group.
Cytotoxicity was further evaluated by analysis of the nuclear division index(NDI) values. The numbers of cells with one to four nuclei were determined in1.000 cells. NDI was calculated using the following formula:NDI = (1 �M1 + 2 �M2 + 3 �M3 + 4 �M4)/1.000, where M1 through M4 repre-sent the number of cells with one to four nuclei.
2.8. Alkaline comet assay
Alkaline comet assay was used to detect single stranded DNA damage (Cavas,2010). BEAS-2B cells were seeded on T25 tissue culture treated flasks at a densityof 3 � 104 cells/flask and allowed to grow for 48 h. Cells were then treated with dif-ferent concentrations (0.1, 0.2, 0.4, 0.8, 1.6 and 3.2 lg/ml) of Cu–Zn ANPs and H2O2
for 24 h. After treatments with Cu–Zn ANPs, the alkaline comet assay was per-formed according to Singh et al. (1988), with some modification (Costa et al.,2008). BEAS-2B cells were harvested and embedded in 0.8% low melting agaroseon slides precoated with normal melting point agarose. Slides were then placedin precooled lysis solution (2.5 M NaCl, 0.1 M EDTA, 10 mM Tris base, pH 10) with1% Triton X for 1 h at 4 �C. Cells were then denatured in alkaline buffer (0.3 M NaCl,1 mM EDTA) for 30 min in the dark at room temperature (RT). Electrophoresis wasperformed at 25 V and 300 mA for 20 min. The slides were immersed in neutraliza-tion buffer (0.5 M Tris–HCl, pH 7.5) for 10 min followed by dehydration in 70% eth-anol. The slides were air dried and stained with ethidium bromide (EtBr). Slides andcomets were examined under Nikon epifluorescence microscope equipped with adigical camera (Kameram 21) using an image processing software (ArganitMikrosistem Comet Assay).
2.9. Immunofluorescence for c-H2AX foci formation
c-H2AX foci were used to identify the presence of Cu–Zn ANPs induced doublestrand DNA breaks (Leopardi et al., 2010) according to the method of Tanaka et al.(2009) with some modifications (Valdiglesias et al., 2011). The cells grown on 8 wellchamber slides were exposed to different concentrations (0.1, 0.2, 0.4, 0.8, 1.6 and3.2 lg/ml) of Cu–Zn ANPs for 24 h. The cells were then fixed in 4% paraformalde-
Ü. Kumbıçak et al. / Food and Chemical Toxicology 73 (2014) 105–112 107
hyde for 10 min, permeabilized with 0.2% Triton X-100 for 5 min and blocked with1% BSA for 1 h. Cells were then incubated with anti c-H2AX antibody at 4 �C over-night and incubated with a AlexaFluor 488-conjugated second antibody for 1 h.Nuclei were counter stained with DAPI. The slides were evaluated under a NikonFluorescence Microscope and c-H2AX foci were counted in 100 cells per treatment.
2.10. Measurement of intracellular ROS formation
The intracellular ROS was determined by using The OxiSelect™ IntracellularROS Assay Kit. Cells were grown in a 96-well cell culture plate and then pre-incu-bated with DCFH-DA, which was cell-permeable. ROS were determined in BEAS-2Bcells exposed to different concentrations (0.1, 0.2, 0.4, 0.8, 1.6, 3.2 and 6.4 lg/ml) ofCu–Zn ANPs for 3 h. After incubation, the cells were read on a standard fluorescenceplate reader. The ROS contents were determined by comparison with the predeter-mined DCF standard curve.
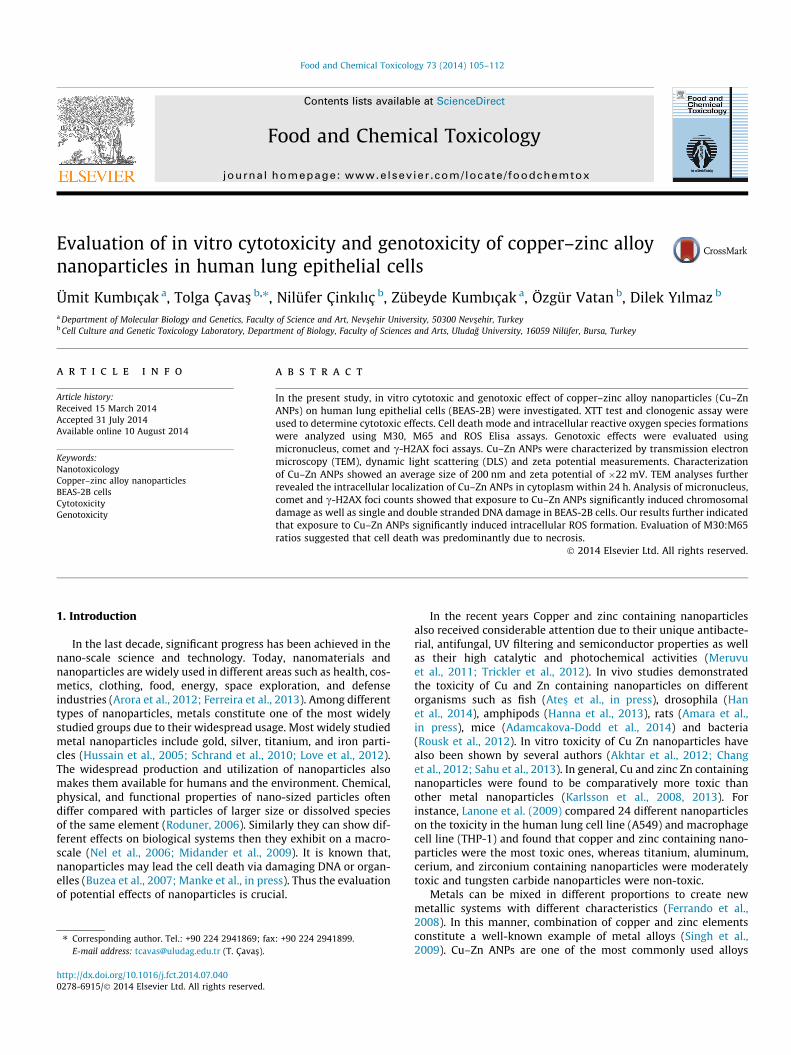
Fig. 1. TEM figures of Cu–Zn ANPs.
2.11. Apoptosis and necrosis
2.11.1. M30 assayApoptosis was assayed by measuring the level of caspase-cleaved keratin 18
(ccK18, M30) by a commercially available immunoassay kit (M30-Cytodeath ELISAkit, Peviva AB, Sweden) according to the manufacturer’s instructions. Cells wereseeded into a 96-well plate at a density of five thousand cells per well and incu-bated for 24 h. At the end of incubation, old medium was removed and cells werewashed with PBS and then fresh medium was added (200 ll/well). Cells wereexposed by Cu–Zn ANPs with varied concentrations (1.6, 3.2, 6.4 and 16.2 lg/ml)and positive control group (26.56 lM of Cis-platin) for 24 h. The plate was freezedto �20 �C for 6 h and thawed tat room temperature (RT) before the experiments.Then 10 ll 10% Triton-X was added into per well and shaked for 5 m at RT to allowlysis. Subsequently, 2 � 25 ll of the medium/lysate were transferred to the wells ofthe M30 CytoDeath Coated Microstrips and 75 ll of diluted M30 CytoDeath HRPconjugate was added. Plates were shaked 4 h at RT and washed with wash solutionfor five times. TMB Substrate was added and incubated for 20 m at RT in dark.Finally, 50 ll stop solution were added and absorbances were read at 450 nm.
2.11.2. M65 assayTotal ratio of cell death based on the measurement of soluble keratin 18
released from dying cells was evaluated using M65 ELISA kit (Peviva AB, Sweden).Cells were seeded into a 96-well plate at a density of five thousand cells per welland incubated for 24 h. At the end of incubation period, old medium was removedand cells were washed with PBS and fresh medium was added (200 ll/well). Cellswere exposed to Cu–Zn ANPs with varied concentrations (1.6, 3.2, 6.4 and12.8 lg/ml) and to 147 lM of H202 (positive control) for 24 h. After lysis,2 � 25 ll of the medium/lysate was transferred to the wells of the M65 ELISACoated Microstrips with 75 ll of diluted M65 ELISA HRP conjugate. Plates were sha-ked 2 h at room temperature and washed with wash solution for five times. TMBSubstrate was added and incubated for 20 m at RT in darkness. Finally, 50 ll stopsolution were added and absorbance were read at 450 nm.
2.12. Statistical analyses
All the data are represented as means ± SE of three identical experiments car-ried out in three replicate. Statistical analyses were performed using SPSS 15.0 soft-ware. Statistical significance was determined by one-way analysis of variance(ANOVA) followed by Dunnett’s multiple comparison tests. Significance wasascribed at P < 0.05. The associations between two variables were analyzed bySpearman’s correlation. Regression analyses were performed to determine thedose–response relationships.
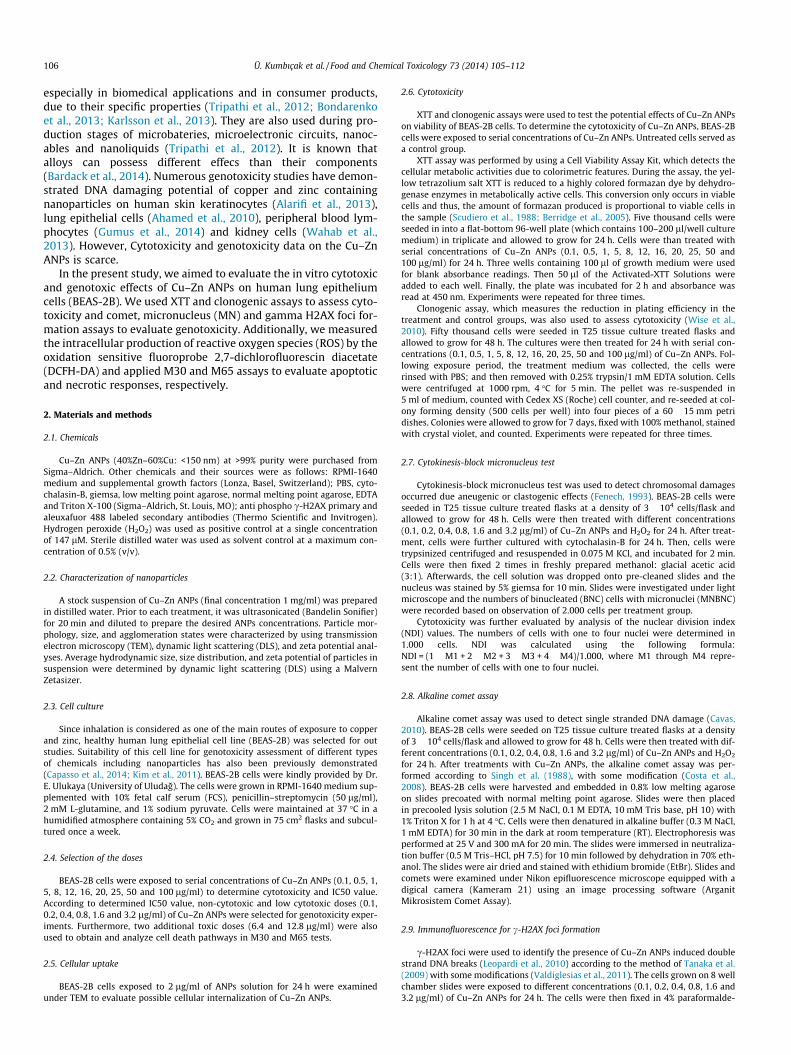
Fig. 2. TEM images showing intracellular localisation of Cu–Zn ANPs. The insertshows magnified view of the selected area.
3. Results
3.1. Nanoparticle characterization
Cu–Zn ANPs zeta potential value of the suspension was deter-mined as �22 mV indicating the stability of solution. This valuepositively shifted to �17 mV in RPMI-1640 medium. DynamicLight Spectrophotometer (DLS) and TEM analysis were showedthat the particle size was approximately 200 nm and 180 nm,respectively (Fig. 1). The observed size differences between TEMand DLS results could be due to hydratation spheres surroundingthe particles in aqueous DLS samples. After Incubation in RPMI-1640 medium an increase in the average size of Cu–Zn ANPs(250 nm) was observed, possibly due to aggregation.
3.2. Intracellular uptake
TEM image of a BEAS-2B cell exposed to Cu–Zn ANPs is shownin Fig. 2. TEM evaluation of BEAS-2B cells indicated that Cu–ZnANPs were taken up by cells and were mainly entrapped in cyto-plasm. Although the observed mean particle size determined byDLS is about 200 nm, the evaluation BEAS-2B cells under TEM, indi-cated that the presence of nanoparticles smaller then 100 nm.
3.3. Cellular viability
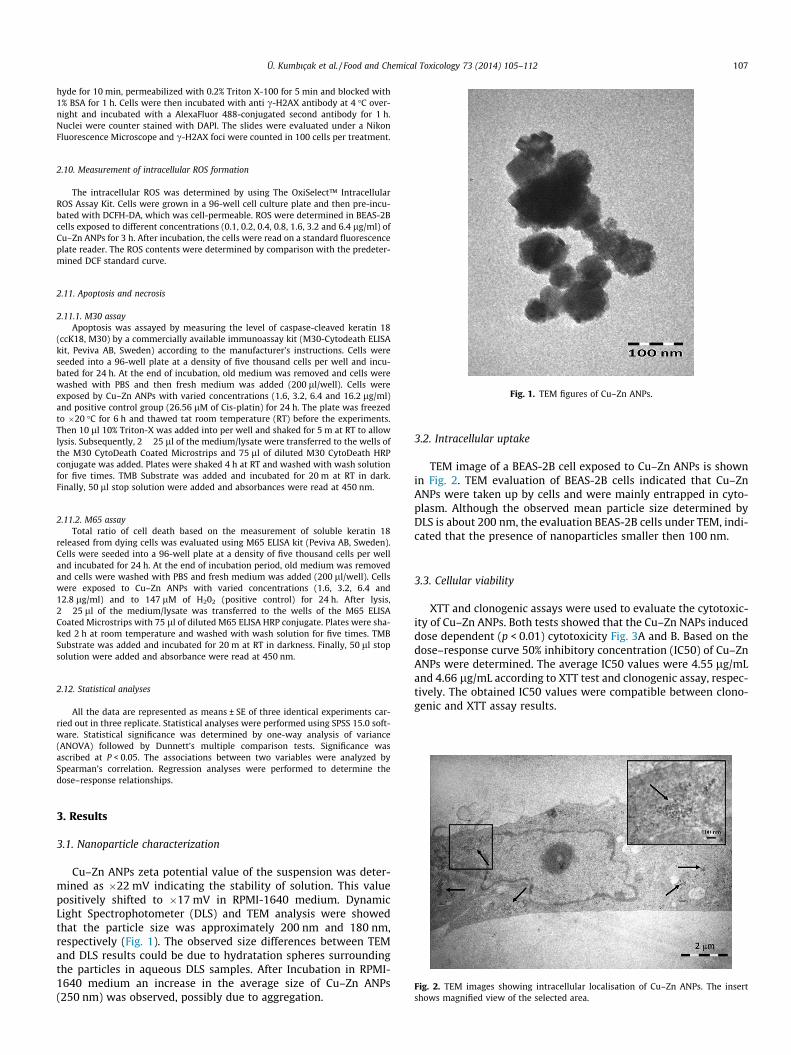
XTT and clonogenic assays were used to evaluate the cytotoxic-ity of Cu–Zn ANPs. Both tests showed that the Cu–Zn NAPs induceddose dependent (p < 0.01) cytotoxicity Fig. 3A and B. Based on thedose–response curve 50% inhibitory concentration (IC50) of Cu–ZnANPs were determined. The average IC50 values were 4.55 lg/mLand 4.66 lg/mL according to XTT test and clonogenic assay, respec-tively. The obtained IC50 values were compatible between clono-genic and XTT assay results.
0102030405060708090
100
0 0.1 1 4 5 8 10 12 16 20 25 50 100
Cel
l via
bilit
y (%
)
Cu-Zn ANPs concentration (μg/ml)
0102030405060708090
100
0 0.1 1 4 5 8 10 12 16 20 25 50 100
Cel
l Via
bilit
y (%
)
Cu-Zn ANPs concentration (μg/ml)
**
******
*** ******
*** ***
B
*** ******
***
***
*********
***
*
***
A
Fig. 3. Viability of BEAS-2B cells treated with Cu–Zn ANPs for 24 h. Results fromXTT assay (A) and clonogenic assay (B). Data represent the average of threeindependent clonogenic assay and XTT assay. Error bars = standard deviation of themean. Asterisk = significantly different from the control (*P < 0.05, **P < 0.01,***P < 0.001).
0
5
10
15
20
25
30
0 0.1 0.2 0.4 0.8 1.6 3.2
MN
BN
C F
requ
ency
(‰)
Cu-Zn ANPs concentration (μg/ml)
0
0.4
0.8
1.2
1.6
2
0 0.1 0.2 0.4 0.8 1.6 3.2
Nuc
lear
Div
isio
n In
dex
(ND
I)Cu-Zn ANPs concentration (μg/ml)
***
***
***
********
A
B
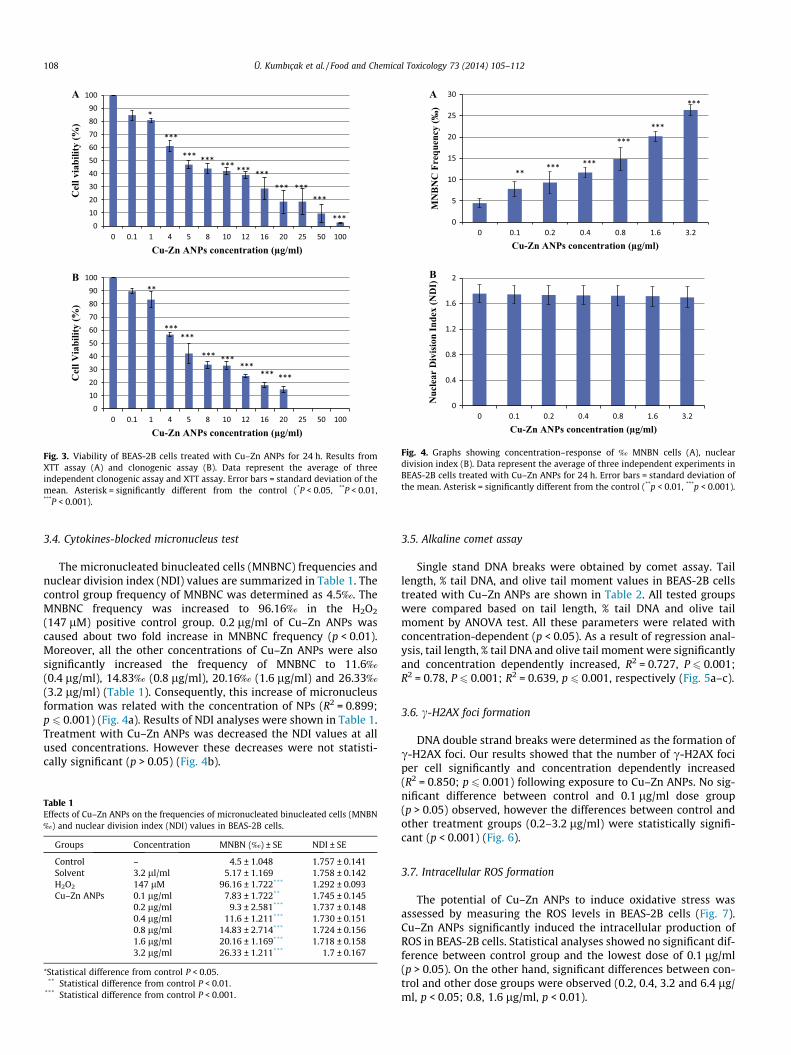
Fig. 4. Graphs showing concentration–response of ‰ MNBN cells (A), nucleardivision index (B). Data represent the average of three independent experiments inBEAS-2B cells treated with Cu–Zn ANPs for 24 h. Error bars = standard deviation ofthe mean. Asterisk = significantly different from the control (**p < 0.01, ***p < 0.001).
108 Ü. Kumbıçak et al. / Food and Chemical Toxicology 73 (2014) 105–112
3.4. Cytokines-blocked micronucleus test
The micronucleated binucleated cells (MNBNC) frequencies andnuclear division index (NDI) values are summarized in Table 1. Thecontrol group frequency of MNBNC was determined as 4.5‰. TheMNBNC frequency was increased to 96.16‰ in the H2O2
(147 lM) positive control group. 0.2 lg/ml of Cu–Zn ANPs wascaused about two fold increase in MNBNC frequency (p < 0.01).Moreover, all the other concentrations of Cu–Zn ANPs were alsosignificantly increased the frequency of MNBNC to 11.6‰
(0.4 lg/ml), 14.83‰ (0.8 lg/ml), 20.16‰ (1.6 lg/ml) and 26.33‰
(3.2 lg/ml) (Table 1). Consequently, this increase of micronucleusformation was related with the concentration of NPs (R2 = 0.899;p 6 0.001) (Fig. 4a). Results of NDI analyses were shown in Table 1.Treatment with Cu–Zn ANPs was decreased the NDI values at allused concentrations. However these decreases were not statisti-cally significant (p > 0.05) (Fig. 4b).
Table 1Effects of Cu–Zn ANPs on the frequencies of micronucleated binucleated cells (MNBN‰) and nuclear division index (NDI) values in BEAS-2B cells.
Groups Concentration MNBN (‰) ± SE NDI ± SE
Control – 4.5 ± 1.048 1.757 ± 0.141Solvent 3.2 ll/ml 5.17 ± 1.169 1.758 ± 0.142H2O2 147 lM 96.16 ± 1.722*** 1.292 ± 0.093Cu–Zn ANPs 0.1 lg/ml 7.83 ± 1.722** 1.745 ± 0.145
0.2 lg/ml 9.3 ± 2.581*** 1.737 ± 0.1480.4 lg/ml 11.6 ± 1.211*** 1.730 ± 0.1510.8 lg/ml 14.83 ± 2.714*** 1.724 ± 0.1561.6 lg/ml 20.16 ± 1.169*** 1.718 ± 0.1583.2 lg/ml 26.33 ± 1.211*** 1.7 ± 0.167
⁄Statistical difference from control P < 0.05.** Statistical difference from control P < 0.01.
*** Statistical difference from control P < 0.001.
3.5. Alkaline comet assay
Single stand DNA breaks were obtained by comet assay. Taillength, % tail DNA, and olive tail moment values in BEAS-2B cellstreated with Cu–Zn ANPs are shown in Table 2. All tested groupswere compared based on tail length, % tail DNA and olive tailmoment by ANOVA test. All these parameters were related withconcentration-dependent (p < 0.05). As a result of regression anal-ysis, tail length, % tail DNA and olive tail moment were significantlyand concentration dependently increased, R2 = 0.727, P 6 0.001;R2 = 0.78, P 6 0.001; R2 = 0.639, p 6 0.001, respectively (Fig. 5a–c).
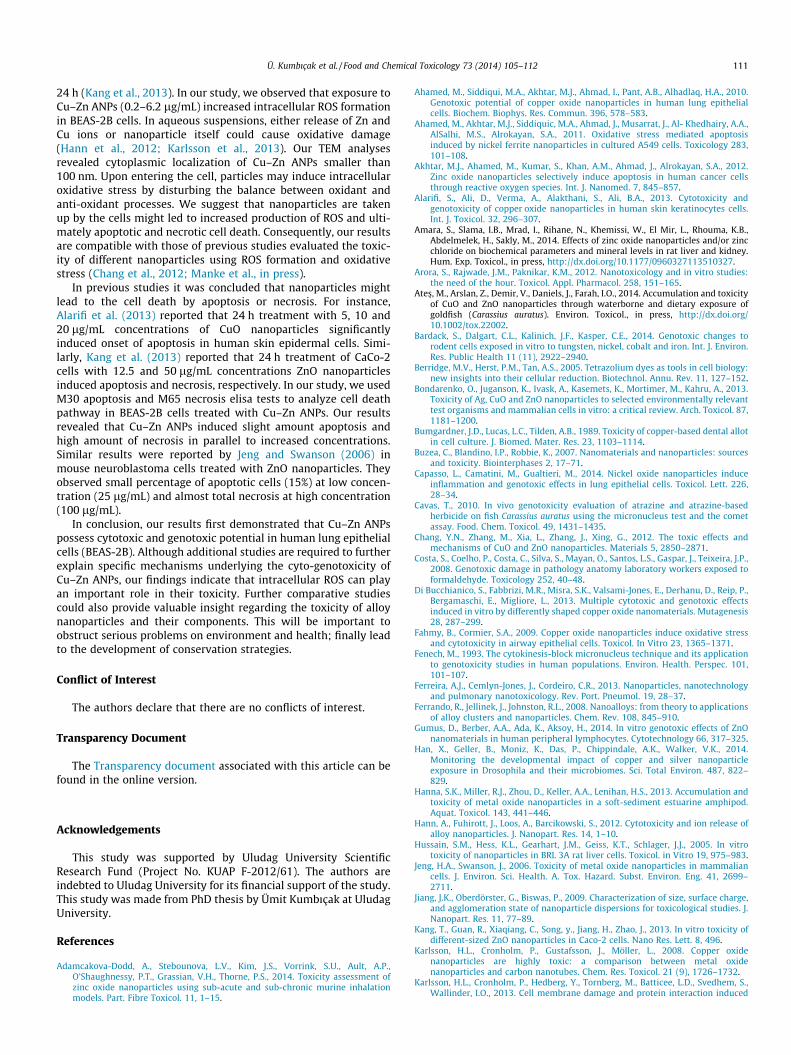
3.6. c-H2AX foci formation
DNA double strand breaks were determined as the formation ofc-H2AX foci. Our results showed that the number of c-H2AX fociper cell significantly and concentration dependently increased(R2 = 0.850; p 6 0.001) following exposure to Cu–Zn ANPs. No sig-nificant difference between control and 0.1 lg/ml dose group(p > 0.05) observed, however the differences between control andother treatment groups (0.2–3.2 lg/ml) were statistically signifi-cant (p < 0.001) (Fig. 6).
3.7. Intracellular ROS formation
The potential of Cu–Zn ANPs to induce oxidative stress wasassessed by measuring the ROS levels in BEAS-2B cells (Fig. 7).Cu–Zn ANPs significantly induced the intracellular production ofROS in BEAS-2B cells. Statistical analyses showed no significant dif-ference between control group and the lowest dose of 0.1 lg/ml(p > 0.05). On the other hand, significant differences between con-trol and other dose groups were observed (0.2, 0.4, 3.2 and 6.4 lg/ml, p < 0.05; 0.8, 1.6 lg/ml, p < 0.01).
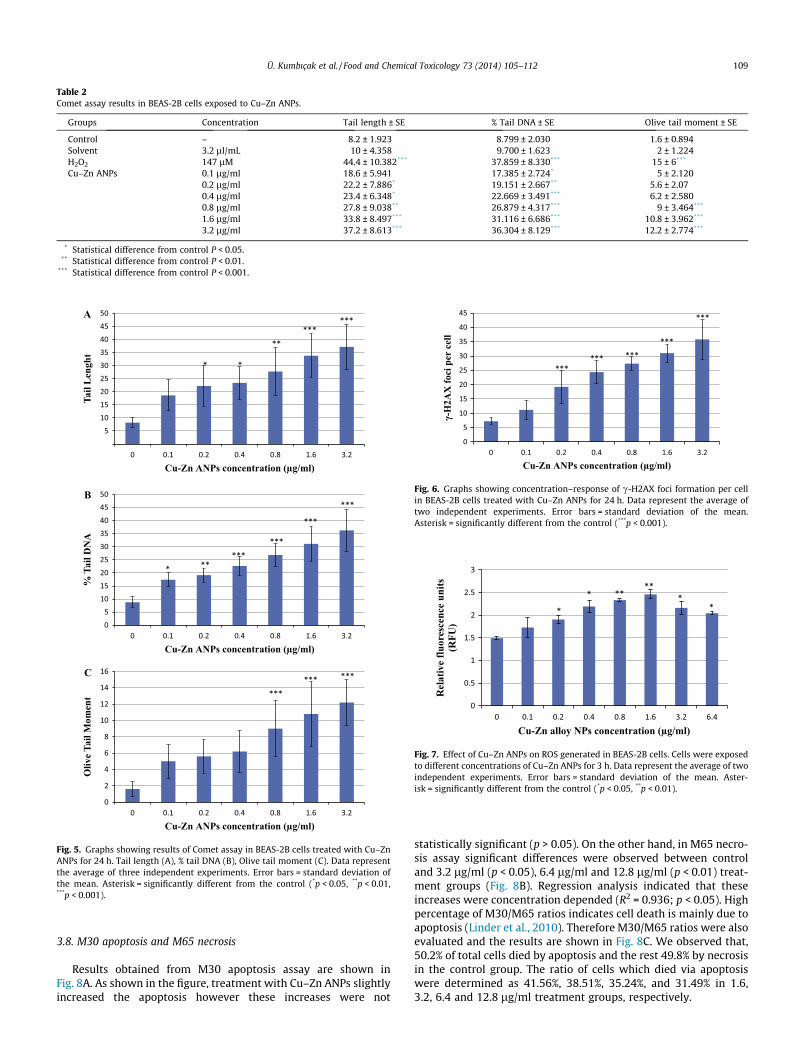
Table 2Comet assay results in BEAS-2B cells exposed to Cu–Zn ANPs.
Groups Concentration Tail length ± SE % Tail DNA ± SE Olive tail moment ± SE
Control – 8.2 ± 1.923 8.799 ± 2.030 1.6 ± 0.894Solvent 3.2 ll/mL 10 ± 4.358 9.700 ± 1.623 2 ± 1.224H2O2 147 lM 44.4 ± 10.382*** 37.859 ± 8.330*** 15 ± 6***
Cu–Zn ANPs 0.1 lg/ml 18.6 ± 5.941 17.385 ± 2.724* 5 ± 2.1200.2 lg/ml 22.2 ± 7.886* 19.151 ± 2.667** 5.6 ± 2.070.4 lg/ml 23.4 ± 6.348* 22.669 ± 3.491*** 6.2 ± 2.5800.8 lg/ml 27.8 ± 9.038** 26.879 ± 4.317*** 9 ± 3.464***
1.6 lg/ml 33.8 ± 8.497*** 31.116 ± 6.686*** 10.8 ± 3.962***
3.2 lg/ml 37.2 ± 8.613*** 36.304 ± 8.129*** 12.2 ± 2.774***
* Statistical difference from control P < 0.05.** Statistical difference from control P < 0.01.
*** Statistical difference from control P < 0.001.
5101520253035404550
0 0.1 0.2 0.4 0.8 1.6 3.2
Tail
Len
ght
Cu-Zn ANPs concentration (μg/ml)
05
101520253035404550
0 0.1 0.2 0.4 0.8 1.6 3.2
% T
ail D
NA
Cu-Zn ANPs concentration (μg/ml)
* *
*****
***
* *****
***
***
***B
A
0
2
4
6
8
10
12
14
16
0 0.1 0.2 0.4 0.8 1.6 3.2
Oliv
e Ta
il M
omen
t
Cu-Zn ANPs concentration (μg/ml)
*********
C
Fig. 5. Graphs showing results of Comet assay in BEAS-2B cells treated with Cu–ZnANPs for 24 h. Tail length (A), % tail DNA (B), Olive tail moment (C). Data representthe average of three independent experiments. Error bars = standard deviation ofthe mean. Asterisk = significantly different from the control (*p < 0.05, **p < 0.01,***p < 0.001).
0
5
10
15
20
25
30
35
40
45
0 0.1 0.2 0.4 0.8 1.6 3.2γ-
H2A
X fo
ci p
er c
ell
Cu-Zn ANPs concentration (μg/ml)
****** ***
***
***
Fig. 6. Graphs showing concentration–response of c-H2AX foci formation per cellin BEAS-2B cells treated with Cu–Zn ANPs for 24 h. Data represent the average oftwo independent experiments. Error bars = standard deviation of the mean.Asterisk = significantly different from the control (***p < 0.001).
0
0.5
1
1.5
2
2.5
3
0 0.1 0.2 0.4 0.8 1.6 3.2 6.4
Rel
ativ
e flu
ores
cenc
e un
its
(RFU
)
Cu-Zn alloy NPs concentration (μg/ml)
*
* **
****
Fig. 7. Effect of Cu–Zn ANPs on ROS generated in BEAS-2B cells. Cells were exposedto different concentrations of Cu–Zn ANPs for 3 h. Data represent the average of twoindependent experiments. Error bars = standard deviation of the mean. Aster-isk = significantly different from the control (*p < 0.05, **p < 0.01).
Ü. Kumbıçak et al. / Food and Chemical Toxicology 73 (2014) 105–112 109
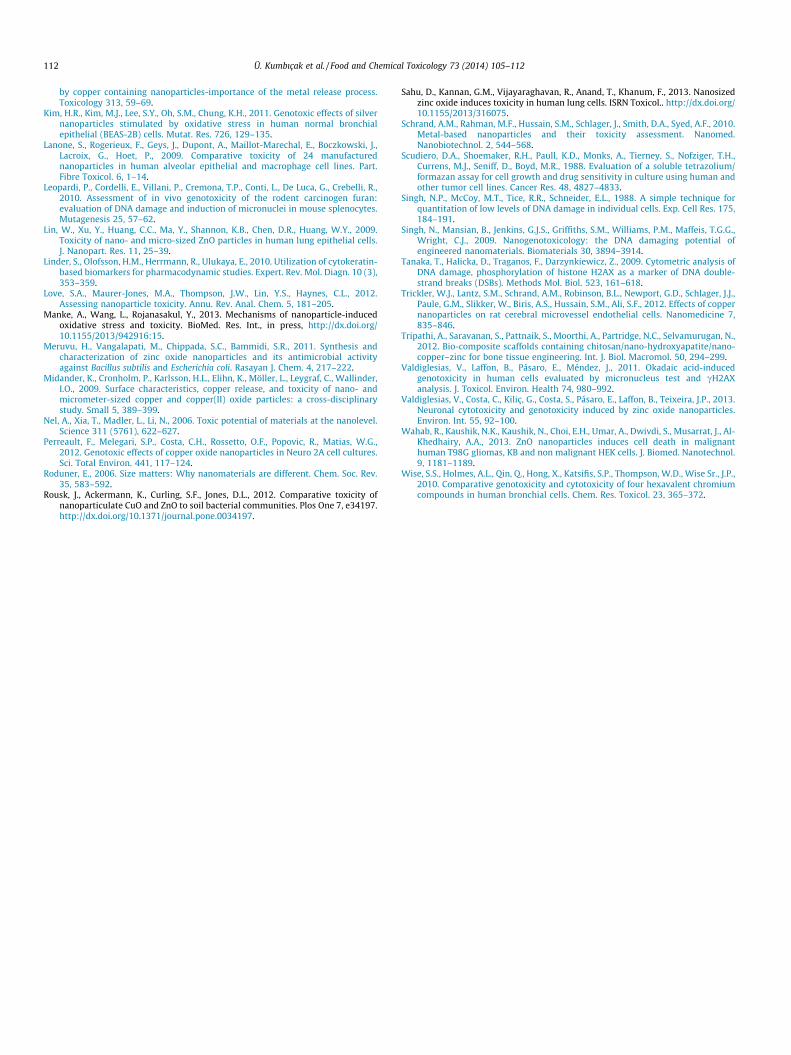
3.8. M30 apoptosis and M65 necrosis
Results obtained from M30 apoptosis assay are shown inFig. 8A. As shown in the figure, treatment with Cu–Zn ANPs slightlyincreased the apoptosis however these increases were not
statistically significant (p > 0.05). On the other hand, in M65 necro-sis assay significant differences were observed between controland 3.2 lg/ml (p < 0.05), 6.4 lg/ml and 12.8 lg/ml (p < 0.01) treat-ment groups (Fig. 8B). Regression analysis indicated that theseincreases were concentration depended (R2 = 0.936; p < 0.05). Highpercentage of M30/M65 ratios indicates cell death is mainly due toapoptosis (Linder et al., 2010). Therefore M30/M65 ratios were alsoevaluated and the results are shown in Fig. 8C. We observed that,50.2% of total cells died by apoptosis and the rest 49.8% by necrosisin the control group. The ratio of cells which died via apoptosiswere determined as 41.56%, 38.51%, 35.24%, and 31.49% in 1.6,3.2, 6.4 and 12.8 lg/ml treatment groups, respectively.

0
50
100
150
200
250
300
0 1.6 3.2 6.4 12.8
M30
(U/L
)
Cu-Zn ANPs concentration (μg/ml)
0
100
200
300
400
500
600
700
0 1.6 3.2 6.4 12.8
M65
(U/L
)
Cu-Zn ANPs concentration (μg/ml)
0
0.2
0.4
0.6
0.8
1
1.2
0 1.6 3.2 6.4 12.8
M30
/M65
Rat
io
Cu-Zn ANPs concentration (μg/ml)
****
*
A
B
C
Fig. 8. Graphs showing to Cu–Zn ANPs induced cell death modalities in BEAS-2Bcells treated with Cu–Zn ANPs for 24 h. (A) M30 test results, (B)M65 test results and(C) M30/M65 ratios. Data represent the average of three independent experiments.Error bars = standard error of the mean (N = 6). Asterisk = significantly differentfrom the control (*p < 0.05, **p < 0.01).
110 Ü. Kumbıçak et al. / Food and Chemical Toxicology 73 (2014) 105–112
4. Discussion
The present study provides an evidence for the cytotoxic andgenotoxic effects of Cu–Zn ANPs on BEAS-2B cells. To our knowl-edge, this is the first study dealing with the in vitro genotoxicityCu–Zn ANPs. Today, it is not exactly known which features ofnanoparticles can influence their toxicity; thus the proper charac-terization of nanoparticles is necessary prior to their toxicity eval-uation (Jiang et al., 2009). Therefore, the first step of our studyinvolved the characterization of Cu–Zn ANPs on the basis of shape,size, and stability via TEM, zeta potential and DLS analyses. Ourmeasurements showed that the shape and average size of Cu–ZnANPs were spherical and 200 nm. Moreover, zeta potential analysisrevealed that Cu–Zn ANPs were stable.
Previous studies indicated that metal nanoparticles couldinduce cytotoxicity. For example, Karlsson et al. (2008) comparedthe toxicity of different metal oxide particles such as CuO, ZnO,TiO2, CuZnFe2O4, Fe3O4 and Fe2O3 using trypan blue staining andreported that CuO nanoparticles were the most potent regardingcytotoxicity. Furthermore, toxicity evaluation SiO2, Fe2O3 andCuO nanoparticles on Hep-g2 cells revealed that CuO was the most
toxic (Fahmy and Cormier, 2009). Moreover, Ahamed et al. (2010)showed the cytotoxic effects of CuO nanoparticles in lung epithe-lial cells using MTT, NRU and LDH assays. ZnO nanoparticles werealso previously reported to induce cytotoxicity in different celllines such as Caco-2 (Chang et al., 2012), L-132 (Sahu et al.,2013), SHSY5Y (Valdiglesias et al., 2013), as well as HEpG2, A549and BEAS-2B cells (Akhtar et al., 2012). In addition to the effectsof single nanoparticles, Karlsson et al. (2013) comparatively stud-ied the toxicity of Cu, CuO and Cu–Zn particles using trypan bluestaining and reported that treatment with Cu and Cu–Zn particlesat a concentration of 20 lg/mL induced membrane damage onA549 cells, in 4 h, whereas CuO was not toxic.
In our study, we used the XTT and clonogenic assays to investi-gate the mitochondrial activity and plating efficiency of cells asindicators of cytotoxicity. We observed that treatment with Cu–Zn ANPs significantly decreased the viability of BEAS-2B cells.The previously reported 24 h IC50 values for Cu nanoparticles were9.9 lg/mL for RAW 264.7 cells and 12.10 lg/mL for human periph-eric lymphocytes (Di Bucchianico et al., 2013) as well as 6.46 lg/mL for A549 cells (Lanone et al., 2009). Similar results werereported for Zn nanoparticles as 13.6 lg/mL for A549 cells (Linet al., 2009) and 15.55 lg/mL for CaCo-2 cells (Kang et al., 2013).Our experiments on BEAS-2B cells revealed IC50 values of 4.5and 4.66 lg/mL in XTT test and clonogenic assay, respectively.Our findings are in agreement with those of previous studies,reported reduced cellular viability following exposure to metalnanoparticles.
Copper and zinc containing nanoparticles have also been shownto induce genotoxic damage in different cell lines. Perreault et al.(2012) studied the genotoxic effects of CuO nanoparticles usingmicronucleus test and reported that treatment with 12.5 lg/mLCuO NP for 24 h significantly increased the micronucleus frequen-cies in mouse Neuro-2A cells. Similar results were also observed inRAW 264.7 cells and peripheral blood lymphocytes exposed to CuOnanoparticles at concentrations of 0.1–10 lg/mL (Di Bucchianicoet al., 2013). Furthermore, Valdiglesias et al. (2013) showed theinduction of genotoxic damage in human SHSY5Y neuronal cells,exposed to ZnO nanoparticles at concentrations of 20–30 lg/mLfor 6 h, using the micronucleus and gH2AX foci assays.
In the present study, we investigated the genotoxic effects ofCu–Zn ANPs (0.1–3.2 lg/mL) on BEAS-2B lung epithelial cells theusing micronucleus, comet and H2AX assay test systems. Weobserved significant increases in the frequencies of micronucleatedcells following exposure to Cu–Zn ANPs. Our comet assay resultsfurther indicated that Cu–Zn ANPs were able to induce singlestranded DNA damage, as demonstrated by dose dependentincrease in tail length, % DNA tail and olive tail moment values.An additive method, which was convenient to determine DNAdamaging effects, is the evaluation of c-H2AX foci formations. Inthis study, we evaluated the average number of c-H2AX foci percell and found significant dose dependent increases followingexposure to Cu–Zn ANPs. Overall, our genotoxicity findings are inagreement with those of previous reports. Considering the previ-ously reported IC50 values and the tested concentrations men-tioned above, it is possible to suggest that Cu–Zn ANPs are moretoxic than its single components. However, these findings mightalso be due to different responses shown by different cell typesor even the media used (Bumgardner et al., 1989).
Results of previous studies suggested that excessive productionof ROS and oxidative stress could be one of the possible mecha-nisms of nanoparticle toxicity (Ahamed et al., 2011; Akhtar et al.,2012). For instance, exposure to CuO nanoparticles, at concentra-tions ranging form 10 to 50 lg/mL for 24 h, was shown to induceoxidative stress in A549 human lung cells (Ahamed et al., 2010).Similar results were obtained in CaCo-2 cells treated with 6.2,12.5, 25 and 100 lg/mL concentrations of ZnO nanoparticles for
Ü. Kumbıçak et al. / Food and Chemical Toxicology 73 (2014) 105–112 111
24 h (Kang et al., 2013). In our study, we observed that exposure toCu–Zn ANPs (0.2–6.2 lg/mL) increased intracellular ROS formationin BEAS-2B cells. In aqueous suspensions, either release of Zn andCu ions or nanoparticle itself could cause oxidative damage(Hann et al., 2012; Karlsson et al., 2013). Our TEM analysesrevealed cytoplasmic localization of Cu–Zn ANPs smaller than100 nm. Upon entering the cell, particles may induce intracellularoxidative stress by disturbing the balance between oxidant andanti-oxidant processes. We suggest that nanoparticles are takenup by the cells might led to increased production of ROS and ulti-mately apoptotic and necrotic cell death. Consequently, our resultsare compatible with those of previous studies evaluated the toxic-ity of different nanoparticles using ROS formation and oxidativestress (Chang et al., 2012; Manke et al., in press).
In previous studies it was concluded that nanoparticles mightlead to the cell death by apoptosis or necrosis. For instance,Alarifi et al. (2013) reported that 24 h treatment with 5, 10 and20 lg/mL concentrations of CuO nanoparticles significantlyinduced onset of apoptosis in human skin epidermal cells. Simi-larly, Kang et al. (2013) reported that 24 h treatment of CaCo-2cells with 12.5 and 50 lg/mL concentrations ZnO nanoparticlesinduced apoptosis and necrosis, respectively. In our study, we usedM30 apoptosis and M65 necrosis elisa tests to analyze cell deathpathway in BEAS-2B cells treated with Cu–Zn ANPs. Our resultsrevealed that Cu–Zn ANPs induced slight amount apoptosis andhigh amount of necrosis in parallel to increased concentrations.Similar results were reported by Jeng and Swanson (2006) inmouse neuroblastoma cells treated with ZnO nanoparticles. Theyobserved small percentage of apoptotic cells (15%) at low concen-tration (25 lg/mL) and almost total necrosis at high concentration(100 lg/mL).
In conclusion, our results first demonstrated that Cu–Zn ANPspossess cytotoxic and genotoxic potential in human lung epithelialcells (BEAS-2B). Although additional studies are required to furtherexplain specific mechanisms underlying the cyto-genotoxicity ofCu–Zn ANPs, our findings indicate that intracellular ROS can playan important role in their toxicity. Further comparative studiescould also provide valuable insight regarding the toxicity of alloynanoparticles and their components. This will be important toobstruct serious problems on environment and health; finally leadto the development of conservation strategies.
Conflict of Interest
The authors declare that there are no conflicts of interest.
Transparency Document
The Transparency document associated with this article can befound in the online version.
Acknowledgements
This study was supported by Uludag University ScientificResearch Fund (Project No. KUAP F-2012/61). The authors areindebted to Uludag University for its financial support of the study.This study was made from PhD thesis by Ümit Kumbıçak at UludagUniversity.
References
Adamcakova-Dodd, A., Stebounova, L.V., Kim, J.S., Vorrink, S.U., Ault, A.P.,O’Shaughnessy, P.T., Grassian, V.H., Thorne, P.S., 2014. Toxicity assessment ofzinc oxide nanoparticles using sub-acute and sub-chronic murine inhalationmodels. Part. Fibre Toxicol. 11, 1–15.
Ahamed, M., Siddiqui, M.A., Akhtar, M.J., Ahmad, I., Pant, A.B., Alhadlaq, H.A., 2010.Genotoxic potential of copper oxide nanoparticles in human lung epithelialcells. Biochem. Biophys. Res. Commun. 396, 578–583.
Ahamed, M., Akhtar, M.J., Siddiquic, M.A., Ahmad, J., Musarrat, J., Al- Khedhairy, A.A.,AlSalhi, M.S., Alrokayan, S.A., 2011. Oxidative stress mediated apoptosisinduced by nickel ferrite nanoparticles in cultured A549 cells. Toxicology 283,101–108.
Akhtar, M.J., Ahamed, M., Kumar, S., Khan, A.M., Ahmad, J., Alrokayan, S.A., 2012.Zinc oxide nanoparticles selectively induce apoptosis in human cancer cellsthrough reactive oxygen species. Int. J. Nanomed. 7, 845–857.
Alarifi, S., Ali, D., Verma, A., Alakthani, S., Ali, B.A., 2013. Cytotoxicity andgenotoxicity of copper oxide nanoparticles in human skin keratinocytes cells.Int. J. Toxicol. 32, 296–307.
Amara, S., Slama, I.B., Mrad, I., Rihane, N., Khemissi, W., El Mir, L., Rhouma, K.B.,Abdelmelek, H., Sakly, M., 2014. Effects of zinc oxide nanoparticles and/or zincchloride on biochemical parameters and mineral levels in rat liver and kidney.Hum. Exp. Toxicol., in press, http://dx.doi.org/10.1177/0960327113510327.
Arora, S., Rajwade, J.M., Paknikar, K.M., 2012. Nanotoxicology and in vitro studies:the need of the hour. Toxicol. Appl. Pharmacol. 258, 151–165.
Ates�, M., Arslan, Z., Demir, V., Daniels, J., Farah, I.O., 2014. Accumulation and toxicityof CuO and ZnO nanoparticles through waterborne and dietary exposure ofgoldfish (Carassius auratus). Environ. Toxicol., in press, http://dx.doi.org/10.1002/tox.22002.
Bardack, S., Dalgart, C.L., Kalinich, J.F., Kasper, C.E., 2014. Genotoxic changes torodent cells exposed in vitro to tungsten, nickel, cobalt and iron. Int. J. Environ.Res. Public Health 11 (11), 2922–2940.
Berridge, M.V., Herst, P.M., Tan, A.S., 2005. Tetrazolium dyes as tools in cell biology:new insights into their cellular reduction. Biotechnol. Annu. Rev. 11, 127–152.
Bondarenko, O., Juganson, K., Ivask, A., Kasemets, K., Mortimer, M., Kahru, A., 2013.Toxicity of Ag, CuO and ZnO nanoparticles to selected environmentally relevanttest organisms and mammalian cells in vitro: a critical review. Arch. Toxicol. 87,1181–1200.
Bumgardner, J.D., Lucas, L.C., Tilden, A.B., 1989. Toxicity of copper-based dental allotin cell culture. J. Biomed. Mater. Res. 23, 1103–1114.
Buzea, C., Blandino, I.P., Robbie, K., 2007. Nanomaterials and nanoparticles: sourcesand toxicity. Biointerphases 2, 17–71.
Capasso, L., Camatini, M., Gualtieri, M., 2014. Nickel oxide nanoparticles induceinflammation and genotoxic effects in lung epithelial cells. Toxicol. Lett. 226,28–34.
Cavas, T., 2010. In vivo genotoxicity evaluation of atrazine and atrazine-basedherbicide on fish Carassius auratus using the micronucleus test and the cometassay. Food. Chem. Toxicol. 49, 1431–1435.
Chang, Y.N., Zhang, M., Xia, L., Zhang, J., Xing, G., 2012. The toxic effects andmechanisms of CuO and ZnO nanoparticles. Materials 5, 2850–2871.
Costa, S., Coelho, P., Costa, C., Silva, S., Mayan, O., Santos, L.S., Gaspar, J., Teixeira, J.P.,2008. Genotoxic damage in pathology anatomy laboratory workers exposed toformaldehyde. Toxicology 252, 40–48.
Di Bucchianico, S., Fabbrizi, M.R., Misra, S.K., Valsami-Jones, E., Derhanu, D., Reip, P.,Bergamaschi, E., Migliore, L., 2013. Multiple cytotoxic and genotoxic effectsinduced in vitro by differently shaped copper oxide nanomaterials. Mutagenesis28, 287–299.
Fahmy, B., Cormier, S.A., 2009. Copper oxide nanoparticles induce oxidative stressand cytotoxicity in airway epithelial cells. Toxicol. In Vitro 23, 1365–1371.
Fenech, M., 1993. The cytokinesis-block micronucleus technique and its applicationto genotoxicity studies in human populations. Environ. Health. Perspec. 101,101–107.
Ferreira, A.J., Cemlyn-Jones, J., Cordeiro, C.R., 2013. Nanoparticles, nanotechnologyand pulmonary nanotoxicology. Rev. Port. Pneumol. 19, 28–37.
Ferrando, R., Jellinek, J., Johnston, R.L., 2008. Nanoalloys: from theory to applicationsof alloy clusters and nanoparticles. Chem. Rev. 108, 845–910.
Gumus, D., Berber, A.A., Ada, K., Aksoy, H., 2014. In vitro genotoxic effects of ZnOnanomaterials in human peripheral lymphocytes. Cytotechnology 66, 317–325.
Han, X., Geller, B., Moniz, K., Das, P., Chippindale, A.K., Walker, V.K., 2014.Monitoring the developmental impact of copper and silver nanoparticleexposure in Drosophila and their microbiomes. Sci. Total Environ. 487, 822–829.
Hanna, S.K., Miller, R.J., Zhou, D., Keller, A.A., Lenihan, H.S., 2013. Accumulation andtoxicity of metal oxide nanoparticles in a soft-sediment estuarine amphipod.Aquat. Toxicol. 143, 441–446.
Hann, A., Fuhirott, J., Loos, A., Barcikowski, S., 2012. Cytotoxicity and ion release ofalloy nanoparticles. J. Nanopart. Res. 14, 1–10.
Hussain, S.M., Hess, K.L., Gearhart, J.M., Geiss, K.T., Schlager, J.J., 2005. In vitrotoxicity of nanoparticles in BRL 3A rat liver cells. Toxicol. in Vitro 19, 975–983.
Jeng, H.A., Swanson, J., 2006. Toxicity of metal oxide nanoparticles in mammaliancells. J. Environ. Sci. Health. A. Tox. Hazard. Subst. Environ. Eng. 41, 2699–2711.
Jiang, J.K., Oberdörster, G., Biswas, P., 2009. Characterization of size, surface charge,and agglomeration state of nanoparticle dispersions for toxicological studies. J.Nanopart. Res. 11, 77–89.
Kang, T., Guan, R., Xiaqiang, C., Song, y., Jiang, H., Zhao, J., 2013. In vitro toxicity ofdifferent-sized ZnO nanoparticles in Caco-2 cells. Nano Res. Lett. 8, 496.
Karlsson, H.L., Cronholm, P., Gustafsson, J., Möller, L., 2008. Copper oxidenanoparticles are highly toxic: a comparison between metal oxidenanoparticles and carbon nanotubes. Chem. Res. Toxicol. 21 (9), 1726–1732.
Karlsson, H.L., Cronholm, P., Hedberg, Y., Tornberg, M., Batticee, L.D., Svedhem, S.,Wallinder, I.O., 2013. Cell membrane damage and protein interaction induced
112 Ü. Kumbıçak et al. / Food and Chemical Toxicology 73 (2014) 105–112
by copper containing nanoparticles-importance of the metal release process.Toxicology 313, 59–69.
Kim, H.R., Kim, M.J., Lee, S.Y., Oh, S.M., Chung, K.H., 2011. Genotoxic effects of silvernanoparticles stimulated by oxidative stress in human normal bronchialepithelial (BEAS-2B) cells. Mutat. Res. 726, 129–135.
Lanone, S., Rogerieux, F., Geys, J., Dupont, A., Maillot-Marechal, E., Boczkowski, J.,Lacroix, G., Hoet, P., 2009. Comparative toxicity of 24 manufacturednanoparticles in human alveolar epithelial and macrophage cell lines. Part.Fibre Toxicol. 6, 1–14.
Leopardi, P., Cordelli, E., Villani, P., Cremona, T.P., Conti, L., De Luca, G., Crebelli, R.,2010. Assessment of in vivo genotoxicity of the rodent carcinogen furan:evaluation of DNA damage and induction of micronuclei in mouse splenocytes.Mutagenesis 25, 57–62.
Lin, W., Xu, Y., Huang, C.C., Ma, Y., Shannon, K.B., Chen, D.R., Huang, W.Y., 2009.Toxicity of nano- and micro-sized ZnO particles in human lung epithelial cells.J. Nanopart. Res. 11, 25–39.
Linder, S., Olofsson, H.M., Herrmann, R., Ulukaya, E., 2010. Utilization of cytokeratin-based biomarkers for pharmacodynamic studies. Expert. Rev. Mol. Diagn. 10 (3),353–359.
Love, S.A., Maurer-Jones, M.A., Thompson, J.W., Lin, Y.S., Haynes, C.L., 2012.Assessing nanoparticle toxicity. Annu. Rev. Anal. Chem. 5, 181–205.
Manke, A., Wang, L., Rojanasakul, Y., 2013. Mechanisms of nanoparticle-inducedoxidative stress and toxicity. BioMed. Res. Int., in press, http://dx.doi.org/10.1155/2013/942916:15.
Meruvu, H., Vangalapati, M., Chippada, S.C., Bammidi, S.R., 2011. Synthesis andcharacterization of zinc oxide nanoparticles and its antimicrobial activityagainst Bacillus subtilis and Escherichia coli. Rasayan J. Chem. 4, 217–222.
Midander, K., Cronholm, P., Karlsson, H.L., Elihn, K., Möller, L., Leygraf, C., Wallinder,I.O., 2009. Surface characteristics, copper release, and toxicity of nano- andmicrometer-sized copper and copper(II) oxide particles: a cross-disciplinarystudy. Small 5, 389–399.
Nel, A., Xia, T., Madler, L., Li, N., 2006. Toxic potential of materials at the nanolevel.Science 311 (5761), 622–627.
Perreault, F., Melegari, S.P., Costa, C.H., Rossetto, O.F., Popovic, R., Matias, W.G.,2012. Genotoxic effects of copper oxide nanoparticles in Neuro 2A cell cultures.Sci. Total Environ. 441, 117–124.
Roduner, E., 2006. Size matters: Why nanomaterials are different. Chem. Soc. Rev.35, 583–592.
Rousk, J., Ackermann, K., Curling, S.F., Jones, D.L., 2012. Comparative toxicity ofnanoparticulate CuO and ZnO to soil bacterial communities. Plos One 7, e34197.http://dx.doi.org/10.1371/journal.pone.0034197.
Sahu, D., Kannan, G.M., Vijayaraghavan, R., Anand, T., Khanum, F., 2013. Nanosizedzinc oxide induces toxicity in human lung cells. ISRN Toxicol.. http://dx.doi.org/10.1155/2013/316075.
Schrand, A.M., Rahman, M.F., Hussain, S.M., Schlager, J., Smith, D.A., Syed, A.F., 2010.Metal-based nanoparticles and their toxicity assessment. Nanomed.Nanobiotechnol. 2, 544–568.
Scudiero, D.A., Shoemaker, R.H., Paull, K.D., Monks, A., Tierney, S., Nofziger, T.H.,Currens, M.J., Seniff, D., Boyd, M.R., 1988. Evaluation of a soluble tetrazolium/formazan assay for cell growth and drug sensitivity in culture using human andother tumor cell lines. Cancer Res. 48, 4827–4833.
Singh, N.P., McCoy, M.T., Tice, R.R., Schneider, E.L., 1988. A simple technique forquantitation of low levels of DNA damage in individual cells. Exp. Cell Res. 175,184–191.
Singh, N., Mansian, B., Jenkins, G.J.S., Griffiths, S.M., Williams, P.M., Maffeis, T.G.G.,Wright, C.J., 2009. Nanogenotoxicology: the DNA damaging potential ofengineered nanomaterials. Biomaterials 30, 3894–3914.
Tanaka, T., Halicka, D., Traganos, F., Darzynkiewicz, Z., 2009. Cytometric analysis ofDNA damage, phosphorylation of histone H2AX as a marker of DNA double-strand breaks (DSBs). Methods Mol. Biol. 523, 161–618.
Trickler, W.J., Lantz, S.M., Schrand, A.M., Robinson, B.L., Newport, G.D., Schlager, J.J.,Paule, G.M., Slikker, W., Biris, A.S., Hussain, S.M., Ali, S.F., 2012. Effects of coppernanoparticles on rat cerebral microvessel endothelial cells. Nanomedicine 7,835–846.
Tripathi, A., Saravanan, S., Pattnaik, S., Moorthi, A., Partridge, N.C., Selvamurugan, N.,2012. Bio-composite scaffolds containing chitosan/nano-hydroxyapatite/nano-copper–zinc for bone tissue engineering. Int. J. Biol. Macromol. 50, 294–299.
Valdiglesias, V., Laffon, B., Pásaro, E., Méndez, J., 2011. Okadaic acid-inducedgenotoxicity in human cells evaluated by micronucleus test and cH2AXanalysis. J. Toxicol. Environ. Health 74, 980–992.
Valdiglesias, V., Costa, C., Kiliç, G., Costa, S., Pásaro, E., Laffon, B., Teixeira, J.P., 2013.Neuronal cytotoxicity and genotoxicity induced by zinc oxide nanoparticles.Environ. Int. 55, 92–100.
Wahab, R., Kaushik, N.K., Kaushik, N., Choi, E.H., Umar, A., Dwivdi, S., Musarrat, J., Al-Khedhairy, A.A., 2013. ZnO nanoparticles induces cell death in malignanthuman T98G gliomas, KB and non malignant HEK cells. J. Biomed. Nanotechnol.9, 1181–1189.
Wise, S.S., Holmes, A.L., Qin, Q., Hong, X., Katsifis, S.P., Thompson, W.D., Wise Sr., J.P.,2010. Comparative genotoxicity and cytotoxicity of four hexavalent chromiumcompounds in human bronchial cells. Chem. Res. Toxicol. 23, 365–372.