evaluation of crystalline silicotitanate and self .../67531/metadc625115/m2/1/high... · evaluation...
TRANSCRIPT

* .
WSRC-RP-99-O0331
Evaluation of Crystalline Silicotitanate and Self-AssembledMonolayer on Mesoporous Support for Cesium and MercuryRemoval from DWPF Recycle
by
L. N. Oji
Westinghouse Savannah River Company
Savannah River SiteAiken, South Carolina 29808
DOE Contract No. DE-AC09-96SR18500
This paper was prepared in connection with work done under the above contract number with the U. S.Department of Energy. By acceptance of this paper, the publisher and/or recipient acknowledges the U.S.Government’s right to retain a nonexclusive, royalty-free license in and to any copyright covering this paper, alongwith the right to reproduce and to authorize others to reproduce all or part of the copyrighted paper.

WSRC-RP-99-O0331 Rev. O.
EVALUATION OF CRYSTALLINE SILICOTITANATE AND SELF-ASSEMBLED MONOLAYERS ON MESOPOROUS SUPPORT FORCESIUM AND MERCURY REMOVAL FROM DWPF RECYCLE.
Key Words: Radioactive cesium,Heavy metals, Wastewater
Retention Time: Permanent
Author: Lawrence N. Oji 773-43A
Report Date: September 22,1999
Westimzhouse Savannah River Com~anvSavannah River SiteAiken. SC 29808
SAVANNAH RIVER SITE
DISCLAIMER
w rqmt wasprepared as ~ account of work sponsored by an agency of theUnitedstatesGovernmentNeither the Umted States Gov-nt nor any agency thereof, nor any of theiremployees, makes any warranty, express or mpk4 or Wsumesc any Iegd Iiability orresponsibility for the accuraq, completeness: or usefidness ~ ~y reformation, apparam,
-Q or- *lo* qx~ts %1*= wo~d not~ge @fMy owned rights.Reference herexn to any specdlc .commercud proch~ proce~s, or s~ce by trade name,tradem& xqmfacturer, q othermse does not ==anly cons~tute or unply its endorsemen~nxxmmendimon, or favoring by the United Smt= Government or any agency thereof. Theviews and opinions of authors expressed hwein do not necessarily state or reflect those of theUnited States Government or any agency thereof.
This report has beenrepmduced directly from the best avakble copy.
Available to DOE and DOE contractors fium the Office of Scientific and Technical Information, ‘P.O. Box 62, Oak Ridge, TN 37831; @ices available fmm (615) 576-8401.
Available to the public tim the National Tedudcal Information Service, U.S. Department ofcQ~ 5285 Port Royal Roa& SPringfieu VA 22161.
-..

WSRC-RP-99-O0331 Rev. O.
Author: Lawrence N. Oji 773-43A
Report Date: September 22,1999
EVALUATION OF CRYSTALLINE SILICOTITANATE AND SELF-ASSEMBLED MONOLAYERS ON MESOPOROUS SUPPORT FORCESIUM AND MERCURY REMOVAL FROM DWPF RECYCLE.
Key Words: Radioactive cesium,Heavy metals, Wastewater
Westinghouse Savannah River Com~anySavannah River SiteAiken. SC 29808
Retention Time: Permanent

WSRC-RP-99-O0331Rev. OSeptember 22, 1999
REVIEWS AND APPROVALS
Author A
at,’ofe /94/57L
Lawrence Oji, Waste Proce~ing Technology Date
Design Check
/u-(g -y?* I
C. A. Langton, Waste ocessing Technology Date
r - J21$!!!’7eB.T. Butcher, Level 4 Manager, Waste Processing Technology
pL ep~M. C. Thompson, &
---J’$@;atemica] Hydrogen Technology Slsction
ii

WSRC-RP-99-O0331 Rev. OSeptember 22, 1999
...111
TABLE OF CONTENTS1. S~MARY ............................................................................................................................................ 12. ~TRODUCTION .................................................................................................................................. 23. EXPERIM13NTAL APPRO.ACH ........................................................................................................... 3
3.1 Ion-Exchange Materials .................................................................................................................. 33.2 DWPFSimulants ............................................................................................................................ 33.3 Method .......................................................................................................................................... 11
4. RESULTS AND DISCUSSl[ON........................................................................................................... 114.1 Cesium Uptake with CST in an Inorganic DWPF Simulant ......................................................... 114.2 Cesium Uptake with CST in Organic and Inorganic DWPF Simulants ........................................ 124.3 SRS Tank 22 Measurelnents ......................................................................................................... 134.4 Variation of Batch Distribution Coefficient With Cesium Concentration .................................... 134.5 Variation of Batch Distribution Coefficient With Ionic Strength. ................................................ 154.6 Experiments With Cesium-137 Spiked Tank-22 Simulant ........................................................... 164.7 Mercury Removal From DWPF Simulant .................................................................................... 174.8 Mercury Removal From Tank 22 Sample With GT.73.Resin ...................................................... 18
5. CONCLUSIONS .................................................................................................................................. 196. QUALITY ASSUMCE .................................................................................................................... 207. REFERENCES ..................................................................................................................................... 21
LIST OF FIGURESFigure 1. Variation of & With Initial Cesium Concentration. ..................................................................... 14Figure 2. Linear Response of & with Cesium Decontamination Factor. .................................................... 15Figure 3. Variation of & with Ionic Strength .............................................................................................. 16Figure 4. Estimated& Variation Profile with pH for Mercury Removal with SAMMS. ........................... 19Figure 5 Variation of Kd with pH for Mercury Removal with Duolite GT-73 ............................................ 19
LIST OF TABLESTable 1 Summary of Test Cases. .................................................................................................................... 4Table 2. Simulant Inorganic Composition Used for Cesium Uptake with CST. ............................................ 4Table 3. DWPF Simulants: High Inorganic/Sodium Compositions. .............................................................. 6Table 4. DWPF Simulants: High Organic/ Sodium Compositions ................................................................ 7Table 5. DWPF Simulants: Average Organic Compositions ......................................................................... 8Table 6. DWPF Simulants: Average Inorganic Compositions ...................................................................... 9Table 7. Organic and Inorganic Components for Tank 22 H Simulant Solution. ........................................ 10Table 8. &values for cesium uptake with CST ( 5.6 M Na+)..................................................................... 12Table 9. & Variation with Initial Cesium Concentration ............................................................................ 13Table 10. & variation with decontamination factor. .................................................................................... 15Table 11. & Variation with Ionic Strength. ................................................................................................ 15Table 12. Data Summary for Tank-22 Simulants Spiked with Cesium.137 ................................................ 17Table 13. Kd VaIues for SAMMS and Duolite GT-73 Resin for Mercury Removal .................................. 18Table 14. & Values for SAMMS and Duolite GT-73 Resin for Mercury Removal from Tank-22 Simulant.
...................................................................................................................................... ............... ......... 18
WSRC-RP-99-O0331 Rev. OSeptember 21, 1999
Page 1 of 21
WESTINGHOUSESAVANNAHRIVERCOMPANYSAVANNAHRIVERTECHNC)LOGYCENTER
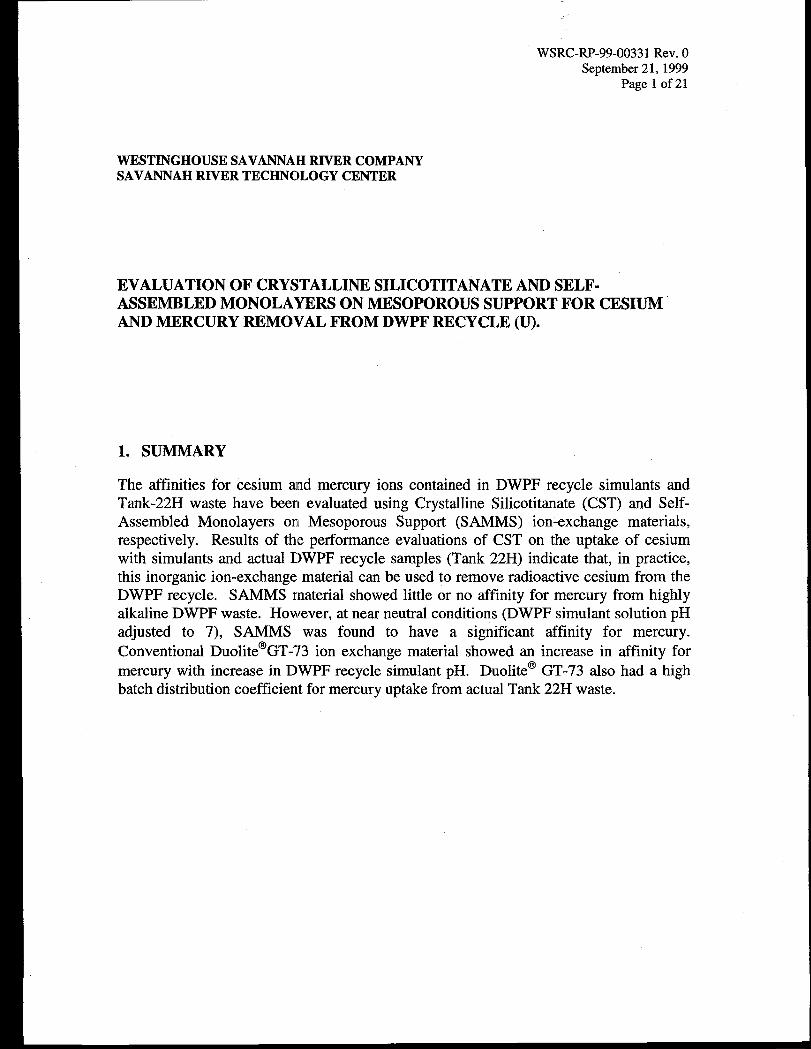
EVALUATION OF CRYSTALLINE SILICOTITANATE AND SELF-ASSEMBLED MONOLAYERS ON MESOPOROUS SUPPORT FOR CESIUMAND MERCURY REMOVAL FROM DWPF RECYCLE (U).
1. SUMMARY
The affinities for cesium and mercury ions contained in DWPF recycle simulants andTank-22H waste have been evaluated using Crystalline Silicotitanate (CST) and Self-Assembled Monolayers on Mesoporous Support (SAMMS) ion-exchange materials,respectively. Results of the performance evaluations of CST on the uptake of cesiumwith simulants and actual DWPF recycle samples (Tank 22H) indicate that, in practice,this inorganic ion-exchange material can be used to remove radioactive cesium from theDWPF recycle. SAMMS material showed little or no affinity for mercury from highlyalkaline DWPF waste. However, at near neutral conditions (DWPF simulant solution pHadjusted to 7), SAMMS was found to have a significant affinity for mercury.
Conventional Duolite@GT-73 ion exchange material showed an increase in affinity formercury with increase in DWPF recycle simulant pH. Duolite@ GT-73 also had a highbatch distribution coefficient for mercury uptake from actual Tank 22H waste.

WSRC-RP-99-00331 Rev. OSeptember 22, 1999
Page 2 of 21
2. INTRODUCTION
High-Level Waste (HLW) is pretreated and vitrified in the Defense Waste ProcessingFacility (DWPF) at the Savannah River Site (SRS). The DWPF process generates a largevolume of aqueous waste known as DWPF recycle, which is returned to the HLW tanksystem for storage and evaporation.
The DWPF recycle stream is an aqueous waste stream, which is returned to the TankFarms through tank 43H and the 2H-evaporator sy$tem. The stream is comprised ofnumerous streams from within DWPF. Waste from the Slurry Mix EvaporatorCondensate Tank (SMECT), Off-Gas Condensate Tank (OGCT), and smaller amounts ofdilution waters and DWPF laboratory waste are sent to the Recycle Collection Tank(RCT). Batches of this waste are collected in the RCT and then caustic adjusted(inhibition process for corrosion control) before transfer to tank 43H. Waste collected inthe RCT may alternate between SMECT and OGCT, that is, one batch may be primarilySMECT while the next batch is OGCT waste. The SMECT waste stream is the mainsource of organic compounds in the RCT, although sc)me small quantities of organics arealso introduced from the DWPF laboratories.
Cesium-137, strontium-90, mercury and traces of transuranic elements are the primaryconstituents of concern in the DWPF recycle waste. The proposed path is to use ion-exchange technology to decontaminate the DWPF recycle waste stream and send thedecontaminated aqueous stream through the general purpose evaporator to the EffluentTreatment Facility (ETF). This approach would eliminate the current practice of sendingthe DWPF recycle to the HLW tank farm relieving HLW of storage capacity problems.The continuous operation of DWPF would be ensured and the long-term storageproblems for the Tank Farms would be alleviated.
The Efficient Separation Program (ESP) funded this investigation with the followingprincipal goals:
● Qualify Crystalline Silicotitanate (CST) ion-exchange material for the removal ofradioactive cesium and, possibly, transuranic elements from the DWPF recycle wastestream,
. Evaluate Sodium Titanate (ST) affinity for the uptake of strontium-90 from theDWPF waste stream and the effect of ST particle size on the cross-flow filtrationprocess (currently not part of objective because of limited funding resources), and
. Evaluate and compare the affinity for mercury in the DWPF recycle waste by otherion-exchange materials like the Self-Assembled hfonolayers on Mesoporous Support(SAMMS) material and standard Duolite GT-73 resin.

WSRC-RP-99-O0331 Rev. OSeptember 22, 1999
Page 3 of 21
\
3. EXPERIMENTAL APPROACH
The purpose of this study was to examine the feasibility of using CST for cesium removalfrom DWPF recycle, and to compare two ion-exchange materials, Duolite GT-73 andSAMMS, for chemisorption of mercury. Important variables in assessing the viability ofthese materials under conditions found at DWPF are pH, initial cesium concentration,or~nic concentration, and sodium concentration. Cesium and mercury uptake behaviorunder the expected range of conditions was conducted for these materials using varioussimulants for the DWPF recycle stream.
3.1 Ion-Exchange MaterialsAn engineered granular form of CST ion exchange material from UOP*, known as
Ionsive@ IE-9 11, (lot # 9990968 10002), was used in this study (l). Dr. Feng of Pacific
Northwest National Laboratory (PNNL) provided the SAMMS material and the Duolite@GT-73, sodium form, was obtained locally on site. Sodium Titanate slurry was obtainedfrom Allied Signal (Allied Signal Research and Technology, 50 East Algonquin Road,Des Plaines, IL 60017-501 6).
3.2 DWPF SimulantsDWPF simulants were selected to represent the expected range of constituents andconditions based on consultation with HLW Engineering. As the project proceeded focusof the work shifted to Tank 22 which is currently the intermediate storage destination forDWPF recycle and other Tank Farm dilute waste streams. In addition, a funding shortfallresulted in a delay in analyzing samples from initial CST runs. The analytical resultsfrom these runs are suspect. As a result, additional tests were run using a Tank 22simulant. Table 1 is a summary of the test cases for this study.
The uptake ofcesium-137 surrogate with CST was first evaluated with a simulant fromearlier CST testing (3) to provide a baseline for the method used in this experiment. Thisinorganic simulant composition, shown in Table 2, is representative of typical HLW saltwaste composition.
Caustic adjustments in the RCT, as described earlier, put sodium concentrations in theRCT in the range of 0.5 to 5.4 molar. Based principally on these sodium concentrations,three types of basic DWPF test solutions (simulants) were used in this study:
*UOP, 307 Fellowship Road, Suite 207, Mount Laurel, NJ (856-727-9400)

WSRC-RP-99-O0331 Rev. OSeptember 22, 1999
Page 4 of 21
Table 1 Summary of Test Cases.
SorbentTested/ SimulantCoritam.Removed Evaluated
CST / CS133 Baseline saltsimulantcomposition
CST / CS133 High sodiumlI organidinorganic
DWPF recycleCST / CS133 Avg. sodium/
organiclinorganicDWPF recycle
CST / CS133 TNX SMECTsample
CST / CS133 Tank 22 simulant(low sodium)
-T==-1==SAMMS, GT-73 & High sodiuudSulfur / Mercurv orjmnic/inorganic
DWPF recy~eSAMMS & GT-73 Tank 22 simulantf Mercury (low sodium)
SolutionComposition
rTable 2
rTables 3 & 4
F
Tables 5 & 6
FNot availableexcept for Cs
FTable 7 Tables 9 & 10
Figures 1 & 2
Table 7
F
Table 7
T
Tables 3 & 4
F
Table 13
Table 6 Table 14Figures 4 & 5
ExperimentalVariable
None. Compari-son with earlierresults (Ref. 3)pH
pH
pH
Initial cesium (Cs-133) concentration
Sodiumconcentration
Radioactivecesium
Sorbent tested
pH
Table 2. Simulant Inorganic Composition Used for Cesium Uptake with CST.
Precursor/ target ion Target concentration (M) Precursor per Liter (g/L)NazS04/ SOd= 0.17 24.10NaNOz/ NO; 0.71 48.70NaNOJ/ NO; 1.20 102.00
KNOs/K+ 0.015 1.52CsNOs/ (CS-133) 2.4E-4 0.047
“’?zC03.HZO/C03= 0.2 24.8
1
NaOH/OH- 2.9 116.0Al(N@~.9H@/ A1+3 0.38 142.5

/
WSRC-RP-99-O0331 Rev. OSeptember 22, 1999
Page 5 of 21
A. High inorganic/organic and high sodium (5.4 M Na+) simulant (Tables 3 and 4).
B. Average inorganic/crganic and average sodium (1.4 M Na+) simulant (See Tables5 and 6).
c. Average inorganic/organic and low sodium (0.5 M Na+) simulants (Table 7).
The last simulant type (Type C) was designed to reflect waste from Tank-22 which iscurrently the intermediate storage destination for DWPF recycle and other Tank Farmdilute waste streams. A range of cesium concentrations were tested (6-60 mg/L CS-133)with Tank 22 simulant to assess variation of batch distribution coefficient with initialcesium concentration. Experiments were also conducted with cesium- 137 spiked Tank
22 simulant (20 pg/L Cs- 137) which is more representative of actual Tank 22 cesiumconcentration. Finally, ranges of sodium concentrations were tested for Tank 22 simularttto assess the impact of ionic strength on cesium uptake.
In the comparative evaluations of SAMMS and Duolite@ GT-73 resin for mercury uptakefrom DWPF recycle, simulant Types A and C spiked with mercury solutions were used.Some mercury solutions were prepared directly from mercuric chloride. Russ Eibling ofSRTC provided other mercuric test solutions from old TNX process SMECT test runsalready containing organic compounds. Cesium-133, as cesium nitrate precursor, wasused as the surrogate for radioactive cesium- 137.

WSRC-RP-99-O0331 Rev. OSeptember 22, 1999
Page 6 of 21
Table 3. DWPF Simulants: High Inorganic/Sodium Compositions.
(Inorganic components for simulant type A)
I w
t KOH 3.000 i-i..,.
~
‘-RCT Simdant- Hi h-m
“ “CL[K+][1’wklNH3 I 0.600
I I .A
0.008 I
o-% [Na NVLNa2Bq07 1.49E-3NaCOOH 0.870 0.013NazCz04 60.00 0.896
NaCl 0.008 1.368E-4NaF 0.017 4.048E-4
NaNOz 37,00 0.536NaN03 120.00 1.412NaOH 100.00 2.500Na2SOl 0.080 0.014
TOTAL [Na’1 5.373 M/LCSNOS 0.004g/L 3.55E-3
(CS-133precursor) M/L Cs
PPPhosphate 2,2:0Fluoride 880Formate 160Chloride 900Cesium 2.3
Carbonate 190

WSRC-RP-99-O0331 Rev. OSeptember 22, 1999
Page 7 of 21
Table 4. DWPF Simulants: High Organic/ Sodium Compositions.
(Organic components for simulant Type A)
IOrganic Compound I mgk I Comments
1
I Benzene 10 Not used due toits properties
Aniline 1301
Sodium Phenoxide 2- 620Sodium nitophenoxide 4- 170
Nitrobenzene 350Sodium dinitrophenoxide 2,4- 1700Sodium phenylphenoxide 2- 1 4 ISodium phenylphenoxide 2- 11Sodium phenylphenoxide 4- 11
Sodium phenylazophenoxide4- 25Glvcerine 200
1 Acetonitrile ! 150 IAcetone 75
Methylene Chloride 73Hydrogen peroxide 51
Surfvol 420 50Quinone 10Biphenyl 10
Terphenyl-O 10Terphenyl-m 10Terphenyl-p 10
Diphenylamine 10Triphenylamine I 10 I
Nitrodiphenylamine 10Phenylformamide 10Dihenylformamide 5
Carbazole 10
I 3H-phenoxazin-3 -one I 5 I

Table 5. DWPF Simulants: Average Organic Compositions.
(Organic components for simulant Type B)
Organic Compound mg/L I Comments
IBenzene I 1 Not used due to its properties 1
Aniline I 30 INitrobenzene 0.2 I
Sodium I%enoxide 2-Sodium nito~henoxide 4- ! :: 1~
WSRC-RP-99-O0331 Rev. OSeptember 22, 1999
Page 8 of 21
Sodium nitrosophenoxide 4- 90Sodium dinitrophenoxide 2,4- 410Sodium phenylphenoxide 2- <0.6Sodium phenylphenoxide 2- <1Sodium phenylphenoxide 4- <1
Sodium phenylazophenoxide4- 6
Glycerine 3.2
E
Lab. Chemical in RTCAcetonitrile 5 Lab. Chemical in RTC
Acetone 2.5 Lab. Chemical in RTCMethylene Chloride 2.4Hydrogen peroxide 0.85
ISurfvol 420 25 !~
Terphenyl-OTerohenvl-m l!l~
DihenylformamideCarbazole
3H-~henoxazin-3 -one + a

WSRC-RP-99-O0331 Rev. OSeptember 22, 1999
Page 9 of 21
Table 6. DWPF Sinmlants: Average Inorganic Compositions
(Inorganic components for simulant Type B)
Inorganic Compound RCT Simulant- Average Commentsg/L M/L
KOH 0.090 1.60E-3 competing ion for CsNHq 0.300 0.004 [NH,] As ammonium nitrate
[Na+],NJ/LNa2B107 0.037 3.68E-4 As sodium chlorideNaCOOH 0.210 0.003NazC204 1.300 0.019
NaCl 0.002 3.42E-5NaF 0.004 9.52E-5
NaN02 6.000 0.087NaN03 2.600 0.306NaOH 40.000 1.000
NajSOd 0.020 0.003TOTAL [Na’1 1.418 M/L,
CSNOS 0.001 8.875E-4(CS-133 precursor) glL MIL Cs
PPmPhosphate 37 Lab..Chemical in RTCFluoride 15 Lab. Chemical in RTCFormate 2.7 Lab. Chemical in RTCChloride 15 Lab. Chemical in RTCCesium 0.038 Lab. Chemical in RTC
Carbonate 3.1 Lab. Chemical in RTC
WSRC-RP-99-O0331 Rev. OSeptember 22, 1999
Page 10 of21
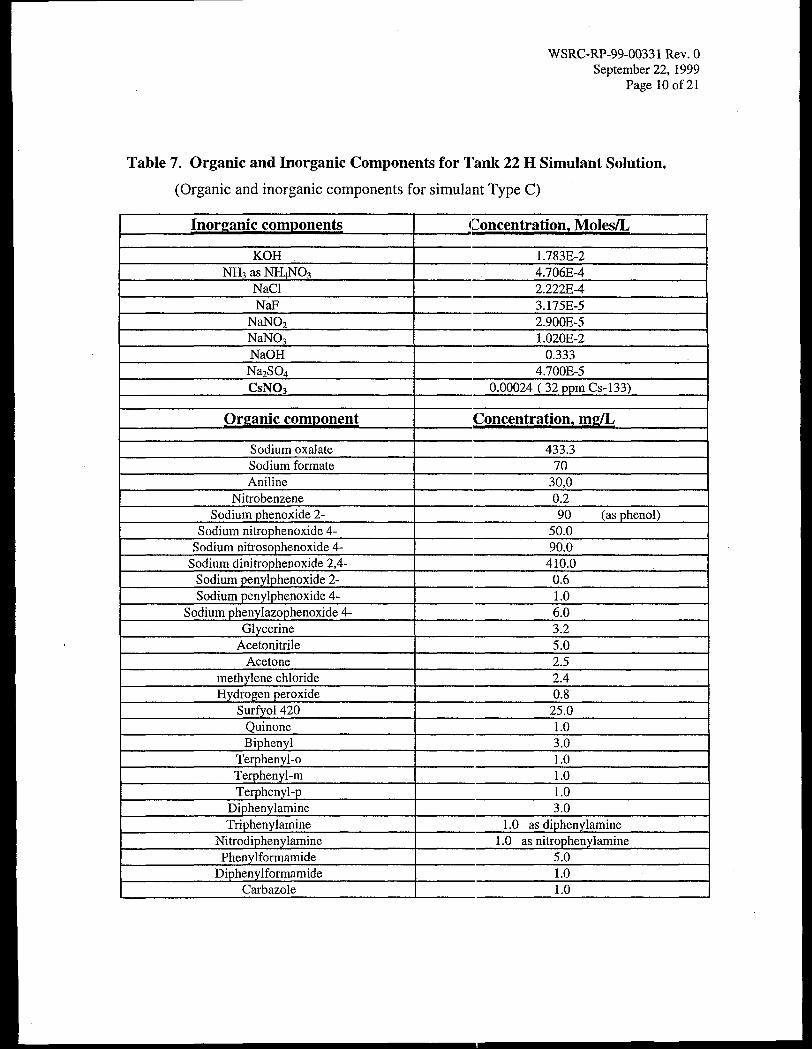
Table 7. Organic and Inorganic Components for Tank 22 H Simulant Solution.
(Organic and inorganic components for simulant Type C)
Inorganic components Concentration. Moles/L
KOH 1.783E-2NHqasNH4NOt 4.706E-4
NaC1 2.222E-4NaF 3. 175E-5
NaNOz 2.900E-5NaNO~ 1.020E-2NaOH 0.333
NazSO1 4.700E-5CSN03 0.00024 (32 ppm CS-133)
Orzzanic component Concentration, m@
Sodium oxalate 433.3Sodium formate 70Aniline 30,0
Nitrobenzene 0.2Sodium phenoxide 2- 90 (as phenol)
Sodium nitrophenoxide 4- 50.0Sodium nitrosophenoxide 4- 90.0
Sodium dinitrophenoxide 2,4- 410.0Sodium penylphenoxide 2- 0.6Sodium penylphenoxide 4- 1.0
Sodium phenylazophenoxide 4- 6.0Glycerine 3.2
Acetonitrile 5.0Acetone I 2.5
methylene chloride 2.4Hydrogen peroxide 0.8
Surfyol 420 25.0Quinone 1.0Biphenyl 3.0
Terphenyl-o 1.0Terphenyl-m 1.0Terphenyl-p 1,0
Diphenylamine 3.0Triphenylamine 1.0 as diphenylamine
Nitrodiphenylamine 1.0 as nitrophenylaminePhenylformamide 5.0
Diphenylformamide 1.0Carbazole 1.0

WSRC-RP-99-O0331 Rev. OSeptember 22, 1999
Page 11 of21
3.3 MethodThe uptake of cesium with CST, or mercury onto Duolite GT-73 or SAMMS, was studiedby a batch technique. The batch distribution coefficient (&, rnL/g) is an equilibriummeasure of the overall ability of a solid phase ion exchange material to remove ions ofinterest from solution. It represents the theoretical volume of solution that can beprocessed per given mass of the ion exchanger under equilibrium conditions (2).
For this study a known quantity of the resin (approximately 0.1 grams) was placed incontact with 25 ml of the simulant in a 50-rnl polyethylene bottle. All samples wereprepared in either duplicate or triplicate. The polyethylene bottles were placed in anorbital shaker and the mixture agitated for 24 hours at 26 i 2 ‘C. After this contact time,the used resin was separated from the solution by filtering through a 0.2-micron nylonfilter. The decanted portion, without resin, was submitted for metal concentrationanalysis. The & values were calculated using Equation (1),
& = ((ci - Cf)/Cf)*(V/IIl*F) (1)
Where, Ci is the initial concentration of the metal ion of interest, Cf is the final metalconcentration after contact, v is the volume of simulant used, m is the sorbent exchangermass and F is the F-factor (ratio by weight of dry sorbent to wet sorbent). In the aboveequation, it is assumed that the mass of dry ion exchange sorbent is approximately equalto that of wet ion exchange sorbent used (F = 1.0). Note that the amount of metal on theresin following sorption is calculated by difference in the solution (Ci - Cf).
For radioactive samples, or simulants spiked with radionuclides, & values weredetermined using equation (2),
& = ((Ai-4)/Af) * v/m. (2)
Where Ai and Af are the activities of the radionuclide in solution at the beginning and atthe end of sorption, respectively, v is the volume in ml of the solution used forequilibration and m is the weight of the adsorbent in grams.
4. RESULTS AND DISCUSSION
4.1 Cesium Uptake with CST in an Inorganic DWPF SimuIantIn the initial characterization of cesium uptake with CST a 5.6 M Na+ simulant (upperlimit simulant) without organic additives was used. The simulant inorganic ioncomposition and concentrations are shown in Table 2 above. In this initial batch study,three simulant samples with an average Cs- 133 concentration of 3.86 t 0.21 mg/L wereused. The average & obtained was 1509 + 95 ml/g. This & value for cesium uptakeagrees with earlier results obtained by McCabe (3). The Kd values obtained and total

WSRC-RP-99-O0331 Rev. OSeptember 22, 1999
Page 12 of21
potassium ion concentration in each sample is summarized in Table 8. Note thatpotassium concentration is listed because it can act as a competing ion for cesium uptakewith CST.
Table 8. &values for cesium uptake with CST ( 5.6 M Na+).
I Run # I [CS-133] mg/L I [K’1 mgiL I CS-133 &1 3.66 464.095 1601.78 1
I 2 I 3.84 I 463.085 I 1514.973 4.08 517.120 1411.15
[ Average I 3.86 k 0,21 I 1509 t 95 I
4.2 Cesium Uptake with CST in Organic and Inorganic DWPF SimulantsDWPF simulants were prepared with both inorganic and organic components based onTypes A and B simulants (i.e., high and average sodium/organic/inorganic DWPF recyclestimulants). The pH of these simulant solutions was 13.3. Since the effectiveness ofcesium uptake by CST was also to be evaluated at other pH conditions (13, 7 and 2),solutions of the original high and average simulants were adjusted with nitric acid (1.0M) to the desired pH levels. In all, six sample types of simulant solutions were preparedfor & measurement; High RCT (DWPF Type A sirnulant) at pH’s of 13, 7 and 2, andAverage RCT (DWPF Type B simulant) at pH’s of [3, 7 and 2. Corresponding blankswithout CST were also prepared. Cesium-133 concentration in each sample wasapproximately 32 mgfl. These particular sets of samples were prepared in triplicate. &measurements were made using the procedure describ ad in the method section above.
For comparison, SMECT sample from TNX operations, which already contained mercuryand DWPF organic compounds, was also used in determining batch & values for CST.With this TNX SMECT sample, an equivalent amount of cesium nitrate (0.0118 g) wasintroduced into a 250-ml sample to bring its cesium concentration to 32 mg/L. The pH ofthree 25-ml representative samples from this batch of modified SMECT samples wasadjusted with sodium hydroxide, respectively, to pH values of 2, 7, and 13. Each of the25-ml samples, with different pH values (2, 7 and 13), was treated with 0.10 g CST asdescribed previously.
Residual cesium analysis of all the above samples, which were contacted with CST, weredelayed for about 4 months due to funding problems. After this delay a selected number
of the samples were analyzed, yielding an average l&J value of 2400 t 50 ml/g. Thisvalue is significantly different from an average batch Kd value of 1500 t 95 ml/gobtained for the baseline simulant without organic components (Table 2). Here oneexpects a decrease in & values with organic components in the simulant. The increase in& value was attributed to the plating out of cesium with organic films onto the sides ofthe sample vials or containers during the four months delay.
WSRC-RP-99-O0331 Rev. OSeptember 22, 1999
Page 13 of21
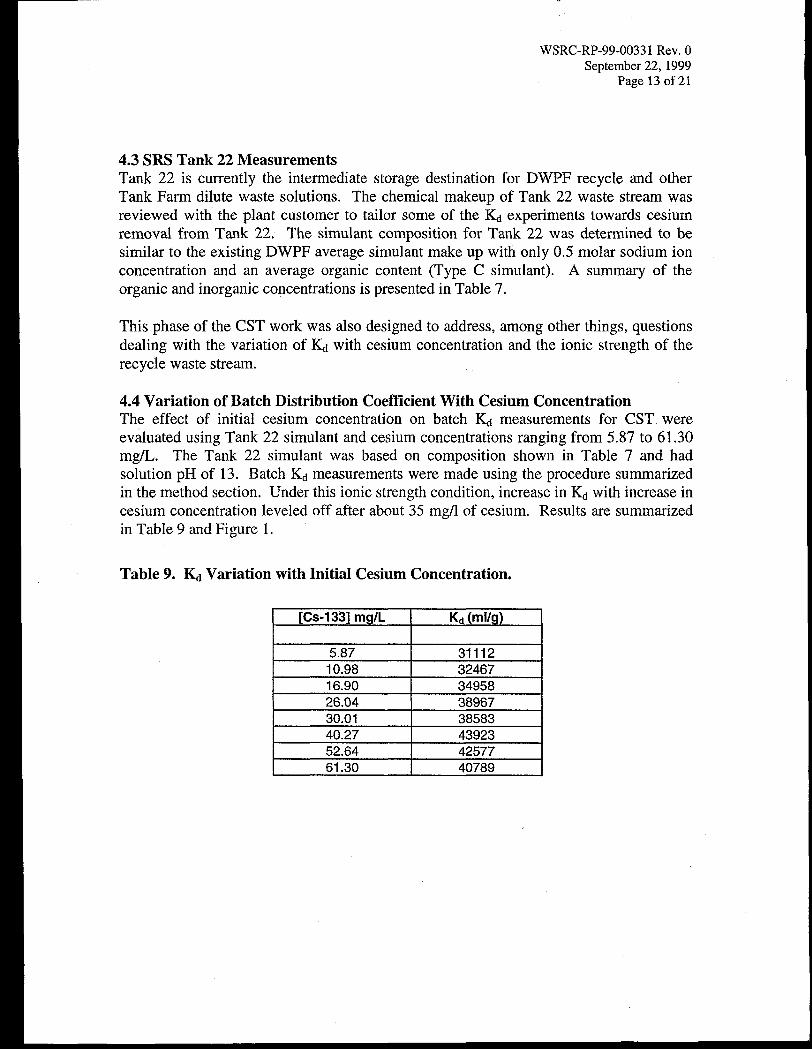
4.3 SRS Tank 22 MeasurementsTank 22 is currently the intermediate storage destination for DWPF recycle and otherTank Farm dilute waste solutions. The chemical makeup of Tank 22 waste stream wasreviewed with the plant customer to tailor some of the I& experiments towards cesiumremoval from Tank 22. The simulant composition for Tank 22 was determined to besimilar to the existing DWPF average simulant make up witli only 0.5 molar sodium ionconcentration and an average organic content (Type C simulant). A summary of theorganic and inorganic concentrations is presented in Table 7.
This phase of the CST work was also designed to address, among other things, questionsdealing with the variation of& with cesium concentration and the ionic strength of therecycle waste stream.
4.4 Variation of Batch Distribution Coefficient With Cesium ConcentrationThe effect of initial cesium concentration on batch & measurements for CST wereevaluated using Tank 22 simulant and cesium concentrations ranging from 5.87 to 61.30mg/L. The Tank 22 simulant was based on composition shown in Table 7 and hadsolution pH of 13. Batch Kd measurements were made using the procedure summarizedin the method section. Under this ionic strength condition, increase in & with increase incesium concentration leveled off after about 35 mg/1 of cesium. Results are summarizedin Table 9 and Figure 1.
Table 9. Kd Variation with Initial Cesium Concentration.
t[CS-133] mg/L I & (ill!/g)
30.01 3858340.27 4392352.64 42577
I 61.30 I 40789 I

WSRC-RP-99-O0331 Rev. OSeptember 22,1999
Page 14 of 21
I 500001 }
dA=====” *
1 05101520253035404550 556065
I Cesium, mg/L
Figure 1. Variation of Kd With Initial Cesium Concentration.
Based on equation (1) above, the batch distribution coefficient is expected to be linearwith respect to the decontamination factor, Ci/Cf, [~’ithin the linear response region ofFigure 1 above (i.e., below 30 mg/L)]. A summary of the basic equations gives:
& = ((ci - Cf)/Cf )*(v/m).If P = v/m, then
I&I= f3(Ci/Cf-1) =(3 Ci/Cf-~ (3)
To validate equation (3) several of the & measurements in the cesium concentrationregion of interest were plotted with the correspondir~g decontamination factor. Using atest solution volume of 25 ml and CST weight of O.lg equation (3) becomes:
Kd = 250 Ci/Cf-250. (4)
Experimentally, per equation (4), a plot of & versus Ci/Cf (decontamination factor)should give a straight line with a slope equal to 250 and intercept of –250.
The experimental results confirming equation (3) with Tank 22 simukmt are summarizedin Table 10 and Figure 2. The slope and intercept from the experimental data, 250 and250.81 respective y, are in excellent agreement with the theoretical values of equation 4.

WSRC-RP-99-O0331 Rev. OSeptember 22, 1999
Page 15 of21
Table 10. Kd variation with decontamination factor.
Ci ,mgfL Cf, mg/L &, rnlig [CJ/[Cf]
5.871 0.047 31112 125.4510.980 0.084 32467 130.8716.900 0.120 34958 140.8326.040 0.166 38967 156.87
y = 250x -250.81R2=1
40000 IG~ 30000
: 20000 I
x 10000
0
100 120 140 160 180
[Ci]/[Cf] (Decontamination factor)
Figure 2. Linear Response of Kd with Cesium Decontamination Factor.
4.5 VariationThe effect of
of Batch Distribution Coefficient With Ionic Strength.ionic strength on batch Kd measurements for CST were evaluated using
Tank 22 simulant at ionic strengths of 0.5, 1.4 and 5.4 molar sodium. Each solution
contained an average of 0.26 k 0.15 moles of cesium per liter. The & values obtainedare summarized in Table 11 and Figure 3. The data clearly shows that J& increases witha decrease in the ionic strength of the test solution.
Table 11. Kd Variation with Ionic Strength.
[Cs]i (moles) [Na+], moles Kd (ml/g) (~a~Csfi)moldmole
0.24925 0.5 37400 2.00600.26060 1.4 8000 5.37220.28045 5.4 1300 19.2547

WSRC-RP-99-O0331 Rev. OSeptember 22, 1999
Page 16 of 21
4000035000 I t y = 101906x-’”4624
30000 I R2 = 0.9993
@ 25000 \
~ 20000” ~
Q 15000 \
10000 I
5000 Io! 1 ,
0 5 10 15 20 25
Ionic strength ([Na.t]/[Cs])
Figure 3. Variation of Kd with Ionic Strength.
The region of interest for cesium- 133 removal from DWPF recycle (less than 1 mg/Lcesium or 7.519 E-6 moles of cesium- 133/Liter) cannot be fully characterized withcesium- 133 simulant. This problem is due, in part to the question of minimum detectionlimit for cold cesium (Cs-1 33) using standard ICP-lVIS analytical techniques. To getaround this problem Tank 22 simulant (0.5 M Na+) was spiked with cesium- 137 and theKd determined by quantifying cesium-137 using gamma counting and equation (2) above.
4.6 Experiments With Cesium-137 Spiked Tank-22 SimulantFour samples (25-mL solutions of Tank 22 simukmt each) were spiked with 0.5 mL Cs-137 tracer (concentration of 20.8 ppb CS-137 or 9.2E05 d/min-mL). Cesium-137concentration in grams was based on 87g Cs- 137/1.231312 chin-ml. The average amountof cesium- 137 in each sample was 6.584E-07 g or 4.95E-09 moles. A volume of 2.5 ml ,from each sample was used for gamma counting (10,000-sec count) after overnightcontact with approximately 0.1 g of CST.
The results are summarized in Table 12, which shows an average & value of 74,500rrd/g. The final cesium concentration, after uptake with CST, may not differ greatly frombackground readings for cesium-137 in the area where the analysis was carried out.Consequently, the fourth sample was re-counted for a longer period of time (50,000-sec.count) resulting in a Kd of 327,425 ml/g versus 77,752 ml/g for a 10,000-second count.

WSRC-RP-99-O0331 Rev. OSeptember 22, 1999
Page 17 of 21
Table 12. Data Summary for Tank-22 Simulants Spiked with Cesium-137
Run # Initial CS-137 activity, Final CS-137 activity Kd (ml/g)Gamma count; dhnin-nd dlmin-nd
1 1.71E04 60 61,2072 1.66E04 47 82,2883 1.68E04 53 76,694
4 1.70E04 50 77.752
I Av.era~e I 1.69 E04 + 0.02 E04 I 52.5 + 3.8 I 74.500* 3900 I
Actual Tank 22 waste was recently secured and evaluated for cesium- 137 removal with
CST (3). The average Kd value reported was 14,850 i 2,380 ml/g. The & values inreference 3 are significantly lower than that reported here. This is probably because ofthe effect of low sodium and cesium- 137 concentration in the Cs- 137 spiked simulant.
4.7 Mercury Removal From DWPF SimulantThe uptake of mercury from DWPF simulant using the Self-Assembled Monolayer onMesoporous Support (SAMMS) material from PNNL (4) was evaluated with the Type ADWPF simukmt ([Na+] of 5.4 M and pH of 13) containing mercury. The SAMMSmaterial was expected to outperform standard GT-73 ion exchange material for mercuryremoval from DWPF waste stream.
The contact results of this SAMMS and GT-73 ion exchange material with DWPFsimulant containing both mercury and organic compound (Table 13 below) shows thatthe SAMMS material, in its current configuration, has no affinity for DWPF waste streammercury (& = 0.0). Even ordinary sulfur powder showed a better affinity for mercurythan SAMMS at a solution pH of 13. The & value for mercury removal from DWPFsimulant using GT-73 averaged about 8,900 ml/g. The SAMMS material does, however,show Kd values less than 600 ml/g when there are no organic compounds in the simulantwaste stream.
The mercury removal evaluations with SAMMS and Duolite GT-73 resins were repeatedwith Tank 22 simulant. This time, the pH of the simulant solution was adjusted to 2, 7and 13 before the batch & work with the resins. Concentrated nitric acid and 0.10 Msolution of sodium hydroxide were used for pH adjustments. The new & values aresummarized in Table 14 and plotted in Figures 4 and 5.

WSRC-RP-99-O0331 Rev. OSeptember 22, 1999
Page 18 of21
Table 13. Kd Values for SAMMS and Duolite GT-73 Resin for Mercury Removal
from Type A DWPF Simulant.
Sample ID Ci [H~] ppm C~[Hg] pprn Kds (ml/g) Average h
Initial [Hg] 38.739
GT-73 run 1 38.739 1.0875 8646 8918
GT-73 run 2 38.739 1.0250 9189
SAMMS run 1 38.739 39.9 0.0 0.0SAMMS run 2 38.739 39.0 0.0SAMMS run 3 117.08 34.67 594.2 594.2
Sulfur run 1 38.739 5.625 1470 1544Sulfur run 2 38.739 5.1750 1619
Table 14. Kd Values for SAMMS and Duolite GT-?~3Resin for Mercury Removalfrom Tank-22 Simulant.
Duolite GT-73 Resin
‘H
SAMMS ResinpH Kd (ml/g) H Kd (ml/g)
2 ‘-119 2 07 1213 ‘7 233,52213 9179 13 0
The SAMMS material showed a significant affinity for the uptake of mercury at neutralpH of 7. The batch distribution coefficient for mercury removal at this neutral pH was233500 ml/g. The SAMMS did not remove mercury from simulants with lower or higherpH values (Figure 4). The GT-73 performed as expected. Its affinity for mercuryincreased with increase in pH (Figure 5).
4.8 Mercury Removal From Tank 22 Sample With GT-73.ResinMcCabe (3) documents the collection and characterization of actual Tank 22 sample usedin this part of the mercury removal study. The mercury removal I& data obtained byMcCabe was based on filtered Tank 22 samples. The average & reported with GT-73
resin (Na+ form) was 39,885 + 3000 ml/g. The initial mercury concentration in Tank 22sample was 10.95 mg/L and the ending mercury concentration was 0.07010.006 mg/L.20-ml sample volumes were used with 0.075 g of GT-’73 in Kd determinations.

WSRC-RP-99-O0331 Rev. OSeptember 22, 1999
Page 19 of21
250000
200000
150000
100000
50000
01234567891011121314
pH
Figure 4. Estimated Kd Variation Profile with pH for Mercury Removal withSAMMS.
ry =61 .466e0”393’x
12000
10000
~ 80003~ 6000
z 4000
2000
0
R2 = 0.9916
0 5 10 15
pH
Figure 5 Variation of Kd with pH for Mercury Removal with Duolite GT-73.
5. CONCLUSIONS
The results of this evaluation of the performance of CST in the uptake of cesium withsimulants and actual DWPF recycle samples (Tank 22) indicate that, in practice, thisinorganic ion-exchange material can be used to remove radioactive cesium from theDWPF recycle. Even in high ionic strength environments the CST material has affinityfor cesium. Characterization of the effect of organic components on the efficiency ofcesium or mercury removal from DWPF simulants using, respectively, CST and SAMMSor Duolite@ GT-73 was aborted due to interruption in the analysis of samples due to afunding shortfall. Based on the data obtained the following conclusions are made:

WSRC-RP-99-O033 I Rev. OSeptember 22, 1999
Page 20 of 21
●
●
●
●
●
●
●
Batch distribution coefficient (&) for cesium removal with alkaline DWPF simulantsolution increases with decreasing ionic strength.
The batch distribution coefficient for alkaline DWPF simulant showed a linearvariation with initial cesium- 133 concentration up to approximately 35 mg/L.
The & value for cesium uptake from DWPF high ionic sodium salt solution (5.4 M[Na+]) is 1500 ml/g. For low sodium salt solution, (0.5 M [Na+]), the & valueobtained is 37,000 ml/g.
Radioactive cesium spiked simulant (0.5 M [Na+]), with cesium- 137 activity of1.69E04 d/rein-ml, showed a CST cesium-137 uptake & value of 74,500 ml/g.
Self-Assembled Monolayer on Mesoporous Support from PNNL had no affinity forDWPF simulant mercury. However, with the pH oF’the simulant adjusted to a value of7 (neutral pH condition), SAMMS material showed its highest affinity for DWPFmercury (kd of 233,000 ml/g).The Kd for the uptake of mercury from DWPF simulant with conventional Duolite@GT-73 resin was found to increase with increasing pH of the simulant solution.GT-73 ion-exchange affinity for mercury from actual Tank 22H sample was quitegood. The average determined & value was 39,700 ml/g.
Additional work that needs to be carried out before implementing this program includesthe following:
●
●
●
●
●
6.
Column performance evaluations with CST in DWPF simulant and actualsolutions.Determination of batch ?& values at different DWPF simulant pH conditions.
Evaluation of the affinity of CST for other transuranic elements, and
waste
Evaluation of strontium-90 uptake with Sodium Tjtanate (ST) and crossflow filtrationcharacterizations with ST.
Evaluation of the effect of organic loading on the efficiency of CST in removingcesium, and GT-73 and SAMMS in removing mercury.
QUALITY ASSURANCE
AH experimental work reported in this document was obtained in accordance with therequirements and controls established in the Savannah River Technology Center Conductof Research and Development manual (VWRC-IM-97-00024). Experimental methods anddata are recorded in laboratory notebook, WSRC-NB-96-655.

WSRC-RP-99-O0331 Rev. OSeptember 22, 1999
Page 21 of 21
Acknowledgements
Dennis Fennelly of UOP and Dr. Feng of PNNL, provided the crystalline silicotitanate(CST) and the Self-Assembled Monolayers on Mesoporous Support (SAMMS),respectively. The Department of Energy, Office of Science and Technology, through theEfficient Separations and Processing Crosscutting Program, funded this work.
7. REI?ER.ENCES
(1)
(2)
(3)
(4)
Klavetter , E. A, Brown , N. NE., Trudell, D. E., Anthony, R. G., Gu, D, andThibaud-Erkey, C, “Ion-Exchange Performance of Crystalline Silicotitanate forCesium Removal from Hanford Tank Waste Stimulants,” Waste Management 04,p. 709, Tucson, AZ.
G. N. Brown, LA. Bray and R. J. Elovich, “Evaluation and Comparison ofSuperlig@ 644, Resorcinol Formaldehyde and CS-1OO Ion Exchange Materialsfor the Removal of Cesium from Simulated Alkaline Supernate”. PNL- 10486,March 1995.
D. J. McCabe, L. N. Oji, “Distribution Coefficients for CrystallineSilicotitanate with Tank-22H (U),” WSRC-TR-98-00197, Rev. 0.0, June 16,1998.
X. Feng, J. Liu, G. E. Fryxell, M. Gong, L. Q. Wang, X. Chen, D. E. Kurath, C.S. Ghormley, K. T. Klasson, and K. M. Kemner, Self-Assembled Mercaptan onMesoporous Silica (SAMMS) Technology for Mercury Removal andStabilization, PNNL-1 1691, Pacific Northwest National Laboratory, Richland,WA (1997).