evaluation and validation of algorithms bay lawrence w ... · evaluation and validation of case 2...
TRANSCRIPT

Evaluation and Validation of Case 2 Algorithms in Chesapeake Bay
Lawrence W. Harding, Jr. Andrea Magnuson
Horn Point Laboratory University of Maryland
Center for Environmental Science P.O. Box 775
Cambridge, MD 2 1 6 13
INTRODUCTION
The high temporal and spatial resolution of satellite ocean color observations will prove invaluable for monitoring the health of coastal ecosystems where physical and biological variability demands sampling scales beyond that possible by ship. However, ocean color remote sensing of Case 2 waters is a challenging undertaking due to the optical complexity of the water. The focus of this SIMBIOS support has been to provide in situ optical measurements from Chesapeake Bay (CB) and adjacent mid-Atlantic bight (MAB) waters for use in algorithm development and validation efforts to improve the satellite retrieval of chlorophyll (chl a) in Case 2 waters. CB provides a valuable site for validation of data from ocean color sensors for a number of reasons. First, the physical dimensions of the Bay (> 6,500 km2) make retrievals from satellites with a spatial resolution of -1 km (ie., SeaWiFS) or less (ie., MODIS) reasonable for most of the ecosystem. Second, CB is highly influenced by freshwater flow from major rivers, making it a classic Case 2 water body with significant concentrations of chlorophyll, particulates and chromophoric dissolved organic matter (CDOM) that highly impact the shape of reflectance spectra. Finally, past and ongoing research efforts provided an extensive data set of optical observations that support the goal of this project.
Our SIMBIOS contribution has the following objectives:
0 To provide to SeaBASS an on-going stream of in-situ optical measurements from CB/MAB for use by the Ocean color community in the development and validation of atmospheric correction and Ocean bio-optical models; To evaluate the performance of SeaWiFS bio-optical algorithms in CB/MAB; To evaluate the performance of SeaWiFS Lw,,, and chi a products in CB/MAB on a wide range of time and space scales; To utilize our bio-optical database to develop a regionally-tuned algorithm for CB/MAB; To produce accurate satellite chl a fields that can be used in existing primary productivity models (Harding et al., 2002) to improve the spatial and temporal resolution of primary productivity estimates for CB/MAB.
0
0
0
0
RESEARCH ACTIVITIES
Field Program
Throughout our SIMBlOS support we have maintained a seasonal (i.e., spring, summer, fall) sampling schedule in CB proper that started in 1995 with the NSF Land-Margin Ecosystem
https://ntrs.nasa.gov/search.jsp?R=20040161487 2019-02-09T20:01:06+00:00Z

Harding & Magnuson 2
Research (LMER) program Trophic Interactions in Estuarine Systems (TIES) cruises (1 995- 2000) and continued with the NSF Biocomplexity cruises (2001-2003). In addition, five separately hnded Of€ice of Naval Research (ONR) cruises were conducted in adjacent offshore waters including coverage to the Gulf Stream. All cruises collected the same suite of measurements. Vertical profiles of downwelling irradiance ( E d ) and upwelling radiance (L,) were preformed with a Biospherical Instruments MER 2040/204 1. Discrete samples of particulate and dissolved fiactions were collected for determination of absorption spectra of phytoplankton, up,,(&, non-pigmented particulates, a&, and colored dissolved material, acm&A). Discrete particulate samples were collected for pigment analyses of chl a by fluorometry and a suite of pigments by HPLC. Radiometric profiles were used to calculate attenuation coefficients for downwelling irradiance (&) and upwelling radiance (&), and surface values of Ed and L, (E&- and L,Q, respectively) by simple linear regression. Instrument self-shading corrections were applied to each L,@ according to Gordon and Ding (1 992).
In 2001 we expanded our sampling protocol to include two new radiometric instruments, the Satlantic MicroPro free-fall radiometer and the Satlantic Hyperspectral Tethered Spectral Radiometer Buoy (Hyper-TSRB). The MicroPro is designed for work in more turbid waters with a small sensor cross-section, and is sufficiently compact to allow deployment from small boats. The Hyper-TSRB measures surface Ed and L, with a 120-channel detector from 400 to 800 nm. On each cruise in CB, sequential radiometric profiles were made with the MER (typically one cast) and Micropro (2 to 5 casts). All casts were completed within -5 to 8 minutes, depending on the number of MicroPro casts that were made. The TSRB was deployed prior to the radiometric profiles and continuously operated while on station. Since 2001 we also have been using a MicroTops sun photometer from the SIMBIOS instrument pool to measure aerosol optical thickness.
In 2002 and 2003 we participated in six EPANASA Atlantic Coast Estuaries Indicators Consortium (ACE INC) cruises that sampled two tributaries of CB, the Patuxent and Choptank Rivers. ACE INC cruises collected the same suite of measurements as the LMER-TIES and Biocomplexity cruises, with the exception that radiometric profiles of Ed and L, were limited to the MicroPro because of vessel limitations.
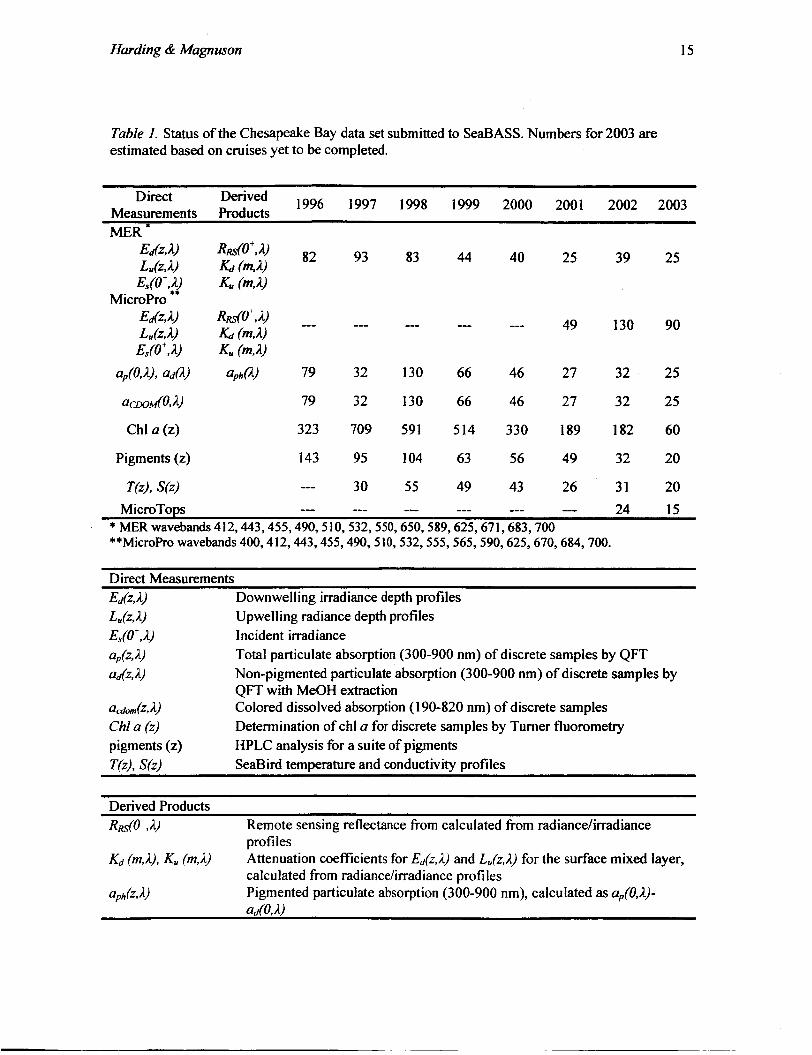
We have submitted over 3000 in-situ measurements to SeaBASS, significantly expanding bio- optical data for Case 2 waters (Table 1). Data from summer and fall cruises of 2003 will be submitted prior to the end of this contract. We also participated in the CHORS/Horn Point Laboratory HPLC Round Robin. We worked together with Jason Per1 to identitjl and minimize methodological and instrument differences between laboratories such that an internally consistent pigment database could be created.
Algorithm EvaluationLDevelopment
We have evaluated the performance of the empirical algorithm OC4v.4 (O’Reilly et ul., 1998) and the semi-analytical Gamer-Siegel-Maritorena (GSMO 1 ) model (Maritorena et al., 2002) for the CB/MAB, using bio-optical data collected during from SIMBIOS. This entailed using regional bio- optical data as input parameters to GSMOl, specifically the chl a-normalized absorption, aph*(I), and spectral slope of the combined absorption of dissolved and non-pigmented particulate matter, Scdm, to produce a regionally tuned version of the model that we termed GSMOI -CB. We subsequently modified the native GSMOl parameters in the SeaWiFS Data Analysis System (SeaDAS) code to evaluate the performance of the GSMOl -CB using satellite-derived radiances as input.

Harding & Magnuson 3
Sea WiFS Image Analysis
We have continued acquisition and analysis of SeaWiFS ocean color imagery from the Goddard Distributed Active Archive Center (DAAC) for CB/MAB. Approximately 100 clear images are available each year fro 1998-present. We have used in-situ data to validate SeaWiFS performance in match-up analyses and comparisons with continuous underway measurements. A three-year times series (1 998-2000) has been used to determine the extent to which SeaWiFS resolves seasonal and interannual variability of chl a evident in the in-situ data.
RESEARCH RESULTS
Radiometric Comparisons
Expansion of our radiometric measurement suite allowed us to evaluate performance of each profiling instrument in nearly simultaneous (i.e., within minutes) deployments. The MicroPro is more suitable for work in Case 2 waters than the MER due to: (1) smaller diameter (Micropro 4.8 cm relative to the MER 2 1 cm) that reduces instrument self-shading; (2) higher sampling frequency that gives greater depth resolution in waters where & is high and slight changes in the depth of the sensor have a larger effect on the measurements. The MicroPro exhibited clear advantages in waters with higher &. The improved depth resolution of the MicroPro (-25 measurements per meter) compared to the MER (-10 measurements per meter) compensated for the shallow optical depths in CB where the depth range available for the extrapolation interval was limited to the upper 4 m (or less). Measurements of EN' from the MicroPro were much easier to reconcile with surface irradiance measurements (Es) than were those from the MER, which exhibited an increasing bias as Kd increased. Measurements of L,@ from the MER and MicroPro also showed increased disagreement as & increased. Based on advantages of the MicroPro over the MER in comparisons of EN' and E.,, we feel confident that the MicroPro measurements of L,Q are more accurate than the MER for the Case 2 waters in which we work. Lastly, the increased depth resolution of the MicroPro reduced the effects of small changes in the selection of the depth interval on the calculated &, K,, E&, and L,Q. The MicroPro also allowed us to expand our radiometric sampling to more turbid waters of the tributaries, and has improved measurement capabilities in the upper reaches of CB. In addition, these comparisons of the MER and MicroPro indicated strong agreement in the clearer waters of the mesohaline and plyhaline CB, confirming confidence in our multi-year time series of radiometric measurements with the MER in the CB/MAB.
Characterization of Bio-optical Properties in Chesapeake Bay
Distributions of inherent optical properties in CB/MAB showed the strong influence of freshwater flow that complicates retrievals of chl a from satellite ocean color measurements. aph(440), acm&440), ad(440) ranged from 0.1 to 1 .O m-' in CB, and were an order of magnitude lower in the MAB. Whereas ad(440) dominated in upper CB, the magnitudes of ap,,(440), acm&40), ad(440) were comparable in the mid- and lower CB and inshore MAB. acmk440) dominated water column absorption in the offshore MAB. The distribution acmk440) was conservative in CB proper, due to its predominant terrestrial origin. a,h(440) and ~ 4 4 4 0 ) were subject to much higher spatial variability. The distribution of dissolved and particulate materials regulated the magnitude and spectral shape of apparent optical properties such as the attenuation coefficient for downwelling irradiance, Kd, and the remote-sensing reflectance, RRy.

Harding & Magnuson 4
OC4v. 4 Algorithm Evaluation
The distribution of inherent optical properties had a pronounced effect on the performance of OC4v.4 in CB/MAB (Fig. 1 a). OC4v.4 returned chl a estimates for CB that had a small positive bias and high uncertainty, reflecting that apt,, acmM, a d did not CO-vary. A larger positive bias of chl a occurred in the MAB where too much of the total absorption was attributed to phytoplankton. Match-ups of SeaWiFS chl a with in-situ data showed a larger positive bias in CB than observed for OC4v.4 applied to in-situ radiometric data, suggesting SeaWiFS-derived radiances introduced additional errors (Fig. 1 b). Whereas the fourth SeaWiFS reprocessing lessened the frequency of negative L-, comparisons of in-situ and satellite-derived LWN as part of this work and others have shown that low and negative LwN fiom SeaWiFS remain a problem in coastal and estuarine waters (Harding et al., 2003; O’Reilly and Yoder, 2003). SeaWiFS LW at ‘blue’ wavebands are low in CB, causing the return of higher-than-observed chl a values by OC4v.4. The lack of increased bias in chl a for match-ups fiom the MAB suggested errors in SeaWiFS chl a could be attributed primarily to OC4v.4 rather than errors in atmospheric correction.
Resolution of Interannual, Seasonal and Event-scale Variability by Sea WiFS
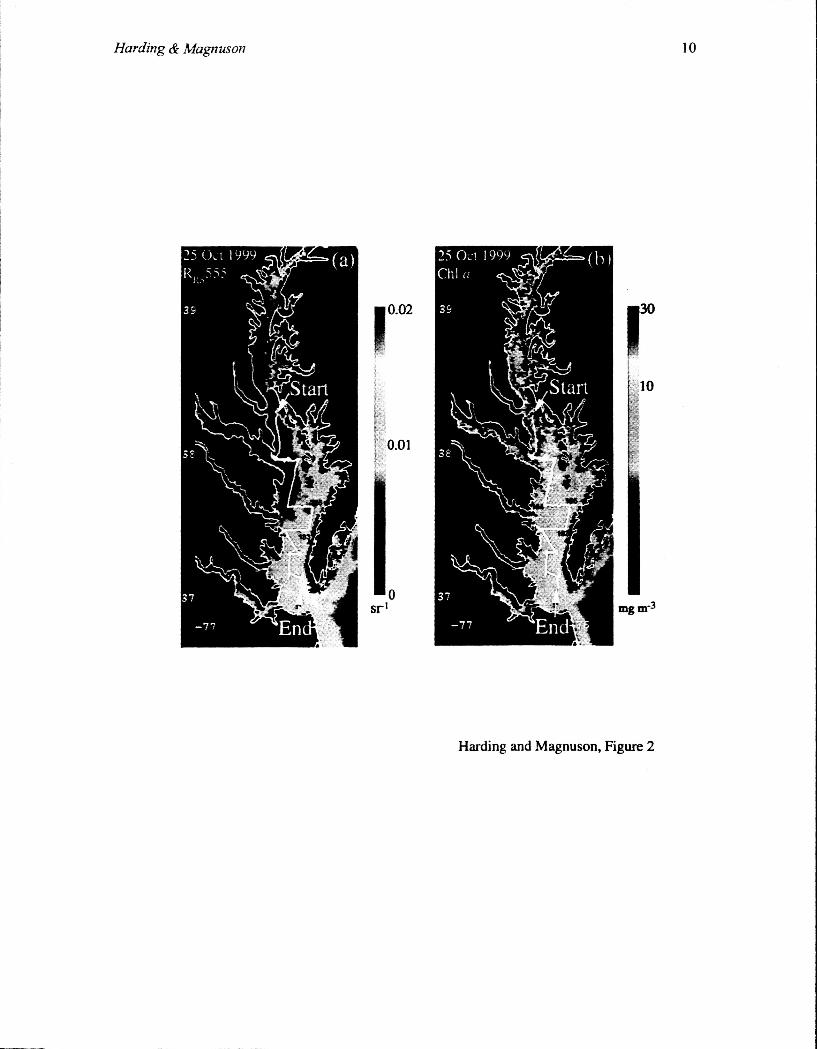
High uncertainties we detected in match-up analyses of in-situ and SeaWiFS chl a restricted the usefulness of SeaWiFS data for CB/MAB, stimulating additional analyses to lessen time-space aliasing we believed was responsible. High Frequency and small-scale variability of biomass typical of estuaries virtually assures time-space aliasing of satellite observations and in-situ measurements. To minimize aliasing, we compared continuous shipboard measurements of chl a were to SeaWiFS chl a along ship tracks to evaluate the extent to which SeaWiFS resolved variability on small spatial scales. We found SeaWiFS accurately captured small-scale (tens-of-kilometers) variability in the mesohaline and polyhaline regions of CB (Figs. 2 and 3) (see Harding et ul., 2003). Increased noise in chl a with distance north corresponded to sharp gradients of Rm. We suspect that the magnitude of the RRT signal often approaches the limits of sensitivity for the SeaWiFS Sensor in turbid waters with high &typical of mesohaline and oligohaline CB, thereby limiting the accuracy of chl a retrievals. This gradient of RRs was persistent in the imagery and was suggested in field radiometric measurements. Comparisons of several transects suggested axial movement of this gradient of RRs could determine the areal extent of accurate chl a retrievals.
Our evaluation of the 1998 - 2000 SeaWiFS chl a time series demonstrated that SeaWiFS accurately represented seasonal and interannual variability of chl a revealed by in-situ data (Fig. 4). Previous research has shown that the timing, position, and magnitude of the spring bloom are regulated by fieshwater flow from the Susquehanna River, supplying nutrients and suspended matter to CB (Malone et al., 1988; Harding, 1994). We found that positive deviations of flow in 1998 resulted in a large spring bloom that extended to the polyhaline CB, shown in both satellite imagery and in-situ data. Measurements of chl a in 1999, a year of lower-than-average freshwater flow, showed a smaller bloom that was confined primarily to the mesohaline CB. Lastly, average freshwater flow in 2000 supported a bloom of intermediate magnitude that extended throughout the mesohaline and part of the polyhaline CB. As observed in transect data, the agreement of SeaWiFS and in-situ chl a improved with distance down the Bay. These comparisons with in-situ data confirm that SeaWiFS chl a retrievals are reasonable and can significantly augment the temporal resolution of shipboard measurements.
The benefit of increased temporal resolution afforded by satellite observations was demonstrated in the three-year time series of chl a (Fig. 5 ) . Mean, daily chl a for a section of polyhaline CB indicated several doublings over a period of days in summer that were not captured by in-situ observations. We hypothesize that these doublings could be associated with short-lived,

Hurding & Magnuson 5
but dense blooms of dinoflagellates that have been observed before during stratified conditions in summer. The sedimentation of organic matter from the spring bloom fuels at least 50% of the primary productivity in surface waters (Kemp and Boynton, 1984). Transient destratification of the summer pycnocline provides the nutrients to support these short-lived summer blooms (Malone et al., 1986, 1988). The higher frequency of these events in 1998 and 2000, contrasted with 1999, may indicate a connection between these transient blooms in summer and the magnitude of the spring bloom. Further study is needed to test this hypothesis.
Regional Parameterization of GSMOl
Semi-analytical models such as GSMO 1 have the potential to distinguish multiple constituents of the water column that absorb and scatter light. This attribute is crucial for accurate retrievals of chl a in optically-complex waters. The original parameterization of GSMOI was based on in-situ observations from Case 1 waters and optimized for performance in the global ocean (Maritorena et al., 2002). We hypothesized that regional parameterization was necessary to improve the accuracy of chl a retrievals in CB/MAB.
We evaluated our extensive data set of in-situ observations to derive regionally and seasonally (when appropriate) values for u,,h'(') and Scdm to produce a regional version of the model, GSMOI- CB (Table 2) (see Magnuson et al., 2003). Regional differences of uph*(A) were significant across the study area from the upper, oligohaline CB to the offshore MAB. up,,*@) increased with distance offshore. This trend of increasing aph*(A) can be explained by two factors: decreases of pigment packaging and increases in concentrations of accessory pigments (Yentsch and Phinney, 1989; Bricaud et ul., 1995). We also found significant seasonal differences in mean aphy@) in CB that we attributed primarily to changes in floral composition and associated changes in pigment packaging. Highest aph*@) occurred in spring when phytoplankton in CB consist primarily of large cells (i.e., centric diatoms) (Malone et al., 1988; Marshall and Nesius, 1996). Lowest a h ' @ ) occurred in summer when phytoplankton consist of a more diverse flora of smaller, flagellated cells (Malone et ul., 1991 ; Marshall and Nesius, 1996). Scdm exhibited an increasing trend with distance offshore, reflecting the decrease in the influence of terrigenous CDOM (Blough et ul., 1993; Nelson and Guarda, 1995; Vodecek et a/., 1997). Small, but significant differences in Sdm along the axis of CB reflected changes in the relative contributions of ut-00~ and a d to acdm.
Evaluation of chl a from OC4v.4, GSMOI, and GSMOI-CB for CB, inshore MAB, and offshore MAB showed that GSMOI-CB improved upon OC4v.4 in all regions (Table 3). The local parameterization was essential to improve performance in CB. Both GSMOI and GSMOl-CB showed improvement over OC4v.4 in the MAB where they specifically accounted for high absorption due to CDOM. Analysis of SeaWiFS products using each model supported results of evaluations using in-situ RRy as inputs, specifically that: (1) one or both of the semi-analytical models performed as well or better than OC4v.4; (2) both semi-analytical models clearly improved upon OC4v.4 in the offshore MAB (Fig. 6). Disagreement between the in-situ observations and model estimates for the inshore MAB likely reflect a sampling bias as in-situ observations were concentrated near the Chesapeake and Delaware Bay mouths where chl a are generally high, whereas mean chl u from SeaWiFS represented the entire inshore region. Disregarding in-situ values, both semi-analytical models returned much lower mean chl u for the inshore MAB than did OC4v.4, and GSMOl-CB chl a were lower than GSMOI chl a, consistent with results obtained using in-situ data as input to the models (Table 3). The semi-analytical models return estimates of ~ ~ ~ ( 4 4 3 ) and bbp(443) in addition to chl a. Estimates of acdn,(443) were closer to in-situ values than were estimates of chl a (Table 3). Meaningful evaluation of the bhp(443) product was not possible due to the lack of direct measurements of scattering. Relatively high uncertainties remained for all models, reflecting the difficulty of working in bio-optically complex waters. It is notable that the
Harding & Magnuson 6
performance of GSMO 1 was surprisingly good, considering the parameterizations differed significantly from bio-optical properties of CB. The relatively strong performance of GSMOl in CB likely reflects the robust tuning procedures used by Maritorena et al. (2002) to derive global parameters for GSMOI .
CONCLUSIONS
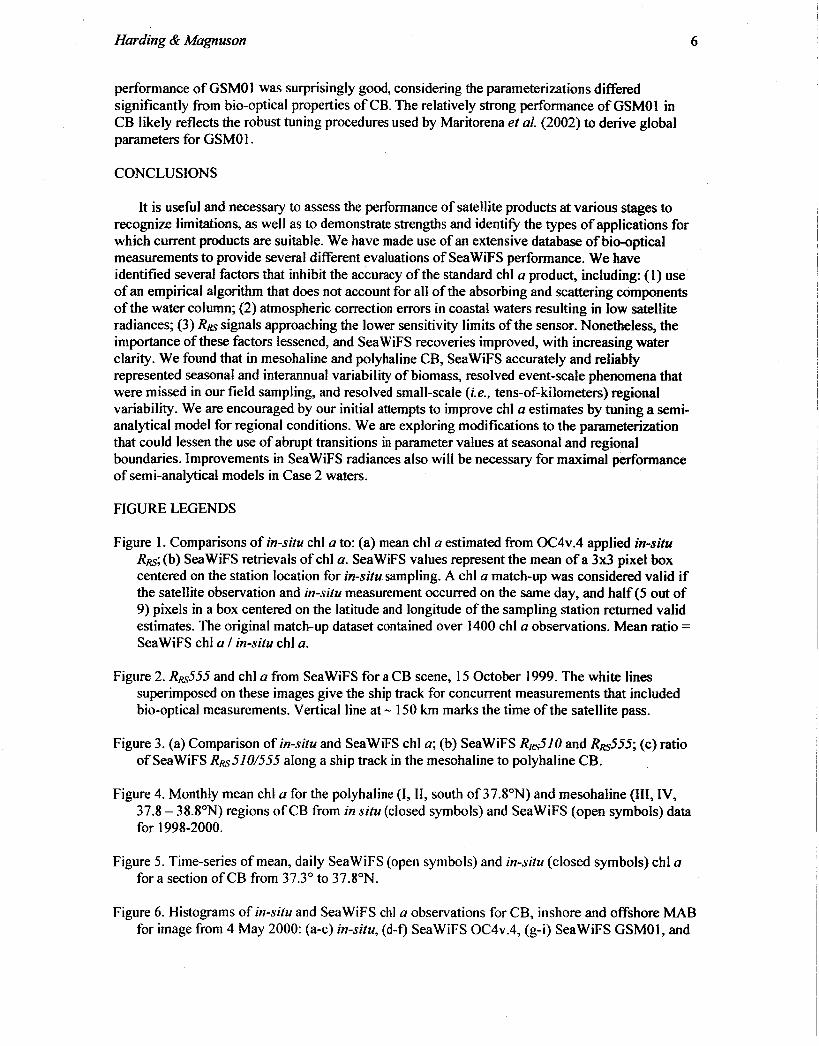
It is useful and necessary to assess the performance of satellite products at various stages to recognize limitations, as well as to demonstrate strengths and identify the types of applications for which current products are suitable. We have made use of an extensive database of bio-optical measurements to provide several different evaluations of SeaWiFS performance. We have identified several factors that inhibit the accuracy of the standard chl a product, including: (1) use of an empirical algorithm that does not account for all of the absorbing and scattering components of the water column; (2) atmospheric correction errors in coastal waters resulting in low satellite radiances; (3) RRS signals approaching the lower sensitivity limits of the sensor. Nonetheless, the importance of these factors lessened, and SeaWiFS recoveries improved, with increasing water clarity. We found that in mesohaline and polyhaline CB, SeaWiFS accurately and reliably represented seasonal and interannual variability of biomass, resolved event-scale phenomena that were missed in our field sampling, and resolved small-scale (i.e., tens-of-kilometers) regional variability. We are encouraged by our initial attempts to improve chl a estimates by tuning a semi- analytical model for regional conditions. We are exploring modifications to the parameterization that could lessen the use of abrupt transitions in parameter values at seasonal and regional boundaries. Improvements in SeaWiFS radiances also will be necessary for maximal performance of semi-analytical models in Case 2 waters.
FIGURE LEGENDS
Figure 1. Comparisons of in-situ chl a to: (a) mean chl a estimated from OC4v.4 applied in-situ Rm; (b) SeaWiFS retrievals of chl a. SeaWiFS values represent the mean of a 3x3 pixel box centered on the station location for in-situ sampling. A chl a match-up was considered valid if the satellite observation and in-situ measurement occurred on the same day, and half ( 5 out of 9) pixels in a box centered on the latitude and longitude of the sampling station returned valid estimates. The original match-up dataset contained over 1400 chl a observations. Mean ratio = SeaWiFS chl a I in-situ chl a.
Figure 2. Rm.555 and chl a from SeaWiFS for a CB scene, 1 5 October 1999. The white lines superimposed on these images give the ship track for concurrent measurements that included bio-optical measurements. Vertical line at - 150 km marks the time of the satellite pass.
Figure 3. (a) Comparison of in-situ and SeaWiFS chl a; (b) SeaWiFS Rm.520 and Rm555; (c) ratio of SeaWiFS Rm520/555 along a ship track in the mesohaline to polyhaline CB.
Figure 4. Monthly mean chl a for the polyhaline (I, 11, south of 37.8"N) and mesohaline (111, IV, 37.8 - 38.8"N) regions of CB from in situ (closed symbols) and SeaWiFS (open symbols) data for 1998-2000.
Figure 5. Time-series of mean, daily SeaWiFS (open symbols) and in-situ (closed symbols) chl a for a section of CB from 37.3" to 37.8"N.
Figure 6. Histograms of in-situ and SeaWiFS chl a observations for CB, inshore and offshore MAB for image from 4 May 2000: (a-c) in-situ, (d-f) SeaWiFS OC4v.4, (g-i) SeaWiFS GSMOI, and

Harding & Magnuson 7
6-1) SeaWiFS GSMOI -CB. In-situ data from the MAB were not available for this image. The inshore and offshore MAB histograms (b-c) reflect all field data available for those regions during May-September 1996- 1998.
REFERENCES
Blough, N.V., O.C. Zafirou, and J. Bonilla, 1993: Optical absorption spectra ofwaters from the Orinoco River outflow: terrestrial input of colored organic matter to the Caribbean. Journal of Geophysical Research 98,2,271-2,278.
Bricaud, A., M. Babin, A. Morel, & H. Claustre, 1995: Variability in the chlorophyll-specific absorption coefficients of natural phytoplankton: analysis and parameterization, Journal of Geophysical Research l?, 13,32 I - 13,332.
Gordon, H.R. and K. Ding. 1992. Self-shading of in-water optical instruments. Limnology and Ocemography., 37,49 1-500.
Kemp, W.M., & W.R. Boynton, 1984: Spatial and temporal coupling of nutrient inputs to estuarine primary production: the role of particulate transport and decomposition, Bulletin of Marine Science 35,242-247.
Harding, L.W., Jr., E.C. Itsweire, and W.E. Esaias, 1994: Estimates of phytoplankton biomass in the Chesapeake Bay from aircraft remote sensing of chl-a, 1989- 1992, Remote Sensing of Environment 49,4 1-56.
Harding, L.W., Jr., A. Magnuson, and M.E. Mallonee, 2003: Bio-Optical and Remote Sensing Observations in Chesapeake Bay, Estuarine, Comtal, and ShelfScience (in review).
Magnuson, A., L.W. Harding, Jr., M.E. Mallonee, and J.E. Adolf, 2003: Bio-optical modeling in the Middle Atlantic Bight, Estuarine, Coastal, and ShelfScience (to be submitted).
Malone, T.C., W.M. Kemp, H.W. Ducklow, W.R. Boynton, J.H. Tuttle, and R.B. Jonas, 1986: Lateral variation in the production and fate of phytoplankton in a partially stratified estuary, Marine Ecology Progress Series 32, 149- 160.
Malone, T.C., L.H. Crocker, S.E. Pike, and B.W. Wendler, 1988: Influences of river flow on the dynamics of phytoplankton production in a partially stratified estuary, Marine Ecology Progress Series 48,235-249.
Malone, T.C., H.W. Ducklow, E.R. Peele, and S.E. Pike, 1991: Picoplankton carbon flux in Chesapeake Bay, Marine Ecology Progress Series 78, 1 1-22.
Maritorena, S., D.A Siege], and A.R. Peterson, 2002: Optimization of a semianalytical ocean color model for global-scale applications, Applied Optics 41,2,705-2,7 14.
Marshall, H.G. and K.K. Nesius, 1996: Phytoplankton composition in relation to primary production in Chesapeake Bay, Marine Biology 125, 61 1-61 7.
Nelson, J.R. and S. Guarda, S. 1995: Particulate and dissolved spectral absorption on the continental shelf of the southeastern United States, Journal of Geophysical Research 100, 8,715-8,732.

Harding & Magnuson 8
O’Reilly, J.E., S. Maritorena, B.G. Mitchell, D.A. Siegel, K.L. Carder, S.A. Garver, M.Kahru, & C.R. McClain, 1998: Ocean color algorithms for SeaWiFS, Journal of Geophysical Research 103, 24,937-24,953.
O’Reilly, J.E. and J.A. Yoder, 2003: A comparison of SeaWiFS LAC Products ftom the Third and Fourth Reprocessing: Northeast US Ecosystem, in Algorithm U’ates for the Fourth SeaWiFS Data Reprocessing (S. B. Hooker & E. R Firestone, eds). NASA Tech. Memo. 2003-206892, NASA Goddard Space Flight Center, Greenbelt, MD, pp. 60-67.
Vodecek, A., N.V. Blough, M.D. DeGrandpre, E.T. Peltzer, and R.K. Nelson, 1997: Seasonal variation of CDOM and DOC in the Middle Atlantic Bight: Terrestrial inputs and photooxidation, Limnology and Oceanography 42,674-686.
Yentsch, C.S. and D.A. Phinney, 1989: A bridge between Ocean optics and microbial ecology, Limnology and Oceanography 34, 1,694- 1,705.
PEER REVIEWED PUBLICATIONS
Harding, L.W., W. . Miller, R.N. Swift, and C.W. Wright, 2001: Aircraft remote sensing, In: Steele, J., S. Thorpe, and K. Turekian, (eds.), Encyclopedia of Ocean Sciences, Academic Press, London, UK, 1 13- 122.
Harding, L.W., Jr., M.E. Mallonee, and E.S. Perry, 2002: Toward a predictive understanding of primary productivity in a temperate, partially stratified estuary, Estuarine, Coastal and Shelf Science 5 5 4 3 7-463.
Harding, L.W., Jr., A. Magnuson, and M.E. Mallonee, 2003: Bio-Optical and remote sensing observations in Chesapeake Bay, Estuarine, Coastal, and ShelfScience (in review).
Magnuson, A., L.W. Harding, Jr., M.E. Mallonee, and J.E. Adolf, 2003: Bio-optical modeling in the middle Atlantic bight, Estuarine, Coastal, and ShelfScience (to be submitted).
PRESENTATIONS
Harding, L.W., Jr., Seasonal and inter-annual variability of primary productivity in Chesapeake Bay from remotely sensed aircraft observations, at Phytoplankton Productivity - An Appreciation of 50 Years of the Study of Production in Oceans and Lakes, 19 March 2002, Bangor, Wales, United Kingdom.
Magnuson, A., L.W. Harding, Jr., and M.E. Mallonee, Progress toward a case I1 bio-optical algorithm optimized for Chesapeake Bay and the adjacent waters of the mid-Atlantic bight. Ocean Optics XVI, 18-22 November 2002, Sante Fe, NM.
Magnuson, A., L.W. Harding, Jr., M.E. Mallonee, and W.D. Miller, Comparison of In Situ radiometric measurements in turbid waters, poster presented at the 5th SIMBIOS Science Team Meeting, 15- 1 7 January 2002, Baltimore, MD.

Harding & Magnuson 9
100.0
10.0
1 .o
Chesapeake Bay mean ratio = 1.42 n = 262
0
13 ,-
.36
/ 0 0.1
0.1 1 .o 10.0 100.0
100.0
10.0
1 .o
Chesapeake Bay /
0.1 0.1
MAB mean ratio = 2.44 5 1 . 1 6 n = 6 (b
1 .o 10.0 100.0 In-situ chl a (mg m”)
Harding and Magnuson, Figure 1
H i d i n g & Magnuson 10
0.02
0.01
0 sr1
30
mg m-3
Harding and Magnuson, Figure 2

Harding & Magnuson 11
n 3 30 E g 20 W
Q 10
25
15 3 20 E a n I ’ 1u
0.015 1 1 . . ~ ~ 0.0
0 50 100 150 200 250 Distance along transect (km)
Harding and Magnuson, Figure 3

Harding & Magnuson 12
60
40
20
0
40 Region 11
30 ~ 1998 .
71 Region 111
-1 Region I1
Region 1l ( 0 1
Region I
J F M A M J J A S O N D J F M A M J J A S O N D J F M A M J J A S O N D
Month
Harding and Magnuson, Figure 4

Harding & Magnuson
30 20 10
-
13
I
-
-
-
n 3 E
E 20 -
Harding and Magnuson, Figure 5

Harding & Magnuson 14
4 May 2000 GSMOl
Mean=S.451
4Ooo
3ooo
2000
1000
0
Median -5.184
1000
800
600
400
200
0
C h e s p d e Bay Mean= 18.861 Median = 14.265 SD = 20.653 n- 1'770
Mean = 3.785' Median ~ 3 . 4 8 0 SD = 2.991 n = 35
40
30
m
10
0
14000
I2000
loo00
8Ooo
6Ooo
4000
2000
0
& MAB h h n - 1.682 Matim = 1.443 SD = 0.785 n = m S
M& =O.
n = 29376
9 9 9 0 - r Y
Log chl a Harding and Magnuson, Figure 6
Harding & Magnuson
Table 1. Status of the Chesapeake Bay data set submitted to SeaBASS. Numbers for 2003 are estimated based on cruises yet to be completed.
~~
Derived 1996 1997 1998 1999 2000 2001 2002 2003 Direct Measurements Products
82 93 83 44 40 25 39 25
79 32 130 66 46 27 32 25
79 32 130 66 46 27 32 25
323 709 591 514 330 189 182 60
I43 95 104 63 56 49 32 20
--- 30 55 49 43 26 31 20 --- --- 24 15 MicroTops --- --- --- ---
* MER wavebands 412,443,455,490,510,532,550,650,589,625,671,683,700 **MicroPro wavebands 400,412,443,455,490,510,532,555,565,590,625,670,684,700.
Direct Measurements Downwelling irradiance depth profiles Upwelling radiance depth profiles Incident irradiance Total particulate absorption (300-900 nm) of discrete samples by QFT Non-pigmented particulate absorption (300-900 nm) of discrete samples by QFT with MeOH extraction Colored dissolved absorption (1 90-820 nm) of discrete samples Determination of chl a for discrete samples by Turner fluorometry HPLC analysis for a suite of pigments SeaBird temperature and conductivity profiles
Derived Products RdO1J)
Kd (m,l), K, (m,A)
aph(z&
Remote sensing reflectance from calculated from radiancelirradiance profiles Attenuation coefficients for Ed(z,A) and L,,(z,A) for the surface mixed layer, calculated from radiancehrradiance profiles Pigmented particulate absorption (300-900 nm), calculated as a,(O,&- a d ( o , 4

m
Iz
m
m 9
*
e
W
0
N
8 v,
0
- * 9 0
m
v,
0
N
8 N
00
v,
m
8 v,
W
W 0
8
0
00
N
c
H
8 Iz
00
0
N
0
9
Iz
N
d
0
0
9
0
m 0
- 8 N
00 2
8 m
0
v,
N
0 9
m
N
- - 8 .- F k m
0
00 d
2 8 8 N
N
N
H
0
Iz d
0
8 00 0
N
e
9
0
m
v,
W c
8 m e
m
N
8 m
m
W
N
8 E 5 m
0
00
N
- 8 W
W
0
9
0
W
*
m 0
8 z! 3
8 N
Iz
$I
8 m
t- v, N
8 s N N 8 - - cd c4
0
m
00
13 8 00 00 ul - 8 m
d d
0
8 d
Iz
m
0
8 e 2
8 2
N
N
8 * 0 0
N
8 en E
m
.- k
0
v,
00
m
*
8 8 v,
00 N
N
m
0
W
0
8 d
W
2
8 00
m
N
.-
8 0
0
m
m
8 v, d
m
m
8 z L
E s cn
0
v,
00 m
- 8 N
N
0
- e 9
3
m
W
0
8 00
m
b, 8 W
N
00 3
8 0
00
0
m
0 9
00
m
Iz
N
8 - - cd L4
0
0
m
m
+
8 00
00
m
d
9
0
m
d d
0
8 d
Iz
m
0
0
9
m
Iz
N
0
c
9
2
N
N
8 e
0
0
N
8 00 E
m
.- &
0
0
m
m
4
8 v,
00
N
N
8 m
0
W
0
8 d
W
W - 8 0
0
m
N
H
8 0
0
Q\
m
8 v, d
m
m
8 E E I
cn
L
is 3
m
0
0
m
$I 8 8 2
- N *
o\
W
0
8 00
m
s 9 0
W
N
00
- 8 0
00
0
m
8 00
v,
Iz
N
8 - - cd c4
0
W
m
2
8 8 m
00
m
- m
m
2
9 0
N
e 0
d
0 9
34 0
W
8 m
00 z 8 m
e
2
8 2 5 0 E I - W
d 2 8 8 o\ d
m
d
0
N
z! 8 00
d 0
W
0 9
N
m
00 o\
8 00
b
W
s 0 e
m 2 0
H
E 0

E: 0
J
a2
U

REPORT DOCUMENTATION PAGE
Evaluation and Validation of Case 2 Algorithms in Chesapeake Bay
f o m Approved OMB No. 074-0188
6. AUTHOR@)
Harding, Lawrence W., Jr. Magnuson, Adrea
University of Maryland Center for Environmental Science (Horn Point Laboratory) PO Box 775 Cambridge, Maryland 21613
7. PERFORMING ORGANIZATION NAME(S) AND ADDRESS(ES)
1. AGENCY USE ONLY (Leave Maw
9. SPONSORING I MONITORING AGENCY NAME(S) AND ADDRESS(ES)
NASAIGoddard Space Flight Center Greenbelt Road, Code 210.5 Greenbelt, Maryland 20771
2. REPORT DATE 3. REPORT TYPE AND DATES COVERED 10- 14 -2003 Final 12-1-2001 - 11-30-2003
11. SUPPLEMENTARY NOTES
12a. DISTRIBUTION I AVAILABILITY STATEMENT
Unclassified Unlimited
5. FUNDING NUMBERS
NAS5-00195
1%. DISTRIBUTION CODE
E. PERFORMING ORGANIZATION REPORT NUMBER
14. SUBJECT TERMS
SEAWiFS, SIMBIOS, ocean optics, ocean color sensor validation
17. SECURITY CLASSIFICATION 18. SECURITY CLASSIFICATION 19. SECURITY CLASSIFICATION OF REPORT OF THIS PAGE OF ABSTRACT unclassified unclassified unclassified
10. SPONSORING I MONITORING AGENCY REPORT NUMBER
15. NUMBER OF PAGES 18
16.PRlCECODE
20. LIMITATION OF ABSTRACT
Unl imi t ed