evaluating the enforceability of texting laws - nhtsa · 2. government accession no. 3....
TRANSCRIPT
Evaluating the Enforceability of
Texting Laws: Strategies Tested in
Connecticut and Massachusetts
DISCLAIMER
This publication is distributed by the U.S. Department of Transportation, National Highway Traffic Safety Administration, in the interest of information exchange. The opinions, findings, and conclusions expressed in this publication are those of the authors and not necessarily those of the Department of Transportation or the National Highway Traffic Safety Administration. The United States Government assumes no liability for its content or use thereof. If trade or manufacturers’ names or products are mentioned, it is because they are considered essential to the object of the publication and should not be construed as an endorsement. The United States Government does not endorse products or manufacturers.
Suggested APA Format Citation:
Retting, R., Sprattler, K., Rothenberg, H., & Sexton, T. (2017, March). Evaluating the enforceability of texting laws: Strategies tested in Connecticut and Massachusetts (Report No. DOT HS 812 367). Washington, DC: National Highway Traffic Safety Administration.
i
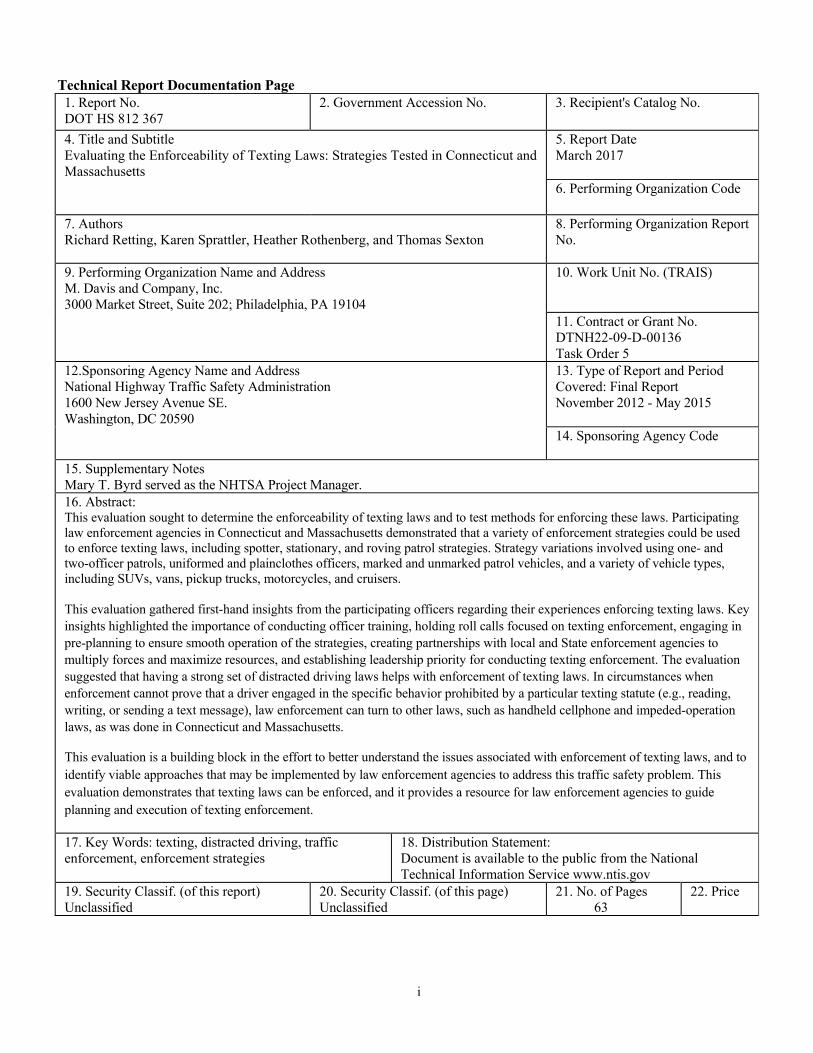
Technical Report Documentation Page 1. Report No. DOT HS 812 367
2. Government Accession No. 3. Recipient's Catalog No.
4. Title and Subtitle Evaluating the Enforceability of Texting Laws: Strategies Tested in Connecticut and Massachusetts
5. Report Date March 2017
6. Performing Organization Code
7. Authors Richard Retting, Karen Sprattler, Heather Rothenberg, and Thomas Sexton
8. Performing Organization Report No.
9. Performing Organization Name and Address M. Davis and Company, Inc. 3000 Market Street, Suite 202; Philadelphia, PA 19104
10. Work Unit No. (TRAIS)
11. Contract or Grant No. DTNH22-09-D-00136 Task Order 5
12.Sponsoring Agency Name and Address National Highway Traffic Safety Administration 1600 New Jersey Avenue SE. Washington, DC 20590
13. Type of Report and Period Covered: Final Report November 2012 - May 2015
14. Sponsoring Agency Code
15. Supplementary Notes Mary T. Byrd served as the NHTSA Project Manager. 16. Abstract: This evaluation sought to determine the enforceability of texting laws and to test methods for enforcing these laws. Participating law enforcement agencies in Connecticut and Massachusetts demonstrated that a variety of enforcement strategies could be used to enforce texting laws, including spotter, stationary, and roving patrol strategies. Strategy variations involved using one- and two-officer patrols, uniformed and plainclothes officers, marked and unmarked patrol vehicles, and a variety of vehicle types, including SUVs, vans, pickup trucks, motorcycles, and cruisers. This evaluation gathered first-hand insights from the participating officers regarding their experiences enforcing texting laws. Key insights highlighted the importance of conducting officer training, holding roll calls focused on texting enforcement, engaging in pre-planning to ensure smooth operation of the strategies, creating partnerships with local and State enforcement agencies to multiply forces and maximize resources, and establishing leadership priority for conducting texting enforcement. The evaluation suggested that having a strong set of distracted driving laws helps with enforcement of texting laws. In circumstances when enforcement cannot prove that a driver engaged in the specific behavior prohibited by a particular texting statute (e.g., reading, writing, or sending a text message), law enforcement can turn to other laws, such as handheld cellphone and impeded-operation laws, as was done in Connecticut and Massachusetts.
This evaluation is a building block in the effort to better understand the issues associated with enforcement of texting laws, and to identify viable approaches that may be implemented by law enforcement agencies to address this traffic safety problem. This evaluation demonstrates that texting laws can be enforced, and it provides a resource for law enforcement agencies to guide planning and execution of texting enforcement.
17. Key Words: texting, distracted driving, traffic enforcement, enforcement strategies
18. Distribution Statement: Document is available to the public from the National Technical Information Service www.ntis.gov
19. Security Classif. (of this report) Unclassified
20. Security Classif. (of this page) Unclassified
21. No. of Pages 63
22. Price
ii
CONTENTS
EXECUTIVE SUMMARY .............................................................................................................................................. iii
INTRODUCTION ............................................................................................................................................................. 1
METHODS ........................................................................................................................................................................ 2
1. Site Selection ......................................................................................................................................................... 2
2. Texting Enforcement Strategies ............................................................................................................................ 2
3. Law Enforcement Activity Data ............................................................................................................................ 3
4. Law Enforcement Recap Discussions ................................................................................................................... 4
5. Earned Media Activity .......................................................................................................................................... 4
6. Observations of Driver Use of Handheld Electronic Devices (“Texting”) ........................................................... 4
7. Public Awareness and Attitude Surveys ................................................................................................................ 7
RESULTS .......................................................................................................................................................................... 8
1. Law Enforcement Activity .................................................................................................................................... 8
2. Texting Enforcement Strategies .......................................................................................................................... 12
3. Law Enforcement Recap Discussions ................................................................................................................. 15
4. Earned Media Activity ........................................................................................................................................ 18
5. Observational Studies of Driver Use of Handheld Electronic Devices (“Texting”) ........................................... 21
6. Public Awareness and Attitudes Surveys ............................................................................................................ 24
DISCUSSION ................................................................................................................................................................. 25
LIMITATIONS ............................................................................................................................................................... 26
CONCLUSIONS ............................................................................................................................................................. 27
REFERENCES ................................................................................................................................................................ 28
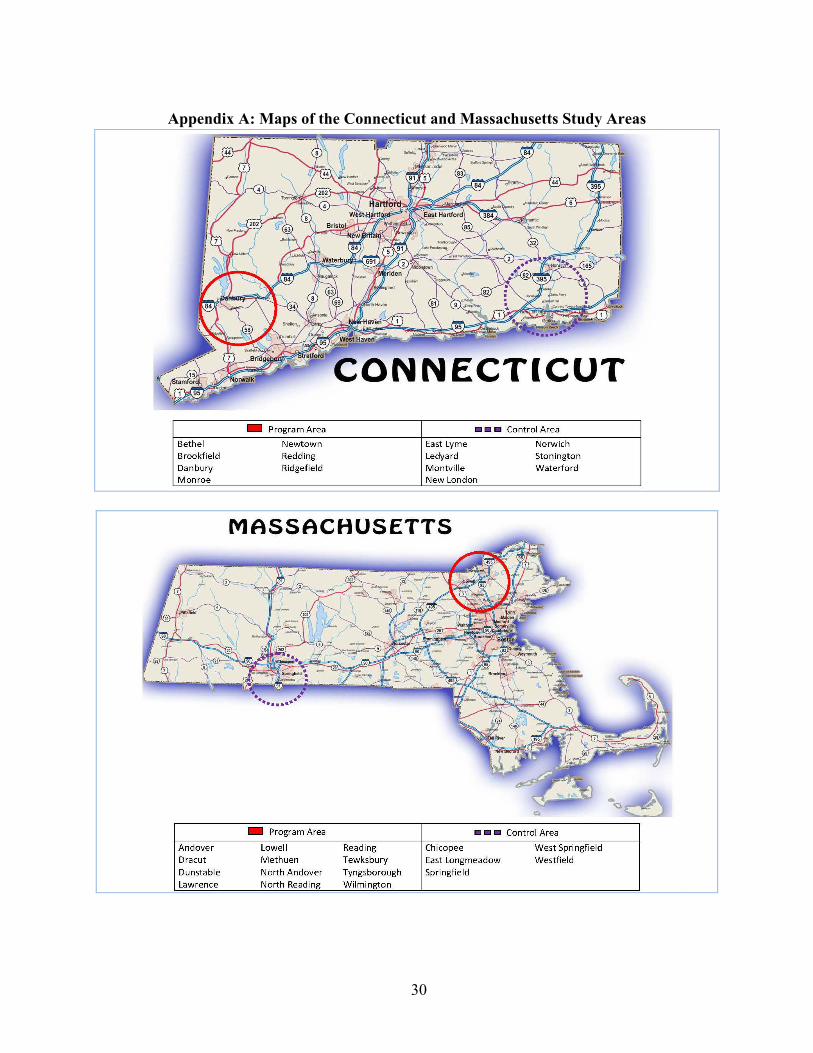
Appendix A: Maps of the Connecticut and Massachusetts Study Areas......................................................................... 30
Appendix B: Survey Administrator Screening Questionnaire ........................................................................................ 31
Appendix C: Responses to Intercept Survey Questions .................................................................................................. 33
Appendix D: Sites Used for Texting Observations ......................................................................................................... 48
Appendix E: Selected Examples of Earned Media .......................................................................................................... 50
iii
EXECUTIVE SUMMARY
The primary purpose of this evaluation was to determine the enforceability of texting laws and to test methods for enforcing these laws. Participating law enforcement agencies in Connecticut and Massachusetts demonstrated that a variety of enforcement strategies could be used to enforce texting laws, including spotter, stationary, and roving patrol strategies, with several different variations of each. Strategy variations involved using one- and two-officer patrols, uniformed and plainclothes officers, marked and unmarked patrol vehicles, and a variety of vehicle types, including SUVs, vans, pickup trucks, motorcycles, and cruisers.
Over four waves of enforcement in each State during 2013 and 2014, officers logged 7,300 hours and reported more than 8,700 citations for texting and other distracted driving offenses. The law enforcement activity was accompanied by earned media to generate public awareness of the enforcement effort.
Recap meetings were conducted after the enforcement waves to gather first-hand insights and lessons learned from the participating officers regarding their experiences enforcing texting laws. Key insights highlighted the importance of conducting officer training, holding roll calls focused on texting enforcement, engaging in pre-planning to ensure smooth operation of the strategies, creating partnerships with local and State enforcement agencies to multiply forces and maximize resources, and establishing leadership priority for conducting texting enforcement. The evaluation suggested that having a strong set of distracted driving laws helps with enforcement of texting laws. In circumstances when enforcement cannot prove a driver engaged in the specific behavior prohibited by a particular texting statute (e.g., reading, writing, or sending a text message), law enforcement can turn to other laws, such as handheld cellphone and impeded-operation laws, as was done in Connecticut and Massachusetts.
A secondary purpose of this evaluation was to measure the outcome of the enforcement and earned media activity on observed distracted driving behavior, self-reported behavior and public awareness. Observations of driver behavior conducted before and after each of the four activity waves in both States found no effect in almost all cases, with two apparent exceptions. The exceptions occurred in Wave 2, when there was a statistically significant decline in handheld phone use among male drivers in Connecticut, and in Wave 4, when there was a statistically significant decline in texting among female drivers and the total sample in Massachusetts.
The evaluation was designed to measure changes in public awareness associated with the program by conducting awareness surveys before and after each wave in the program and control areas in each State. However, awareness surveys were only conducted for the second half of the program because of delays in obtaining data collection clearance. For both Connecticut and Massachusetts, results of the awareness surveys from Waves 3 and 4 suggested the effect of the program on public awareness was limited, in which case it would require either more earned media or paid media to influence public awareness. However, the survey results are limited in what they communicate about the effectiveness of the overall program because baseline surveys were not administered before the program began.
This evaluation demonstrates that texting laws can be enforced in States with and without a handheld phone law, and it provides a resource for law enforcement agencies to guide planning and execution of texting enforcement.
1
INTRODUCTION
In 2014 there were 3,179 people who died and an estimated additional 431,000 people who were injured in motor vehicle crashes involving distracted drivers. Of the 2,955 fatal crashes in 2014 that involved distraction, 385 were specifically identified as involving drivers who were talking on, listening to, or manipulating cellphones (National Center for Statistics and Analysis, 2016). According to the nationally representative survey of distracted driving behavior conducted by the National Center for Statistics and Analysis, 2.2 percent of drivers were observed visibly manipulating handheld devices and 4.3 percent were observed holding cellphones to their ears while driving during a typical daylight moment in 2014 (Pickrell & KC, 2015). The NCSA estimates there were 13,665,865 drivers on the road in the United States during a typical daylight moment in 2014, which would be an estimate of 300,649 drivers visibly manipulating handheld devices and 587,632 drivers holding cellphones to their ears during a typical daylight moment in 2014.
As one countermeasure to reduce distracted driving, 46 States, the District of Columbia, Puerto Rico, Guam and the U.S. Virgin Islands have laws banning text messaging by drivers as of November 2016 (GHSA, 2016). There are fewer laws banning handheld phone use by drivers, with 14 States, the District of Columbia, Puerto Rico, Guam, and the U.S. Virgin Islands having such laws. Also according to Governors Highway Safety Association, 38 States and the District of Columbia ban all cellphone use for novice drivers.
Distracted driving laws vary across the States in what they prohibit, how they are written, and how they can be enforced. Some States have laws prohibiting drivers from talking on handheld phones whereas others do not; some laws apply only to vehicles in motion whereas others apply to drivers stopped in a travel lane. For texting laws specifically, some specify particular behaviors, such as reading, writing or sending a text message, but don’t include the many other actions that could be completed on a handheld device, such as dialing a phone number, searching the Internet or emailing. Texting laws like this require enforcement to differentiate between particular actions, a requirement identified as challenging by States in the 2012 GHSA Distracted Driving Survey (GHSA, 2013). For example, Indiana reported, “Yes. It is being enforced, but lightly. Many officers are reluctant to enforce it because they claim they cannot tell if someone is dialing a number or texting,” Georgia reported “Yes. It is being enforced, however not pervasively because it is difficult to determine a person’s age in the case of the all cellphone ban for persons 18 and under and difficult to determine if a person is texting or making a call if over 18,” and Massachusetts reported, “Yes. Law enforcement is doing the best they can, considering it is difficult to tell whether a driver is texting or dialing a phone number.” The GHSA survey suggests States have encountered challenges enforcing distracted driving laws, which may, at least partially, explain why respondents to NHTSA’s 2012 National Survey on Distracted Driving Attitudes and Behaviors reported low awareness of distracted driving enforcement (Schroeder, Meyers, & Kostyniuk, 2013).
In 2010 and 2011, NHTSA worked with Connecticut and New York to implement high-visibility enforcement (HVE) programs to combat handheld cellphone use among drivers (Cosgrove, Chaudhary, & Roberts, 2010). While the program was primarily concerned with enforcing and reducing handheld cellphone use, the scope also included some efforts to enforce and reduce texting among drivers. Of many findings, the program revealed that new enforcement strategies were needed to enforce texting laws because of challenges with enforcing these laws, such as difficulties with observing the offense. This finding suggests a need to identify additional strategies to address the enforcement of texting laws.
A major goal of this evaluation project was to identify and test a variety of strategies to enforce State driver texting laws. Connecticut and Massachusetts implemented these strategies through enforcement demonstration programs.
2
METHODS
1. Site Selection
Massachusetts and Connecticut were selected for Cooperative Agreements with NHTSA to implement this texting enforcement demonstration project. NHTSA and its evaluation contractor worked with each State to identify suitable program and control areas. Primary considerations were population size and demographics that provided reasonable comparability of the program and control areas, as well as a requirement that the program and control areas within each State be located in separate media markets. The NHTSA team selected the following program and control areas (see Appendix A for maps).
In Connecticut: The program area consisted of 7 towns in Fairfield County.
-Bethel -Monroe -Ridgefield -Brookfield -Newtown -Danbury -Redding
The control area consisted of 8 towns in the New London area.
-East Lyme -Montville -Stonington -Groton -New London -Waterford -Ledyard -Norwich
In Massachusetts: The program area consisted of 12 cities and towns that comprise Station A-1 (Andover) of Troop A of the Massachusetts State Police (MSP).
-Andover -Lowell -Reading -Dracut -Methuen -Tewksbury -Dunstable -North Andover -Tyngsborough -Lawrence -North Reading -Wilmington
The control area consisted of Chicopee and Springfield.
The 2010 Census population counts for the program and control areas were 196,764 (Connecticut program), 426,557 (Massachusetts program), 200,071 (Connecticut control), and 208,358 (Massachusetts control).
2. Texting Enforcement Strategies
The research team worked closely with Connecticut and Massachusetts law enforcement officials to identify and evaluate various strategies for police to enforce State laws regulating driver texting. The process began with a series of discussions in each State, in which respective State and local law enforcement agencies discussed potential advantages
3
and disadvantages of various strategies to observe and enforce texting laws. The next step was to employ these law enforcement strategies during each activity wave, which ranged in duration from one to four weeks. Finally, following each activity wave, recap discussions were held with law enforcement officials in each State – including line officers directly engaged in the enforcement activity – to assess officer experience with the various strategies and to develop recommendations for future enforcement efforts.
There were important differences between Connecticut and Massachusetts with regard to State distracted driving laws that affected the respective law enforcement strategies and enforcement practices. At the time the project was conducted, Connecticut law banned drivers from talking on handheld phones, whereas in Massachusetts, drivers were permitted to talk on handheld phones (with the exception of junior operators). Another difference was that during Wave 1, the Connecticut texting ban applied only to vehicles in motion, whereas the Massachusetts texting ban also applied to drivers stopped in travel lanes (e.g., waiting at red lights). During Wave 2, following a law change in Connecticut, the texting ban in both States applied to drivers stopped in travel lanes.
3. Law Enforcement Activity Data
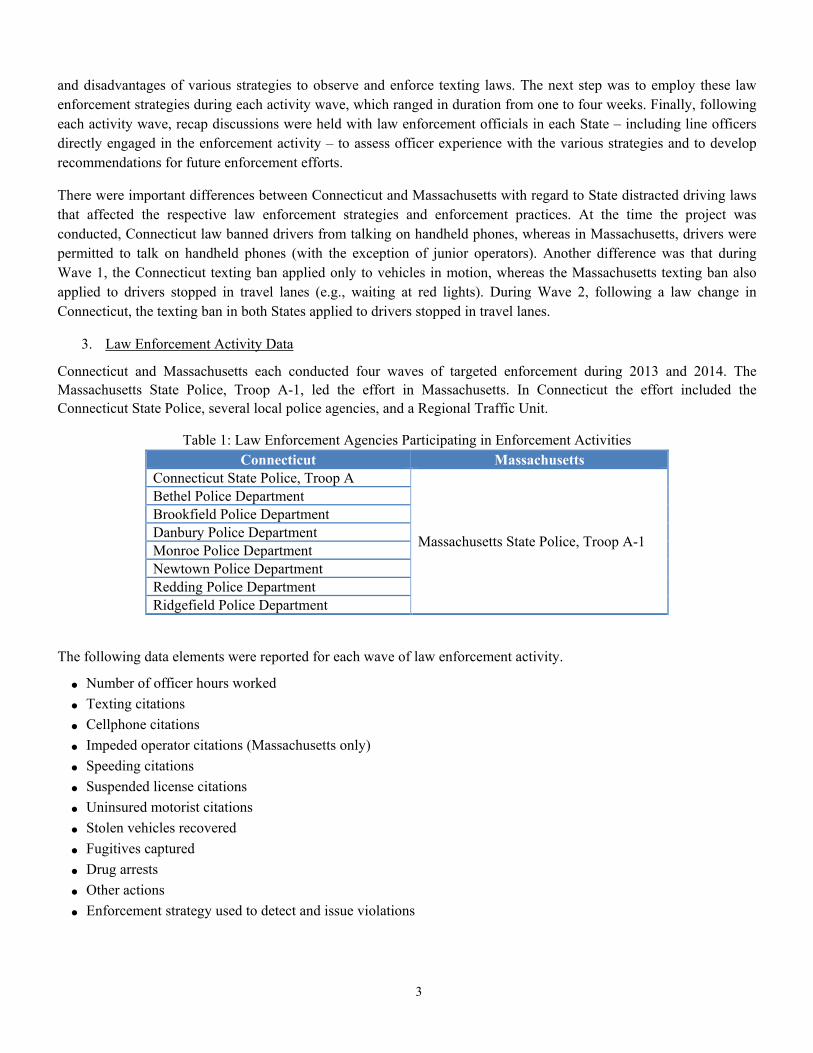
Connecticut and Massachusetts each conducted four waves of targeted enforcement during 2013 and 2014. The Massachusetts State Police, Troop A-1, led the effort in Massachusetts. In Connecticut the effort included the Connecticut State Police, several local police agencies, and a Regional Traffic Unit.
Table 1: Law Enforcement Agencies Participating in Enforcement Activities Connecticut Massachusetts
Connecticut State Police, Troop A
Massachusetts State Police, Troop A-1
Bethel Police Department Brookfield Police Department Danbury Police Department Monroe Police Department Newtown Police Department Redding Police Department Ridgefield Police Department
The following data elements were reported for each wave of law enforcement activity.
• Number of officer hours worked • Texting citations • Cellphone citations • Impeded operator citations (Massachusetts only) • Speeding citations • Suspended license citations • Uninsured motorist citations • Stolen vehicles recovered • Fugitives captured • Drug arrests • Other actions • Enforcement strategy used to detect and issue violations
4
In addition to reporting the numbers of citations, arrests, and other law enforcement actions, the team computed hourly rates based on the reported numbers of patrol hours, as well as the number of citations per 10,000 population based on data from the 2010 Census for each respective State.
4. Law Enforcement Recap Discussions
Recap discussions were held in Connecticut and Massachusetts following the law enforcement mobilizations. The purpose of the recap discussions was to collect first-hand insights and lessons learned from participating law enforcement officers and supervisors regarding the strategies tested during each activity wave. Earned media efforts undertaken by law enforcement agencies and the respective State Highway Safety Offices were also reviewed during the recap discussions.
5. Earned Media Activity
The Connecticut and Massachusetts texting enforcement programs included the use of NHTSA-prepared earned media material in both English and Spanish designed to increase public awareness of the texting enforcement activity. The program did not include paid media. The State Highway Safety Offices provided information regarding the types of media messages used for each mobilization.
6. Observations of Driver Use of Handheld Electronic Devices (“Texting”)
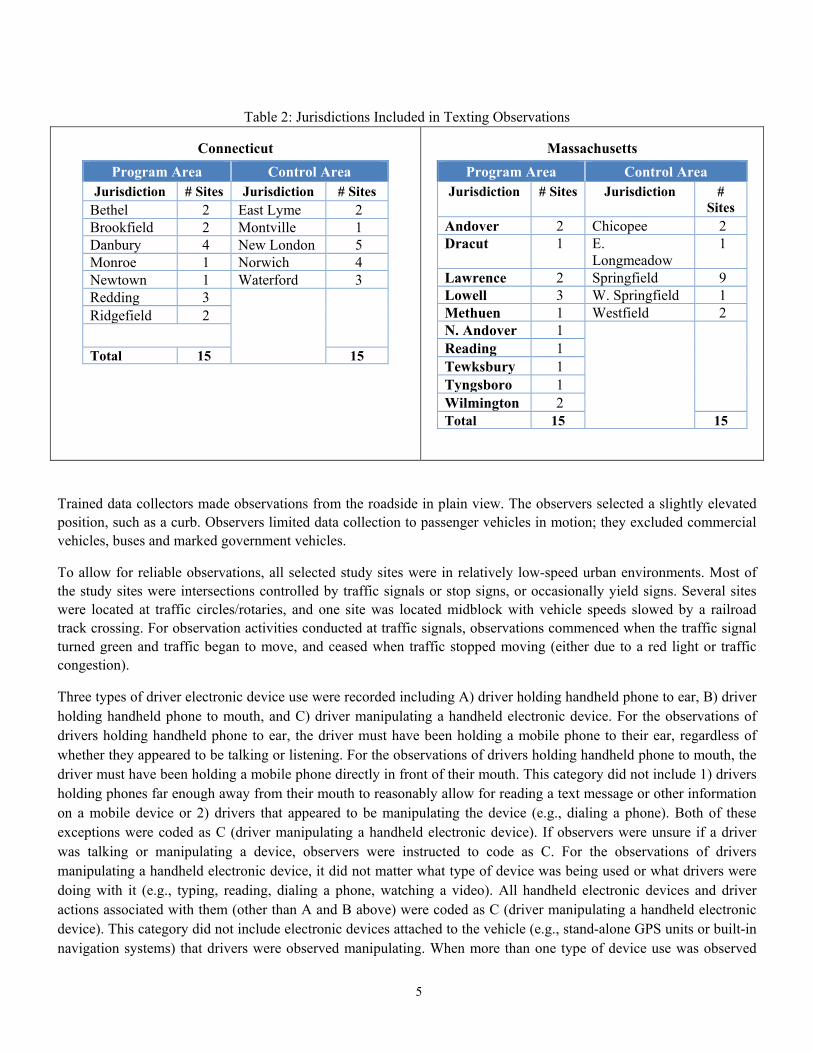
To estimate change in observed texting behavior before and after the activity waves, field observations were conducted at 30 Connecticut and 30 Massachusetts sites, with 15 program and 15 control sites for each State (see Table 2).
To identify potential data collection sites, the evaluation team contacted traffic engineers at the State Departments of Transportation in Connecticut and Massachusetts to obtain traffic volume data for roads in the respective program and control areas. The team reviewed traffic volume data for cities and towns in each of the program and control areas and selected roads in each community with the highest traffic volumes (typically 10,000 to 20,000 vehicles per day). Members of the team drove along each of these roads to identify specific intersections where observations of driver behavior could be conducted safely and effectively (see Appendix D for sites).
5
Table 2: Jurisdictions Included in Texting Observations
Connecticut Program Area Control Area
Jurisdiction # Sites Jurisdiction # Sites Bethel 2 East Lyme 2 Brookfield 2 Montville 1 Danbury 4 New London 5 Monroe 1 Norwich 4 Newtown 1 Waterford 3 Redding 3 Ridgefield 2
Total 15 15
Massachusetts
Program Area Control Area Jurisdiction # Sites Jurisdiction #
Sites Andover 2 Chicopee 2 Dracut 1 E.
Longmeadow 1
Lawrence 2 Springfield 9 Lowell 3 W. Springfield 1 Methuen 1 Westfield 2 N. Andover 1 Reading 1 Tewksbury 1 Tyngsboro 1 Wilmington 2 Total 15 15
Trained data collectors made observations from the roadside in plain view. The observers selected a slightly elevated position, such as a curb. Observers limited data collection to passenger vehicles in motion; they excluded commercial vehicles, buses and marked government vehicles.
To allow for reliable observations, all selected study sites were in relatively low-speed urban environments. Most of the study sites were intersections controlled by traffic signals or stop signs, or occasionally yield signs. Several sites were located at traffic circles/rotaries, and one site was located midblock with vehicle speeds slowed by a railroad track crossing. For observation activities conducted at traffic signals, observations commenced when the traffic signal turned green and traffic began to move, and ceased when traffic stopped moving (either due to a red light or traffic congestion).
Three types of driver electronic device use were recorded including A) driver holding handheld phone to ear, B) driver holding handheld phone to mouth, and C) driver manipulating a handheld electronic device. For the observations of drivers holding handheld phone to ear, the driver must have been holding a mobile phone to their ear, regardless of whether they appeared to be talking or listening. For the observations of drivers holding handheld phone to mouth, the driver must have been holding a mobile phone directly in front of their mouth. This category did not include 1) drivers holding phones far enough away from their mouth to reasonably allow for reading a text message or other information on a mobile device or 2) drivers that appeared to be manipulating the device (e.g., dialing a phone). Both of these exceptions were coded as C (driver manipulating a handheld electronic device). If observers were unsure if a driver was talking or manipulating a device, observers were instructed to code as C. For the observations of drivers manipulating a handheld electronic device, it did not matter what type of device was being used or what drivers were doing with it (e.g., typing, reading, dialing a phone, watching a video). All handheld electronic devices and driver actions associated with them (other than A and B above) were coded as C (driver manipulating a handheld electronic device). This category did not include electronic devices attached to the vehicle (e.g., stand-alone GPS units or built-in navigation systems) that drivers were observed manipulating. When more than one type of device use was observed
6
(e.g., driver observed talking on the phone while manipulating a handheld device) all observed uses were coded. Observers were instructed to record the first action of the driver that they observed. For example, if a driver was not using an electronic device at the start of observation and then began to use one, the observers would record “no device used.”
To simplify the data reporting and analysis, the results tables combine the two categories of drivers observed talking on handheld cellphones (A and B). The vast majority of observed cellphone use (about 75% in Connecticut and 90% in Massachusetts) consisted of drivers holding handheld phone to the ear.
Observers recorded driver gender during all study waves. For the Wave 1 pre-wave data collection period in Massachusetts (the first set of observations conducted for this project), observers also recorded the vehicle type (passenger car, passenger van, SUV, pickup), estimated driver age (16-24, 25-69, 70+), and whether or not a front-seat passenger was present. A subsequent change in data collection protocol for the remainder of the project eliminated the collection of these additional variables to substantially increase the total number of observations.
The same group of three observers collected data in both States. As a quality control measure, the same observer collected data at each site during both the day and at night and the pre and post periods. In addition, during each wave, the same observers were used in both the program and control areas. All data were collected on weekdays. Data collectors recorded their observations for a minimum of 1 hour over a 2-week period immediately preceding and following each activity wave.
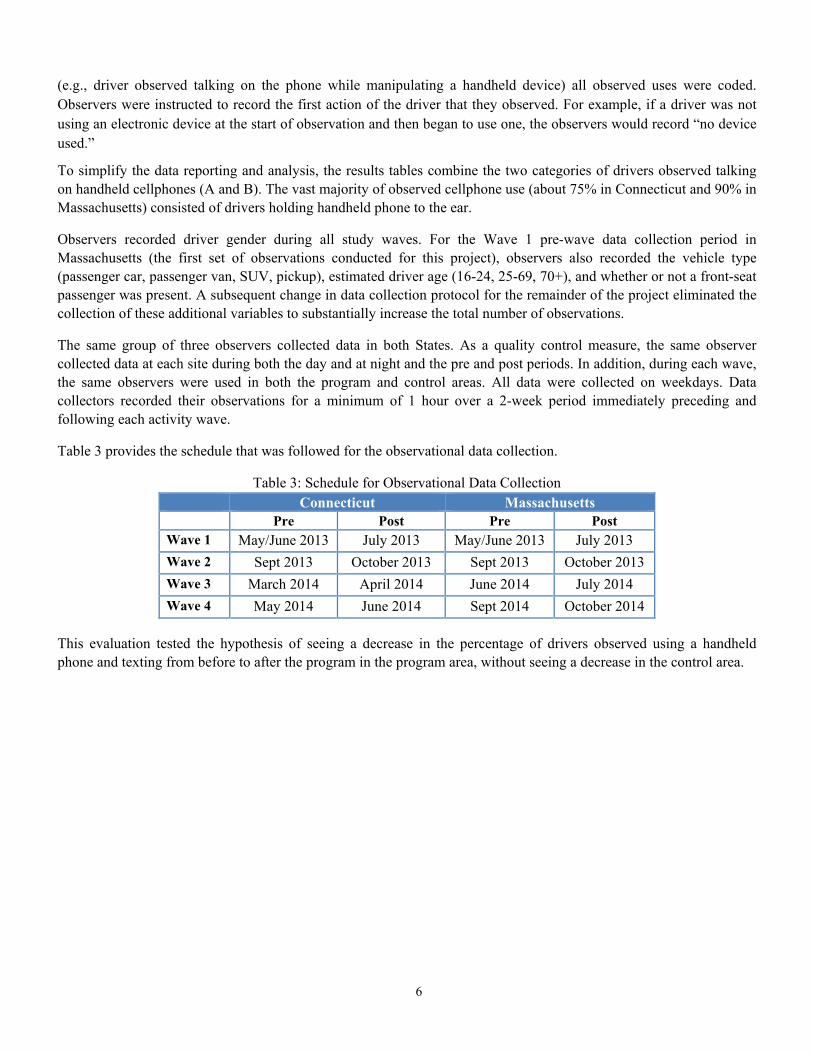
Table 3 provides the schedule that was followed for the observational data collection.
Table 3: Schedule for Observational Data Collection Connecticut Massachusetts
Pre Post Pre Post Wave 1 May/June 2013 July 2013 May/June 2013 July 2013 Wave 2 Sept 2013 October 2013 Sept 2013 October 2013 Wave 3 March 2014 April 2014 June 2014 July 2014 Wave 4 May 2014 June 2014 Sept 2014 October 2014
This evaluation tested the hypothesis of seeing a decrease in the percentage of drivers observed using a handheld phone and texting from before to after the program in the program area, without seeing a decrease in the control area.
7
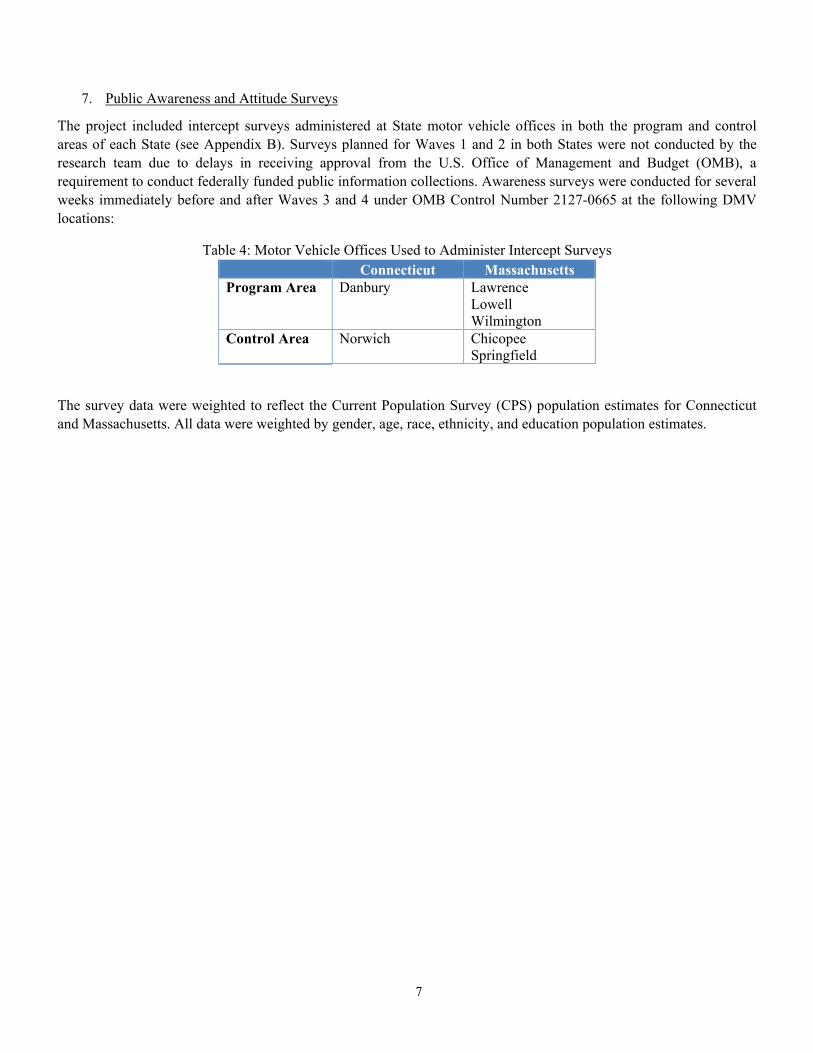
7. Public Awareness and Attitude Surveys
The project included intercept surveys administered at State motor vehicle offices in both the program and control areas of each State (see Appendix B). Surveys planned for Waves 1 and 2 in both States were not conducted by the research team due to delays in receiving approval from the U.S. Office of Management and Budget (OMB), a requirement to conduct federally funded public information collections. Awareness surveys were conducted for several weeks immediately before and after Waves 3 and 4 under OMB Control Number 2127-0665 at the following DMV locations:
Table 4: Motor Vehicle Offices Used to Administer Intercept Surveys Connecticut Massachusetts
Program Area Danbury Lawrence Lowell Wilmington
Control Area Norwich Chicopee Springfield
The survey data were weighted to reflect the Current Population Survey (CPS) population estimates for Connecticut and Massachusetts. All data were weighted by gender, age, race, ethnicity, and education population estimates.
8
RESULTS
1. Law Enforcement Activity
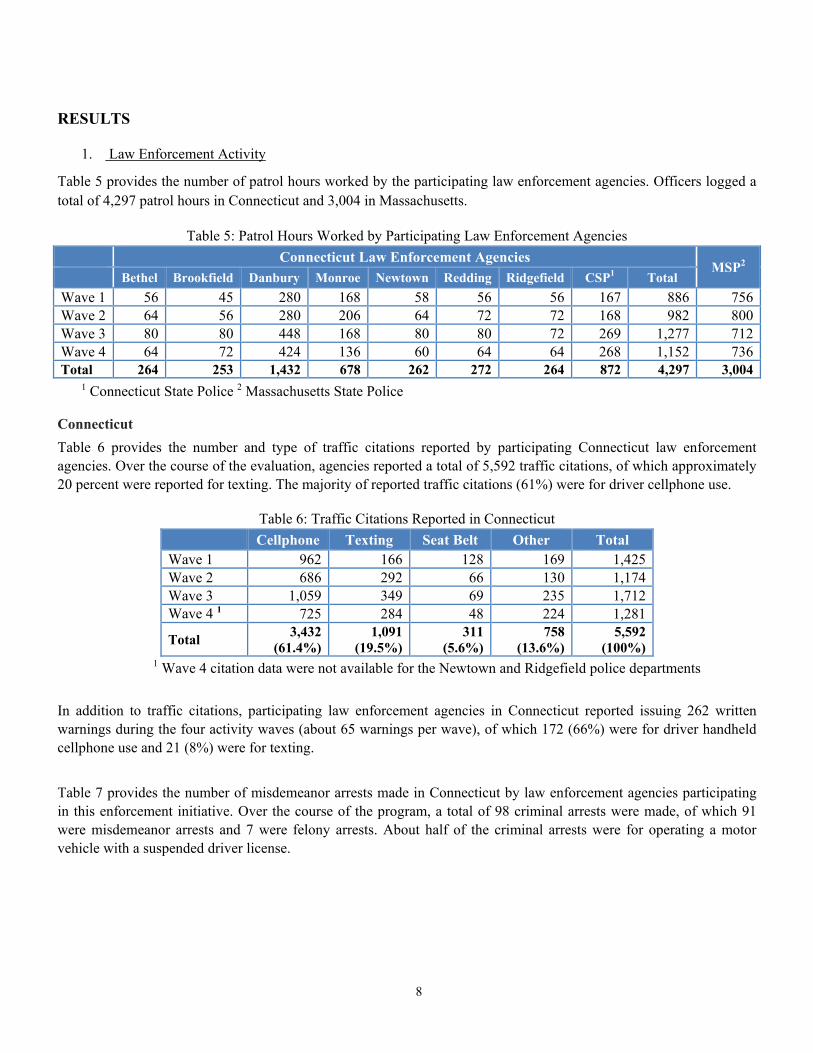
Table 5 provides the number of patrol hours worked by the participating law enforcement agencies. Officers logged a total of 4,297 patrol hours in Connecticut and 3,004 in Massachusetts.
Table 5: Patrol Hours Worked by Participating Law Enforcement Agencies Connecticut Law Enforcement Agencies
MSP2 Bethel Brookfield Danbury Monroe Newtown Redding Ridgefield CSP1 Total Wave 1 56 45 280 168 58 56 56 167 886 756 Wave 2 64 56 280 206 64 72 72 168 982 800 Wave 3 80 80 448 168 80 80 72 269 1,277 712 Wave 4 64 72 424 136 60 64 64 268 1,152 736 Total 264 253 1,432 678 262 272 264 872 4,297 3,004
1 Connecticut State Police 2 Massachusetts State Police
Connecticut Table 6 provides the number and type of traffic citations reported by participating Connecticut law enforcement agencies. Over the course of the evaluation, agencies reported a total of 5,592 traffic citations, of which approximately 20 percent were reported for texting. The majority of reported traffic citations (61%) were for driver cellphone use.
Table 6: Traffic Citations Reported in Connecticut Cellphone Texting Seat Belt Other Total Wave 1 962 166 128 169 1,425 Wave 2 686 292 66 130 1,174 Wave 3 1,059 349 69 235 1,712 Wave 4 1 725 284 48 224 1,281
Total 3,432 (61.4%)
1,091 (19.5%)
311 (5.6%)
758 (13.6%)
5,592 (100%)
1 Wave 4 citation data were not available for the Newtown and Ridgefield police departments
In addition to traffic citations, participating law enforcement agencies in Connecticut reported issuing 262 written warnings during the four activity waves (about 65 warnings per wave), of which 172 (66%) were for driver handheld cellphone use and 21 (8%) were for texting.
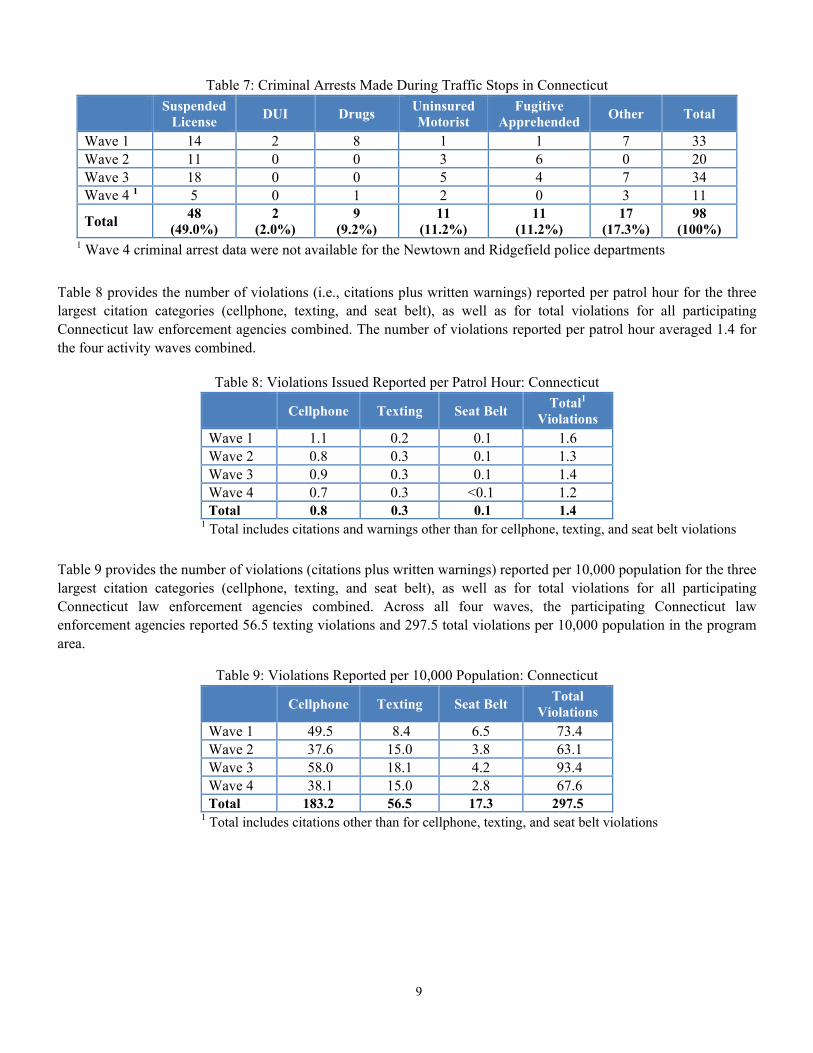
Table 7 provides the number of misdemeanor arrests made in Connecticut by law enforcement agencies participating in this enforcement initiative. Over the course of the program, a total of 98 criminal arrests were made, of which 91 were misdemeanor arrests and 7 were felony arrests. About half of the criminal arrests were for operating a motor vehicle with a suspended driver license.
9
Table 7: Criminal Arrests Made During Traffic Stops in Connecticut Suspended
License DUI Drugs Uninsured Motorist
Fugitive Apprehended Other Total
Wave 1 14 2 8 1 1 7 33 Wave 2 11 0 0 3 6 0 20 Wave 3 18 0 0 5 4 7 34 Wave 4 1 5 0 1 2 0 3 11
Total 48 (49.0%)
2 (2.0%)
9 (9.2%)
11 (11.2%)
11 (11.2%)
17 (17.3%)
98 (100%)
1 Wave 4 criminal arrest data were not available for the Newtown and Ridgefield police departments
Table 8 provides the number of violations (i.e., citations plus written warnings) reported per patrol hour for the three largest citation categories (cellphone, texting, and seat belt), as well as for total violations for all participating Connecticut law enforcement agencies combined. The number of violations reported per patrol hour averaged 1.4 for the four activity waves combined.
Table 8: Violations Issued Reported per Patrol Hour: Connecticut Cellphone Texting Seat Belt Total1
Violations Wave 1 1.1 0.2 0.1 1.6 Wave 2 0.8 0.3 0.1 1.3 Wave 3 0.9 0.3 0.1 1.4 Wave 4 0.7 0.3 <0.1 1.2 Total 0.8 0.3 0.1 1.4
1 Total includes citations and warnings other than for cellphone, texting, and seat belt violations
Table 9 provides the number of violations (citations plus written warnings) reported per 10,000 population for the three largest citation categories (cellphone, texting, and seat belt), as well as for total violations for all participating Connecticut law enforcement agencies combined. Across all four waves, the participating Connecticut law enforcement agencies reported 56.5 texting violations and 297.5 total violations per 10,000 population in the program area.
Table 9: Violations Reported per 10,000 Population: Connecticut Cellphone Texting Seat Belt Total
Violations Wave 1 49.5 8.4 6.5 73.4 Wave 2 37.6 15.0 3.8 63.1 Wave 3 58.0 18.1 4.2 93.4 Wave 4 38.1 15.0 2.8 67.6 Total 183.2 56.5 17.3 297.5
1 Total includes citations other than for cellphone, texting, and seat belt violations
10
Massachusetts
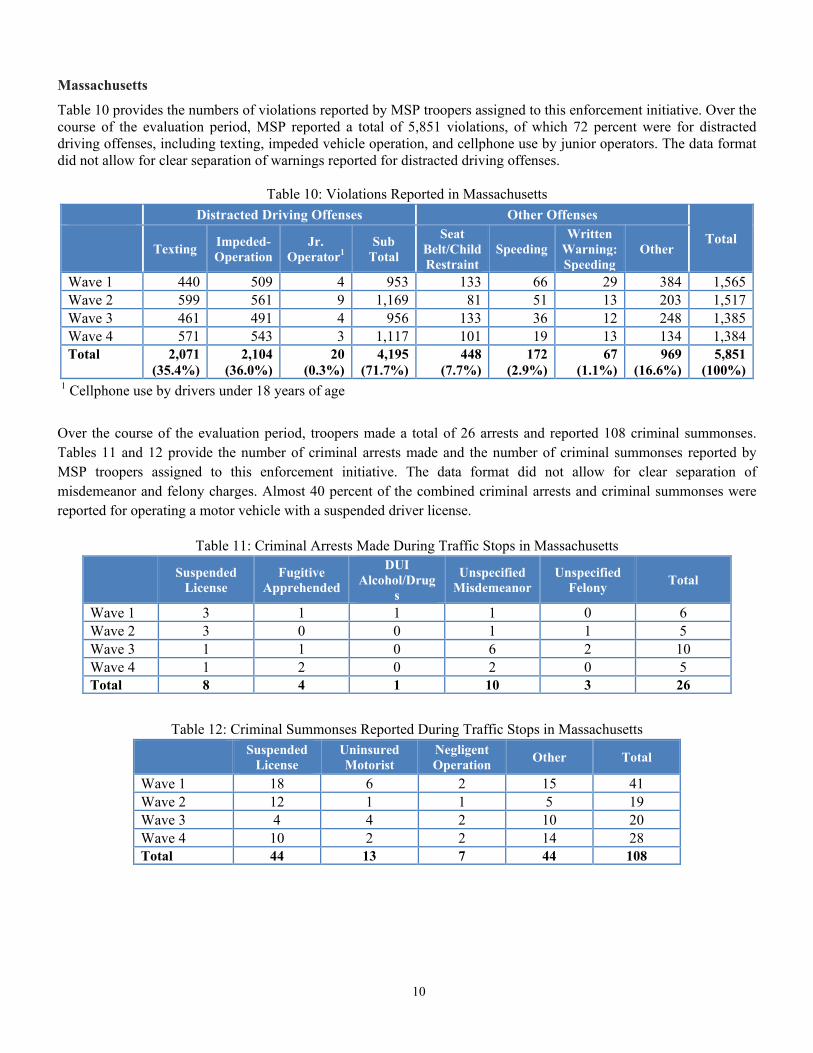
Table 10 provides the numbers of violations reported by MSP troopers assigned to this enforcement initiative. Over the course of the evaluation period, MSP reported a total of 5,851 violations, of which 72 percent were for distracted driving offenses, including texting, impeded vehicle operation, and cellphone use by junior operators. The data format did not allow for clear separation of warnings reported for distracted driving offenses.
Table 10: Violations Reported in Massachusetts Distracted Driving Offenses Other Offenses
Total Texting Impeded-
Operation Jr.
Operator1 Sub
Total
Seat Belt/Child Restraint
Speeding Written
Warning: Speeding
Other
Wave 1 440 509 4 953 133 66 29 384 1,565 Wave 2 599 561 9 1,169 81 51 13 203 1,517 Wave 3 461 491 4 956 133 36 12 248 1,385 Wave 4 571 543 3 1,117 101 19 13 134 1,384 Total 2,071
(35.4%) 2,104
(36.0%) 20
(0.3%) 4,195
(71.7%) 448
(7.7%) 172
(2.9%) 67
(1.1%) 969
(16.6%) 5,851
(100%) 1 Cellphone use by drivers under 18 years of age
Over the course of the evaluation period, troopers made a total of 26 arrests and reported 108 criminal summonses. Tables 11 and 12 provide the number of criminal arrests made and the number of criminal summonses reported by MSP troopers assigned to this enforcement initiative. The data format did not allow for clear separation of misdemeanor and felony charges. Almost 40 percent of the combined criminal arrests and criminal summonses were reported for operating a motor vehicle with a suspended driver license.
Table 11: Criminal Arrests Made During Traffic Stops in Massachusetts Suspended
License Fugitive
Apprehended
DUI Alcohol/Drug
s
Unspecified Misdemeanor
Unspecified Felony Total
Wave 1 3 1 1 1 0 6 Wave 2 3 0 0 1 1 5 Wave 3 1 1 0 6 2 10 Wave 4 1 2 0 2 0 5 Total 8 4 1 10 3 26
Table 12: Criminal Summonses Reported During Traffic Stops in Massachusetts
Suspended License
Uninsured Motorist
Negligent Operation Other Total
Wave 1 18 6 2 15 41 Wave 2 12 1 1 5 19 Wave 3 4 4 2 10 20 Wave 4 10 2 2 14 28 Total 44 13 7 44 108
11
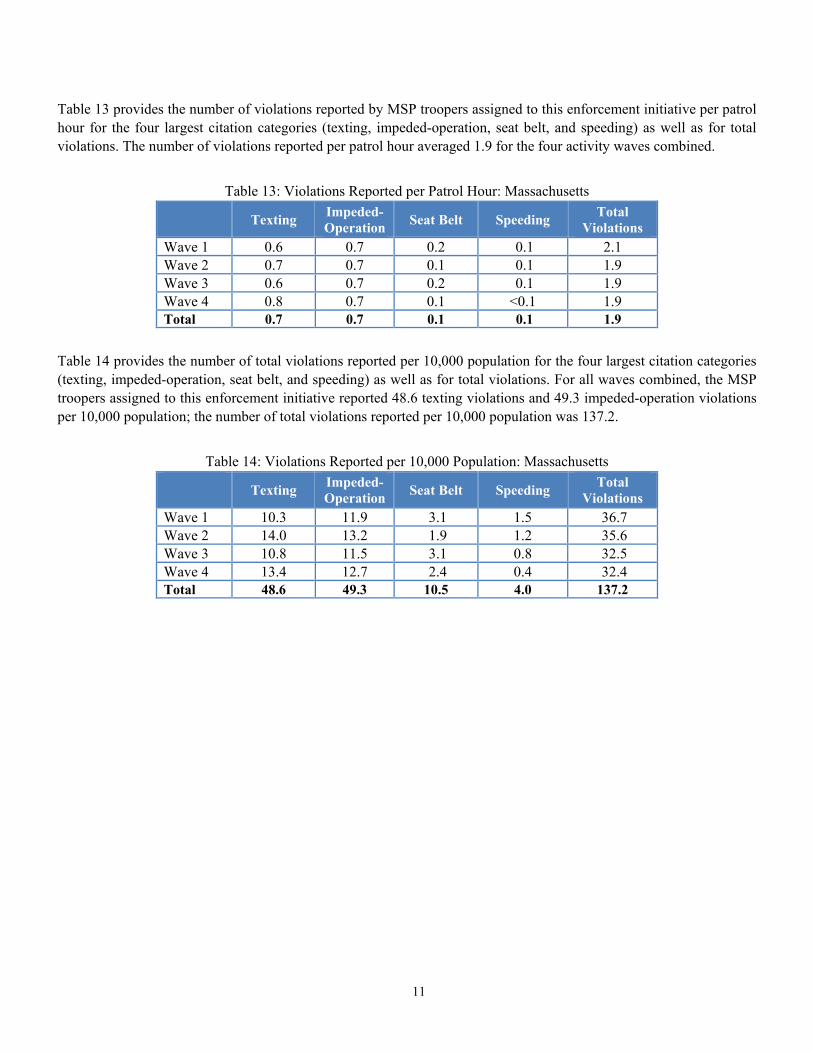
Table 13 provides the number of violations reported by MSP troopers assigned to this enforcement initiative per patrol hour for the four largest citation categories (texting, impeded-operation, seat belt, and speeding) as well as for total violations. The number of violations reported per patrol hour averaged 1.9 for the four activity waves combined.
Table 13: Violations Reported per Patrol Hour: Massachusetts
Texting Impeded-Operation Seat Belt Speeding Total
Violations Wave 1 0.6 0.7 0.2 0.1 2.1 Wave 2 0.7 0.7 0.1 0.1 1.9 Wave 3 0.6 0.7 0.2 0.1 1.9 Wave 4 0.8 0.7 0.1 <0.1 1.9 Total 0.7 0.7 0.1 0.1 1.9
Table 14 provides the number of total violations reported per 10,000 population for the four largest citation categories (texting, impeded-operation, seat belt, and speeding) as well as for total violations. For all waves combined, the MSP troopers assigned to this enforcement initiative reported 48.6 texting violations and 49.3 impeded-operation violations per 10,000 population; the number of total violations reported per 10,000 population was 137.2.
Table 14: Violations Reported per 10,000 Population: Massachusetts
Texting Impeded-Operation Seat Belt Speeding Total
Violations Wave 1 10.3 11.9 3.1 1.5 36.7 Wave 2 14.0 13.2 1.9 1.2 35.6 Wave 3 10.8 11.5 3.1 0.8 32.5 Wave 4 13.4 12.7 2.4 0.4 32.4 Total 48.6 49.3 10.5 4.0 137.2
12
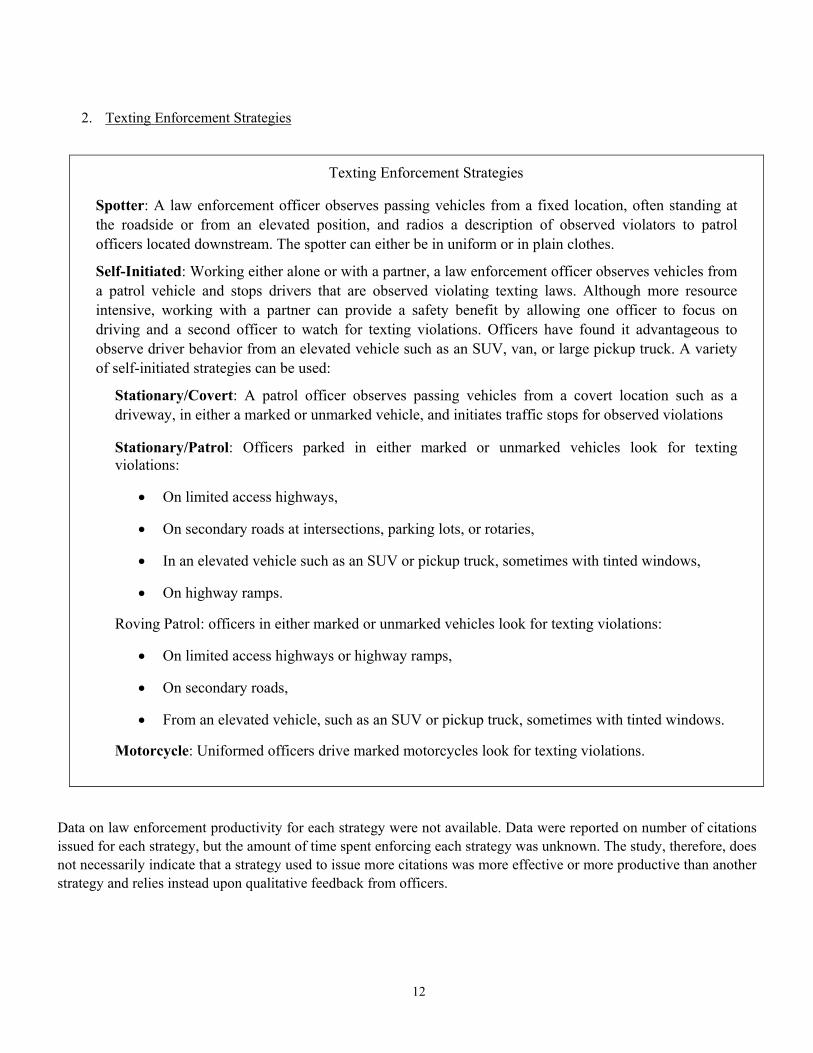
2. Texting Enforcement Strategies
Texting Enforcement Strategies
Spotter: A law enforcement officer observes passing vehicles from a fixed location, often standing at the roadside or from an elevated position, and radios a description of observed violators to patrol officers located downstream. The spotter can either be in uniform or in plain clothes.
Self-Initiated: Working either alone or with a partner, a law enforcement officer observes vehicles from a patrol vehicle and stops drivers that are observed violating texting laws. Although more resource intensive, working with a partner can provide a safety benefit by allowing one officer to focus on driving and a second officer to watch for texting violations. Officers have found it advantageous to observe driver behavior from an elevated vehicle such as an SUV, van, or large pickup truck. A variety of self-initiated strategies can be used:
Stationary/Covert: A patrol officer observes passing vehicles from a covert location such as a driveway, in either a marked or unmarked vehicle, and initiates traffic stops for observed violations
Stationary/Patrol: Officers parked in either marked or unmarked vehicles look for texting violations:
• On limited access highways,
• On secondary roads at intersections, parking lots, or rotaries,
• In an elevated vehicle such as an SUV or pickup truck, sometimes with tinted windows,
• On highway ramps.
Roving Patrol: officers in either marked or unmarked vehicles look for texting violations:
• On limited access highways or highway ramps,
• On secondary roads,
• From an elevated vehicle, such as an SUV or pickup truck, sometimes with tinted windows.
Motorcycle: Uniformed officers drive marked motorcycles look for texting violations.
Data on law enforcement productivity for each strategy were not available. Data were reported on number of citations issued for each strategy, but the amount of time spent enforcing each strategy was unknown. The study, therefore, does not necessarily indicate that a strategy used to issue more citations was more effective or more productive than another strategy and relies instead upon qualitative feedback from officers.
13
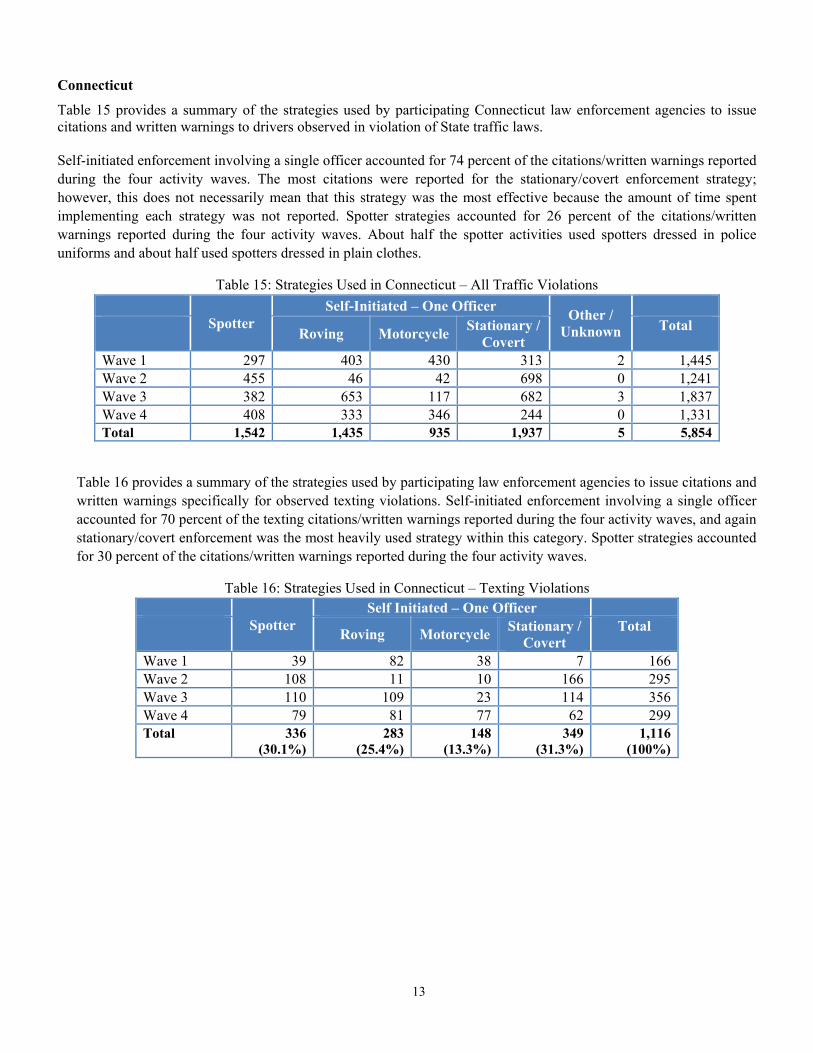
Connecticut
Table 15 provides a summary of the strategies used by participating Connecticut law enforcement agencies to issue citations and written warnings to drivers observed in violation of State traffic laws. Self-initiated enforcement involving a single officer accounted for 74 percent of the citations/written warnings reported during the four activity waves. The most citations were reported for the stationary/covert enforcement strategy; however, this does not necessarily mean that this strategy was the most effective because the amount of time spent implementing each strategy was not reported. Spotter strategies accounted for 26 percent of the citations/written warnings reported during the four activity waves. About half the spotter activities used spotters dressed in police uniforms and about half used spotters dressed in plain clothes.
Table 15: Strategies Used in Connecticut – All Traffic Violations
Spotter Self-Initiated – One Officer Other /
Unknown
Roving Motorcycle Stationary / Covert
Total
Wave 1 297 403 430 313 2 1,445 Wave 2 455 46 42 698 0 1,241 Wave 3 382 653 117 682 3 1,837 Wave 4 408 333 346 244 0 1,331 Total 1,542 1,435 935 1,937 5 5,854
Table 16 provides a summary of the strategies used by participating law enforcement agencies to issue citations and written warnings specifically for observed texting violations. Self-initiated enforcement involving a single officer accounted for 70 percent of the texting citations/written warnings reported during the four activity waves, and again stationary/covert enforcement was the most heavily used strategy within this category. Spotter strategies accounted for 30 percent of the citations/written warnings reported during the four activity waves.
Table 16: Strategies Used in Connecticut – Texting Violations
Spotter Self Initiated – One Officer
Roving Motorcycle Stationary / Covert
Total
Wave 1 39 82 38 7 166 Wave 2 108 11 10 166 295 Wave 3 110 109 23 114 356 Wave 4 79 81 77 62 299 Total 336
(30.1%) 283
(25.4%) 148
(13.3%) 349
(31.3%) 1,116
(100%)
14
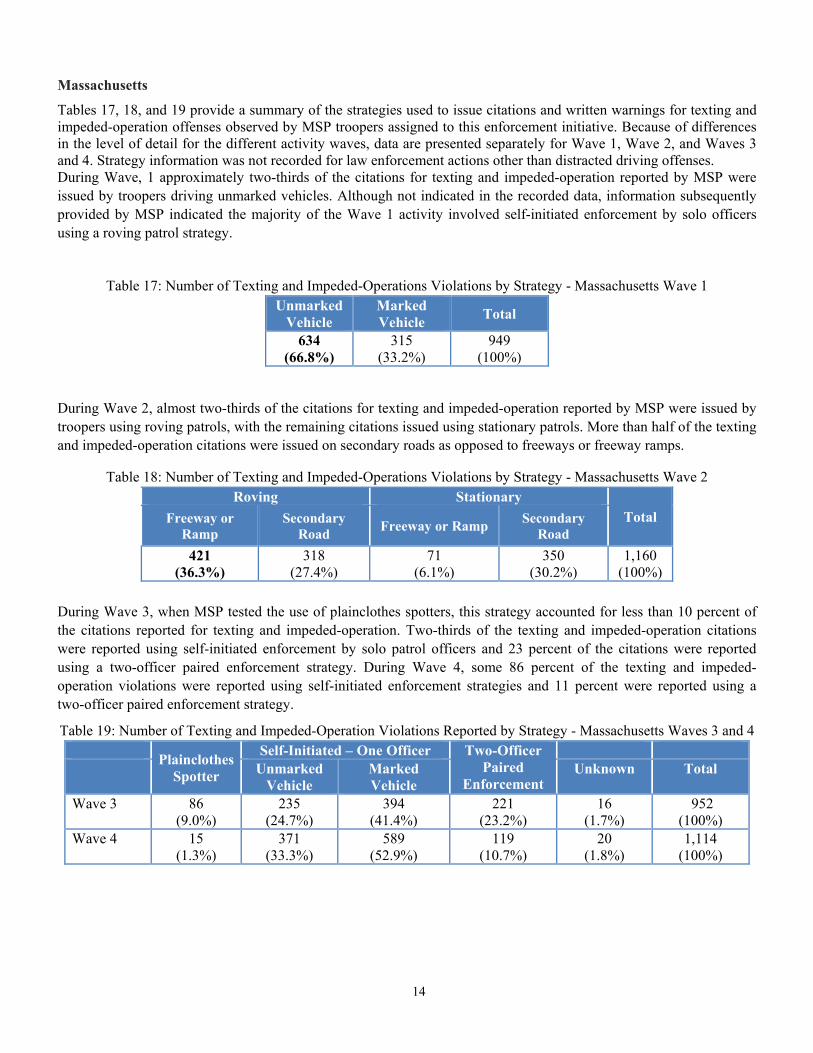
Massachusetts
Tables 17, 18, and 19 provide a summary of the strategies used to issue citations and written warnings for texting and impeded-operation offenses observed by MSP troopers assigned to this enforcement initiative. Because of differences in the level of detail for the different activity waves, data are presented separately for Wave 1, Wave 2, and Waves 3 and 4. Strategy information was not recorded for law enforcement actions other than distracted driving offenses. During Wave, 1 approximately two-thirds of the citations for texting and impeded-operation reported by MSP were issued by troopers driving unmarked vehicles. Although not indicated in the recorded data, information subsequently provided by MSP indicated the majority of the Wave 1 activity involved self-initiated enforcement by solo officers using a roving patrol strategy.
Table 17: Number of Texting and Impeded-Operations Violations by Strategy - Massachusetts Wave 1 Unmarked
Vehicle Marked Vehicle Total
634 (66.8%)
315 (33.2%)
949 (100%)
During Wave 2, almost two-thirds of the citations for texting and impeded-operation reported by MSP were issued by troopers using roving patrols, with the remaining citations issued using stationary patrols. More than half of the texting and impeded-operation citations were issued on secondary roads as opposed to freeways or freeway ramps.
Table 18: Number of Texting and Impeded-Operations Violations by Strategy - Massachusetts Wave 2 Roving Stationary
Total Freeway or Ramp
Secondary Road Freeway or Ramp Secondary
Road 421
(36.3%) 318
(27.4%) 71
(6.1%) 350
(30.2%) 1,160
(100%)
During Wave 3, when MSP tested the use of plainclothes spotters, this strategy accounted for less than 10 percent of the citations reported for texting and impeded-operation. Two-thirds of the texting and impeded-operation citations were reported using self-initiated enforcement by solo patrol officers and 23 percent of the citations were reported using a two-officer paired enforcement strategy. During Wave 4, some 86 percent of the texting and impeded-operation violations were reported using self-initiated enforcement strategies and 11 percent were reported using a two-officer paired enforcement strategy.
Table 19: Number of Texting and Impeded-Operation Violations Reported by Strategy - Massachusetts Waves 3 and 4 Plainclothes
Spotter
Self-Initiated – One Officer Two-Officer Paired
Enforcement
Unmarked
Vehicle Marked Vehicle
Unknown Total
Wave 3 86 (9.0%)
235 (24.7%)
394 (41.4%)
221 (23.2%)
16 (1.7%)
952 (100%)
Wave 4 15 (1.3%)
371 (33.3%)
589 (52.9%)
119 (10.7%)
20 (1.8%)
1,114 (100%)
15
3. Law Enforcement Recap Discussions
The participating law enforcement agencies held recap discussions after Waves 1, 2, and 4 to discuss experiences and possible adjustments in activity for future activity periods. The following observations from the recap discussions are relevant to law enforcement agencies conducting – or planning to conduct – texting enforcement: Officer Safety Officer safety is an essential element of enforcement, especially when the enforcement requires searching for specific driver behaviors happening within other vehicles. Officers tested two-officer roving patrols, with one officer driving and one searching for violations. While single-officer roving patrols were feasible, some officers indicated the two-officer patrols helped by allowing the officer driving the vehicle to maintain situational awareness and attention on the roadway, and by providing an additional set of eyes to concentrate on locating violators and collecting sufficient detail on the violation. On freeways and other limited access highways, stationary patrols may be safer on ramps versus main sections of the highway. Massachusetts noted safety concerns associated with parking a patrol vehicle on shoulders and other highway locations. Training Training was an essential component of distracted driving enforcement in this demonstration program. Officers noted benefits associated with the use of law sheets or law cards for officer reference, involving the State’s Attorney to discuss the law and evidence that should be collected, discussing enforcement strategy logistics with illustrations, and providing live speaker roll calls to enhance interest and motivation (rather than using video-based). Officers also suggested that setting distracted driving enforcement as a leadership priority and giving line officers ownership of the effort by soliciting input on enforcement strategies may increase officer motivation and involvement. Balance of Marked and Unmarked Vehicles Finding a balance with the use of marked and unmarked patrol vehicles may be helpful. Marked vehicles create visibility of enforcement and may discourage drivers from violating laws when enforcement is present. In this program, officers in marked vehicles observed some drivers putting down their phones when the presence of enforcement became evident, limiting the amount of information the officer could collect on the violation. While being visible is important in some cases, officers in this program found covert enforcement with unmarked vehicles to aid the detection of texting law violations and to help with issuing citations. Pre-plan for Smooth Operation Using spotters helped officers with detecting violations, especially when the spotter was positioned at an elevated level relative to the traffic. One supervisor commented that the key to successful texting enforcement is getting out of the car, with the spotter preferably in an elevated position. Officers found this strategy to require a great deal of pre-planning and coordination, and to be resource intensive. Multiple officers experienced timing issues with this strategy where the violating driver would pass the ticketing officer location before the spotting officer could relay the violation details. Some officers noted that using more officers when working in high-volume traffic conditions may help with this issue. Law Enforcement Partnerships State Police and local law enforcement agencies have emphasized the importance of working together to enforce texting laws through partnerships, such as regional enforcement teams and the pairing of State and local police. Such partnerships can act as a force multiplier to maximize resources and personnel and should be encouraged in communities that undertake texting enforcement activities. As an example, officers found spotter and stationary patrols to typically be more suitable strategies for urban environments with slower traffic and intersections, which allowed the officers to observe drivers more clearly. With strong enforcement partnerships, officers from local and State police departments could coordinate efforts to cover the roadways identified for the enforcement effort.
16
Challenges with Novice Driver Distracted Driving Laws Challenges were noted with enforcing distracted driving laws that are specific to novice drivers. Massachusetts conducted patrols near high schools, and noted a possible benefit of using School Resource Officers to educate high school students on distracted driving laws before the enforcement begins in order to increase student awareness of the laws and consequences of violating the laws. Texting enforcement in school zones was challenging because the majority of students left the school all at once and after one or two citations were issued, most students had left the area. Troopers also had difficulty discerning age of violators, making specific juvenile enforcement problematic. Indicators of Violations Officers noticed some driver behaviors associated with distracted driving, including leaving a large following gap, failure to stay in lane, and drivers looking down at their laps. It was also noted that officers looked for the glow emitted from electronic devices when conducting nighttime enforcement. These are possible indicators to search for when conducting distracted driving enforcement. Detailed Reporting Officers noted detailed reporting of infractions may help with adjudication rates. Some texting and distracted driving laws ban very specific behaviors (reading, writing, and sending a text message, for example), which may be challenging to prove. Collecting specific details about a violation may help provide evidence. Such details collected by officers during this program include how the driver was manipulating the device, for how many seconds the driver was observed engaging in the illegal behavior prior to the traffic stop, if the device was held with the left or right hand, and a description of the device (color, for example). Education Opportunity Law enforcement can use traffic stops as an opportunity to educate the public about the dangers of distracted driving. Enforcement officers noted they were more inclined to provide educational materials to drivers when issuing a warning than when issuing a citation. Additional Citation Categories Despite the fact that texting enforcement was the specific focus of this project, large numbers of the distracted driving citations were reported for either cellphone use (where State law prohibited handheld phone use) or alternative violations that were closely related to texting violations, such as impeded-operation. It was noted by law enforcement officials that cellphone and impeded-operation citations were often issued in lieu of texting citations when driving behavior could not definitively be determined to be a texting violation (e.g., the officer may not have observed the violation long enough, the officer’s view may have been less than optimal, or when drivers claimed they were dialing a phone). Benefits of Motorcycle Enforcement Officers found motorcycle enforcement to help with detecting violations, partially due to the height of the motorcycle relative to the vehicle height and the maneuverability of the motorcycle while roving in traffic. Officers also found motorcycle enforcement to allow for a quicker turnaround with fast mount and dismount compared to operating out of another type of patrol vehicle. Shorter Shifts Officers suggested that shorter shifts were better for maintaining focus on texting enforcement. Connecticut law enforcement officers also recommended conducting texting enforcement during the week, as they noted a marked decrease of texting activity on weekends. Spotter Strategy Challenges Regarding the Spotter strategy, Massachusetts noted some push back from motorists due to the fact the ticketing officer did not observe the violation. Massachusetts noted potential adjudication issues because the officer issuing the summons was not the observing officer, and suggested making a note of this on the citation. They also mentioned court costs associated with sending two officers to court, and the consideration of doing a cost/benefit analysis that takes into
17
account how much it costs to send officers to court and how much money the ticket generates. Massachusetts mentioned it may be better to use a line officer as the spotter, rather than a lieutenant. By comparison, Connecticut indicated no problem with spotter citations holding up in court, noting that the ticket writer testifies. Texting Enforcement Priority Law enforcement officers are asked to perform a wide range of activities, of which traffic enforcement may be just one focus. In some cases, it may not be clear to officers how a particular enforcement assignment, such as texting enforcement, can improve public safety. Sharing pertinent research and statistics with officers about the dangers of texting and driving may encourage more positive attitudes toward texting enforcement. In addition, giving officers a say in how to conduct the enforcement can increase officer buy-in. Officer Supervision and Motivation The relationship between law enforcement officers and their supervisors is crucial to agency morale and the success of all assigned duties. Supervisors not only manage the day-to-day activities of line staff but also provide guidance and encouragement to support the agency’s public safety mission and goals. Officers who receive clear and consistent guidance and positive feedback regarding the enforcement of texting laws may be more motivated and committed to this important traffic safety effort. Officer Coaching The benefits of supervision extend beyond junior or rookie officers. State and local law enforcement agencies that participated in texting enforcement demonstration programs found that coaching even seasoned traffic officers helped increase their commitment to texting enforcement.
18
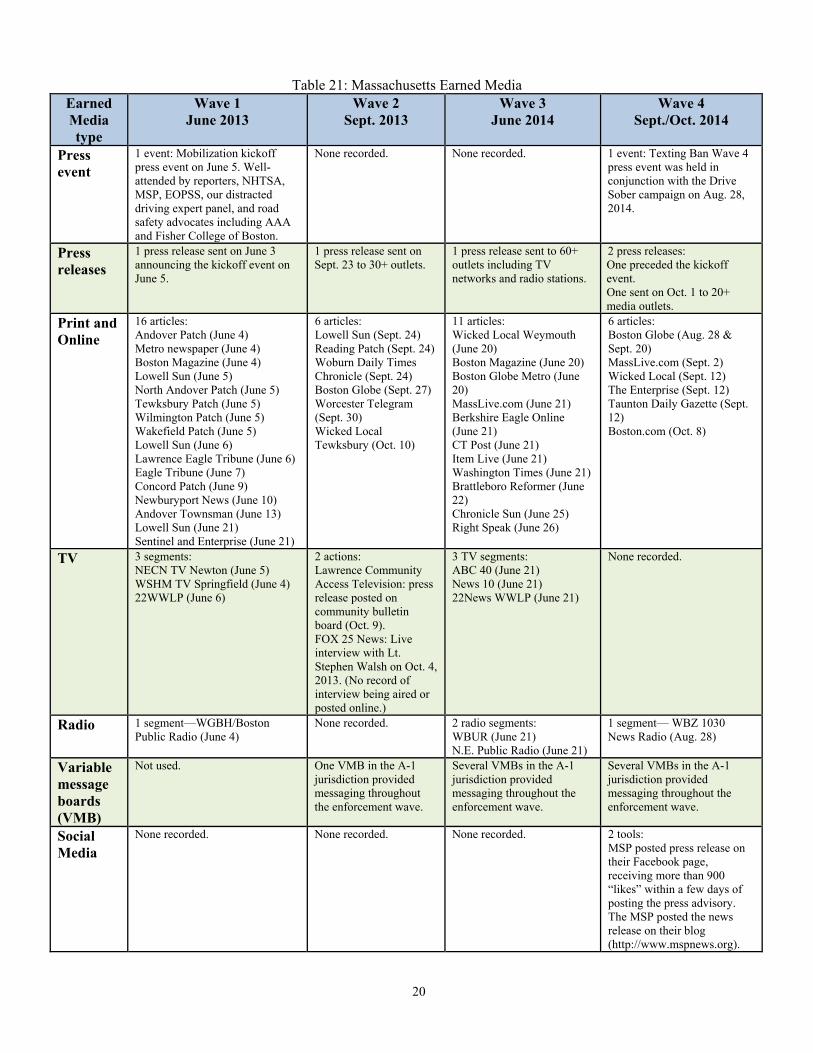
4. Earned Media Activity
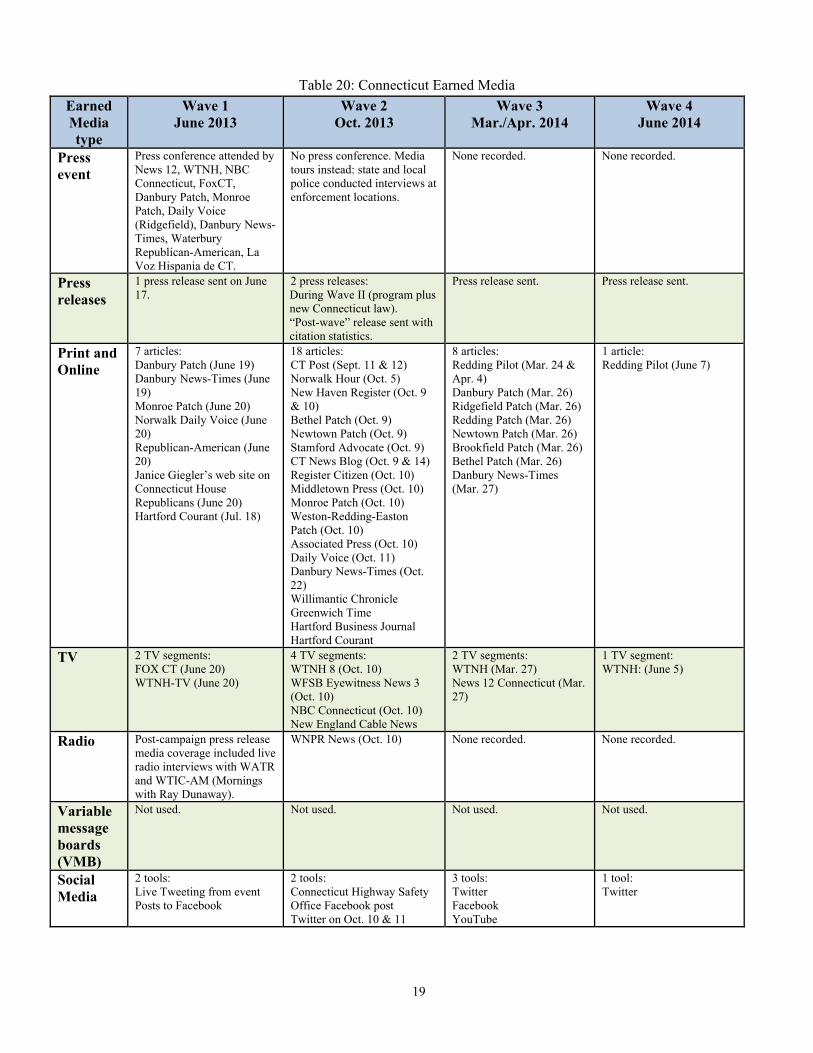
Tables 20 and 21 summarize the earned media activities reported by the Connecticut and Massachusetts State Highway Safety Offices that accompanied the focused texting enforcement in both States. Appendix E provides examples of earned media materials from each State. Efforts to publicize the additional texting enforcement undertaken in the program areas of each State were primarily focused on getting earned media attention through traditional and social media outlets. No paid media supported enforcement efforts in this demonstration project.
With the initial enforcement waves, media kick-off events with law enforcement and other traffic safety experts were held by the Highway Safety Offices in both States to inform the public about the enforcement effort. As the project progressed, public awareness efforts focused primarily on press releases and other awareness activities to describe enforcement efforts that would occur. Connecticut used social media outlets throughout the four enforcement waves. Massachusetts used variable message signs warning the public in the program area about the additional texting enforcement.
19
Table 20: Connecticut Earned Media Earned Media type
Wave 1 June 2013
Wave 2 Oct. 2013
Wave 3 Mar./Apr. 2014
Wave 4 June 2014
Press event
Press conference attended by News 12, WTNH, NBC Connecticut, FoxCT, Danbury Patch, Monroe Patch, Daily Voice (Ridgefield), Danbury News-Times, Waterbury Republican-American, La Voz Hispania de CT.
No press conference. Media tours instead: state and local police conducted interviews at enforcement locations.
None recorded. None recorded.
Press releases
1 press release sent on June 17.
2 press releases: During Wave II (program plus new Connecticut law). “Post-wave” release sent with citation statistics.
Press release sent. Press release sent.
Print and Online
7 articles: Danbury Patch (June 19) Danbury News-Times (June 19) Monroe Patch (June 20) Norwalk Daily Voice (June 20) Republican-American (June 20) Janice Giegler’s web site on Connecticut House Republicans (June 20) Hartford Courant (Jul. 18)
18 articles: CT Post (Sept. 11 & 12) Norwalk Hour (Oct. 5) New Haven Register (Oct. 9 & 10) Bethel Patch (Oct. 9) Newtown Patch (Oct. 9) Stamford Advocate (Oct. 9) CT News Blog (Oct. 9 & 14) Register Citizen (Oct. 10) Middletown Press (Oct. 10) Monroe Patch (Oct. 10) Weston-Redding-Easton Patch (Oct. 10) Associated Press (Oct. 10) Daily Voice (Oct. 11) Danbury News-Times (Oct. 22) Willimantic Chronicle Greenwich Time Hartford Business Journal Hartford Courant
8 articles: Redding Pilot (Mar. 24 & Apr. 4) Danbury Patch (Mar. 26) Ridgefield Patch (Mar. 26) Redding Patch (Mar. 26) Newtown Patch (Mar. 26) Brookfield Patch (Mar. 26) Bethel Patch (Mar. 26) Danbury News-Times (Mar. 27)
1 article: Redding Pilot (June 7)
TV 2 TV segments: FOX CT (June 20) WTNH-TV (June 20)
4 TV segments: WTNH 8 (Oct. 10) WFSB Eyewitness News 3 (Oct. 10) NBC Connecticut (Oct. 10) New England Cable News
2 TV segments: WTNH (Mar. 27) News 12 Connecticut (Mar. 27)
1 TV segment: WTNH: (June 5)
Radio Post-campaign press release media coverage included live radio interviews with WATR and WTIC-AM (Mornings with Ray Dunaway).
WNPR News (Oct. 10)
None recorded. None recorded.
Variable message boards (VMB)
Not used. Not used. Not used. Not used.
Social Media
2 tools: Live Tweeting from event Posts to Facebook
2 tools: Connecticut Highway Safety Office Facebook post Twitter on Oct. 10 & 11
3 tools: Twitter Facebook YouTube
1 tool: Twitter
20
Table 21: Massachusetts Earned Media Earned Media type
Wave 1 June 2013
Wave 2 Sept. 2013
Wave 3 June 2014
Wave 4 Sept./Oct. 2014
Press event
1 event: Mobilization kickoff press event on June 5. Well-attended by reporters, NHTSA, MSP, EOPSS, our distracted driving expert panel, and road safety advocates including AAA and Fisher College of Boston.
None recorded. None recorded. 1 event: Texting Ban Wave 4 press event was held in conjunction with the Drive Sober campaign on Aug. 28, 2014.
Press releases
1 press release sent on June 3 announcing the kickoff event on June 5.
1 press release sent on Sept. 23 to 30+ outlets.
1 press release sent to 60+ outlets including TV networks and radio stations.
2 press releases: One preceded the kickoff event. One sent on Oct. 1 to 20+ media outlets.
Print and Online
16 articles: Andover Patch (June 4) Metro newspaper (June 4) Boston Magazine (June 4) Lowell Sun (June 5) North Andover Patch (June 5) Tewksbury Patch (June 5) Wilmington Patch (June 5) Wakefield Patch (June 5) Lowell Sun (June 6) Lawrence Eagle Tribune (June 6) Eagle Tribune (June 7) Concord Patch (June 9) Newburyport News (June 10) Andover Townsman (June 13) Lowell Sun (June 21) Sentinel and Enterprise (June 21)
6 articles: Lowell Sun (Sept. 24) Reading Patch (Sept. 24) Woburn Daily Times Chronicle (Sept. 24) Boston Globe (Sept. 27) Worcester Telegram (Sept. 30) Wicked Local Tewksbury (Oct. 10)
11 articles: Wicked Local Weymouth (June 20) Boston Magazine (June 20) Boston Globe Metro (June 20) MassLive.com (June 21) Berkshire Eagle Online (June 21) CT Post (June 21) Item Live (June 21) Washington Times (June 21) Brattleboro Reformer (June 22) Chronicle Sun (June 25) Right Speak (June 26)
6 articles: Boston Globe (Aug. 28 & Sept. 20) MassLive.com (Sept. 2) Wicked Local (Sept. 12) The Enterprise (Sept. 12) Taunton Daily Gazette (Sept. 12) Boston.com (Oct. 8)
TV 3 segments: NECN TV Newton (June 5) WSHM TV Springfield (June 4) 22WWLP (June 6)
2 actions: Lawrence Community Access Television: press release posted on community bulletin board (Oct. 9). FOX 25 News: Live interview with Lt. Stephen Walsh on Oct. 4, 2013. (No record of interview being aired or posted online.)
3 TV segments: ABC 40 (June 21) News 10 (June 21) 22News WWLP (June 21)
None recorded.
Radio 1 segment—WGBH/Boston Public Radio (June 4)
None recorded. 2 radio segments: WBUR (June 21) N.E. Public Radio (June 21)
1 segment— WBZ 1030 News Radio (Aug. 28)
Variable message boards (VMB)
Not used. One VMB in the A-1 jurisdiction provided messaging throughout the enforcement wave.
Several VMBs in the A-1 jurisdiction provided messaging throughout the enforcement wave.
Several VMBs in the A-1 jurisdiction provided messaging throughout the enforcement wave.
Social Media
None recorded. None recorded. None recorded. 2 tools: MSP posted press release on their Facebook page, receiving more than 900 “likes” within a few days of posting the press advisory. The MSP posted the news release on their blog (http://www.mspnews.org).
21
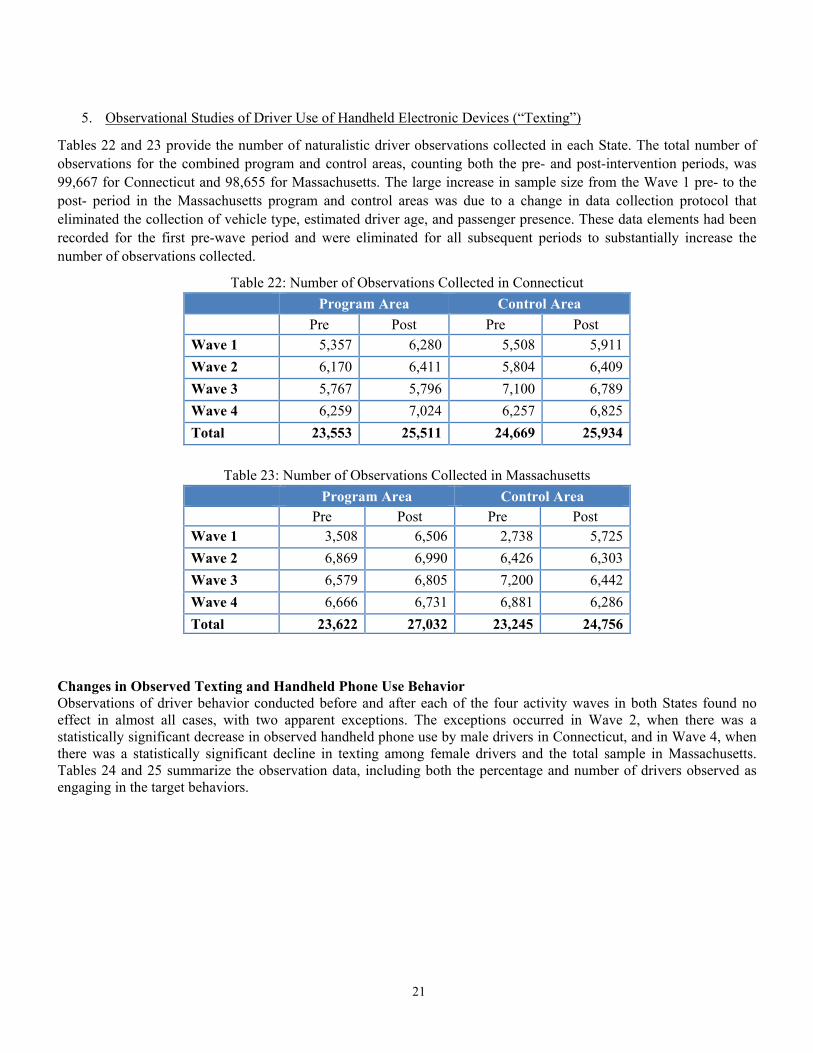
5. Observational Studies of Driver Use of Handheld Electronic Devices (“Texting”)
Tables 22 and 23 provide the number of naturalistic driver observations collected in each State. The total number of observations for the combined program and control areas, counting both the pre- and post-intervention periods, was 99,667 for Connecticut and 98,655 for Massachusetts. The large increase in sample size from the Wave 1 pre- to the post- period in the Massachusetts program and control areas was due to a change in data collection protocol that eliminated the collection of vehicle type, estimated driver age, and passenger presence. These data elements had been recorded for the first pre-wave period and were eliminated for all subsequent periods to substantially increase the number of observations collected.
Table 22: Number of Observations Collected in Connecticut Program Area Control Area Pre Post Pre Post Wave 1 5,357 6,280 5,508 5,911 Wave 2 6,170 6,411 5,804 6,409 Wave 3 5,767 5,796 7,100 6,789 Wave 4 6,259 7,024 6,257 6,825 Total 23,553 25,511 24,669 25,934
Table 23: Number of Observations Collected in Massachusetts
Program Area Control Area Pre Post Pre Post Wave 1 3,508 6,506 2,738 5,725 Wave 2 6,869 6,990 6,426 6,303 Wave 3 6,579 6,805 7,200 6,442 Wave 4 6,666 6,731 6,881 6,286 Total 23,622 27,032 23,245 24,756
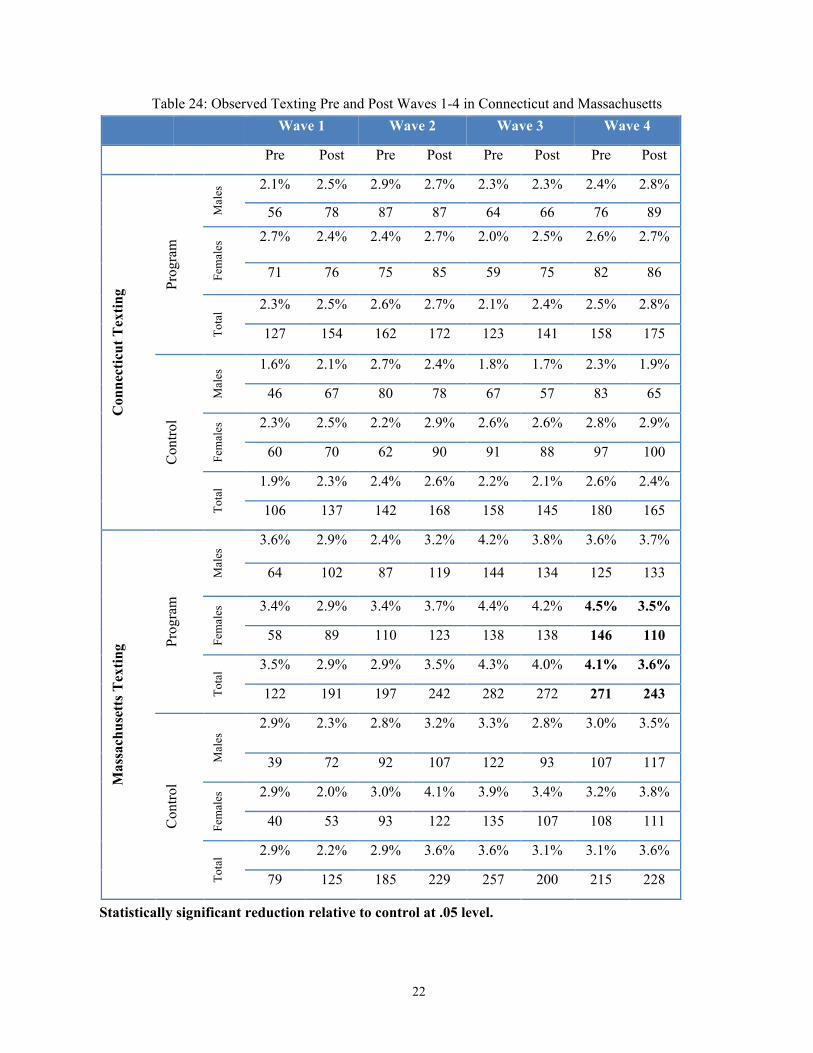
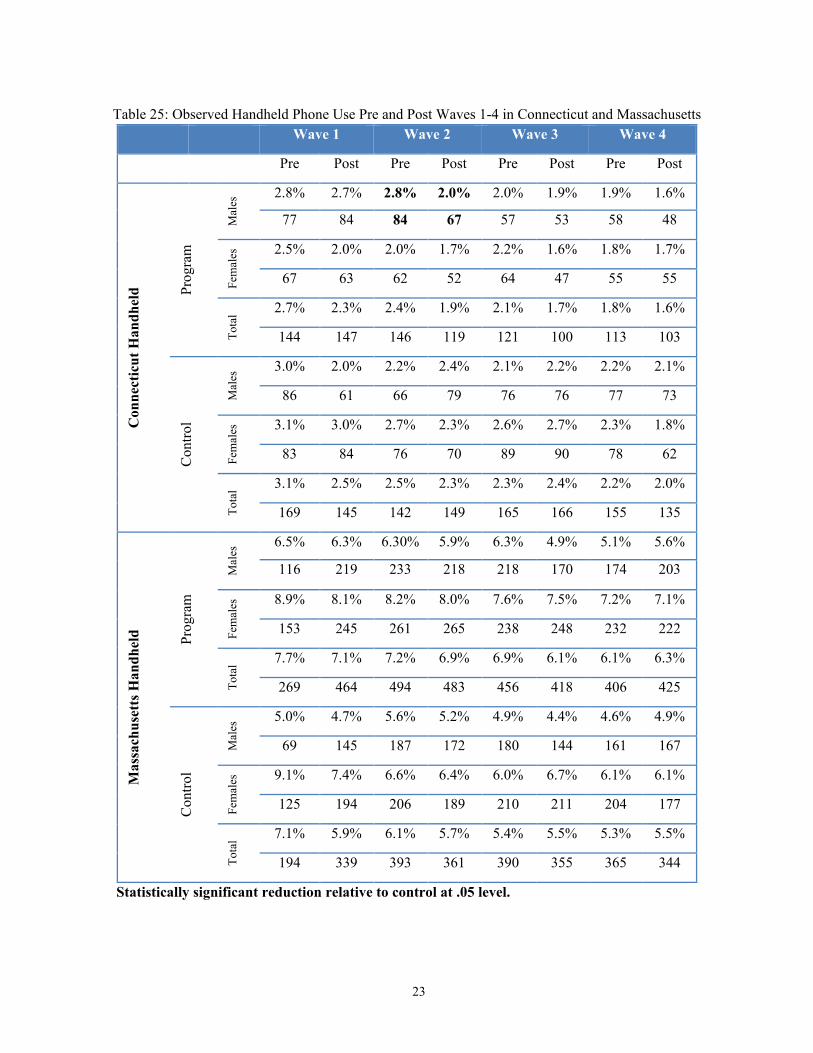
Changes in Observed Texting and Handheld Phone Use Behavior Observations of driver behavior conducted before and after each of the four activity waves in both States found no effect in almost all cases, with two apparent exceptions. The exceptions occurred in Wave 2, when there was a statistically significant decrease in observed handheld phone use by male drivers in Connecticut, and in Wave 4, when there was a statistically significant decline in texting among female drivers and the total sample in Massachusetts. Tables 24 and 25 summarize the observation data, including both the percentage and number of drivers observed as engaging in the target behaviors.
22
Table 24: Observed Texting Pre and Post Waves 1-4 in Connecticut and Massachusetts
Statistically significant reduction relative to control at .05 level.
Wave 1 Wave 2 Wave 3 Wave 4
Pre Post Pre Post Pre Post Pre Post
Con
nect
icut
Tex
ting Pr
ogra
m
Mal
es 2.1% 2.5% 2.9% 2.7% 2.3% 2.3% 2.4% 2.8%
56 78 87 87 64 66 76 89 Fe
mal
es 2.7% 2.4% 2.4% 2.7% 2.0% 2.5% 2.6% 2.7%
71 76 75 85 59 75 82 86
Tota
l 2.3% 2.5% 2.6% 2.7% 2.1% 2.4% 2.5% 2.8%
127 154 162 172 123 141 158 175
Con
trol
Mal
es 1.6% 2.1% 2.7% 2.4% 1.8% 1.7% 2.3% 1.9%
46 67 80 78 67 57 83 65
Fem
ales
2.3% 2.5% 2.2% 2.9% 2.6% 2.6% 2.8% 2.9%
60 70 62 90 91 88 97 100
Tota
l 1.9% 2.3% 2.4% 2.6% 2.2% 2.1% 2.6% 2.4%
106 137 142 168 158 145 180 165
Mas
sach
uset
ts T
extin
g Prog
ram
Mal
es 3.6% 2.9% 2.4% 3.2% 4.2% 3.8% 3.6% 3.7%
64 102 87 119 144 134 125 133
Fem
ales
3.4% 2.9% 3.4% 3.7% 4.4% 4.2% 4.5% 3.5%
58 89 110 123 138 138 146 110
Tota
l 3.5% 2.9% 2.9% 3.5% 4.3% 4.0% 4.1% 3.6%
122 191 197 242 282 272 271 243
Con
trol
Mal
es 2.9% 2.3% 2.8% 3.2% 3.3% 2.8% 3.0% 3.5%
39 72 92 107 122 93 107 117
Fem
ales
2.9% 2.0% 3.0% 4.1% 3.9% 3.4% 3.2% 3.8%
40 53 93 122 135 107 108 111
Tota
l 2.9% 2.2% 2.9% 3.6% 3.6% 3.1% 3.1% 3.6%
79 125 185 229 257 200 215 228
23
Table 25: Observed Handheld Phone Use Pre and Post Waves 1-4 in Connecticut and Massachusetts
Statistically significant reduction relative to control at .05 level.
Wave 1 Wave 2 Wave 3 Wave 4
Pre Post Pre Post Pre Post Pre Post
Con
nect
icut
Han
dhel
d Prog
ram
Mal
es 2.8% 2.7% 2.8% 2.0% 2.0% 1.9% 1.9% 1.6%
77 84 84 67 57 53 58 48 Fe
mal
es 2.5% 2.0% 2.0% 1.7% 2.2% 1.6% 1.8% 1.7%
67 63 62 52 64 47 55 55
Tota
l 2.7% 2.3% 2.4% 1.9% 2.1% 1.7% 1.8% 1.6%
144 147 146 119 121 100 113 103
Con
trol
Mal
es 3.0% 2.0% 2.2% 2.4% 2.1% 2.2% 2.2% 2.1%
86 61 66 79 76 76 77 73
Fem
ales
3.1% 3.0% 2.7% 2.3% 2.6% 2.7% 2.3% 1.8%
83 84 76 70 89 90 78 62
Tota
l 3.1% 2.5% 2.5% 2.3% 2.3% 2.4% 2.2% 2.0%
169 145 142 149 165 166 155 135
Mas
sach
uset
ts H
andh
eld Prog
ram
Mal
es 6.5% 6.3% 6.30% 5.9% 6.3% 4.9% 5.1% 5.6%
116 219 233 218 218 170 174 203
Fem
ales
8.9% 8.1% 8.2% 8.0% 7.6% 7.5% 7.2% 7.1%
153 245 261 265 238 248 232 222
Tota
l 7.7% 7.1% 7.2% 6.9% 6.9% 6.1% 6.1% 6.3%
269 464 494 483 456 418 406 425
Con
trol
Mal
es 5.0% 4.7% 5.6% 5.2% 4.9% 4.4% 4.6% 4.9%
69 145 187 172 180 144 161 167
Fem
ales
9.1% 7.4% 6.6% 6.4% 6.0% 6.7% 6.1% 6.1%
125 194 206 189 210 211 204 177
Tota
l 7.1% 5.9% 6.1% 5.7% 5.4% 5.5% 5.3% 5.5%
194 339 393 361 390 355 365 344
24
6. Public Awareness and Attitudes Surveys
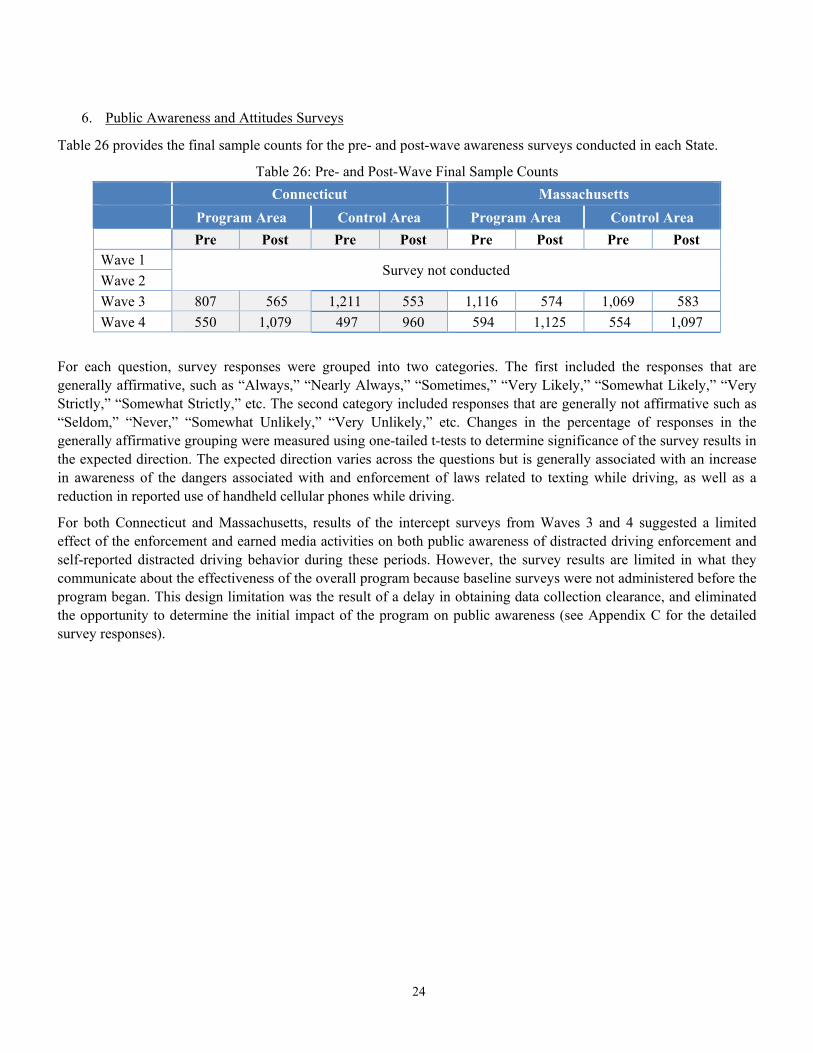
Table 26 provides the final sample counts for the pre- and post-wave awareness surveys conducted in each State.
Table 26: Pre- and Post-Wave Final Sample Counts Connecticut Massachusetts Program Area Control Area Program Area Control Area
Pre Post Pre Post Pre Post Pre Post Wave 1
Survey not conducted Wave 2 Wave 3 807 565 1,211 553 1,116 574 1,069 583 Wave 4 550 1,079 497 960 594 1,125 554 1,097
For each question, survey responses were grouped into two categories. The first included the responses that are generally affirmative, such as “Always,” “Nearly Always,” “Sometimes,” “Very Likely,” “Somewhat Likely,” “Very Strictly,” “Somewhat Strictly,” etc. The second category included responses that are generally not affirmative such as “Seldom,” “Never,” “Somewhat Unlikely,” “Very Unlikely,” etc. Changes in the percentage of responses in the generally affirmative grouping were measured using one-tailed t-tests to determine significance of the survey results in the expected direction. The expected direction varies across the questions but is generally associated with an increase in awareness of the dangers associated with and enforcement of laws related to texting while driving, as well as a reduction in reported use of handheld cellular phones while driving.
For both Connecticut and Massachusetts, results of the intercept surveys from Waves 3 and 4 suggested a limited effect of the enforcement and earned media activities on both public awareness of distracted driving enforcement and self-reported distracted driving behavior during these periods. However, the survey results are limited in what they communicate about the effectiveness of the overall program because baseline surveys were not administered before the program began. This design limitation was the result of a delay in obtaining data collection clearance, and eliminated the opportunity to determine the initial impact of the program on public awareness (see Appendix C for the detailed survey responses).
25
DISCUSSION
Traffic safety officials in Connecticut and Massachusetts have taken a major step toward helping identify viable strategies to enforce State laws that regulate driver use of handheld electronic devices (“texting”). Law enforcement officers in Connecticut and Massachusetts tested a number of strategies to enforce texting laws. The broader category of distracted driving citations, including texting, impeded-operation, and cellphone use, accounted for 76 percent of the total number of citations reported, indicating that participating law enforcement agencies were highly focused on distracted driving. These results demonstrate that texting laws can be enforced.
The participating Connecticut and Massachusetts law enforcement agencies tested a number of enforcement strategies, including a variety of spotter strategies, roving patrols, and stationary patrols. Massachusetts State Police (MSP) troopers identified unmarked SUVs with tinted glass as the most effective enforcement profile. They also viewed roving patrols as most effective on highways and ramps, and the use of stationary patrols as most effective in cities and towns. The Connecticut law enforcement activities, which primarily used local police agencies, relied heavily on spotter strategies, and were regarded as generally effective among participating officers.
In both States, officer training was an important component of the texting enforcement effort. Training elements such as roll call briefings, texting law fact sheets, and coaching on issuing texting citations were viewed as important steps to consider given that texting enforcement is a relatively new and evolving policing function. The participating agencies also valued the importance of supervisors motivating line officers to enforce texting laws.
While all of the strategies identified in this report proved feasible for enforcing texting laws, some approaches can be readily integrated into routine patrols (e.g., single-officer roving and stationary patrols, and motorcycle patrols) whereas other approaches (e.g., spotter strategies, two-officer roving and stationary patrols) may be better suited to special emphasis patrols.
Although single-officer patrols were found to be feasible and constituted the majority of roving patrol activity for this project, some participating officers suggested two-officer patrols may be safer because they allow one officer to concentrate on driving while the other officer checks for texting violations. While two-officer patrols are not the norm in many agencies and staffing patrol vehicles with two officers could strain limited resources, this approach might be more feasible for short-term campaigns or periodically recurring enforcement periods.
State Police and local law enforcement agencies emphasized the importance of working together to enforce texting laws through partnerships, such as regional enforcement teams and the pairing of State and local police. Such partnerships should be encouraged in communities that undertake texting enforcement activities.
A secondary purpose of this evaluation was to measure the outcome of the enforcement and earned media activity on observed distracted driving behavior, self-reported behavior, and public awareness. Observations of driver behavior conducted before and after each of the four activity waves in both States found no effect in almost all cases, with two apparent exceptions. The exceptions occurred in Wave 2, when there was a significant decline in handheld phone use among male drivers in Connecticut, and in Wave 4, when there was a significant decline in texting among female drivers and the total sample in Massachusetts.
The evaluation was designed to measure changes in public awareness associated with the program by conducting awareness surveys before and after each wave in program and control areas in each State. However, awareness surveys were only conducted for the second half of the program because of delays in obtaining data collection clearance. For both Connecticut and Massachusetts, results of the awareness surveys from Waves 3 and 4 suggested there was no effect of the enforcement and earned media activities on both public awareness of distracted driving enforcement and self-reported distracted driving behavior, in which case it would require either more earned media or paid media to influence public awareness. However, the survey results are limited in what they communicate about the effectiveness of the overall program because baseline surveys were not administered before the program began.
26
LIMITATIONS
Data on law enforcement productivity for each strategy were not available. Data were reported on number of citations issued for each strategy, but the amount of time spent enforcing each strategy was unknown. The study, therefore, does not necessarily indicate that a strategy used to issue more citations was more effective or more productive than another strategy and relies instead upon qualitative feedback from officers.
There was a large gap in time between Waves 2 and 3 of the program. This gap was approximately 6 months in Connecticut and 8 months in Massachusetts. It is possible that this period of inactivity may have resulted in a reduced effect shown in the project outcome.
As typical with program evaluations of this nature, the awareness survey followed a nonequivalent control group design. The intention of using this design was to measure the effect of a program by taking a yardstick measurement pre and post each wave to determine change, not to estimate what represents the area as a whole. The research team applied strong consistency in measurement protocol across measurement periods and tried to establish similarity across the program and control samples to limit extraneous influences on the results to produce a non-biased and reliable indication of change. With some programs, the evaluator has less control over site selection and must adapt to the realities of the situation, including any differences in the program and control samples. To address any differences, the research team weighted the data to reflect the demographic makeup of each geographic location. The weighting process entailed two major steps. In the first step, target population benchmarks were created for computation of weight factors using public data sources, such as Current Population Survey or American Community Survey, as well as commercial sources such as Claritas to obtain demographic profiles of adults in each geographic location. In the second step, an iterative proportional fitting procedure was used to balance the composition of respondents in each location to their respective demographic profiles obtained during the first step.
The awareness survey results were limited in what they communicated about the effectiveness of the overall program because baseline surveys were not administered before the program began. This design limitation was the result of a delay in obtaining data collection clearance, and eliminated the opportunity to determine the initial impact of the program on public awareness.
The small geographic size of both States and the relatively statewide reach of many media outlets may have contributed to control area exposure to the earned media activity. In addition, Connecticut used social media outlets throughout the four enforcement waves, which have few boundaries and the potential to reach a wide range of locations.
27
CONCLUSIONS
This evaluation found that texting laws are enforceable, and identified viable strategies that police can use to enforce texting laws. The evaluation suggested that having a strong set of distracted driving laws helps with enforcement of texting laws. In circumstances when enforcement cannot prove that a driver engaged in the specific behavior prohibited by a particular texting statute (e.g., reading, writing, and sending a text message), law enforcement can turn to other laws, such as handheld cellphone and impeded-operation laws, as was done in Connecticut and Massachusetts.
The outcome of this evaluation acts as a building block in the effort to better understand the issues associated with enforcement of texting laws, and to identify viable approaches that may be implemented by law enforcement agencies to address this traffic safety problem. This evaluation demonstrates that texting laws can be enforced, and it provides a resource for law enforcement agencies to guide planning and execution of texting enforcement.
28
REFERENCES
Cosgrove, L., Chaudhary, N., & Roberts S. (2010, September). High-visibility enforcement demonstration programs in Connecticut and New York reduce handheld phone use. (Report No. DOT HS 811 376). Washington, DC: National Highway Traffic Safety Administration. Available at http://www.distraction.gov/downloads/pdfs/traffic-safety-facts-09-2010.pdf
Governors Highway Safety Association. (2013). Distracted driving survey of the States. Retrieved from the GHSA web site at www.teensafedriver.com/doc/distracted-driving-survey-of-states.pdf
GHSA. (2016). Distracted Driving Laws. Retrieved from the GHSA web site at www.ghsa.org/html/stateinfo/laws/cellphone_laws.html
National Center for Statistics and Analysis. (2016, April). Distracted driving 2014 (Traffic Safety Facts Research Note. Report No. DOT HS 812 260). Washington, DC: National Highway Traffic Safety Administration. Available at https://crashstats.nhtsa.dot.gov/Api/Public/ViewPublication/812260
Pickrell, T. M., & KC, S. (2015, September). Driver electronic device use in 2014. (Traffic Safety Facts Research Note. Report No. DOT HS 812 197). Washington, DC: National Highway Traffic Safety Administration. Available at https://crashstats.nhtsa.dot.gov/Api/Public/ViewPublication/812197
Schroeder, P., Meyers, M., & Kostyniuk, L. (2013, April). National survey on distracted driving attitudes and behaviors – 2012. (Report No. DOT HS 811 729). Washington, DC: National Highway Traffic Safety Administration. Available at www.nhtsa.gov/staticfiles/nti/pdf/811729.pdf

29
Appendices
30
Appendix A: Maps of the Connecticut and Massachusetts Study Areas
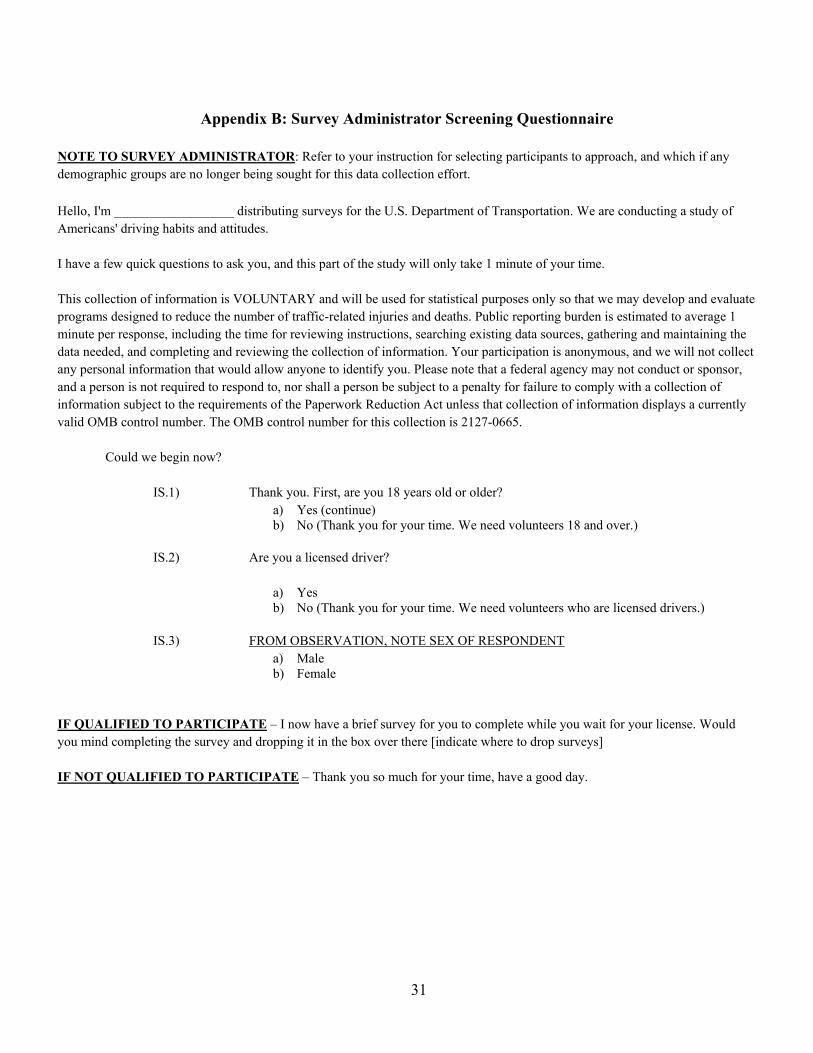
31
Appendix B: Survey Administrator Screening Questionnaire
NOTE TO SURVEY ADMINISTRATOR: Refer to your instruction for selecting participants to approach, and which if any demographic groups are no longer being sought for this data collection effort. Hello, I'm __________________ distributing surveys for the U.S. Department of Transportation. We are conducting a study of Americans' driving habits and attitudes. I have a few quick questions to ask you, and this part of the study will only take 1 minute of your time. This collection of information is VOLUNTARY and will be used for statistical purposes only so that we may develop and evaluate programs designed to reduce the number of traffic-related injuries and deaths. Public reporting burden is estimated to average 1 minute per response, including the time for reviewing instructions, searching existing data sources, gathering and maintaining the data needed, and completing and reviewing the collection of information. Your participation is anonymous, and we will not collect any personal information that would allow anyone to identify you. Please note that a federal agency may not conduct or sponsor, and a person is not required to respond to, nor shall a person be subject to a penalty for failure to comply with a collection of information subject to the requirements of the Paperwork Reduction Act unless that collection of information displays a currently valid OMB control number. The OMB control number for this collection is 2127-0665.
Could we begin now?
IS.1) Thank you. First, are you 18 years old or older? a) Yes (continue) b) No (Thank you for your time. We need volunteers 18 and over.)
IS.2) Are you a licensed driver?
a) Yes b) No (Thank you for your time. We need volunteers who are licensed drivers.)
IS.3) FROM OBSERVATION, NOTE SEX OF RESPONDENT
a) Male b) Female
IF QUALIFIED TO PARTICIPATE – I now have a brief survey for you to complete while you wait for your license. Would you mind completing the survey and dropping it in the box over there [indicate where to drop surveys] IF NOT QUALIFIED TO PARTICIPATE – Thank you so much for your time, have a good day.
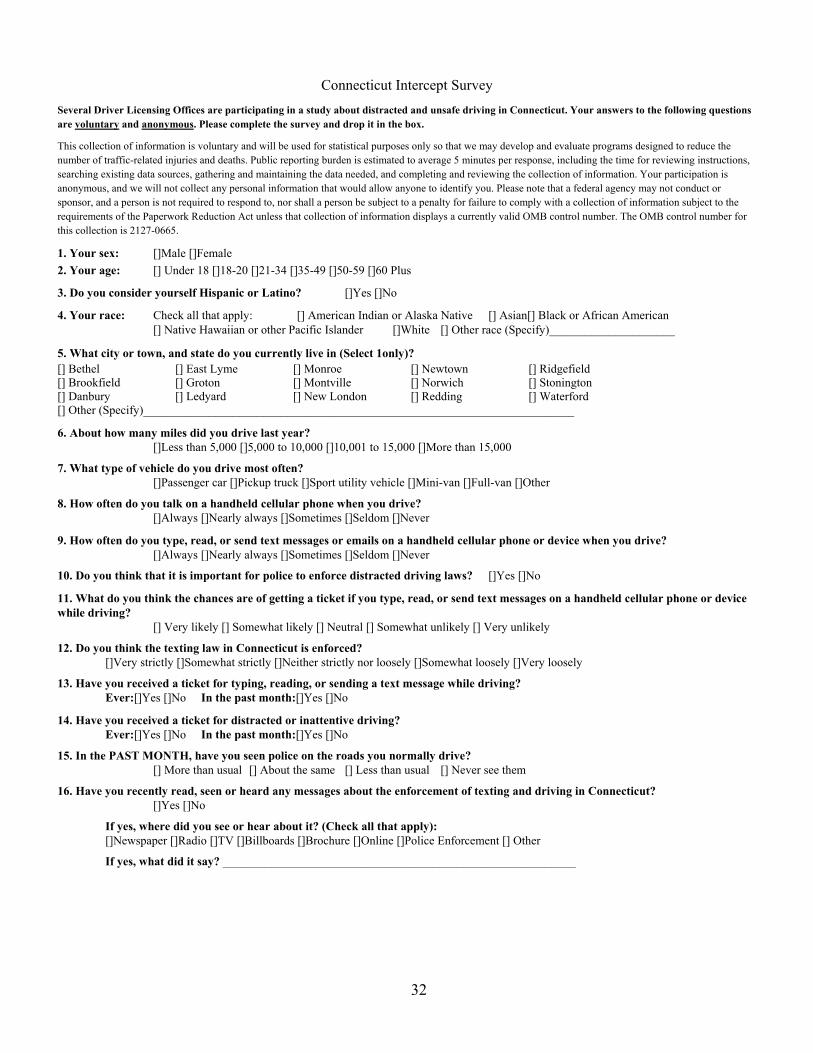
32
Connecticut Intercept Survey
Several Driver Licensing Offices are participating in a study about distracted and unsafe driving in Connecticut. Your answers to the following questions are voluntary and anonymous. Please complete the survey and drop it in the box.
This collection of information is voluntary and will be used for statistical purposes only so that we may develop and evaluate programs designed to reduce the number of traffic-related injuries and deaths. Public reporting burden is estimated to average 5 minutes per response, including the time for reviewing instructions, searching existing data sources, gathering and maintaining the data needed, and completing and reviewing the collection of information. Your participation is anonymous, and we will not collect any personal information that would allow anyone to identify you. Please note that a federal agency may not conduct or sponsor, and a person is not required to respond to, nor shall a person be subject to a penalty for failure to comply with a collection of information subject to the requirements of the Paperwork Reduction Act unless that collection of information displays a currently valid OMB control number. The OMB control number for this collection is 2127-0665.
1. Your sex: []Male []Female 2. Your age: [] Under 18 []18-20 []21-34 []35-49 []50-59 []60 Plus
3. Do you consider yourself Hispanic or Latino? []Yes []No
4. Your race: Check all that apply: [] American Indian or Alaska Native [] Asian[] Black or African American [] Native Hawaiian or other Pacific Islander []White [] Other race (Specify)_____________________
5. What city or town, and state do you currently live in (Select 1only)? [] Bethel [] East Lyme [] Monroe [] Newtown [] Ridgefield [] Brookfield [] Groton [] Montville [] Norwich [] Stonington [] Danbury [] Ledyard [] New London [] Redding [] Waterford [] Other (Specify)________________________________________________________________________
6. About how many miles did you drive last year? []Less than 5,000 []5,000 to 10,000 []10,001 to 15,000 []More than 15,000
7. What type of vehicle do you drive most often? []Passenger car []Pickup truck []Sport utility vehicle []Mini-van []Full-van []Other
8. How often do you talk on a handheld cellular phone when you drive? []Always []Nearly always []Sometimes []Seldom []Never
9. How often do you type, read, or send text messages or emails on a handheld cellular phone or device when you drive? []Always []Nearly always []Sometimes []Seldom []Never
10. Do you think that it is important for police to enforce distracted driving laws? []Yes []No
11. What do you think the chances are of getting a ticket if you type, read, or send text messages on a handheld cellular phone or device while driving? [] Very likely [] Somewhat likely [] Neutral [] Somewhat unlikely [] Very unlikely
12. Do you think the texting law in Connecticut is enforced? []Very strictly []Somewhat strictly []Neither strictly nor loosely []Somewhat loosely []Very loosely
13. Have you received a ticket for typing, reading, or sending a text message while driving? Ever:[]Yes []No In the past month:[]Yes []No
14. Have you received a ticket for distracted or inattentive driving? Ever:[]Yes []No In the past month:[]Yes []No
15. In the PAST MONTH, have you seen police on the roads you normally drive? [] More than usual [] About the same [] Less than usual [] Never see them
16. Have you recently read, seen or heard any messages about the enforcement of texting and driving in Connecticut? []Yes []No
If yes, where did you see or hear about it? (Check all that apply): []Newspaper []Radio []TV []Billboards []Brochure []Online []Police Enforcement [] Other
If yes, what did it say? ___________________________________________________________
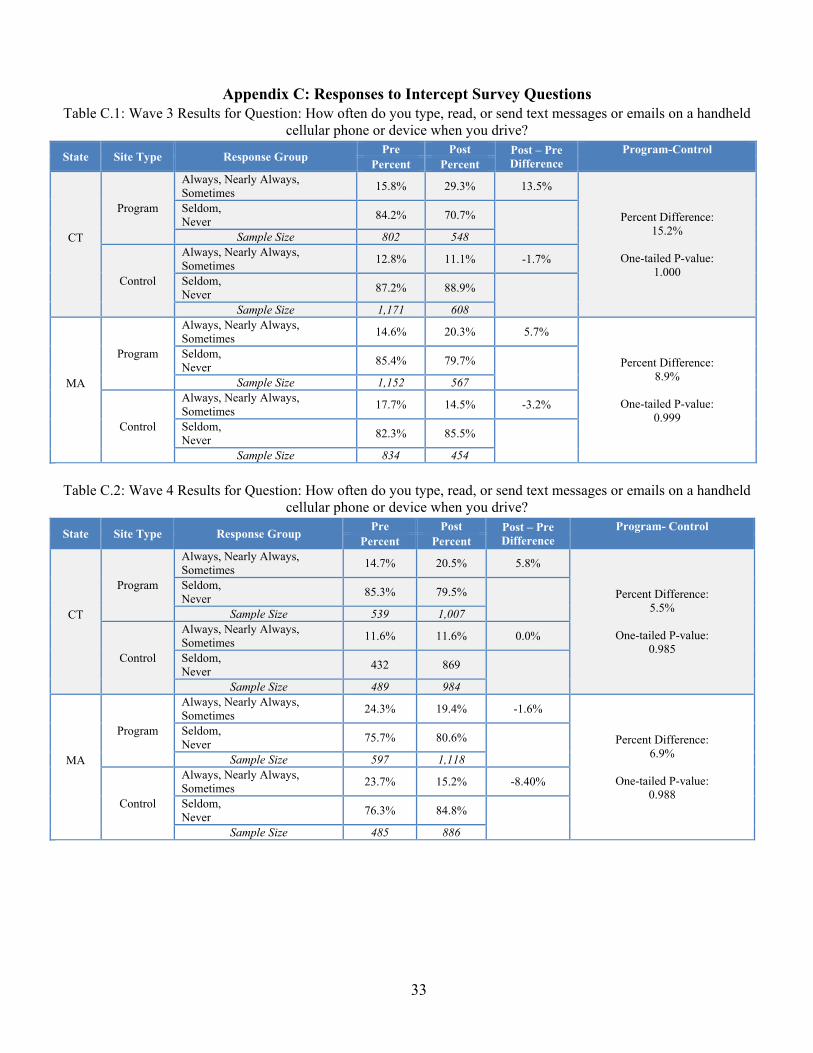
33
Appendix C: Responses to Intercept Survey Questions Table C.1: Wave 3 Results for Question: How often do you type, read, or send text messages or emails on a handheld
cellular phone or device when you drive?
State Site Type Response Group Pre Post Post – Pre Difference
Program-Control Percent Percent
CT
Program
Always, Nearly Always, Sometimes 15.8% 29.3% 13.5%
Percent Difference: 15.2%
One-tailed P-value:
1.000
Seldom, Never 84.2% 70.7%
Sample Size 802 548
Control
Always, Nearly Always, Sometimes 12.8% 11.1% -1.7%
Seldom, Never 87.2% 88.9%
Sample Size 1,171 608
MA
Program
Always, Nearly Always, Sometimes 14.6% 20.3% 5.7%
Percent Difference: 8.9%
One-tailed P-value:
0.999
Seldom, Never 85.4% 79.7%
Sample Size 1,152 567
Control
Always, Nearly Always, Sometimes 17.7% 14.5% -3.2%
Seldom, Never 82.3% 85.5%
Sample Size 834 454
Table C.2: Wave 4 Results for Question: How often do you type, read, or send text messages or emails on a handheld cellular phone or device when you drive?
State Site Type Response Group Pre Post Post – Pre Difference
Program- Control Percent Percent
CT
Program
Always, Nearly Always, Sometimes 14.7% 20.5% 5.8%
Percent Difference: 5.5%
One-tailed P-value:
0.985
Seldom, Never 85.3% 79.5%
Sample Size 539 1,007
Control
Always, Nearly Always, Sometimes 11.6% 11.6% 0.0%
Seldom, Never 432 869
Sample Size 489 984
MA
Program
Always, Nearly Always, Sometimes 24.3% 19.4% -1.6%
Percent Difference: 6.9%
One-tailed P-value:
0.988
Seldom, Never 75.7% 80.6%
Sample Size 597 1,118
Control
Always, Nearly Always, Sometimes 23.7% 15.2% -8.40%
Seldom, Never 76.3% 84.8%
Sample Size 485 886
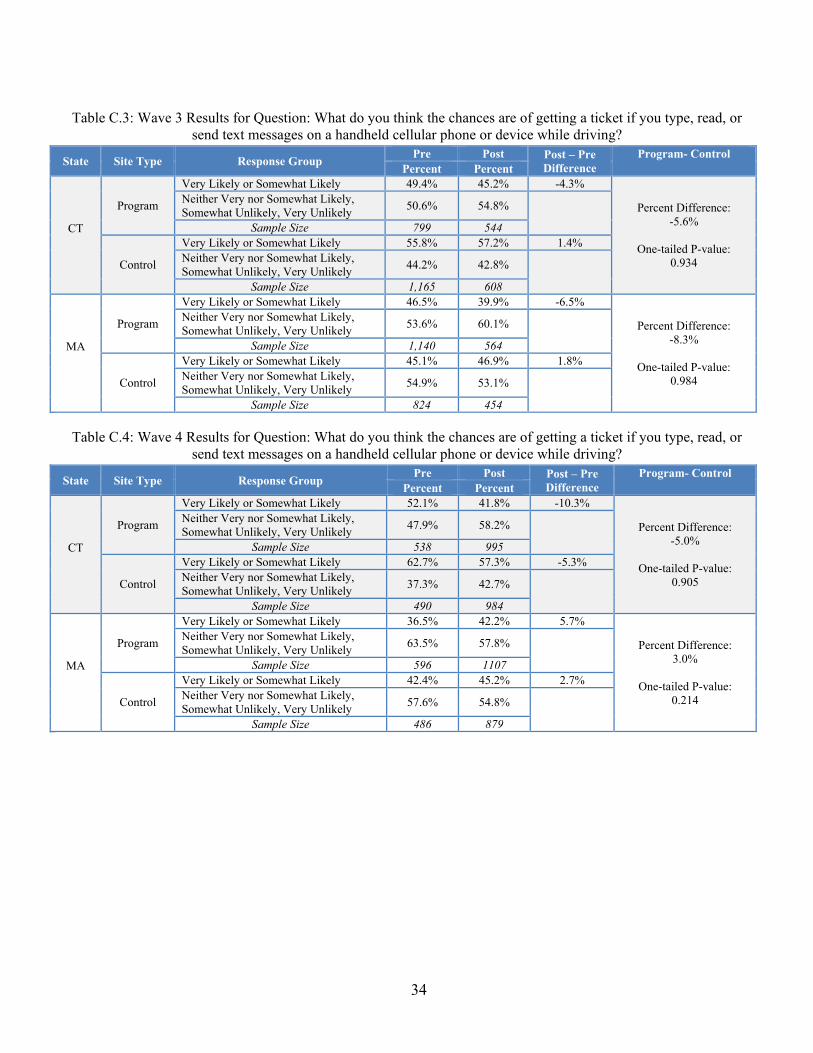
34
Table C.3: Wave 3 Results for Question: What do you think the chances are of getting a ticket if you type, read, or send text messages on a handheld cellular phone or device while driving?
State Site Type Response Group Pre Post Post – Pre Difference
Program- Control Percent Percent
CT
Program
Very Likely or Somewhat Likely 49.4% 45.2% -4.3%
Percent Difference: -5.6%
One-tailed P-value:
0.934
Neither Very nor Somewhat Likely, Somewhat Unlikely, Very Unlikely 50.6% 54.8%
Sample Size 799 544
Control
Very Likely or Somewhat Likely 55.8% 57.2% 1.4% Neither Very nor Somewhat Likely, Somewhat Unlikely, Very Unlikely 44.2% 42.8%
Sample Size 1,165 608
MA
Program
Very Likely or Somewhat Likely 46.5% 39.9% -6.5%
Percent Difference: -8.3%
One-tailed P-value:
0.984
Neither Very nor Somewhat Likely, Somewhat Unlikely, Very Unlikely 53.6% 60.1%
Sample Size 1,140 564
Control
Very Likely or Somewhat Likely 45.1% 46.9% 1.8% Neither Very nor Somewhat Likely, Somewhat Unlikely, Very Unlikely 54.9% 53.1%
Sample Size 824 454
Table C.4: Wave 4 Results for Question: What do you think the chances are of getting a ticket if you type, read, or send text messages on a handheld cellular phone or device while driving?
State Site Type Response Group Pre Post Post – Pre Difference
Program- Control Percent Percent
CT
Program
Very Likely or Somewhat Likely 52.1% 41.8% -10.3%
Percent Difference: -5.0%
One-tailed P-value:
0.905
Neither Very nor Somewhat Likely, Somewhat Unlikely, Very Unlikely 47.9% 58.2%
Sample Size 538 995
Control
Very Likely or Somewhat Likely 62.7% 57.3% -5.3% Neither Very nor Somewhat Likely, Somewhat Unlikely, Very Unlikely 37.3% 42.7%
Sample Size 490 984
MA
Program
Very Likely or Somewhat Likely 36.5% 42.2% 5.7%
Percent Difference: 3.0%
One-tailed P-value:
0.214
Neither Very nor Somewhat Likely, Somewhat Unlikely, Very Unlikely 63.5% 57.8%
Sample Size 596 1107
Control
Very Likely or Somewhat Likely 42.4% 45.2% 2.7% Neither Very nor Somewhat Likely, Somewhat Unlikely, Very Unlikely 57.6% 54.8%
Sample Size 486 879
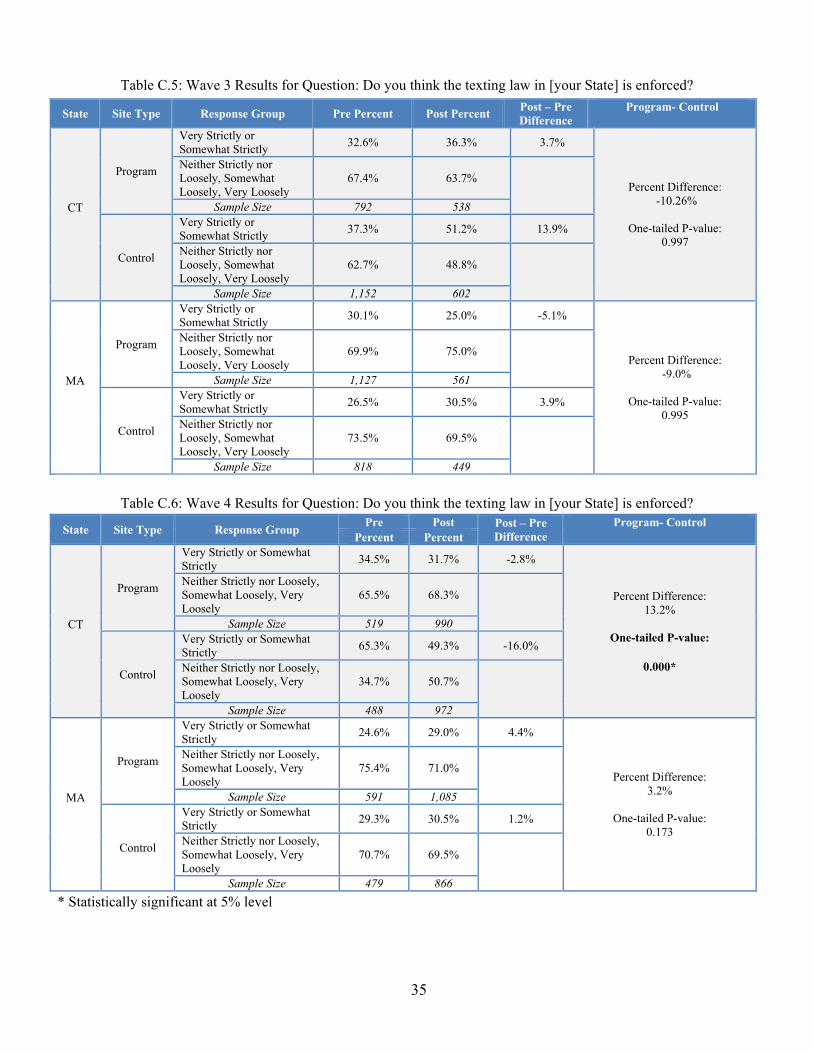
35
Table C.5: Wave 3 Results for Question: Do you think the texting law in [your State] is enforced?
State Site Type Response Group Pre Percent Post Percent Post – Pre Difference
Program- Control
CT
Program
Very Strictly or Somewhat Strictly 32.6% 36.3% 3.7%
Percent Difference: -10.26%
One-tailed P-value:
0.997
Neither Strictly nor Loosely, Somewhat Loosely, Very Loosely
67.4% 63.7%
Sample Size 792 538
Control
Very Strictly or Somewhat Strictly 37.3% 51.2% 13.9%
Neither Strictly nor Loosely, Somewhat Loosely, Very Loosely
62.7% 48.8%
Sample Size 1,152 602
MA
Program
Very Strictly or Somewhat Strictly 30.1% 25.0% -5.1%
Percent Difference: -9.0%
One-tailed P-value:
0.995
Neither Strictly nor Loosely, Somewhat Loosely, Very Loosely
69.9% 75.0%
Sample Size 1,127 561
Control
Very Strictly or Somewhat Strictly 26.5% 30.5% 3.9%
Neither Strictly nor Loosely, Somewhat Loosely, Very Loosely
73.5% 69.5%
Sample Size 818 449
Table C.6: Wave 4 Results for Question: Do you think the texting law in [your State] is enforced?
State Site Type Response Group Pre Post Post – Pre Difference
Program- Control Percent Percent
CT
Program
Very Strictly or Somewhat Strictly 34.5% 31.7% -2.8%
Percent Difference: 13.2%
One-tailed P-value:
0.000*
Neither Strictly nor Loosely, Somewhat Loosely, Very Loosely
65.5% 68.3%
Sample Size 519 990
Control
Very Strictly or Somewhat Strictly 65.3% 49.3% -16.0%
Neither Strictly nor Loosely, Somewhat Loosely, Very Loosely
34.7% 50.7%
Sample Size 488 972
MA
Program
Very Strictly or Somewhat Strictly 24.6% 29.0% 4.4%
Percent Difference: 3.2%
One-tailed P-value:
0.173
Neither Strictly nor Loosely, Somewhat Loosely, Very Loosely
75.4% 71.0%
Sample Size 591 1,085
Control
Very Strictly or Somewhat Strictly 29.3% 30.5% 1.2%
Neither Strictly nor Loosely, Somewhat Loosely, Very Loosely
70.7% 69.5%
Sample Size 479 866 * Statistically significant at 5% level
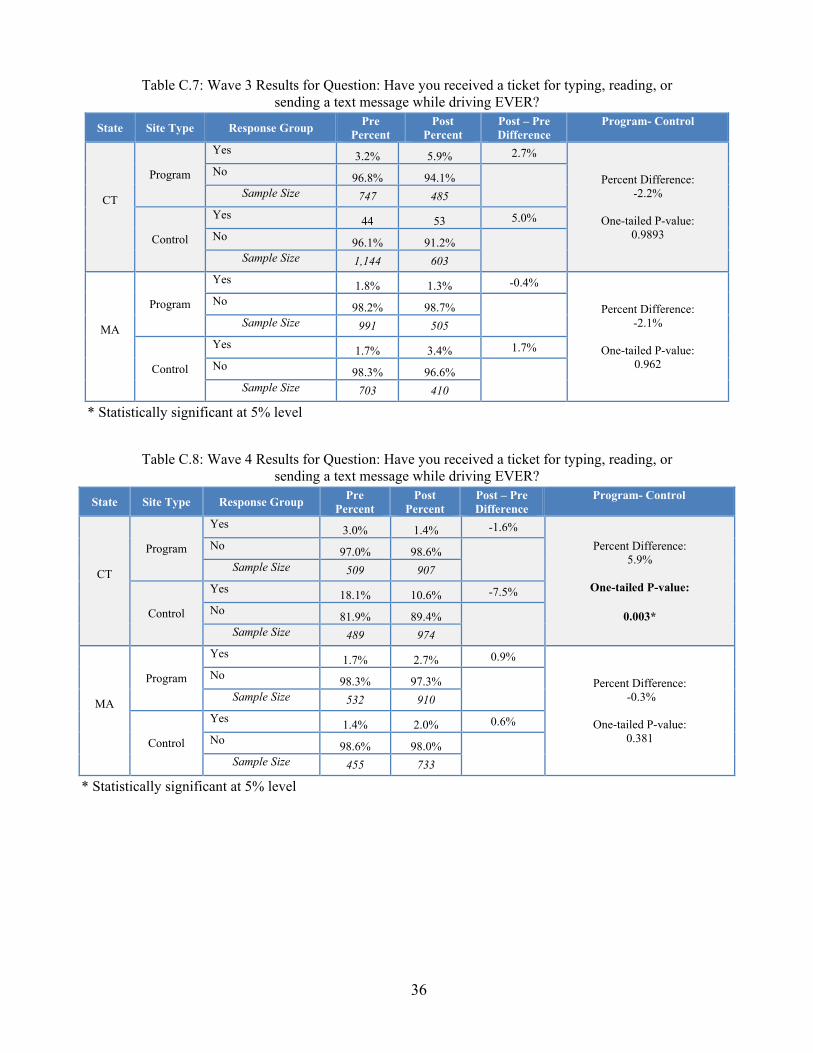
36
Table C.7: Wave 3 Results for Question: Have you received a ticket for typing, reading, or sending a text message while driving EVER?
State Site Type Response Group Pre Percent
Post Percent
Post – Pre Difference
Program- Control
CT
Program
Yes 3.2% 5.9% 2.7%
Percent Difference: -2.2%
One-tailed P-value:
0.9893
No 96.8% 94.1% Sample Size 747 485
Control
Yes 44 53 5.0% No 96.1% 91.2% Sample Size 1,144 603
MA
Program
Yes 1.8% 1.3% -0.4%
Percent Difference: -2.1%
One-tailed P-value:
0.962
No 98.2% 98.7% Sample Size 991 505
Control
Yes 1.7% 3.4% 1.7% No 98.3% 96.6% Sample Size 703 410
* Statistically significant at 5% level
Table C.8: Wave 4 Results for Question: Have you received a ticket for typing, reading, or sending a text message while driving EVER?
State Site Type Response Group Pre Percent
Post Percent
Post – Pre Difference
Program- Control
CT
Program
Yes 3.0% 1.4% -1.6% Percent Difference:
5.9%
One-tailed P-value:
0.003*
No 97.0% 98.6% Sample Size 509 907
Control
Yes 18.1% 10.6% -7.5% No 81.9% 89.4% Sample Size 489 974
MA
Program
Yes 1.7% 2.7% 0.9%
Percent Difference: -0.3%
One-tailed P-value:
0.381
No 98.3% 97.3% Sample Size 532 910
Control
Yes 1.4% 2.0% 0.6% No 98.6% 98.0% Sample Size 455 733
* Statistically significant at 5% level
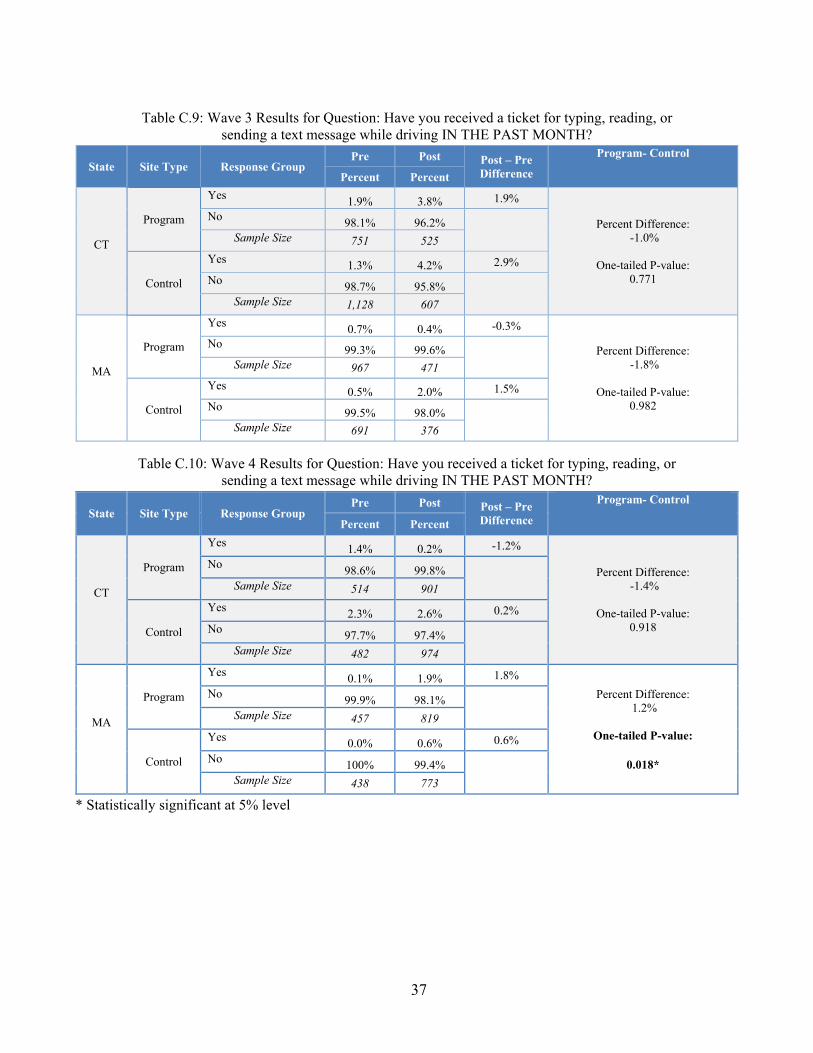
37
Table C.9: Wave 3 Results for Question: Have you received a ticket for typing, reading, or sending a text message while driving IN THE PAST MONTH?
State Site Type Response Group Pre Post Post – Pre
Difference
Program- Control
Percent Percent
CT
Program
Yes 1.9% 3.8% 1.9%
Percent Difference: -1.0%
One-tailed P-value:
0.771
No 98.1% 96.2% Sample Size 751 525
Control
Yes 1.3% 4.2% 2.9% No 98.7% 95.8% Sample Size 1,128 607
MA
Program
Yes 0.7% 0.4% -0.3%
Percent Difference: -1.8%
One-tailed P-value:
0.982
No 99.3% 99.6% Sample Size 967 471
Control
Yes 0.5% 2.0% 1.5% No 99.5% 98.0% Sample Size 691 376
Table C.10: Wave 4 Results for Question: Have you received a ticket for typing, reading, or sending a text message while driving IN THE PAST MONTH?
State Site Type Response Group Pre Post Post – Pre
Difference
Program- Control
Percent Percent
CT
Program
Yes 1.4% 0.2% -1.2%
Percent Difference: -1.4%
One-tailed P-value:
0.918
No 98.6% 99.8% Sample Size 514 901
Control
Yes 2.3% 2.6% 0.2% No 97.7% 97.4% Sample Size 482 974
MA
Program
Yes 0.1% 1.9% 1.8% Percent Difference:
1.2%
One-tailed P-value:
0.018*
No 99.9% 98.1% Sample Size 457 819
Control
Yes 0.0% 0.6% 0.6% No 100% 99.4% Sample Size 438 773
* Statistically significant at 5% level
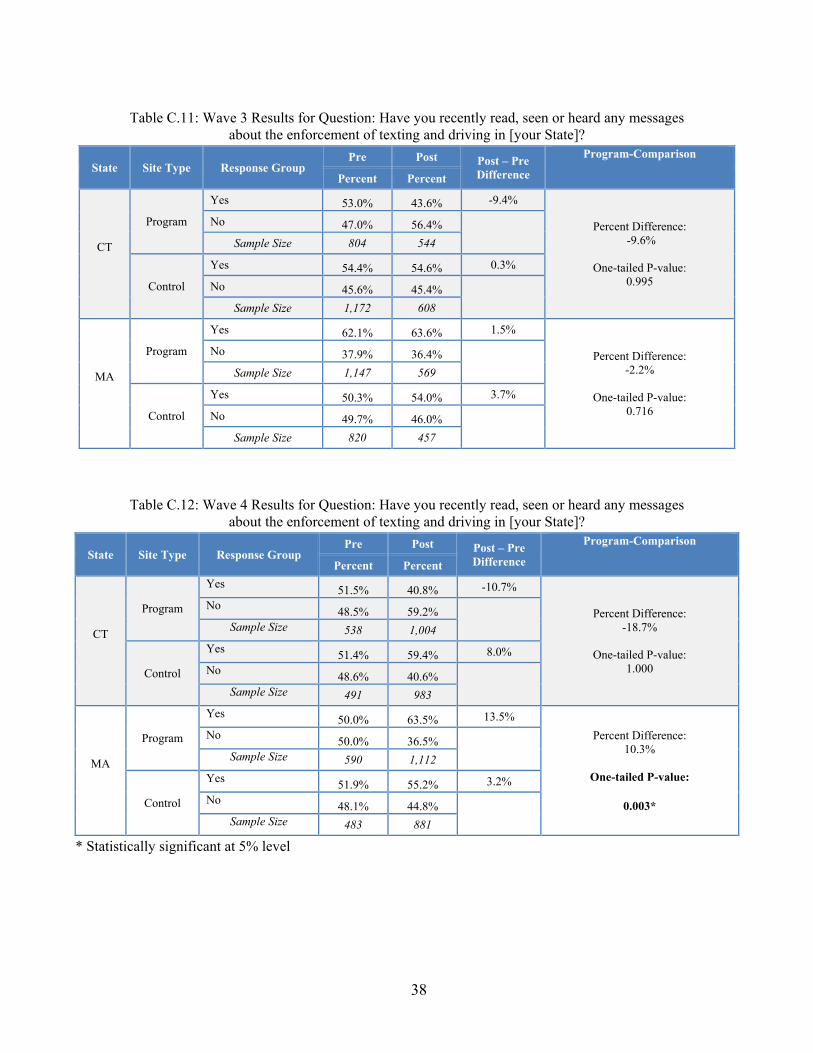
38
Table C.11: Wave 3 Results for Question: Have you recently read, seen or heard any messages about the enforcement of texting and driving in [your State]?
State Site Type Response Group Pre Post Post – Pre
Difference
Program-Comparison
Percent Percent
CT
Program
Yes 53.0% 43.6% -9.4%
Percent Difference: -9.6%
One-tailed P-value:
0.995
No 47.0% 56.4% Sample Size 804 544
Control
Yes 54.4% 54.6% 0.3%
No 45.6% 45.4% Sample Size 1,172 608
MA
Program
Yes 62.1% 63.6% 1.5%
Percent Difference: -2.2%
One-tailed P-value:
0.716
No 37.9% 36.4% Sample Size 1,147 569
Control
Yes 50.3% 54.0% 3.7%
No 49.7% 46.0% Sample Size 820 457
Table C.12: Wave 4 Results for Question: Have you recently read, seen or heard any messages about the enforcement of texting and driving in [your State]?
State Site Type Response Group Pre Post Post – Pre
Difference
Program-Comparison
Percent Percent
CT
Program
Yes 51.5% 40.8% -10.7%
Percent Difference: -18.7%
One-tailed P-value:
1.000
No 48.5% 59.2% Sample Size 538 1,004
Control
Yes 51.4% 59.4% 8.0% No 48.6% 40.6% Sample Size 491 983
MA
Program
Yes 50.0% 63.5% 13.5% Percent Difference:
10.3%
One-tailed P-value:
0.003*
No 50.0% 36.5% Sample Size 590 1,112
Control
Yes 51.9% 55.2% 3.2% No 48.1% 44.8% Sample Size 483 881
* Statistically significant at 5% level
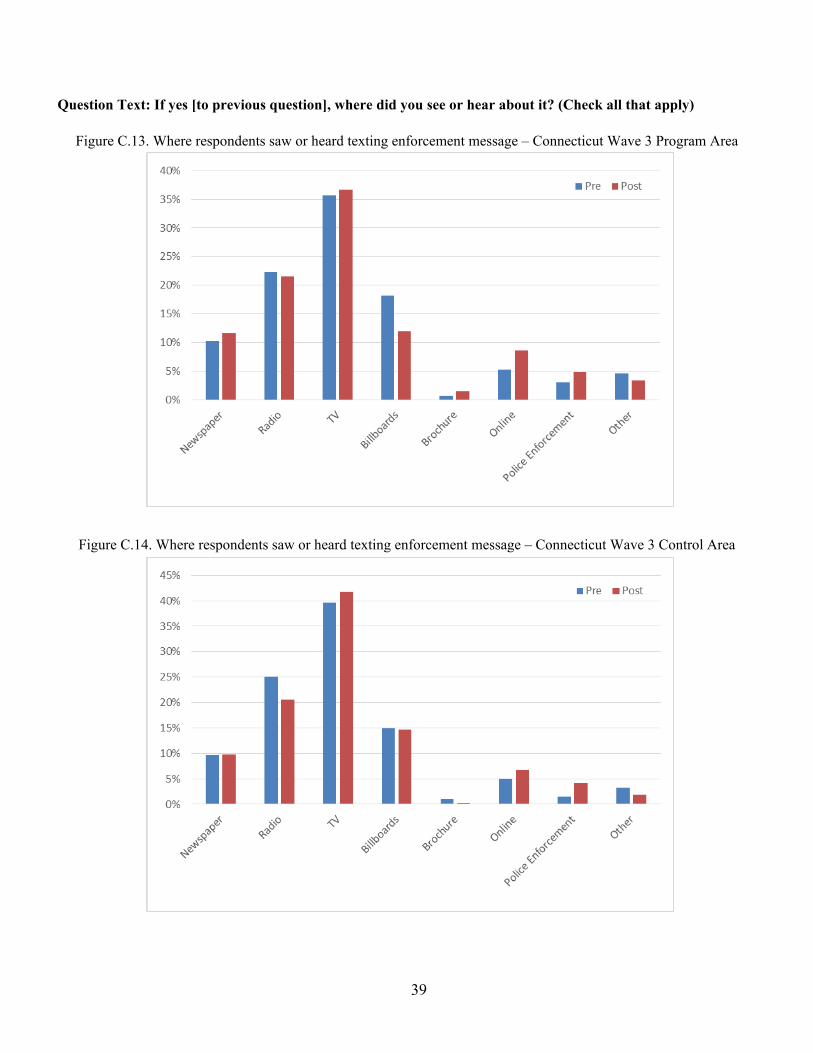
39
Question Text: If yes [to previous question], where did you see or hear about it? (Check all that apply)
Figure C.13. Where respondents saw or heard texting enforcement message – Connecticut Wave 3 Program Area
Figure C.14. Where respondents saw or heard texting enforcement message – Connecticut Wave 3 Control Area
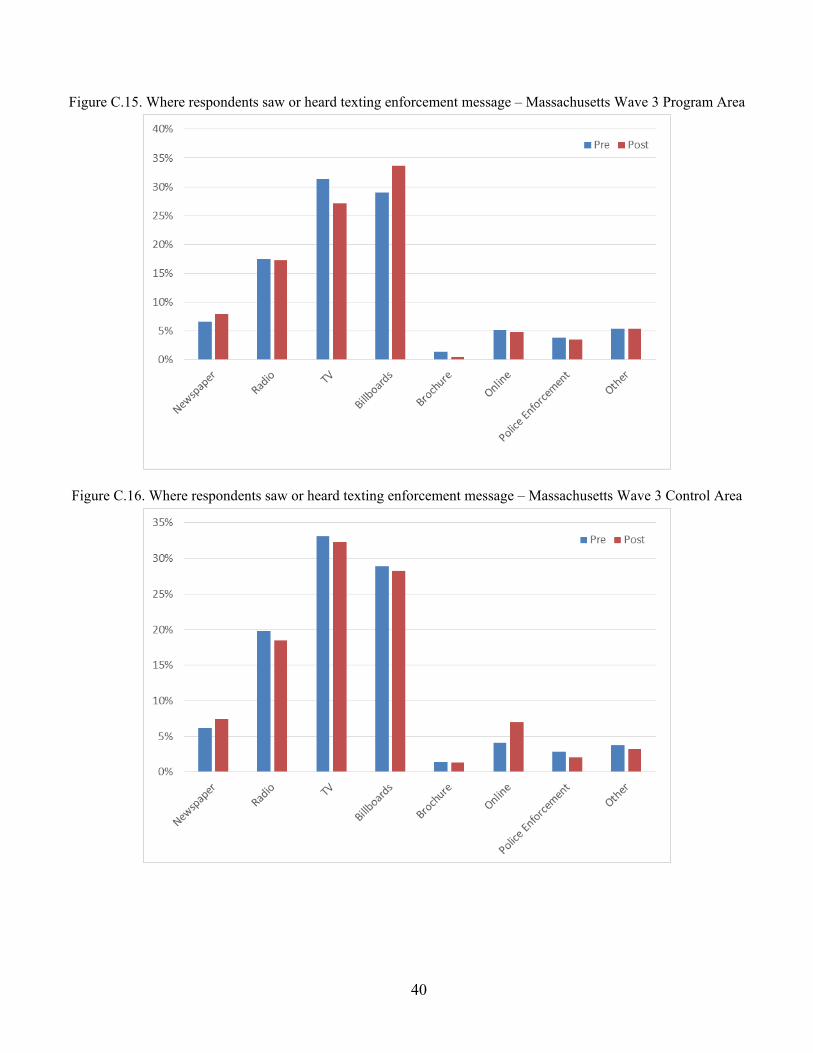
40
Figure C.15. Where respondents saw or heard texting enforcement message – Massachusetts Wave 3 Program Area
Figure C.16. Where respondents saw or heard texting enforcement message – Massachusetts Wave 3 Control Area
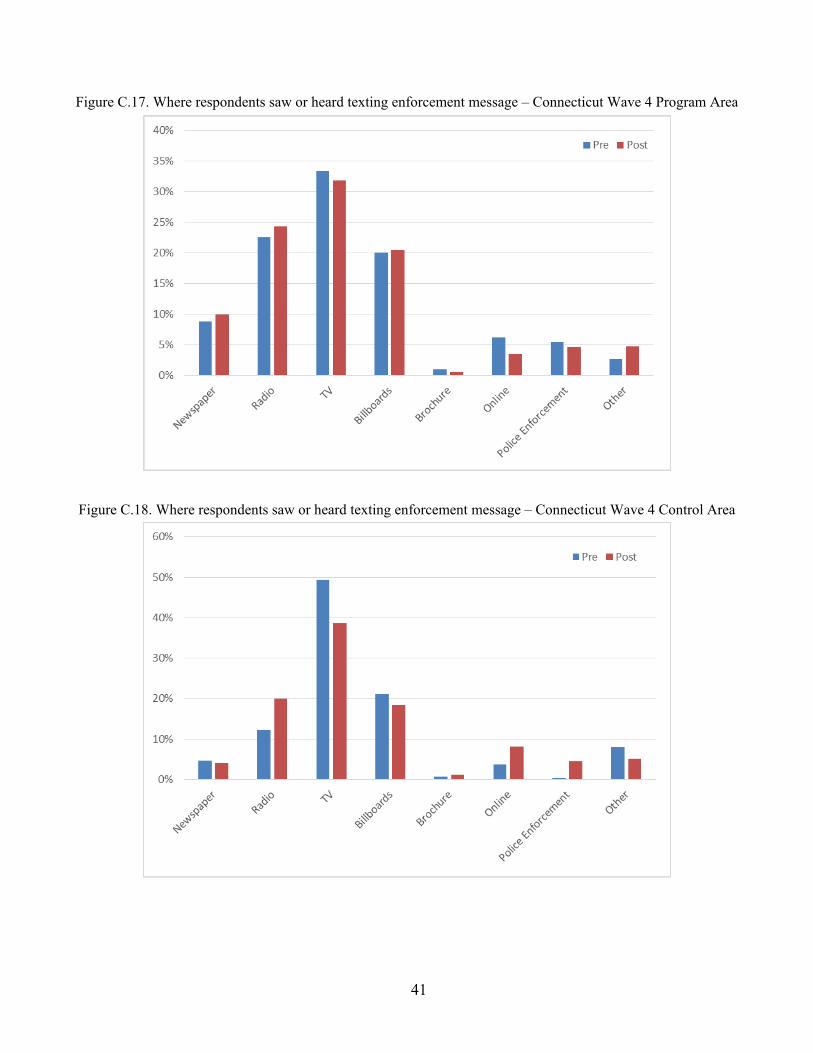
41
Figure C.17. Where respondents saw or heard texting enforcement message – Connecticut Wave 4 Program Area
Figure C.18. Where respondents saw or heard texting enforcement message – Connecticut Wave 4 Control Area
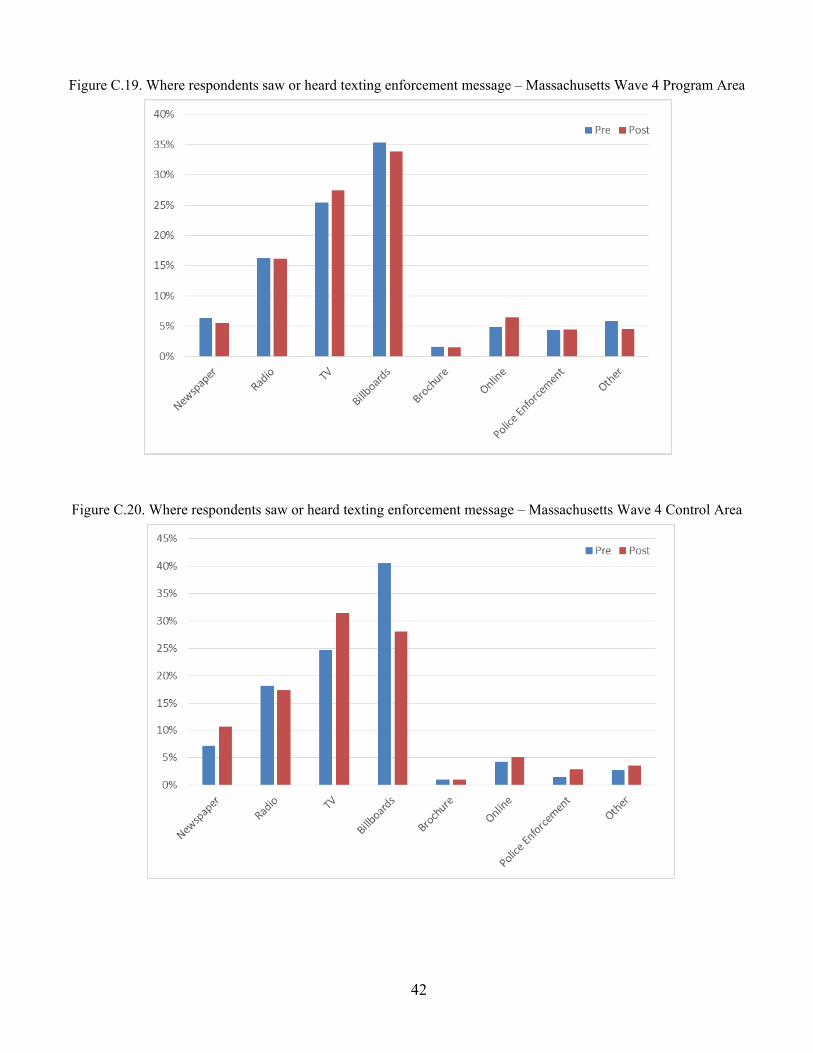
42
Figure C.19. Where respondents saw or heard texting enforcement message – Massachusetts Wave 4 Program Area
Figure C.20. Where respondents saw or heard texting enforcement message – Massachusetts Wave 4 Control Area
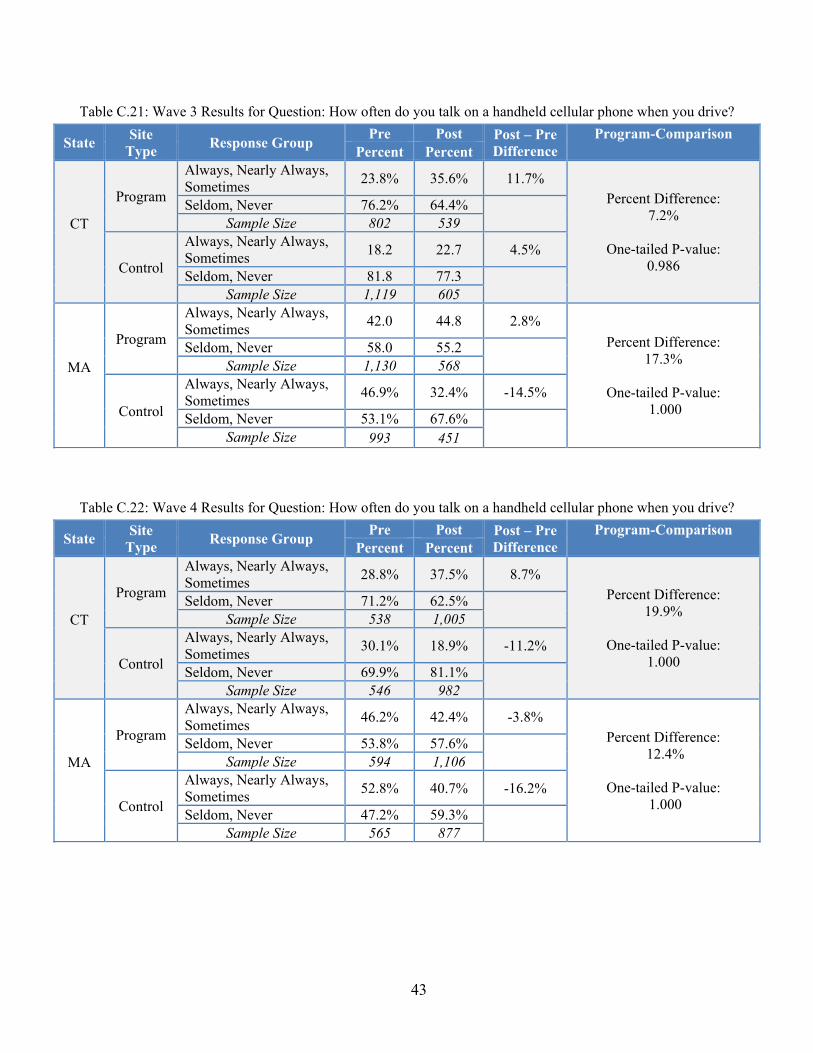
43
Table C.21: Wave 3 Results for Question: How often do you talk on a handheld cellular phone when you drive?
State Site Type Response Group Pre Post Post – Pre
Difference Program-Comparison
Percent Percent
CT
Program
Always, Nearly Always, Sometimes 23.8% 35.6% 11.7%
Percent Difference: 7.2%
One-tailed P-value:
0.986
Seldom, Never 76.2% 64.4% Sample Size 802 539
Control
Always, Nearly Always, Sometimes 18.2 22.7 4.5%
Seldom, Never 81.8 77.3 Sample Size 1,119 605
MA
Program
Always, Nearly Always, Sometimes 42.0 44.8 2.8%
Percent Difference: 17.3%
One-tailed P-value:
1.000
Seldom, Never 58.0 55.2 Sample Size 1,130 568
Control
Always, Nearly Always, Sometimes 46.9% 32.4% -14.5%
Seldom, Never 53.1% 67.6% Sample Size 993 451
Table C.22: Wave 4 Results for Question: How often do you talk on a handheld cellular phone when you drive?
State Site Type Response Group Pre Post Post – Pre
Difference Program-Comparison
Percent Percent
CT
Program
Always, Nearly Always, Sometimes 28.8% 37.5% 8.7%
Percent Difference: 19.9%
One-tailed P-value:
1.000
Seldom, Never 71.2% 62.5% Sample Size 538 1,005
Control
Always, Nearly Always, Sometimes 30.1% 18.9% -11.2%
Seldom, Never 69.9% 81.1% Sample Size 546 982
MA
Program
Always, Nearly Always, Sometimes 46.2% 42.4% -3.8%
Percent Difference: 12.4%
One-tailed P-value:
1.000
Seldom, Never 53.8% 57.6% Sample Size 594 1,106
Control
Always, Nearly Always, Sometimes 52.8% 40.7% -16.2%
Seldom, Never 47.2% 59.3% Sample Size 565 877
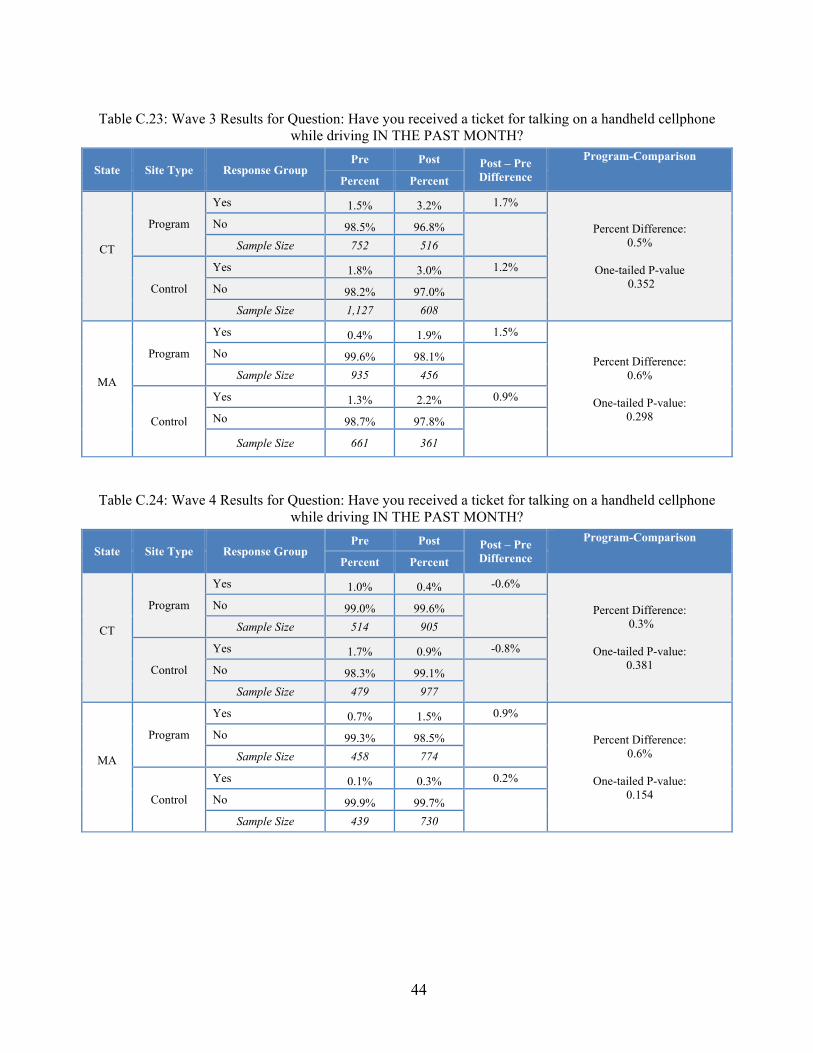
44
Table C.23: Wave 3 Results for Question: Have you received a ticket for talking on a handheld cellphone while driving IN THE PAST MONTH?
State Site Type Response Group Pre Post Post – Pre
Difference
Program-Comparison
Percent Percent
CT
Program
Yes 1.5% 3.2% 1.7%
Percent Difference: 0.5%
One-tailed P-value
0.352
No 98.5% 96.8% Sample Size 752 516
Control
Yes 1.8% 3.0% 1.2%
No 98.2% 97.0% Sample Size 1,127 608
MA
Program
Yes 0.4% 1.9% 1.5%
Percent Difference: 0.6%
One-tailed P-value:
0.298
No 99.6% 98.1% Sample Size 935 456
Control
Yes 1.3% 2.2% 0.9%
No 98.7% 97.8%
Sample Size 661 361
Table C.24: Wave 4 Results for Question: Have you received a ticket for talking on a handheld cellphone while driving IN THE PAST MONTH?
State Site Type Response Group Pre Post Post – Pre
Difference
Program-Comparison
Percent Percent
CT
Program
Yes 1.0% 0.4% -0.6%
Percent Difference: 0.3%
One-tailed P-value:
0.381
No 99.0% 99.6% Sample Size 514 905
Control
Yes 1.7% 0.9% -0.8%
No 98.3% 99.1% Sample Size 479 977
MA
Program
Yes 0.7% 1.5% 0.9%
Percent Difference: 0.6%
One-tailed P-value:
0.154
No 99.3% 98.5% Sample Size 458 774
Control
Yes 0.1% 0.3% 0.2%
No 99.9% 99.7% Sample Size 439 730
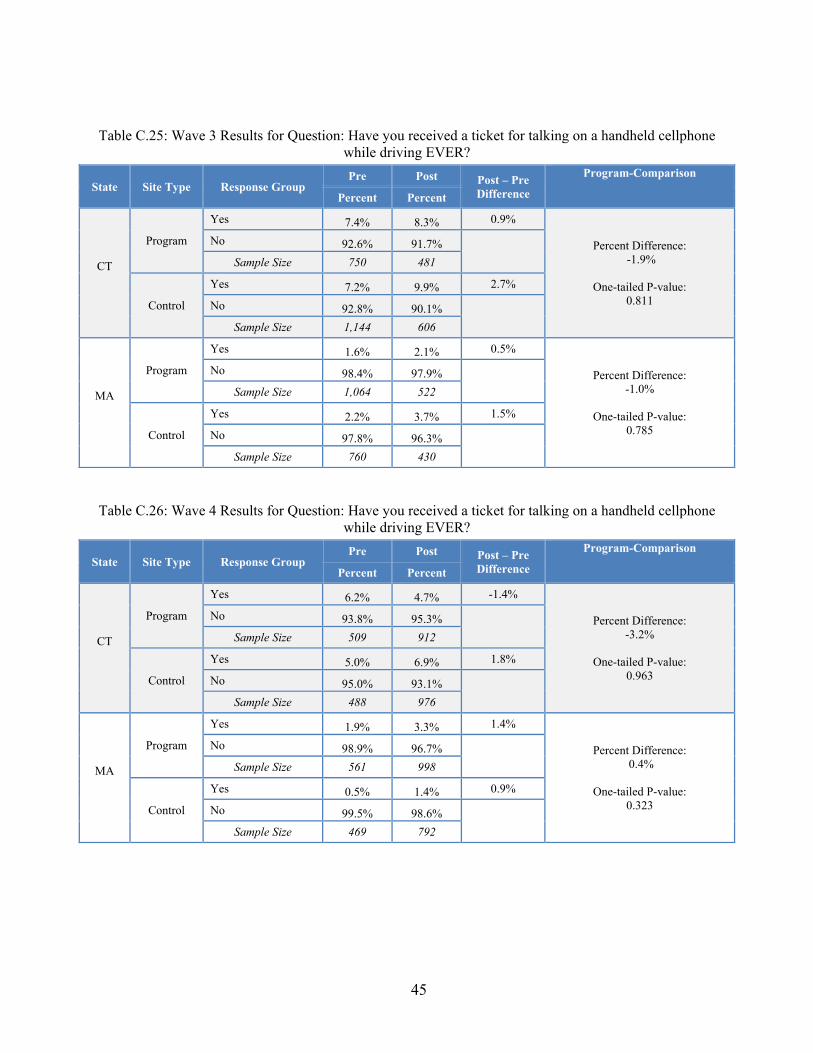
45
Table C.25: Wave 3 Results for Question: Have you received a ticket for talking on a handheld cellphone while driving EVER?
State Site Type Response Group Pre Post Post – Pre
Difference
Program-Comparison
Percent Percent
CT
Program
Yes 7.4% 8.3% 0.9%
Percent Difference: -1.9%
One-tailed P-value:
0.811
No 92.6% 91.7% Sample Size 750 481
Control
Yes 7.2% 9.9% 2.7%
No 92.8% 90.1% Sample Size 1,144 606
MA
Program
Yes 1.6% 2.1% 0.5%
Percent Difference: -1.0%
One-tailed P-value:
0.785
No 98.4% 97.9% Sample Size 1,064 522
Control
Yes 2.2% 3.7% 1.5%
No 97.8% 96.3% Sample Size 760 430
Table C.26: Wave 4 Results for Question: Have you received a ticket for talking on a handheld cellphone while driving EVER?
State Site Type Response Group Pre Post Post – Pre
Difference
Program-Comparison
Percent Percent
CT
Program
Yes 6.2% 4.7% -1.4%
Percent Difference: -3.2%
One-tailed P-value:
0.963
No 93.8% 95.3% Sample Size 509 912
Control
Yes 5.0% 6.9% 1.8%
No 95.0% 93.1% Sample Size 488 976
MA
Program
Yes 1.9% 3.3% 1.4%
Percent Difference: 0.4%
One-tailed P-value:
0.323
No 98.9% 96.7% Sample Size 561 998
Control
Yes 0.5% 1.4% 0.9%
No 99.5% 98.6% Sample Size 469 792
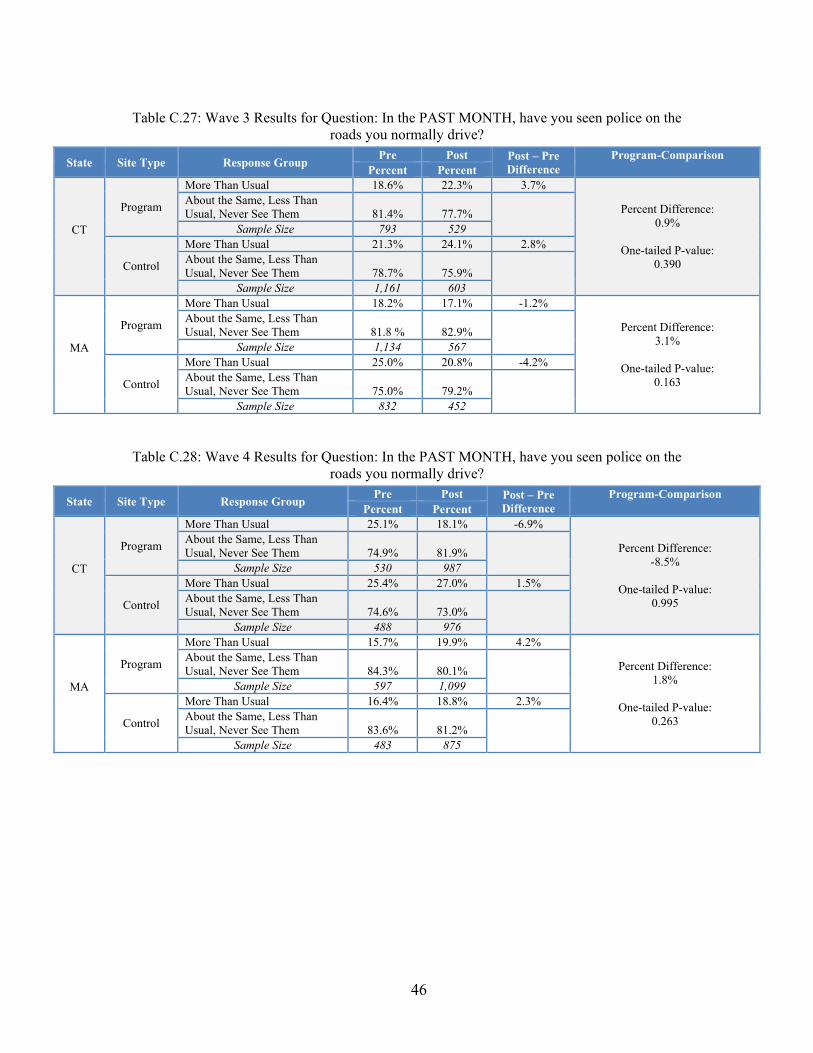
46
Table C.27: Wave 3 Results for Question: In the PAST MONTH, have you seen police on the roads you normally drive?
State Site Type Response Group Pre Post Post – Pre Difference
Program-Comparison Percent Percent
CT
Program
More Than Usual 18.6% 22.3% 3.7%
Percent Difference: 0.9%
One-tailed P-value:
0.390
About the Same, Less Than Usual, Never See Them 81.4% 77.7%
Sample Size 793 529
Control
More Than Usual 21.3% 24.1% 2.8% About the Same, Less Than Usual, Never See Them 78.7% 75.9%
Sample Size 1,161 603
MA
Program
More Than Usual 18.2% 17.1% -1.2%
Percent Difference: 3.1%
One-tailed P-value:
0.163
About the Same, Less Than Usual, Never See Them 81.8 % 82.9%
Sample Size 1,134 567
Control
More Than Usual 25.0% 20.8% -4.2% About the Same, Less Than Usual, Never See Them 75.0% 79.2%
Sample Size 832 452
Table C.28: Wave 4 Results for Question: In the PAST MONTH, have you seen police on the
roads you normally drive?
State Site Type Response Group Pre Post Post – Pre Difference
Program-Comparison Percent Percent
CT
Program
More Than Usual 25.1% 18.1% -6.9%
Percent Difference: -8.5%
One-tailed P-value:
0.995
About the Same, Less Than Usual, Never See Them 74.9% 81.9%
Sample Size 530 987
Control
More Than Usual 25.4% 27.0% 1.5% About the Same, Less Than Usual, Never See Them 74.6% 73.0%
Sample Size 488 976
MA
Program
More Than Usual 15.7% 19.9% 4.2%
Percent Difference: 1.8%
One-tailed P-value:
0.263
About the Same, Less Than Usual, Never See Them 84.3% 80.1%
Sample Size 597 1,099
Control
More Than Usual 16.4% 18.8% 2.3% About the Same, Less Than Usual, Never See Them 83.6% 81.2%
Sample Size 483 875
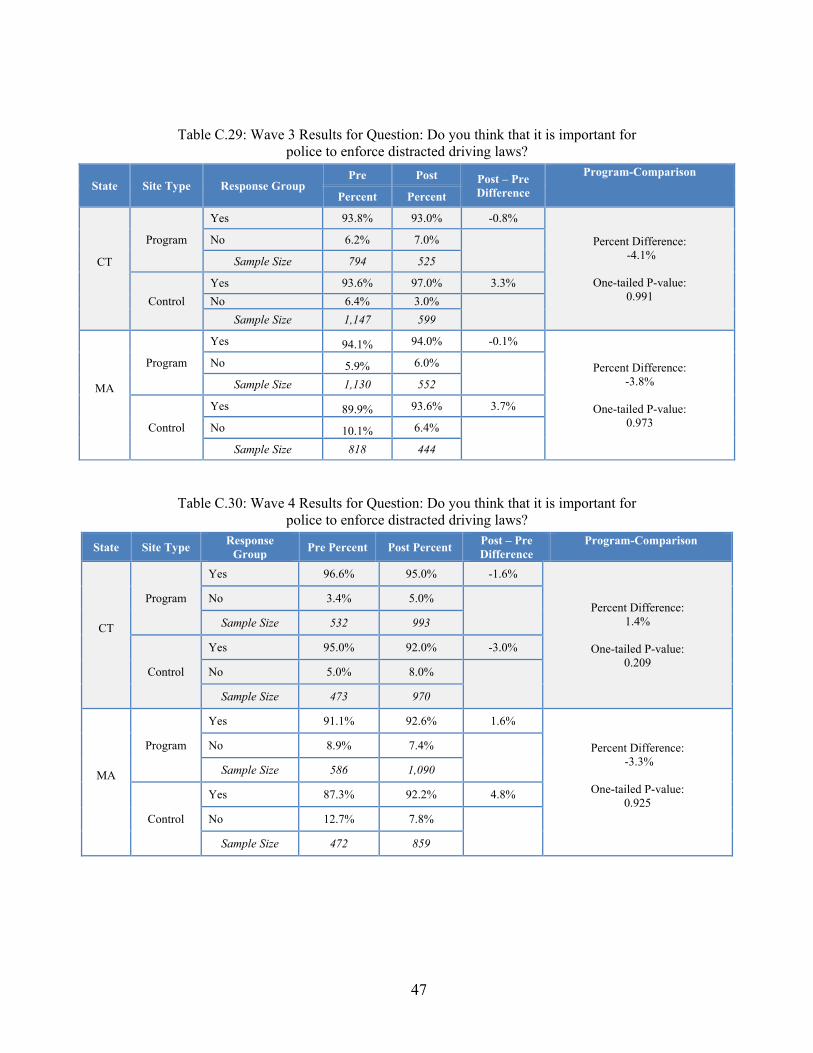
47
Table C.29: Wave 3 Results for Question: Do you think that it is important for
police to enforce distracted driving laws?
State Site Type Response Group Pre Post Post – Pre
Difference
Program-Comparison
Percent Percent
CT
Program
Yes 93.8% 93.0% -0.8%
Percent Difference: -4.1%
One-tailed P-value:
0.991
No 6.2% 7.0%
Sample Size 794 525
Control Yes 93.6% 97.0% 3.3% No 6.4% 3.0%
Sample Size 1,147 599
MA
Program
Yes 94.1% 94.0% -0.1%
Percent Difference: -3.8%
One-tailed P-value:
0.973
No 5.9% 6.0%
Sample Size 1,130 552
Control
Yes 89.9% 93.6% 3.7%
No 10.1% 6.4%
Sample Size 818 444
Table C.30: Wave 4 Results for Question: Do you think that it is important for police to enforce distracted driving laws?
State Site Type Response Group Pre Percent Post Percent Post – Pre
Difference Program-Comparison
CT
Program
Yes 96.6% 95.0% -1.6%
Percent Difference: 1.4%
One-tailed P-value:
0.209
No 3.4% 5.0%
Sample Size 532 993
Control
Yes 95.0% 92.0% -3.0%
No 5.0% 8.0%
Sample Size 473 970
MA
Program
Yes 91.1% 92.6% 1.6%
Percent Difference: -3.3%
One-tailed P-value:
0.925
No 8.9% 7.4%
Sample Size 586 1,090
Control
Yes 87.3% 92.2% 4.8%
No 12.7% 7.8%
Sample Size 472 859
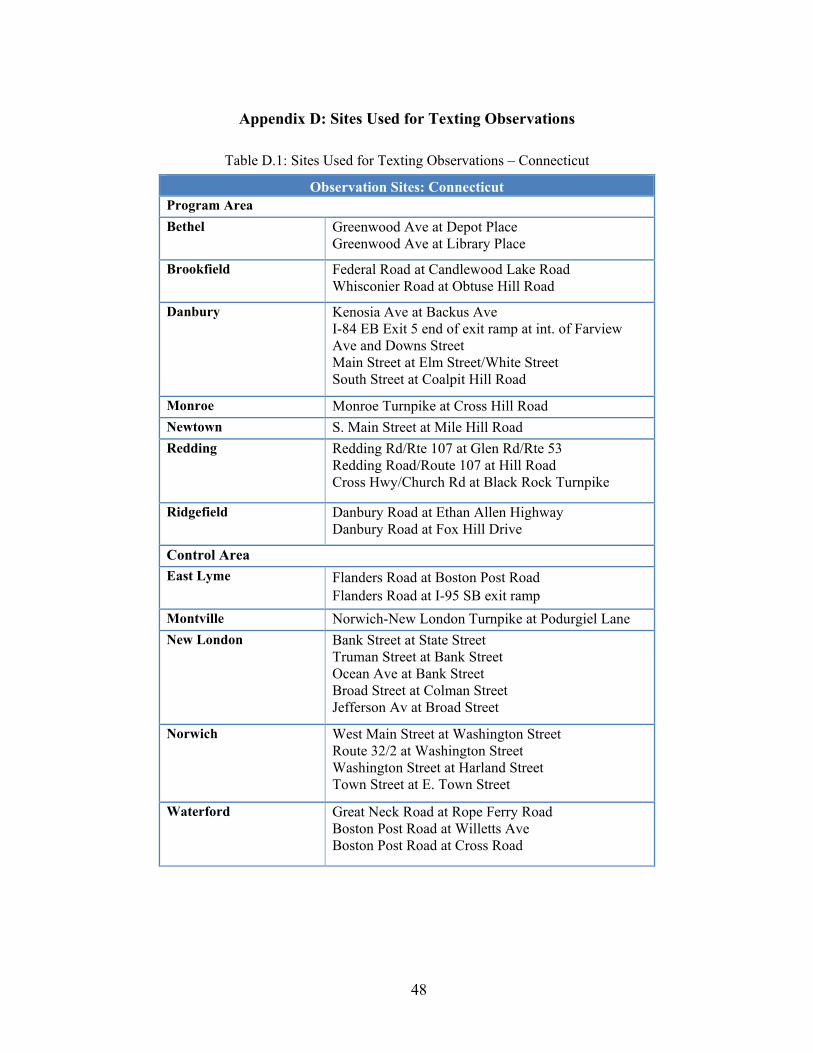
48
Appendix D: Sites Used for Texting Observations
Table D.1: Sites Used for Texting Observations – Connecticut
Observation Sites: Connecticut Program Area Bethel Greenwood Ave at Depot Place
Greenwood Ave at Library Place
Brookfield Federal Road at Candlewood Lake Road Whisconier Road at Obtuse Hill Road
Danbury Kenosia Ave at Backus Ave I-84 EB Exit 5 end of exit ramp at int. of Farview Ave and Downs Street Main Street at Elm Street/White Street South Street at Coalpit Hill Road
Monroe Monroe Turnpike at Cross Hill Road Newtown S. Main Street at Mile Hill Road Redding Redding Rd/Rte 107 at Glen Rd/Rte 53
Redding Road/Route 107 at Hill Road Cross Hwy/Church Rd at Black Rock Turnpike
Ridgefield Danbury Road at Ethan Allen Highway Danbury Road at Fox Hill Drive
Control Area East Lyme Flanders Road at Boston Post Road
Flanders Road at I-95 SB exit ramp Montville Norwich-New London Turnpike at Podurgiel Lane New London Bank Street at State Street
Truman Street at Bank Street Ocean Ave at Bank Street Broad Street at Colman Street Jefferson Av at Broad Street
Norwich West Main Street at Washington Street Route 32/2 at Washington Street Washington Street at Harland Street Town Street at E. Town Street
Waterford Great Neck Road at Rope Ferry Road Boston Post Road at Willetts Ave Boston Post Road at Cross Road
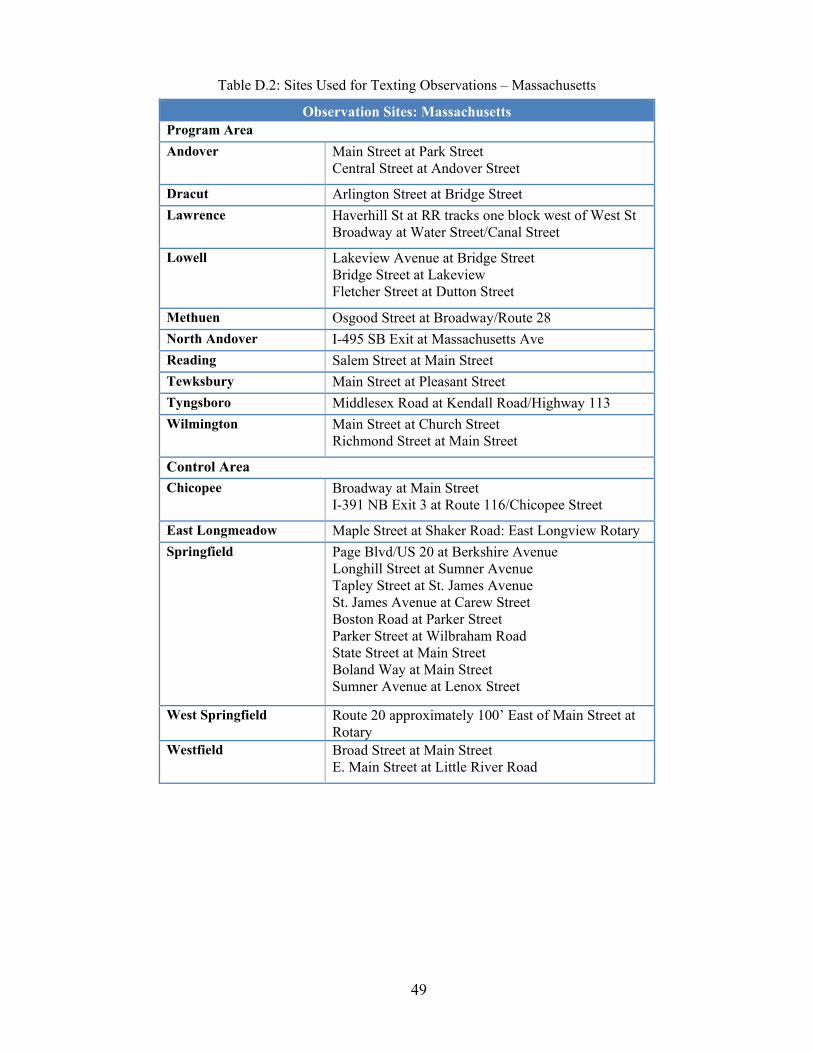
49
Table D.2: Sites Used for Texting Observations – Massachusetts
Observation Sites: Massachusetts Program Area Andover Main Street at Park Street
Central Street at Andover Street
Dracut Arlington Street at Bridge Street Lawrence Haverhill St at RR tracks one block west of West St
Broadway at Water Street/Canal Street
Lowell Lakeview Avenue at Bridge Street Bridge Street at Lakeview Fletcher Street at Dutton Street
Methuen Osgood Street at Broadway/Route 28 North Andover I-495 SB Exit at Massachusetts Ave Reading Salem Street at Main Street Tewksbury Main Street at Pleasant Street Tyngsboro Middlesex Road at Kendall Road/Highway 113 Wilmington Main Street at Church Street
Richmond Street at Main Street
Control Area Chicopee Broadway at Main Street
I-391 NB Exit 3 at Route 116/Chicopee Street
East Longmeadow Maple Street at Shaker Road: East Longview Rotary Springfield Page Blvd/US 20 at Berkshire Avenue
Longhill Street at Sumner Avenue Tapley Street at St. James Avenue St. James Avenue at Carew Street Boston Road at Parker Street Parker Street at Wilbraham Road State Street at Main Street Boland Way at Main Street Sumner Avenue at Lenox Street
West Springfield Route 20 approximately 100’ East of Main Street at Rotary
Westfield Broad Street at Main Street E. Main Street at Little River Road
50
Appendix E: Selected Examples of Earned Media
> Use of conventional press outreach
Massachusetts Wave 1 –Earned media outreach (press release and press conference) resulted in a total of 16 print/online articles including two op-eds, 1 radio segment, and 3 television stories.
The Massachusetts Wave 1 press release
The HSD staff sent the following media advisory on June 3 in advance of the mobilization kick off press event on Wednesday, June 5:
MEDIA ADVISORY:
For Immediate Release Contact: Cindy Campbell 617-725-3351
June Crackdown on Distracted Driving Announced
Effort Funded by New NHTSA Federal Grant
Boston – Monday, June 3, 2013 – Massachusetts has been awarded $275,000 in National Highway Traffic Safety Administration [F]ederal grant funds to increase enforcement of the Massachusetts Safe Driving Law which bans the sending, typing or reading of electronic messages to or from handheld devices while operating a motor vehicle and a complete ban on the use of all handheld electronic devices by junior operators while behind the wheel. This pilot project, called “Text With One Hand, Ticket In The Other,” will give Massachusetts State Police (MSP) the ability to test the high-visibility enforcement (HVE) model and effectively observe distracted driver behaviors through proven enforcement strategies. The Safe Driving Law signed by Governor Patrick became effective on September 30, 2010.
The specialized enforcement will take place in two to four week intervals over the next two years. The first installment will occur from June 10 to June 29 on state roadways in the twelve communities covered by MSP Troop A-1: Andover, Dracut, Dunstable, Lawrence, Lowell, Methuen, North Andover, North Reading, Reading, Tewksbury, Tyngsboro and Wilmington.
51
State Officials from the Executive Office of Public Safety and Security (EOPSS), MSP, and NHTSA are scheduled to gather Wednesday at Troop A-1 headquarters in Andover to discuss this vitally important public safety law and the hope for this national pilot project.
WHEN: Wednesday, June 5, 2013, 10:00 AM
WHERE: Troop A-1 Barracks
Route 125
Andover, MA 02151
WHO:
• Lieutenant Colonel Edward Amodeo, Massachusetts State Police • Anne Powers, Undersecretary of Law Enforcement, Executive Office of Public Safety and Security • Maria E. Vegega, Ph.D., Chief, NHTSA Occupant Protection Division • Mike Geraci, Administrator, NHTSA Region 1 • Dr. Donald Fisher, University of Massachusetts Amherst, distracted driving expert
A recent National Safety Council study has shown that nationwide, 24 percent of all crashes are related to the use of handheld electronic devices while driving.
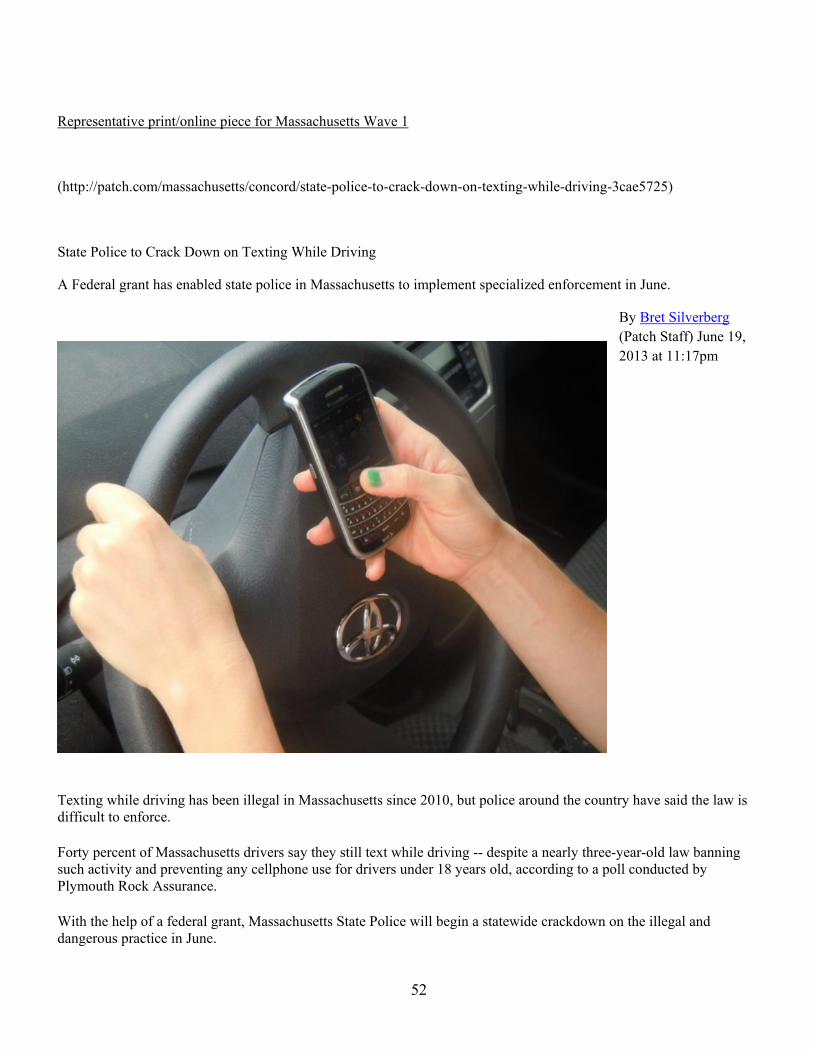
52
Representative print/online piece for Massachusetts Wave 1
(http://patch.com/massachusetts/concord/state-police-to-crack-down-on-texting-while-driving-3cae5725)
State Police to Crack Down on Texting While Driving
A Federal grant has enabled state police in Massachusetts to implement specialized enforcement in June.
By Bret Silverberg (Patch Staff) June 19, 2013 at 11:17pm
Texting while driving has been illegal in Massachusetts since 2010, but police around the country have said the law is difficult to enforce.
Forty percent of Massachusetts drivers say they still text while driving -- despite a nearly three-year-old law banning such activity and preventing any cellphone use for drivers under 18 years old, according to a poll conducted by Plymouth Rock Assurance.
With the help of a federal grant, Massachusetts State Police will begin a statewide crackdown on the illegal and dangerous practice in June.

53
The National Highway Traffic Safety Administration has awarded the state a $275,000 federal grant to increase enforcement of the Safe Driving Law, which bans the sending, typing or reading of electronic messages to or from handheld devices while operating a motor vehicle and a complete ban on the use of all handheld electronic devices by junior operators while behind the wheel, according to a state police press statement Tuesday.
The law was enacted in Massachusetts Sept. 30, 2010.
The program, called “Text With One Hand, Ticket In The Other,” will make use of a “high visibility enforcement” model which uses informational road signs, command posts other tools which make the enforcement obvious to the public, according to the NHTSA website.
This specialized enforcement will take place in two to four week intervals over the next two years, according to the police statement. The first installment will occur from June 10-29 on state roadways in Andover, Dracut, Dunstable, Lawrence, Lowell, Methuen, North Andover, North Reading, Reading, Tewksbury, Tyngsboro and Wilmington.
A recent National Safety Council study has shown that nationwide, 24 percent of all crashes are related to the use of handheld electronic devices while driving, the statement says. As many as 3,000 deaths per year are caused by distracted driving, according to Boston Medical Center.
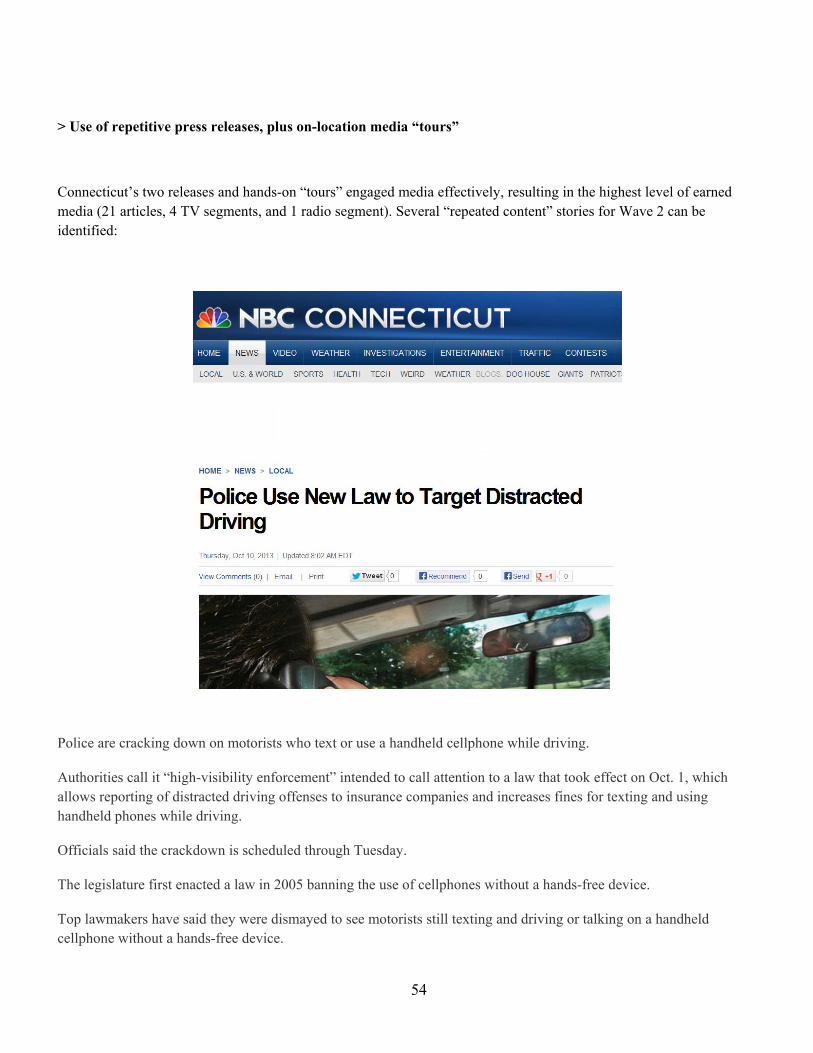
54
> Use of repetitive press releases, plus on-location media “tours”
Connecticut’s two releases and hands-on “tours” engaged media effectively, resulting in the highest level of earned media (21 articles, 4 TV segments, and 1 radio segment). Several “repeated content” stories for Wave 2 can be identified:
Police are cracking down on motorists who text or use a handheld cellphone while driving.
Authorities call it “high-visibility enforcement” intended to call attention to a law that took effect on Oct. 1, which allows reporting of distracted driving offenses to insurance companies and increases fines for texting and using handheld phones while driving.
Officials said the crackdown is scheduled through Tuesday.
The legislature first enacted a law in 2005 banning the use of cellphones without a hands-free device.
Top lawmakers have said they were dismayed to see motorists still texting and driving or talking on a handheld cellphone without a hands-free device.
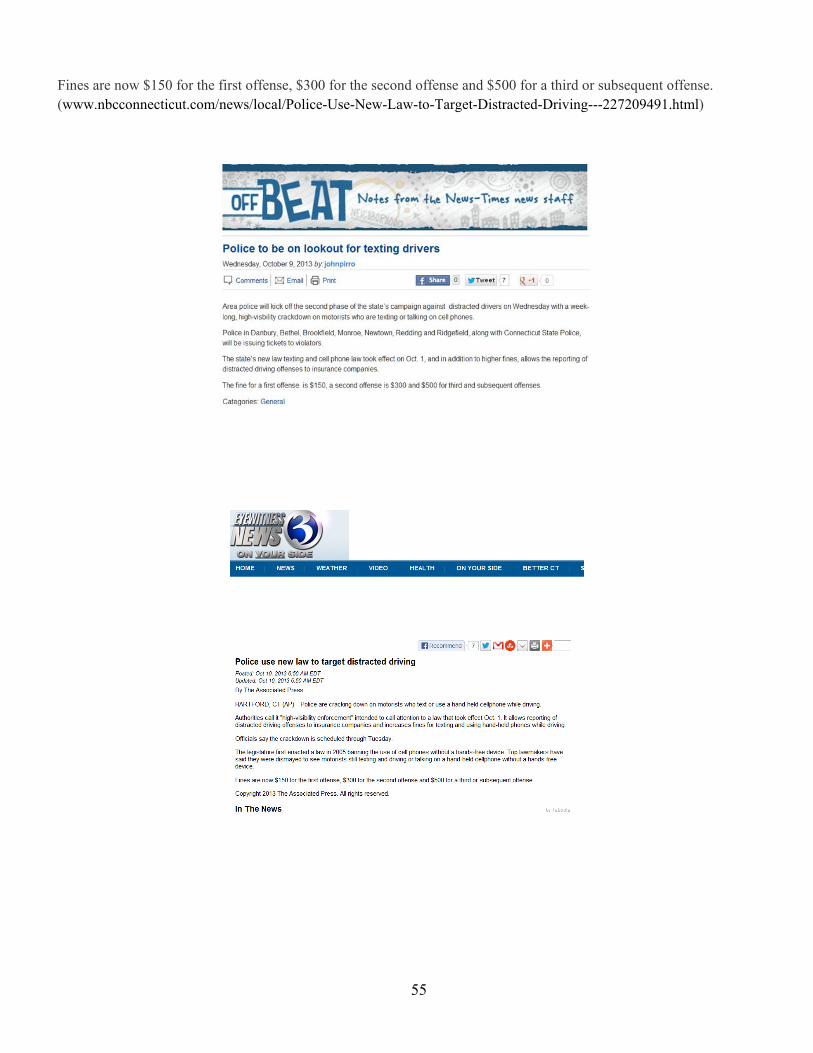
55
Fines are now $150 for the first offense, $300 for the second offense and $500 for a third or subsequent offense. (www.nbcconnecticut.com/news/local/Police-Use-New-Law-to-Target-Distracted-Driving---227209491.html)
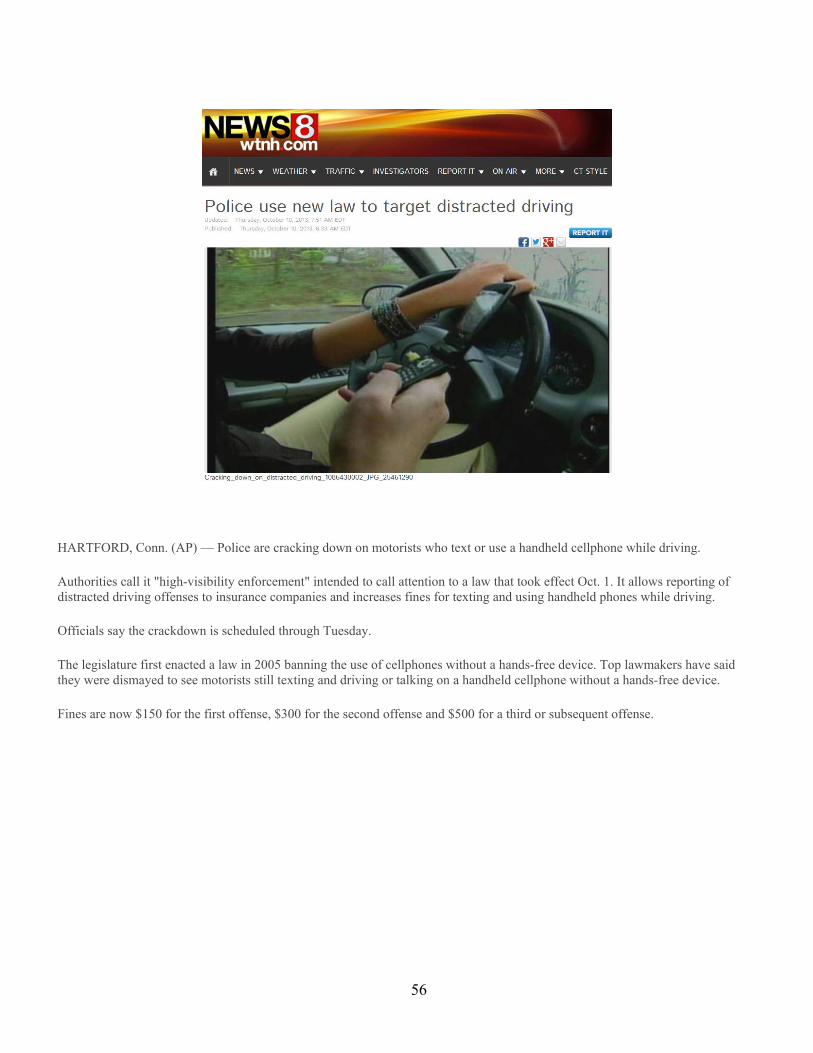
56
HARTFORD, Conn. (AP) — Police are cracking down on motorists who text or use a handheld cellphone while driving.
Authorities call it "high-visibility enforcement" intended to call attention to a law that took effect Oct. 1. It allows reporting of distracted driving offenses to insurance companies and increases fines for texting and using handheld phones while driving.
Officials say the crackdown is scheduled through Tuesday.
The legislature first enacted a law in 2005 banning the use of cellphones without a hands-free device. Top lawmakers have said they were dismayed to see motorists still texting and driving or talking on a handheld cellphone without a hands-free device.
Fines are now $150 for the first offense, $300 for the second offense and $500 for a third or subsequent offense.
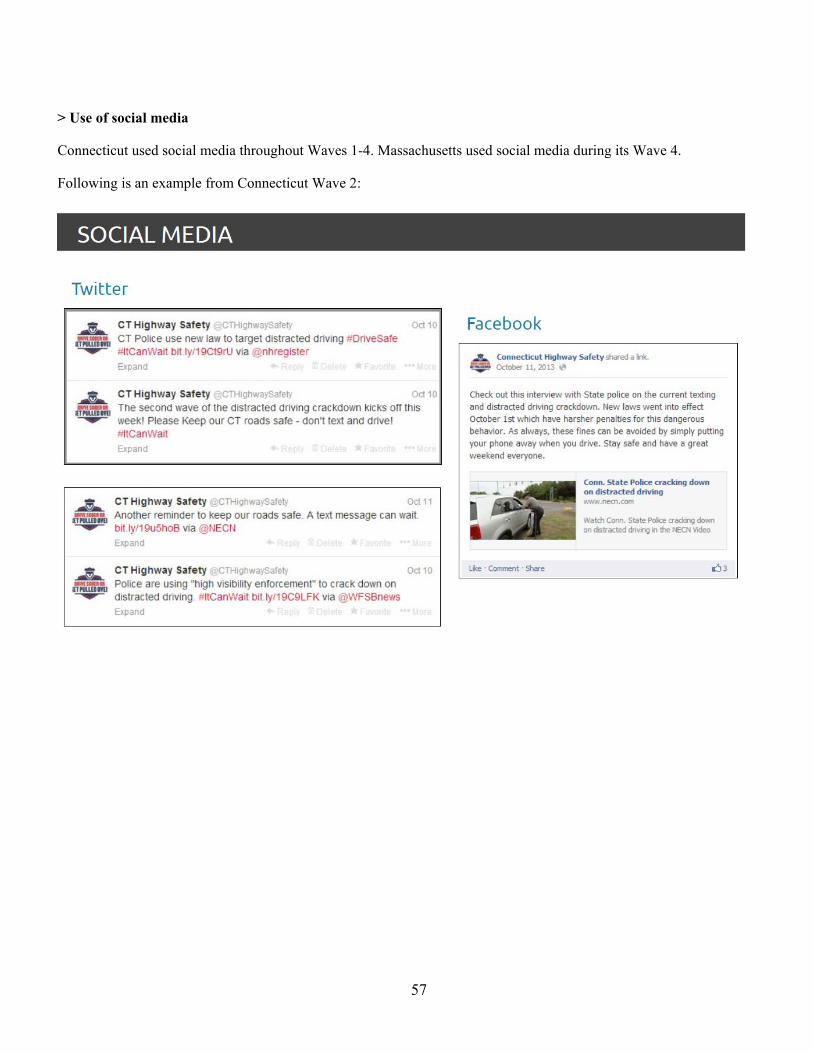
57
> Use of social media
Connecticut used social media throughout Waves 1-4. Massachusetts used social media during its Wave 4.
Following is an example from Connecticut Wave 2:
12717-031517-v3
DOT HS 812 367March 2017