evaluating hypotheses. lehrstuhl für informatik 2 gabriella kókai: maschine learning 2 some...
Post on 18-Dec-2015
214 views
TRANSCRIPT
Evaluating Hypotheses
2Lehrstuhl für Informatik 2
Gabriella Kókai: Maschine Learning
Some notices Exam can be made in Artificial Intelligence (Department 8)
Invitation: ERASMUS INFOABEND Mittwoch 16.11.05 19.00 Kollegienhaus R. 0.016 Universitätsstr 15 Programm: Nach einer kurze Einführung werden ehemalige
Austauschstudenten von ihren Erfahrungen in Spanien Großbritannien, Polen, Lettland, Frankreich etc. und Fragen des Publikums beantworten

3Lehrstuhl für Informatik 2
Gabriella Kókai: Maschine Learning
Context
➔ Motivation Terms Estimating Hypothesis Accuracy Basics of Sampling Theory Difference in Error of Two Hypotheses Comparing Learning Algorithms Summary
4Lehrstuhl für Informatik 2
Gabriella Kókai: Maschine Learning
Motivation
Goal: Introduction to statistical methods for estimating hypothesis accuracy, focusing on the followings:
Given the observed accuracy of a hypothesis over a limited sample of data, how well does this estimate its accuracy over additional examples?
Given that one hypothesis outperforms another over some sample of data, how probable is it that this hypothesis is more accurate in general?
When data is limited what is the best way to use this data to both learn a hypothesis and estimate its accuracy?
5Lehrstuhl für Informatik 2
Gabriella Kókai: Maschine Learning
Motivation 2
It is important to evaluate the performance of the learned hypotheses as precisely as possible:
To understand whether to use the hypothesis Example: Learning from limited-size database indicating the
effectiveness of different medical treatments Evaluating hypotheses is an integral component of many learning
methods Example: in post-pruning decision trees to avoid overfiting
Methods for comparing the accuracy of two hypotheses Methods for comparing two learning algorithms when only limited
data is available
6Lehrstuhl für Informatik 2
Gabriella Kókai: Maschine Learning
Motivation 3
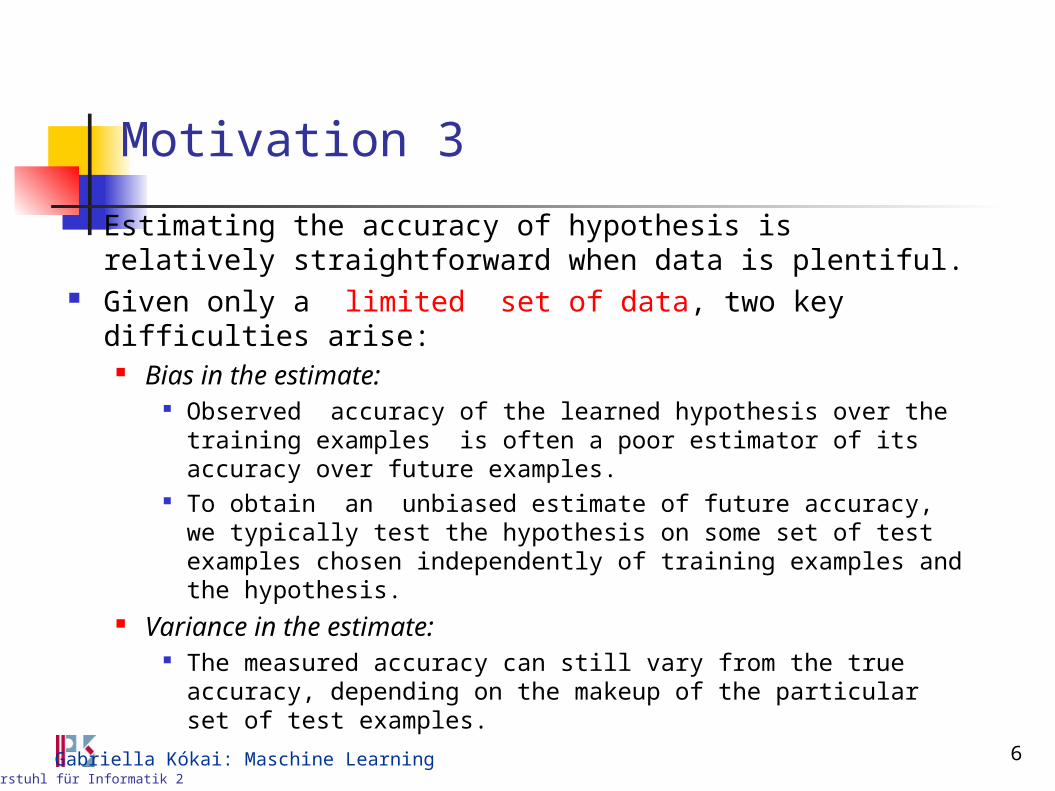
Estimating the accuracy of hypothesis is relatively straightforward when data is plentiful.
Given only a limited set of data, two key difficulties arise: Bias in the estimate:
Observed accuracy of the learned hypothesis over the training examples is often a poor estimator of its accuracy over future examples.
To obtain an unbiased estimate of future accuracy, we typically test the hypothesis on some set of test examples chosen independently of training examples and the hypothesis.
Variance in the estimate: The measured accuracy can still vary from the true accuracy, depending
on the makeup of the particular set of test examples.
7Lehrstuhl für Informatik 2
Gabriella Kókai: Maschine Learning
Context
Motivation Terms Estimating Hypothesis Accuracy Basics of Sampling Theory Difference in Error of Two Hypotheses Comparing Learning Algorithms Summary
8Lehrstuhl für Informatik 2
Gabriella Kókai: Maschine Learning
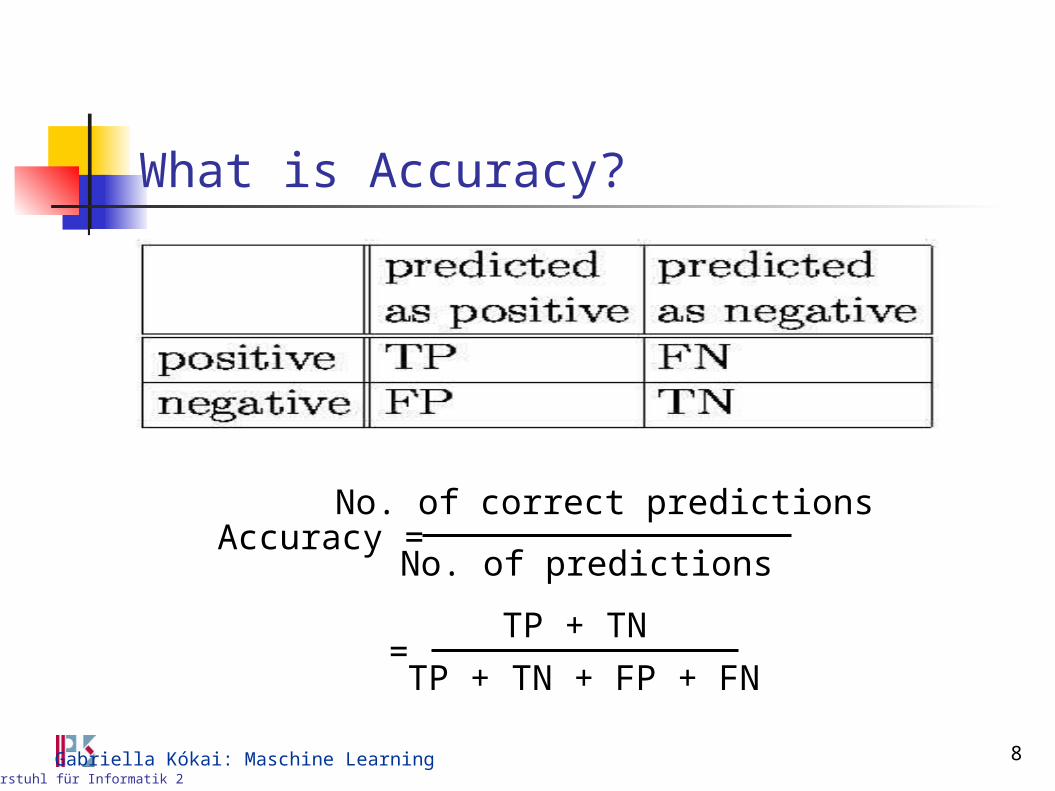
What is Accuracy?
Accuracy =No. of correct predictions
No. of predictions
=TP + TN
TP + TN + FP + FN
9Lehrstuhl für Informatik 2
Gabriella Kókai: Maschine Learning
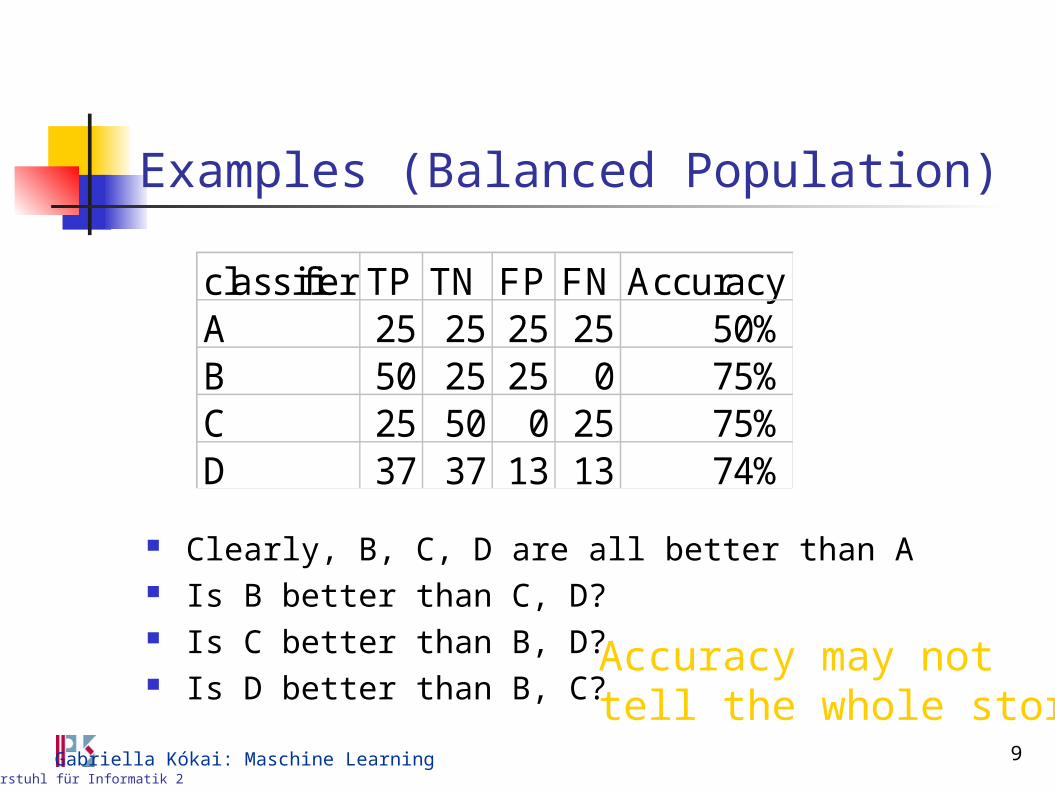
Examples (Balanced Population)
Clearly, B, C, D are all better than A Is B better than C, D? Is C better than B, D? Is D better than B, C?
classifier TP TN FP FN AccuracyA 25 25 25 25 50%B 50 25 25 0 75%C 25 50 0 25 75%D 37 37 13 13 74%
Accuracy may nottell the whole story
10Lehrstuhl für Informatik 2
Gabriella Kókai: Maschine Learning
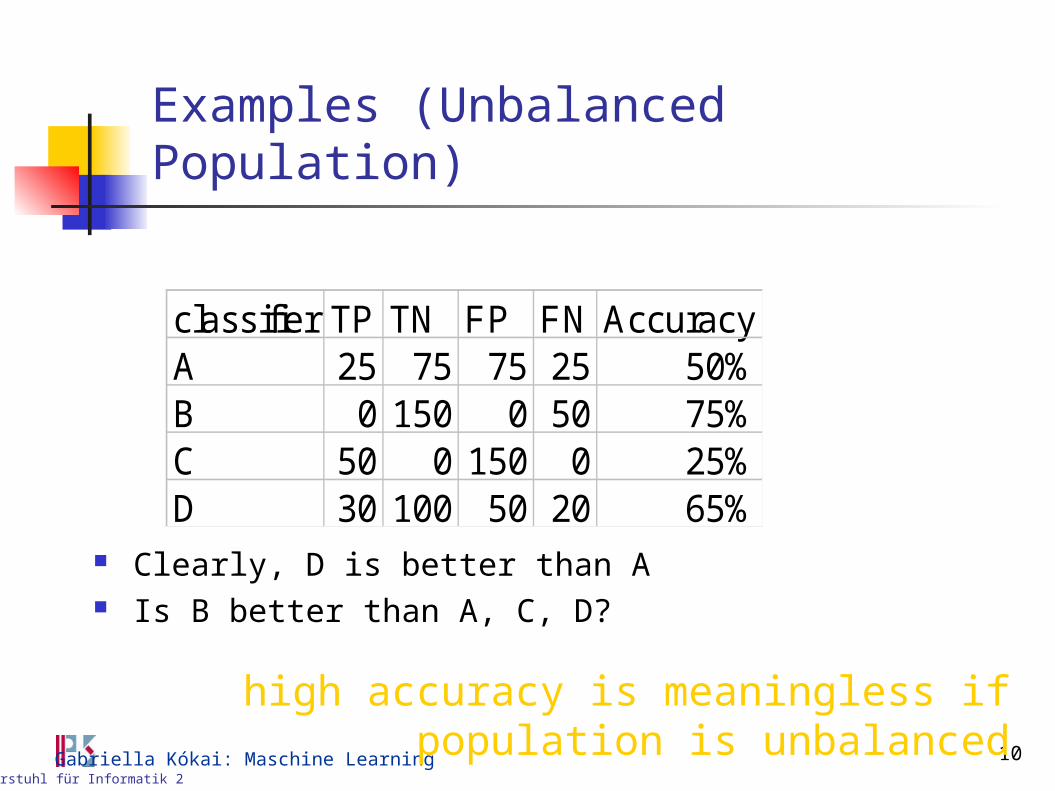
Examples (Unbalanced Population)
Clearly, D is better than A Is B better than A, C, D?
classifier TP TN FP FN AccuracyA 25 75 75 25 50%B 0 150 0 50 75%C 50 0 150 0 25%D 30 100 50 20 65%
high accuracy is meaningless if population is unbalanced
11Lehrstuhl für Informatik 2
Gabriella Kókai: Maschine Learning
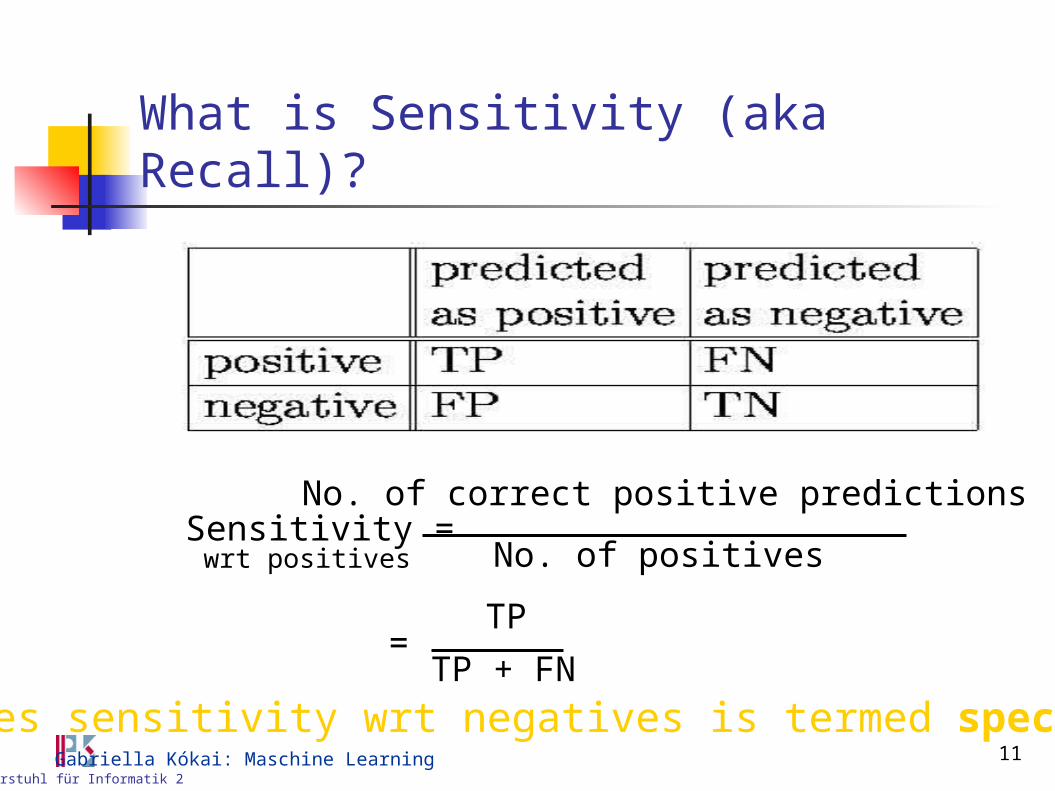
What is Sensitivity (aka Recall)?
Sensitivity =No. of correct positive predictions
No. of positives
=TP
TP + FN
wrt positives
Sometimes sensitivity wrt negatives is termed specificity
12Lehrstuhl für Informatik 2
Gabriella Kókai: Maschine Learning
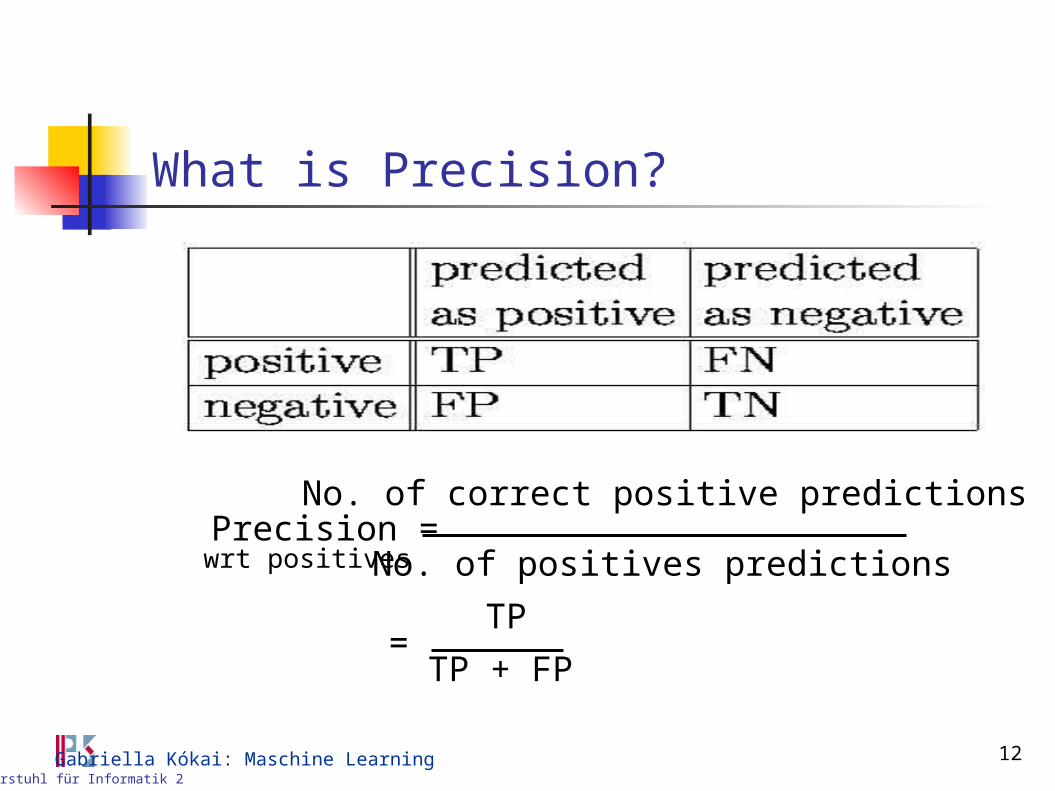
What is Precision?
Precision =No. of correct positive predictions
No. of positives predictions
=TP
TP + FP
wrt positives
13Lehrstuhl für Informatik 2
Gabriella Kókai: Maschine Learning
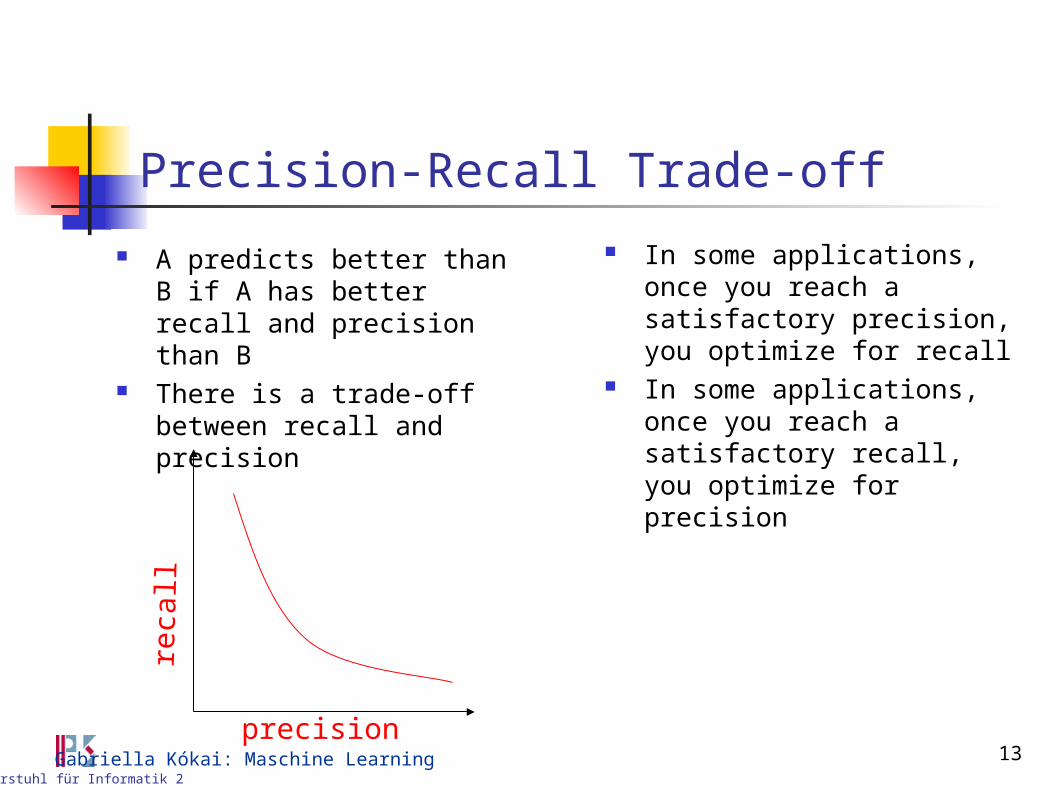
Precision-Recall Trade-off
A predicts better than B if A has better recall and precision than B
There is a trade-off between recall and precision
In some applications, once you reach a satisfactory precision, you optimize for recall
In some applications, once you reach a satisfactory recall, you optimize for precision
reca
ll
precision

14Lehrstuhl für Informatik 2
Gabriella Kókai: Maschine Learning
Comparing Prediction Performance Accuracy is the obvious measure
But it conveys the right intuition only when the positive and negative populations are roughly equal in size
Recall and precision together form a better measure But what do you do when A has better recall than B and B has
better precision than A?
15Lehrstuhl für Informatik 2
Gabriella Kókai: Maschine Learning
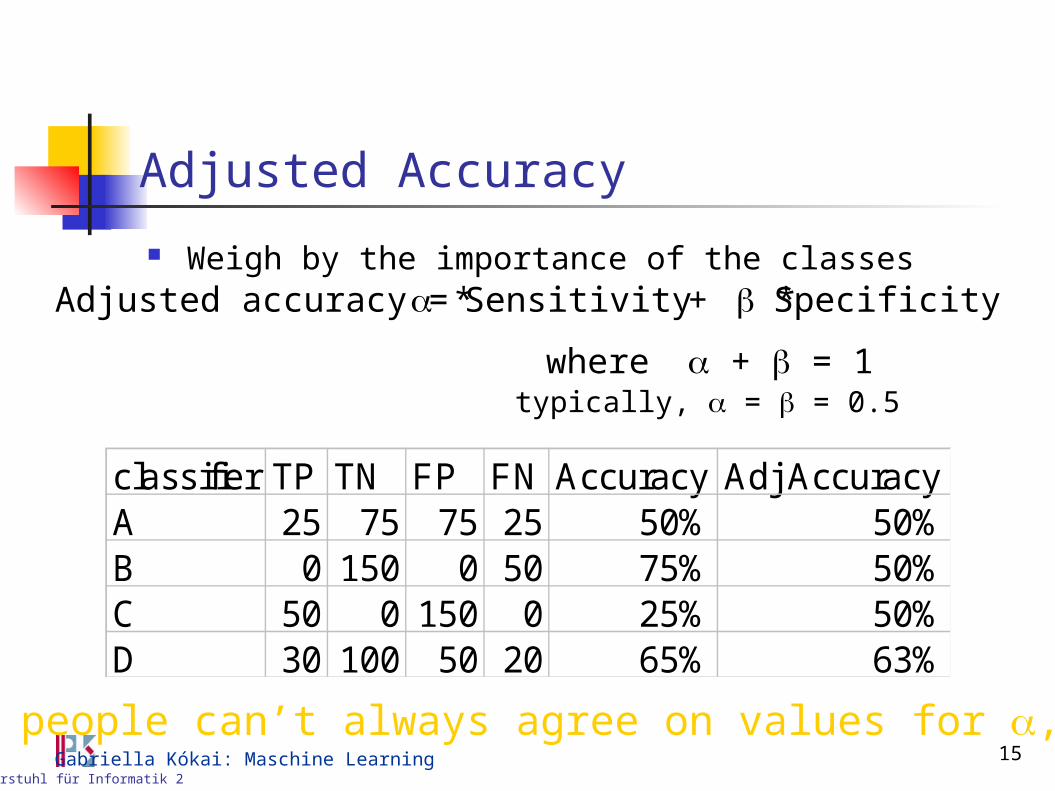
Adjusted Accuracy
Weigh by the importance of the classes
classifier TP TN FP FN Accuracy Adj AccuracyA 25 75 75 25 50% 50%B 0 150 0 50 75% 50%C 50 0 150 0 25% 50%D 30 100 50 20 65% 63%
Adjusted accuracy = * Sensitivity * Specificity+
where + = 1typically, = = 0.5
But people can’t always agree on values for ,
16Lehrstuhl für Informatik 2
Gabriella Kókai: Maschine Learning
ROC-Analysis
ROC: Receiver Operating Characteristic Signal detection theory: model of how well a receiver is able to
detect a signal in the presence of noise Key feature: distinction between hit rate (true or positive rate) and
false alarm rate (false positive rate)
17Lehrstuhl für Informatik 2
Gabriella Kókai: Maschine Learning
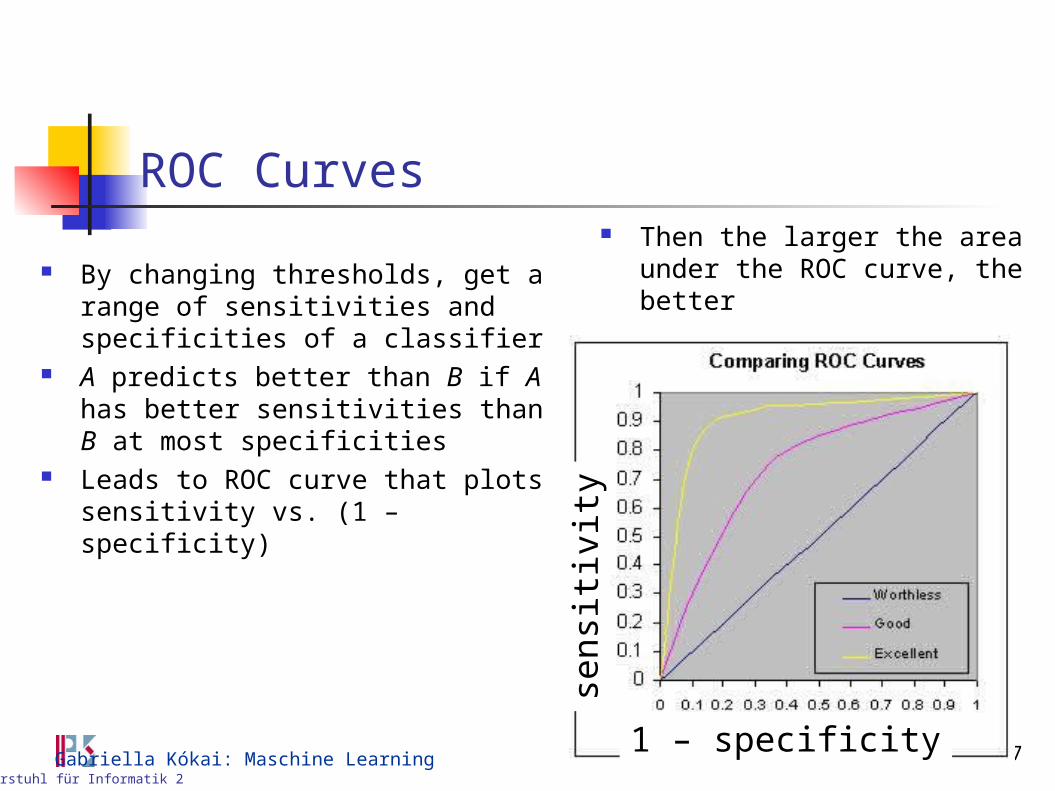
ROC Curves
By changing thresholds, get a range of sensitivities and specificities of a classifier
A predicts better than B if A has better sensitivities than B at most specificities
Leads to ROC curve that plots sensitivity vs. (1 – specificity)
Then the larger the area under the ROC curve, the better
s ens
itiv
ity
1 – specificity
What is Cross Validation?
19Lehrstuhl für Informatik 2
Gabriella Kókai: Maschine Learning
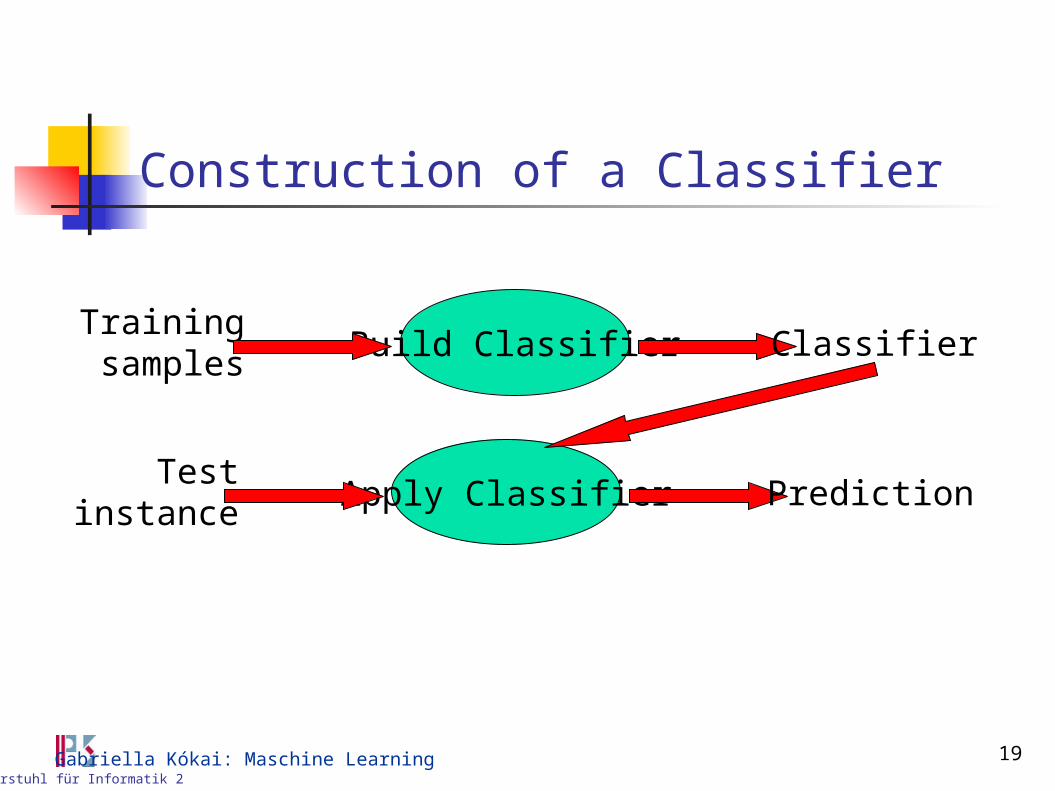
Construction of a Classifier
Build ClassifierTrainingsamples
Classifier
Apply ClassifierTest
instancePrediction
20Lehrstuhl für Informatik 2
Gabriella Kókai: Maschine Learning
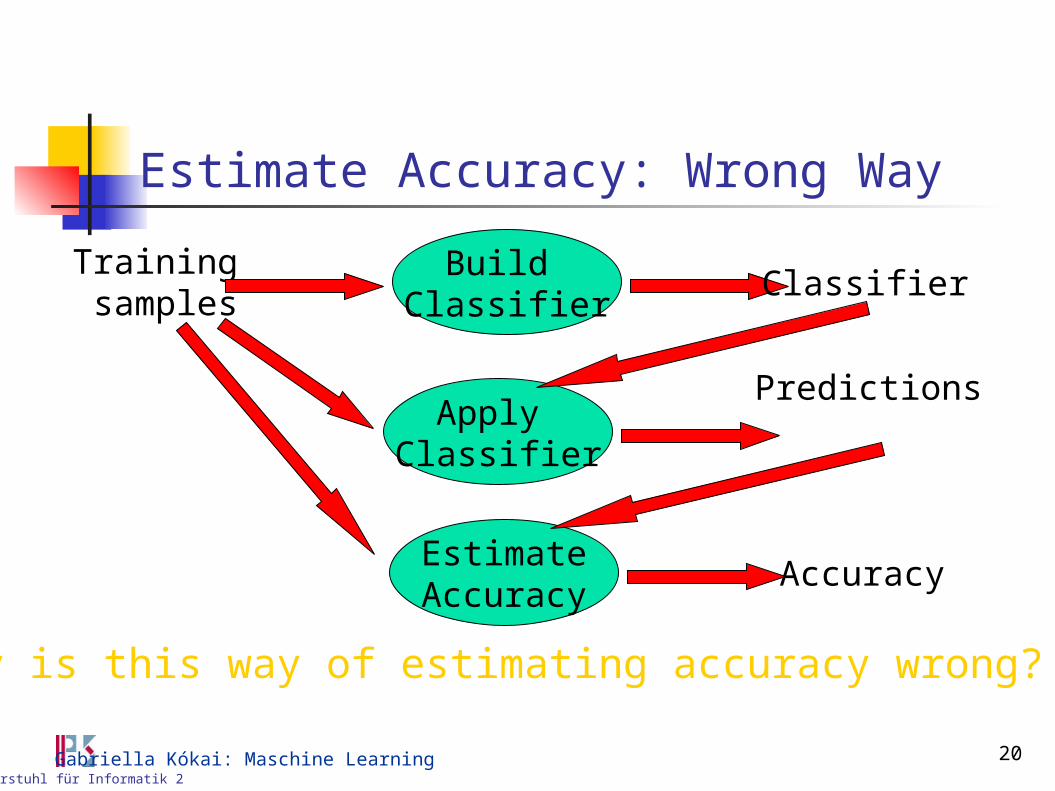
Estimate Accuracy: Wrong Way
Apply Classifier
Predictions
Build Classifier
Trainingsamples
Classifier
EstimateAccuracy
Accuracy
Why is this way of estimating accuracy wrong?
21Lehrstuhl für Informatik 2
Gabriella Kókai: Maschine Learning
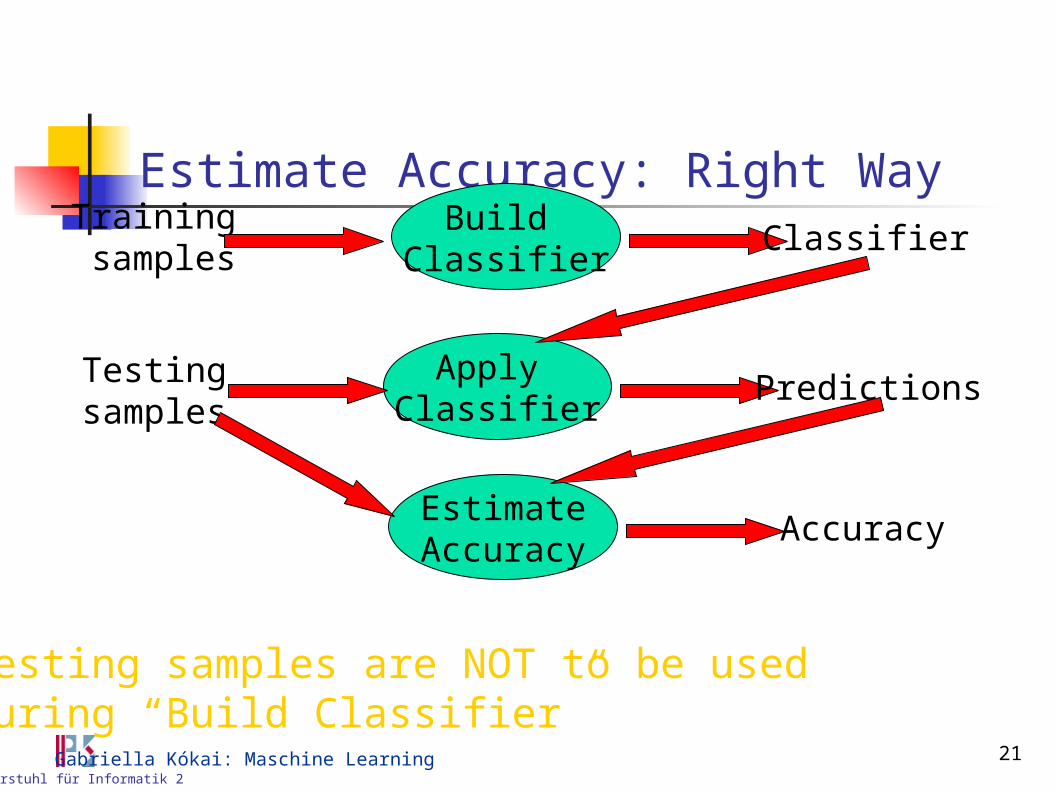
Estimate Accuracy: Right Way
Testing samples are NOT to be used during “Build Classifier”
Apply Classifier
Predictions
Build Classifier
Trainingsamples
Classifier
EstimateAccuracy
Accuracy
Testingsamples
22Lehrstuhl für Informatik 2
Gabriella Kókai: Maschine Learning
How Many Training and Testing Samples?
No fixed ratio between training and testing samples; but typically 2:1 ratio
Proportion of instances of different classes in testing samples should be similar to proportion in training samples
What if there are insufficient samples to reserve 1/3 for testing? Ans: Cross validation
23Lehrstuhl für Informatik 2
Gabriella Kókai: Maschine Learning
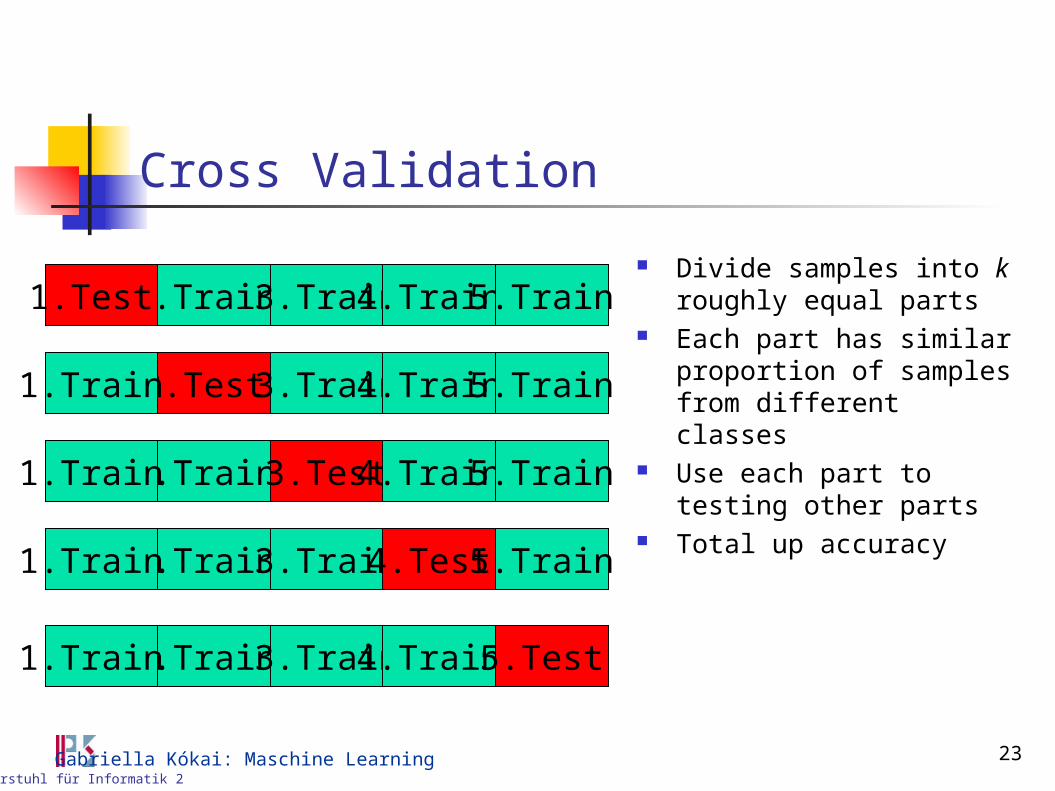
Cross Validation
2.Train 3.Train 4.Train 5.Train 1.Test Divide samples into k roughly
equal parts Each part has similar
proportion of samples from different classes
Use each part to testing other parts
Total up accuracy
2.Test 3.Train 4.Train 5.Train 1.Train
2.Train 3.Test 4.Train 5.Train 1.Train
2.Train 3.Train 4.Test 5.Train 1.Train
2.Train 3.Train 4.Train 5.Test 1.Train
24Lehrstuhl für Informatik 2
Gabriella Kókai: Maschine Learning
Context
Motivation➔ Estimating Hypothesis Accuracy
Sample Error and True Error Basics of Sampling Theory Difference in Error of Two Hypotheses Comparing Learning Algorithms Summary
25Lehrstuhl für Informatik 2
Gabriella Kókai: Maschine Learning
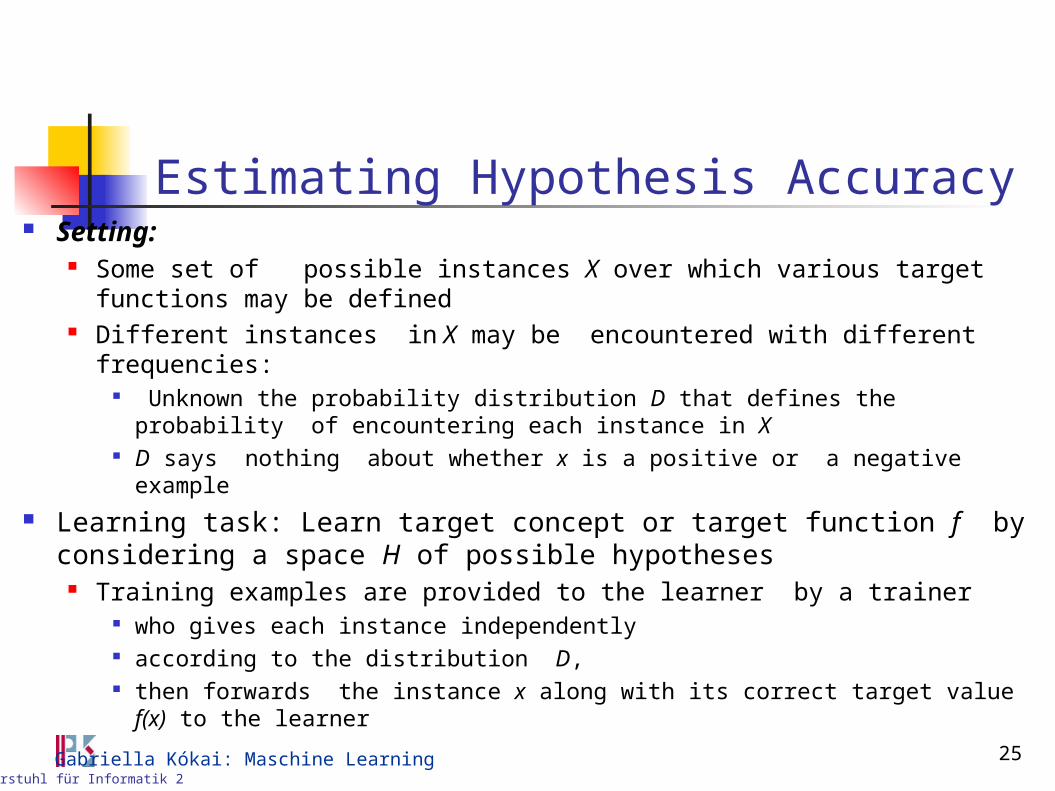
Estimating Hypothesis Accuracy Setting:
Some set of possible instances X over which various target functions may be defined
Different instances in X may be encountered with different frequencies: Unknown the probability distribution D that defines the probability of
encountering each instance in X D says nothing about whether x is a positive or a negative example
Learning task: Learn target concept or target function f by considering a space H of possible hypotheses
Training examples are provided to the learner by a trainer who gives each instance independently according to the distribution D, then forwards the instance x along with its correct target value f(x) to the learner
26Lehrstuhl für Informatik 2
Gabriella Kókai: Maschine Learning
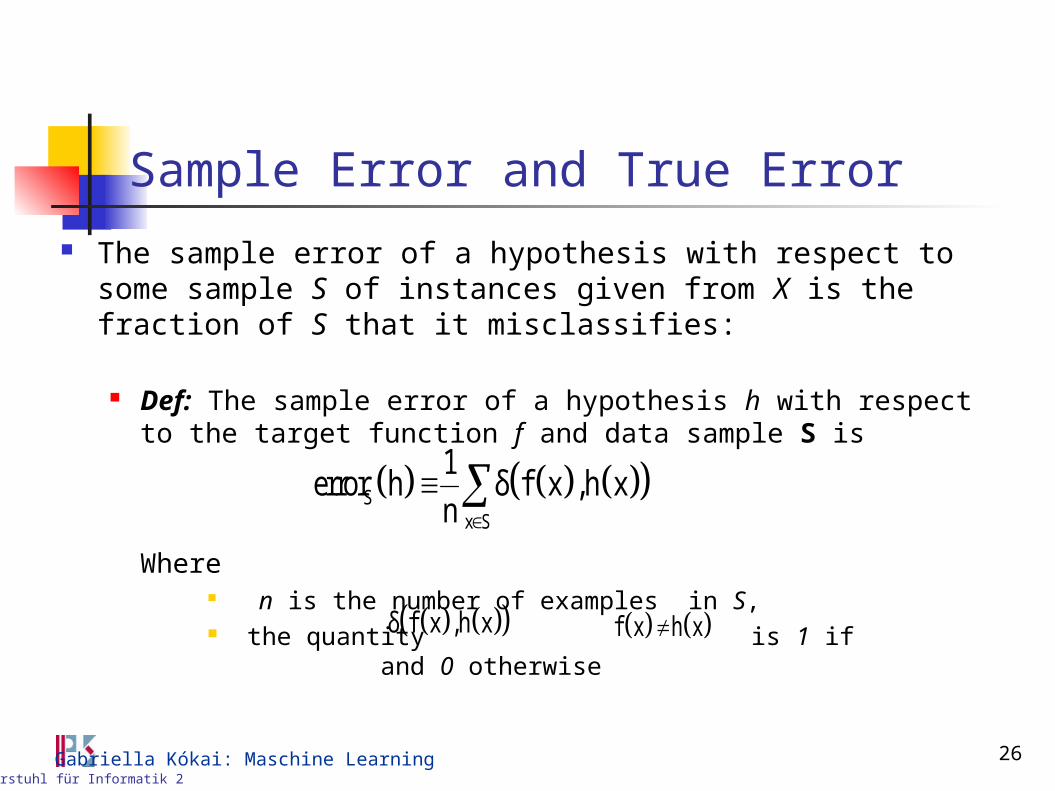
Sample Error and True Error
The sample error of a hypothesis with respect to some sample S of instances given from X is the fraction of S that it misclassifies:
Def: The sample error of a hypothesis h with respect to the target function f and data sample S is
Where n is the number of examples in S, the quantity is 1 if and 0 otherwise f x h x δ f x ,h x
Sx S
1error h δ f x ,h x
n
27Lehrstuhl für Informatik 2
Gabriella Kókai: Maschine Learning
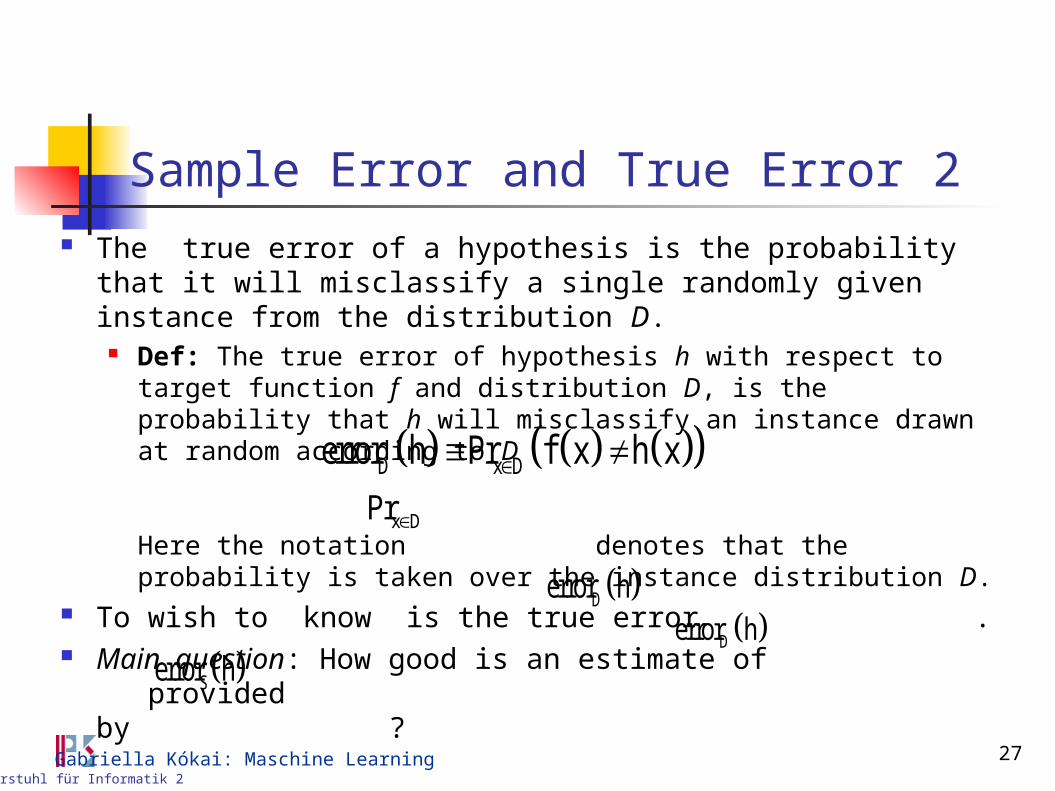
Sample Error and True Error 2 The true error of a hypothesis is the probability that it will
misclassify a single randomly given instance from the distribution D. Def: The true error of hypothesis h with respect to target function f and
distribution D, is the probability that h will misclassify an instance drawn at random according to D
Here the notation denotes that the probability is taken over the instance distribution D.
To wish to know is the true error . Main question: How good is an estimate of provided
by ?
D x Derror h Pr f x h x
x DPr
Derror h Derror h
Serror h
28Lehrstuhl für Informatik 2
Gabriella Kókai: Maschine Learning
Context Motivation Estimating Hypothesis Accuracy➔ Basics of Sampling Theory
Error Estimation and Estimating Binomial Proportions The Binomial Distribution Mean and Variance Confidence Intervals Two-Sided and One-Sided Bounds
Difference in Error of Two Hypotheses Comparing Learning Algorithms Summary
29Lehrstuhl für Informatik 2
Gabriella Kókai: Maschine Learning
Basics of Sampling Theory Question: How does the derivation between sample error and true error
depend on the size of the data sample? Equal with the statistical problem: The problem of estimating the
proportion of a population that exhibits some property, given the observed proportion over some random sample of the population .
Here: The property of interest is that h misclassifies the example Answer:
When measuring the sample error we are performing an experiment with a random outcome.
Repeating this experiment many times, each time drawing a different random sample set of size n, we would expect to observe different values for the various depending on random differences in the makeup of the various
In such cases the outcome of the ith such experiment is arandom variable
Sierror h
iS
iS Sierror h
30Lehrstuhl für Informatik 2
Gabriella Kókai: Maschine Learning
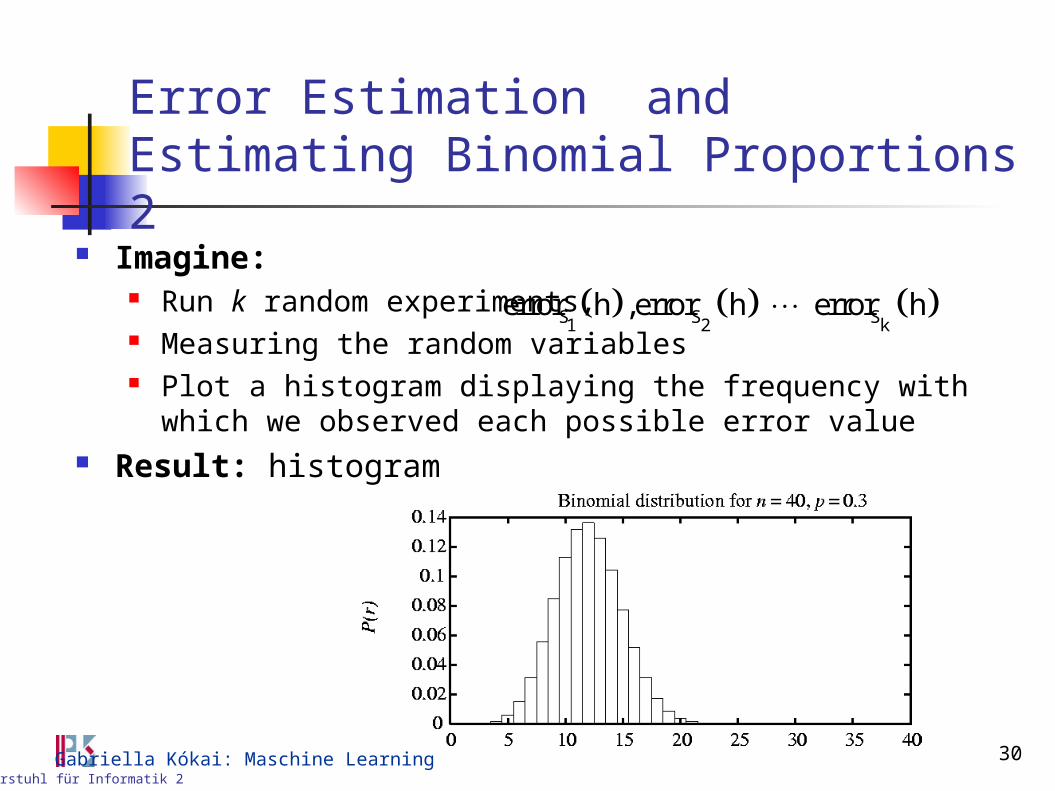
Error Estimation and Estimating Binomial Proportions 2
Imagine: Run k random experiments, Measuring the random variables Plot a histogram displaying the frequency with which we observed
each possible error value Result: histogram
S S S1 2 kerror h ,error h error h

31Lehrstuhl für Informatik 2
Gabriella Kókai: Maschine Learning
The Binomial Distribution General setting to which the Binomial distribution applies:
There is a base or underlying experiment whose outcome can be described by a random variable, say Y. It can take on two possible values.
The probability that Y=1 on any single trial of the underlying experiment is given by some constant p, independent of the outcome of any other experiment.The probability that Y=0 is therefore 1-p.Typically, p is not known in advance, and the problem is to estimate it.
A series of n independent trials of the underlying experiment is performed, producing the sequence of independent, identically distributed random variables .Let R denote the number of trials for which in this series of n experiments
The probability that R will take on a specific value r is given by the Binomial distribution:
1, 2 kY Y Y
iY = 1n
ii=1
R Y
n rrn!Pr R = r = p 1 p
r! n r !
32Lehrstuhl für Informatik 2
Gabriella Kókai: Maschine Learning
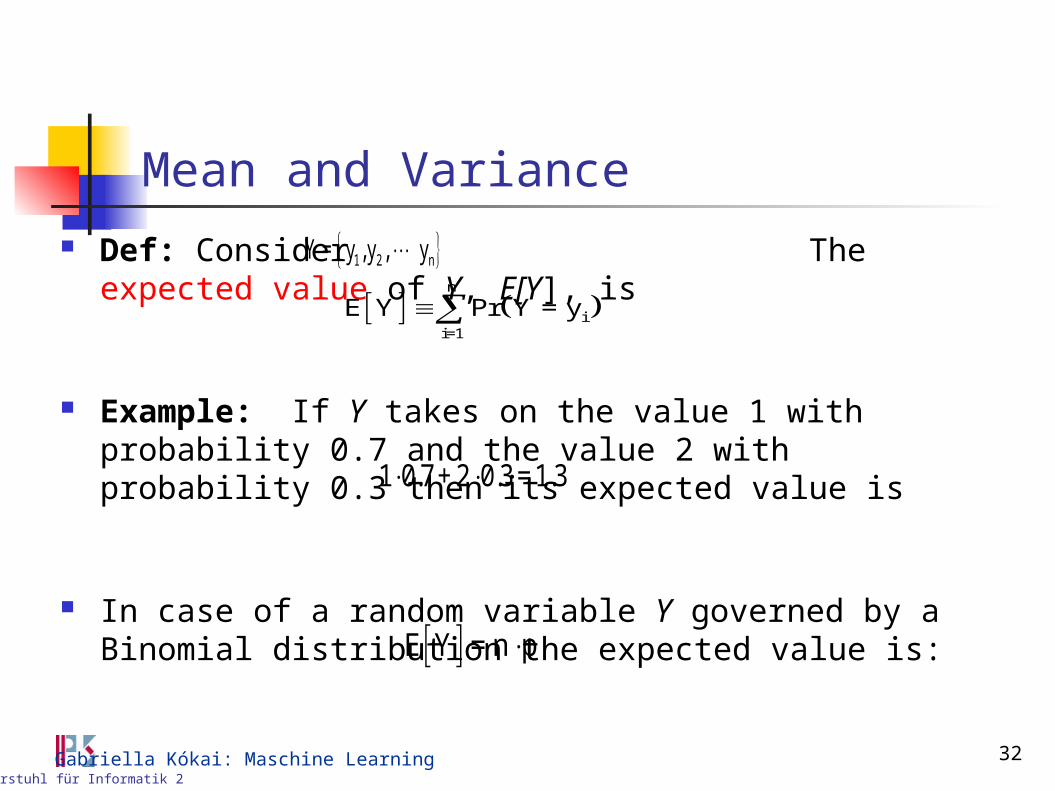
Mean and Variance Def: Consider The expected value of Y, E[Y], is
Example: If Y takes on the value 1 with probability 0.7 and the value 2 with probability 0.3 then its expected value is
In case of a random variable Y governed by a Binomial distribution the expected value is:
1 2 nY = y , y , y
n
ii=1
E Y Pr Y = y
1 0.7 + 2 0.3 = 1.3
E Y = n p
33Lehrstuhl für Informatik 2
Gabriella Kókai: Maschine Learning
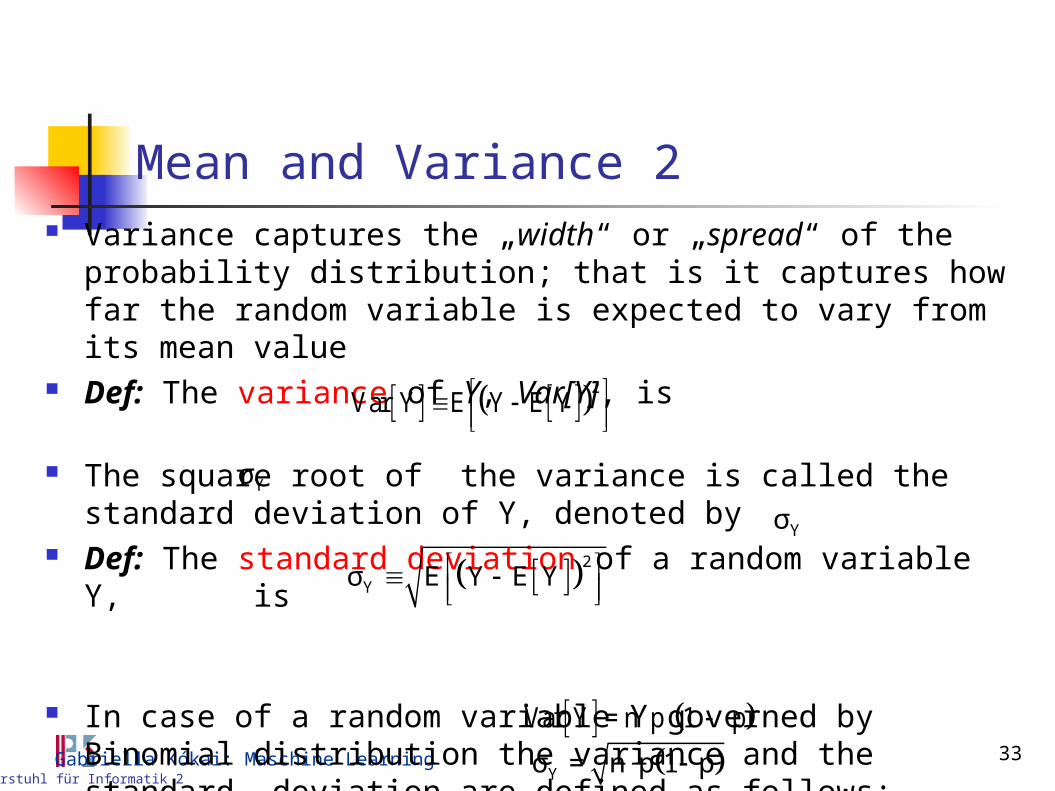
Mean and Variance 2 Variance captures the „width“ or „spread“ of the probability distribution;
that is it captures how far the random variable is expected to vary from its mean value
Def: The variance of Y, Var[Y], is
The square root of the variance is called the standard deviation of Y, denoted by
Def: The standard deviation of a random variable Y, is
In case of a random variable Y governed by Binomial distribution the variance and the standard deviation are defined as follows:
2Var Y E Y E Y
Yσ
2
Yσ E Y E Y
Yσ
Var Y = n p 1 p
Yσ = n p 1 p
34Lehrstuhl für Informatik 2
Gabriella Kókai: Maschine Learning
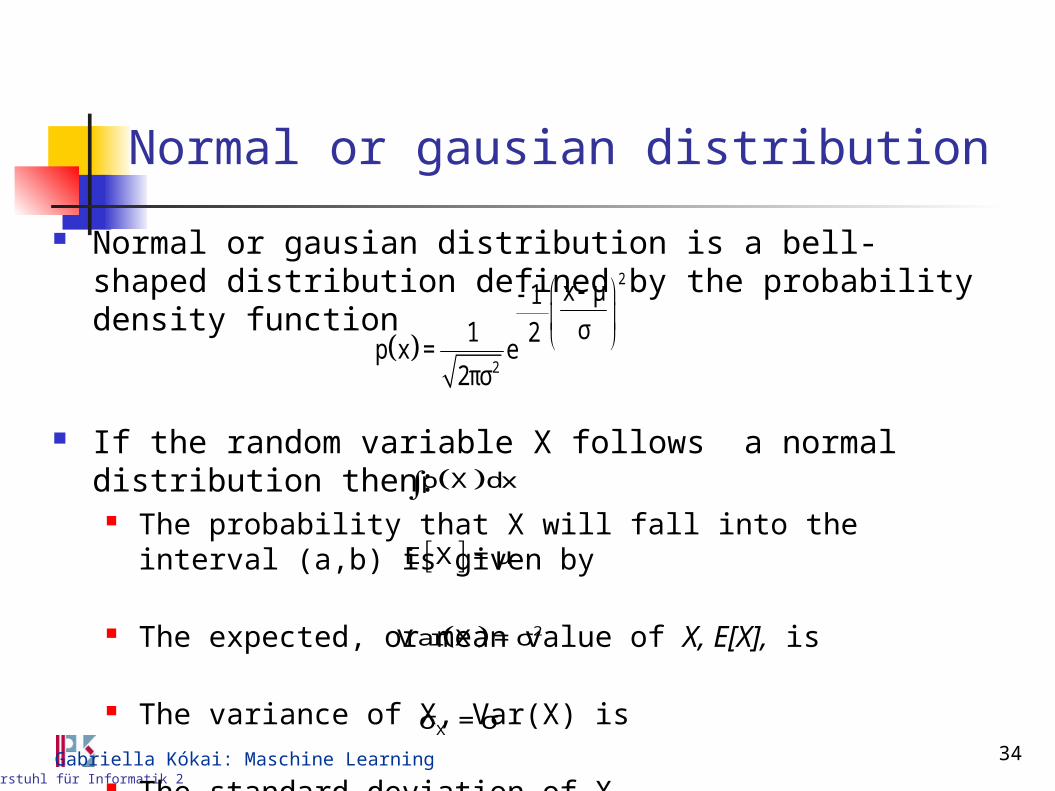
Normal or gausian distribution
Normal or gausian distribution is a bell-shaped distribution defined by the probability density function
If the random variable X follows a normal distribution then: The probability that X will fall into the interval (a,b) is given by
The expected, or mean value of X, E[X], is
The variance of X, Var(X) is
The standard deviation of X,
2
2
x μ1σ1 2
p x = e2πσ
Xσ = σ
2Var X = σ
E X = μ
p X dx
35Lehrstuhl für Informatik 2
Gabriella Kókai: Maschine Learning
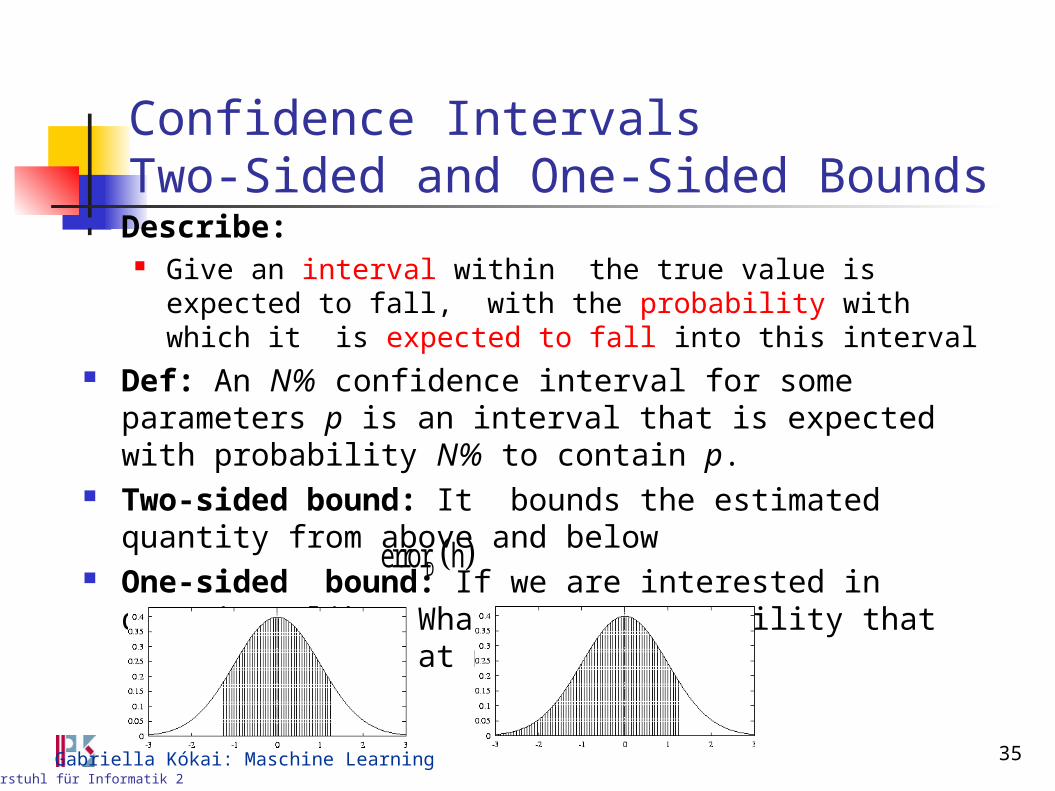
Confidence Intervals Two-Sided and One-Sided Bounds
Describe: Give an interval within the true value is expected to fall, with the
probability with which it is expected to fall into this interval Def: An N% confidence interval for some parameters p is an
interval that is expected with probability N% to contain p. Two-sided bound: It bounds the estimated quantity from above
and below One-sided bound: If we are interested in questions like: What is
the probability that is at most U Derror h

36Lehrstuhl für Informatik 2
Gabriella Kókai: Maschine Learning
Application on the Hypothesis Accuracy
Question: What can we say about the if we know Bevor
When measuring the sample error we are performing an experiment with a random outcome.
The measured value follows Binomial Distribution The mean is the True Error We can use normal distribution if there is enough input Formula for Binomial Distribution
We can saySample Error: where n is the number of instance in data S True Error: r is the number incorrect classified instance von h
p is the probability to incorrect classify a randomly
selected instance
Derror h Serror h
r n rn!Pr(R r) p (1 p)
r!(n r!)
S
rerror h
n
Derror h p
37Lehrstuhl für Informatik 2
Gabriella Kókai: Maschine Learning
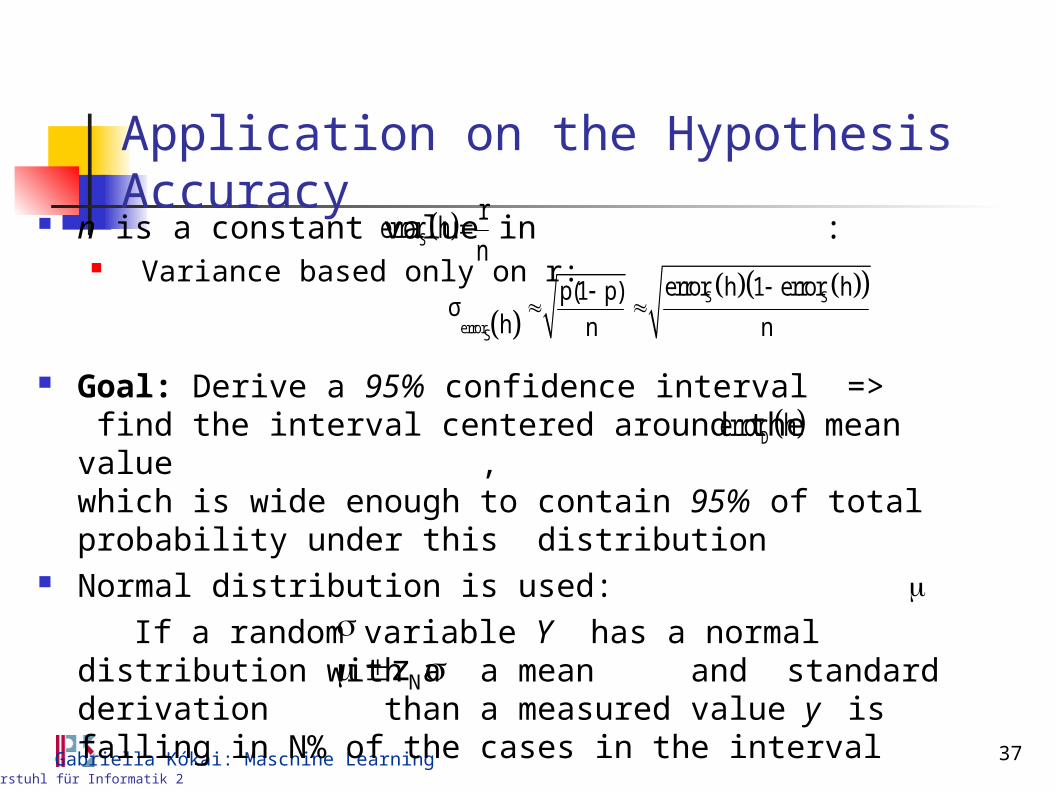
Application on the Hypothesis Accuracy
n is a constant value in : Variance based only on r:
Goal: Derive a 95% confidence interval => find the interval centered around the mean value ,which is wide enough to contain 95% of total probability under this distribution
Normal distribution is used:
If a random variable Y has a normal distribution with a a mean and standard derivation than a measured value y is falling in N% of the cases in the interval
Derror h
S S
errorS
error h 1 error hp(1 p)σ
h n n
S
rerror h
n
Nz
38Lehrstuhl für Informatik 2
Gabriella Kókai: Maschine Learning
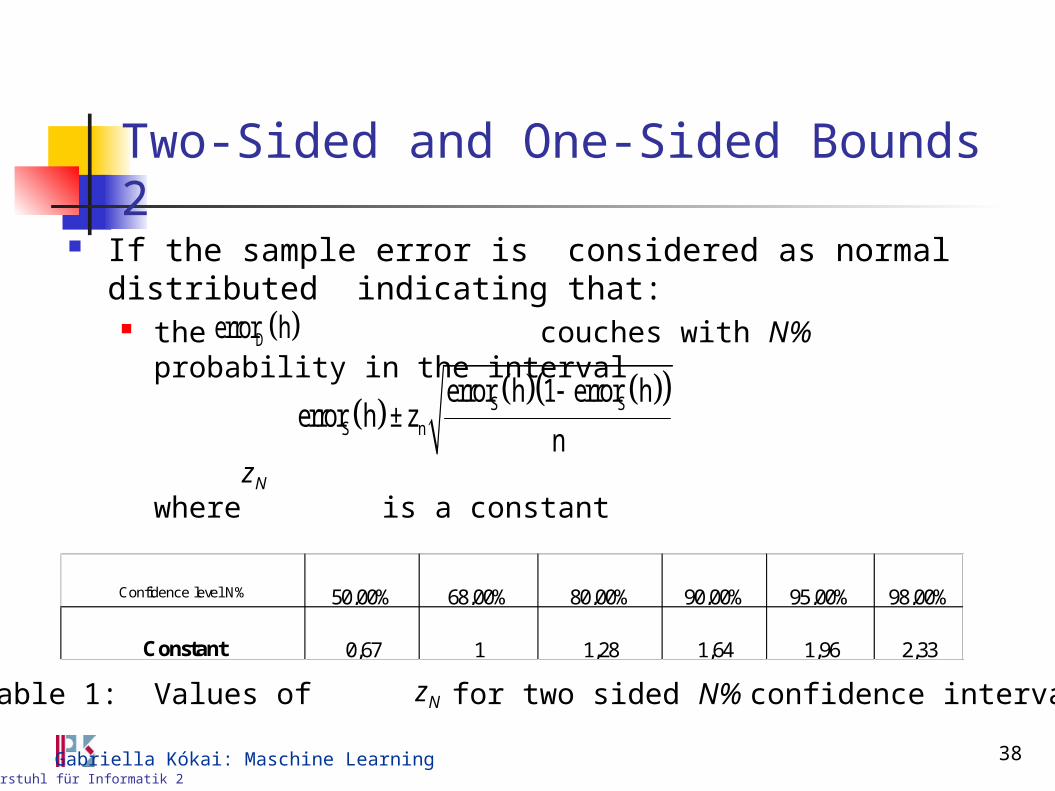
Two-Sided and One-Sided Bounds 2 If the sample error is considered as normal distributed indicating
that: the couches with N% probability in the interval
where is a constant
Derror h
S SS n
error h 1 error herror h ± z
n
zN
Confidence level N% 50,00% 68,00% 80,00% 90,00% 95,00% 98,00%
Constant 0,67 1 1,28 1,64 1,96 2,33
Table 1: Values of for two sided N% confidence intervalszN
39Lehrstuhl für Informatik 2
Gabriella Kókai: Maschine Learning
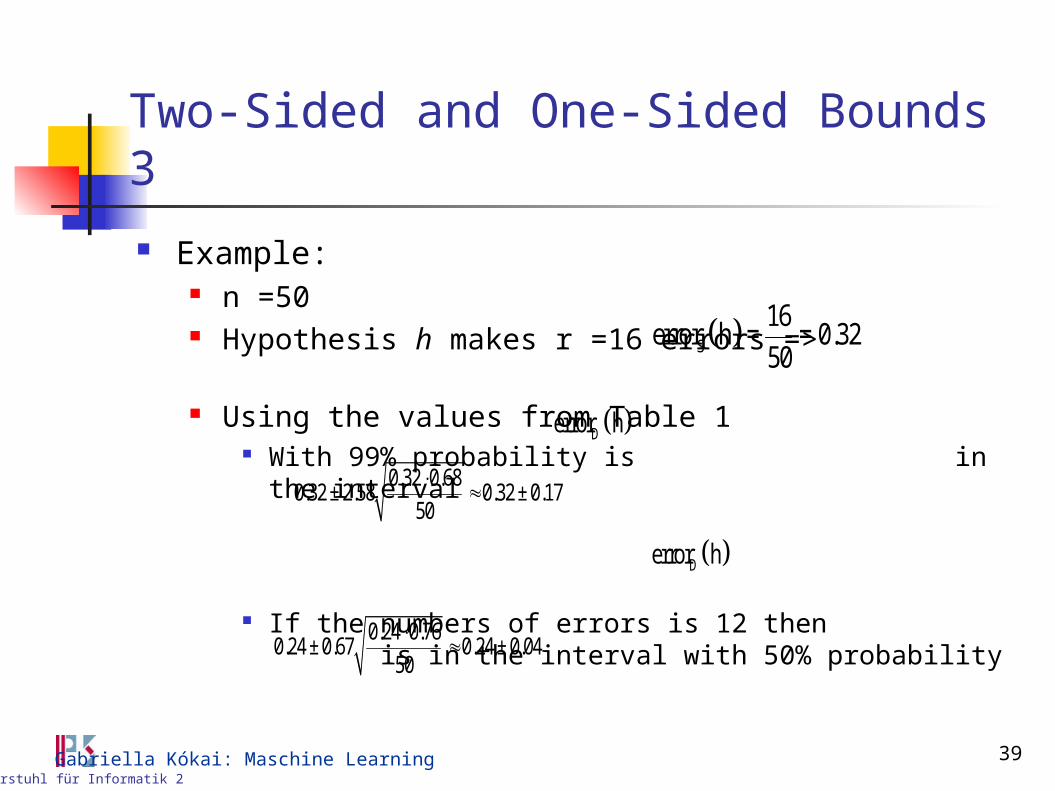
Two-Sided and One-Sided Bounds 3
Example: n =50 Hypothesis h makes r =16 errors => Using the values from Table 1
With 99% probability is in the interval
If the numbers of errors is 12 then is in the interval with 50% probability
S
16error h = = 0.32
50
Derror h
0.32 0.680.32 ± 2.58 0.32 ± 0.17
50
Derror h
0.24 0.760.24 ± 0.67 0.24 ± 0.04
50
40Lehrstuhl für Informatik 2
Gabriella Kókai: Maschine Learning
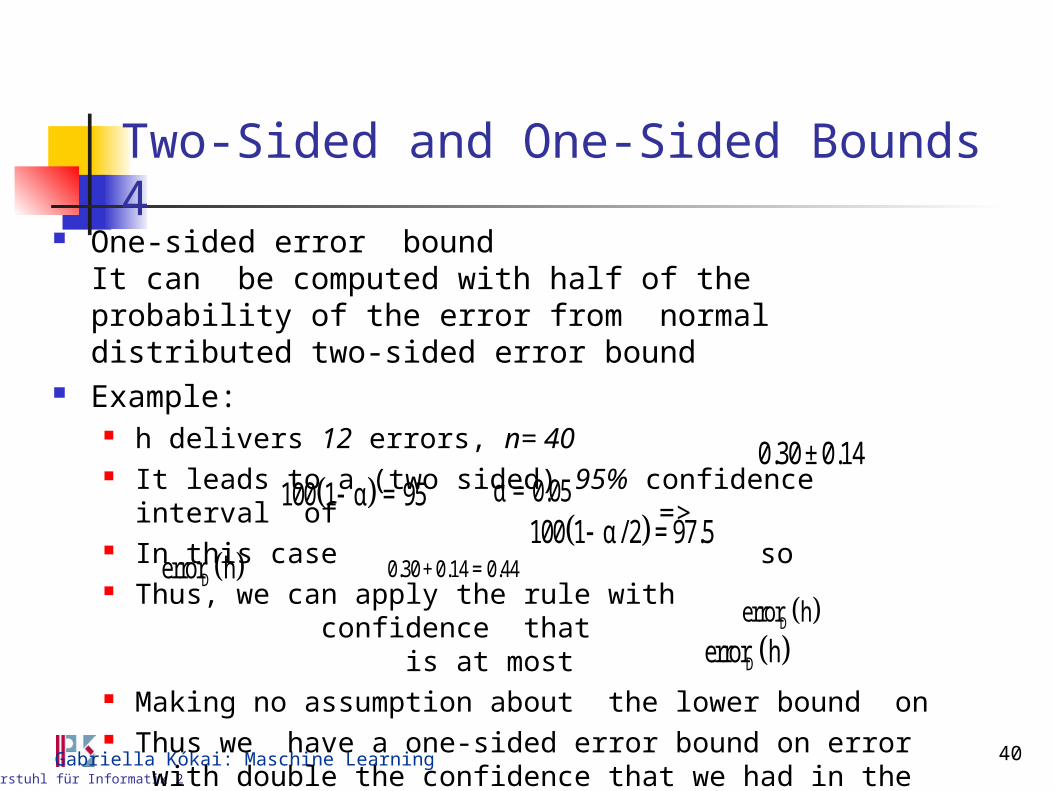
Two-Sided and One-Sided Bounds 4 One-sided error bound
It can be computed with half of the probability of the error from normal distributed two-sided error bound
Example: h delivers 12 errors, n= 40 It leads to a (two sided) 95% confidence interval of => In this case so Thus, we can apply the rule with confidence that
is at most Making no assumption about the lower bound on Thus we have a one-sided error bound on error
with double the confidence that we had in the corresponding two-sided bound
0.30 ± 0.14
100 1 α / 2 = 97.5
Derror h
0.30 + 0.14 = 0.44
100 1 α = 95 α = 0.05
Derror h
Derror h
41Lehrstuhl für Informatik 2
Gabriella Kókai: Maschine Learning
Context
Motivation Estimating Hypothesis Accuracy Basics of Sampling Theory➔ Difference in Error of Two Hypotheses
Hypothesis Testing Comparing Learning Algorithms Summary
42Lehrstuhl für Informatik 2
Gabriella Kókai: Maschine Learning
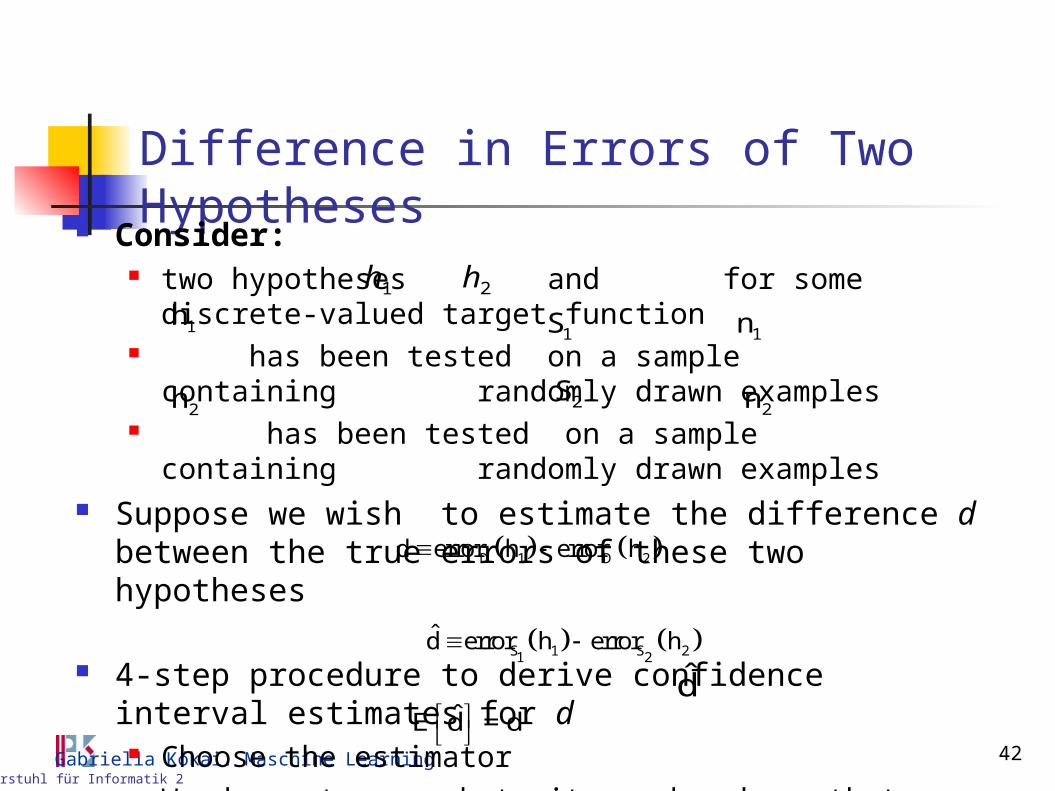
Difference in Errors of Two Hypotheses
Consider: two hypotheses and for some discrete-valued target function has been tested on a sample containing randomly drawn
examples has been tested on a sample containing randomly
drawn examples Suppose we wish to estimate the difference d between the true
errors of these two hypotheses
4-step procedure to derive confidence interval estimates for d Choose the estimator We do not prove but it can be shown that gives an unbiased
estimate of d; that is
h1
2h
1h
2S
1n1S
2n
D 1 D 2d error h error h
S 1 S 21 2d̂ error h error h
d̂
h2
ˆE d = d
43Lehrstuhl für Informatik 2
Gabriella Kókai: Maschine Learning
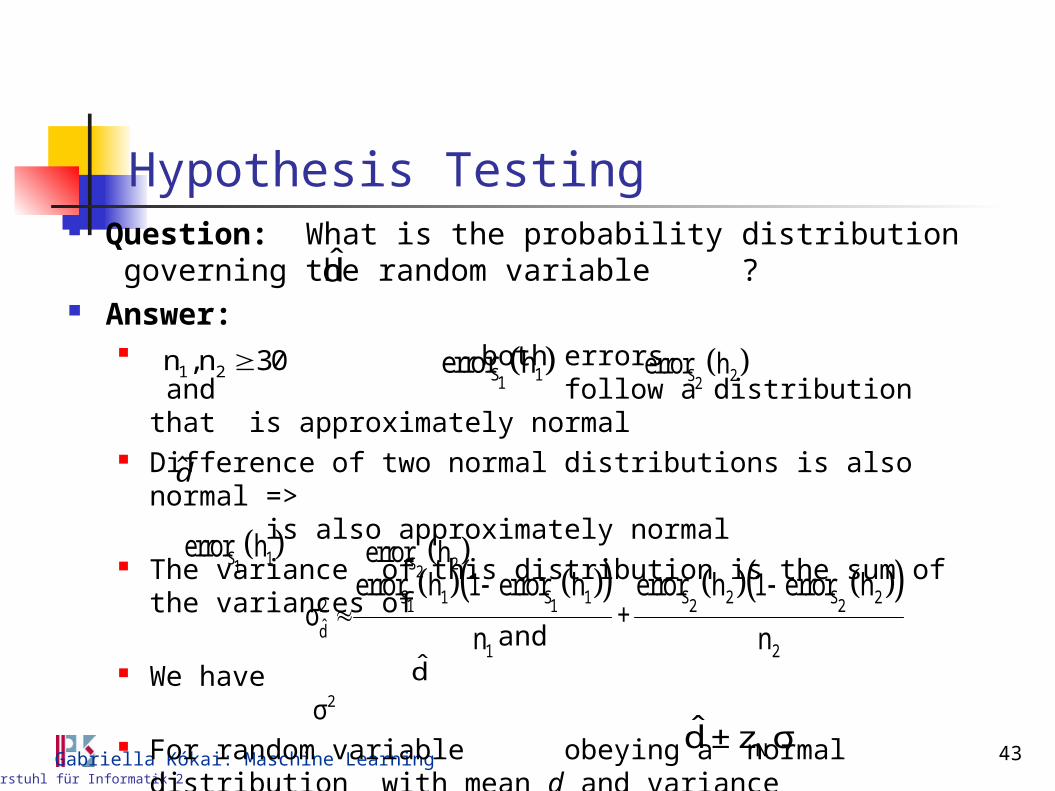
Hypothesis Testing Question: What is the probability distribution governing the
random variable ? Answer:
both errors and follow a distribution that is approximately normal
Difference of two normal distributions is also normal => is also approximately normal
The variance of this distribution is the sum of the variances of and
We have
For random variable obeying a normal distribution with mean d and variance the N% confidence interval estimate for d is
d̂
1 2n ,n 30 S 11error h S 22
error h
d
S 11error h S 22
error h S 1 S 1 S 2 S 22 1 1 2 2
d̂1 2
error h 1 error h error h 1 error hσ +
n n
d̂2σ
Nd̂ ± z σ
44Lehrstuhl für Informatik 2
Gabriella Kókai: Maschine Learning
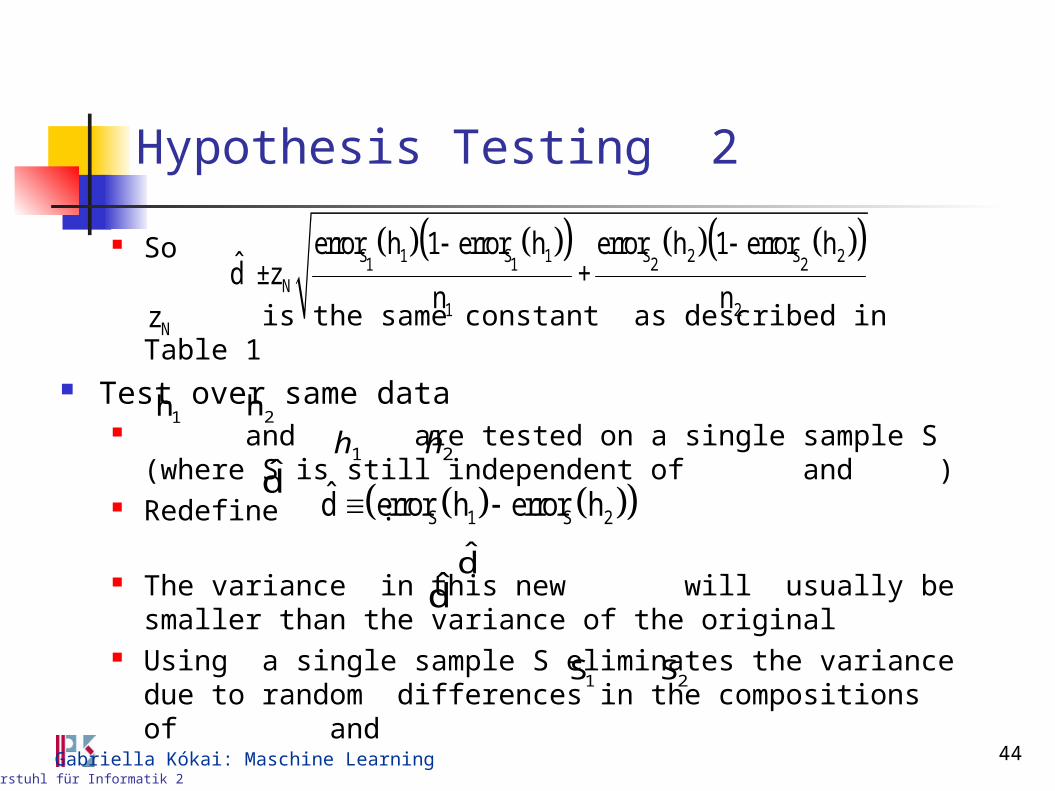
Hypothesis Testing 2
So
is the same constant as described in Table 1 Test over same data
and are tested on a single sample S (where S is still independent of and )
Redefine :
The variance in this new will usually be smaller than the variance of the original
Using a single sample S eliminates the variance due to random differences in the compositions of and
S 1 S 1 S 2 S 21 1 2 2N
1 2
error h 1 error h error h 1 error hd̂ ±z +
n n
Nz
1h 2hh1 h2
d̂
d̂
1S 2S
S 1 S 2d̂ error h error h
d̂
49Lehrstuhl für Informatik 2
Gabriella Kókai: Maschine Learning
Context
Motivation Estimating Hypothesis Accuracy Basics of Sampling Theory Difference in Error of Two Hypotheses Comparing Learning Algorithms ➔ Summary
50Lehrstuhl für Informatik 2
Gabriella Kókai: Maschine Learning
Summary
Statistical theory provides a basis for estimating the true error ( ) of hypothesis h, based on its observed error ( )over a sample S of data.
In general, the problem of estimating confidence intervals is approached by identifying the parameter to be estimated ( ) and an estimator ( ) for this quantity.
Because the estimator is a random variable it can be characterised by the probability distribution that governs its value.
Confidence intervals can then be calculated by determining the interval that contains the desired probability mass under this distribution.
Derror h Serror h
Derror h Serror h
51Lehrstuhl für Informatik 2
Gabriella Kókai: Maschine Learning
Summary 2 A cause of estimation error is the variance in the estimate. Even with an
unbiased estimator, the observed value of the estimator is likely to vary from one experiment to another. The variance of the distribution governing the estimator characterises how widely this estimate is likely to vary from the correct value
Comparing the relative effectiveness of two learning algorithms is an estimation problem that is relatively easy when data and time are unlimited, but more difficult when these resources are limited.
One approach to run the learning algorithms on different subsets of available data, testing the learned hypotheses on the remaining data, then averaging the result of these experiments.
In most cases considered here, deriving confidence intervals involves making a number of assumptions and approximations.
2σ