eutrophication: an ecological vision - carleton college · eutrophication: an ecological vision 451...
TRANSCRIPT
EUTROPHICATION: AN ECOLOGICAL VISION 449
Issued
© 2005 The New York Botanical Garden
Copies of this issue [71(4)] may be purchased from The NYBG Press,
The New York Botanical Garden, Bronx, NY 10458-5126, U.S.A.;
[email protected]. Please inquire as to prices.
449
The Botanical Review 71(4): 449–482
Eutrophication: An Ecological Vision
FAREED A. KHAN AND ABID ALI ANSARI
Department of Botany
Aligarh Muslim University
Aligarh-202002, Uttar Pradesh, India
Abstract . . . . . . . . . . . . . . . . . . . . . . . . . . . . . . . . . . . . . . . . . . . . . . . . . . . . . . . . . . . . 450
Introduction . . . . . . . . . . . . . . . . . . . . . . . . . . . . . . . . . . . . . . . . . . . . . . . . . . . . . . . . . 450
Definition . . . . . . . . . . . . . . . . . . . . . . . . . . . . . . . . . . . . . . . . . . . . . . . . . . . . . . . 452
Eutrophication Studies on Lakes . . . . . . . . . . . . . . . . . . . . . . . . . . . . . . . . . . . . . 452
Water Resources . . . . . . . . . . . . . . . . . . . . . . . . . . . . . . . . . . . . . . . . . . . . . . . . . . . . . . 455
Water Cycle . . . . . . . . . . . . . . . . . . . . . . . . . . . . . . . . . . . . . . . . . . . . . . . . . . . . . . 455
Distribution . . . . . . . . . . . . . . . . . . . . . . . . . . . . . . . . . . . . . . . . . . . . . . . . . . . . . . 456
Phosphorus and Its Role . . . . . . . . . . . . . . . . . . . . . . . . . . . . . . . . . . . . . . . . . . . . . . . 457
Role of Phosphorus in Eutrophication . . . . . . . . . . . . . . . . . . . . . . . . . . . . . . . . . 457
Sources of Phosphorus . . . . . . . . . . . . . . . . . . . . . . . . . . . . . . . . . . . . . . . . . . . . . 458
Monitoring of Phosphorus . . . . . . . . . . . . . . . . . . . . . . . . . . . . . . . . . . . . . . . . . . . 458
Phosphorus Cycle . . . . . . . . . . . . . . . . . . . . . . . . . . . . . . . . . . . . . . . . . . . . . . . . . 458
Detergents and Their Role . . . . . . . . . . . . . . . . . . . . . . . . . . . . . . . . . . . . . . . . . . . . . . 460
Definitions . . . . . . . . . . . . . . . . . . . . . . . . . . . . . . . . . . . . . . . . . . . . . . . . . . . . . . . 460
Synthetic Detergent . . . . . . . . . . . . . . . . . . . . . . . . . . . . . . . . . . . . . . . . . . . . . . . . 460
Role of Some Other Nutrients . . . . . . . . . . . . . . . . . . . . . . . . . . . . . . . . . . . . . . . . . . . 461
Impact of Organic Matter . . . . . . . . . . . . . . . . . . . . . . . . . . . . . . . . . . . . . . . . . . . . . . 462
Role of Environmental Factors . . . . . . . . . . . . . . . . . . . . . . . . . . . . . . . . . . . . . . . . . . 463
Carbon Dioxide Level . . . . . . . . . . . . . . . . . . . . . . . . . . . . . . . . . . . . . . . . . . . . . . 463
Temperature . . . . . . . . . . . . . . . . . . . . . . . . . . . . . . . . . . . . . . . . . . . . . . . . . . . . . . 463
Hydrogen Ion Concentration (pH) . . . . . . . . . . . . . . . . . . . . . . . . . . . . . . . . . . . . 464
Light . . . . . . . . . . . . . . . . . . . . . . . . . . . . . . . . . . . . . . . . . . . . . . . . . . . . . . . . . . . . 464
Dissolved Oxygen . . . . . . . . . . . . . . . . . . . . . . . . . . . . . . . . . . . . . . . . . . . . . . . . . 464
Eutrophication versus Plant Diversity . . . . . . . . . . . . . . . . . . . . . . . . . . . . . . . . . . . . 465
Eutrophication versus Wetland Plants . . . . . . . . . . . . . . . . . . . . . . . . . . . . . . . . . . . . 465
Eutrophication versus Succession Pathways . . . . . . . . . . . . . . . . . . . . . . . . . . . . . . . 466
Bioindicators of Eutrophication . . . . . . . . . . . . . . . . . . . . . . . . . . . . . . . . . . . . . . . . . 466
Structural Diversity . . . . . . . . . . . . . . . . . . . . . . . . . . . . . . . . . . . . . . . . . . . . . . . . 466
Algae . . . . . . . . . . . . . . . . . . . . . . . . . . . . . . . . . . . . . . . . . . . . . . . . . . . . . . . . 467
Macrophytes . . . . . . . . . . . . . . . . . . . . . . . . . . . . . . . . . . . . . . . . . . . . . . . . . . . 467
Diatoms . . . . . . . . . . . . . . . . . . . . . . . . . . . . . . . . . . . . . . . . . . . . . . . . . . . . . . 467
Plant Pigments . . . . . . . . . . . . . . . . . . . . . . . . . . . . . . . . . . . . . . . . . . . . . . . . . 468
Ecosystem Functioning . . . . . . . . . . . . . . . . . . . . . . . . . . . . . . . . . . . . . . . . . . . . . 468
Control Measures . . . . . . . . . . . . . . . . . . . . . . . . . . . . . . . . . . . . . . . . . . . . . . . . . . . . . 468
Biological Control . . . . . . . . . . . . . . . . . . . . . . . . . . . . . . . . . . . . . . . . . . . . . . . . . 469
Role of Microorganisms . . . . . . . . . . . . . . . . . . . . . . . . . . . . . . . . . . . . . . . . . . . . 470
19 December 2005
450 THE BOTANICAL REVIEW
Mechanical Control . . . . . . . . . . . . . . . . . . . . . . . . . . . . . . . . . . . . . . . . . . . . . . . . 470
Legislative Measures . . . . . . . . . . . . . . . . . . . . . . . . . . . . . . . . . . . . . . . . . . . . . . . 471
Ecological Vision . . . . . . . . . . . . . . . . . . . . . . . . . . . . . . . . . . . . . . . . . . . . . . . . . . . . . 471
Discussion . . . . . . . . . . . . . . . . . . . . . . . . . . . . . . . . . . . . . . . . . . . . . . . . . . . . . . . . . . 472
Conclusion . . . . . . . . . . . . . . . . . . . . . . . . . . . . . . . . . . . . . . . . . . . . . . . . . . . . . . . . . . 474
Acknowledgments . . . . . . . . . . . . . . . . . . . . . . . . . . . . . . . . . . . . . . . . . . . . . . . . . . . . 475
Literature Cited . . . . . . . . . . . . . . . . . . . . . . . . . . . . . . . . . . . . . . . . . . . . . . . . . . . . . . 475
Abstract
The present review deals with the studies conducted on the impact of phosphorus on growth
of aquatic plants causing eutrophication in well-known water bodies the world over. The re-
view covers the definition and concept of eutrophication and the adverse effects on quality and
ecosystem functioning. The eutrophication of several water bodies leads to significant changes
in the structure and function of the aquatic ecosystem. Several activities of human interest,
including navigation and power generation, are hampered. A large number of lakes in the United
States, Europe, and Asia have recently been found to be highly eutrophic. Water, the precious
fluid, is not uniformly distributed throughout the surface of the earth. Most of the water bodies
world over are surrounded with densely populated human settlement areas and agricultural
fields. The size of smaller water bodies in human settlement areas is on the decrease with rise
in population. After treatment, a large quantity of sewage from the households is regularly
discharged into the water bodies. The runoff brings down fertilizers and other chemicals from
agricultural fields. The phosphorus contained in these effluents is known to promote excessive
growth of plants. This review is an account of the role, sources, and monitoring of phosphorus,
as well as its cycle. The natural phosphorus cycle originating from the weathering of phosphate
rock is now a two-way operation, due to significant addition of phosphorus from anthropo-
genic sources.
The detergents that are the major source of phosphorus inputs into water bodies (through
sewage and drainage systems) have been thoroughly discussed. The major part of detergents
comprises builders containing polyphosphate salts. An environment-friendly and effective syn-
thetic builder is yet to be developed to replace existing phosphorus containing builders of
detergents. The utility of the alternative builders available has been reviewed. Nitrogen has
also been reported to affect the phytoplankton production in eutrophic waters in temperate
regions. Several environmental factors have also been found to add to the problem of eutrophica-
tion in addition to nutrients. Several limiting factors—namely, CO2 level, temperature, pH,
light, and dissolved oxygen—are known to affect eutrophic water bodies. Eutrophication not
only results in algal bloom but also affects wetland plants and activates early onset of natural
succession at a relatively faster rate. Some of the plant species reported and studied world over
are the best indicators of the level of eutrophication. The studies on the change in structure,
function, and diversity of the ecosystem have been used as parameters to assess the level of
eutrophication. In several countries adequate control measures have been adopted in to control
eutrophication. But these measures were found to be only partially effective in controlling the
phosphorus unloading in water bodies. In this review some control measures are suggested,
with emphasis on biological control. The review concludes by taking into account the ecologi-
cal prospective of the water—the precious fluid and a basis of life on the earth.
Introduction
Water, a precious natural resource, is essential for a multiplicity of purposes. Water consti-
tutes the major bulk (70%–90%) of all living cells. Water is an essential, life-supporting factor
EUTROPHICATION: AN ECOLOGICAL VISION 451
in every cell (microcosm), individual organism, ecosystem, and cosmos. Freshwater is utilized
in drinking, several domestic and household purposes, industrial cooling, power generation,
agricultural irrigation, and waste disposal. Since time immemorial, water bodies (river, lakes,
and oceans) have been the cheapest route of transportation. Nature has not provided any alter-
native or replacement of water (essential for all life forms). Today, in almost all spheres of
human activity, a far larger amount of water is drawn out than what is actually required. Due to
careless and excessive uses, a major bulk of water is drained out in an impure state as waste. At
many places in India, clean water is no longer available for domestic uses. The rapid rise in
demand for freshwater is a manifestation of an equally rapid growth in the number of consum-
ers. However, reckless overconsumption, misuse, pollution, eutrophication, and depletion of
the underground water table, not simple population growth, are the actual causes of degenera-
tion of freshwater.
Beeton (2002) predicted that climate change and pollution are global problems that will
affect all lakes, large or small. Diversion of water out of or away from large lakes will become
more of a threat as global human population growth continues and water supplies from rivers
and groundwater become depleted. Most of the aquatic ecosystems of varying characters world-
wide receive regular inputs of a range of nutrients in varying quantities. High amounts of
nutrients are unloaded into water bodies from human settlements via sewage. These nutrients
result in the extensive growth of aquatic flora. Eutrophication is a kind of nutrient-enrichment
process of any aquatic body, which results in an excessive growth of phytoplanktons. This
undesirable overgrowth of aquatic plants and their subsequent death form a greenish slime
layer over the surface of the water body. The slime layer reduces light penetration and restricts
reoxygenation of water through air currents. The death and decay of aquatic plants produces a
foul smell and makes the water more turbid (Beeby, 1995; Rao, 1998).
Eutrophication, or the promotion of the growth of plants, animals, and microorganisms in
lakes and rivers, has been a very slow, natural process. If this is allowed to occur uninterrupted,
it results in an excessive deficiency of oxygen in the water. Thus organisms that thrive under
anaerobic conditions are favored more and more at the expense of aerobic organisms (Mengel
& Kirkby, 1996). In surface waters, phosphorus concentrations exceeding 0.05 mg L–1
may
cause eutrophic conditions (Hinesly & Jones, 1990). Eutrophication of drainage ditches by
overfertilization with nitrogen and phosphorus causes a shift mainly from submerged aquatic
vegetation to a dominance of floating duckweeds. This results in anoxic conditions, loss of
biodiversity, and hampering of the agricultural functions of such ditches (Janse & Puijenbroek,
1998). The change in eutrophic conditions is reflected in the occurrence, pattern of distribu-
tion, and diversity of the biotic community (Tiwari, 1998).
Many natural water bodies are described as oligotrophic, for they have clear-water ecosys-
tems in which primary and secondary productivities are limited by a shortage of major nutrients
(Beeby, 1995). These oligotrophic water bodies, if brought under natural succession, require
thousands of years to become eutrophic. The enrichment of aquatic ecosystems through the
discharge of human wastes from settlements and excessive fertilizers from agricultural lands
brings down the water bodies under an undesirably increased rate of eutrophication.
Nitrogen and phosphorus are essential elements required by plants and animals for main-
taining their growth and metabolism. Small amounts of nitrates and phosphates occur in all
aquatic ecosystems and maintain a balanced biological growth in such ecosystems. In waste-
water, these nutrients are abundant as phosphates, nitrates, and ammonia or combined or-
ganic nitrogen. These compounds often enter the water bodies directly from the fertilizer
manufacturing and processing units or from the agroecosystems having excessive applica-
tions. In their model, Welch and Crooke (1987) predicted the decline in phosphorus loading by
452 THE BOTANICAL REVIEW
diverting effluents away from Lake Washington, which became eutrophic as the city of Seattle
expanded.
Eutrophication is one of the serious kinds of water pollution directly affecting the fauna due
to the loss of dissolved oxygen. It leads to an early and relatively faster mortality rate of fish
and thus spoils the desired water qualities of ponds and lakes. Fishing and navigation in eutrophic
water become difficult due to enmeshed and heavy growth of plants. Hydroelectric generation
from such water storage is adversely affected as nutrient rich water acts chemically upon the
turbines. At the end of an algal bloom, the decomposing debris also spoils the desired water
characteristics and may result in the growth of disease-causing bacteria. Uncontrolled eutrophi-
cation leads to a rapid upwelling of a water body. The limited storage and water-recharging
capacity of smaller freshwater bodies is reduced by silting. Small lakes and many ponds steadily
lose their aquatic entity and become permanently terrestrial in nature. Eutrophication leads to
significant changes in water quality. It lowers the value of surface waters for the industrial and
recreational uses. Overpopulation of algae makes water unfit for swimming. Algae growing in
long strands often twine around boat propellers and make boating difficult. Eutrophic waters
tend to be scummy, cloudy, or even soupy green. The rapidly growing aquatic plants may wash
onto the shore in storms or high winds. Where these plants die, decay produces a bad smell all
around such water bodies (Penelope & Charles, 1992).
DEFINITION
Lakes and estuaries accumulating large amounts of plant nutrients are called “eutrophic”
(from the Greek words eu meaning “well” and trophe meaning “nourishment”). Eutrophication
may be defined as the sum of the effects of the excessive growth of phytoplanktons leading to
imbalanced primary and secondary productivity and a faster rate of succession from existing to
higher seral stage as caused by nutrient enrichment through runoffs that carry down overused
fertilizers from agroecosystems and/or discharged human waste from settlements. Eutrophica-
tion is a plant-growth-promoting process resulting from accumulation of nutrients in lakes or
other water bodies. It is in fact a very slow, natural process, but it can be greatly accelerated by
human activities that increase the rate of nutrient input in a water body.
Among various natural resources, water is an important resource and one of the prime
necessities of life. Water quality is deteriorating steadily due to rapid industrialization and
urbanization. Undesirable changes in the physicochemical characteristics of water bring about
water pollution, which in turn affects the planktonic flora of the water body in question. Algal
growth is limited by the available supply of phosphorus or nitrogen. Oligotrophic water bodies
contain less than 5–10 µg L–1
of phosphorus and less than 250–600 µg L–1
of nitrogen. The
mean primary productivity in oligotrophic water is reported between 50–300 mg carbon m–2
day–1
. In moderately eutrophic water bodies the phosphorus content is 10–30 µg L–1
, and the
nitrogen content is 500–1100 µg L–1
. The primary productivity in eutrophic water is reported to
be above 1 g carbon m–1
day–1
(Likens et al., 1977). If excessive amounts of phosphorus and
nitrogen are added to the water, algae and aquatic plants can grow in large quantities. When
these algae die, they are decomposed by bacteria. The decomposers use up the dissolved oxy-
gen of the water body. The dissolved oxygen concentrations often drop too low for fish to
breathe, leading to fish kills (Murphy, 2002).
EUTROPHICATION STUDIES ON LAKES
Lakes can be synthetically characterized as plain lakes, very shallow, polymictic, eutrophic,
or hypereutrophic. During the peak of the growth season three types of the large lakes are
EUTROPHICATION: AN ECOLOGICAL VISION 453
distinguished: 1) lakes with relatively low phytoplankton biomass and abundant rooted macro-
phytes; 2) lakes with high inorganic turbidity, scarce macrophytes population, and low phy-
toplankton biomass; and 3) lakes clearly limited in their productivity by light availability and
are the result of direct human action on their drainage basins (Quiros et al., 2002). Limnologi-
cal studies on lakes, rivers, and streams have been emphasized owing to deterioration of water
quality due to eutrophication (Saxena et al., 1988).
Lake Erie is a fitting example of eutrophication due to humanmade problems. This lake is
surrounded by four American states and one Canadian province. It is approximately 240 miles
long and 57 miles wide. The lake has a shallow western basin (average depth of 24 feet), a deep
eastern basin (maximum depth of 210 feet) and a central basin (average depth of 60 feet). The
lake is biologically the most productive of the Great Lakes because it is the shallowest and
warmest, and it is excessively rich in nutrients (Reutter, 1989). The human activities around the
lake have enhanced the nutrient input rate and accelerated the natural aging process known as
eutrophication. This aging process brought down the lake under a faster cycle of succession.
This succession is the process by which a water body becomes a marsh, then a bog, and finally
a drier terrestrial body (Reutter, 1989). According to an estimate, more than 80 tons of phos-
phates were added daily in the lake in 1965, and each 400g of phosphate induces an algal
bloom to add about 350 tons of algal slime (Sharma, 1998). Nutrient (such as phosphorus)
enrichment in the Lake Erie has resulted in huge blooms of floating blue-green algae and the
attached green alga, Cladophora spp. These blooms have rolled onto beaches in large mats
resembling green steel wool. The blooms impaired the light penetration in the lake, reduced
photosynthesis and oxygen production. When the bloomed algae died, the decomposers further
depleted the dissolved oxygen (Reutter, 1989). Interestingly, all forms of phosphorus entering
Lake Erie were not biologically available to phytoplanktons. Therefore, reducing total phos-
phorus input is not as important as reducing the input of usable phosphorus (bioavailable or
soluble reactive form). It is also known that detergents, sewage, and agricultural fertilizers are
major sources of phosphorus in a form capable of stimulating the growth of algae (Reutter,
1989).
Lake Washington became eutrophic as the city of Seattle expanded and discharged more of
its effluent into the lake. Models accurately predicted the decline in the phosphorus concentra-
tion of the water when the effluents were diverted. These models helped to demonstrate that
phosphorus was the key nutrient in the eutrophication of the ecosystem (Welch & Crooke,
1987). Lake Okeechobee, in southeastern Florida, is a shallow mixing basin with annual total
phosphorus concentrations of 50–100 µg L–1
. The minima in orthophosphorus and inorganic
nitrogen were found to be seasonally limited (Schelske, 1989). Owing to seasonal and spatial
gradations in phosphorus and nitrogen concentrations, the empirical models based on annual
phosphorus loadings were not adequate to predict chlorophyll concentration or other trophic
state variables in the lake (Schelske, 1989). Lake Apopka is another large, shallow lake in
Florida. The lake was made hypereutrophic by phosphorus loading from floodplain farms and
has high levels of nutrients, phytoplankton, and suspended matter (Coveney et al., 2002).
In Lake Lugano, between Italy and Switzerland, a faster rate of eutrophication is reported
due to excessive discharges from human settlements around the lake, owing to population
increase and immigration (Barbieri & Simona, 2001). In 1960s Lake Lugano received about
55% of its phosphorus input from metabolic sources and 45 % from detergents and cleaning
products. Field investigations were conducted on Jaroslawieckie Lake, in Poland, during the
summer of 1996. The lake had several plant communities in corresponding variable environ-
ments. Most habitats of this lake were eutrophic. Analysis of the phytoplankton samples and
bottom sediment showed a succession of algae, corresponding to the increasing trophic levels

454 THE BOTANICAL REVIEW
(Pelechaty et al., 1997). Most freshwater lakes in the northern and western portions of the
Netherlands are very shallow (<2 m). These lakes vary in area from a few hectares to a few
thousand hectares. The input to the lakes of phosphorus and nitrogen and of polluted waters
from the rivers and canals have been the major cause of eutrophication (Gulati & van Donk,
2002).
In Uruguay there was no upper limit for phosphorus content in detergents. Detergents con-
tributed 58% of the daily phosphorus load (2.5 tons) to the Río de la Plata at Montevideo.
Consumption of phosphorus-based fertilizers in Uruguay showed an oscillatory pattern of in-
crease and decrease between 1959 and 1985 but stability, at around 40,000 tons per year, from
1985 to 1990. Based on soil-erosion levels, population settlements, and fertilizer-use data, the
water bodies were phosphorus sensitive in the three zones of the country; namely, central-
south, western zone, and the eastern rice fields (Sommaruga et al., 1995).
The majority of Danish lakes are highly eutrophic due to high nutrient input from domestic
sources and agricultural activities. Several factors—reduced nutrient retention, more rapid re-
moval in catchments, and channelization of streams—also play a role in eutrophication (Jeppesen
et al., 1999). Control measures have resulted in 73% reduction in total phosphorus concentration
of point-source-polluted streams since 1978, but reduction of the total nitrogen concentration
has not been significant (Jeppesen et al., 1999). Surface runoff rich in agricultural wastes and
underground seepage from urban and rural areas enriched the Lake Kastoria in Greece with
nutrients and intensified eutrophication (Koussouris et al., 1991).
Lake Peipsi (3555 km2, mean depth 7.1 m), consisting of three parts—Lake Peipsi, Lake
Pihkva, and Lake Lammijarv—is located on the border of Estonia and Russia. The Lake Peipsi
part is unstratified eutrophic possessing mesotrophic features. The Lake Lammijarv part has
some eutrophic features, and the Lake Phikva part is a typically unstratified eutrophic. The
mean concentrations of total phosphorus and nitrogen in the surface water were 42 and 767 mg
m–3
, respectively. The biomass of phytoplankton fluctuated between 1 and 125 g m–3
; that of
zooplankton, from 0.088 to 6.344 g m–3
, with a summer average of 3.092 g m–3
. The species
diversity was up to 129 taxa, and the dominant species were typical of eutrophic lakes, includ-
ing Phragmites australis (Haberman et al., 2000).
Lake Taihu, in China, is in the mesoeutrophication stage owing to the nutrients unloading
from local industries and agricultural areas. The main eutrophic area of this lake is Meiliang
Bay. The chemical oxygen demand was 4.63 mg L–1
in 1993. Total nitrogen and total phospho-
rus contents were 3.93 mg L–1
and 0.107 mg L–1
, respectively, in 1995. The Microcystis spp.
among five major component phytoplankton species occupied 85% of the algal biomass and
led to an algal bloom in summer that, in turn, affected the supply of water to the city of Wuxi
(Weimin et al., 1997). Eutrophication is one of the main factors causing increased growth of
green algae and turbid waters in Donghu Lake, also in China (He et al., 2002). Excessive
growth of Eicchornia crassipes and Alternanthera pheloxirodes has been noted in the shallow,
eutrophic Donghu Lake. The blooming in terms of biomass and height of the species was noted
in the month of November in 1996 and 1998. Alternanthera pheloxirodes showed the begin-
ning of bloom in September; E. crassipes, in October (Liu et al., 2004).
City Park Lake is a shallow, urban, hypereutrophic lake in Baton Rouge, Louisiana. The
lake has become highly eutrophic and suffered from frequent algal blooms and fish kill (Ruley
& Rusch, 2002).
Garg et al. (2002) studied three lakes of Bhopal (Upper Lake, Lower Lake, and Mansarovar
Lake) in India, to assess the potential fertility of lentic waters and to analyze the floral ecology.
The highest level of eutrophication was found in Mansarovar Lake. The nutrient unloading into
the lake initially promoted the growth of phytoplanktons. But the higher nutrient levels eliminated
EUTROPHICATION: AN ECOLOGICAL VISION 455
the sensitive phytoplankton due to competition with other species (Garg et al., 2002). Hydro-
biological study of Lake Mirik in the Darjeeling Himalayas was conducted by Jha and Barat
(2003). The study revealed higher concentration of nutrients in certain pockets of the lake, due
to increased human influences that spoiled the quality of potable water. Bellandur Lake is one
of the major lakes of Bangalore, India. The addition of effluents from urbanized Bangalore city
has changed the characteristics of the lake from a natural, oligotrophic lake to an artificial
reservoir of domestic sewage and industrial effluents (Chandrashekar et al., 2003). Singhal and
Mahto (2004) studied the characteristics Robertson Lake in the urban area of Jabalpur, India
and found low species density, fast shallowing, dominance of detritus food webs, and water
unsuitable for human consumption. To gain more insight into the gravity of damage caused by
eutrophication to our depleting water resources, a brief account of the ecological aspects of
distribution and water cycle is given herewith.
Water Resources
Water is a most essential natural resource. The main sources of water are rainfall, surface
water (ponds, rivers, lakes), and groundwater (wells, water pumps). The water has great eco-
logical significance. It constitutes 70% of the weight of organisms, so it is a significant medium
for biological activities. About 70% of the earth’s surface is covered by water constituting
aquatic ecosystems. Water is an agent of: 1) energy transfer in ecosystems; 2) geological activi-
ties that cause weathering rocks to form soil; 3) a nutrient distribution medium as a solvent for
soluble salts or a suspending medium for insoluble salts; 4) atmospheric temperature regula-
tion as the water vapors act as an atmospheric blanket and absorb heat radiation, thus regulat-
ing the temperature of the earth’s upper crust; and 5) an atmospheric scavenger as water vapors
absorb gaseous pollutants and particulate matters and wash them down.
WATER CYCLE
The cycle involves evaporation, transpiration, cloud formation, and precipitation. Only a
minor amount of water remains in circulation between the atmosphere and water bodies on the
earth’s surface, living organisms, underground water bodies, and oceans. The melting water
locked into ice caps is brought down by streams and rivers. Ultimately a bulk of it is drained
into lakes and oceans, from which it evaporates. It is brought back to the land as precipitation
from clouds, which recharges the underground and surface water bodies. Each gram of ice
requires 80 g cal of energy to be converted into a liquid state and another 536 g cal to be
vaporized. In dimictic lakes of the temperate regions, semiannual temperature inversions cause
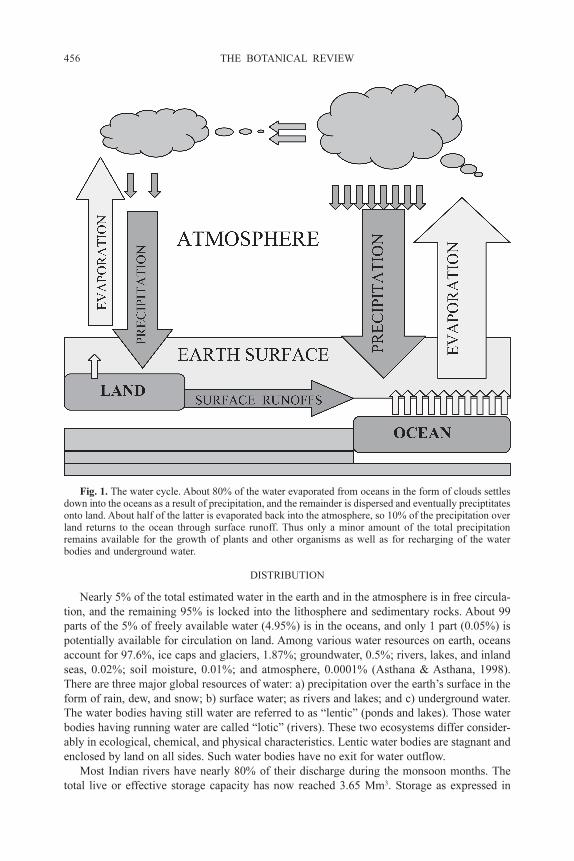
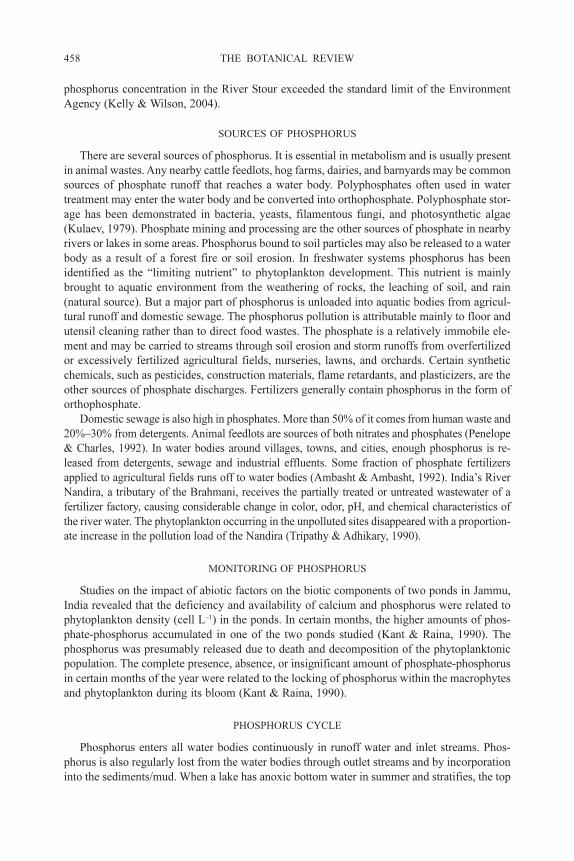
movement of water from a surface layer to deeper layers and vice versa. Figure 1 shows the
circulation of water between land surface and ocean via atmosphere and its locking into under-
ground water. A major amount of the evaporated water from the oceans and large lakes is
precipitated back into the oceans and lakes. Only a portion of the evaporated water is trans-
ported to the land through the atmosphere, where some of it is evaporated back to the atmo-
sphere. Part of the precipitation on the land is intercepted by the forests, green plants, crops,
and a large number of organisms and other objects on the earth. The component of water
available on the earth’s surface circulates among all organisms of the terrestrial and aquatic
ecosystems. The pattern of this water cycle is shown in Figure 1. During the circulation of
water between ocean and land the highest global average of water (available on the land) is
reported in the months of March and April. In India, however, the larger quantity of water on
the land is received in the monsoon months, from mid-June to September. The excessive
availability of water on land varies from region to region and according to the local climate.
456 THE BOTANICAL REVIEW
DISTRIBUTION
Nearly 5% of the total estimated water in the earth and in the atmosphere is in free circula-
tion, and the remaining 95% is locked into the lithosphere and sedimentary rocks. About 99
parts of the 5% of freely available water (4.95%) is in the oceans, and only 1 part (0.05%) is
potentially available for circulation on land. Among various water resources on earth, oceans
account for 97.6%, ice caps and glaciers, 1.87%; groundwater, 0.5%; rivers, lakes, and inland
seas, 0.02%; soil moisture, 0.01%; and atmosphere, 0.0001% (Asthana & Asthana, 1998).
There are three major global resources of water: a) precipitation over the earth’s surface in the
form of rain, dew, and snow; b) surface water; as rivers and lakes; and c) underground water.
The water bodies having still water are referred to as “lentic” (ponds and lakes). Those water
bodies having running water are called “lotic” (rivers). These two ecosystems differ consider-
ably in ecological, chemical, and physical characteristics. Lentic water bodies are stagnant and
enclosed by land on all sides. Such water bodies have no exit for water outflow.
Most Indian rivers have nearly 80% of their discharge during the monsoon months. The
total live or effective storage capacity has now reached 3.65 Mm3. Storage as expressed in
Fig. 1. The water cycle. About 80% of the water evaporated from oceans in the form of clouds settles
down into the oceans as a result of precipitation, and the remainder is dispersed and eventually preciptitates
onto land. About half of the latter is evaporated back into the atmosphere, so 10% of the precipitation over
land returns to the ocean through surface runoff. Thus only a minor amount of the total precipitation
remains available for the growth of plants and other organisms as well as for recharging of the water
bodies and underground water.
EUTROPHICATION: AN ECOLOGICAL VISION 457
percentage of total flow shows Pennar to be the highest, with 61%, followed by Mahi, 56%,
Tapi, 45%, and Krishna, 44%. All these rivers have reached the saturation level of nearly 50%.
The rest range from 34% (Indus) to 7% (Ganges), 6% (Narmada), and 4% (Subarnarekha).
Power generation is another cause of ecodegradation in these water bodies due to dams and
canals (Sharma, 1998). However, the discharge of nutrients—specifically, the phosphorus in-
put—is the major cause of the degradation of characteristics, species structure, and size of the
water bodies.
Phosphorus and Its Role
Phosphorus is a macronutrient necessary for all living cells. It is an important component of
adenosine triphosphate, adenosine diphosphate, nicotinamide adenosine dinucleotide phos-
phate, nucleic acids, and phospholipids in cell membranes. Phosphorus may be stored in intra-
cellular volutin granules as polyphosphates in both prokaryotes and eukaryotes. It is a limiting
nutrient for algal growth in lakes.
ROLE OF PHOSPHORUS IN EUTROPHICATION
The average concentration of total phosphorus (inorganic and organic forms) in wastewater
has been reported to vary in the range of 10–20 mg L–1
(Bitton, 1999). Approximately 15% of
the U.S. population contributes phosphorus-containing wastewater effluents to lakes, resulting
in eutrophication of those water bodies (Hammer, 1986). Phosphorus concentration in clean
waters is generally very low. Phosphorus is used extensively in fertilizers and other chemicals
and commonly accumulates in higher concentrations in the water bodies around agricultural
fields or densely populated areas. In water bodies, the phosphorus may be present in various
forms. All forms of phosphorus are not readily available to plants. Total phosphorus is a mea-
sure of all forms of phosphorus (dissolved or suspended) found in any water sample. The
soluble reactive phosphorus is a measure of orthophosphate. The soluble inorganic (a filterable
fraction) phosphorus is the form directly taken up by plant cells. While monitoring the water
bodies, the latter form of phosphorus would be of special significance to determine the stage of
eutrophy and oligotrophy.
Natural waters are normally deficient in phosphorus and other plant nutrients. Such natural
water bodies support only a limited growth of algae and higher aquatic plants. An additional
loading of phosphorus in any of the various forms—orthophosphate, pyrophosphate, meta-
phosphate, mono- and di-hydrogen phosphate, etc.—results into an undesirably extensive growth
of algae and/or other aquatic plants like water hyacinth (Ambasht & Ambasht, 1992). The
death and decay of the bloomed aquatic flora further deteriorate the natural water bodies. The
organic form of phosphorus is decomposed by bacteria in the bottom of the eutrophic water
bodies and converted into inorganic form, which readily diffuses upward to the photic zone.
The inorganic form of phosphorus is recycled again by the aquatic flora via absorption, pho-
tophosphorylation, growth, death, and decay. Notestein et al. (2003) suggested that phospho-
rus rather than nitrogen was implicated as the nutrient that potentially limits periphyton growth
in the coastal stream of Florida.
Clastic sediments were found to act as a sink of phosphorus in a German lowland river,
especially in summer months. The particulate iron was reported to be the sorption site of phos-
phorus. The organic river substrate was, however, found to be a source of phosphorus rather
than a sink (Schulz & Herzog, 2004). England and Wales were found vulnerable to the transfer
of sedimentary phosphorus from agriculture to river. Estimates of phosphorus transfer risks
were carried out on a larger grid size of resolution of 25 km2 (Chapman et al., 2003). The
458 THE BOTANICAL REVIEW
phosphorus concentration in the River Stour exceeded the standard limit of the Environment
Agency (Kelly & Wilson, 2004).
SOURCES OF PHOSPHORUS
There are several sources of phosphorus. It is essential in metabolism and is usually present
in animal wastes. Any nearby cattle feedlots, hog farms, dairies, and barnyards may be common
sources of phosphate runoff that reaches a water body. Polyphosphates often used in water
treatment may enter the water body and be converted into orthophosphate. Polyphosphate stor-
age has been demonstrated in bacteria, yeasts, filamentous fungi, and photosynthetic algae
(Kulaev, 1979). Phosphate mining and processing are the other sources of phosphate in nearby
rivers or lakes in some areas. Phosphorus bound to soil particles may also be released to a water
body as a result of a forest fire or soil erosion. In freshwater systems phosphorus has been
identified as the “limiting nutrient” to phytoplankton development. This nutrient is mainly
brought to aquatic environment from the weathering of rocks, the leaching of soil, and rain
(natural source). But a major part of phosphorus is unloaded into aquatic bodies from agricul-
tural runoff and domestic sewage. The phosphorus pollution is attributable mainly to floor and
utensil cleaning rather than to direct food wastes. The phosphate is a relatively immobile ele-
ment and may be carried to streams through soil erosion and storm runoffs from overfertilized
or excessively fertilized agricultural fields, nurseries, lawns, and orchards. Certain synthetic
chemicals, such as pesticides, construction materials, flame retardants, and plasticizers, are the
other sources of phosphate discharges. Fertilizers generally contain phosphorus in the form of
orthophosphate.
Domestic sewage is also high in phosphates. More than 50% of it comes from human waste and
20%–30% from detergents. Animal feedlots are sources of both nitrates and phosphates (Penelope
& Charles, 1992). In water bodies around villages, towns, and cities, enough phosphorus is re-
leased from detergents, sewage and industrial effluents. Some fraction of phosphate fertilizers
applied to agricultural fields runs off to water bodies (Ambasht & Ambasht, 1992). India’s River
Nandira, a tributary of the Brahmani, receives the partially treated or untreated wastewater of a
fertilizer factory, causing considerable change in color, odor, pH, and chemical characteristics of
the river water. The phytoplankton occurring in the unpolluted sites disappeared with a proportion-
ate increase in the pollution load of the Nandira (Tripathy & Adhikary, 1990).
MONITORING OF PHOSPHORUS
Studies on the impact of abiotic factors on the biotic components of two ponds in Jammu,
India revealed that the deficiency and availability of calcium and phosphorus were related to
phytoplankton density (cell L–1
) in the ponds. In certain months, the higher amounts of phos-
phate-phosphorus accumulated in one of the two ponds studied (Kant & Raina, 1990). The
phosphorus was presumably released due to death and decomposition of the phytoplanktonic
population. The complete presence, absence, or insignificant amount of phosphate-phosphorus
in certain months of the year were related to the locking of phosphorus within the macrophytes
and phytoplankton during its bloom (Kant & Raina, 1990).
PHOSPHORUS CYCLE
Phosphorus enters all water bodies continuously in runoff water and inlet streams. Phos-
phorus is also regularly lost from the water bodies through outlet streams and by incorporation
into the sediments/mud. When a lake has anoxic bottom water in summer and stratifies, the top
EUTROPHICATION: AN ECOLOGICAL VISION 459
few millimeters of mud is chemically reduced to a condition that allows the phosphorus to
release back into the water. The bottom water thus becomes phosphorus rich. Stirring of the
lake by winter storms brings the phosphorus-rich water to the surface, completing an annual
cycle and fertilizing the lake for a spring plant bloom. An almost similar pattern of phosphorus
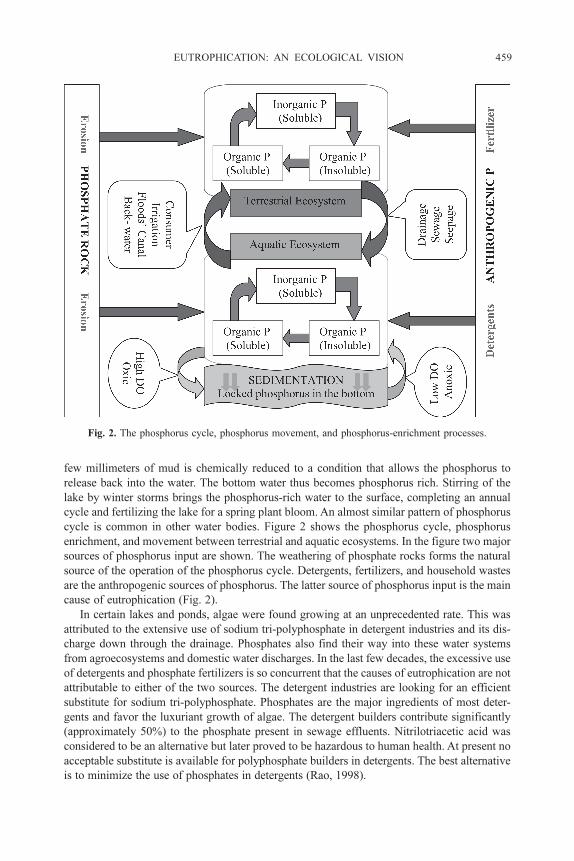
cycle is common in other water bodies. Figure 2 shows the phosphorus cycle, phosphorus
enrichment, and movement between terrestrial and aquatic ecosystems. In the figure two major
sources of phosphorus input are shown. The weathering of phosphate rocks forms the natural
source of the operation of the phosphorus cycle. Detergents, fertilizers, and household wastes
are the anthropogenic sources of phosphorus. The latter source of phosphorus input is the main
cause of eutrophication (Fig. 2).
In certain lakes and ponds, algae were found growing at an unprecedented rate. This was
attributed to the extensive use of sodium tri-polyphosphate in detergent industries and its dis-
charge down through the drainage. Phosphates also find their way into these water systems
from agroecosystems and domestic water discharges. In the last few decades, the excessive use
of detergents and phosphate fertilizers is so concurrent that the causes of eutrophication are not
attributable to either of the two sources. The detergent industries are looking for an efficient
substitute for sodium tri-polyphosphate. Phosphates are the major ingredients of most deter-
gents and favor the luxuriant growth of algae. The detergent builders contribute significantly
(approximately 50%) to the phosphate present in sewage effluents. Nitrilotriacetic acid was
considered to be an alternative but later proved to be hazardous to human health. At present no
acceptable substitute is available for polyphosphate builders in detergents. The best alternative
is to minimize the use of phosphates in detergents (Rao, 1998).
Fig. 2. The phosphorus cycle, phosphorus movement, and phosphorus-enrichment processes.
460 THE BOTANICAL REVIEW
Detergents and Their Role
DEFINITIONS
Many definitions of synthetic detergents have been proposed, all of which are of a very
wide scope. After several years of deliberation the Comiti International de Dirivis Tensio Actifs
defined the detergent as a “product, the formulation of which is specially devised to promote
the development of detergency. . . . A detergent is a formulation comprising essential constitu-
ents (surface active agents) and subsidiary constituents (builders, boosters, fillers and auxilia-
ries)” (Campbell, 1998). Perhaps the most widely used detergents are sodium salts of
alkylbenzene sulfonic acids. A long chain of the alkyl group is attached to a benzene ring by the
action of Friedel-Crafts catalyst and an alkyl halide, alkene, or alcohol. Sulfonation and neu-
tralization yields the detergent (Morrison & Boyd, 2000).
Of the two basic components of detergent—surfactants and builders—the surfactants, or
surface-active agents, are the main cleaning agents. Various brands of Indian detergents, in-
cluding those of multinational companies prevalent in the market, usually contain only 10%–
30% surfactants. The remainder comprises builders as polyphosphate salts (Rao, 1998; Sharma,
1998). In addition to the two basic components, certain products contain small amounts of
optical whiteners to increase cleaning efficiency. About 1 ppm of surfactant produces foam in
river and sewage treatment plants. This concentration is nontoxic to human beings but gives an
off taste to drinking water. Just 0.1 ppm of surfactant reduces the rate of oxygen absorption in
water to about half (Rao, 1998).
Orthophosphates and certain polyphosphates are major constituents of many commercial
cleaning preparations. In 1950s and 1960s, sodium phosphate was often used as a builder in
household detergents to increase cleaning power. The extensive use of detergents led to major
eutrophication problems. In the 1960s efforts were made by governments, detergent manufac-
turers, and consumers to reduce the use of phosphates in detergents. As a result, phosphorus
concentrations in many streams and lakes decreased. This was due to limits on the phosphate
content of detergent and also additional treatment used in wastewater treatment plants to re-
move phosphorus. Many states have a ban on phosphates in detergents (Campbell, 1998).
SYNTHETIC DETERGENT
Although the start of the synthetic detergent industry is not shrouded in the veils of history
as were the beginnings of the soap industry, it is nevertheless not easy to pinpoint exactly when
the detergent industry as such came into being. The term “synthetic detergent” needs to be
defined. In the United States the terms “surfactant” and “syndet” are being used, but in Europe
the term “tenside” (for tensio-active material) is more common. The first synthetic detergents
seem to have been developed by the Germans in the World War I period to allow fats to be
utilized for other purposes. Chemically these detergents were of the short-chain alkyl naphtha-
lene sulphonate type, made by coupling propyl or butyl alcohols with naphthalene and subse-
quent sulphonation, and they appeared under the general name of “Nekal.” These products
proved to be only fair to moderately good detergents but good wetting agents, and they are still
being produced in large quantities for use as textile auxiliaries (Campbell, 1998).
In the late 1920s and early 1930s long-chain alcohols were sulphonated and sold as the neutral-
ized sodium salts without any further additions except for sodium sulphate as an extender. In the
early 1930s long-chain alkyl aryl sulphonates with benzene as the aromatic nucleus and the alkyl
portion made from a kerosene fraction appeared in the U.S. market. These products were earlier
available to the industries as sodium salts. Proteolytic enzymes were tried as additives to washing
powders in Germany in the 1920s with only moderate success and again in Switzerland in the
EUTROPHICATION: AN ECOLOGICAL VISION 461
1930s. A little later, enzymes of organic origin appeared on the market. Heavy-duty detergent
formulations were introduced from 1947 onward. Initially these organic products were tetra so-
dium pyrophosphate; later these formulations had sodium tripolyphosphate. With the advent of
carboxy methyl cellulose and tri-polyphosphate builders, the detergent industry was on the rise
until 1970. Later, a combination of restrictions on the use of phosphates and international shortages
of raw materials reduced detergent production (Campbell, 1998).
Role of Some Other Nutrients
Nitrogen may limit phytoplankton production in temperate eutrophic waters, especially when
phosphate concentrations are high (when nitrogen:phosphorus ratios are low). The variations
in the chemical composition of natural waters are believed to be an important factor in regulat-
ing the abundance, composition, and geographical and periodic distribution of phytoplankton.
In phosphate-deficient water bodies or those having reasonably good growth of blue-green
algae (which fix enough of the atmospheric nitrogen), the phosphates become limiting, be-
cause some of it is used to counterbalance the high nitrate content (Reynolds, 1984). Inorganic
and organic nitrogen fluxes in the Ria Vigo (in the northwestern Iberian Peninsula) have been
quantified in order to recognize the contrasting nitrogen budget scenarios and understand the
biogeochemical response to eutrophication events (Prego et al., 2002).
A large-scale increase in the nutrient input in the water bodies induces faster plant growth,
imbalanced trophic structure, and reduced dissolved oxygen concentrations (Campus-Ortega,
1998; Moss, 1988). A majority of lakes and freshwater bodies the world over are excessively
loaded with a number of plant nutrients. Aquatic ecosystems respond variably to nutrient en-
richment and altered nutrient ratios, along a continuum from freshwater through estuarine,
coastal, and marine systems. Although phosphorus is mainly considered as the limiting nutrient
for phytoplankton production in freshwater systems, the effect of atmospheric nitrogen and its
contribution to the acidification of freshwater can also be detrimental. Among nitrogen, phos-
phorus, and silicon, nitrogen is generally considered as the primary limiting nutrient for the
accumulation of phytoplankton biomass (Rabalais et al., 2002). Seasonal phosphorus and ni-
trogen accumulation and release by two macrophytes stands—mart weed (Polygonum amphib-
ium) and marsh cudweed (Gnaphalium uliginosum)—growing in a eutrophic reservoir in
Spremberg, Germany were investigated by Kleeberg and Heidenreich (2004). The rate of re-
lease of phosphorus was faster than the rate of accumulation, and the nitrogen accumulation
rate was higher than the release rate (Kleeberg & Heidenreich, 2004).
Nutrient input into a more stable ecosystem causes eutrophication. It induced changes in
the ecosystem functioning and increased primary production in the Pagasitikos Gulf, in Greece
(Triantafyllou et al., 2001). Nitrates can enter natural waters from several sources. City sewage
and agroecosystems in India are the two major sources of nitrates. A considerable bulk (about
one-half) of human and animal wastes are nitrates. Fertilizer, which runs off croplands or sub-
urban lawns (in some countries) during rainstorms, contains large amounts of nitrates (Penelope
& Charles, 1992). Danish coastal waters were found to be heavily eutrophic, with high particu-
late concentrations and turbid waters. The chlorophyll concentration was strongly linked to the
total nitrogen concentration. In summer the total nitrogen concentrations accounted for about
60% of the variability in chlorophyll concentrations among the different coastal systems (Nielsen
et al., 2002).
In lentic and lotic water bodies, nitrogen and phosphorus cycling is closely related to sun-
light. In a water body with a phosphate:nitrate ratio of 1:15, all of the phosphate, but only about
half of the nitrate, is used up by aquatic plants. The phosphate in such a water body becomes
limiting, and nitrate accumulates in abundance. However, a water body with a nitrate:phosphate
462 THE BOTANICAL REVIEW
enrichment level at the ratio of 4:15 uses up all the nitrate, and the nitrate thus becomes limit-
ing. The acceptable level of total inorganic phosphate in water is 0.03 to 0.04 mg L–1
. In most
of the lakes and rivers in which eutrophication is encountered, the principal cause is excessive
enrichment of water by phosphates and nitrates. In and around cities and industries, phosphate
content has increased 20–25-fold during the last 10–15 years (Muller & Helsel, 1999).
Nitrogen and phosphorus, the most frequently discussed of all nutrients, enter lakes from
many sources. The three major nutrients in fertilizer required for crop growth are nitrogen,
phosphorus, and potassium. These nutrients, when unloaded into water bodies, promote phy-
toplankton (microscopic plants or algae) growth. This is important because phytoplankton rep-
resents the base of the food chain in lakes. The zooplankton feed upon phytoplankton, and
small fish feed upon zooplankton. The smaller fish are consumed by large carnivorous fish.
The growth of phytoplankton, or the primary productivity, is the first step in the food chain of
a lake. The extent of algal production indicates to a certain degree the productive capacity of a
lake. However, there are limits beyond which algal growth becomes detrimental to other aquatic
life (Reutter, 1989). In freshwater lakes and rivers, phosphorus is often the growth-limiting
nutrient, because it occurs in the least amount relative to the needs of plants. In estuaries and
coastal waters, nitrogen is generally the growth-limiting nutrient (Murphy, 2002).
Kant and Raina (1990) compared the phytoplankton population of the two ponds in the
Jammu and Kashmir region. The increase in population of phytoplankton was related to the
amount of magnesium available. The concentration of magnesium consistently reduced and
became untraceable with the increase in the standing crop of phytoplankton because of its
utilization in chlorophyll formation. The depletion of magnesium (due to its binding into chlo-
rophyll molecule) acts as a limiting factor for the growth of phytoplankton. The calcium in
these ponds was found inversely related to population sizes and fluctuations in the water tem-
perature (Kant & Raina, 1990). The additions of nutrients to the lakes were largely bound to the
inedible component of the phytoplankton. This ecosystem component consisting mainly of
blue-green algae (Cyanophyta) is avoided by planktivorous fish and zooplanktons because of
their toxicity and taste (Campbell, 1998). Shen (2002) found that algal growth was directly
related to the concentration of phosphorus and nitrogen in water. The number of algae in-
creased when total phosphorus in the water was 0.1–0.75 mg L–1
. The specific growth of algae
was highest when the concentration of total phosphorus was <0.5 mg L–1
and that of total
nitrogen was <1.0 mg L–1
. The effect of phosphorus was greater than was that of nitrogen.
Physicochemical characteristics and water pollution have been studied on Lake Banjara in
India for a period of two years. In this lake chlorides, calcium and magnesium were within
stipulated range where as the total solids and the total hardness of water exceeded the limits set
by the Indian Standards Institution and the World Health Organization, indicating the impact
of sewage and domestic waste (Swaranlatha & Rao, 1998).
Impact of Organic Matter
Some food-processing industries (meat, vegetables, cheese) contribute significantly to the
phosphorus that is unloaded into the freshwater bodies and leads to eutrophication (Vuillemin,
2001). The organic inputs (carbohydrates, proteins, and lipids) from the food industry increased
the biological oxygen demand level due to degradation of lipids and carbohydrates by microor-
ganisms in fresh water bodies (Jones, 2001). In West Bengal, India, high nutrient content was
found in a water body receiving washing from a rice mill (Chattopadhyay & Kushari, 2003).
Deteriorated water quality below Indian Standards Institution, World Health Organization, and
U.S. Public Health Service standards owing to discharge of sewage has recently been observed in
EUTROPHICATION: AN ECOLOGICAL VISION 463
the Cauvery River in India (Lalitha et al., 2003). The unprocessed effluents of leather tanneries
contribute a significant amount of tannin to the Ganges River in Kanpur, also in India.
Role of Environmental Factors
The environments inhabited by plankton are heterogeneous. Temporal changes in mean
temperature, irradiance, and nutrient availability are among the more obvious variables
(Reynolds, 1984). The population of cyanophytes dominated the phytoplankton community
upon phosphorus increase. On increase in phosphorus one can predict the relative dominance
of cyanophytes from the balance between nitrogen and phosphorus (Welch & Crooke, 1987).
The range of factors that can influence eutrophication dynamics may be fully investigated
when long-term data with respect to time series are available (Lau & Lane, 2002a, 2002b). The
algal bloom caused by phosphorus inputs also modifies several abiotic factors of the water
body. These factors directly govern the growth, diversity, and density of the biotic components.
The impact of algal bloom on any one or some of these factors indirectly influences the struc-
ture and characteristics of the water bodies. The influence of nutrient inputs on some of these
factors is discussed below.
CARBON DIOXIDE LEVEL
Cyanophytes are more capable of utilizing low levels of carbon dioxide and become more
buoyant at low levels of carbon dioxide and high water pH. It keeps them in the upper layers of
the water column with abundant sunlight. In addition, some species produce dense mats of vegeta-
tion and inhibit the growth of other phytoplankton, and they also limit the swimming of zooplank-
ton. These factors together mean that a slow-moving freshwater ecosystem can rapidly become
dominated by blue-green algae, displacing not only members of the phytoplankton but some of
the animal community as well. The reduction of light reaching the lake floor also inhibits
submerged and rooted macrophytes, and sediments become anoxic as large amounts of plank-
tonic biomass are added to them (Kant & Raina, 1990).
The fluctuations in free carbon dioxide values correspond directly with the fluctuation in
the standing crop of phytoplankton. As the diversity and density of phytoplanktons increase
through various months, the amount of free carbon dioxide for photosynthetic activity be-
comes limiting. The pH changes in these ponds are governed by the amount of free carbon
dioxide, carbon trioxide, and bicarbonate (Kant & Raina, 1990). Inflow nutrient concentration,
inflow volume, and inflow water temperature show very regular and reasonable impacts on the
quality of lake water (Imteaz et al., 2003). Yin (2002) reported that monsoons served as a
flushing mechanism in two ways: They reduced seasonal eutrophication by nutrient enrich-
ment in summer, and they prevented long-term (annual) accumulation of organic matter in the
sediments due to nutrient enrichment in the region. Because of the monsoon-influenced pro-
cesses and low phosphorus in the Pearl River estuary, the estuary and adjacent coastal waters of
Hong Kong appeared to be more resilient to enrichment of nitrogen.
TEMPERATURE
Temperature always influences fertility. If a lake is cold, a high nutrient loading may fail to
make it eutrophic. A relatively high influx of nutrients from the watershed is locked into the
toxic mud under an oxygen-rich hypolimnion. A large volume of water implies a large oxygen
reserve. Thus a very deep lake can retain oxygen in the hypolimnion all summer, even though
the surface waters are fertile, and deep lakes can retain the essential properties of oligotrophic
464 THE BOTANICAL REVIEW
lakes despite significant nutrient loading from the watershed (Colinvaux, 1993). The high wa-
ter temperatures that excluded certain zooplankton species, and the inedibility of the filaments,
further increased the dominance of cyanobacteria. In Mansarovar Lake in India, maximum
phytoplankton density was observed during winter, with minimum temperature, conductivity,
pH, and chloride contents of the lake water (Kulshreshtha et al., 1989). The effect of tempera-
ture on algal growth was more obvious than the other factors. The most favorable temperature
for algal growth was 30° C (Shen, 2002). The discharge of sewage and drainage water has
resulted in the change in temperature, pH, and metal concentration of a monsoon-fed freshwa-
ter pond in Coimbatore, India (Francis et al., 1997).
HYDROGEN ION CONCENTRATION (pH)
The pH is an important environmental factor. It is a plant-growth-limiting factor. The change
in pH is directly related to the availability and absorption of nutrients from solution. Ionization
of electrolytes or the valence numbers of different ion species are influenced by changes in pH.
The absorption of phosphate is accelerated by an acidic pH (Devlin & Witham, 1986). An
acidic pH has been reported to promote growth of Spirodela polyrrhiza at a faster rate. A pH of
6.0 was found most suitable. But the growth retardation in S. polyrrhiza has been noted below
pH 6.0 and/or above 9.0. A low pH also affected the chlorophyll b formation (Aziz & Mobina,
1999). But George and Heaney (1978) suggested that high pH values promote the growth of
phytoplankton and result in bloom.
LIGHT
Light plays an important role in the growth, diversity, and density of aquatic flora. Algal
growth has been reported to increase with light intensity, and luminescence of 4000 lux was
found most favorable (Shen, 2002). As eutrophication progresses, a decline of submerged mac-
rophytes occurs in many shallow lakes, probably due to low light intensity caused by algal
blooming. It is suggested that the adaptation strategy of Potamogeton maackianus under a
certain range of low light stress is to accelerate the elongation of the main and lateral shoots
and to increase their density (Ni et al., 1999).
The light has been almost completely absorbed by the plankton of the top few meters, so that
too little light penetrates to the thermocline and beyond to support photosynthesis. But there is a
rain of corpses into the deep water, whose decomposition requires oxygen. Since the deep water is
cut off from the air until fall overturn, an oxygen deficit develops in the deep water, and the bottom
mud is reduced. Eutrophication in an estuary is a complex process, and climate change is likely to
affect each estuary differently due to interactions with nutrient loading and physical circulation.
Hence, it is essential to consider the effects of climate change in the context of individual estuarine
function to successfully manage eutrophication (Howarth et al., 2000).
DISSOLVED OXYGEN
The minima and maxima in the concentration of dissolved oxygen are found to be directly
related to the maxima and minima of the phytoplankton. Slight variations in the relationship of
dissolved oxygen and phytoplankton in winter is attributable to the lowering of water temperature.
This in turn increases the capacity of water to hold more dissolved oxygen, possibly due to the
decreased photosynthetic activity of the phytoplankton brought about by temperatures beyond the
optima. This would otherwise act as limiting factor for photosynthetic activity (Kant & Raina,
1990). The direct relationship between phytoplankton and dissolved oxygen content has been ob-
served by a number of researchers (Lande, 1973; Misra et al., 1975; Saad, 1973; Schindler, 1971).
EUTROPHICATION: AN ECOLOGICAL VISION 465
Eutrophication versus Plant Diversity
Any change in the natural quality of water is best reflected in the change in natural flora and
fauna of the aquatic ecosystem (Kulshreshtha et al., 1989). The process of eutrophication re-
duced the number of rare species and increased the abundance of mesoeutrophentic to
hypereutrophentic species, particularly Fragilaria berolinensis, in the eutrophicated broad area
of De Nieuwkoopse Plassen in the Netherlands (Van Dam & Mertens, 1993). In a shallow lake
under eutrophic succession, the population of Chara spp. was positively, and that Potamogeton
pectinatus, slightly negatively, related to Secchi depth (Van Den Burg et al., 1999). Lake Geneva
underwent rapid eutrophication until 1980, followed by a reversal that is still in progress.
However, Potamogeton pectinatus, P. perfoliatus, P. lucens, and Elodea canadensis showed
no significant changes in their distribution, with the two former species dominant throughout.
Tracy et al. (2003) reported that aquatic macrophyte diversity and community have a strong
relationship to variations in nitrogen (nitrate and ammonia).
The impact of eutrophication on aquatic macrophyte diversity in weakly mineralized streams in
the northern Vosges Mountains, in northeastern France, was studied by Thiebaut and Muller (1998).
Macrophyte-specific richness and abundance increased along an upstream-to-downstream zona-
tion, which was characterized by an increase in mineralization and nutrient level. A comparison of
aquatic macrophyte diversity of two streams reflected the impact of human-induced perturbations
(fish farms, domestic sewage) in such weakly mineralized and poorly buffered waters. Disturbed
sites with very high nutrient loading were characterized by low vascular plant richness and by the
presence of filamentous algae (Thiebaut & Muller, 1998). Vadineanu et al. (1992) studied the
phytoplankton and submerged macrophytes in the aquatic ecosystems of the Danube Delta and
observed that the species changes were found to be linked to accelerated eutrophication of the
lakes, with increased phosphorus loading and a reduction in the nitrogen:phosphorus ratio.
Vaithiyanathan and Richardson (1999) observed distinct changes in the macrophyte species com-
position in response to phosphorus enrichment. Marshes in the unenriched and enriched areas were
dominated by Cladium jamaicense and Typha domingensis, respectively. Open-water areas were
characterized by Eleocharis spp., Utricularia spp., Chara zeylanica, and Nymphaea odorata in
oligotrophic areas and by floating plants and Polygonum spp. in eutrophic areas.
A shift in primary producers from eelgrass to macroalgae in response to increased nutrient
loading altered the habitat, physicochemical structure, and food webs. The nitrogen decreased
shoot density and biomass of the eelgrass and promoted a record increase in the algal biomass
(Deegan et al., 2002). Enhanced nutrient concentrations and loading have been observed in
several coastal areas of the North Sea, resulting in increased production and changes in the
species composition of phytoplankton (Colijn et al., 2002).
Garg et al. (2002) studied three lakes of Bhopal (Upper Lake, Lower Lake, and Mansarovar
Lake) in India and assessed the potential fertility of the lentic water and its aquatic flora. Eutro-
phication was highest in Mansarovar Lake. The observations of Garg et al. (2002) indicated
that different species of phytoplankton could subsist up to a certain nutrient level, beyond
which competition between cyanophytes and other algae enhanced and eliminated the sensitive
plankton flora.
Eutrophiocation versus Wetland Plants
Wetlands are ecologically complex hydrological and biogeochemical systems endowed with
specific structural and functional characters. A number of wetlands in India have been studied
with emphasis on macrophyte communities (Adoni & Yadav, 1985; Kaul, 1970; Kaul et al.,
1978; Trisal & Kaul, 1983). Much of the information has been compiled on wetlands ecology
466 THE BOTANICAL REVIEW
by Gopal et al. (1982). Macrophytes play an important role in energy flow and organic matter
input during recycling of nutrients in water bodies (Mickel & Wetzel, 1978).
The experiments by Smolders et al. (1995) revealed that internal eutrophication processes
causing eutrophication without any nutrient input play an important role in wetlands. Purple
loosestrife (Lythrum salicaria) rapidly displaced the native vegetation in North American wet-
lands. The conversion of wetland vegetation from cattails (Typha spp.) to loosestrife is ex-
pected to cause significant changes in wetland function by altering the timing of litter input and
downstream phosphorus loads. The conversion of a riverine flowing through wetland from
Typha to loosestrife may effectively accelerate eutrophication of downstream water bodies
(Emery & Perry, 1996).
Eutrophication versus Succession Pathways
Succession is the process by which a water body becomes a marsh, then a bog, and finally
a drier terrestrial body. Human activities around the aquatic bodies have enhanced the nutrient-
input rate and accelerated the natural aging process known as “eutrophication.” This aging
process brought down the water body under a faster cycle of succession (Reutter, 1989). Eutrophi-
cation is a noticeable problem of aquatic environments all over the world. In the Netherlands,
the abundance of many aquatic macrophytes has shown a steep decline, and the eutrophic
habitats are now characterized by floating species like Lemna spp., Spirodela polyrrhiza, and
Azolla filiculoides. Weimin et al. (1997) found China’s Lake Taihu in the mesoeutrophication
stage. The dominant phytoplankton species noted were Microcystis, Anabaena, Melosira, Cyclo-
tella, and Cryptomonas. In summer Microsystis spp. occupied 85% of algae biomass and re-
sulted in an algal bloom.
Benndorf and Henning (1989) found that the seasonal increase in the toxicity of Microcytis
aerugicosa in a reservoir was due to the selective consumption of nontoxic strains by Daphnia. The
toxic varieties inhibit the invertebrate’s filtering rate and so are avoided; leaving patches of the
strain that can go on to dominate the ecosystem. Thus in a cyanophyte-dominated community with
eutrophic and calm waters the grazing activity of the Daphnia may actually promote the growth of
a toxic phytoplankton as the season progresses. Moss et al. (1991) found that, in the absence of fish
predation, larger Daphnia species could flourish only where cyanophytes were absent. In the pres-
ence of the filamentous Oscillatoria, only smaller species of zooplankton were found. These alter-
ations in the community structures modify the environment of water body and in turn pave the way
for the development of another community of a higher trophic level.
Bioindicators of Eutrophication
Bioindicators act as a measure of prevailing environmental conditions. Also referred to as
“ecological indicators,” bioindicators provide information on the ecosystem condition. They
may be used to observe the functioning and cause-and-effect relationships within an ecosys-
tem. The biological indicator of eutrophication may be a single species or an assemblage of
several species. The diversity and distribution of species in an ecosystem depends upon the
ecological amplitude of species and the existing environment of the ecosystem. Some of the
biological parameters are given below.
STRUCTURAL DIVERSITY
Indicators for eutrophication differ for rivers and for lakes. For river ecosystems the
bioindicators describe the diversity and occurrence of life cycles along the longitudinal and
EUTROPHICATION: AN ECOLOGICAL VISION 467
lateral dimension. For lake ecosystems two bioindicators are selected that are characteristic for
the switch between the two equilibrium states: the area and biomass of macrophytes, indicating
that turbidity has lessened to the extent that macrophytes can grow; and the ratio between prey
fish and predatory fish, which has to be 1:1 to 2:1 to guarantee a long-term, stable, clear lake
(Lorenz, 2003). Phytoplankton, aquatic vegetation, and fish play important roles as indicators
of eutrophication (Sekulic et al., 1998). Some biotic components given below have been used
as biological indicators of eutrophication.
Algae
Aquatic vascular plants are good indicators of water quality (Shimoda, 1984). Algae are
commonly used for biological assessment of water quality and indicators of eutrophication
(Garg et al., 2003; Patrick, 1950). Fast-growing, ephemeral algae are increasingly observed in
shallow coastal waters worldwide. This is generally considered a symptom of coastal eutrophi-
cation (Sundback et al., 2003). Eutrophication causes predictable increases in the biomass of
algae in lakes and reservoirs, in streams and rivers, and in wetland and coastal marine ecosys-
tems (Smith, 2003). Significant effects of sewage discharge on flora and fauna of Moa Point
Bay (New Zealand) have been observed by Rogers (2003). The area around the point of
discharge had limited biodiversity, but Ulva lactuca, a seaweed-like lettuce (a typical inhab-
itant of areas with high nutrient input) was found in abundance (Rogers, 2003). Growth and
continuous blooms of Microcystis and also the existence of Stigeoclonium indicate organic
pollution in Banjara Lake, in India (Swaranlatha & Rao, 1998).
Macrophytes
Schnitzler et al. (1996) studied the response of aquatic macrophyte communities to levels of
phosphorus and nitrogen in an old swamp on the upper Rhine plain in eastern France and
worked out the utility of some aquatic macrophytes as bioindicators of eutrophication. Vallisnaria
americana is reported to be the efficient biomonitor of organic contamination and stressed
aquatic ecosystems (Biernacki et al., 1996; Lovett-Doust et al., 1994; Potter & Lovett-Doust,
2001). Some significant bioindicators of eutrophication studied and listed by Stojanovic et al.
(1998) include Wolffia arrhiza, Lemna gibba, L. minor, L. trisulca, Spirodela polyrrhiza, Cerato-
phylum demersum, Elodea canadensis, Vallisnaria spiralis, Stratiotes aloides, Nupher lutea,
Bolboschoenus maritimus, Typha angustifolia, T. latifolia, and Phragmites communis. These
species were reported to be the best indicators of eutrophication caused by organic effluents
and nutrients (Stojanovic et al., 1998). The growth of Spirodela polyrrhiza was found to be
directly related to the nutrient concentration of water (Ansari & Khan, 2002). The population
and growth of Lemna minor and Spirodela polyrrhiza were studied as a measure of eutrophica-
tion caused by household detergents (Ansari, 2005).
Diatoms
The epiphytic diatom assemblage indicates eutrophication by nitrogen and phosphorus con-
centrations (Denys, 2003; Winter & Duthie, 2000). The changes in geochemistry and diatom
assemblages are probably linked to increases in nutrient supply (from sewage and diffuse agri-
cultural sources) and hence to increases in primary production (Gibson et al., 2003). The phos-
phorus could be considered as the driver of increased diatom production (Foy et al., 2003).
Epilithic diatom assemblages were used to evaluate water quality in the Karasu River basin in
Turkey, which was polluted by industrial, agricultural, and urban wastes (Gurbuz & Kivrak,
468 THE BOTANICAL REVIEW
2002). Diatoms are generally recognized as indicators in temperate streams, but Juttner et al.
(2003) also reported diatoms indicating stream quality in the tropics and subtropics in the
Kathmandu Valley and Middle Hills of Nepal and India. The diatom population and water
analysis revealed that England’s River Stour was eutrophic. Biological analysis of samples
taken downstream and upstream of a sewage-treatment plant showed little difference in the
diatom population. However, chemical analysis showed that nitrogen acted as a limiting factor
for some part of the year (Kelly & Wilson, 2004).
Plant Pigments
Wei et al. (2000) found that chlorophyll a was suitable as one of the biological indicators to
show the trend of eutrophication of Lake Kasumigaura, in Japan. However, it will be limited,
because the diversity index is employed only to test the biotic response to the change of water
environment. Phytoplankton photopigments were also reported as indicators of estuarine and
coastal eutrophication. The photopigment indicators can be routinely incorporated in water-
quality monitoring programs to assess environmental controls on ecosystem structure and func-
tion at varying spatial and temporal scales. Chlorophyll, however, may not be a consistent
parameter of eutrophication, because the response differs with change in trophic structure.
Kufel (2001) also suggested that chlorophyll in eutrophic lakes correlates well with nitro-
gen and phosphorus. However, chlorophyll-nutrient relationships varied with the trophic status
of the lake. Chlorophyll a was found to be a function of the level of orthophosphate concentra-
tion in the shallow, eutrophic Chinese Lake Donghu (Zhou et al., 2004). Significant seasonal
variation in the chlorophyll a of the planktons in the northern coast of Karawang, West Java,
Indonesia has been reported, as have variations in physical and chemical characteristics. These
variations have been attributed to eutrophication resulting from nutrient enrichment of coastal
water suspected to be caused by organic wastes from agricultural and aquacultural practices
(Sachoemar & Yanagi, 1999).
ECOSYSTEM FUNCTIONING
Primary productivity has been used as a biological parameter to monitor the overall re-
sponse of vegetation to a prevailing environment in terrestrial ecosystems (Khan, 1985). Changes
in the rate of primary production as an indication of trophic status of aquatic ecosystems have
been one of the major indicators of their health (Herrera-Silveira et al., 2002). Phytotreatment
of pond systems caused reductions of dissolved and particulate nitrogen and, to an extent, of
phosphorus. The flooded areas used for phytotreatment permit the growth of huge quantities of
macroalgae, which remove nitrogen and phosphorus from the effluent (Porrello et al., 2003a,
2003b). Bonsdorff et al. (2002) suggested several parameters—transparency, oxygen/hypoxia,
nutrients, primary production, chlorophyll a, algal mats, macroalgae, zoobenthos and fish—to
quantify eutrophication.
Control Measures
Phosphorus is a major nutrient in controlling the growth of algae. Phosphorus in Lake Erie
is often the limiting factor. Algae growth can be controlled by reducing input of any one of the
essential nutrients. Phosphorus is the nutrient over which one has the greatest control (Reutter,
1989). In freshwater lakes and rivers, phosphorus is a growth-limiting nutrient, because it
occurs in far lesser amount than the quantity required for optimum plant growth. If excessive
amounts of phosphorus and nitrogen are added to the water, algae and other aquatic plants can
EUTROPHICATION: AN ECOLOGICAL VISION 469
be produced in large quantities. Removal of bloomed algae in which phosphorus is bound and
of sediments before anoxic state at bottom may also be helpful in remediation of eutrophic
ecosystems.
BIOLOGICAL CONTROL
Partial recovery from an algal to a macrophyte-dominated state in a eutrophic freshwater
system requires managed phosphorus limitation and unmanaged macrophyte growth (Perkins
& Underwood, 2002). Aquatic macrophytes like Eichhornia crassipes and Salvinia auriculata
cause significant reduction of nitrogen and phosphorus compounds in the water. This informa-
tion was thought to be helpful in developing adequate management strategies for aquatic mac-
rophytes, intended to check the eutrophication process in Imboassica Lagoon, in Brazil, by
Petrucio and Esteves (2000). Some aquatic weeds, such as Typha, Phragmites, and Glyceria
spp., in ditches were expected to be useful in removing nutrients from the eutrophic water body
(Beltman et al., 1990). Wychera et al. (1990) studied macrophytes of the New Danube River
flowing through Vienna and suggested that the constant harvesting of macrophytes would be
necessary to manage the process of eutrophication if a power plant were built on its bank.
Potential removal of particulate matter and nitrogen through water hyacinth (Eicchornia
crassipes) roots was also reported by Billore et al. (1998), and removal of water hyacinth may
prove beneficial in controlling eutrophication. Alternatively, water hyacinth may be used in the
formation of compost. Some aquatic macrophytes are capable of purifying eutrophic lake wa-
ter. The water peanut, Alternanthera philoxeroides, improves the transparency of eutrophic
lake water (Wang et al., 1999).
Hydrodictyon reticulatum was reported to actively remove 67.3% nitrogen and phosphorus
in six days under different environmental conditions (Liu et al., 2004). The dissolved phospho-
rus can be removed in irrigation drainage water by planted floats. The floats are designed to
implement horizontally spreading water plants to the surface of irrigation drains, fields, or
treatment ponds in order to eliminate dissolved phosphorus and to allow harvest of the stand-
ing crop and therefore removal of the accumulated phosphorus. The results indicated that the
float technology could utilize creeping-stem water plants in order to remove soluble reactive
phosphorus from the water column (Wen & Recknagel, 2002). Seaweeds can remove up to
90% of the nutrient discharge from an intensive fish farm. Mass culture of commercially valu-
able seaweed species is likely to play an increasingly important role as a nutrient-removal
system to alleviate eutrophication problems due to fed aquaculture (Luning et al., 2002).
The potential of three estuarine macroalgae (Ulva rotundata, Enteromorpha intestinelis,
and Gracilaria gracilis) as biofilters for phosphate in effluents of a sea bass (Dicentrarchus
labrax) cultivation tank was reported by Martinez-Aragon et al. (2002). Abe et al. (2002) col-
lected the aerial macroalga Trentipohlia aurea from Japan, which was investigated in relation
to the removal characteristics of nitrate, nitrite, ammonium, and phosphate ions. The biomass
was recorded 1.5 times higher in medium with sufficient nitrogen and phosphorus source in
ordinary medium. In the experiment about 37% of nitrite and 32% nitrate removal was ob-
served. Thus T. aurea has the potential for use in the purification of wastewater.
Some phytoplanktivorous fish can be utilized for weed management and counteracting
eutrophication (Opuszynski & Shireman, 1995). Processing of nutrients in shallow habitats
removes phosphorus from water naturally, and periphyton influences phosphorus removal from
the water column in flowing waters and wetlands. Periphyton plays several roles in removing
phosphorus from the water column, including phosphorus uptake and deposition, filtering par-
ticulate phosphorus from the water, and attenuating flow, which decreases advective transport
of particulate and dissolved phosphorus from sediments (Dodds, 2003). Lake managers have
470 THE BOTANICAL REVIEW
opted to increase macrophyte abundance to improve water quality and transparency and thus to
restore eutrophic water to the oligotrophic stage (Lau & Lane, 2002b). In freshwater bodies
phytoremediation has been suggested to be effective in reducing the toxicity of water caused by
microorganisms releasing ammonia and sulphide while degrading protein released from the
food industry (Jones, 2001).
ROLE OF MICROORGANISMS
Several microorganisms are reported to be efficient scavengers of phosphates from sewage
sludge. Eight strains of a bacterium (Acinetobacter calcoaceticus) were found to remove substan-
tial amounts of phosphates from an acetate medium–based pilot plant (Lawson & Tonhazy, 1980).
Two varieties of A. calcoaceticus (var. lwoffi and var. anitratus) were found to be efficient phos-
phate-removing bacteria in acetate-enriched pilot plants (Florentz & Hartemann, 1984).
MECHANICAL CONTROL
In India about 50% of the phosphate present in sewage come from household detergents
(Rao, 1998). In the United States 20%–30% of the phosphate in sewage is contributed by
detergents (Penelope & Charles, 1992). Increased capacity and improved sewage treatment are
the most effective ways to reduce the phosphorus load. In the Great Lakes regions of the United
States and Canada a phosphorus-effluent target limitation of about 0.01 mg L–1
has been estab-
lished for municipal sewage-treatment plants. These plants discharge more than 1 million gal-
lons of sewage water per day. This target has been achieved by most of the municipal wastewater
treatment systems in both nations. Treatment plants in Ohio had been discharging an average
effluent concentration of 7 mg L–1
. The phosphate in these plants is precipitated out of sewage
before the release of treated water into lakes or rivers. Through a precipitation method, about
80%–90% or even more of the phosphate was being removed from sewage without much
increase in the cost (Bitton, 1999).
The average concentration of total phosphorus (inorganic and organic forms) in wastewa-
ter is within the range of 10–20 mg L–1
, much of which comes from phosphate builders in
detergents. Common forms of phosphorus in wastewater are orthophosphates (50%–70% of
phosphorus). Phosphates and phosphorus are tied to organic compounds. Orthophosphate
comprises approximately 90% of phosphorus in biologically treated effluents (Meganck &
Faup, 1988). Since phosphorus is mainly responsible for the eutrophication of surface waters,
it must be removed by wastewater treatment processes before the effluents are discharged
into surface waters. Several biological and chemical mechanisms are responsible for phos-
phorus removal in wastewater treatment plants (Arvin, 1985; Arvin & Kristensen, 1983).
These processes include chemical precipitation, phosphorus assimilation by microorganisms,
polyphosphate accumulation by microorganisms, and microorganism-mediated, enhanced
chemical precipitation. Sucrose tricarboxylic acid is obtained by reacting aqueous 5%–20%
sucrose with oxygen in the presence of a phosphorus-activated carbon catalyst at atmospheric
pressure, pH 5–9 (6–8), and high temperature. The product is converted to the sodium salt by
batch neutralization with 30% sodium hydroxide on gradual heating from room temperature
to 60–95 (70–80)° C over several hours. During the procedure the pH is maintained at 8 and
adjusted to 9 at the end of the reaction. The product has superior detergent properties with no
tendency to cause eutrophication of waterways (Leupold et al., 1990). The eutrophication
process may also be controlled temporarily by direct killing of aquatic plants. Copper sulfate
and sodium arsenate are employed for killing algae and rooted plants, respectively (Khitoliya,
2004).
EUTROPHICATION: AN ECOLOGICAL VISION 471
Eutrophication and persistent pollutants were believed to be the two main environmental
problems in European marine and freshwater ecosystems because they tend to interact with
each other (Skei et al., 2000). In fact, the co-occurrence of water pollutants and eutrophication
is the major problem in all developed and developing countries. Phosphorus loading to Lake
Erie has been reduced through the wastewater treatment plants and by limiting the amount of
phosphorus in laundry detergents. Phosphorus loadings to Lake Erie are approaching the an-
nual target load of 11,000 tons (the target load is specified in the Water Quality Agreements).
Continued emphasis on phosphorus reduction is needed to restore water quality and reduce
eutrophication. Eutrophication is thus a limiting factor in supply of clean water for drinking,
fishing, navigation, and so forth. Biggs (2000) suggested that managing nutrient supply could
reduce not only the magnitude of maximum biomass but also the frequency and duration of
benthic algal proliferation in streams. Reduction in phosphorus loading is an essential measure
for long-term eutrophication control in aquatic ecosystems (An & Kim, 2003).
Microorganisms, especially planktons, thrive well, combat the pollution load, and prolifer-
ate in polluted waters. There is every reason for concern over the alarming but gradual increase
in the pollution level: Although the waters revealed an appreciable quantity of planktonic cells,
immediate remediation is needed to have a cleaner environment throughout (Sivaswamy &
Prasad, 1990). The extent of dependence of the growth of aquatic flora upon the phosphorus
concentration in any eutrophic water body has led to the assumption that reduction in nutrient
loading would result in oligotrophy. However, it later became apparent from the complexities
encountered in certain enriched freshwater bodies that the problem would not be cured so
easily.
LEGISLATIVE MEASURES
To control eutrophic conditions in streams and lakes, laws restricting phosphate levels in
detergents were proposed and became law in some states in the United States. Phosphate is the
nutrient that limits plant growth in water bodies the world over, and detergents are the major
source of phosphates. The best option is to cut down the use of phosphates in detergents in an
effort to stop eutrophication. In the United States, all of the Great Lakes states have legisla-
tive controls limiting the phosphorus content of laundry detergents to 0.5 percent by weight.
Presently, Canada’s limit is 2.2 percent (Hartig, 1981). Hartig et al. (1990, 1991) proposed
various remedial action plans to restore the degraded areas of the Great Lakes in Ontario,
Canada.
A complete ban on phosphates in detergents would remove about 20%–30% of the phos-
phates in sewage. In a number of areas, either a ban on or a reduction in the amount of
phosphate allowed in detergents has been tried to reverse eutrophication in lakes. Detergent
phosphorus bans in Maryland and Michigan are reported to have significantly reduced phos-
phate loading to Chesapeake Bay and the Detroit River, respectively. By 1988 all of the states
with major watersheds bordering the Great Lakes had passed statutes limiting detergent phos-
phate to 0.5%, and Ontario had declared a limit of 2.2% (Penelope & Charles, 1992).
Ecological Vision
Until the early 1960s the surfactant present in synthetic detergents was alkylbenzene sul-
phonate. This showed remarkable resistance to biodegradation (the so-called hard detergents)
and has been replaced with a new surfactant called “linear alkyl sulphonate,” which is of com-
patible cost and cleaning potential but is not rapidly biodegradable. At present, one of the most
pressing problems is not the effect of the surfactant itself but the release of polyphosphate
472 THE BOTANICAL REVIEW
builders into natural waters. The extensive use of phosphate-based detergents and agricultural
fertilizers is one of the main causes of the worldwide eutrophication of rivers and lakes. To
ameliorate such problems, partial or total substitution of phosphates in laundry detergents by
synthetic, non-phosphorus-containing complexing agents is practiced in several countries.
To date, a complete replacement has not been found, but, in the Scandinavian countries
particularly, formulations of household detergent powders are beginning to appear with appre-
ciable portions of the phosphate replaced with nitrilotriacetic acid, which is a better sequester-
ing agent than tripolyphosphate but has none of the other properties exhibited by the phosphate.
The use of nitrilotriacetic acid has, however, been found to be harmful for health (Rao, 1998).
Some of the hydroxypolycarboxylic acids not containing nitrogen are also being considered.
Testing methods were developed, and it was proved that linear alkyl benzene is biodegrad-
able. Germany introduced legislation prohibiting the discharge of non–biologically degrad-
able material into sewer systems. In the United States, detergent manufacturers agreed
voluntarily to switch over from propylene tetramer benzene to linear alkyl benzene by June
1965. In the United Kingdom, a similar type of “gentlemen’s agreement” was entered into
(Campbell, 1998).
Muller and Helsel (1999) suggested that, in order to reduce nutrient loads on lakes to within
the limits permitted by the Organisation for Economic Co-operation and Development, not
only will all sewage inputs need to be prevented, and non-phosphate detergents used, but losses
from agricultural land must be reduced. Some scientists have categorized trophic status accord-
ing to phosphorus concentration. Lakes with phosphorus concentrations below 0.01 mg L–1
are
indicative of mesotrophic lakes, and eutrophic lakes have phosphorus concentrations exceed-
ing 0.02 mg L–1
(Muller & Helsel, 1999). No rationale or state criteria have been established for
concentrations of phosphorus compounds in water. However, to control eutrophication, the
U.S. Environmental Protection Agency makes the following recommendations: Total phos-
phate (as phosphorus) should not exceed 0.05 mg L–1
in a stream at the point at which it enters
a lake or reservoir and should not exceed 0.1 mg L–1
in streams that do not discharge directly
into lakes or reservoirs (Muller & Helsel, 1999).
Phosphate levels greater than 1.0 mg L–1
may interfere with coagulation in water treatment
plants. As a result, organic particles that harbor microorganisms may not be completely re-
moved before distribution. Eutrophic growth of aquatic plants seems to continue. Removal of
detergent phosphates, by itself, will not usually accomplish such a large reduction because
other inputs, such as runoff from agricultural lands, are much greater sources of phosphates.
Those countries whose economies are based on agriculture have to take adequate measures in
controlling the use of fertilizers, specifically phosphorus. Research and proper advice to farm-
ers on the optimum requirement of the nutrients needs to be emphasized. Urban waste and
sewage must be treated to reduce phosphorus before it is discharged into a water body.
Discussion
It is evident from the present review of literature that eutrophication studies have focused
mainly on lakes, including some well-known salt and freshwater lakes in the United States,
Italy, the Netherlands, Denmark, Greece, Uruguay, Russia, China, and India. The problem of
eutrophication has increased during the past 50 years. Population growth, coupled with eco-
nomic development and changes in life style, during this period has added to the problem.
Johnson et al. (2001) speculated that population increase and rapid economic development in
next 25 years will substantially increase the demand for freshwater resources. The availability
of freshwater for human consumption will be one of the great issues of the twenty-first century.
Eutrophication has become a major cause for concern in the developing world, including South
EUTROPHICATION: AN ECOLOGICAL VISION 473
American, African, and South Asian countries. Scientific interest in eutrophication has consis-
tently been significant during the last 25 years. Emphasis on this area of research has risen
suddenly in recent years. Brönmark and Hansson (2002) predicted that eutrophication, acidifi-
cation, and contamination by toxic substances are likely to increase as threats to freshwater
resources and ecosystems. Vörösmarty et al. (2000) speculated that population growth and the
associated increase in demand for water would greatly outweigh climate change in determining
the status of global water systems by 2025.
The problem of eutrophication, in addition to being dependent upon nutrient inputs, is
greatly influenced by number of environmental factors. The growth of algae and its diversity
are dependent upon the quality and quantity of light, temperature inversion, and geographical
location of a water body. Variation in eutrophication level is directly dependent upon the pat-
tern of phosphorus cycling. The phosphorus cycling varies in the monomictic, dimictic, and
polymictic lakes. Temperature limits the rate of cell division in all organisms. The ecological
amplitude of temperature varies from organism to organism. Temperatures below the lower or
above higher tolerable limit retard cell division, presumably by affecting enzyme structure
(Giese, 1979). Ghosh et al. (1995) noticed a temperature-related growth of duckweed. The
growth rate of duckweed decreased when the temperature was brought down below 10° C. The
freezing cold temperature completely inhibited the growth rate of duckweed. Significantly higher
yields and numbers of fronds of Spirodela polyrrhiza Dh116 and S. punctata Dh122 were
observed at 33° C and 25° C, respectively (Aziz & Mubina, 1999). Several plant processes,
including enzyme reactions, metabolisms, and carbon dioxide fixation are temperature depen-
dent (Giese, 1979; Teshow, 1970). The temperature also affects the pH and viscosity of water
(Garg, 1998; Teshow, 1970). An acidic pH accelerates the absorption of phosphates (Devlin &
Witham, 1986). The death and decay of rapidly growing aquatic plants increases the turbidity
of water and reduces the dissolved oxygen (Rao, 1998).
The growth of aquatic flora is promoted when the soluble inorganic form of phosphorus is
available to the plant. The organic phosphorus bound into sediment is released under anoxic
conditions. It is again made available to the upper layer of water body when temperature inver-
sion results in the circulation of water. The water-mixing period in shallower tropical lakes may
be consistently longer in a year. Shen (2002) studied the impact of limiting factors on the
eutrophication of the river networks in Zhejiang, China and determined the effects of light
intensity, temperature, and nutrients (nitrogen and phosphorus) on algal growth. The amount of
algae increased with an increase in light intensity and temperature. The illuminance of 4000
lux and 30° C temperature were the most favorable conditions promoting algal growth in
eutrophic water bodies. The effect of temperature was more prominent than the impact of
light intensity. It is evident from this review that eutrophication induced significant change in
the diversity of phytoplankton and increased primary productivity. The change in diversity
and production of autotrophs directly affect the aquatic organisms of higher trophic levels.
Changes in the rate of primary production indicated the trophic status of aquatic ecosystems
and their health (Herrera-Silveira et al., 2002). Changes in biodiversity have directly affected
the primary productivity (Lévêque, 2001), detritus processing (Jonsson & Malmqvist, 2000),
and nutrient transport at the water-sediment interface (Mermillod-Blondin et al., 2002; Palmer
et al., 1997). Further loss of species in higher trophic levels may have strong repercussions
down the food chain (Brönmark et al., 1997; Carpenter, 1988).
Consistent change in the diversity of organisms modifies the aquatic environment at a faster
rate. Autogenic succession of eutrophic water bodies modifies their own environment, from an
inorganic rich state to an organic rich state. leading to change in the diversity of the trophic
structure. In eutrophic water bodies, early onset of succession consistently reduced the size and
474 THE BOTANICAL REVIEW
depth of the water body. The shallow eutrophic water bodies in densely populated areas of
human settlement are under the direct threat of reducing their size and water-recharging capaci-
ties. Like other organisms, humankind also preferred to settle beside freshwater bodies (lentic
or lotic). The problem of eutrophication has increased greatly with population growth, exces-
sive use of fertilizers, and increase in industrialization. It is now evident that the water bodies
of the highly populated countries like China, India, Bangladesh, Pakistan, and Indonesia, the
industrialized countries of Europe, and the Great Lakes region of the United States and Canada
are under the direct threat of eutrophication. Floral and faunal diversity is threatened in coastal
areas that receive direct input of nutrients from some of the major rivers, like the Amazon, the
Nile, the Ganges, the Mississippi, the Brahamputra, and the Thames.
In the review several aquatic species have been suggested as indicators of eutrophication.
Some aquatic plants accumulate nutrients in higher concentration. Consistent removal of the
accumulators soon after they bloom may reduce the phosphorus level in the water bodies. As
suggested in the discussion of control measures, biological measures are usually effective in
smaller, shallow, and lentic water bodies. The mechanical control of phosphorus input through
the sewage treatment plants and an international understanding as well as awareness in reduc-
ing the use of phosphorus builders in detergents appear to be more effective ways to save water.
We suggest a more coordinated scheme to assess and preserve water bodies for our own needs
and for those of future generations.
Conclusion
Water is an important resource of prime necessity in life-supporting systems. Rapid eutrophi-
cation in the past 25 years has led to significant changes in water quality. The eutrophication
results in physical, chemical, biological, and ecological changes in water bodies. Studies on
eutrophication have revealed that the nutrient inputs into shallower and warmer parts of lakes
are more severely altered (Reutter, 1989). Enrichment of nutrients in a water body accelerates
its aging process and leads to faster succession. About 400 g of phosphate has been reported to
promote an algal bloom to the extent of 350 tons (Sharma, 1998). The literature review re-
vealed that all saltwater and freshwater lakes in densely populated areas are under the direct
threat of eutrophication. In one of the European lakes, about 55% of the phosphorus came from
metabolic sources and 45% from detergents and cleaning products until 1960 (Barbieri &
Simona, 2001). The world population since then has increased greatly. In Uruguay the use of
phosphorus-based fertilizers has shown an oscillatory pattern of increase from 1959 to 1985
and stability from 1985 to 1990, but detergents were reported to contribute 58% of the daily
phosphorus load (Sommaruga et al., 1995). It has been established that detergents, domestic
sewage, and fertilizers are the three major humanmade sources of nutrient enrichment in and
eutrophication of natural water bodies.
Water bodies located near large cities are likely to receive more phosphorus from domestic
effluents containing detergents. However, urban water bodies also receive major quantities of
phosphorus from fertilizers and other agriculture-related activities. Eutrophication of smaller
water bodies reduce the water-recharging capacity in these areas, so groundwater is likely to
become depleted partly due to eutrophication and partly due to exploitation through pumping.
The review shows that the emphasis in eutrophication studies has been in the areas of estimat-
ing the physicochemical properties of water, the diversity of aquatic flora and fauna, the sources
of phosphorus, and the cycling of phosphorus in some of the world’s major water bodies.
Information on the overall outcome of eutrophication in terms of reduction in size and depth of
water bodies is lacking. There is no information on whether eutrophication leads to changes in
EUTROPHICATION: AN ECOLOGICAL VISION 475
the water body that directly affect the transpiration rate. The change (if any) in the regional and
global pattern of precipitation has not been determined either. Some studies in these areas
would be of special interest.
Some effective control measures, including awareness programs pertaining to the present
threat to water resources on the blue planet need to be implemented. As evident from the
proposed phosphorus cycle (Fig. 2), the phosphorus input from one of the two sources—
erosion of phosphate rocks (a natural source) and anthropogenic sources such as detergents
and fertilizers—needs to be checked. The main emphasis needs to be on controlling excessive
phosphorus inputs from the anthropogenic source. A check on the excessive erosion of phos-
phate rocks, probably due to deforestation, is also required. We hereby propose that biological
control through phytoremediation, together with mechanical removal of sediments from the
water body, would be an effective control measure. The depletion of the water resource may be
checked if efforts are made at international and local government levels to adopt legislative
measures and develop an alternative phosphorus-free detergent builder. Awareness and educa-
tional programs at government and nongovernmental organization levels would be much more
effective than mere legislative measures.
Acknowledgments
We thank the directors of the Indian Agricultural Research Institute, New Delhi and of the
National Botanical Research Institute, Lucknow for providing library facilities. We are also
thankful to the chairman of the Department of Botany, the director of the Computer Center, and
the librarian of the Maulana Azad Library at Aligarh Muslim University, Aligarh, for providing
necessary facilities for the literature survey. The University JRF to Abid Ali Ansari is highly
acknowledged.
Literature Cited
Abe, K., A. Imamaki & M. Hirano. 2002. Removal of nitrate, nitrite, ammonium and phosphate ions
from water by the aerial microalga Trentepohilia aurea. Journal of Applied Phycology 14: 129–134.
Adoni, A. D. & M. Yadav. 1985. Chemical and productional characteristics of Potamogelon pectinutus
(Linn.) and Hydrilla verticillata (Royle) in a eutrophic lake. Pp. 96–105 in A. D. Adoni (ed.), Pro-
ceedings of the National Symposium on Pure and Applied Limnology. Bulletin of Botanical Society,
Univ. of Sagar.
Ambasht, R. S. & P. K. Ambasht. 1992. Environment and Pollution. Student Friends & Co. Publishers,
Varanasi.
An, K. G. & D. S. Kim. 2003. Response of reservoir water quality to nutrient inputs from streams and in-
lake fishfarms. Water, Air and Soil Pollution 149: 27–49.
Ansari, A. A. 2005. Studies on the role of selected household detergents in the eutrophication of freshwa-
ter ecosystem. Ph.D. diss., Aligarh Muslim Univ.
——— & F. A. Khan. 2002. Nutritional status and quality of water of a waste water pond in Aligarh
showing blooms of Spirodela polyrrhiza (L.) Shleid. Journal of Ecophysiology and Occupational
Health 2: 185–189.
Arvin, E. 1985. Observations supporting phosphorus removal by biologically mediated chemical precipi-
tation: A review. Water Sci. Technol. 15: 43–63.
——— & G. H. Kristensen. 1983. Phosphate precipitation in biofilms and flocs. Water Sci. Technol. 15:
65–85.
Asthana, D. K. & M. Asthana. 1998. Environment: Problems and solutions. S. Chand & Co., Ram
Nagar, New Delhi.
Aziz, A. & N. K. Mobina. 1999. Growth and morphology of S. polyrrhiza and S. punctata as affected by
some environmental factors. Bangladesh Journal of Botany 28: 133–138.
476 THE BOTANICAL REVIEW
Barbieri, A. & M. Simona. 2001. Trophic evolution of Lake Lugano related to external load reduction:
Changes in phosphorus and nitrogen as well as oxygen balance and biological parameters. Lakes &
Reservoirs: Research and Management 6: 37–47.
Beeby, A. 1995. Applying ecology. Chapman & Hall, London.
Beeton, A. M. 2002. Large freshwater lakes: Present states, trends and future. Environmental Conserva-
tion 29: 21–38.
Beltman, B., P. R. F. Barrett, M. P. Greaves, K. J. Murphy, A. H. Pieterse, P. M. Wade & M. Wallsten.
1990. Aquatic macrophytes: A useful tool against eutrophication. Pp. 35–38 in Proceedings of the
8th International Symposium on Aquatic Weeds, Uppsala, Sweden, 13–17 August 1990.
Benndorf, J. & M. Henning. 1989. Daphnia and toxic worms of Microcystis aeruginosa in Bentzen
reservoir (GDR). Int. Rev. Ges. Hydrobiol. 74: 233–248.
Biernacki, M., J. Lovett-Doust & L. Lovett-Doust. 1996. Vallisnaria americana as a biomonitors of
aquatic ecosystems: Leaf-to-root surface area ratios and organic contamination in the Huron-Erie
Corridor. Journal of Great Lakes Research 22: 289–303.
Biggs, B. J. F. 2000. Eutrophication of streams and rivers: Dissolved nutrient-chlorophyll relationships
for benthic algae. Journal of the North American Benthological Society 19: 17–31.
Billore, S. K., R. Bharadia & A. Kumar. 1998. Potential removal of particulate matter and nitrogen
through roots of water hyacinth in a tropical natural wetland. Current Science 74: 154–156.
Bitton, G. 1999. Wastewater microbiology. John Wiley & Sons, New York.
Bonsdorff, E., C. Ronnberg, K. Aarnio, E. Orive, M. Elliott & V. N. de Jonge. 2002. Some ecological
properties in relation to eutrophication in the Baltic Sea. Hydrobiologia 475–476: 371–377.
Brönmark, C. & L. A. Hansson. 2002. Environmental issues in lakes and ponds: Current state and
perspectives. Environmental Conservation 29: 290–306.
———, J. Dahl & L. Greenberg. 1997. Complex trophic interactions in benthic food chains. Pp. 55–88
in B. Streit, T. Städler & C. Lively (eds.), Ecology and evolution of freshwater animals. Brikhäuser
Publishers, Basel.
Campbell, A. 1998. Development of the detergent industry. <http://www.chemistry.co.nz/deterghistory.htm>
Campus-Ortega, H. R. 1998. Eutrophication and macronutrients in lentic ecosystems. IDESIA 15: 95–106.
Carpenter, S. R. ed. 1988. Complex interactions in lake communities. Springer-Verlag, New York.
Chandrashekar, J. S., K. Lenin Babu & R. K. Somashekar. 2003. Impact of urbanization on Bellandur
Lake, Bangalore: A case study. J. Env. Biol. 24: 223–227.
Chapman, A. S., I. D. L. Forster, J. A. Lees, R. J. Hodgkinson & R. H. Jackson. 2003. Sediments and
phosphorus delivery from field to river via land drains in England and Wales: A risk assessment
using field and national databases. Soil Use and Management 19: 347–355.
Chattopadhyay, P. & D. P. Kushari. 2003. Study of some physico-chemical characteristics of 5 water
bodies enriched with runoff from different sources in a Latiniti Zone of West Bengal. Indian Journal
of Environmental Protection 23: 123–1238.
Colijn, F., K. J. Hesse, N. Ladwig, U. Tillmann, O. Vadstein & Y. Olsen. 2002. Effects of the large-
scale uncontrolled fertilization process along the continental coastal North Sea. Hydrobiologia 484:
133–148.
Colinvaux, P. 1993. Ecology 2. John Wiley and Sons, New York.
Coveney, M. F., D. L. Stites, E. F. Lowe, L. E. Battoe & R. Conrow. 2002. Nutrient removal from
eutrophic lake water by wetland filtration. Ecological Engineering 19, 141–159.
Deegan, L. A., A. Wright, S. G. Ayvazian, J. T. Finn, H. Golden, R. R. Merson & J. Harrison. 2002.
Nitrogen loading alters seagrass ecosystem structure and support of higher tropic levels. Aquatic
Conservation 12: 193–212.
Denys, L. 2003. Environmental changes in man-made coastal dune pools since 1850 as indicated by
sedimentary and epiphytic diatom assemblages (Belgium). Aquatic Conservation 13: 191–211.
Devlin, R. M. & F. H. Witham. 1986. Plant physiology. Ed. 4. CBS Publishers & Distribution, New
Delhi.
Dodds, W. K. 2003. The role of periphyton in phosphorus retention in shallow freshwater aquatic sys-
tems. Journal of Phycology 39: 840–849.
Emery, S. L. & J. A. Perry. 1996. Decompsition rates and phosphorus concentrations of purple loose-
strife (Lythrim salicaria) and cattail (Typha spp.) in fourteen Minnesota wetlands. Hydrobiologia
323: 129–138.
EUTROPHICATION: AN ECOLOGICAL VISION 477
Florentz, M. & P. Hartemann. 1984. Screening for phosphate accumulating bacteria isolated from acti-
vated sludge. Environ. Technol. Lett. 5: 457–463.
Foy, R. H., S. D. Lennox & C. E. Gibson. 2003. Changing perspectives on the importance of urban
phosphorus inputs as the cause of nutrient enrichment in Lough Neagh. Science of the Total Envi-
ronment 310: 87–99.
Francis, K., P. Shanmughavel, M. Anbazhangan & T. Parimelazhagan. 1997. Investigation of pollu-
tion and its influence on the biomass of a monsoon fed fresh water pond. Pollution Research 16:
133–137.
Garg, J., H. K. Garg & J. Garg. 2002. Nutrient loading and its consequences in a lake ecosystem.
Tropical Ecology 43: 355–358.
———, ——— & ———. 2003. Algae as indicators of eutrophication: A microcosmal approach. Envi-
ronment and Ecology 21: 313–316.
Garg, S. K. 1998. Sewage disposal and air pollution engineering: Environmental engineering. Ed. 11.
Khanna Publications, Delhi.
George, D. G. & S. I. Heaney. 1978. Factors influencing the spatial distribution of phytoplankton in
small productive lake. Journal of Ecology 66: 133–155.
Ghosh, C., J. Frijns, G. Ghosh & G. Lettinga. 1995. Water recycling through duckweed (Lemna minor)
culture during post-summer months in European Climate. Indian Journal of Environmental Protec-
tion 15: 677–684.
Gibson, C. E., N. J. Anderson, Q. Zhou, M. Allen & P. G. Appleby. 2003. Changes in sediment and
diatom deposition in Lower Lough Erne c. 1920–90. Biology and Environment 103B: 31–38.
Giese, A. C. 1979. Cell physiology. Ed. 5. Toppan Co., Tokyo.
Gopal, B., R. E. Turner, R. G. Wetzel & D. F. Whigham. 1982. Wetlands: Ecology and management.
National Institute of Ecology and International Scientific Publications, New Delhi.
Gulati, R. D. & E. van Donk. 2002. Lakes in the Netherlands, their origin, eutropication and restoration:
State of the art review. Hydrobiologia 478: 73–106.
Gurbuz, H. & E. Kivrak. 2002. Use of epilithic diatoms to evaluate water quality in the Karasu River of
Turkey. J. Env. Biol. 23: 239–246.
Haberman, J., A. Jaani, A. Kangur, K. Kangur, R. Laugaste, A. Milius, H. Maemets & E. Pihu.
2000. Lake Peipsi and its ecosystem. Proceedings of the Estonian Academy of Sciences Biology
Ecology 49: 3–18.
Hammer, M. J. 1986. Water and wastewater technology. John Wiley & Sons, New York.
Hartig, J. H. 1981. Preliminary effects of the detergent phosphorus ban in Michigan 1981. Publication
No. 3833–9900. Michigan Department of Natural Resources, Lansing.
———, L. Lovett-Doust & P. Seidl. 1990. Successes and challenges in developing and implementing
remedial action plans to restore degraded areas of the Great Lakes. Pp. 269–278 in J. E. Fitzgibbon
(ed.), International and transboundary water resources issues. TPS-90-1. American Water Resources
Association, Bethesda, MD.
———, ———, M. Zarull, S. Leppard, L. New, G. Daniel, T. Coape-Arnold, S. Skavorneck & T. Eder.
1991. Great Lakes remedial action plans: Progress and prospects. Journal of International Environ-
ment Affairs 3: 91–107.
He, F., Z. B. Wu & D. R. Qiu. 2002. Allelopathic effects between aquatic plant (Potamogeton crispus) and
algae (Scenedesmus obliquus) in enclosures at Donghu Lake. Acta Hydrobiologica Sinica 26: 421–424.
Herrera-Silveira, J. A., I. Medina-Gomez, R. Colli, E. Orive, M. Elliott & V. N. de Jonge. 2002.
Trophic status based on nutrient concentration scales and primary producers community of tropical
coastal lagoons influenced by groundwater discharges. Hydrobiologia 475–476: 91–98.
Hinesly, R. L. & T. D. Jones. 1990. Phosphorus in waters from sewage sludge amended lysimeters.
Environmental Pollution 65: 293–309.
Howarth, R. W., D. P. Swaney, T. J. Butler & R. Marino. 2000. Climatic control on eutrophication of
the Hudson River estuary. Ecosystems 3: 210–215.
Imteaz, M. A., T. Asaeda & D. A. Lockington. 2003. Modelling the effects of inflow parameters on lake
water quality. Environmental Modeling and Assessment 8: 63–70.
Janse, J. H. & P. J. T. M. Van Puijenbroek. 1998. Effects of eutrophication in drainage ditches. Envi-
ronmental Pollution 102: 547–552.
478 THE BOTANICAL REVIEW
Jeppesen, E., M. Søndergaard, B. Kronvang, J. P. Jenson, L. M. Svendsen & T. L. Lauridsen. 1999.
Lake and catchment management in Denmark. Hydrobiologia 395–396: 419–432.
Jha, P. & S. Barat. 2003. Hydrobiological studies of Lake Mirik in Darjeeling Himalayas. J. Env. Biol.
24: 339–344.
Johnson, N., C. Revenga & J. Echeverria. 2001. Managing water for people and nature. Science 292:
1071–1072.
Jones, J. G. 2001. Freshwater ecosystems structure and response. Ecotoxicology and Environmental Safety
50: 1090–2414.
Jonsson, M. & B. Malmqvist. 2000. Ecosystem process rate increases with animal species richness:
Evidence from leaf-eating, aquatic insects. Oikos 89: 519–523.
Juttner, I., S. Sharma, B. M. Dahal, S. J. Ormerod, P. J. Chimonides & E. J. Cox. 2003. Diatoms as
indicators of stream quality in the Kathmandu Valley and Middle Hills of Nepal and India. Freshwa-
ter Biology 48: 2065–2084.
Kant, S. & A. K. Raina. 1990. Limnological studies of two ponds in Jammu, II. Physico-chemical pa-
rameters. J. Env. Biol. 11: 137–144.
Kaul, V. 1970. Production and ecology of some macrophytes of Kashmir lakes. Hydrobiologia 12: 63–69.
———, C. L. Tristal & J. K. Handoo. 1978. Distribution and production of macrophytes in some
aquatic bodies of Kashmir. Pp. 313–334 in J. S. Singh & B. Gopal (eds.), Glimpses of Ecology.
Prakash Publishers, Jaipur.
Kelly, M. G. & S. Wilson. 2004. Effect of phosphorus stripping on water chemistry and diatom ecology
in an eastern lowland river. Water Research 38: 1559–1567.
Khan, F. A. 1985. Studies on primary productivity in relation to air pollution emitted by a coal-fired
power plant. Ph.D. diss., Aligarh Muslim Univ.
Khitoliya, R. K. 2004. Environmental pollution: Management & control for sustainable development.
S. Chand, New Delhi.
Kleeberg, A. & M. Heidenreich. 2004. Release of nitrogen and phosphorus from macrophyte stands of
summer dried out sediments of a eutrophic reservoir. Archiv für Hydrobiologie 159: 115–136.
Koussouris, T. S., A. C. Diapoulis & I. T. Bertahas. 1991. Evaluation trophic status and restoration
procedures of a polluted lake, Lake Kastoria, Greece. Geojournal 23: 153–161.
Kufel, L. 2001. Uncoupling of chlorophyll and nutrients in lakes: Possible reasons, expected conse-
quences. Hydrobiologia 443: 59–67.
Kulaev, I. S. 1979. The biochemistry of inorganic polyphosphates. John Wiley & Sons, Wiley-Interscience
Publication, New York.
Kulshreshtha, S. K., R. Saxena, M. P. George, M. Srivastava & A. Tiwari. 1989. Phytoplankton of
eutrophic Mansarovar reservoir of Bhopal. International Journal of Ecology & Environmental Sci-
ence 15: 205–215.
Lalitha, S., R. Kasthuri, D. Kalaivani, Banumathi & L. Akilandishwari. 2003. Impact of sewage
disposal on quality of water near Chinthamani, Tiruchirapalli. Indian Journal of Environmental
Protection 23: 1268–1271.
Lande, A. 1973. Byglandsfjorden: Primary production and other limnological features in an oligotrophic
Norwegian lake. Hydrobiologia 41: 335–344.
Lau, S. S. S. & S. N. Lane. 2002a. Biological and chemical factors influencing shallow lake eutrophica-
tion: A long-term study. Science of the Total Environment 3: 167–181.
——— & ———. 2002b. Nutrient and grazing factors in relation to phytoplankton level in a eutrophic
shallow lake: The effect of low macrophyte abundance. Water Research Oxford 36: 3593–3601.
Lawson, E. N. & N. E. Tonhazy. 1980. Changes in morphology and phosphate uptake patterns of
Acinetobacter calcoaceticus strains. Water SA 6: 105–112.
Leupold, E. I., K. H. Schonwalder, L. W. Fritsche, M. Schlingmann, A. H. Linkies, W. Gohla & F. J.
Dany. 1990. Method for making a mixture of sucrose oxidation products. German Federal Republic
Patent. DE 3900677, 5 pp; A12.01.89-DE-3900677, P 19.07.90; also: AU 90-47824, CA2007550,
EP378127B, JP-A 02-233691, ZA 90-194.
Lévêque, C. 2001. Lake and pond ecosystems. Encyclopedia of Biodiversity 3: 633–644.
Likens, G. E., F. H. Bormann, R. S. Pierce, J. S. Eaton & N. M. Johnson. 1977. Biogeochemistry of a
forested ecosystem. Springer-Verlag, New York.
EUTROPHICATION: AN ECOLOGICAL VISION 479
Liu, C., G. Wu, D. Yu, D. Wang & S. Xia. 2004. Seasonal changes in height, biomass and biomass
allocation of two exotic aquatic plants in a shallow eutrophic lake. Journal of Freshwater Ecology
19: 41–45.
Lorenz, C. M. 2003. Bioindicators for ecosystem management, with special reference to freshwater sys-
tems. Pp. 123–152 in B. A. Markert, A. M. Breure & H. G. Zechmeister (eds.), Bioindicators and
biomonitors: Principles, concepts and applications. Elsevier, Amsterdam.
Lovett-Doust, L., J. Lovett-Doust & M. Biernacki. 1994. American wildcelery, Vallisneria americana,
as a biomonitor of organic contaminants in aquatic ecosystems. Journal of Great Lakes Research 20:
333–354.
Luning, K., S. J. Pang, J. M. Fernandez-Sevilla, M. Garcia-Guerrero, E. Molina-Grima, F. G. Acien-
Fernandez, J. A. Sanchez-Perez & B. A. Whitton. 2002. Mass cultivation of seaweeds: Current
aspects and approaches. Journal of Applied Phycology 15: 115–119.
Martinez-Aragon, J. F., I. Hernandez, J. L. Perez-Liorens, R. Vazquez & J. J. Vergara. 2002.
Biofiltering efficiency in removal of dissolved nutrients by three species of estuarine macroalgae
cultivated with sea bass (Dicentrarchus labrax) waste waters, 1. Phosphate. Journal of Applied
Phycology 14: 365–374.
Meganck, M. J. J. & G. M. Faup. 1988. Enhanced biological phosphorus removal of waste waters.
Biotreatment Systems 3: 111–203,
Mengel, K. & E. A. Kirkby. 1996. Principles of plant nutrition. Ed 4. Panima Publishing Corp., New
Delhi.
Mermillod-Blondin, F., M. Gerino, M. Creuzé des Châtelliers & V. Degrange. 2002. Functional di-
versity among 3 detritivorous hyporheic invertebrates: An experimental study in microcosms. Jour-
nal of the North American Benthological Society 21: 132–149.
Mickel, A. M. & R. G. Wetzel. 1978. Effectiveness of submerged anglosperm-epiphyte complexes on
exchange of nutrients of organic carbon in littoral systems, I. Inorganic nutrients. Aquatic Botany:
303–316.
Misra, S. D., S. C. Bhargava & O. P. Bohra. 1975. Diurnal variation in physico-chemical factors at
Padmasagar reservoir during pre-monsoon period of the year 1974. Geobios 2: 32–33.
Morrison, R. T. & R. N. Boyd. 2000. Organic chemistry. Prentice Hall of India, New Delhi.
Moss, B. 1988. Ecology of fresh waters: Man and medium. Ed 2. Blackwell, Oxford.
———, J. Stansfield & K. Irvine, 1991. Development of daphnid communities in diatom- and cyanophyte-
dominated lakes and their relevance to lake restoration by biomanipulation. J. Appl. Ecol. 28: 586–602.
Muller, D. K. & D. R. Helsel. 1999. Nutrients in the nation’s water—Too much of good thing? Circular
1136. U.S. Geological Survey, Denver.
Murphy, S. 2002. General information on phosphorus. City of Boulder / USGS Water Quality Monitor-
ing. <http://bcn.boulder.co.us/basin/data/NUTRIENTS/info/TP.html>.
Nielsen, S. L., K. Sand-Jensen, J. Borum & O. Geertz-Hansen. 2002. Phytoplankton, nutrients and
transparency in Danish coastal waters. Estuaries 25: 930–937.
Ni, L.-Y., D. M. Wang & P. Xie. 1999. Experimental studies on the growth of Potamogeton maackianus
A. under low-light stress in highly eutrophic water. Proceedings of the 9th International Symposium
on River and Lake Environments, Hungshan, China, October 9–13, 1998. Acta Hydrobiologica
Sinica 23: 53–58.
Notestein, S. K., T. K. Frazer, M. V. Hoyer & D. E. Canfield Jr. 2003. Nutrient limitation of periphyton
in a spring-fed, coastal stream in Florida, USA. Journal of Aquatic Plant Management 41: 57–60.
Opuszynski, K. & J. V. Shireman. 1995. Herbivorous fishes: Culture and use for weed management.
CRC Press, Boca Raton, FL.
Palmer, M., A. P. Covich, B. J. Finlay, J. Gibert, K. D. Hyde, R. K. Johnson, T. Kairesalo, S. Lake,
C. R. Lovell, R. J. Naiman, C. Ricci, F. Sabater & D. Strayer. 1997. Biodiversity and ecosystem
processes in freshwater sediments. Ambio 26: 571–577.
Patrick, R. 1950. Biological measure of stream conditions. Sew. Industr. Wastes 22: 926–938.
Pelechaty, M., D. Machowiak, A. Kostrzewski & R. Siwecki. 1997. The diversity and quality of the
dominant types of habitats of the Jaroslawieckie Lake due to perennial changes of micro- and
macrophytes. Morena-Prau-Wielkopolskiego-Parku-Narodowego 5: 53–59.
Penelope, R. V. & R. V. Charles. 1992. Water resources and the quality of natural waters. Jones and
Bartbett Publishers, London.
480 THE BOTANICAL REVIEW
Perkins, R. G. & G. J. C. Underwood. 2002. Partial recovery of eutrophic reservoir through managed
phosphorus limitation and unmanaged macrophyte growth. Hydrobiologia 481: 74–87.
Petrucio, M. M. & F. A. Esteves. 2000. Uptake rates of nitrogen and phosphorus in the water by Eichhornia
crassipes and Salvinia auriculata. Revista Brasileira de Biologia 60: 229–236.
Porrello, S., M. Lenzi, E. Persia, P. Tomassetti & M. G. Finoia. 2003a. Reduction of aquaculture
wastewater eutrophication by phytotreatment ponds system, I. Dissolved and particulate nitrogen
and phosphorus. Aquaculture 219: 515–529.
———, ———, P. Tomassetti, E. Persia, M. G. Finoia & I. Mercatali. 2003b. Reduction of aquacul-
ture wastewater eutrophication by phytotreatment ponds system, II. Nitrogen and phosphorus con-
tent in macroalgae and sediment. Aquaculture 219: 531–544.
Potter, K. & Lovett-Doust, L. 2001. Site parameters and the efficacy of Vallisneria americana as a
biomonitor of stressed aquatic ecosystems: Implications for widespread biomonitoring. Ecol. Mon.
11: 215–225.
Prego, R., E. Orive, M. Elliot & V. N. de Jonge. 2002. Nitrogen fluxes and budget seasonality in the Ria
Vigo (NW Iberian Peninsula). Hydrobiologia 475–476: 161–171.
Quiros, R., A. M. Rennella, M. B. Boveri, J. J. Rosso & A. Sosnovsky. 2002. Factors affecting the
structure and functioning of shallow Pampean lakes. Ecologia Austral 12: 175–185.
Rabalais, N. N., J. Galloway & E. Cowling. 2002. Nitrogen in aquatic ecosystems. 2nd International
Nitrogen Conference on Optimizing Nitrogen Management in Food and Energy Productions, and
Environmental Change, Potomac, Maryland, USA, October 2001. Ambio 31: 102–112.
Rao, C. S. 1998. Environmental pollution control engineering. New Age International, New Delhi.
Reutter, J. M. 1989. Lake Erie: Phosphorus and eutrophication. Fact Sheet 015. Ohio Sea Grant College
Program, Columbus.
Reynolds, C. S. 1984. The ecology of freshwater phytoplankton. Cambridge Univ. Press, Cambridge.
Rogers, K. M. 2003. Stable carbon and nitrogen isotope signatures indicate recovery of marine biota
from sewage pollution at Moa Point, New Zealand. Marine Pollution Bulletin 46: 821–827.
Ruley, J. E. & K. A. Rusch. 2002. An assessment of long-term post-restoration water quality trends in a
shallow subtropical, urban hypereutrophic lake. Ecological Engineering 19: 265–280.
Saad, M. A. H. 1973. Some limnological characteristics of the Nozh a Hydradrome, near Alexandria,
Egypt. Hydrobiologia 41: 477–500.
Sachoemar, S. & T. Yanagi. 1999. Seasonal variation in water quality at the northern coast of Karawang-
West Java, Indonesia. Mer (Tokyo) 37: 91–101.
Saxena, P. K., S. Jabeen & R. Sahai. 1988. Variation in certain physico-chemical characteristics of
freshwater stream receiving industrial effluents. Geobios 15: 107–111.
Schelske, C. L. 1989. Assessment of nutrient effects and nutrient limitation in Lake Okeechobee. Water
Resources Bulletin 25: 1119–1130.
Schindler, D. W. 1971. Light, temperature and oxygen regimes of selected lakes in the experimental lakes
area, North-Western Ontario. J. Fish. Res. Bd. Canada 28: 157–169.
Schnitzler, A., I. Eglin, F. Robach & M. Tremolieres. 1996. Response of aquatic macrophytes commu-
nities to levels of P and N in an old swamp of the upper Rhine plain (Eastern France). Ecologie 27:
51–61.
Schulz, M. & C. Herzog. 2004. The influence of sorption processes on the phosphorus mass balance in a
eutrophic German lowland river. Water, Air, & Soil Pollution 155: 291–301.
Sekulic, N., V. Stojsic, L. Budakov & D. Brangovic. 1998. Begecka Jama (Serbia, Yugoslavia) in the
condition of anthropogenic eutrophication. Protection of Nature 50: 537–542.
Sharma, P. D. 1998. Ecology and environment. Rastogi Publications, Meerut.
Shen, D. S. 2002. Study on limiting factors of water eutrophication of the network of rivers in plain.
Journal of Zhejiang University (Agriculture and Life Sciences) 28: 94–97.
Shimoda, M. 1984. Macrophyte communities and their significance as indicators of water quality in two
ponds in the Saijo basin, Hiroshima Prefecture, Japan. Hikobia 9: 1–14.
Singhal, P. K. & S. Mahto. 2004. Role of water hyacinth in the health of a tropical urban lake. J. Env.
Biol. 25: 269–277.
Sivaswamy, S. N. & K. S. Prasad. 1990. Population dynamics of phytoplankton along the Madras coast.
J. Environ. Biol. 11: 145–162.
EUTROPHICATION: AN ECOLOGICAL VISION 481
Skei, J., P. Larsson, R. Rosenberg, P. Jonsson, M. Olsson & D. Broman. 2000. Eutrophication and
contaminants in aquatic ecosystems. Ambio 29: 184–194.
Smith, V. H. 2003. Eutrophication of freshwater and coastal marine ecosystems: A global problem. Envi-
ronmental Science and Pollution Research 10: 126–139.
Smolders, A. J. P., J. G. M. Roelofs, H. C. Den, M. Tremolieres & S. Muller. 1995. Internal eutrophi-
cation of aquatic ecosystems: Mechanisms and possible remedies. Acta Botanica Gallica 142:
707–717.
Sommaruga, R., D. Conde & J. A. Casal. 1995. The role of fertilizers and detergents for eutrophication
in Uruguay. Fresenius Environmental Bulletin 4: 111–116.
Stojanovic, S., L. Nikilic & D. Lazic. 1998. The function of dominant hydrophytes of the Mostonga
(Serbia Yugoslavia) in water quality bioindication. Pp. 425–428 in Proceedings of the 27th Annual
Conference of Yugoslav Water Pollution Control Society, Beograd (Yugoslavia).
Sundback, K., A. Miles, S. Hulth, L. Pihl, P. Engstrom, E. Selander & A. Svenson. 2003. Importance
of benthic nutrient regeneration during initiation of macroalgal blooms in shallow bays. Marine
Ecology 246: 115–126.
Swaranlatha, N. & A. N. Rao. 1998. Ecological studies of Banjara Lake with reference to water pollu-
tion. J. Env. Biol. 19: 179–186.
Teshow, M. 1970. Environment and plant response. McGraw-Hill, New York.
Thiebaut, G. & S. Muller. 1998. The impact of eutrophication on aquatic macrophyte diversity in weakly
mineralized streams in the Northern Vosges mountains (NE France). Biodiversity and Conservation
7: 1051–1068.
Tiwari, A. 1998. Rotifers as indicators for assessment of water quality. Proc. Acad. Environ. Biol. 7:
161–166.
Tracy, M., J. M. Montante, T. E. Allenson & R. A. Hough. 2003. Long-term response of aquatic
macrophyte diversity and community structure to variation in nitrogen loading. Aquatic Botany 77:
43–52.
Triantafyllou, G., G. Petihakis, D. Costas & A. Theodorou. 2001. Assessing marine ecosystems re-
sponse to nutrient inputs. Marine Pollution Bulletin 43: 7–12.
Tripathy, P. K. & S. P. Adhikary. 1990. Preliminary studies on the water pollution of river Nandira.
Indian Journal of Environmental Health 32: 363–368.
Trisal, C. L. & S. Kaul. 1983. Sediment composition and water inter changes and the role of macro-
phytes in Dal Lake, Kashmir. Internationale Revue der gesamten Hydrobiologie 68: 671–682.
Vadineanu, A., S. Cristofor & G. Ignat. 1992. Phytoplankton and submerged macrophytes in the aquatic
ecosystems of the Danube Delta during the last decade. Hydrobiologia 243–244: 141–146.
Vaithiyanathan, P. & C. J. Richardson. 1999. Macrophyte species changes in the Everglades: Examina-
tion along a eutrophication gradient. J. Environ. Qual. 28: 1347–1358.
Van Dam, H. & A. Mertens. 1993. Diatoms on herbarium macrophytes as indicators for water quality.
Hydrobiologia 269–270: 437–445.
Van Den Berg, M. S., M. Scheffer, E. H. Van Nes, H. Coops, N. Walz & B. Nixdorf. 1999. Dynamics
and stability of Chara sp. and Potamogeton pectinatus in a shallow lake changing in eutrophication
level. Hydrobiologia 408–409: 335–342.
Vörösmarty, C. J., P. Green, J. Salisbury & R. B. Lammers. 2000. Global water resources: Vulnerabil-
ity from climate change and population growth. Science 289: 284–288.
Vuillemin, M. H. T. 2001. Do food processing industries contribute to the eutrophication of aquatic
systems. Ecotoxicology and Environmental Safety 50: 143–152.
Wang, G. X., P. M. Pu, S. Z. Zhang, C. H. Hu & W. P. Hu. 1999. The purification ability of aquatic
macrophytes for eutrophic lake water in winter. China Environmental Science 19: 106–109.
Wei, B., N. Sugiura & T. Maekawa. 2000. Evaluation of trophic state of eutrophicated lake and biotic
response from algal community level. Environmental Technology 21: 1047–1053.
Weimin, C., C. Yuwei, G. Xiyun & I. Yoshida. 1997. Eutrophication of Lake Taihu and its control.
International Agricultural Engineering Journal 6: 109–120.
Welch, F. B. & G. D. Crooke. 1987. Lakes. Pp. 109–129 in W. R. Jordan III, J. D. Aber & M. E. Gilpin
(eds.), Restoration ecology: A synthetic approach to ecological research. Cambridge Univ. Press,
Cambridge.

482 THE BOTANICAL REVIEW
Wen, L. & F. Recknagel. 2002. In situ removal of dissolved phosphorus in irrigation drainage water by
planted floats: Preliminary results from growth chamber experiment. Agriculture, Ecosystems and
Environment 90: 9–15.
Winter, J. G. & H. C. Duthie. 2000. Epilithic diatoms as indicators of stream total N and total P concen-
tration. Journal of the North American Benthological Society 19: 32–49.
Wychera, U., P. Dirry, G. A. Janauer, P. R. F. Barrett, M. P. Greaves, K. J. Murphy, A. H. Pieterse,
P. M. Wade & M. Wallsten. 1990. Macrophytes of the “New Danube” (Vienna): Biological and
management aspects. Pp. 249–255 in Proceedings of the 8th International Symposium on Aquatic
Weeds, Uppsala, Sweden, 13–17 August 1990.
Yin, K. 2002. Monsoonal influence on seasonal variations in nutrients and phytoplankton biomass in
coastal waters of Hong Kong in the vicinity of the Pearl River estuary. Marine Ecology Progress
Series 245: 111–122.
Zhou, Y., J. Li, C. Song & X. Cao. 2004. Variation and possible source of potentially available phosphorus
in a Chinese shallow eutrophic lake. Journal of Freshwater Ecology 19: 87–96.