europeans’ attitudes towards climate...
TRANSCRIPT
SPECIAL EUROBAROMETER 313 Europeans’ attitudes towards climate change
1
Europeans’ attitudes towards climate change
Spe
cial
Eur
obar
omet
er 3
13 /
Wav
e 71
.1 –
TN
S O
pini
on &
Soc
ial
Report
Fieldwork: January - February 2009
Publication: July 2009
Special Eurobarometer 313
This survey was requested by the European Commission and the European Parliament and coordinated by the Directorate-General for Communication of the European Commission. This document does not represent the European Commission's or the European Parliament’s point of view. The interpretations and opinions expressed herein are solely those of the authors.
EUROPEAN COMMISSION
EUROPEAN PARLIAMENT
SPECIAL EUROBAROMETER 313 Europeans’ attitudes towards climate change
2
TABLE OF CONTENT
INTRODUCTION............................................................................................ 3
1. PERCEPTIONS OF CLIMATE CHANGE AND GLOBAL WARMING ................................ 6
1.1 The three most serious problems facing the world.............................................6
1.2 Assessing the seriousness of the issue........................................................... 16
2. LEVEL OF INFORMATION ABOUT CLIMATE CHANGE.......................................... 19
3. COMBATING CLIMATE CHANGE................................................................... 25
3.1 Attitudes towards climate change and ways of fighting it.................................. 25
3.1.1 Alternative fuels....................................................................................... 27
3.1.2 Personal action taken to fight climate change ............................................... 29
3.1.3 Impact on the European economy .............................................................. 32
3.1.4 Climate change is not an unstoppable process .............................................. 35
3.1.5 Impact of CO emissions on climate change .................................................. 38
3.1.6 The “seriousness” of climate change has not been exaggerated ...................... 41
CONCLUSION.............................................................................................. 45
TECHNICAL SPECIFICATIONS..................................................................... 47
QUESTIONNAIRE........................................................................................ 49
TABLES …………………………………………………………………………………………….54
SPECIAL EUROBAROMETER 313 Europeans’ attitudes towards climate change
3
INTRODUCTION This report presents the results of a survey on Europeans' attitudes towards climate change which was carried out in January and February 2009. Over the past years, climate change has gained top priority on international political agendas. The European Union is committed to working constructively towards a global agreement to control climate change, and is leading the way by taking ambitious action of its own.1 In December 2008, the EU adopted an integrated package of legislative measures on energy and climate to implement ambitious targets for 2020 set by EU leaders in March 2007. The targets are aimed at building a sustainable future through cutting greenhouse gases, reducing energy consumption through increased energy efficiency and meeting more of our energy needs from renewable sources. The issue of climate change has not only raised concern at the political top levels. Intense (international) media attention has fostered a lively public debate. It is in this light that this Eurobarometer survey has been conducted, with the overarching aim of exploring European citizens’ attitudes towards climate change. The survey focuses on:
Citizens’ perceptions of climate change in relation to other world problems.
Citizens’ perceptions of the seriousness of climate change.
The extent to which citizens feel informed about climate change – its causes, consequences and ways of fighting it.
Citizens' attitudes towards alternative fuels and CO² emissions.
Whether citizens feel that climate change is stoppable or has been
exaggerated, and what impact it has on the European economy.
Whether citizens have taken personal action to fight climate change.
This Eurobarometer survey was commissioned by the Directorate General for Communication of the European Commission, on behalf of the European Parliament and the European Commission. It was carried out by TNS Opinion & Social network between 16 January and 22 February 2009. The interviews were conducted among 26,718 citizens in the 27 Member States of the European Union, the three candidate countries for accession to the European Union (Croatia, Turkey and the Former Yugoslav Republic of Macedonia) and in the Turkish Cypriot Community.
1 http://ec.europa.eu/environment/climat/home_en.htm
SPECIAL EUROBAROMETER 313 Europeans’ attitudes towards climate change
4
The methodology used is that of Eurobarometer surveys as carried out by the Directorate General for Communication (“Research and Political Analysis” Unit)2 of the European Commission. A technical note on the manner in which interviews were conducted by the Institutes within the TNS Opinion & Social network is appended as an annex to this report. This note indicates the interview methods and the confidence intervals3. The findings of this survey are in the first place analysed at EU level and secondly by country. Where applicable, different socio-demographic variables - such as respondents’ gender, age, education, occupation and political orientation - have been used to take the analysis further. In addition, the following key variables were used in the analysis to gain deeper insight in citizens’ views on climate change:
Respondents’ subjective level of information about the causes and consequences of climate change and the ways of fighting it: QE3: "Personally, do you think that you are well informed or not about…? The different causes of climate change; the different consequences of climate change; Ways in which we can fight climate change."
Their perception of the seriousness of climate change: QE2: "How
serious a problem do you think climate change is at this moment? Please use a scale from 1 to 10, 1 would mean that it is not a serious problem at all and 10 would mean that it is extremely serious."
2 http://ec.europa.eu/public_opinion/index_en.htm 3 The results tables are included in the annex. It should be noted that the total of the percentages in the tables of this report may exceed 100% when the respondent can give several answers to the same question.
SPECIAL EUROBAROMETER 313 Europeans’ attitudes towards climate change
5
In this report, the countries are represented by their official abbreviations. The abbreviations used in this report correspond to:
ABBREVIATIONS
EU27 European Union – 27 Member States DK/NA Don’t know / No answer BE Belgium BG Bulgaria CZ Czech Republic DK Denmark D-E East Germany DE Germany D-W West Germany EE Estonia EL Greece ES Spain FR France IE Ireland IT Italy CY Republic of Cyprus*
CY (tcc) Area not controlled by the government of the Republic of Cyprus
LT Lithuania LV Latvia LU Luxembourg HU Hungary MT Malta NL The Netherlands AT Austria PL Poland PT Portugal RO Romania SI Slovenia SK Slovakia FI Finland SE Sweden UK The United Kingdom HR Croatia TR Turkey MK The former Yugoslav Republic of Macedonia**
*Cyprus as a whole is one of the 27 European Union Member States. However, the “acquis communautaire” is suspended in the part of the country that is not controlled by the government of the Republic of Cyprus. For practical reasons, only the interviews conducted in the part of the country controlled by the government of the Republic of Cyprus are recorded in the category “CY” and included in the EU27 average. The interviews conducted in the part of the country not controlled by the government of the Republic of Cyprus are recorded in the category “CY(tcc)” [tcc: Turkish Cypriot Community]. ** Provisional code which does not prejudge in any way the definitive nomenclature for this country, which will be agreed following the conclusion of negotiations currently taking place at the United Nations.
SPECIAL EUROBAROMETER 313 Europeans’ attitudes towards climate change
6
1. Perceptions of climate change and global warming 1.1 The three most serious problems facing the world
- Poverty, a global economic downturn and climate change are considered the most serious problems in the world-
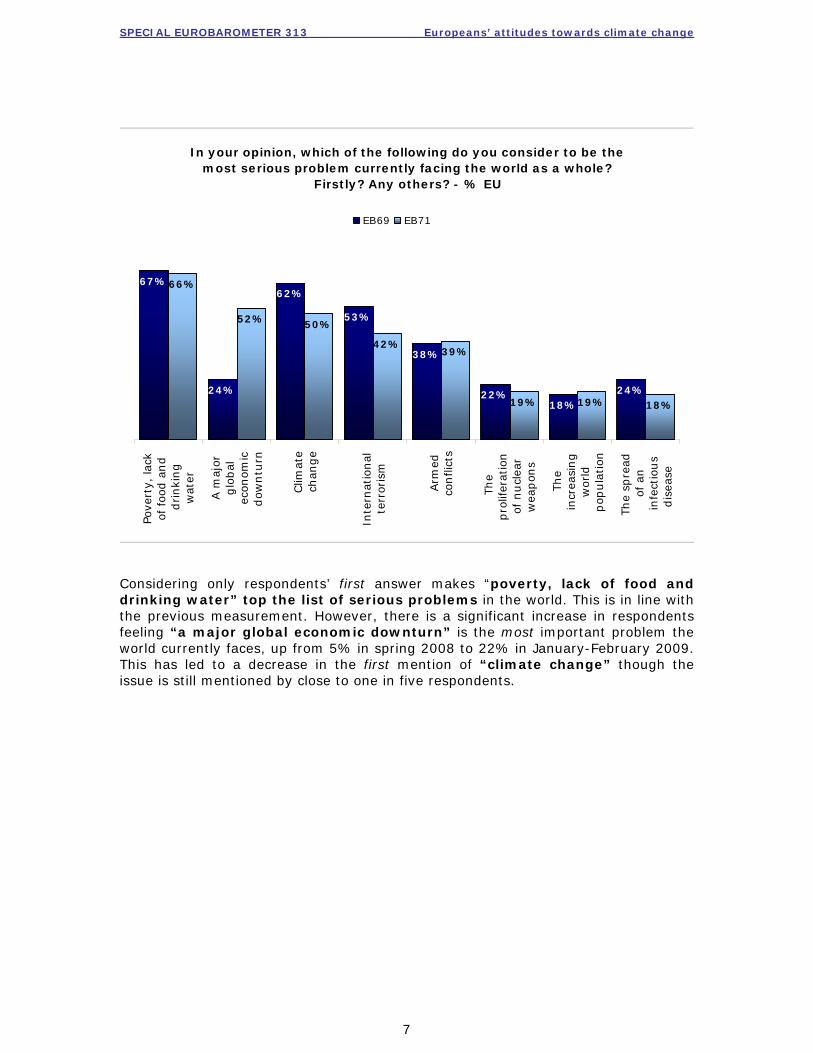
When looking at the total aggregate of respondents’ answers4 to what they consider to be the most serious problems5, 66% think that “poverty, the lack of food and drinking water” is one of the most serious problems our world faces now. Ranking second is “a major global economic downturn” which more than doubled in mentions (from 24% in spring 2008 to 52% in January-February 2009). The increased mentions for “a major global economic downturn” have resulted in lower mentions for “climate change” which received 62% of mentions in spring 2008. Now “climate change”, with 50% feeling that it is amongst the most serious problems our world faces, ranks third. While the economic crisis dominates over “climate change” and the latter receives lower mentions compared to previous levels, it is important to note that these three problems (poverty, the economy and climate change) receive the highest mentions by at least half the sample. After these three problems, respondents consider “international terrorism” as a serious problem (42%), though in this instance the mentions have also decreased (from 53% in spring 2008). Ranking fifth is “armed conflicts”, mentioned by 39% of respondents. Around a fifth of respondents consider “the proliferation of nuclear weapons” (19%, down from 23% in spring 2008), “the increasing world population” (19%, stable from spring 2008) and “the spread of infectious disease” (18%, down from 23% in spring 2008) as the most serious problems facing the world. Again, it is noted that the increased mentions regarding the seriousness of the economic downturn has resulted in lower mentions for other world problems. The graph overleaf shows the overview:
4 This analysis is based on all answers given by the respondents (i.e. first and other answers) 5 QE1 In your opinion, which of the following do you consider to be the most serious problem currently facing the world as a whole? Firstly? Any others?
SPECIAL EUROBAROMETER 313 Europeans’ attitudes towards climate change
7
In your opinion, which of the following do you consider to be the most serious problem currently facing the world as a whole?
Firstly? Any others? - % EU
67%
24%
62%
53%
38%
22%18%
24%
66%
52% 50%
42%39%
19% 19% 18%
Pove
rty,
lack
of foo
d a
nd
drinki
ng
wat
er
A m
ajor
glo
bal
econ
omic
dow
ntu
rn
Clim
ate
chan
ge
Inte
rnat
ional
terr
oris
m
Arm
edco
nfli
cts
The
pro
lifer
atio
nof
nucl
ear
wea
pon
s
The
incr
easi
ng
wor
ldpop
ula
tion
The
spre
adof
an
infe
ctio
us
dis
ease
EB69 EB71
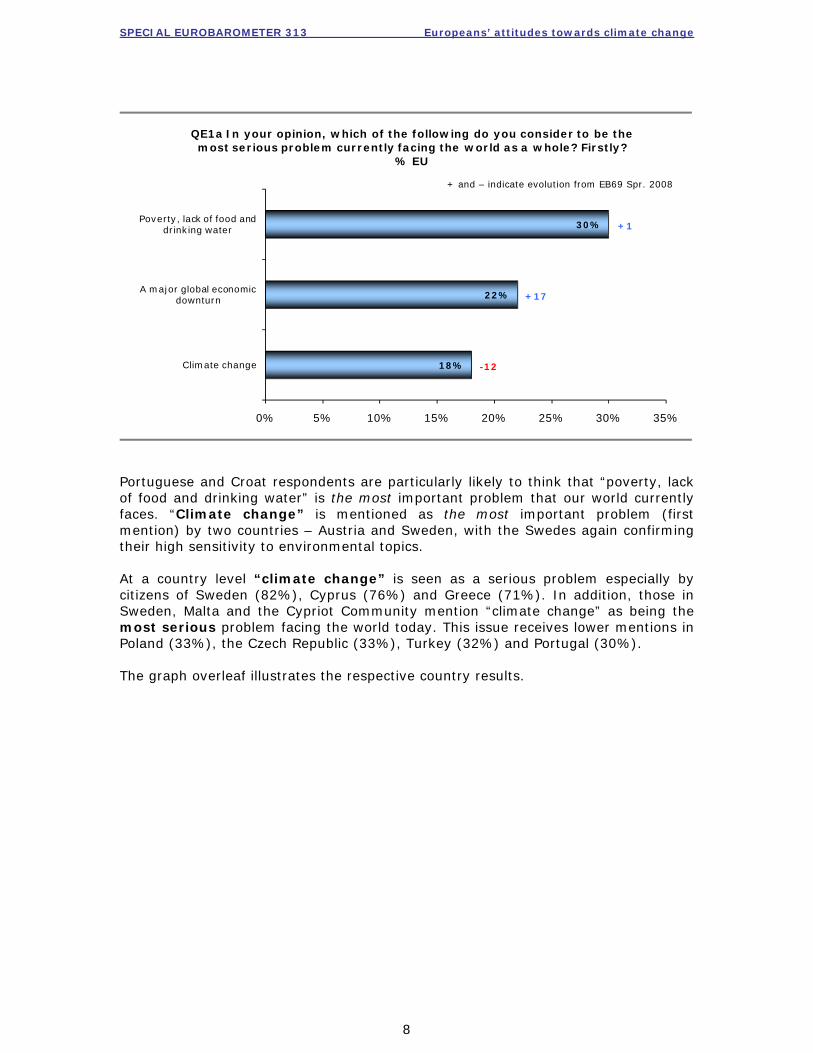
Considering only respondents’ first answer makes “poverty, lack of food and drinking water” top the list of serious problems in the world. This is in line with the previous measurement. However, there is a significant increase in respondents feeling “a major global economic downturn” is the most important problem the world currently faces, up from 5% in spring 2008 to 22% in January-February 2009. This has led to a decrease in the first mention of “climate change” though the issue is still mentioned by close to one in five respondents.
SPECIAL EUROBAROMETER 313 Europeans’ attitudes towards climate change
8
18%
22%
30%
0% 5% 10% 15% 20% 25% 30% 35%
Climate change
A major global economic downturn
Poverty, lack of food and drinking water
QE1a In your opinion, which of the following do you consider to be the most serious problem currently facing the world as a whole? Firstly?
% EU
+1
+17
-12
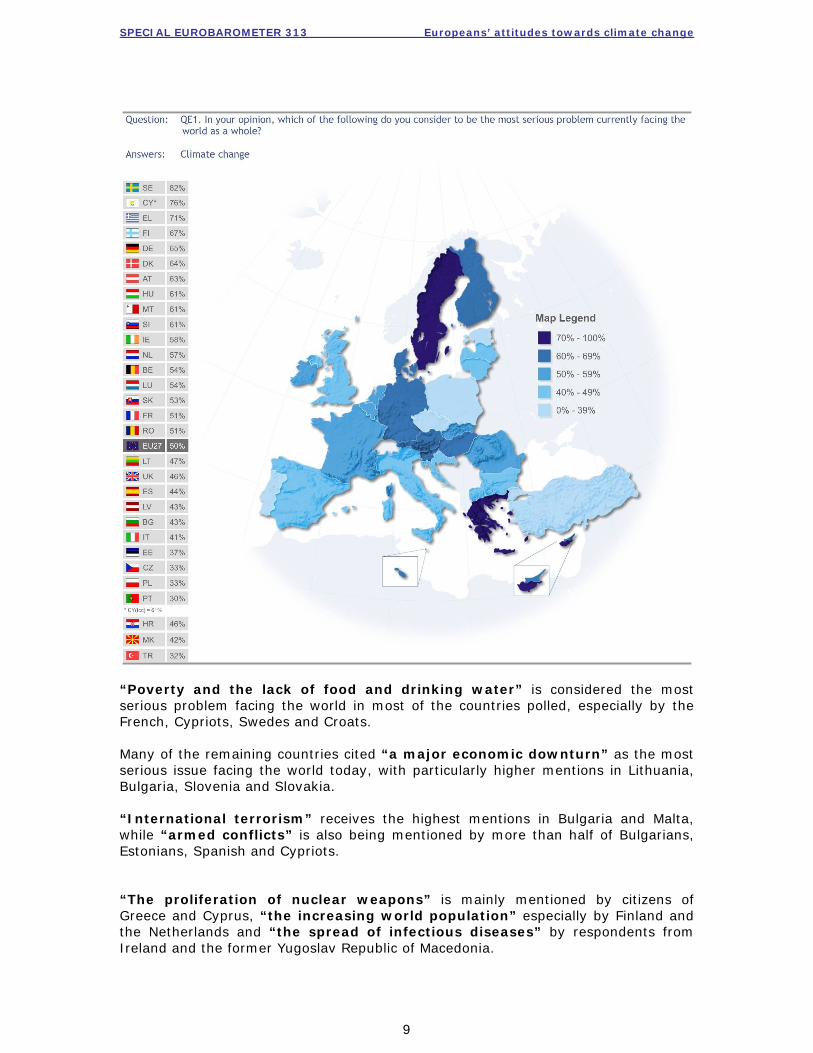
Portuguese and Croat respondents are particularly likely to think that “poverty, lack of food and drinking water” is the most important problem that our world currently faces. “Climate change” is mentioned as the most important problem (first mention) by two countries – Austria and Sweden, with the Swedes again confirming their high sensitivity to environmental topics. At a country level “climate change” is seen as a serious problem especially by citizens of Sweden (82%), Cyprus (76%) and Greece (71%). In addition, those in Sweden, Malta and the Cypriot Community mention “climate change” as being the most serious problem facing the world today. This issue receives lower mentions in Poland (33%), the Czech Republic (33%), Turkey (32%) and Portugal (30%). The graph overleaf illustrates the respective country results.
+ and – indicate evolution from EB69 Spr. 2008
SPECIAL EUROBAROMETER 313 Europeans’ attitudes towards climate change
9
“Poverty and the lack of food and drinking water” is considered the most serious problem facing the world in most of the countries polled, especially by the French, Cypriots, Swedes and Croats. Many of the remaining countries cited “a major economic downturn” as the most serious issue facing the world today, with particularly higher mentions in Lithuania, Bulgaria, Slovenia and Slovakia. “International terrorism” receives the highest mentions in Bulgaria and Malta, while “armed conflicts” is also being mentioned by more than half of Bulgarians, Estonians, Spanish and Cypriots. “The proliferation of nuclear weapons” is mainly mentioned by citizens of Greece and Cyprus, “the increasing world population” especially by Finland and the Netherlands and “the spread of infectious diseases” by respondents from Ireland and the former Yugoslav Republic of Macedonia.
SPECIAL EUROBAROMETER 313 Europeans’ attitudes towards climate change
10
Poverty, lack of
food and drinking
water
A major global economic downturn
Climate changeInternational
terrorismArmed conflicts
The proliferation of nuclear weapons
The increasing
world population
The spread of an infectious disease
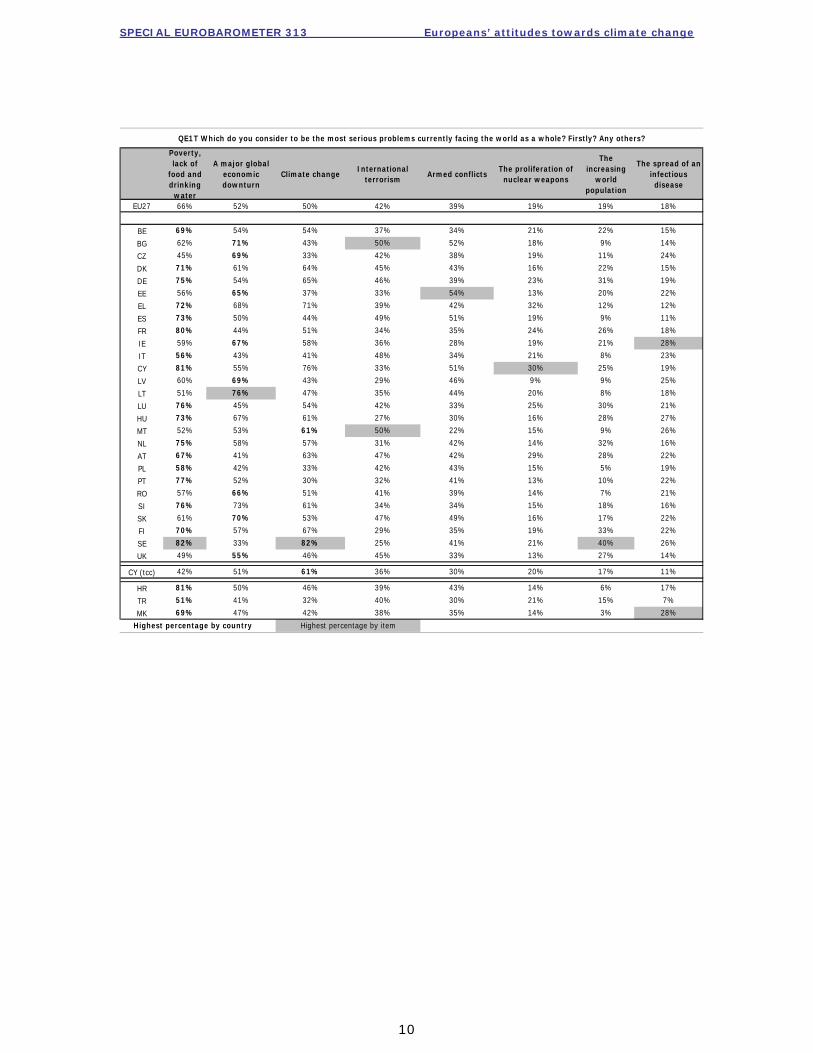
EU27 66% 52% 50% 42% 39% 19% 19% 18%
BE 69% 54% 54% 37% 34% 21% 22% 15%
BG 62% 71% 43% 50% 52% 18% 9% 14%
CZ 45% 69% 33% 42% 38% 19% 11% 24%
DK 71% 61% 64% 45% 43% 16% 22% 15%
DE 75% 54% 65% 46% 39% 23% 31% 19%
EE 56% 65% 37% 33% 54% 13% 20% 22%
EL 72% 68% 71% 39% 42% 32% 12% 12%
ES 73% 50% 44% 49% 51% 19% 9% 11%
FR 80% 44% 51% 34% 35% 24% 26% 18%
IE 59% 67% 58% 36% 28% 19% 21% 28%
IT 56% 43% 41% 48% 34% 21% 8% 23%
CY 81% 55% 76% 33% 51% 30% 25% 19%
LV 60% 69% 43% 29% 46% 9% 9% 25%
LT 51% 76% 47% 35% 44% 20% 8% 18%
LU 76% 45% 54% 42% 33% 25% 30% 21%
HU 73% 67% 61% 27% 30% 16% 28% 27%
MT 52% 53% 61% 50% 22% 15% 9% 26%
NL 75% 58% 57% 31% 42% 14% 32% 16%
AT 67% 41% 63% 47% 42% 29% 28% 22%
PL 58% 42% 33% 42% 43% 15% 5% 19%
PT 77% 52% 30% 32% 41% 13% 10% 22%
RO 57% 66% 51% 41% 39% 14% 7% 21%
SI 76% 73% 61% 34% 34% 15% 18% 16%
SK 61% 70% 53% 47% 49% 16% 17% 22%
FI 70% 57% 67% 29% 35% 19% 33% 22%
SE 82% 33% 82% 25% 41% 21% 40% 26%
UK 49% 55% 46% 45% 33% 13% 27% 14%
CY (tcc) 42% 51% 61% 36% 30% 20% 17% 11%
HR 81% 50% 46% 39% 43% 14% 6% 17%
TR 51% 41% 32% 40% 30% 21% 15% 7%
MK 69% 47% 42% 38% 35% 14% 3% 28%
QE1T Which do you consider to be the most serious problems currently facing the world as a whole? Firstly? Any others?
Highest percentage by country Highest percentage by item
SPECIAL EUROBAROMETER 313 Europeans’ attitudes towards climate change
11
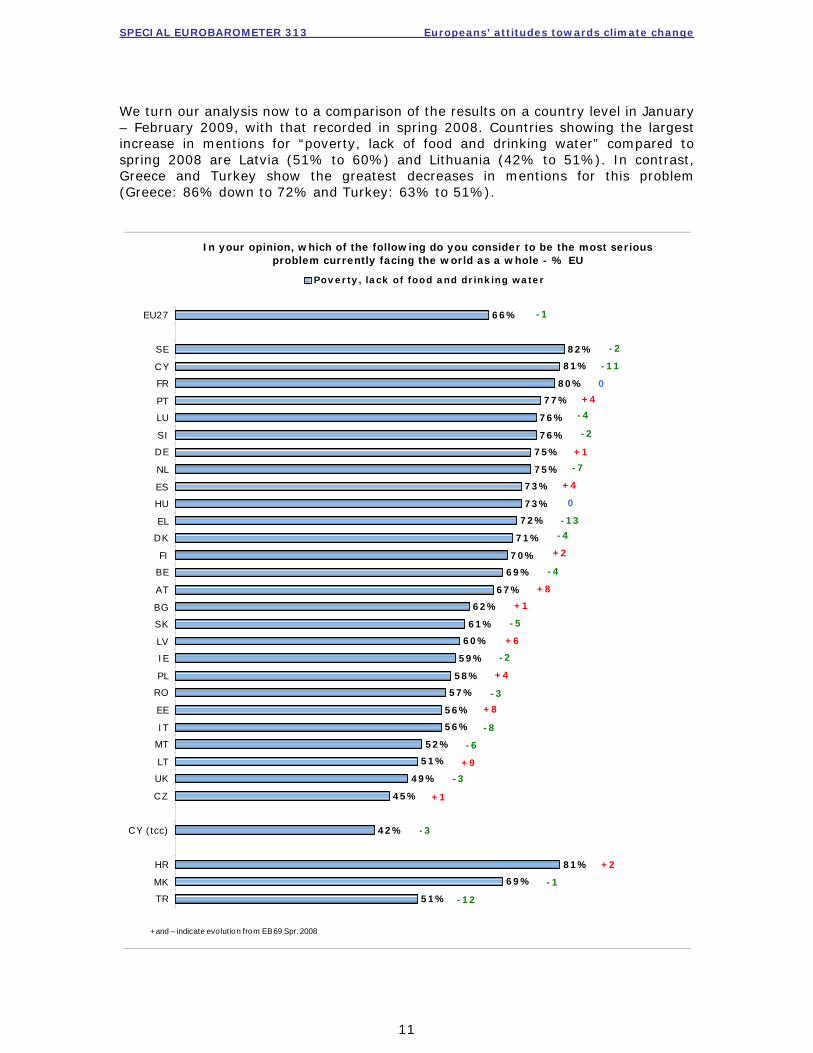
We turn our analysis now to a comparison of the results on a country level in January – February 2009, with that recorded in spring 2008. Countries showing the largest increase in mentions for “poverty, lack of food and drinking water” compared to spring 2008 are Latvia (51% to 60%) and Lithuania (42% to 51%). In contrast, Greece and Turkey show the greatest decreases in mentions for this problem (Greece: 86% down to 72% and Turkey: 63% to 51%).
In your opinion, which of the following do you consider to be the most serious problem currently facing the world as a whole - % EU
66%
82%
81%
80%
77%
76%
76%
75%
75%
73%
73%
72%
71%
70%
69%
67%
62%
61%
60%
59%
58%
57%
56%
56%
52%
51%
49%
45%
42%
81%
69%
51%
EU27
SE
CY
FR
PT
LU
SI
DE
NL
ES
HU
EL
DK
FI
BE
AT
BG
SK
LV
IE
PL
RO
EE
IT
MT
LT
UK
CZ
CY (tcc)
HR
MK
TR
Poverty, lack of food and drinking water
+ and – indicate evolution from EB69 Spr. 2008
-1
-12
0
-13
-2
-8
-6
-3
+9
-3
+2
-1
+1
+8
-3
+4
+6
-5
+1
+8
-4
+2
-4
+4
-7
+1
-2
-4
+4
0
-11
-2
SPECIAL EUROBAROMETER 313 Europeans’ attitudes towards climate change
12
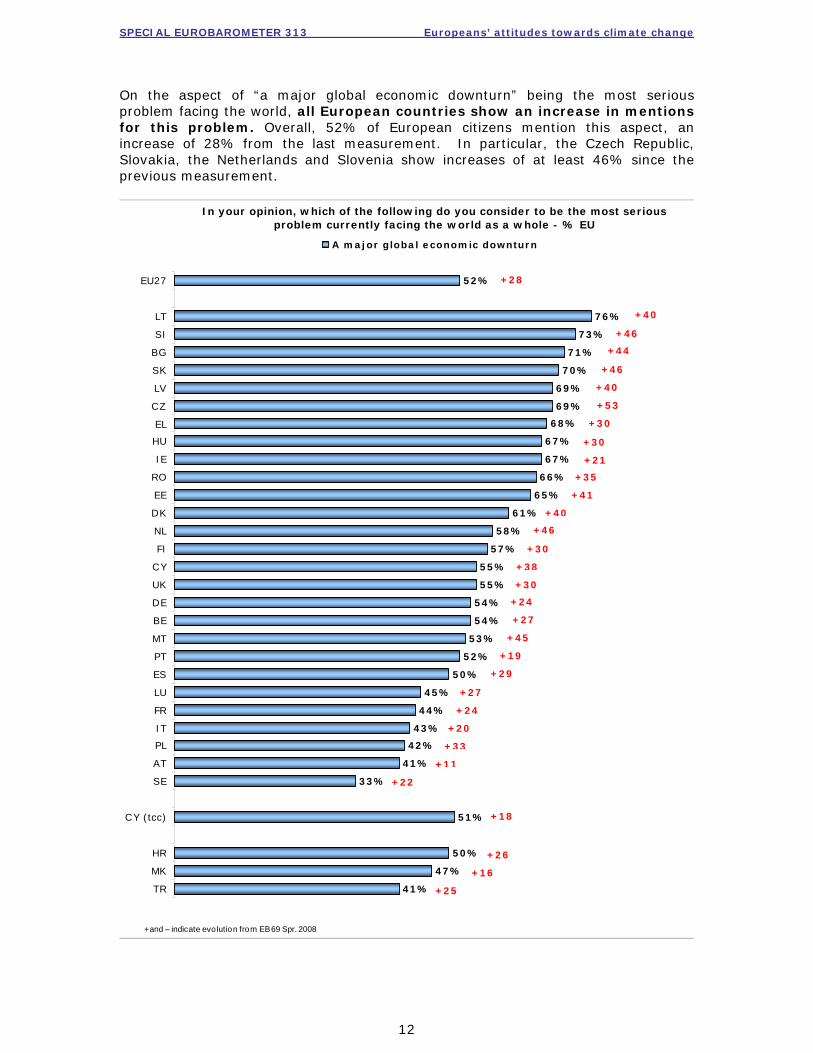
On the aspect of “a major global economic downturn” being the most serious problem facing the world, all European countries show an increase in mentions for this problem. Overall, 52% of European citizens mention this aspect, an increase of 28% from the last measurement. In particular, the Czech Republic, Slovakia, the Netherlands and Slovenia show increases of at least 46% since the previous measurement.
In your opinion, which of the following do you consider to be the most serious problem currently facing the world as a whole - % EU
52%
76%
73%
71%
70%
69%
69%
68%
67%
67%
66%
65%
61%
58%
57%
55%
55%
54%
54%
53%
52%
50%
45%
44%
43%
42%
41%
33%
51%
50%
47%
41%
EU27
LT
SI
BG
SK
LV
CZ
EL
HU
IE
RO
EE
DK
NL
FI
CY
UK
DE
BE
MT
PT
ES
LU
FR
IT
PL
AT
SE
CY (tcc)
HR
MK
TR
A major global economic downturn
+28
+25
+35
+41
+45
+24
+20
+11
+33
+18
+26
+16
+22
+27
+29
+19
+27
+24
+30
+38
+30
+46
+40
+21
+30
+30
+53
+40
+46
+44
+46
+40
+ and – indicate evo lution from EB69 Spr. 2008
SPECIAL EUROBAROMETER 313 Europeans’ attitudes towards climate change
13
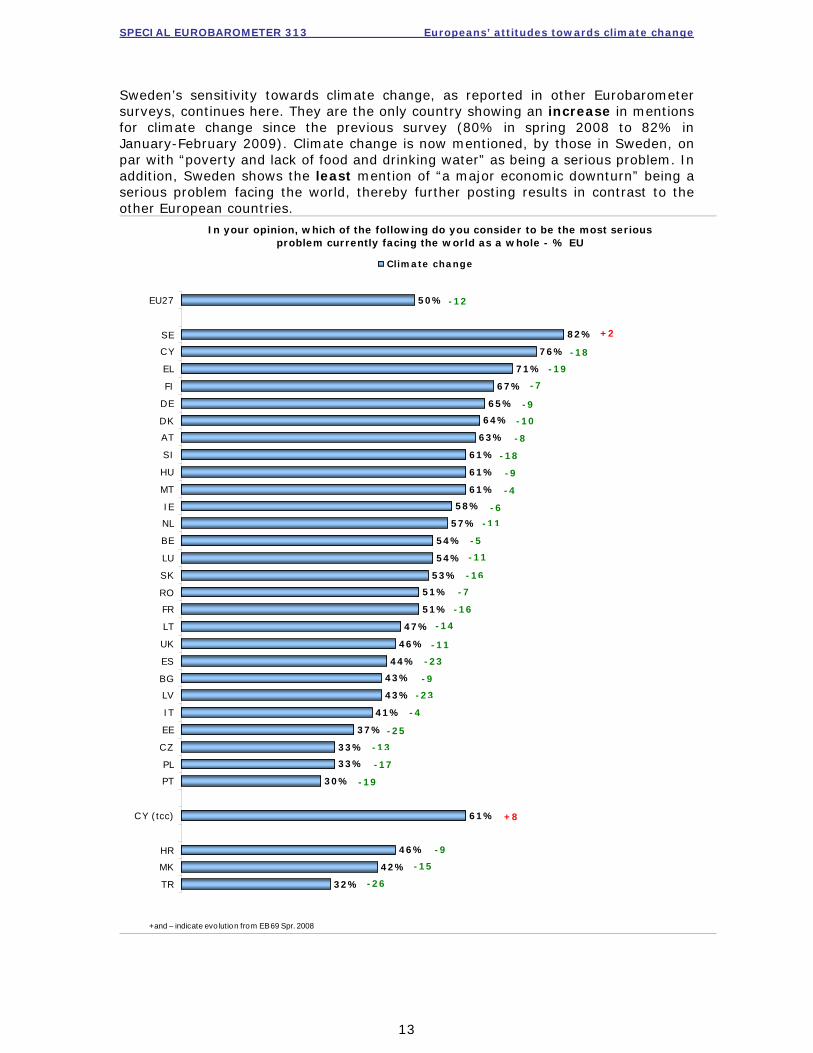
Sweden’s sensitivity towards climate change, as reported in other Eurobarometer surveys, continues here. They are the only country showing an increase in mentions for climate change since the previous survey (80% in spring 2008 to 82% in January-February 2009). Climate change is now mentioned, by those in Sweden, on par with “poverty and lack of food and drinking water” as being a serious problem. In addition, Sweden shows the least mention of “a major economic downturn” being a serious problem facing the world, thereby further posting results in contrast to the other European countries.
In your opinion, which of the following do you consider to be the most serious problem currently facing the world as a whole - % EU
50%
82%
76%
71%
67%
65%
64%
63%
61%
61%
61%
58%
57%
54%
54%
53%
51%
51%
47%
46%
44%
43%
43%
41%
37%
33%
33%
30%
61%
46%
42%
32%
EU27
SE
CY
EL
FI
DE
DK
AT
SI
HU
MT
IE
NL
BE
LU
SK
RO
FR
LT
UK
ES
BG
LV
IT
EE
CZ
PL
PT
CY (tcc)
HR
MK
TR
Climate change
-12
-26
-4
-6
-11
-4
-25
-17
-13
+8
-9
-15
-19
-23
-9
-23
-14
-16
-7
-16
-11
-5
-11
-9
-18
-8
-10
-9
-7
-19
-18
+2
+ and – indicate evolution from EB69 Spr. 2008
SPECIAL EUROBAROMETER 313 Europeans’ attitudes towards climate change
14
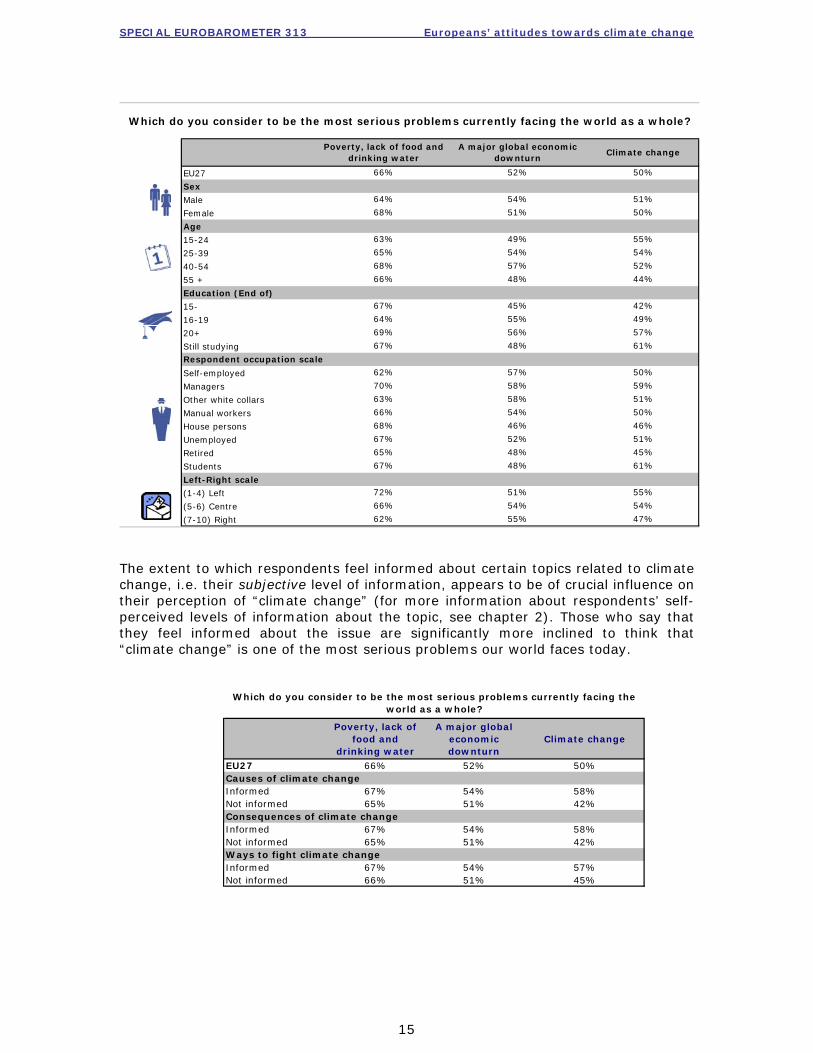
Socio-demographic analysis We now return to the analysis of all answers given by the respondents (first and other answers). When taking into account different socio-demographic variables it appears that:
“Poverty and lack of food and drinking water” is seen as the most serious problem by men and women, though women show higher mentions on this issue than men (68% versus 64%). In addition, women are more likely to mention “the spread of infectious disease”. In their turn, men are more likely to mention “a major economic downturn” and “the increasing world population” as one of the most serious problems.
Older respondents (aged 55+) are less likely to mention “climate change”
as a serious problem (44%) compared to all the other younger age groups. The middle age groups (25-54) are more likely to mention “a major global economic downturn” (age 25-39: 54%, age 40-54: 52%) showing similar sensitivity to the current economic climate as the youngest (age 15-24: 55%) but more than the oldest (age 55+: 44%) age groups.
Respondents who studied until they reached the age of 20 or beyond are considerably more likely to find poverty, climate change and the increasing world population serious problems than those who finished their studies at the age of 19 or before. International terrorism and the spread of an infectious disease, however, are more frequently mentioned by those who finished their studies earlier.
Those who position themselves at the left end of the political scale appear to mention “climate change”, “poverty” and “armed conflicts” considerably more often than respondents at the right end of the scale. On the other hand, “international terrorism” and “a major economic downturn” is cited more often by respondents on the right side of the political spectrum than by those on the left.
“Climate change” is mentioned most frequently by managers and students and, conversely, the least by house persons and retired people The issue of “climate change” appears to be the second or third most important problem across all socio-demographic categories, thus reflecting its importance across the citizens surveyed.
SPECIAL EUROBAROMETER 313 Europeans’ attitudes towards climate change
15
EU27
Sex
Male
Female
Age
15-24
25-39
40-54
55 +
Education (End of)
15-
16-19
20+
Still studying
Self-employed
Managers
Other white collars
Manual workers
House persons
Unemployed
Retired
Students
Left-Right scale
(1-4) Left
(5-6) Centre
(7-10) Right
Respondent occupation scale
55%
54%
47%
62%
72%
69%
67%
56%
57%
48%
63%
65%
68%
66%
55%
54%
52%
68%
Poverty, lack of food and drinking water
A major global economic downturn
Climate change
64% 54%
44%
49%
54%
51% 50%
67%
64%
45%
55%
51%
66% 52% 50%
48%
42%
49%
57%
61%
66%
62%
51%
54%
55%
70%
63%
66%
68%
67%
65%
67%
57%
58%
58%
54%
46%
52%
48%
48%
50%
59%
51%
50%
46%
51%
45%
61%
Which do you consider to be the most serious problems currently facing the world as a whole?
The extent to which respondents feel informed about certain topics related to climate change, i.e. their subjective level of information, appears to be of crucial influence on their perception of “climate change” (for more information about respondents’ self-perceived levels of information about the topic, see chapter 2). Those who say that they feel informed about the issue are significantly more inclined to think that “climate change” is one of the most serious problems our world faces today.
Poverty, lack of food and
drinking water
A major global economic downturn
Climate change
EU27 66% 52% 50%Causes of climate changeInformed 67% 54% 58%Not informed 65% 51% 42%Consequences of climate changeInformed 67% 54% 58%Not informed 65% 51% 42%Ways to fight climate changeInformed 67% 54% 57%Not informed 66% 51% 45%
Which do you consider to be the most serious problems currently facing the world as a whole?
SPECIAL EUROBAROMETER 313 Europeans’ attitudes towards climate change
16
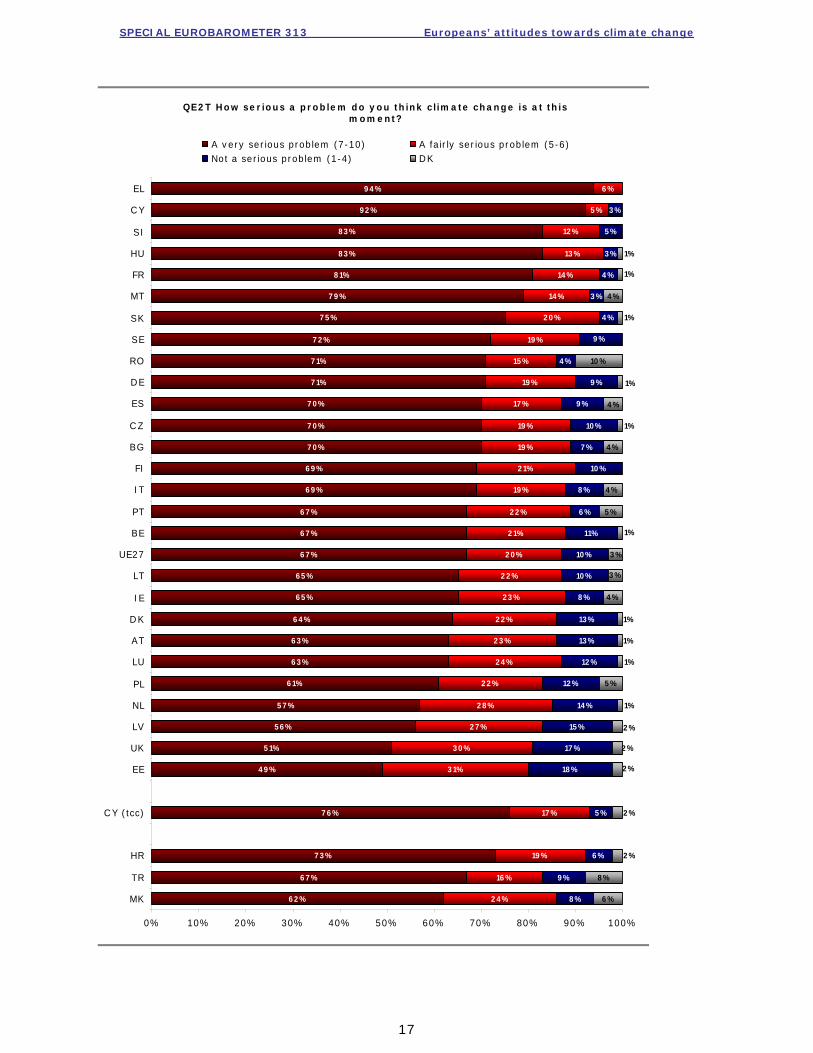
1.2 Assessing the seriousness of the issue - Despite the overshadowing economic crisis, a vast majority of Europeans
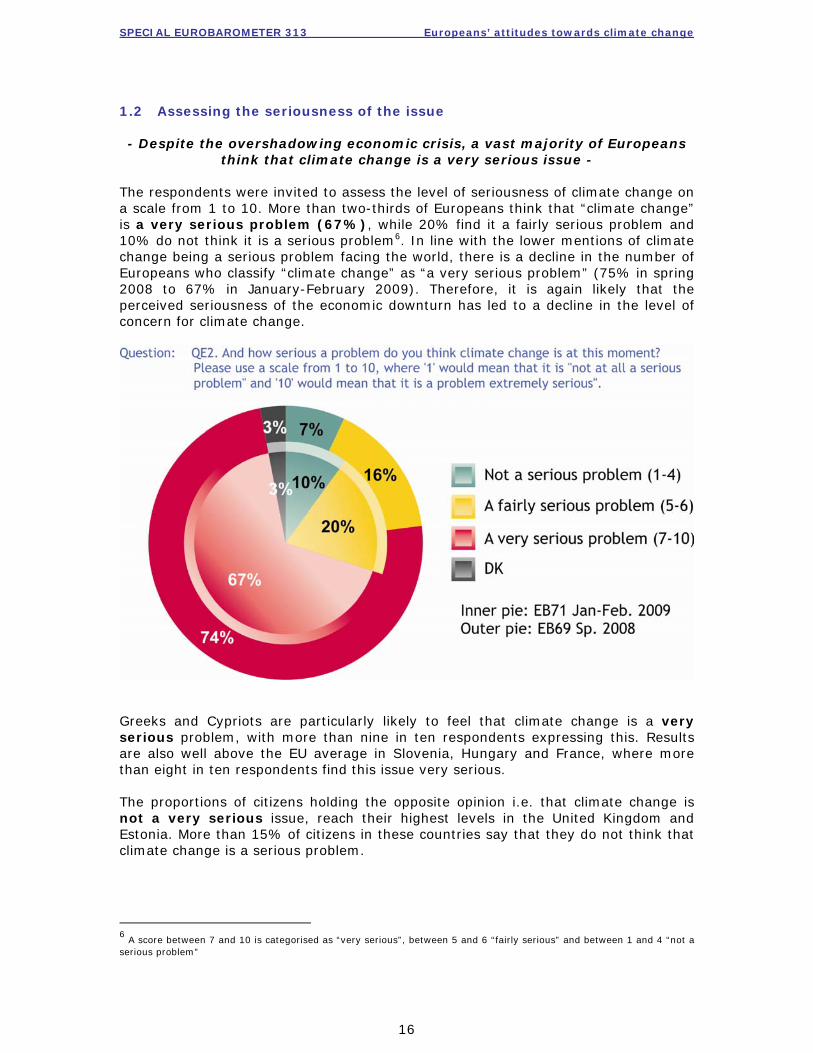
think that climate change is a very serious issue - The respondents were invited to assess the level of seriousness of climate change on a scale from 1 to 10. More than two-thirds of Europeans think that “climate change” is a very serious problem (67%), while 20% find it a fairly serious problem and 10% do not think it is a serious problem6. In line with the lower mentions of climate change being a serious problem facing the world, there is a decline in the number of Europeans who classify “climate change” as “a very serious problem” (75% in spring 2008 to 67% in January-February 2009). Therefore, it is again likely that the perceived seriousness of the economic downturn has led to a decline in the level of concern for climate change.
Greeks and Cypriots are particularly likely to feel that climate change is a very serious problem, with more than nine in ten respondents expressing this. Results are also well above the EU average in Slovenia, Hungary and France, where more than eight in ten respondents find this issue very serious. The proportions of citizens holding the opposite opinion i.e. that climate change is not a very serious issue, reach their highest levels in the United Kingdom and Estonia. More than 15% of citizens in these countries say that they do not think that climate change is a serious problem.
6 A score between 7 and 10 is categorised as “very serious”, between 5 and 6 “fairly serious” and between 1 and 4 “not a
serious problem”
SPECIAL EUROBAROMETER 313 Europeans’ attitudes towards climate change
17
QE2T How serious a problem do you think climate change is at this moment?
6 2 %
6 7 %
7 3 %
7 6 %
4 9 %
5 1%
5 6 %
5 7 %
6 1%
6 3 %
6 3 %
6 4 %
6 5 %
6 5 %
6 7 %
6 7 %
6 7 %
6 9 %
6 9 %
7 0 %
7 0 %
7 0 %
7 1%
7 1%
7 2 %
7 5 %
7 9 %
8 1%
8 3 %
8 3 %
9 2 %
9 4 %
2 4 %
16 %
19 %
17 %
3 1%
3 0 %
2 7 %
2 8 %
2 2 %
2 4 %
2 3 %
2 2 %
2 3 %
2 2 %
2 0 %
2 1%
2 2 %
19 %
2 1%
19 %
19 %
17 %
19 %
15 %
19 %
2 0 %
14 %
14 %
13 %
12 %
8 %
9 %
6 %
5 %
18 %
17 %
15 %
14 %
12 %
12 %
13 %
13 %
10 %
10 %
11%
6 %
8 %
10 %
7 %
10 %
9 %
9 %
4 %
4 %
6 %
8 %
5 %
4 %
5 %
6 %
4 %
3 %
3 %
5 %
3 %
9 %
8 %
1%
4 %
1%
1%
10 %
1%
4 %
4 %
4 %
5 %
3 %
3 %
1%
2 %
2 %
1%
1%
1%
1%
1%
2 %
2 %
2 %
0% 10% 20% 30% 40% 50% 60% 70% 80% 90% 100%
MK
TR
HR
CY (tcc)
EE
UK
LV
NL
PL
LU
AT
DK
IE
LT
UE27
BE
PT
IT
FI
BG
C Z
ES
DE
RO
SE
SK
MT
FR
HU
SI
CY
EL
A very serious problem (7-10) A fairly serious problem (5-6)Not a serious problem (1-4) DK
SPECIAL EUROBAROMETER 313 Europeans’ attitudes towards climate change
18
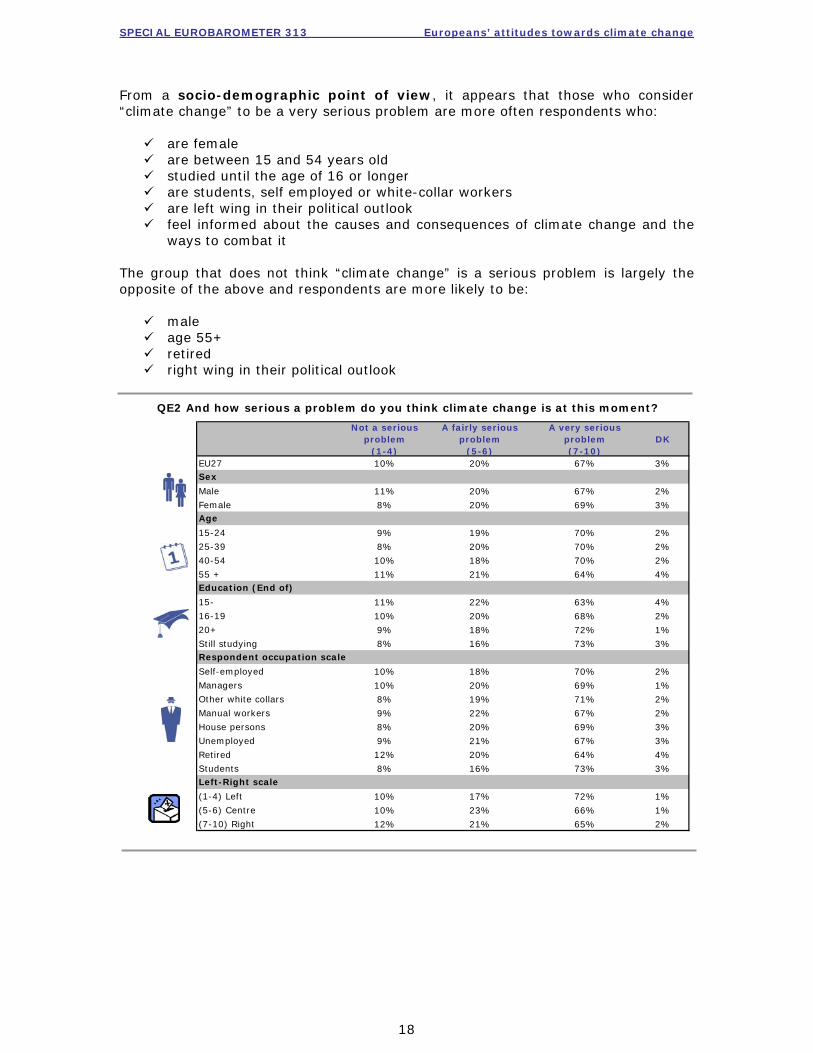
From a socio-demographic point of view, it appears that those who consider “climate change” to be a very serious problem are more often respondents who:
are female are between 15 and 54 years old studied until the age of 16 or longer are students, self employed or white-collar workers are left wing in their political outlook feel informed about the causes and consequences of climate change and the
ways to combat it The group that does not think “climate change” is a serious problem is largely the opposite of the above and respondents are more likely to be:
male age 55+ retired right wing in their political outlook
Not a serious problem
(1-4)
A fairly serious problem
(5-6)
A very serious problem(7-10)
DK
EU27 10% 20% 67% 3%
Male 11% 20% 67% 2%
Female 8% 20% 69% 3%
15-24 9% 19% 70% 2%
25-39 8% 20% 70% 2%
40-54 10% 18% 70% 2%
55 + 11% 21% 64% 4%
15- 11% 22% 63% 4%
16-19 10% 20% 68% 2%
20+ 9% 18% 72% 1%
Still studying 8% 16% 73% 3%
Self-employed 10% 18% 70% 2%
Managers 10% 20% 69% 1%
Other white collars 8% 19% 71% 2%
Manual workers 9% 22% 67% 2%
House persons 8% 20% 69% 3%
Unemployed 9% 21% 67% 3%
Retired 12% 20% 64% 4%
Students 8% 16% 73% 3%
(1-4) Left 10% 17% 72% 1%
(5-6) Centre 10% 23% 66% 1%
(7-10) Right 12% 21% 65% 2%
Left-Right scale
Respondent occupation scale
Education (End of)
QE2 And how serious a problem do you think climate change is at this moment?
Sex
Age
SPECIAL EUROBAROMETER 313 Europeans’ attitudes towards climate change
19
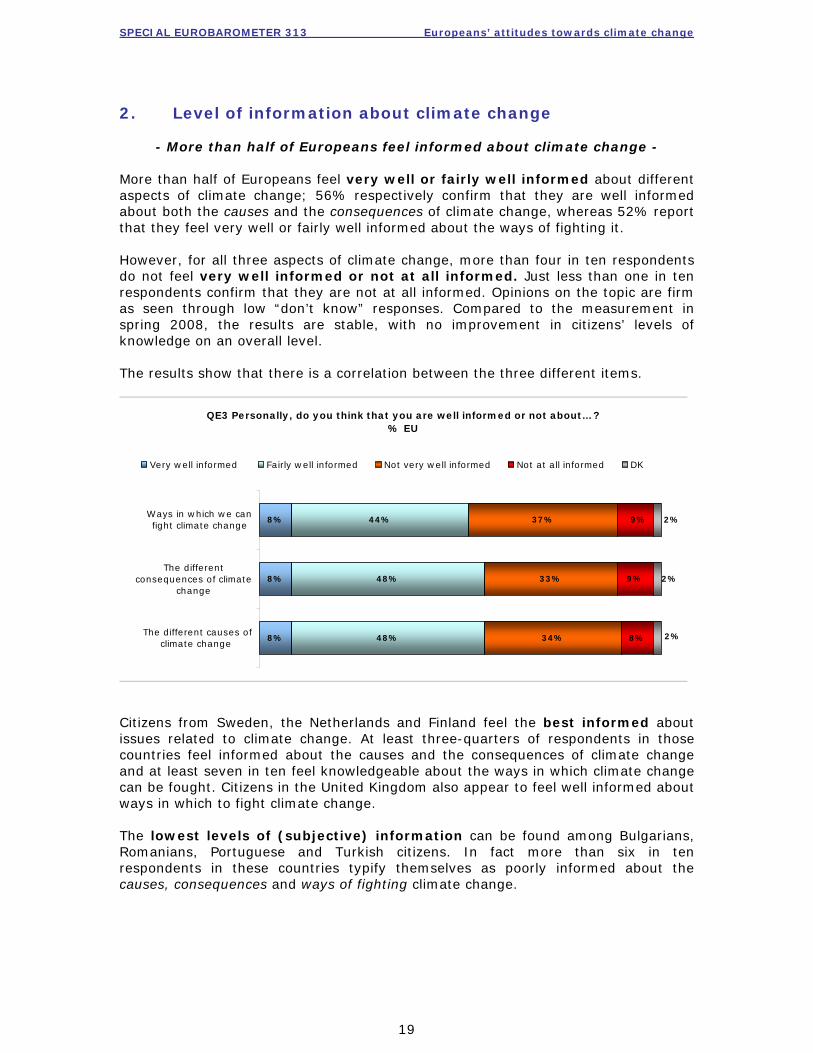
2. Level of information about climate change
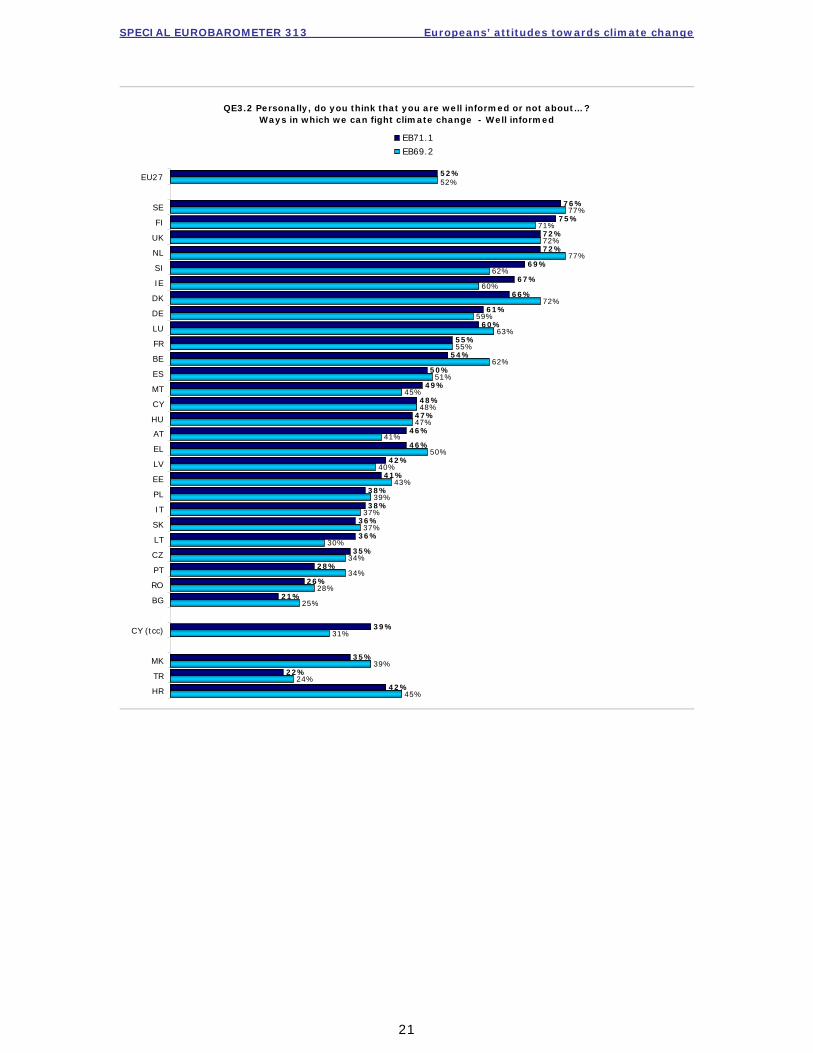
- More than half of Europeans feel informed about climate change - More than half of Europeans feel very well or fairly well informed about different aspects of climate change; 56% respectively confirm that they are well informed about both the causes and the consequences of climate change, whereas 52% report that they feel very well or fairly well informed about the ways of fighting it. However, for all three aspects of climate change, more than four in ten respondents do not feel very well informed or not at all informed. Just less than one in ten respondents confirm that they are not at all informed. Opinions on the topic are firm as seen through low “don’t know” responses. Compared to the measurement in spring 2008, the results are stable, with no improvement in citizens’ levels of knowledge on an overall level. The results show that there is a correlation between the three different items.
QE3 Personally, do you think that you are well informed or not about…? % EU
8%
8%
8%
48%
48%
44%
34%
33%
37%
8%
9%
9%
2%
2%
2%
The different causes ofclimate change
The differentconsequences of climate
change
Ways in which we canfight climate change
Very well informed Fairly well informed Not very well informed Not at all informed DK
Citizens from Sweden, the Netherlands and Finland feel the best informed about issues related to climate change. At least three-quarters of respondents in those countries feel informed about the causes and the consequences of climate change and at least seven in ten feel knowledgeable about the ways in which climate change can be fought. Citizens in the United Kingdom also appear to feel well informed about ways in which to fight climate change. The lowest levels of (subjective) information can be found among Bulgarians, Romanians, Portuguese and Turkish citizens. In fact more than six in ten respondents in these countries typify themselves as poorly informed about the causes, consequences and ways of fighting climate change.
SPECIAL EUROBAROMETER 313 Europeans’ attitudes towards climate change
20
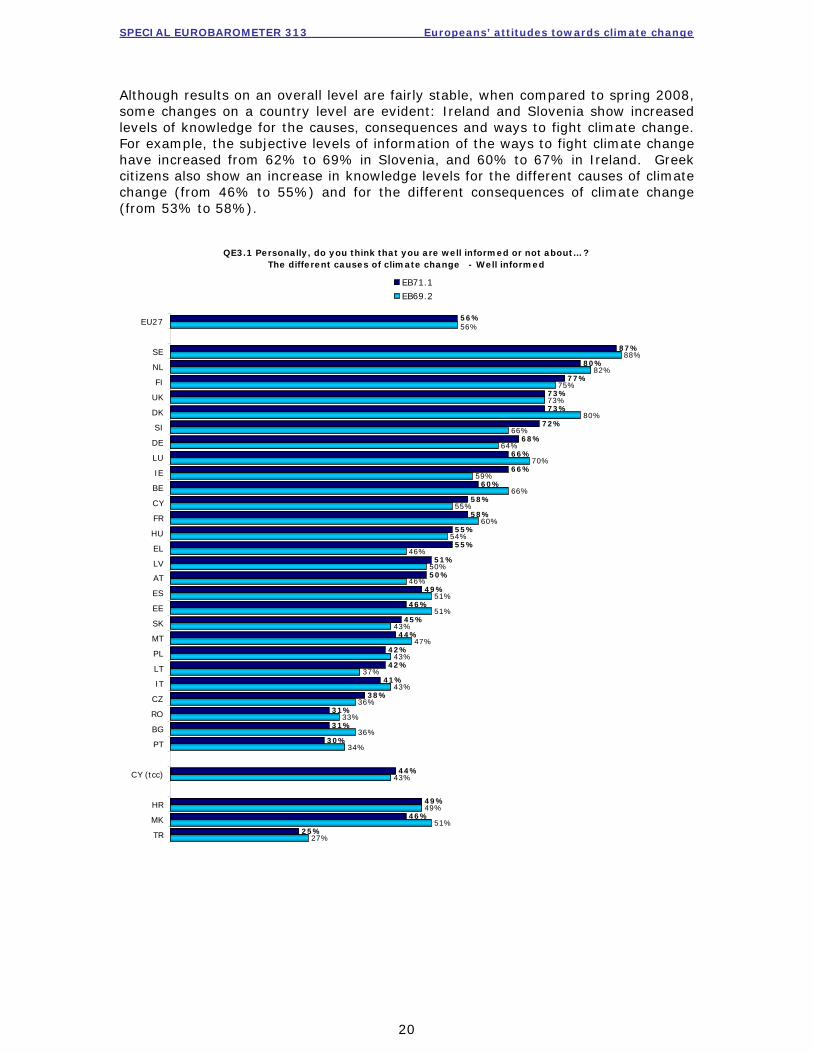
Although results on an overall level are fairly stable, when compared to spring 2008, some changes on a country level are evident: Ireland and Slovenia show increased levels of knowledge for the causes, consequences and ways to fight climate change. For example, the subjective levels of information of the ways to fight climate change have increased from 62% to 69% in Slovenia, and 60% to 67% in Ireland. Greek citizens also show an increase in knowledge levels for the different causes of climate change (from 46% to 55%) and for the different consequences of climate change (from 53% to 58%).
QE3.1 Personally, do you think that you are well informed or not about…?The different causes of climate change - Well informed
27%
51%
49%
43%
34%
36%
33%
36%
43%
37%
43%
47%
43%
51%
51%
46%
50%
46%
54%
60%
55%
66%
59%
70%
64%
66%
80%
73%
75%
82%
88%
25%
46%
49%
44%
30%
31%
31%
38%
41%
42%
42%
44%
45%
46%
49%
50%
51%
55%
55%
58%
58%
60%
66%
66%
68%
72%
73%
73%
77%
80%
87%
56%56%
TR
MK
HR
CY (tcc)
PT
BG
RO
CZ
IT
LT
PL
MT
SK
EE
ES
AT
LV
EL
HU
FR
CY
BE
IE
LU
DE
SI
DK
UK
FI
NL
SE
EU27
EB71.1
EB69.2
SPECIAL EUROBAROMETER 313 Europeans’ attitudes towards climate change
21
QE3.2 Personally, do you think that you are well informed or not about…?Ways in which we can fight climate change - Well informed
45%
24%
39%
31%
25%
28%
34%
34%
30%
37%
37%
39%
43%
40%
50%
41%
47%
48%
45%
51%
62%
55%
63%
59%
72%
60%
62%
77%
72%
71%
77%
42%
22%
35%
39%
21%
26%
28%
35%
36%
36%
38%
38%
41%
42%
46%
46%
47%
48%
49%
50%
54%
55%
60%
61%
66%
67%
69%
72%
72%
75%
76%
52%52%
HR
TR
MK
CY (tcc)
BG
RO
PT
CZ
LT
SK
IT
PL
EE
LV
EL
AT
HU
CY
MT
ES
BE
FR
LU
DE
DK
IE
SI
NL
UK
FI
SE
EU27
EB71.1
EB69.2
SPECIAL EUROBAROMETER 313 Europeans’ attitudes towards climate change
22
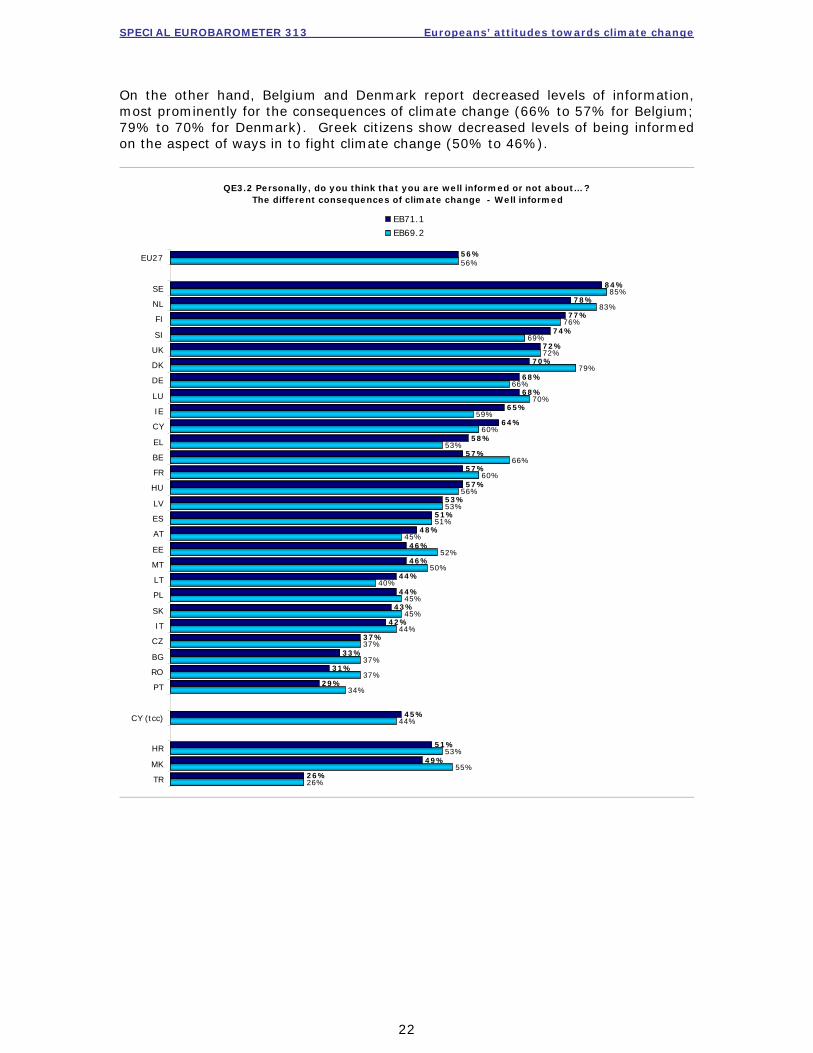
On the other hand, Belgium and Denmark report decreased levels of information, most prominently for the consequences of climate change (66% to 57% for Belgium; 79% to 70% for Denmark). Greek citizens show decreased levels of being informed on the aspect of ways in to fight climate change (50% to 46%).
QE3.2 Personally, do you think that you are well informed or not about…? The different consequences of climate change - Well informed
26%
55%
53%
44%
34%
37%
37%
37%
44%
45%
45%
40%
50%
52%
45%
51%
53%
56%
60%
66%
53%
60%
59%
70%
66%
79%
72%
69%
76%
83%
85%
26%
49%
51%
45%
29%
31%
33%
37%
42%
43%
44%
44%
46%
46%
48%
51%
53%
57%
57%
57%
58%
64%
65%
68%
68%
70%
72%
74%
77%
78%
84%
56%56%
TR
MK
HR
CY (tcc)
PT
RO
BG
CZ
IT
SK
PL
LT
MT
EE
AT
ES
LV
HU
FR
BE
EL
CY
IE
LU
DE
DK
UK
SI
FI
NL
SE
EU27
EB71.1
EB69.2
SPECIAL EUROBAROMETER 313 Europeans’ attitudes towards climate change
23
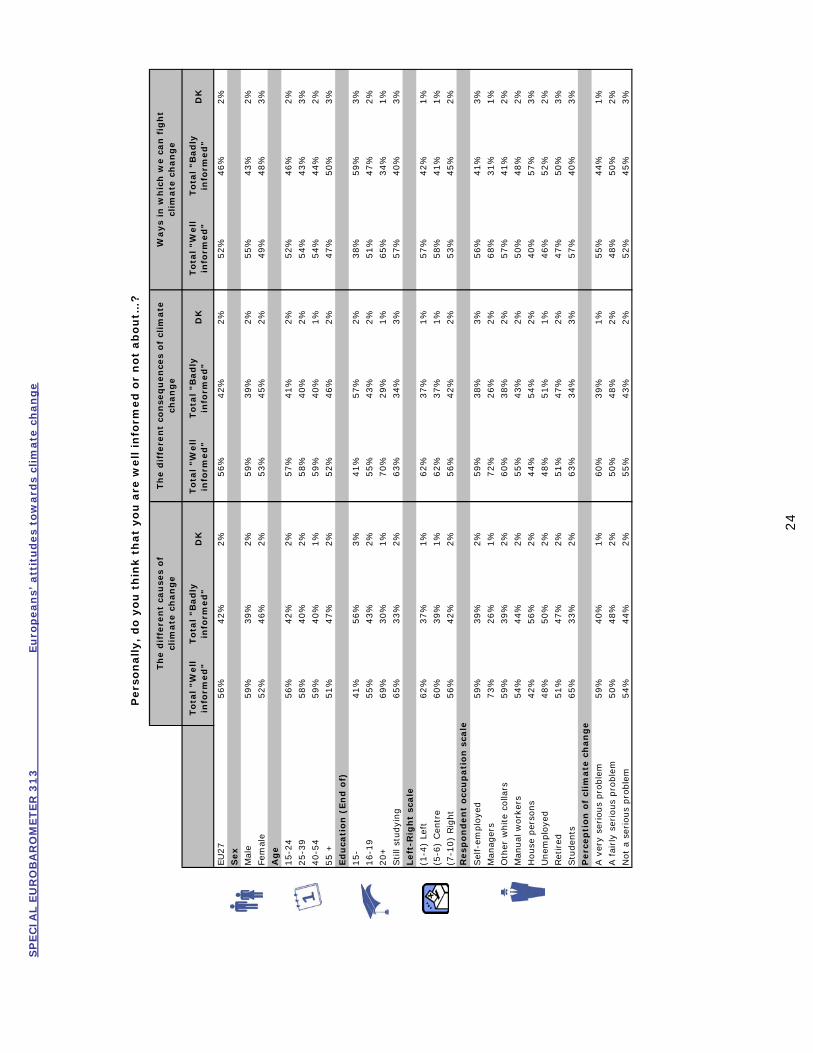
From a socio-demographic point of view, shown in the table, we see that:
Men feel better informed than women about the causes of climate change, its consequences and the ways it could be combated.
The group of older respondents (aged 55+) feels significantly less informed than its younger counterparts about these issues.
The self-perceived level of information among respondents increases with their levels of education.
Managers, students, other white collar workers and those who are self employed feel the best informed about these issues while retired, unemployed people and manual workers feel the least informed.
Respondents’ place of residence has an influence on their subjective information levels; respondents in rural areas more frequently feel poorly informed about climate change than those living in large towns.
People who think that climate change is a very serious problem feel better informed about its different causes and consequences (59% and 60% versus 56% EU27 average ‘well informed’ for both aspects) than those who do not consider it to be a serious problem (54% and 55% versus 56% EU27 average ‘well informed’ for both aspects). Those who regard climate change as a fairly serious problem feel the least informed about all issues related to climate change (its causes, consequences and the ways to fight it; 48% on causes and consequences respectively versus 42% EU27 average ‘badly informed’ for both aspects and 50% versus 46% EU27 average ‘badly informed’ on the aspect of ways in which to fight climate change).
SP
EC
IAL E
UR
OB
AR
OM
ET
ER
31
3
E
uro
pean
s’ a
ttit
ud
es
tow
ard
s cl
imate
ch
an
ge
24
To
tal
"Well
info
rmed
"T
ota
l "B
ad
ly
info
rmed
"D
KT
ota
l "W
ell
info
rmed
"T
ota
l "B
ad
ly
info
rmed
"D
KT
ota
l "W
ell
in
form
ed
"To
tal
"Bad
ly
info
rmed
"D
K
EU
27
56%
42%
2%
56%
42%
2%
52%
46%
2%
Sex
Mal
e59%
39%
2%
59%
39%
2%
55%
43%
2%
Fem
ale
52%
46%
2%
53%
45%
2%
49%
48%
3%
Ag
e
15-2
456%
42%
2%
57%
41%
2%
52%
46%
2%
25-3
958%
40%
2%
58%
40%
2%
54%
43%
3%
40-5
459%
40%
1%
59%
40%
1%
54%
44%
2%
55 +
51%
47%
2%
52%
46%
2%
47%
50%
3%
Ed
uca
tion
(En
d o
f)
15-
41%
56%
3%
41%
57%
2%
38%
59%
3%
16-1
955%
43%
2%
55%
43%
2%
51%
47%
2%
20+
69%
30%
1%
70%
29%
1%
65%
34%
1%
Still
studyi
ng
65%
33%
2%
63%
34%
3%
57%
40%
3%
Left
-Rig
ht
scale
(1-4
) Le
ft62%
37%
1%
62%
37%
1%
57%
42%
1%
(5-6
) Cen
tre
60%
39%
1%
62%
37%
1%
58%
41%
1%
(7-1
0)
Rig
ht
56%
42%
2%
56%
42%
2%
53%
45%
2%
Sel
f-em
plo
yed
59%
39%
2%
59%
38%
3%
56%
41%
3%
Man
ager
s73%
26%
1%
72%
26%
2%
68%
31%
1%
Oth
er w
hite
colla
rs59%
39%
2%
60%
38%
2%
57%
41%
2%
Man
ual
work
ers
54%
44%
2%
55%
43%
2%
50%
48%
2%
House
per
sons
42%
56%
2%
44%
54%
2%
40%
57%
3%
Unem
plo
yed
48%
50%
2%
48%
51%
1%
46%
52%
2%
Ret
ired
51%
47%
2%
51%
47%
2%
47%
50%
3%
Stu
den
ts65%
33%
2%
63%
34%
3%
57%
40%
3%
Perc
ep
tion
of
clim
ate
ch
an
ge
A v
ery
serious
pro
ble
m59%
40%
1%
60%
39%
1%
55%
44%
1%
A f
airly
serious
pro
ble
m50%
48%
2%
50%
48%
2%
48%
50%
2%
Not
a se
rious
pro
ble
m54%
44%
2%
55%
43%
2%
52%
45%
3%
Pers
on
ally,
do
you
th
ink t
hat
yo
u a
re w
ell in
form
ed
or
no
t ab
ou
t…?
Resp
on
den
t o
ccu
pati
on
sca
le
Th
e d
iffe
ren
t co
nse
qu
en
ces
of
clim
ate
ch
an
ge
Ways
in w
hic
h w
e c
an
fig
ht
clim
ate
ch
an
ge
Th
e d
iffe
ren
t ca
use
s o
f cl
imate
ch
an
ge
SPECIAL EUROBAROMETER 313 Europeans’ attitudes towards climate change
25
3. Combating climate change
3.1 Attitudes towards climate change and ways of fighting it
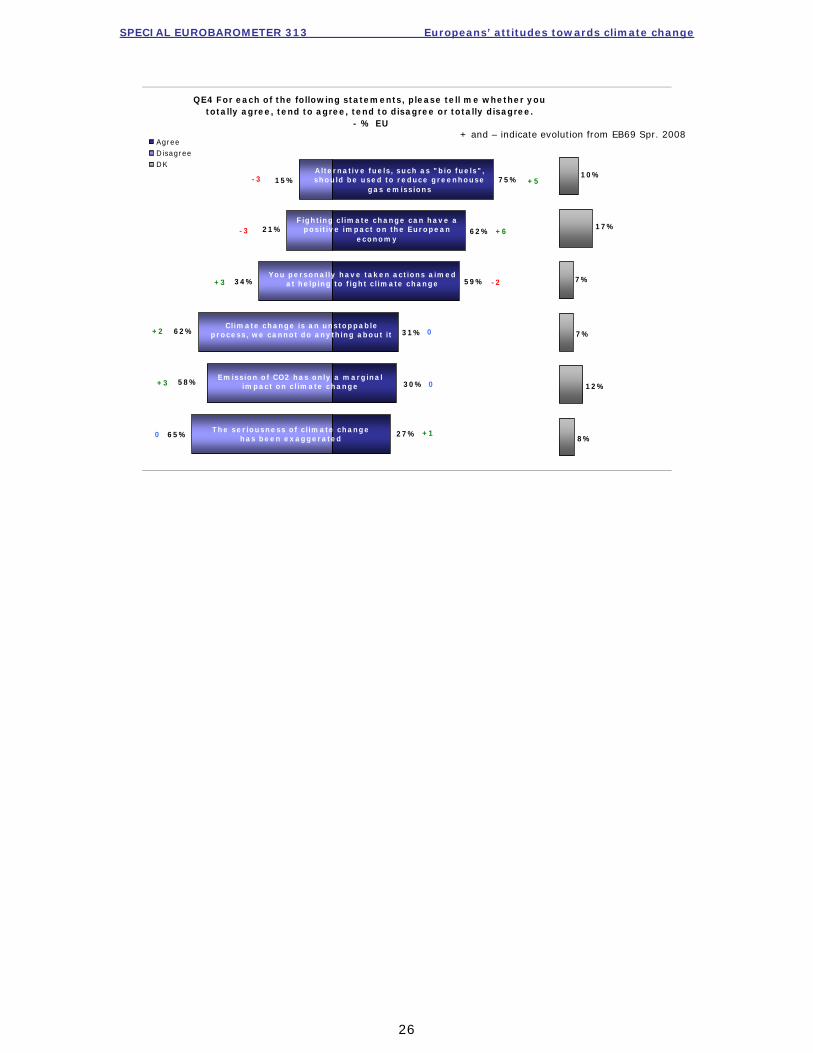
- Although climate change is seen as a serious problem, it can be solved - Respondents were invited to give their opinion on a number of statements linked to the problem of climate change.7 Their attitudes can be summarised as follows: the issue of climate change is serious but the process is not unstoppable. Whilst nearly two-thirds of Europeans (65%) do not think that the seriousness of climate change has been exaggerated, they are nevertheless predominantly optimistic and mostly disagree (58%) with the statement that the process of climate change is unstoppable. However, also just under a third (31%) are rather pessimistic and believe that climate change is an unstoppable process. On the seriousness of climate change, around a quarter (27%) of Europeans think that the seriousness of climate change has been exaggerated. According to a wide majority of Europeans (75%), alternative fuels should be used to reduce greenhouse gas emissions. Belief in alternative fuels has also increased significantly, from 70% in spring 2008. Another measurement showing an encouraging significant increase is the belief that fighting climate change can have a positive effect on the European economy (56% in spring 2008 to 62% in January-February 2009), which is remarkable in the light of the current economic downturn. The share of "don't know answers" is quite high at 17%. As far as the causes of climate change are concerned, the majority of citizens (62%) disagree with the statement that CO2 emissions have only a marginal impact on climate change. Turning to citizens’ personal contribution to the fight against climate change, we see that a clear majority (59%) confirm that they have taken some kind of action on this matter. However, compared to spring 2008, more people state they have not personally taken action aimed at helping to fight climate change (31% in spring 2008 to 34% in January-February 2009). The current economic and financial crisis impacting on the respondents’ lives may play a role in this regard.
7 QE4 For each of the following statements, please tell me whether you totally agree, tend to agree, tend to disagree or totally disagree…? Climate change is an unstoppable process, we cannot do anything about it; The seriousness of climate change has been exaggerated; Emission of CO2 (Carbon dioxide) has only a marginal impact on climate change; Fighting climate change can have a positive impact on the European economy; Alternative fuels, such as "bio fuels", should be used to reduce greenhouse gas emissions; You personally have taken actions aimed at helping to fight climate change
SPECIAL EUROBAROMETER 313 Europeans’ attitudes towards climate change
26
QE4 For each of the following statements, please tell me whether you totally agree, tend to agree, tend to disagree or totally disagree.
- % EU
75%
62%
59%
31%
30%
27%
15%
21%
34%
62%
58%
65%
AgreeDisagreeDK
Fighting climate change can have a positive impact on the European
economy
Alternative fuels, such as "bio fuels", should be used to reduce greenhouse
gas emissions
You personally have taken actions aimed at helping to fight climate change
Climate change is an unstoppable process, we cannot do anything about it
Emission of CO2 has only a marginal impact on climate change
The seriousness of climate change has been exaggerated 8%
12%
7%
7%
17%
10%+5
+6
-2
0
0
+1
-3
-3
+3
+2
+3
0
+ and – indicate evolution from EB69 Spr. 2008

SPECIAL EUROBAROMETER 313 Europeans’ attitudes towards climate change
27
3.1.1 Alternative fuels On average, three quarters of Europeans think that alternative fuels should be used to reduce greenhouse gases (75%), 15% disagree with this and 10% say that they do not know. The results at country level are relatively homogenous. Absolute majorities in all countries polled, in fact, agree with this (except for Turkey where 41% agree). The strongest belief in the usage of alternative fuels is found in Greece, Denmark, Slovenia and Slovakia, though in most other countries more than six in ten citizens also feel that fuels of this type should be used to reduce greenhouse gases. The greatest increases in the belief that alternative fuels should be used can be found in Germany (54% in spring 2008 to 68% in January-February 2009), with Bulgaria (72% to 82%) and Lithuania (75% to 84%) also posting large increases. On the other side of the spectrum, as mentioned, are Turkey and the Turkish Cypriot Community where 41% and 58% agree (respectively). However, it should be noted that a third or more of citizens in these two countries feel they are not familiar enough with the topic to give their opinion, as 41% in Turkey and 33% in the Turkish Cypriot Community give “don’t know” in reply to this question. A similar high level of unfamiliarity is found in Malta (33% “don’t know”). Malta and Turkey also show the greatest decrease in the belief in the usage of alternative fuels –64% of Maltese now agree that alternative fuels should be used (compared to 73% in spring 2008) though this is largely due to more Maltese not having an opinion. In Turkey though, belief in alternative fuels have declined from 50% to 41% due to more people disagreeing that alternative fuels should be used to reduce greenhouse gas emissions.
SPECIAL EUROBAROMETER 313 Europeans’ attitudes towards climate change
28
The analysis of the results by socio-demographic variables reveals:
Women are more likely than men not to have an opinion about the usage of alternative fuels to reduce greenhouse gas emissions as can be seen in higher “don’t know” levels. This leads to higher proportions of men both agreeing and disagreeing that such fuels should be used for this purpose.
Most inclined to agree that alternative fuels should be used to reduce
greenhouse gas emissions are respondents in the lowest two age groups (aged 15-39 years). Respondents who are 55 years and older are most inclined to disagree with this. They also, more frequently than respondents in other age groups, have no opinion regarding this topic.
Looking at education levels, those who completed their education at the age
of 15 years or younger are more likely to be unfamiliar with the topic (17% “don’t know”), and therefore least likely to “agree” that alternative fuels should be used to reduce greenhouse gas emissions. Although more than three-quarters of those who continued their studies to the age of 20 or beyond believe in alternative fuels (76%), they are also more likely to “disagree” that alternative fuels should be used to reduce greenhouse gas emissions (18%). This indicates how better-educated citizens are more likely to have an opinion on the matter.
For various employment categories it is noted that house persons and
retired citizens are more likely to be unfamiliar with the topic.
Respondents who feel informed about the causes and consequences of climate change and the ways to fight it are significantly more likely than those who feel poorly informed about these issues to agree with the statement. This is however clearly due to the much higher rate of “don’t know” replies among respondents in the latter group.
Those who think that climate change is a very serious problem are
considerably more likely to think that alternative fuels should be used to reduce greenhouse gas emissions than those who feel that climate change is not a serious problem.
SPECIAL EUROBAROMETER 313 Europeans’ attitudes towards climate change
29
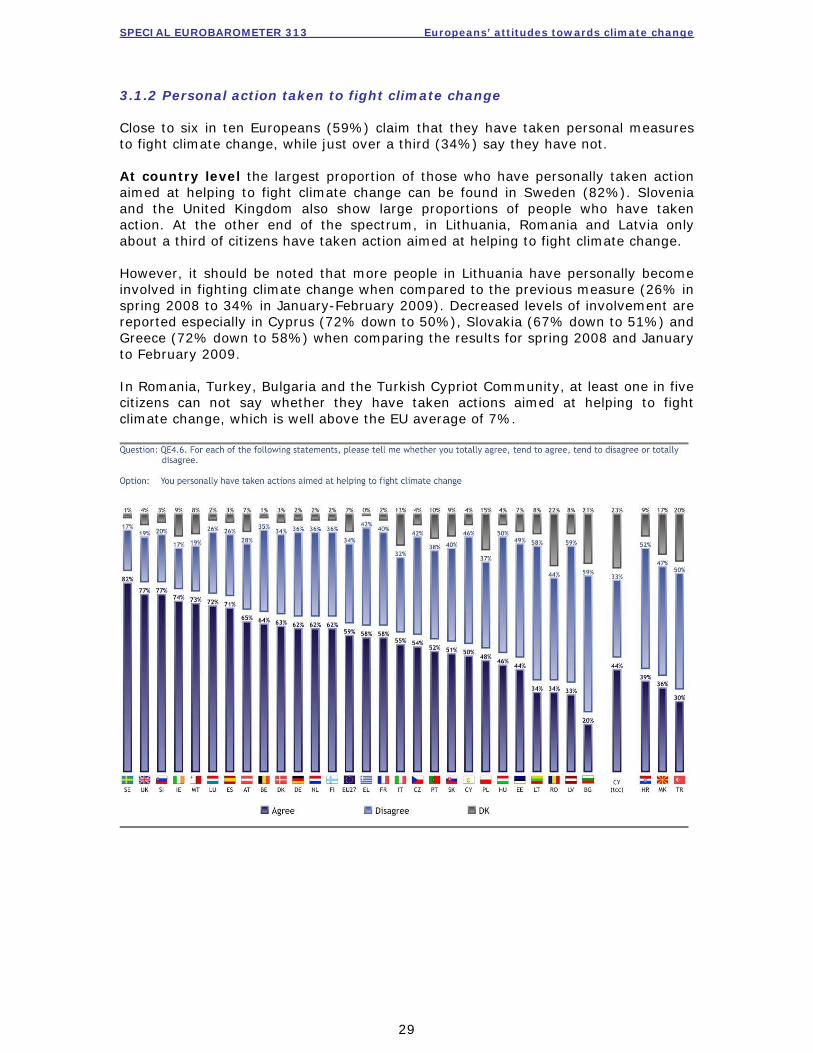
3.1.2 Personal action taken to fight climate change Close to six in ten Europeans (59%) claim that they have taken personal measures to fight climate change, while just over a third (34%) say they have not. At country level the largest proportion of those who have personally taken action aimed at helping to fight climate change can be found in Sweden (82%). Slovenia and the United Kingdom also show large proportions of people who have taken action. At the other end of the spectrum, in Lithuania, Romania and Latvia only about a third of citizens have taken action aimed at helping to fight climate change. However, it should be noted that more people in Lithuania have personally become involved in fighting climate change when compared to the previous measure (26% in spring 2008 to 34% in January-February 2009). Decreased levels of involvement are reported especially in Cyprus (72% down to 50%), Slovakia (67% down to 51%) and Greece (72% down to 58%) when comparing the results for spring 2008 and January to February 2009. In Romania, Turkey, Bulgaria and the Turkish Cypriot Community, at least one in five citizens can not say whether they have taken actions aimed at helping to fight climate change, which is well above the EU average of 7%.
SPECIAL EUROBAROMETER 313 Europeans’ attitudes towards climate change
30
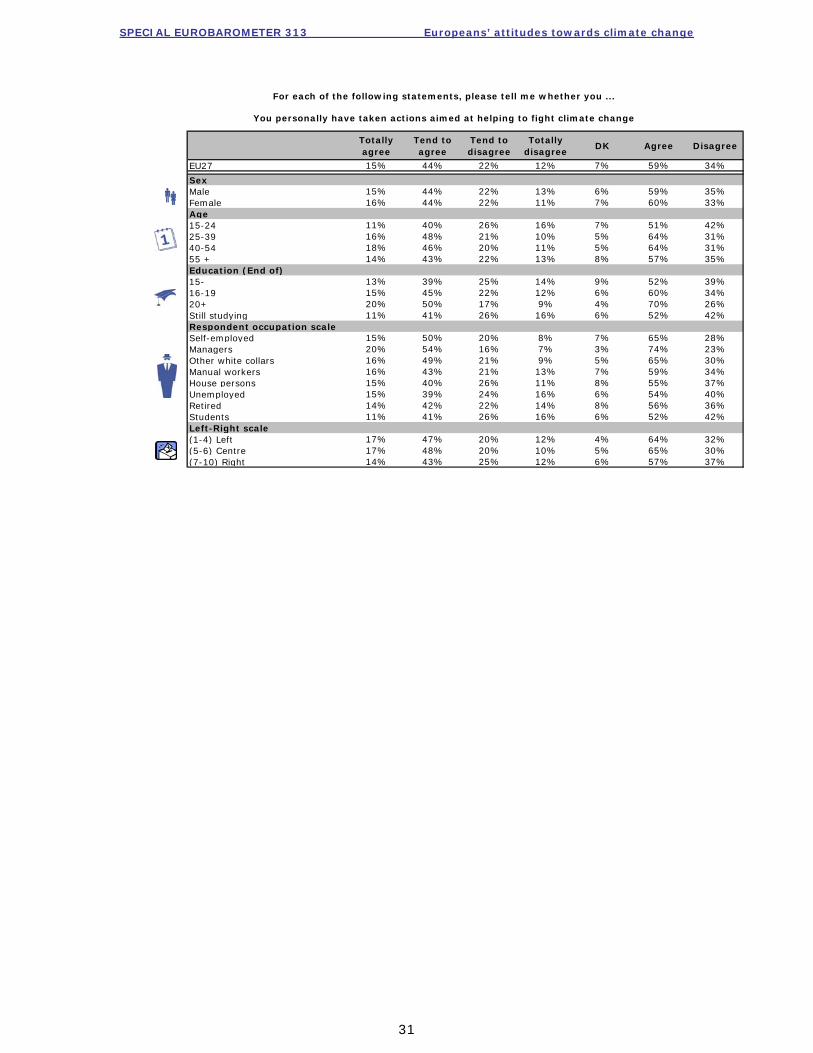
Analysis by socio-demographic variables reveals that:
An increase in respondents’ age increases the likelihood that they have taken personal action. The results for the highest age (age 55+) bracket, however, do not follow this pattern.
“Taking personal action” is significantly more common among respondents
with a longer education (ending at the age of 20+) than among those who ended their educational career at a relatively early age. Those who finished school at 15 or younger are much more inclined to give a “don’t know” reply than respondents in other educational categories.
Actions aimed at helping to fight climate change were more frequently taken
by respondents who position themselves to the left of the political scale than by those who describe themselves as politically “right-wing”.
Among occupational groups, managers most often confirm that they have
personally taken action aimed at helping to fight climate change. Students and unemployed people are most likely to disagree with this. Taking actions to fight climate change can be costly, and this may explain why the categories that act personally are those who have the higher standard of living.
“Taking action” to fight climate change is much more widespread among
respondents who feel well-informed about climate change (its causes, consequences and the ways to fight it) than among those who feel ill- informed about these issues.
Quite logically, those who think that climate change is a very serious
problem are considerably more likely to have taken personal action aimed at fighting climate change than those who do not think it is a serious problem.
SPECIAL EUROBAROMETER 313 Europeans’ attitudes towards climate change
31
Totally agree
Tend to agree
Tend to disagree
Totally disagree
DK Agree Disagree
EU27 15% 44% 22% 12% 7% 59% 34%
SexMale 15% 44% 22% 13% 6% 59% 35%Female 16% 44% 22% 11% 7% 60% 33%Age15-24 11% 40% 26% 16% 7% 51% 42%25-39 16% 48% 21% 10% 5% 64% 31%40-54 18% 46% 20% 11% 5% 64% 31%55 + 14% 43% 22% 13% 8% 57% 35%Education (End of)15- 13% 39% 25% 14% 9% 52% 39%16-19 15% 45% 22% 12% 6% 60% 34%20+ 20% 50% 17% 9% 4% 70% 26%Still studying 11% 41% 26% 16% 6% 52% 42%Respondent occupation scaleSelf-employed 15% 50% 20% 8% 7% 65% 28%Managers 20% 54% 16% 7% 3% 74% 23%Other white collars 16% 49% 21% 9% 5% 65% 30%Manual workers 16% 43% 21% 13% 7% 59% 34%House persons 15% 40% 26% 11% 8% 55% 37%Unemployed 15% 39% 24% 16% 6% 54% 40%Retired 14% 42% 22% 14% 8% 56% 36%Students 11% 41% 26% 16% 6% 52% 42%Left-Right scale(1-4) Left 17% 47% 20% 12% 4% 64% 32%(5-6) Centre 17% 48% 20% 10% 5% 65% 30%(7-10) Right 14% 43% 25% 12% 6% 57% 37%
You personally have taken actions aimed at helping to fight climate change
For each of the following statements, please tell me whether you ...
SPECIAL EUROBAROMETER 313 Europeans’ attitudes towards climate change
32
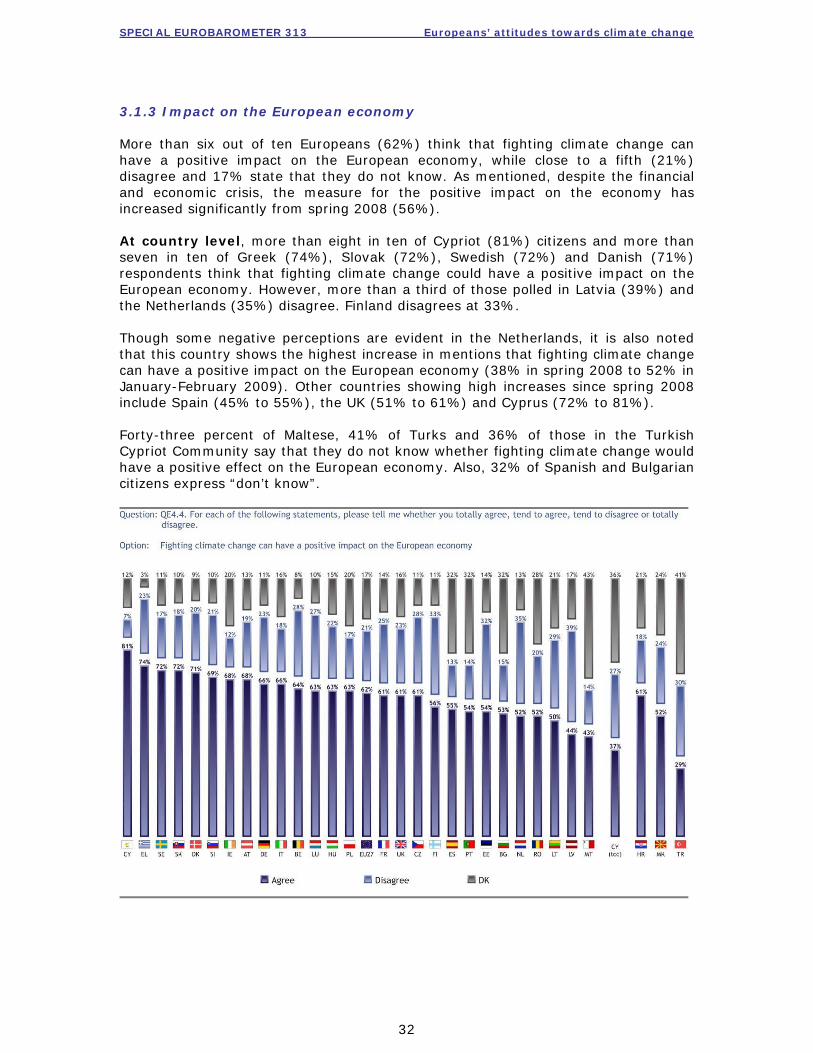
3.1.3 Impact on the European economy More than six out of ten Europeans (62%) think that fighting climate change can have a positive impact on the European economy, while close to a fifth (21%) disagree and 17% state that they do not know. As mentioned, despite the financial and economic crisis, the measure for the positive impact on the economy has increased significantly from spring 2008 (56%). At country level, more than eight in ten of Cypriot (81%) citizens and more than seven in ten of Greek (74%), Slovak (72%), Swedish (72%) and Danish (71%) respondents think that fighting climate change could have a positive impact on the European economy. However, more than a third of those polled in Latvia (39%) and the Netherlands (35%) disagree. Finland disagrees at 33%. Though some negative perceptions are evident in the Netherlands, it is also noted that this country shows the highest increase in mentions that fighting climate change can have a positive impact on the European economy (38% in spring 2008 to 52% in January-February 2009). Other countries showing high increases since spring 2008 include Spain (45% to 55%), the UK (51% to 61%) and Cyprus (72% to 81%). Forty-three percent of Maltese, 41% of Turks and 36% of those in the Turkish Cypriot Community say that they do not know whether fighting climate change would have a positive effect on the European economy. Also, 32% of Spanish and Bulgarian citizens express “don’t know”.
SPECIAL EUROBAROMETER 313 Europeans’ attitudes towards climate change
33
Looking at the influence of socio-demographic factors on respondents’ opinions, we see that:
Men are more likely than women to believe that fighting climate change can affect the European economy positively. Women are, also, less likely than men to have an opinion in this respect, seen in high “don’t know” levels.
Looking at the age groupings, older respondents (age 55+) are more likely
to have no opinion on this matter, with one in five (20%) stating they “don’t know”.
Agreement with the statement that fighting climate change has a positive effect on European economy rises along with respondents’ levels of education. This can partially be explained by the high “don’t know” rates among less educated people.
Respondents who classify themselves on the left-hand spectrum of the
political scale are more likely to agree than those on the right (67% vs. 62% respectively).
The highest level of agreement is found among managers. The variations in terms of occupational groupings are clearly linked to the strong differences in the proportions of “don’t know” replies between those groups.
This is also the case for respondents’ subjective level of information. Due
to significant differences in the proportions of "don't know” replies, those who feel well-informed about different aspects of climate change agree to a much stronger extent that the European economy would be affected positively by fighting climate change than those who do not feel well informed about those issues.
For a clear majority of those respondents who consider climate change a
very serious problem, fighting climate change can have a positive impact on the European economy (62%), compared to only 44% agreement among respondents who do not think that climate change is a serious problem.

SPECIAL EUROBAROMETER 313 Europeans’ attitudes towards climate change
34
Totally agree
Tend to agree
Tend to disagree
Totally disagree
DK Agree Disagree
EU27 17% 45% 16% 5% 17% 62% 21%
SexMale 19% 46% 17% 5% 13% 65% 22%Female 15% 45% 15% 5% 20% 60% 20%Age15-24 15% 46% 17% 5% 17% 61% 22%25-39 18% 45% 16% 5% 16% 63% 21%40-54 18% 45% 17% 6% 14% 63% 23%55 + 15% 45% 15% 5% 20% 60% 20%Education (End of)15- 14% 40% 15% 6% 25% 54% 21%16-19 16% 47% 16% 5% 16% 63% 21%20+ 22% 46% 17% 5% 10% 68% 22%Still studying 15% 47% 16% 5% 17% 62% 21%Respondent occupation scaleSelf-employed 20% 47% 15% 6% 12% 67% 21%Managers 21% 49% 18% 4% 8% 70% 22%Other white collars 17% 48% 16% 5% 14% 65% 21%Manual workers 15% 45% 18% 6% 16% 60% 24%House persons 13% 41% 14% 6% 26% 54% 20%Unemployed 19% 40% 17% 5% 19% 59% 22%Retired 15% 45% 15% 4% 21% 60% 19%Students 15% 47% 16% 5% 17% 62% 21%Left-Right scale(1-4) Left 20% 47% 16% 4% 13% 67% 20%(5-6) Centre 17% 47% 17% 5% 14% 64% 22%(7-10) Right 16% 46% 19% 6% 13% 62% 25%
Fighting climate change can have a positive impact on the European economy
For each of the following statements, please tell me whether you ...
SPECIAL EUROBAROMETER 313 Europeans’ attitudes towards climate change
35
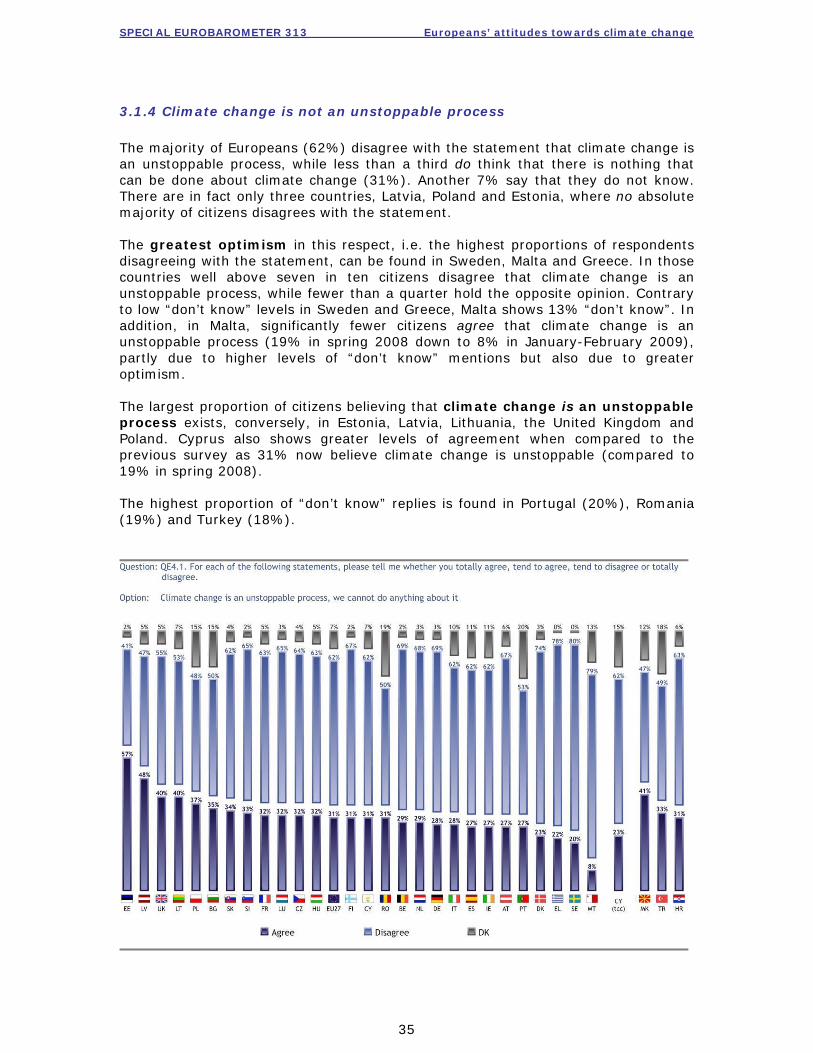
3.1.4 Climate change is not an unstoppable process The majority of Europeans (62%) disagree with the statement that climate change is an unstoppable process, while less than a third do think that there is nothing that can be done about climate change (31%). Another 7% say that they do not know. There are in fact only three countries, Latvia, Poland and Estonia, where no absolute majority of citizens disagrees with the statement. The greatest optimism in this respect, i.e. the highest proportions of respondents disagreeing with the statement, can be found in Sweden, Malta and Greece. In those countries well above seven in ten citizens disagree that climate change is an unstoppable process, while fewer than a quarter hold the opposite opinion. Contrary to low “don’t know” levels in Sweden and Greece, Malta shows 13% “don’t know”. In addition, in Malta, significantly fewer citizens agree that climate change is an unstoppable process (19% in spring 2008 down to 8% in January-February 2009), partly due to higher levels of “don’t know” mentions but also due to greater optimism. The largest proportion of citizens believing that climate change is an unstoppable process exists, conversely, in Estonia, Latvia, Lithuania, the United Kingdom and Poland. Cyprus also shows greater levels of agreement when compared to the previous survey as 31% now believe climate change is unstoppable (compared to 19% in spring 2008). The highest proportion of “don’t know” replies is found in Portugal (20%), Romania (19%) and Turkey (18%).
SPECIAL EUROBAROMETER 313 Europeans’ attitudes towards climate change
36
From a socio-demographic perspective, we see that:
Although the levels of disagreement are equal between the two genders,
females are more likely than males to not have an opinion on whether climate change is an unstoppable process.
Respondents in the oldest age group (age 55+) are less likely to feel that climate change can be stopped, compared to the other age groupings. This is due to them being more likely to agree that climate change is an unstoppable process (34%) and having no opinion on the matter (10%).
Levels of disagreement increase with respondents’ educational levels. On the other hand, rates of “don’t know” replies increase with lower educational levels.
Those on the left-hand side of the political spectrum are more likely to
disagree (65%) than those on the right (60%).
Retired and unemployed people most frequently think that climate change is an unstoppable process, while managers, students and other white collar workers are most likely to disagree with this.
Respondents who feel well-informed about the causes and consequences of
climate change and the ways to fight it more frequently disagree with the statement than those who do not feel well informed about these subjects. This can however be explained by the fact that the latter group much more frequently than the former gives a “don’t know” reply.
It is also interesting to observe that those who regard climate change as a
very serious problem seem much more inclined than those holding the opposite view to disagree that this phenomenon is an unstoppable process.
SPECIAL EUROBAROMETER 313 Europeans’ attitudes towards climate change
37
Totally agree
Tend to agree
Tend to disagree
Totally disagree
DK Agree Disagree
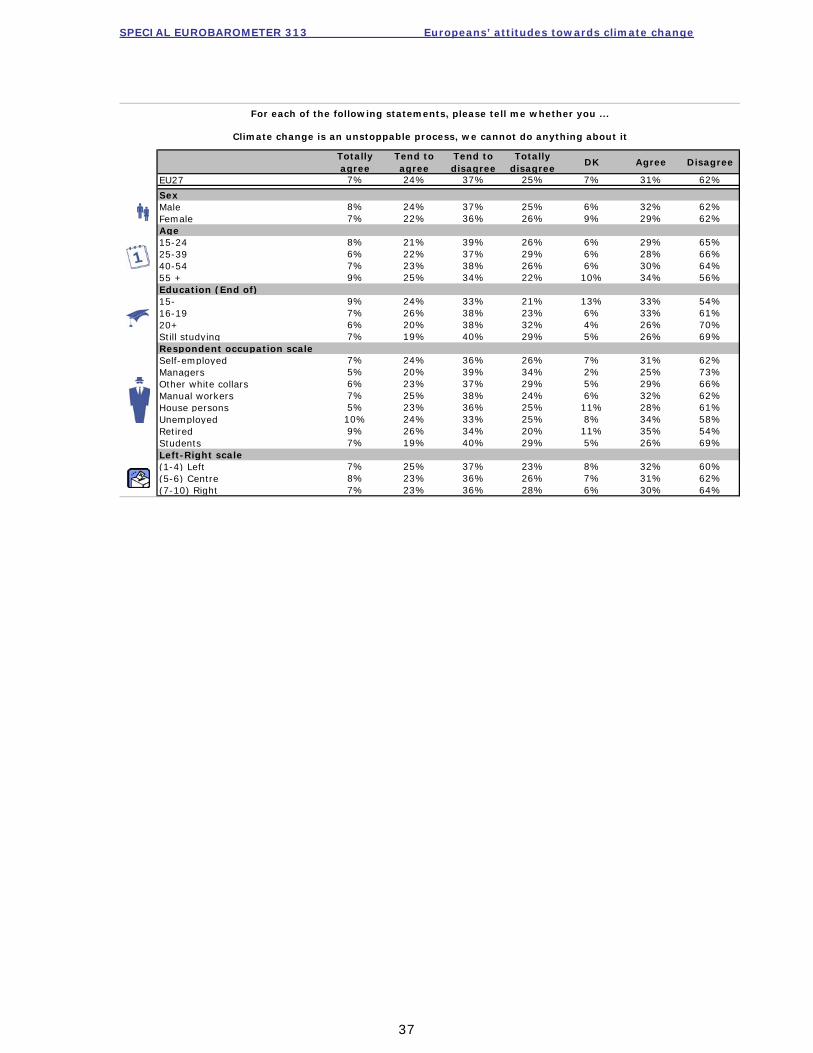
EU27 7% 24% 37% 25% 7% 31% 62%
SexMale 8% 24% 37% 25% 6% 32% 62%Female 7% 22% 36% 26% 9% 29% 62%Age15-24 8% 21% 39% 26% 6% 29% 65%25-39 6% 22% 37% 29% 6% 28% 66%40-54 7% 23% 38% 26% 6% 30% 64%55 + 9% 25% 34% 22% 10% 34% 56%Education (End of)15- 9% 24% 33% 21% 13% 33% 54%16-19 7% 26% 38% 23% 6% 33% 61%20+ 6% 20% 38% 32% 4% 26% 70%Still studying 7% 19% 40% 29% 5% 26% 69%Respondent occupation scaleSelf-employed 7% 24% 36% 26% 7% 31% 62%Managers 5% 20% 39% 34% 2% 25% 73%Other white collars 6% 23% 37% 29% 5% 29% 66%Manual workers 7% 25% 38% 24% 6% 32% 62%House persons 5% 23% 36% 25% 11% 28% 61%Unemployed 10% 24% 33% 25% 8% 34% 58%Retired 9% 26% 34% 20% 11% 35% 54%Students 7% 19% 40% 29% 5% 26% 69%Left-Right scale(1-4) Left 7% 25% 37% 23% 8% 32% 60%(5-6) Centre 8% 23% 36% 26% 7% 31% 62%(7-10) Right 7% 23% 36% 28% 6% 30% 64%
Climate change is an unstoppable process, we cannot do anything about it
For each of the following statements, please tell me whether you ...
SPECIAL EUROBAROMETER 313 Europeans’ attitudes towards climate change
38
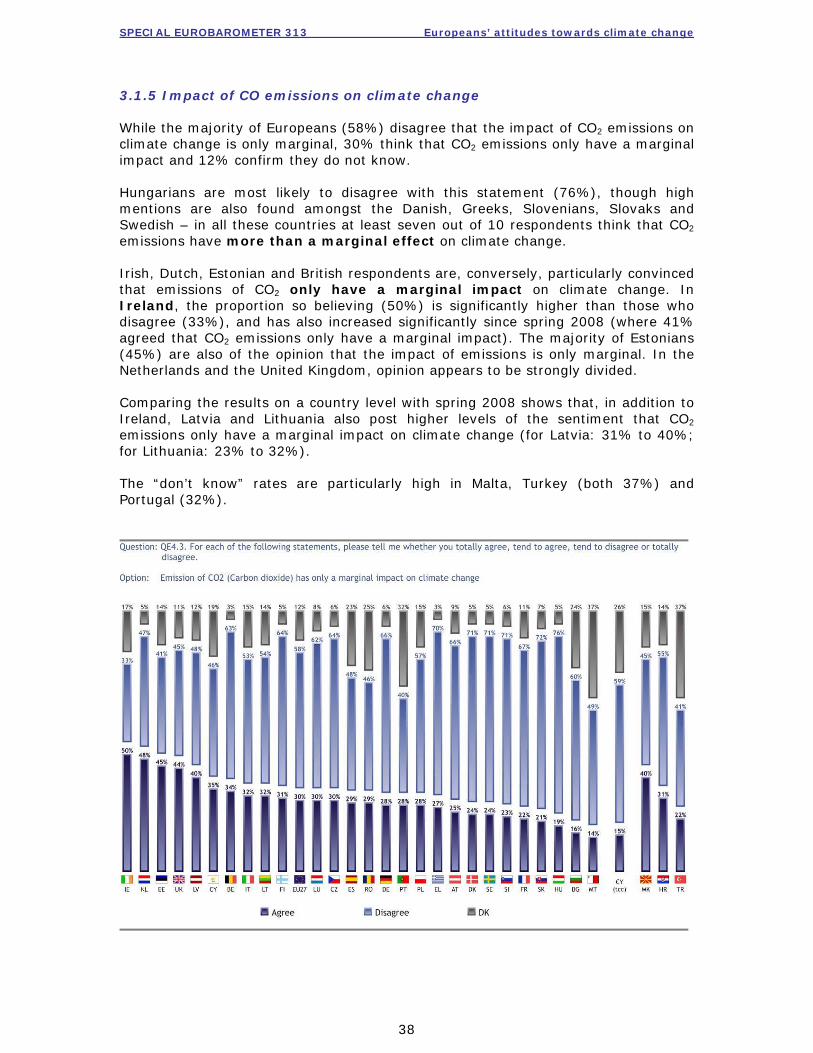
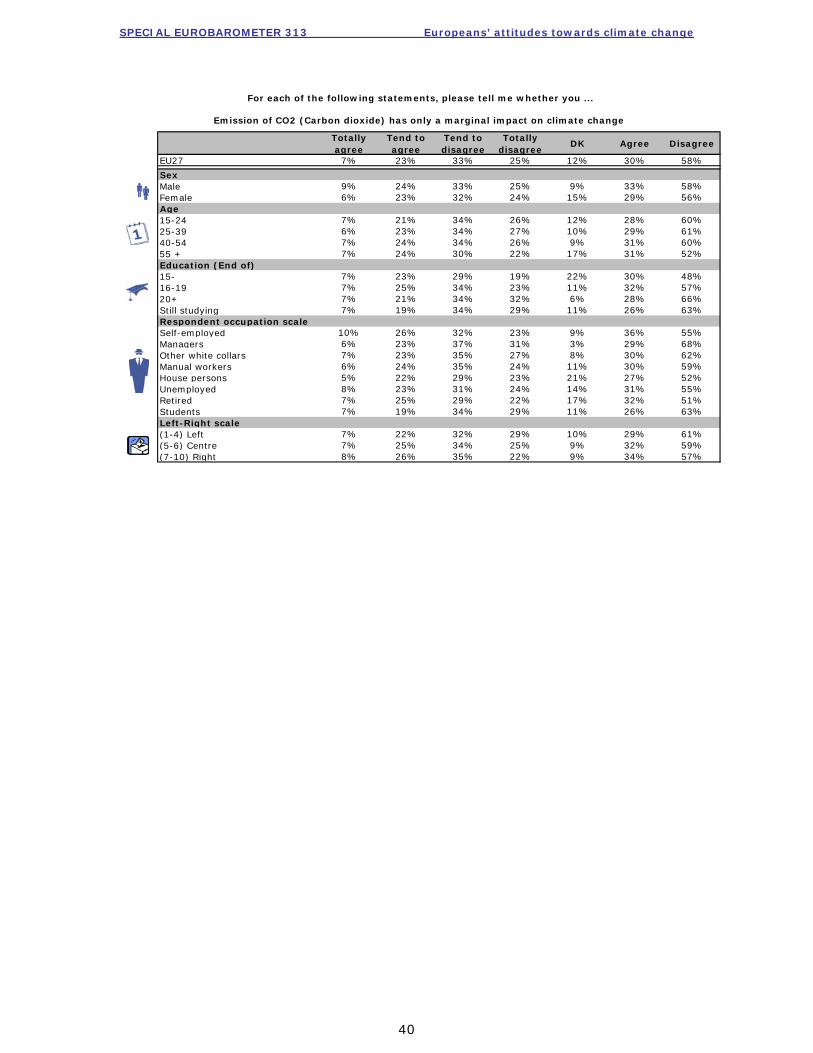
3.1.5 Impact of CO emissions on climate change While the majority of Europeans (58%) disagree that the impact of CO2 emissions on climate change is only marginal, 30% think that CO2 emissions only have a marginal impact and 12% confirm they do not know. Hungarians are most likely to disagree with this statement (76%), though high mentions are also found amongst the Danish, Greeks, Slovenians, Slovaks and Swedish – in all these countries at least seven out of 10 respondents think that CO2 emissions have more than a marginal effect on climate change. Irish, Dutch, Estonian and British respondents are, conversely, particularly convinced that emissions of CO2 only have a marginal impact on climate change. In Ireland, the proportion so believing (50%) is significantly higher than those who disagree (33%), and has also increased significantly since spring 2008 (where 41% agreed that CO2 emissions only have a marginal impact). The majority of Estonians (45%) are also of the opinion that the impact of emissions is only marginal. In the Netherlands and the United Kingdom, opinion appears to be strongly divided. Comparing the results on a country level with spring 2008 shows that, in addition to Ireland, Latvia and Lithuania also post higher levels of the sentiment that CO2 emissions only have a marginal impact on climate change (for Latvia: 31% to 40%; for Lithuania: 23% to 32%). The “don’t know” rates are particularly high in Malta, Turkey (both 37%) and Portugal (32%).
SPECIAL EUROBAROMETER 313 Europeans’ attitudes towards climate change
39
Analysis by socio-demographic variables shows that:
The level of agreement with the statement is higher among men than among women, i.e. men are particularly likely to think that CO2 emissions only have a marginal effect on climate change. “Don’t know” rates, however, are higher among women.
The oldest respondents (aged 55+) are not as likely as other respondents to
disagree with the statement that CO2 emissions only have a marginal impact on climate change. This can most probably be explained by the much higher proportions of “don’t know” replies in this age group.
The levels of disagreement increase with respondents’ levels of education.
This should also clearly be put in relation to the strongly increasing proportions of “don’t know” replies, when educational levels fall.
Those to the left of the political spectrum disagree more often than those
on the right that the impact of CO2 emissions on climate change is only marginal.
Managers form the occupational category most likely to disagree that CO2
emissions only have a marginal effect on climate change, with higher answers of “don’t know” amongst house persons and retired respondents.
Respondents who feel well-informed about the causes and consequences of
climate change and the ways to fight it tend to disagree with this more frequently than those who do not feel well informed about these subjects. It needs to be taken into account that the latter group more often give a “don’t know” reply than the former.
Those who consider climate change to be a very serious problem are
significantly more likely to disagree that the impact of CO2 emissions is only marginal, than those who think that climate change is not a serious problem.
SPECIAL EUROBAROMETER 313 Europeans’ attitudes towards climate change
40
Totally agree
Tend to agree
Tend to disagree
Totally disagree
DK Agree Disagree
EU27 7% 23% 33% 25% 12% 30% 58%
SexMale 9% 24% 33% 25% 9% 33% 58%Female 6% 23% 32% 24% 15% 29% 56%Age15-24 7% 21% 34% 26% 12% 28% 60%25-39 6% 23% 34% 27% 10% 29% 61%40-54 7% 24% 34% 26% 9% 31% 60%55 + 7% 24% 30% 22% 17% 31% 52%Education (End of)15- 7% 23% 29% 19% 22% 30% 48%16-19 7% 25% 34% 23% 11% 32% 57%20+ 7% 21% 34% 32% 6% 28% 66%Still studying 7% 19% 34% 29% 11% 26% 63%Respondent occupation scaleSelf-employed 10% 26% 32% 23% 9% 36% 55%Managers 6% 23% 37% 31% 3% 29% 68%Other white collars 7% 23% 35% 27% 8% 30% 62%Manual workers 6% 24% 35% 24% 11% 30% 59%House persons 5% 22% 29% 23% 21% 27% 52%Unemployed 8% 23% 31% 24% 14% 31% 55%Retired 7% 25% 29% 22% 17% 32% 51%Students 7% 19% 34% 29% 11% 26% 63%Left-Right scale(1-4) Left 7% 22% 32% 29% 10% 29% 61%(5-6) Centre 7% 25% 34% 25% 9% 32% 59%(7-10) Right 8% 26% 35% 22% 9% 34% 57%
Emission of CO2 (Carbon dioxide) has only a marginal impact on climate change
For each of the following statements, please tell me whether you ...
SPECIAL EUROBAROMETER 313 Europeans’ attitudes towards climate change
41
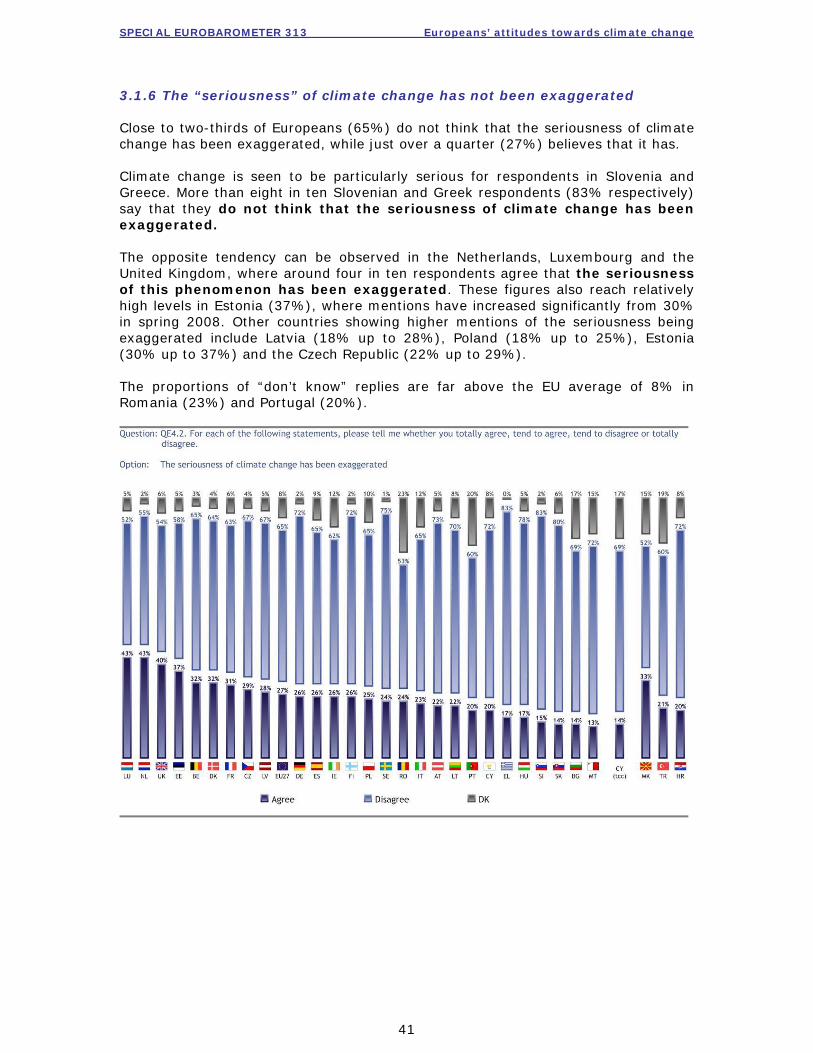
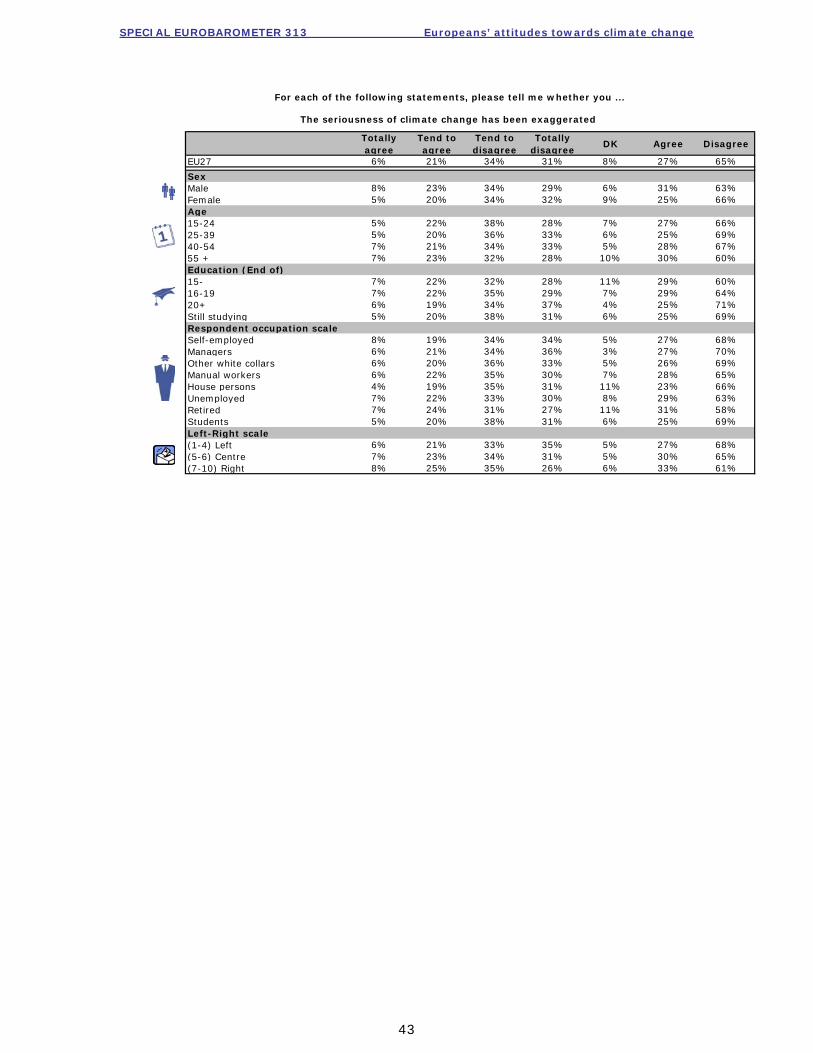
3.1.6 The “seriousness” of climate change has not been exaggerated Close to two-thirds of Europeans (65%) do not think that the seriousness of climate change has been exaggerated, while just over a quarter (27%) believes that it has. Climate change is seen to be particularly serious for respondents in Slovenia and Greece. More than eight in ten Slovenian and Greek respondents (83% respectively) say that they do not think that the seriousness of climate change has been exaggerated. The opposite tendency can be observed in the Netherlands, Luxembourg and the United Kingdom, where around four in ten respondents agree that the seriousness of this phenomenon has been exaggerated. These figures also reach relatively high levels in Estonia (37%), where mentions have increased significantly from 30% in spring 2008. Other countries showing higher mentions of the seriousness being exaggerated include Latvia (18% up to 28%), Poland (18% up to 25%), Estonia (30% up to 37%) and the Czech Republic (22% up to 29%). The proportions of “don’t know” replies are far above the EU average of 8% in Romania (23%) and Portugal (20%).
SPECIAL EUROBAROMETER 313 Europeans’ attitudes towards climate change
42
A socio-demographic breakdown reveals that:
Men, more often than women, think that the seriousness of climate change has been exaggerated.
Disagreement, furthermore, seems to be much more widespread among
respondents that ended their education at the age of 20 or later than among those who finished at a younger age. The share of “don’t know” replies is much bigger in the latter group than in the former.
Those who lean towards the right politically are considerably more likely to
believe that the seriousness of this issue has been exaggerated.
Those who feel well-informed about the causes and consequences of climate change and the ways to fight it are more likely to disagree, compared with those who do not feel well informed about these subjects, though this is due to a larger proportion of the latter having no opinion.
Respondents who consider climate change to be a very serious problem are
significantly more likely to disagree than those who believe that climate change is not a serious problem.
SPECIAL EUROBAROMETER 313 Europeans’ attitudes towards climate change
43
Totally agree
Tend to agree
Tend to disagree
Totally disagree
DK Agree Disagree
EU27 6% 21% 34% 31% 8% 27% 65%
SexMale 8% 23% 34% 29% 6% 31% 63%Female 5% 20% 34% 32% 9% 25% 66%Age15-24 5% 22% 38% 28% 7% 27% 66%25-39 5% 20% 36% 33% 6% 25% 69%40-54 7% 21% 34% 33% 5% 28% 67%55 + 7% 23% 32% 28% 10% 30% 60%Education (End of)15- 7% 22% 32% 28% 11% 29% 60%16-19 7% 22% 35% 29% 7% 29% 64%20+ 6% 19% 34% 37% 4% 25% 71%Still studying 5% 20% 38% 31% 6% 25% 69%Respondent occupation scaleSelf-employed 8% 19% 34% 34% 5% 27% 68%Managers 6% 21% 34% 36% 3% 27% 70%Other white collars 6% 20% 36% 33% 5% 26% 69%Manual workers 6% 22% 35% 30% 7% 28% 65%House persons 4% 19% 35% 31% 11% 23% 66%Unemployed 7% 22% 33% 30% 8% 29% 63%Retired 7% 24% 31% 27% 11% 31% 58%Students 5% 20% 38% 31% 6% 25% 69%Left-Right scale(1-4) Left 6% 21% 33% 35% 5% 27% 68%(5-6) Centre 7% 23% 34% 31% 5% 30% 65%(7-10) Right 8% 25% 35% 26% 6% 33% 61%
The seriousness of climate change has been exaggerated
For each of the following statements, please tell me whether you ...
SPECIAL EUROBAROMETER 313 Europeans’ attitudes towards climate change
44
Summarising the socio-demographic results In summary, we see that respondents with a longer education who feel well-informed about climate change (its causes, consequences and the ways of fighting it) or who consider this phenomenon to be a very serious problem are more inclined to believe that climate change is serious, that the process of it can be stopped, that alternative fuels should be used to fight it and that fighting climate change would impact the European economy positively than respondents who spent shorter time within education, rather feel ill-informed about the subject or do not think that climate change is a serious problem. Respondents representing the former groups are also more likely than those in the latter to have taken personal action against climate change or to know that CO2 emissions do not have a merely marginal impact on climate change.
SPECIAL EUROBAROMETER 313 Europeans’ attitudes towards climate change
45
CONCLUSION Climate change is still seen as one of the top three most serious problems facing the world today, though the seriousness of this issue (as with many other world problems) has declined in the face of the economic downturn, which dominates public opinion (and perceived concerns). Still, over two-thirds of Europeans feel that climate change is a very serious problem, and that the seriousness of climate change has not been exaggerated. However, Europeans feel that climate change can be stopped and the proportion of those thinking that fighting it can have a positive impact on the economy has increased. Undoubtedly, the fact that most Europeans feel well informed about climate change, its consequences, causes and ways of combating it assists in enabling people to join in the fight. Nevertheless, when asked at taking action a personal level, the proportion of Europeans that claim to personally act to fight climate change has decreased since spring 2008. It is important, however, to note the variances in responses at a country level, especially in light of the fact that to effectively combat climate change a collective effort is required. To this end a trend is noted in Turkey, Romania, Bulgaria and Lithuania – in these countries, specifically, citizens admit to not being well informed about the causes, consequences and ways of combating climate change. This then leads to citizens from these countries either not personally taking action against climate change, or not being able to say whether they are taking any action.. In addition, several countries show a lack of familiarity (through higher “don’t know” levels) regarding the consequences and outcomes regarding climate change, when probed on specifics. For example, Turkey shows high levels of unfamiliarity with climate change’s impact on the European economy, the efficacy of using alternative fuels, whether climate change can be stopped and the impact of CO2 emissions. Malta, the Turkish Cypriot Community, Romania and Portugal also show above average levels of unfamiliarity with more than one of these aspects. On the other side of the spectrum, Sweden, Slovenia, the United Kingdom and Ireland are countries where an above average number of citizens are both well informed about climate change, and personally take action to fight climate change. In Ireland and Slovenia the proportions of citizens who feel well informed about the causes, consequences and ways to fight climate change have increased since spring 2008. Looking further at the perceptions and attitudes regarding climate change, respondents in Sweden, Greece, Denmark and Slovakia state that CO2 emissions have a significant impact on climate change. In addition, all these countries feel that the seriousness of climate change has not been exaggerated, though the process of climate change can be stopped.
SPECIAL EUROBAROMETER 313 Europeans’ attitudes towards climate change
46
The Netherlands and the United Kingdom differ from this trend – although they, like the countries mentioned above, feel well informed about climate change, more than four in ten citizens in these countries say that the seriousness of climate change has been exaggerated and CO2 emissions have only a marginal impact on climate change. Hence, there is greater division of opinion in these two countries, which leads to only around half of citizens in the United Kingdom and Netherlands classifying climate change as a “very serious” problem (significantly lower than the European average). In socio-demographic terms, women, those with a shorter education, and older citizens (aged 55+) feel the least informed about climate change. In general, there is a positive correlation between the perceived level of knowledge about climate change, and the perceived seriousness of the issue. It can be concluded that, despite the economic and financial crisis, concerns about climate change have retained their “position” in the public’s mind. Whilst considerable country variations are noted, there is a positive base of informed and active citizens in the fight against climate change.
SPECIAL EUROBAROMETER 313 Europeans’ attitudes towards climate change
47
TECHNICAL SPECIFICATIONS Between the 16th of January and the 22nd of February 2009, TNS Opinion & Social, a consortium created between Taylor Nelson Sofres and EOS Gallup Europe, carried out wave 71.1 of the EUROBAROMETER, on request of the EUROPEAN COMMISSION, Directorate-General for Communication, “Research and Political Analysis” and the EUROPEAN PARLIAMENT. The SPECIAL EUROBAROMETER N°313 is part of wave 71.1 and covers the population of the respective nationalities of the European Union Member States, resident in each of the Member States and aged 15 years and over. The SPECIAL EUROBAROMETER N°313 has also been conducted in the three candidate countries (Croatia, Turkey and the Former Yugoslav Republic of Macedonia) and in the Turkish Cypriot Community. In these countries, the survey covers the national population of citizens and the population of citizens of all the European Union Member States that are residents in these countries and have a sufficient command of the national languages to answer the questionnaire. The basic sample design applied in all states is a multi-stage, random (probability) one. In each country, a number of sampling points was drawn with probability proportional to population size (for a total coverage of the country) and to population density. In order to do so, the sampling points were drawn systematically from each of the "administrative regional units", after stratification by individual unit and type of area. They thus represent the whole territory of the countries surveyed according to the EUROSTAT NUTS II (or equivalent) and according to the distribution of the resident population of the respective nationalities in terms of metropolitan, urban and rural areas. In each of the selected sampling points, a starting address was drawn, at random. Further addresses (every Nth address) were selected by standard "random route" procedures, from the initial address. In each household, the respondent was drawn, at random (following the "closest birthday rule"). All interviews were conducted face-to-face in people's homes and in the appropriate national language. As far as the data capture is concerned, CAPI (Computer Assisted Personal Interview) was used in those countries where this technique was available.
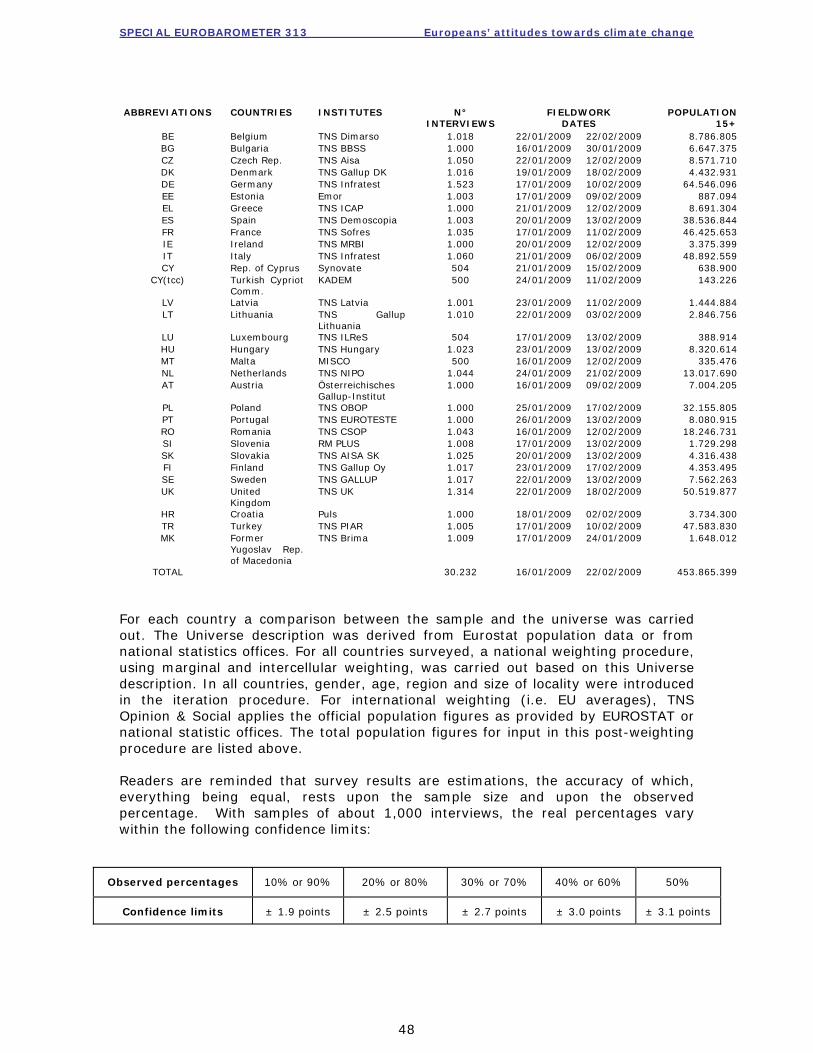
SPECIAL EUROBAROMETER 313 Europeans’ attitudes towards climate change
48
For each country a comparison between the sample and the universe was carried out. The Universe description was derived from Eurostat population data or from national statistics offices. For all countries surveyed, a national weighting procedure, using marginal and intercellular weighting, was carried out based on this Universe description. In all countries, gender, age, region and size of locality were introduced in the iteration procedure. For international weighting (i.e. EU averages), TNS Opinion & Social applies the official population figures as provided by EUROSTAT or national statistic offices. The total population figures for input in this post-weighting procedure are listed above. Readers are reminded that survey results are estimations, the accuracy of which, everything being equal, rests upon the sample size and upon the observed percentage. With samples of about 1,000 interviews, the real percentages vary within the following confidence limits:
Observed percentages 10% or 90% 20% or 80% 30% or 70% 40% or 60% 50%
Confidence limits ± 1.9 points ± 2.5 points ± 2.7 points ± 3.0 points ± 3.1 points
ABBREVIATIONS COUNTRIES INSTITUTES N° INTERVIEWS
FIELDWORK DATES
POPULATION 15+
BE Belgium TNS Dimarso 1.018 22/01/2009 22/02/2009 8.786.805 BG Bulgaria TNS BBSS 1.000 16/01/2009 30/01/2009 6.647.375 CZ Czech Rep. TNS Aisa 1.050 22/01/2009 12/02/2009 8.571.710 DK Denmark TNS Gallup DK 1.016 19/01/2009 18/02/2009 4.432.931 DE Germany TNS Infratest 1.523 17/01/2009 10/02/2009 64.546.096 EE Estonia Emor 1.003 17/01/2009 09/02/2009 887.094 EL Greece TNS ICAP 1.000 21/01/2009 12/02/2009 8.691.304 ES Spain TNS Demoscopia 1.003 20/01/2009 13/02/2009 38.536.844 FR France TNS Sofres 1.035 17/01/2009 11/02/2009 46.425.653 IE Ireland TNS MRBI 1.000 20/01/2009 12/02/2009 3.375.399 IT Italy TNS Infratest 1.060 21/01/2009 06/02/2009 48.892.559 CY Rep. of Cyprus Synovate 504 21/01/2009 15/02/2009 638.900
CY(tcc) Turkish Cypriot Comm.
KADEM 500 24/01/2009 11/02/2009 143.226
LV Latvia TNS Latvia 1.001 23/01/2009 11/02/2009 1.444.884 LT Lithuania TNS Gallup
Lithuania 1.010 22/01/2009 03/02/2009 2.846.756
LU Luxembourg TNS ILReS 504 17/01/2009 13/02/2009 388.914 HU Hungary TNS Hungary 1.023 23/01/2009 13/02/2009 8.320.614 MT Malta MISCO 500 16/01/2009 12/02/2009 335.476 NL Netherlands TNS NIPO 1.044 24/01/2009 21/02/2009 13.017.690 AT Austria Österreichisches
Gallup-Institut 1.000 16/01/2009 09/02/2009 7.004.205
PL Poland TNS OBOP 1.000 25/01/2009 17/02/2009 32.155.805 PT Portugal TNS EUROTESTE 1.000 26/01/2009 13/02/2009 8.080.915 RO Romania TNS CSOP 1.043 16/01/2009 12/02/2009 18.246.731 SI Slovenia RM PLUS 1.008 17/01/2009 13/02/2009 1.729.298 SK Slovakia TNS AISA SK 1.025 20/01/2009 13/02/2009 4.316.438 FI Finland TNS Gallup Oy 1.017 23/01/2009 17/02/2009 4.353.495 SE Sweden TNS GALLUP 1.017 22/01/2009 13/02/2009 7.562.263 UK United
Kingdom TNS UK 1.314 22/01/2009 18/02/2009 50.519.877
HR Croatia Puls 1.000 18/01/2009 02/02/2009 3.734.300 TR Turkey TNS PIAR 1.005 17/01/2009 10/02/2009 47.583.830 MK Former
Yugoslav Rep. of Macedonia
TNS Brima 1.009 17/01/2009 24/01/2009 1.648.012
TOTAL 30.232 16/01/2009 22/02/2009 453.865.399

SPECIAL EUROBAROMETER 313 Europeans’ attitudes towards climate change
49
QUESTIONNAIRE
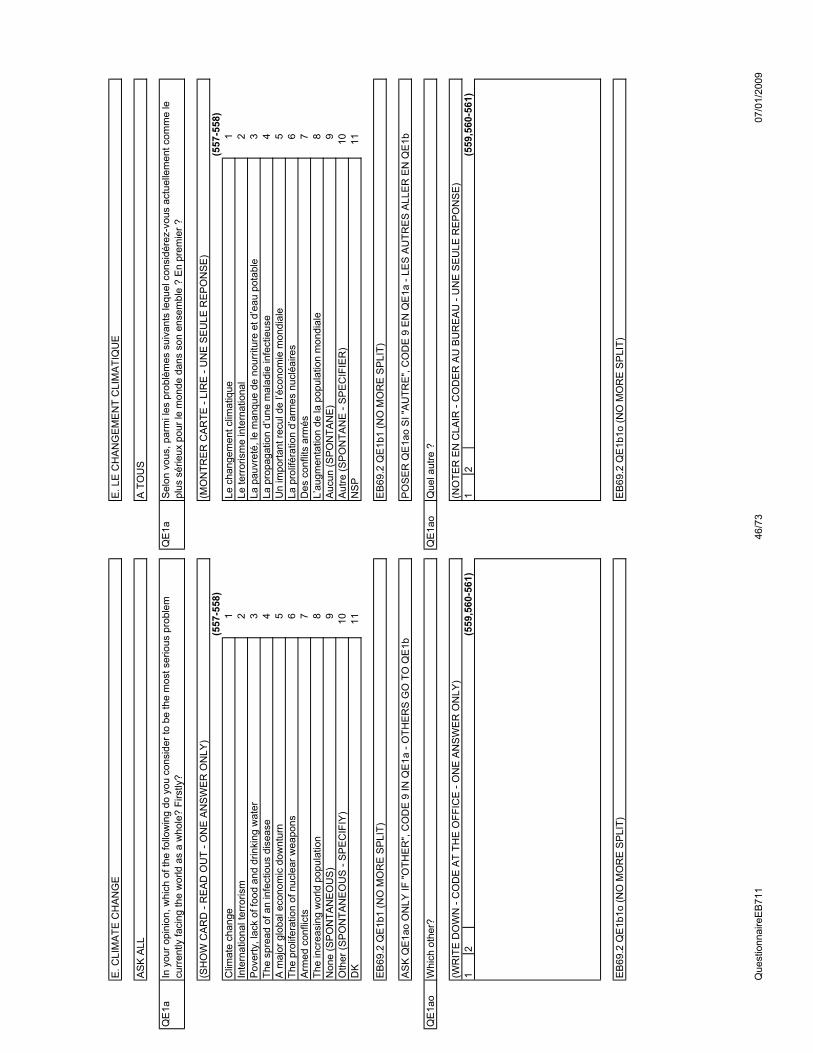
QE
1aQ
E1a
(557-558)
(557-558)
11
22
33
44
55
66
77
88
99
1010
1111
QE
1ao
QE
1ao
12
(559,560-561)
12
(559,560-561)
Que
l aut
re ?
(NO
TER
EN
CLA
IR -
CO
DE
R A
U B
UR
EA
U -
UN
E S
EU
LE R
EP
ON
SE
)
EB
69.2
QE
1b1o
(NO
MO
RE
SP
LIT)
Aut
re (S
PO
NTA
NE
- S
PE
CIF
IER
)N
SP
EB
69.2
QE
1b1
(NO
MO
RE
SP
LIT)
PO
SE
R Q
E1a
o S
I "A
UTR
E",
CO
DE
9 E
N Q
E1a
- LE
S A
UTR
ES
ALL
ER
EN
QE
1b
La p
rolif
érat
ion
d’ar
mes
nuc
léai
res
Des
con
flits
arm
ésL’
augm
enta
tion
de la
pop
ulat
ion
mon
dial
eA
ucun
(SP
ON
TAN
E)
Le te
rror
ism
e in
tern
atio
nal
La p
auvr
eté,
le m
anqu
e de
nou
rritu
re e
t d’e
au p
otab
leLa
pro
paga
tion
d’un
e m
alad
ie in
fect
ieus
eU
n im
porta
nt re
cul d
e l’é
cono
mie
mon
dial
e
A T
OU
S
Sel
on v
ous,
par
mi l
es p
robl
èmes
sui
vant
s le
quel
con
sidé
rez-
vous
act
uelle
men
t com
me
le
plus
sér
ieux
pou
r le
mon
de d
ans
son
ense
mbl
e ?
En
prem
ier ?
(MO
NTR
ER
CA
RTE
- LI
RE
- U
NE
SE
ULE
RE
PO
NS
E)
Le c
hang
emen
t clim
atiq
ue
E. L
E C
HA
NG
EM
EN
T C
LIM
ATI
QU
E
Whi
ch o
ther
?
(WR
ITE
DO
WN
- C
OD
E A
T TH
E O
FFIC
E -
ON
E A
NS
WE
R O
NLY
)
EB
69.2
QE
1b1o
(NO
MO
RE
SP
LIT)
Oth
er (S
PO
NTA
NE
OU
S -
SP
EC
IFIY
)D
K
EB
69.2
QE
1b1
(NO
MO
RE
SP
LIT)
AS
K Q
E1a
o O
NLY
IF "O
THE
R",
CO
DE
9 IN
QE
1a -
OTH
ER
S G
O T
O Q
E1b
The
prol
ifera
tion
of n
ucle
ar w
eapo
nsA
rmed
con
flict
sTh
e in
crea
sing
wor
ld p
opul
atio
nN
one
(SP
ON
TAN
EO
US
)
Inte
rnat
iona
l ter
roris
mP
over
ty, l
ack
of fo
od a
nd d
rinki
ng w
ater
The
spre
ad o
f an
infe
ctio
us d
isea
se
A m
ajor
glo
bal e
cono
mic
dow
ntur
n
AS
K A
LL
In y
our o
pini
on, w
hich
of t
he fo
llow
ing
do y
ou c
onsi
der t
o be
the
mos
t ser
ious
pro
blem
cu
rren
tly fa
cing
the
wor
ld a
s a
who
le?
Firs
tly?
(SH
OW
CA
RD
- R
EA
D O
UT
- ON
E A
NS
WE
R O
NLY
)
Clim
ate
chan
ge
E. C
LIM
ATE
CH
AN
GE
Que
stio
nnai
reE
B71
146
/73
07/0
1/20
09
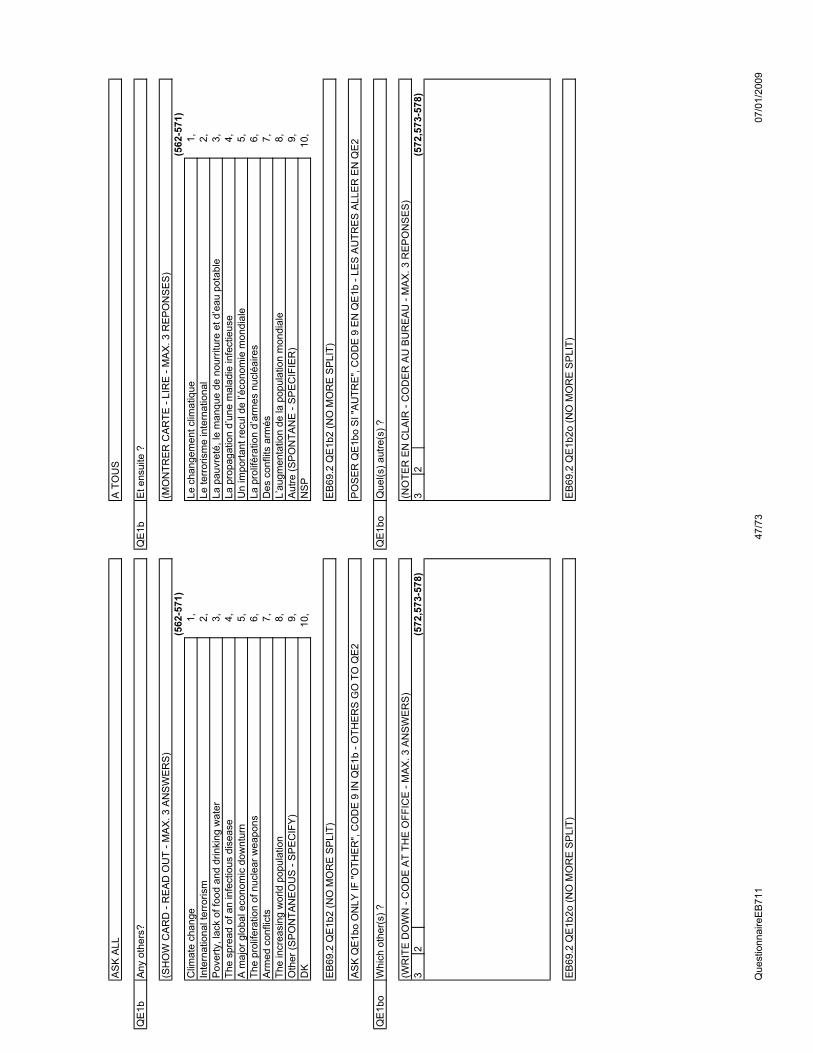
QE
1bQ
E1b
(562-571)
(562-571)
1,1,
2,2,
3,3,
4,4,
5,5,
6,6,
7,7,
8,8,
9,9,
10,
10,
QE
1bo
QE
1bo
32
(572,573-578)
32
(572,573-578)
(NO
TER
EN
CLA
IR -
CO
DE
R A
U B
UR
EA
U -
MA
X. 3
RE
PO
NS
ES
)
EB
69.2
QE
1b2o
(NO
MO
RE
SP
LIT)
NS
P
EB
69.2
QE
1b2
(NO
MO
RE
SP
LIT)
PO
SE
R Q
E1b
o S
I "A
UTR
E",
CO
DE
9 E
N Q
E1b
- LE
S A
UTR
ES
ALL
ER
EN
QE
2
Que
l(s) a
utre
(s) ?
La p
rolif
érat
ion
d’ar
mes
nuc
léai
res
Des
con
flits
arm
ésL’
augm
enta
tion
de la
pop
ulat
ion
mon
dial
eA
utre
(SP
ON
TAN
E -
SP
EC
IFIE
R)
Le te
rror
ism
e in
tern
atio
nal
La p
auvr
eté,
le m
anqu
e de
nou
rritu
re e
t d’e
au p
otab
leLa
pro
paga
tion
d’un
e m
alad
ie in
fect
ieus
eU
n im
porta
nt re
cul d
e l’é
cono
mie
mon
dial
e
A T
OU
S
Et e
nsui
te ?
(MO
NTR
ER
CA
RTE
- LI
RE
- M
AX
. 3 R
EP
ON
SE
S)
Le c
hang
emen
t clim
atiq
ue
(WR
ITE
DO
WN
- C
OD
E A
T TH
E O
FFIC
E -
MA
X. 3
AN
SW
ER
S)
EB
69.2
QE
1b2o
(NO
MO
RE
SP
LIT)
DK
EB
69.2
QE
1b2
(NO
MO
RE
SP
LIT)
AS
K Q
E1b
o O
NLY
IF "O
THE
R",
CO
DE
9 IN
QE
1b -
OTH
ER
S G
O T
O Q
E2
Whi
ch o
ther
(s) ?
The
prol
ifera
tion
of n
ucle
ar w
eapo
nsA
rmed
con
flict
sTh
e in
crea
sing
wor
ld p
opul
atio
nO
ther
(SP
ON
TAN
EO
US
- S
PE
CIF
Y)
Inte
rnat
iona
l ter
roris
mP
over
ty, l
ack
of fo
od a
nd d
rinki
ng w
ater
The
spre
ad o
f an
infe
ctio
us d
isea
se
A m
ajor
glo
bal e
cono
mic
dow
ntur
n
AS
K A
LL
Any
oth
ers?
(SH
OW
CA
RD
- R
EA
D O
UT
- MA
X. 3
AN
SW
ER
S)
Clim
ate
chan
ge
Que
stio
nnai
reE
B71
147
/73
07/0
1/20
09

QE
2Q
E2
(579-580)
(579-580)
1 Not
at
all
a se
rio us
prob
lem
23
45
67
89
10 A
pr
obl
em
extre
mel
y se
rio us
1 Pas
un
pr
obl
ème
série ux
du
tout
23
45
67
89
10
Un
prob
lèm
e ex
trêm
em ent
série ux
12
34
56
78
910
12
34
56
78
910
1111
QE
3Q
E3
(581)
1(581)
1
(582)
2
(582)
2
(583)
3
(583)
34
5
EB
69.2
QE
3
Les
man
ière
s do
nt n
ous
pouv
ons
lutte
r con
tre le
ch
ange
men
t clim
atiq
ue
12
3
45
Les
diffé
rent
es
cons
éque
nces
du
chan
gem
ent c
limat
ique
12
34
5
Les
diffé
rent
es c
ause
s du
ch
ange
men
t clim
atiq
ue
12
3
Per
sonn
elle
men
t, pe
nsez
-vou
s qu
e vo
us ê
tes
bien
info
rmé(
e) o
u pa
s bi
en in
form
é(e)
sur
… ?
(MO
NTR
ER
CA
RTE
AV
EC
EC
HE
LLE
- U
NE
RE
PO
NS
E P
AR
LIG
NE
)
(LIR
E -
RO
TATI
ON
)Tr
ès b
ien
info
rmé(
e)P
lutô
t bie
n in
form
é(e)
Pas
très
bi
en
info
rmé(
e)
Pas
du
tout
in
form
é(e)
NS
P
Et d
ans
quel
le m
esur
e pe
nsez
-vou
s qu
e le
cha
ngem
ent c
limat
ique
est
un
prob
lèm
e sé
rieux
ac
tuel
lem
ent ?
Util
isez
s'il
vous
pla
ît ce
tte é
chel
le d
e 1
à 10
où
'1' s
igni
fie q
ue c
e n’
est "
pas
du to
ut u
n pr
oblè
me
série
ux" e
t '10
' que
c’e
st "u
n pr
oblè
me
extrê
mem
ent s
érie
ux".
(MO
NTR
ER
CA
RTE
- U
NE
SE
ULE
RE
PO
NS
E)
NS
P
EB
69.2
QE
2b (N
O M
OR
E S
PLI
T)
A T
OU
S
45
EB
69.2
QE
3
Way
s in
whi
ch w
e ca
n fig
ht
clim
ate
chan
ge1
23
45
The
diffe
rent
con
sequ
ence
s of
clim
ate
chan
ge
12
34
5
The
diffe
rent
cau
ses
of
clim
ate
chan
ge
12
3
Per
sona
lly, d
o yo
u th
ink
that
you
are
wel
l inf
orm
ed o
r not
abo
ut…
?
(SH
OW
CA
RD
WIT
H S
CA
LE -
ON
E A
NS
WE
R P
ER
LIN
E)
(RE
AD
OU
T - R
OTA
TE)
Ver
y w
ell
info
rmed
Fa
irly
wel
l in
form
edN
ot v
ery
wel
l in
form
ed
Not
at a
ll in
form
edD
K
And
how
ser
ious
a p
robl
em d
o yo
u th
ink
clim
ate
chan
ge is
at t
his
mom
ent?
Ple
ase
use
a sc
ale
from
1 to
10,
'1' w
ould
mea
n th
at it
is "n
ot a
t all
a se
rious
pro
blem
" and
'10'
wou
ld m
ean
that
it is
a p
robl
em e
xtre
mel
y se
rious
".
(SH
OW
CA
RD
- O
NE
AN
SW
ER
ON
LY)
DK
EB
69.2
QE
2b (N
O M
OR
E S
PLI
T)
AS
K A
LL
Que
stio
nnai
reE
B71
148
/73
07/0
1/20
09
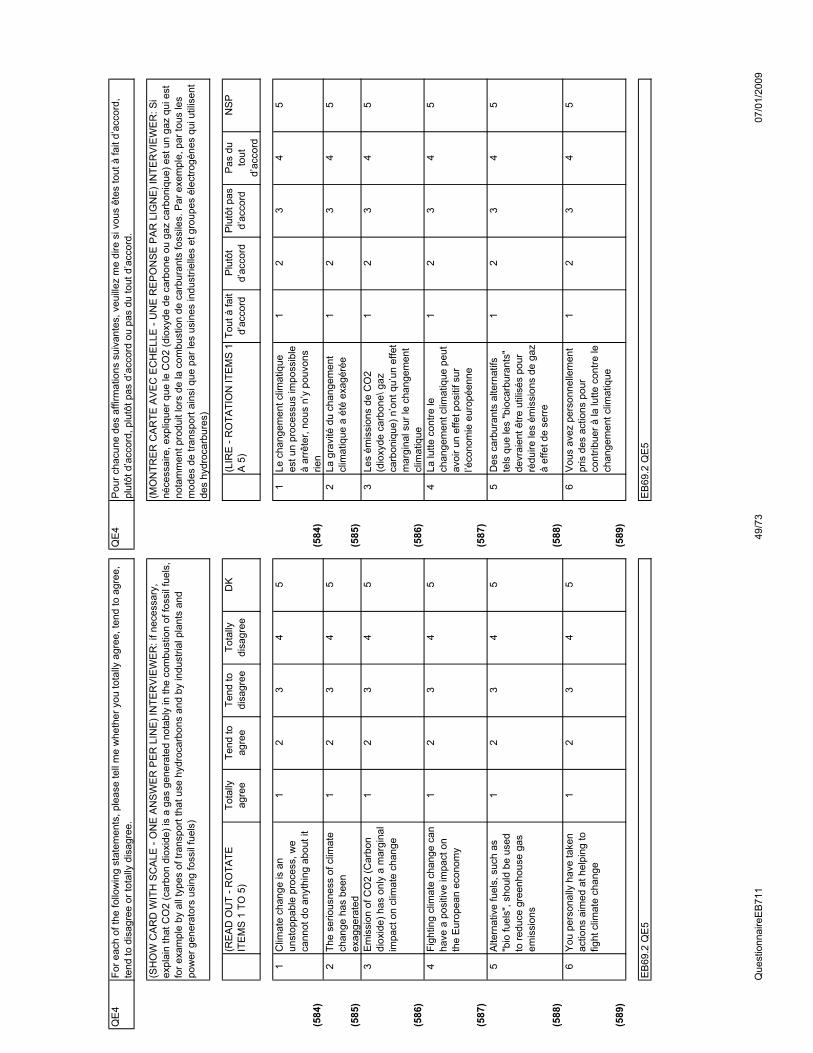
QE
4Q
E4
(584)
1
(584)
1
(585)
2
(585)
2
(586)
3
(586)
3
(587)
4
(587)
4
(588)
5
(588)
5
(589)
6
(589)
6
EB
69.2
QE
5
45
Vou
s av
ez p
erso
nnel
lem
ent
pris
des
act
ions
pou
r co
ntrib
uer à
la lu
tte c
ontre
le
chan
gem
ent c
limat
ique
12
34
5
Des
car
bura
nts
alte
rnat
ifs
tels
que
les
"bio
carb
uran
ts"
devr
aien
t être
util
isés
pou
r ré
duire
les
émis
sion
s de
gaz
à
effe
t de
serr
e
12
3
45
La lu
tte c
ontre
le
chan
gem
ent c
limat
ique
peu
t av
oir u
n ef
fet p
ositi
f sur
l’é
cono
mie
eur
opée
nne
12
34
5
Les
émis
sion
s de
CO
2 (d
ioxy
de c
arbo
ne\ g
az
carb
oniq
ue) n
’ont
qu’
un e
ffet
mar
gina
l sur
le c
hang
emen
t cl
imat
ique
12
3
45
La g
ravi
té d
u ch
ange
men
t cl
imat
ique
a é
té e
xagé
rée
12
34
5
Le c
hang
emen
t clim
atiq
ue
est u
n pr
oces
sus
impo
ssib
le
à ar
rête
r, no
us n
’y p
ouvo
ns
rien
12
3
(MO
NTR
ER
CA
RTE
AV
EC
EC
HE
LLE
- U
NE
RE
PO
NS
E P
AR
LIG
NE
) IN
TER
VIE
WE
R: S
i né
cess
aire
, exp
lique
r que
le C
O2
(dio
xyde
de
carb
one
ou g
az c
arbo
niqu
e) e
st u
n ga
z qu
i est
no
tam
men
t pro
duit
lors
de
la c
ombu
stio
n de
car
bura
nts
foss
iles.
Par
exe
mpl
e, p
ar to
us le
s m
odes
de
trans
port
ains
i que
par
les
usin
es in
dust
rielle
s et
gro
upes
éle
ctro
gène
s qu
i util
isen
t de
s hy
droc
arbu
res)
(LIR
E -
RO
TATI
ON
ITE
MS
1
A 5
)To
ut à
fait
d’ac
cord
Plu
tôt
d’ac
cord
Plu
tôt p
as
d’ac
cord
Pas
du
tout
d’
acco
rd
NS
P
Pou
r cha
cune
des
affi
rmat
ions
sui
vant
es, v
euill
ez m
e di
re s
i vou
s êt
es to
ut à
fait
d’ac
cord
, pl
utôt
d’a
ccor
d, p
lutô
t pas
d’a
ccor
d ou
pas
du
tout
d’a
ccor
d.
EB
69.2
QE
5
45
You
per
sona
lly h
ave
take
n ac
tions
aim
ed a
t hel
ping
to
fight
clim
ate
chan
ge
12
34
5
Alte
rnat
ive
fuel
s, s
uch
as
"bio
fuel
s", s
houl
d be
use
d to
redu
ce g
reen
hous
e ga
s em
issi
ons
12
3
45
Figh
ting
clim
ate
chan
ge c
an
have
a p
ositi
ve im
pact
on
the
Eur
opea
n ec
onom
y
12
34
5
Em
issi
on o
f CO
2 (C
arbo
n di
oxid
e) h
as o
nly
a m
argi
nal
impa
ct o
n cl
imat
e ch
ange
12
3
45
The
serio
usne
ss o
f clim
ate
chan
ge h
as b
een
exag
gera
ted
12
34
5
Clim
ate
chan
ge is
an
unst
oppa
ble
proc
ess,
we
cann
ot d
o an
ythi
ng a
bout
it
12
3
(SH
OW
CA
RD
WIT
H S
CA
LE -
ON
E A
NS
WE
R P
ER
LIN
E) I
NTE
RV
IEW
ER
: if n
eces
sary
, ex
plai
n th
at C
O2
(car
bon
diox
ide)
is a
gas
gen
erat
ed n
otab
ly in
the
com
bust
ion
of fo
ssil
fuel
s,
for e
xam
ple
by a
ll ty
pes
of tr
ansp
ort t
hat u
se h
ydro
carb
ons
and
by in
dust
rial p
lant
s an
d po
wer
gen
erat
ors
usin
g fo
ssil
fuel
s)
(RE
AD
OU
T - R
OTA
TE
ITE
MS
1 T
O 5
)To
tally
ag
ree
Tend
to
agre
eTe
nd to
di
sagr
eeTo
tally
di
sagr
eeD
K
For e
ach
of th
e fo
llow
ing
stat
emen
ts, p
leas
e te
ll m
e w
heth
er y
ou to
tally
agr
ee, t
end
to a
gree
, te
nd to
dis
agre
e or
tota
lly d
isag
ree.
Que
stio
nnai
reE
B71
149
/73
07/0
1/20
09

SPECIAL EUROBAROMETER 313 Europeans’ attitudes towards climate change
54
TABLES
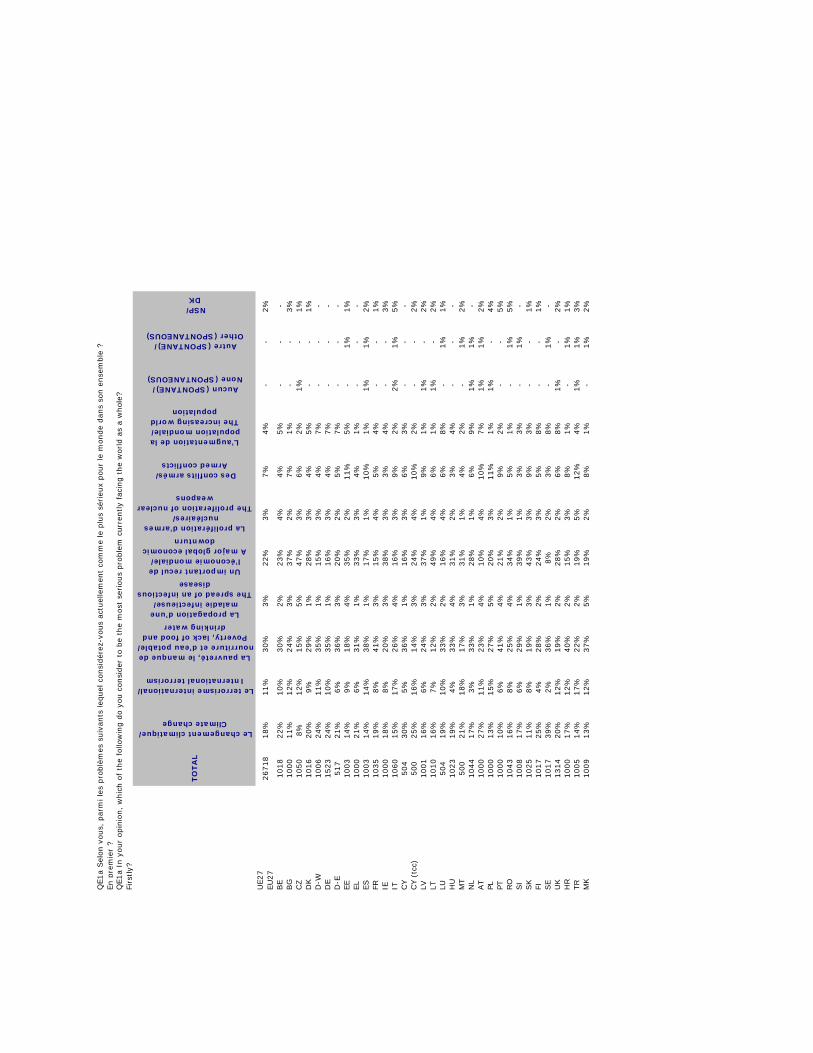
TO
TA
L
Le changement climatique/Climate change
Le terrorisme international/International terrorism
La pauvreté, le manque de nourriture et d’eau potable/
Poverty, lack of food and drinking water
La propagation d’une maladie infectieuse/
The spread of an infectious disease
Un important recul de l’économie mondiale/
A major global economic downturn
La prolifération d’armes nucléaires/
The proliferation of nuclear weapons
Des conflits armés/Armed conflicts
L’augmentation de la population mondiale/The increasing world
population
Aucun (SPONTANE)/None (SPONTANEOUS)
Autre (SPONTANE)/Other (SPONTANEOUS)
NSP/DK
UE27
EU
27
26718
18%
11%
30%
3%
22%
3%
7%
4%
- -
2%
BE
1018
22%
10%
30%
2%
23%
4%
4%
5%
- -
- BG
1000
11%
12%
24%
3%
37%
2%
7%
1%
- -
3%
CZ
1050
8%
12%
15%
5%
47%
3%
6%
2%
1%
- 1%
DK
1016
20%
9%
29%
1%
28%
3%
4%
5%
- -
1%
D-W
1006
24%
11%
35%
1%
15%
3%
4%
7%
- -
- D
E1523
24%
10%
35%
1%
16%
3%
4%
7%
- -
- D
-E517
21%
6%
36%
3%
20%
2%
5%
7%
- -
- EE
1003
14%
9%
18%
4%
35%
2%
11%
5%
- 1%
1%
EL
1000
21%
6%
31%
1%
33%
3%
4%
1%
- -
- ES
1003
14%
14%
38%
1%
17%
1%
10%
1%
1%
1%
2%
FR1035
19%
8%
41%
3%
15%
4%
5%
4%
- -
1%
IE1000
18%
8%
20%
3%
38%
3%
3%
4%
- -
3%
IT1060
15%
17%
26%
4%
16%
3%
9%
2%
2%
1%
5%
CY
504
30%
5%
36%
1%
16%
3%
6%
3%
- -
- CY (
tcc)
500
25%
16%
14%
3%
24%
4%
10%
2%
- -
2%
LV1001
16%
6%
24%
3%
37%
1%
9%
1%
1%
- 2%
L T1010
16%
7%
12%
2%
49%
4%
6%
1%
1%
- 2%
LU504
19%
10%
33%
2%
16%
4%
6%
8%
- 1%
1%
HU
1023
19%
4%
33%
4%
31%
2%
3%
4%
- -
- M
T500
21%
18%
17%
3%
31%
1%
4%
2%
- 1%
2%
NL
1044
17%
3%
33%
1%
28%
1%
6%
9%
1%
1%
- AT
1000
27%
11%
23%
4%
10%
4%
10%
7%
1%
1%
2%
P L1000
13%
15%
27%
5%
20%
3%
11%
1%
1%
- 4%
P T1000
10%
6%
41%
4%
21%
2%
9%
2%
- -
5%
RO
1043
16%
8%
25%
4%
34%
1%
5%
1%
- 1%
5%
SI
1008
17%
6%
29%
1%
39%
1%
3%
3%
- 1%
- SK
1025
11%
8%
19%
3%
43%
3%
9%
3%
- -
1%
FI1017
25%
4%
28%
2%
24%
3%
5%
8%
- -
1%
SE
1017
39%
2%
36%
1%
8%
2%
3%
8%
- 1%
- U
K1314
20%
12%
19%
2%
28%
2%
6%
8%
1%
- 2%
HR
1000
17%
12%
40%
2%
15%
3%
8%
1%
- 1%
1%
TR
1005
14%
17%
22%
2%
19%
5%
12%
4%
1%
1%
3%
MK
1009
13%
12%
37%
5%
19%
2%
8%
1%
-1%
2%
QE1a
Sel
on v
ous,
par
mi le
s pro
blè
mes
suiv
ants
leq
uel
consi
dér
ez-v
ous
actu
elle
men
t co
mm
e le
plu
s sé
rieu
x pour
le m
onde
dan
s so
n e
nse
mble
?En p
rem
ier
? Q
E1a
In y
our
opin
ion,
whic
h o
f th
e fo
llow
ing d
o y
ou c
onsi
der
to b
e th
e m
ost
ser
ious
pro
ble
m c
urr
ently
faci
ng t
he
world a
s a
whol
e?Fi
rstly?
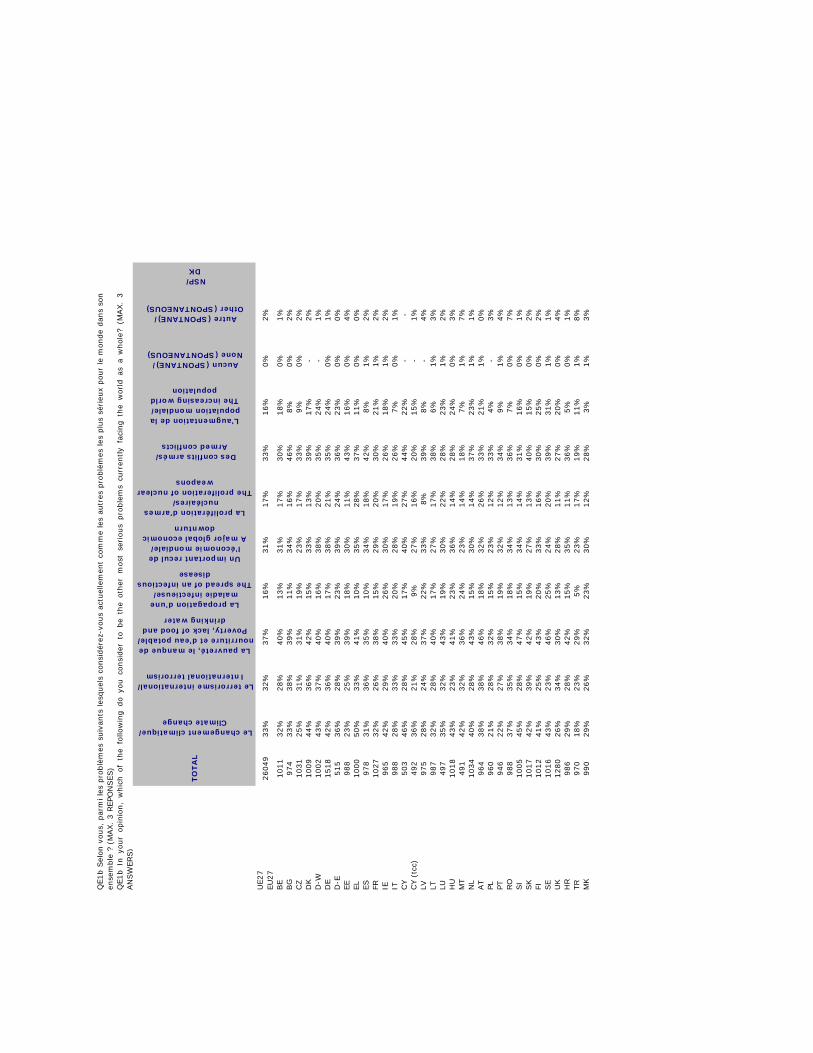
TO
TA
L
Le changement climatique/Climate change
Le terrorisme international/International terrorism
La pauvreté, le manque de nourriture et d’eau potable/
Poverty, lack of food and drinking water
La propagation d’une maladie infectieuse/
The spread of an infectious disease
Un important recul de l’économie mondiale/
A major global economic downturn
La prolifération d’armes nucléaires/
The proliferation of nuclear weapons
Des conflits armés/Armed conflicts
L’augmentation de la population mondiale/The increasing world
population
Aucun (SPONTANE)/None (SPONTANEOUS)
Autre (SPONTANE)/Other (SPONTANEOUS)
NSP/DK
UE27
EU
27
26049
33%
32%
37%
16%
31%
17%
33%
16%
0%
2%
BE
1011
32%
28%
40%
13%
31%
17%
30%
18%
0%
1%
BG
974
33%
38%
39%
11%
34%
16%
46%
8%
0%
2%
CZ
1031
25%
31%
31%
19%
23%
17%
33%
9%
0%
2%
DK
1009
44%
36%
42%
15%
33%
13%
39%
17%
- 2%
D-W
1002
43%
37%
40%
16%
38%
20%
35%
24%
- 1%
DE
1518
42%
36%
40%
17%
38%
21%
35%
24%
0%
1%
D-E
515
36%
28%
39%
23%
39%
24%
36%
23%
0%
0%
EE
988
23%
25%
39%
18%
30%
11%
43%
16%
0%
4%
EL
1000
50%
33%
41%
10%
35%
28%
37%
11%
0%
0%
ES
978
31%
36%
35%
10%
34%
18%
42%
8%
1%
2%
FR1027
32%
26%
38%
15%
29%
20%
30%
21%
1%
2%
IE965
42%
29%
40%
26%
30%
17%
26%
18%
1%
2%
IT988
28%
33%
33%
20%
28%
19%
26%
7%
0%
1%
CY
503
46%
28%
45%
17%
40%
27%
44%
22%
- -
CY (
tcc)
492
36%
21%
28%
9%
27%
16%
20%
15%
- 1%
LV975
28%
24%
37%
22%
33%
8%
39%
8%
- 4%
L T987
32%
28%
40%
17%
27%
17%
38%
6%
1%
3%
LU497
35%
32%
43%
19%
30%
22%
28%
23%
1%
2%
HU
1018
43%
23%
41%
23%
36%
14%
28%
24%
0%
3%
MT
491
42%
32%
36%
24%
23%
14%
18%
7%
1%
7%
NL
1034
40%
28%
43%
15%
30%
14%
37%
23%
1%
1%
AT
964
38%
38%
46%
18%
32%
26%
33%
21%
1%
0%
P L960
21%
28%
32%
15%
23%
12%
33%
4%
- 3%
P T946
22%
27%
38%
19%
32%
12%
34%
9%
1%
4%
RO
988
37%
35%
34%
18%
34%
13%
36%
7%
0%
7%
SI
1005
45%
28%
47%
15%
34%
14%
31%
16%
0%
1%
SK
1017
42%
39%
42%
19%
27%
13%
40%
15%
0%
2%
FI1012
41%
25%
43%
20%
33%
16%
30%
25%
0%
2%
SE
1016
43%
23%
46%
25%
24%
20%
39%
31%
1%
1%
UK
1280
26%
34%
30%
13%
28%
11%
27%
20%
0%
4%
HR
986
29%
28%
42%
15%
35%
11%
36%
5%
0%
1%
TR
970
18%
23%
29%
5%
23%
17%
19%
11%
1%
8%
MK
990
29%
26%
32%
23%
30%
12%
28%
3%
1%
3%
QE1b
Sel
on
vous,
par
mile
spro
blè
mes
suiv
ants
lesq
uel
sco
nsi
dér
ez-v
ous
actu
elle
men
tco
mm
ele
sau
tres
pro
blè
mes
les
plu
ssé
rieu
xpour
lem
onde
dan
sso
nen
sem
ble
? (
MAX.
3 R
EPO
NSES)
QE1b
Inyo
ur
opin
ion,
whic
hof
the
follo
win
gdo
you
consi
der
tobe
the
oth
erm
ost
serious
pro
ble
ms
curr
ently
faci
ng
the
world
asa
whole
?(M
AX.
3AN
SW
ERS)
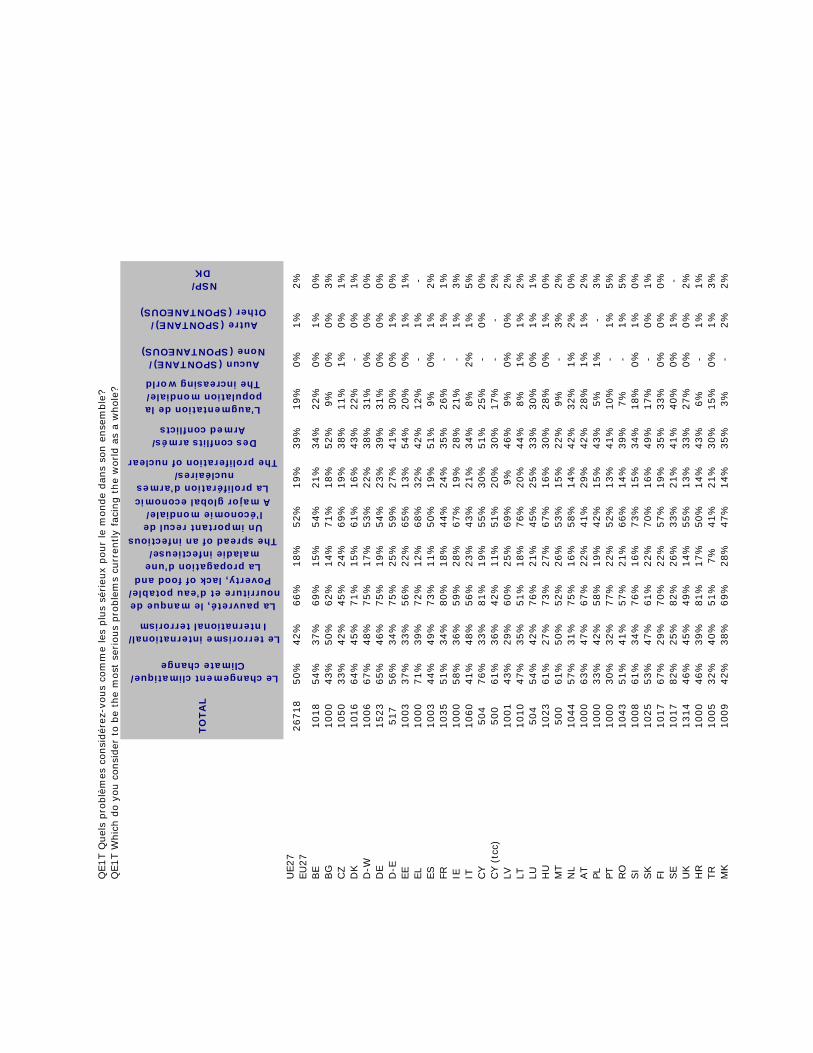
TO
TA
L
Le changement climatique/Climate change
Le terrorisme international/International terrorism
La pauvreté, le manque de nourriture et d’eau potable/
Poverty, lack of food and La propagation d’une maladie infectieuse/
The spread of an infectious Un important recul de l’économie mondiale/
A major global economic La prolifération d’armes
nucléaires/The proliferation of nuclear
Des conflits armés/Armed conflicts
L’augmentation de la population mondiale/The increasing world
Aucun (SPONTANE)/None (SPONTANEOUS)
Autre (SPONTANE)/Other (SPONTANEOUS)
NSP/DK
UE27
EU
27
26718
50%
42%
66%
18%
52%
19%
39%
19%
0%
1%
2%
BE
1018
54%
37%
69%
15%
54%
21%
34%
22%
0%
1%
0%
BG
1000
43%
50%
62%
14%
71%
18%
52%
9%
0%
0%
3%
CZ
1050
33%
42%
45%
24%
69%
19%
38%
11%
1%
0%
1%
DK
1016
64%
45%
71%
15%
61%
16%
43%
22%
- 0%
1%
D-W
1006
67%
48%
75%
17%
53%
22%
38%
31%
0%
0%
0%
DE
1523
65%
46%
75%
19%
54%
23%
39%
31%
0%
0%
0%
D-E
517
56%
34%
75%
25%
59%
27%
41%
30%
0%
1%
0%
EE
1003
37%
33%
56%
22%
65%
13%
54%
20%
0%
1%
1%
EL
1000
71%
39%
72%
12%
68%
32%
42%
12%
- 1%
- ES
1003
44%
49%
73%
11%
50%
19%
51%
9%
0%
1%
2%
FR1035
51%
34%
80%
18%
44%
24%
35%
26%
- 1%
1%
IE1000
58%
36%
59%
28%
67%
19%
28%
21%
- 1%
3%
IT1060
41%
48%
56%
23%
43%
21%
34%
8%
2%
1%
5%
CY
504
76%
33%
81%
19%
55%
30%
51%
25%
- 0%
0%
CY (
tcc)
500
61%
36%
42%
11%
51%
20%
30%
17%
- -
2%
LV1001
43%
29%
60%
25%
69%
9%
46%
9%
0%
0%
2%
LT1010
47%
35%
51%
18%
76%
20%
44%
8%
1%
1%
2%
LU504
54%
42%
76%
21%
45%
25%
33%
30%
0%
1%
1%
HU
1023
61%
27%
73%
27%
67%
16%
30%
28%
0%
1%
0%
MT
500
61%
50%
52%
26%
53%
15%
22%
9%
- 3%
2%
NL
1044
57%
31%
75%
16%
58%
14%
42%
32%
1%
2%
0%
AT
1000
63%
47%
67%
22%
41%
29%
42%
28%
1%
1%
2%
PL1000
33%
42%
58%
19%
42%
15%
43%
5%
1%
- 3%
PT1000
30%
32%
77%
22%
52%
13%
41%
10%
- 1%
5%
RO
1043
51%
41%
57%
21%
66%
14%
39%
7%
- 1%
5%
SI
1008
61%
34%
76%
16%
73%
15%
34%
18%
0%
1%
0%
SK
1025
53%
47%
61%
22%
70%
16%
49%
17%
- 0%
1%
FI1017
67%
29%
70%
22%
57%
19%
35%
33%
0%
0%
0%
SE
1017
82%
25%
82%
26%
33%
21%
41%
40%
0%
1%
- U
K1314
46%
45%
49%
14%
55%
13%
33%
27%
0%
0%
2%
HR
1000
46%
39%
81%
17%
50%
14%
43%
6%
- 1%
1%
TR
1005
32%
40%
51%
7%
41%
21%
30%
15%
0%
1%
3%
MK
1009
42%
38%
69%
28%
47%
14%
35%
3%
-2%
2%
QE1T Q
uel
s pro
blè
mes
consi
dér
ez-v
ous
com
me
les
plu
s sé
rieu
x pour
le m
onde
dan
s so
n e
nse
mble
?Q
E1T W
hic
h d
o y
ou c
onsi
der
to b
e th
e m
ost
ser
ious
pro
ble
ms
curr
ently
faci
ng t
he
world a
s a
whole
?
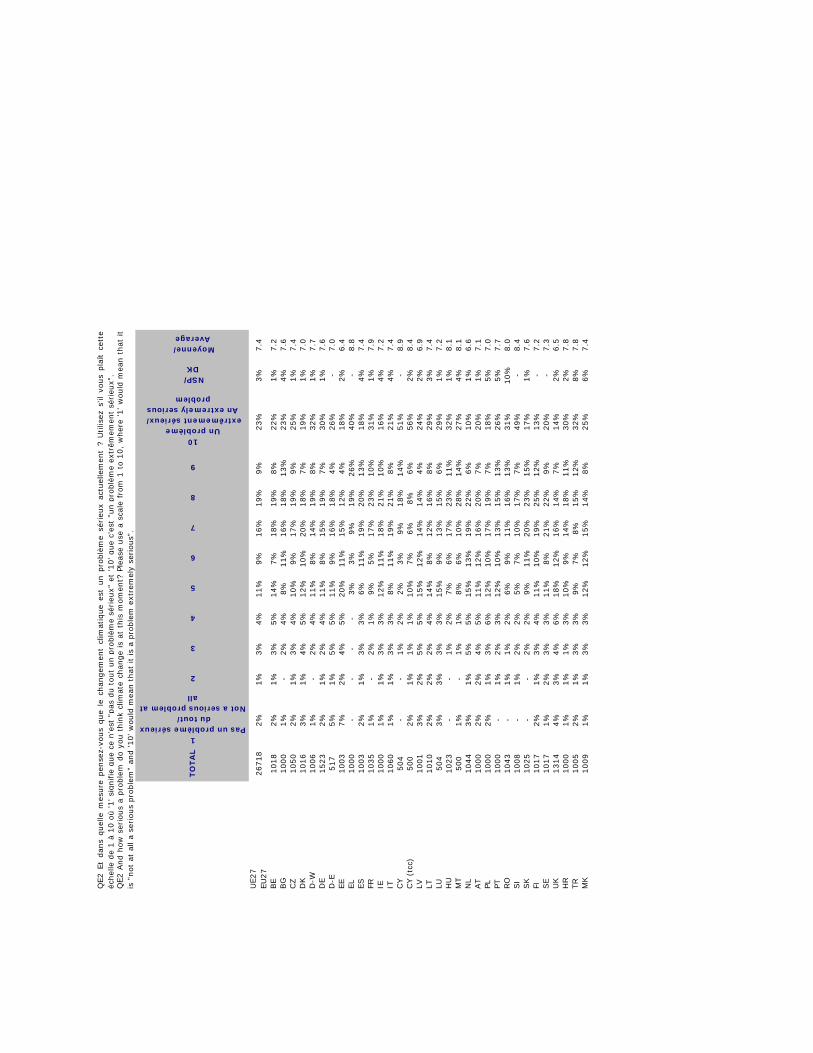
TO
TA
L
1Pas un problème sérieux
du tout/Not a serious problem at
all
2
3
4
5
6
7
8
9
10Un problème
extrêmement sérieux/An extremely serious
problem
NSP/DK
Moyenne/Average
UE27
EU
27
26718
2%
1%
3%
4%
11%
9%
16%
19%
9%
23%
3%
7.4
BE
1018
2%
1%
3%
5%
14%
7%
18%
19%
8%
22%
1%
7.2
BG
1000
1%
- 2%
4%
8%
11%
16%
18%
13%
23%
4%
7.6
CZ
1050
2%
1%
3%
4%
10%
9%
17%
19%
9%
25%
1%
7.4
DK
1016
3%
1%
4%
5%
12%
10%
20%
18%
7%
19%
1%
7.0
D-W
1006
1%
- 2%
4%
11%
8%
14%
19%
8%
32%
1%
7.7
DE
1523
2%
1%
2%
4%
11%
8%
15%
19%
7%
30%
1%
7.6
D-E
517
5%
1%
5%
5%
11%
9%
16%
18%
4%
26%
- 7.0
EE
1003
7%
2%
4%
5%
20%
11%
15%
12%
4%
18%
2%
6.4
EL
1000
- -
- -
3%
3%
9%
19%
26%
40%
- 8.8
ES
1003
2%
1%
3%
3%
6%
11%
19%
20%
13%
18%
4%
7.4
FR1035
1%
- 2%
1%
9%
5%
17%
23%
10%
31%
1%
7.9
IE1000
1%
1%
3%
3%
12%
11%
18%
21%
10%
16%
4%
7.2
IT1060
1%
1%
3%
3%
8%
11%
19%
21%
8%
21%
4%
7.4
CY
504
- -
1%
2%
2%
3%
9%
18%
14%
51%
- 8.9
CY (
tcc)
500
2%
1%
1%
1%
10%
7%
6%
8%
6%
56%
2%
8.4
LV1001
3%
2%
5%
5%
15%
12%
14%
14%
4%
24%
2%
6.9
LT1010
2%
2%
2%
4%
14%
8%
12%
16%
8%
29%
3%
7.4
LU504
3%
3%
3%
3%
15%
9%
13%
15%
6%
29%
1%
7.2
HU
1023
- -
1%
2%
7%
6%
17%
23%
11%
32%
1%
8.1
MT
500
1%
- 1%
1%
8%
6%
10%
28%
14%
27%
4%
8.1
NL
1044
3%
1%
5%
5%
15%
13%
19%
22%
6%
10%
1%
6.6
AT
1000
2%
2%
4%
5%
11%
12%
16%
20%
7%
20%
1%
7.1
PL1000
2%
1%
3%
6%
12%
10%
17%
19%
7%
18%
5%
7.0
PT1000
- 1%
2%
3%
12%
10%
13%
15%
13%
26%
5%
7.7
RO
1043
- 1%
1%
2%
6%
9%
11%
16%
13%
31%
10%
8.0
SI
1008
- 1%
2%
2%
5%
7%
10%
17%
7%
49%
- 8.4
SK
1025
- -
2%
2%
9%
11%
20%
23%
15%
17%
1%
7.6
FI1017
2%
1%
3%
4%
11%
10%
19%
25%
12%
13%
- 7.2
SE
1017
1%
2%
3%
3%
11%
8%
21%
22%
9%
20%
- 7.3
UK
1314
4%
3%
4%
6%
18%
12%
16%
14%
7%
14%
2%
6.5
HR
1000
1%
1%
1%
3%
10%
9%
14%
18%
11%
30%
2%
7.8
TR
1005
2%
1%
3%
3%
9%
7%
8%
15%
12%
32%
8%
7.8
MK
1009
1%
1%
3%
3%
12%
12%
15%
14%
8%
25%
6%
7.4
QE2
Et
dan
squel
lem
esure
pen
sez-
vous
que
lech
angem
ent
clim
atiq
ue
est
un
pro
blè
me
sérieu
xac
tuel
lem
ent
?U
tilis
ezs'
ilvo
us
pla
îtce
tte
échel
le d
e 1 à
10 o
ù '1' si
gnifie
que
ce n
’est
"pas
du t
out
un p
roblè
me
sérieu
x" e
t '1
0' que
c’es
t "u
n p
roblè
me
extr
êmem
ent
sérieu
x".
QE2
And
how
serious
apro
ble
mdo
you
thin
kcl
imat
ech
ange
isat
this
mom
ent?
Plea
seuse
asc
ale
from
1to
10,
wher
e'1
'w
ould
mea
nth
atit
is "
not
at a
ll a
serious
pro
ble
m"
and '10' w
ould
mea
n t
hat
it
is a
pro
ble
m e
xtre
mel
y se
rious"
.
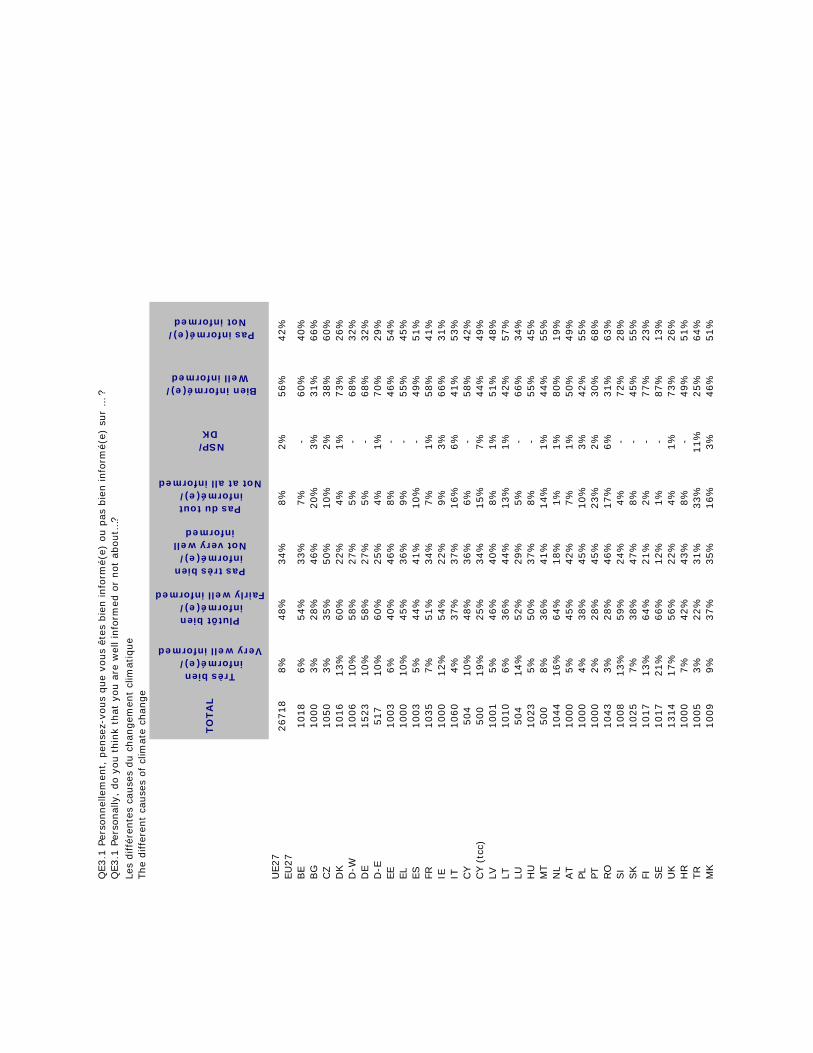
TO
TA
L
Très bien informé(e)/
Very well informed
Plutôt bien informé(e)/
Fairly well informed
Pas très bien informé(e)/
Not very well informed
Pas du tout informé(e)/
Not at all informed
NSP/DK
Bien informé(e)/Well informed
Pas informé(e)/Not informed
UE27
EU
27
26718
8%
48%
34%
8%
2%
56%
42%
BE
1018
6%
54%
33%
7%
- 60%
40%
BG
1000
3%
28%
46%
20%
3%
31%
66%
CZ
1050
3%
35%
50%
10%
2%
38%
60%
DK
1016
13%
60%
22%
4%
1%
73%
26%
D-W
1006
10%
58%
27%
5%
- 68%
32%
DE
1523
10%
58%
27%
5%
- 68%
32%
D-E
517
10%
60%
25%
4%
1%
70%
29%
EE
1003
6%
40%
46%
8%
- 46%
54%
EL
1000
10%
45%
36%
9%
- 55%
45%
ES
1003
5%
44%
41%
10%
- 49%
51%
FR1035
7%
51%
34%
7%
1%
58%
41%
IE1000
12%
54%
22%
9%
3%
66%
31%
IT1060
4%
37%
37%
16%
6%
41%
53%
CY
504
10%
48%
36%
6%
- 58%
42%
CY (
tcc)
500
19%
25%
34%
15%
7%
44%
49%
LV1001
5%
46%
40%
8%
1%
51%
48%
LT1010
6%
36%
44%
13%
1%
42%
57%
LU504
14%
52%
29%
5%
- 66%
34%
HU
1023
5%
50%
37%
8%
- 55%
45%
MT
500
8%
36%
41%
14%
1%
44%
55%
NL
1044
16%
64%
18%
1%
1%
80%
19%
AT
1000
5%
45%
42%
7%
1%
50%
49%
PL1000
4%
38%
45%
10%
3%
42%
55%
PT1000
2%
28%
45%
23%
2%
30%
68%
RO
1043
3%
28%
46%
17%
6%
31%
63%
SI
1008
13%
59%
24%
4%
- 72%
28%
SK
1025
7%
38%
47%
8%
- 45%
55%
FI1017
13%
64%
21%
2%
- 77%
23%
SE
1017
21%
66%
12%
1%
- 87%
13%
UK
1314
17%
56%
22%
4%
1%
73%
26%
HR
1000
7%
42%
43%
8%
- 49%
51%
TR
1005
3%
22%
31%
33%
11%
25%
64%
MK
1009
9%
37%
35%
16%
3%
46%
51%
QE3.1
Per
sonnel
lem
ent,
pen
sez-
vous
que
vous
êtes
bie
n info
rmé(
e) o
u p
as b
ien info
rmé(
e) s
ur
… ?
Q
E3.1
Per
sonal
ly,
do y
ou t
hin
k th
at y
ou a
re w
ell in
form
ed o
r not
about…
? Le
s diffé
rente
s ca
use
s du c
han
gem
ent
clim
atiq
ue
The
diffe
rent
cause
s of
clim
ate
chan
ge
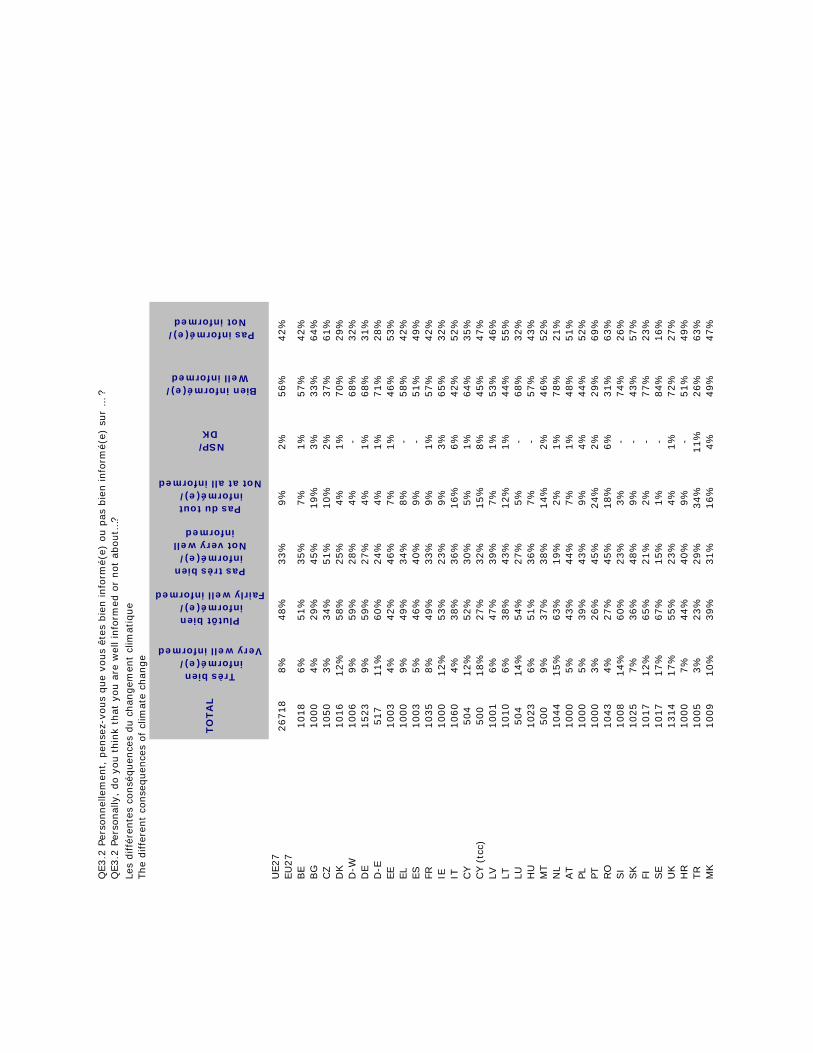
TO
TA
L
Très bien informé(e)/
Very well informed
Plutôt bien informé(e)/
Fairly well informed
Pas très bien informé(e)/
Not very well informed
Pas du tout informé(e)/
Not at all informed
NSP/DK
Bien informé(e)/Well informed
Pas informé(e)/Not informed
UE27
EU
27
26718
8%
48%
33%
9%
2%
56%
42%
BE
1018
6%
51%
35%
7%
1%
57%
42%
BG
1000
4%
29%
45%
19%
3%
33%
64%
CZ
1050
3%
34%
51%
10%
2%
37%
61%
DK
1016
12%
58%
25%
4%
1%
70%
29%
D-W
1006
9%
59%
28%
4%
- 68%
32%
DE
1523
9%
59%
27%
4%
1%
68%
31%
D-E
517
11%
60%
24%
4%
1%
71%
28%
EE
1003
4%
42%
46%
7%
1%
46%
53%
EL
1000
9%
49%
34%
8%
- 58%
42%
ES
1003
5%
46%
40%
9%
- 51%
49%
FR1035
8%
49%
33%
9%
1%
57%
42%
IE1000
12%
53%
23%
9%
3%
65%
32%
IT1060
4%
38%
36%
16%
6%
42%
52%
CY
504
12%
52%
30%
5%
1%
64%
35%
CY (
tcc)
500
18%
27%
32%
15%
8%
45%
47%
LV1001
6%
47%
39%
7%
1%
53%
46%
LT1010
6%
38%
43%
12%
1%
44%
55%
LU504
14%
54%
27%
5%
- 68%
32%
HU
1023
6%
51%
36%
7%
- 57%
43%
MT
500
9%
37%
38%
14%
2%
46%
52%
NL
1044
15%
63%
19%
2%
1%
78%
21%
AT
1000
5%
43%
44%
7%
1%
48%
51%
PL1000
5%
39%
43%
9%
4%
44%
52%
PT1000
3%
26%
45%
24%
2%
29%
69%
RO
1043
4%
27%
45%
18%
6%
31%
63%
SI
1008
14%
60%
23%
3%
- 74%
26%
SK
1025
7%
36%
48%
9%
- 43%
57%
FI1017
12%
65%
21%
2%
- 77%
23%
SE
1017
17%
67%
15%
1%
- 84%
16%
UK
1314
17%
55%
23%
4%
1%
72%
27%
HR
1000
7%
44%
40%
9%
- 51%
49%
TR
1005
3%
23%
29%
34%
11%
26%
63%
MK
1009
10%
39%
31%
16%
4%
49%
47%
QE3.2
Per
sonnel
lem
ent,
pen
sez-
vous
que
vous
êtes
bie
n info
rmé(
e) o
u p
as b
ien info
rmé(
e) s
ur
… ?
Q
E3.2
Per
sonal
ly,
do y
ou t
hin
k th
at y
ou a
re w
ell in
form
ed o
r not
about…
? Le
s diffé
rente
s co
nsé
quen
ces
du c
han
gem
ent
clim
atiq
ue
The
diffe
rent
conse
quen
ces
of
clim
ate
chan
ge
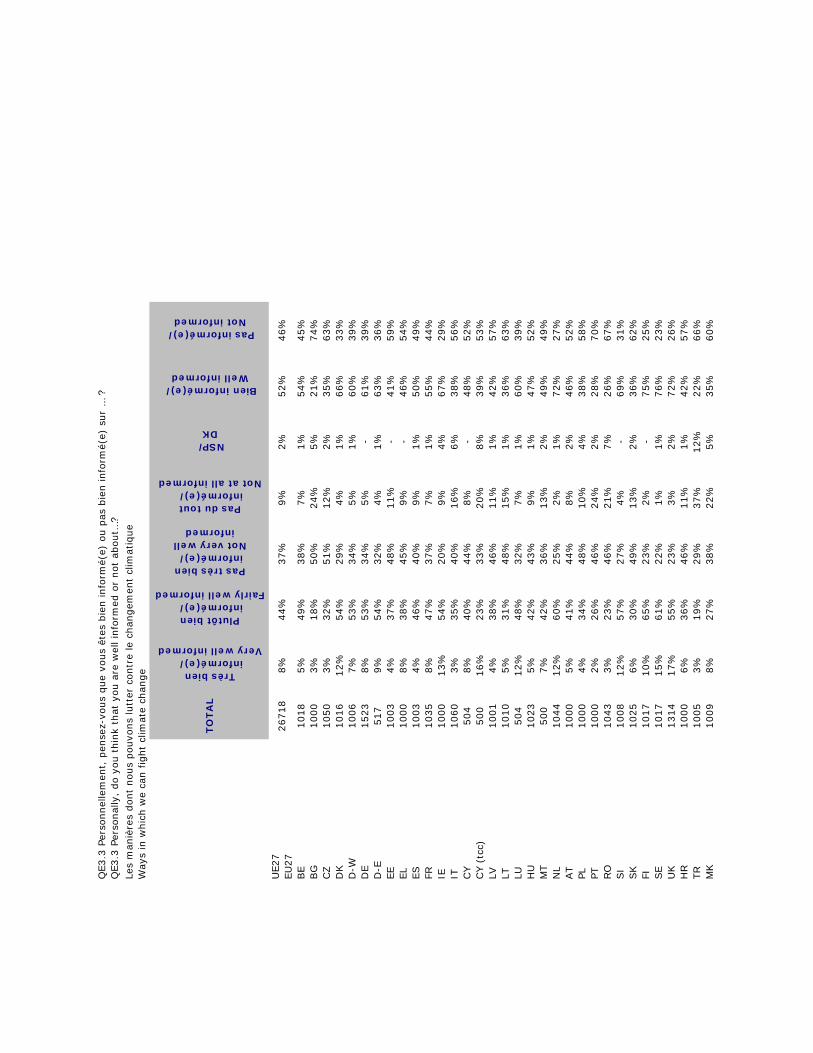
TO
TA
L
Très bien informé(e)/
Very well informed
Plutôt bien informé(e)/
Fairly well informed
Pas très bien informé(e)/
Not very well informed
Pas du tout informé(e)/
Not at all informed
NSP/DK
Bien informé(e)/Well informed
Pas informé(e)/Not informed
UE27
EU
27
26718
8%
44%
37%
9%
2%
52%
46%
BE
1018
5%
49%
38%
7%
1%
54%
45%
BG
1000
3%
18%
50%
24%
5%
21%
74%
CZ
1050
3%
32%
51%
12%
2%
35%
63%
DK
1016
12%
54%
29%
4%
1%
66%
33%
D-W
1006
7%
53%
34%
5%
1%
60%
39%
DE
1523
8%
53%
34%
5%
- 61%
39%
D-E
517
9%
54%
32%
4%
1%
63%
36%
EE
1003
4%
37%
48%
11%
- 41%
59%
EL
1000
8%
38%
45%
9%
- 46%
54%
ES
1003
4%
46%
40%
9%
1%
50%
49%
FR1035
8%
47%
37%
7%
1%
55%
44%
IE1000
13%
54%
20%
9%
4%
67%
29%
IT1060
3%
35%
40%
16%
6%
38%
56%
CY
504
8%
40%
44%
8%
- 48%
52%
CY (
tcc)
500
16%
23%
33%
20%
8%
39%
53%
LV1001
4%
38%
46%
11%
1%
42%
57%
LT1010
5%
31%
48%
15%
1%
36%
63%
LU504
12%
48%
32%
7%
1%
60%
39%
HU
1023
5%
42%
43%
9%
1%
47%
52%
MT
500
7%
42%
36%
13%
2%
49%
49%
NL
1044
12%
60%
25%
2%
1%
72%
27%
AT
1000
5%
41%
44%
8%
2%
46%
52%
PL1000
4%
34%
48%
10%
4%
38%
58%
PT1000
2%
26%
46%
24%
2%
28%
70%
RO
1043
3%
23%
46%
21%
7%
26%
67%
SI
1008
12%
57%
27%
4%
- 69%
31%
SK
1025
6%
30%
49%
13%
2%
36%
62%
FI1017
10%
65%
23%
2%
- 75%
25%
SE
1017
15%
61%
22%
1%
1%
76%
23%
UK
1314
17%
55%
23%
3%
2%
72%
26%
HR
1000
6%
36%
46%
11%
1%
42%
57%
TR
1005
3%
19%
29%
37%
12%
22%
66%
MK
1009
8%
27%
38%
22%
5%
35%
60%
QE3.3
Per
sonnel
lem
ent,
pen
sez-
vous
que
vous
êtes
bie
n info
rmé(
e) o
u p
as b
ien info
rmé(
e) s
ur
… ?
Q
E3.3
Per
sonal
ly,
do y
ou t
hin
k th
at y
ou a
re w
ell in
form
ed o
r not
about…
? Le
s m
aniè
res
dont
nous
pouvo
ns
lutt
er c
ontr
e le
chan
gem
ent
clim
atiq
ue
Way
s in
whic
h w
e ca
n f
ight
clim
ate
chan
ge
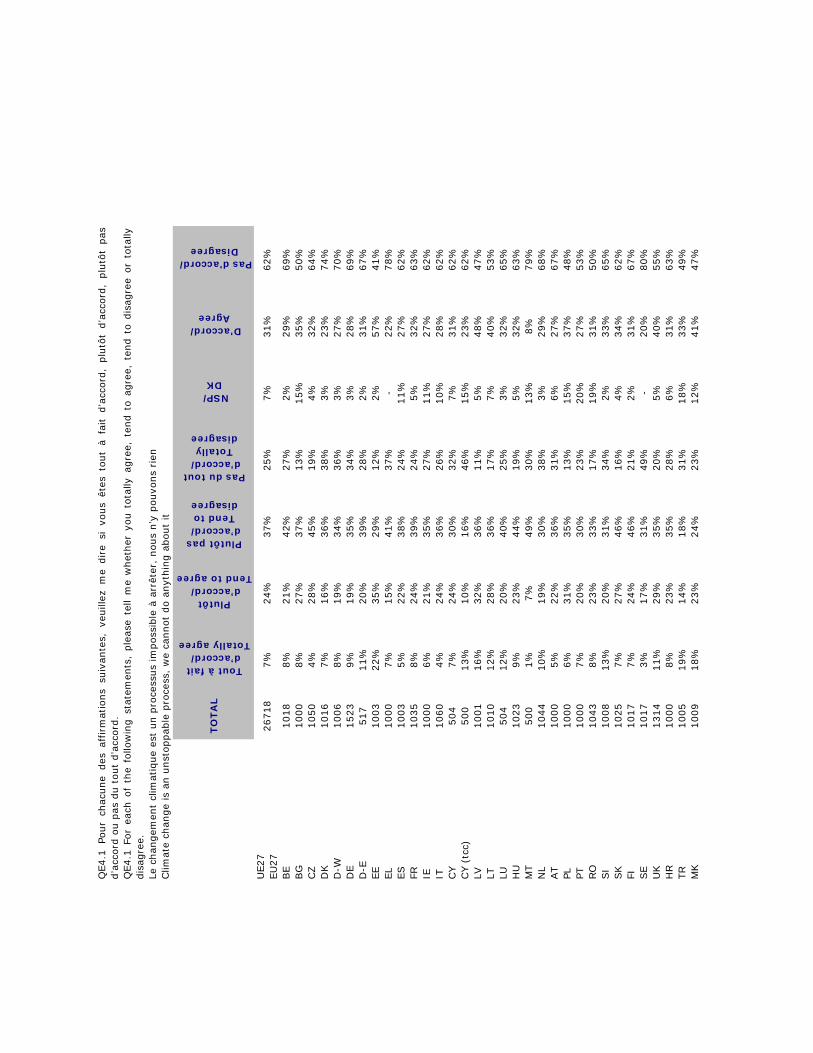
TO
TA
L
Tout à fait d’accord/
Totally agree
Plutôt d’accord/
Tend to agree
Plutôt pas d’accord/Tend to disagree
Pas du tout d’accord/
Totally disagree
NSP/DK
D'accord/Agree
Pas d'accord/Disagree
UE27
EU
27
26718
7%
24%
37%
25%
7%
31%
62%
BE
1018
8%
21%
42%
27%
2%
29%
69%
BG
1000
8%
27%
37%
13%
15%
35%
50%
CZ
1050
4%
28%
45%
19%
4%
32%
64%
DK
1016
7%
16%
36%
38%
3%
23%
74%
D-W
1006
8%
19%
34%
36%
3%
27%
70%
DE
1523
9%
19%
35%
34%
3%
28%
69%
D-E
517
11%
20%
39%
28%
2%
31%
67%
EE
1003
22%
35%
29%
12%
2%
57%
41%
EL
1000
7%
15%
41%
37%
- 22%
78%
ES
1003
5%
22%
38%
24%
11%
27%
62%
FR1035
8%
24%
39%
24%
5%
32%
63%
IE1000
6%
21%
35%
27%
11%
27%
62%
IT1060
4%
24%
36%
26%
10%
28%
62%
CY
504
7%
24%
30%
32%
7%
31%
62%
CY (
tcc)
500
13%
10%
16%
46%
15%
23%
62%
LV1001
16%
32%
36%
11%
5%
48%
47%
LT1010
12%
28%
36%
17%
7%
40%
53%
LU504
12%
20%
40%
25%
3%
32%
65%
HU
1023
9%
23%
44%
19%
5%
32%
63%
MT
500
1%
7%
49%
30%
13%
8%
79%
NL
1044
10%
19%
30%
38%
3%
29%
68%
AT
1000
5%
22%
36%
31%
6%
27%
67%
PL1000
6%
31%
35%
13%
15%
37%
48%
PT1000
7%
20%
30%
23%
20%
27%
53%
RO
1043
8%
23%
33%
17%
19%
31%
50%
SI
1008
13%
20%
31%
34%
2%
33%
65%
SK
1025
7%
27%
46%
16%
4%
34%
62%
FI1017
7%
24%
46%
21%
2%
31%
67%
SE
1017
3%
17%
31%
49%
- 20%
80%
UK
1314
11%
29%
35%
20%
5%
40%
55%
HR
1000
8%
23%
35%
28%
6%
31%
63%
TR
1005
19%
14%
18%
31%
18%
33%
49%
MK
1009
18%
23%
24%
23%
12%
41%
47%
QE4.1
Pour
chac
une
des
affirm
atio
ns
suiv
ante
s,ve
uill
ezm
edire
sivo
us
êtes
tout
àfa
itd’a
ccord
,plu
tôt
d’a
ccord
,plu
tôt
pas
d’a
ccord
ou p
as d
u t
out
d’a
ccord
. Q
E4.1
For
each
of
the
follo
win
gst
atem
ents
,ple
ase
tell
me
whet
her
you
tota
llyag
ree,
tend
toag
ree,
tend
todis
agre
eor
tota
llydis
agre
e.
Le c
han
gem
ent
clim
atiq
ue
est
un p
roce
ssus
imposs
ible
à a
rrêt
er,
nous
n’y
pouvo
ns
rien
Clim
ate
chan
ge
is a
n u
nst
oppab
le p
roce
ss,
we
cannot
do a
nyt
hin
g a
bout
it
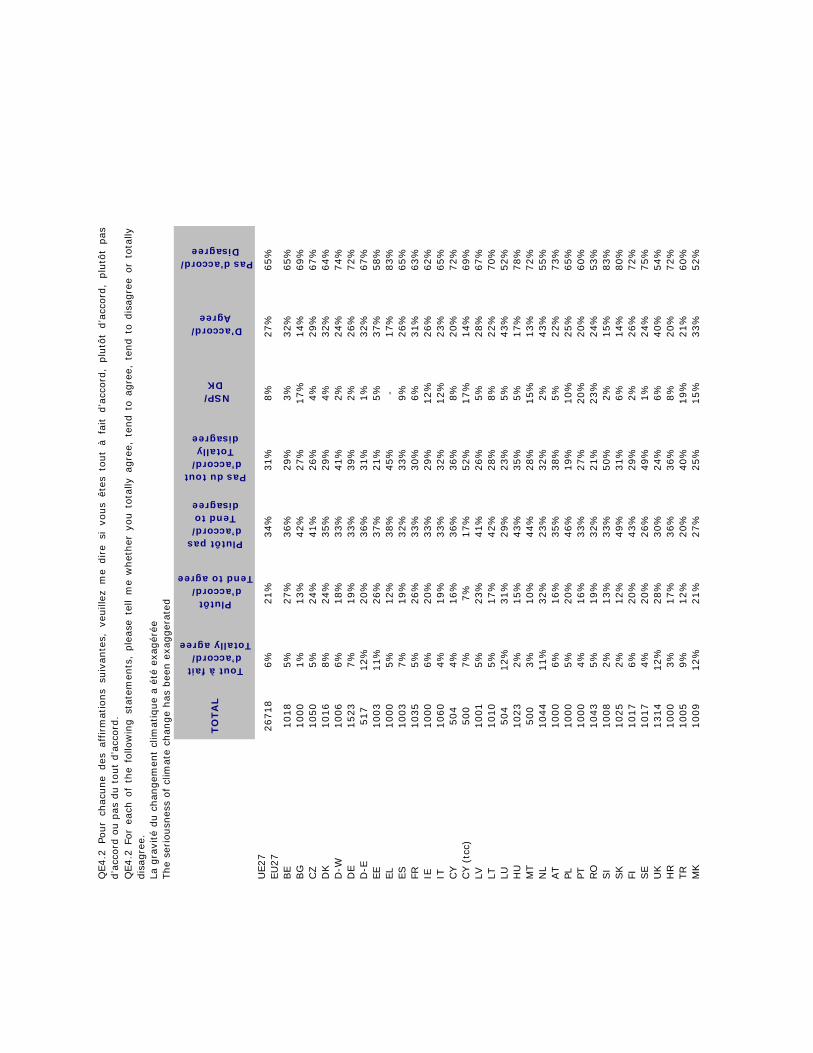
TO
TA
L
Tout à fait d’accord/
Totally agree
Plutôt d’accord/
Tend to agree
Plutôt pas d’accord/Tend to disagree
Pas du tout d’accord/
Totally disagree
NSP/DK
D'accord/Agree
Pas d'accord/Disagree
UE27
EU
27
26718
6%
21%
34%
31%
8%
27%
65%
BE
1018
5%
27%
36%
29%
3%
32%
65%
BG
1000
1%
13%
42%
27%
17%
14%
69%
CZ
1050
5%
24%
41%
26%
4%
29%
67%
DK
1016
8%
24%
35%
29%
4%
32%
64%
D-W
1006
6%
18%
33%
41%
2%
24%
74%
DE
1523
7%
19%
33%
39%
2%
26%
72%
D-E
517
12%
20%
36%
31%
1%
32%
67%
EE
1003
11%
26%
37%
21%
5%
37%
58%
EL
1000
5%
12%
38%
45%
- 17%
83%
ES
1003
7%
19%
32%
33%
9%
26%
65%
FR1035
5%
26%
33%
30%
6%
31%
63%
IE1000
6%
20%
33%
29%
12%
26%
62%
IT1060
4%
19%
33%
32%
12%
23%
65%
CY
504
4%
16%
36%
36%
8%
20%
72%
CY (
tcc)
500
7%
7%
17%
52%
17%
14%
69%
LV1001
5%
23%
41%
26%
5%
28%
67%
LT1010
5%
17%
42%
28%
8%
22%
70%
LU504
12%
31%
29%
23%
5%
43%
52%
HU
1023
2%
15%
43%
35%
5%
17%
78%
MT
500
3%
10%
44%
28%
15%
13%
72%
NL
1044
11%
32%
23%
32%
2%
43%
55%
AT
1000
6%
16%
35%
38%
5%
22%
73%
PL1000
5%
20%
46%
19%
10%
25%
65%
PT1000
4%
16%
33%
27%
20%
20%
60%
RO
1043
5%
19%
32%
21%
23%
24%
53%
SI
1008
2%
13%
33%
50%
2%
15%
83%
SK
1025
2%
12%
49%
31%
6%
14%
80%
FI1017
6%
20%
43%
29%
2%
26%
72%
SE
1017
4%
20%
26%
49%
1%
24%
75%
UK
1314
12%
28%
30%
24%
6%
40%
54%
HR
1000
3%
17%
36%
36%
8%
20%
72%
TR
1005
9%
12%
20%
40%
19%
21%
60%
MK
1009
12%
21%
27%
25%
15%
33%
52%
QE4.2
Pour
chac
une
des
affirm
atio
ns
suiv
ante
s,ve
uill
ezm
edire
sivo
us
êtes
tout
àfa
itd’a
ccord
,plu
tôt
d’a
ccord
,plu
tôt
pas
d’a
ccord
ou p
as d
u t
out
d’a
ccord
. Q
E4.2
For
each
of
the
follo
win
gst
atem
ents
,ple
ase
tell
me
whet
her
you
tota
llyag
ree,
tend
toag
ree,
tend
todis
agre
eor
tota
llydis
agre
e.
La g
ravi
té d
u c
han
gem
ent
clim
atiq
ue
a ét
é ex
agér
éeThe
seriousn
ess
of
clim
ate
chan
ge
has
bee
n e
xagger
ated

TO
TA
L
Tout à fait d’accord/
Totally agree
Plutôt d’accord/
Tend to agree
Plutôt pas d’accord/Tend to disagree
Pas du tout d’accord/
Totally disagree
NSP/DK
D'accord/Agree
Pas d'accord/Disagree
UE27
EU
27
26718
7%
23%
33%
25%
12%
30%
58%
BE
1018
6%
28%
40%
23%
3%
34%
63%
BG
1000
4%
12%
35%
25%
24%
16%
60%
CZ
1050
5%
25%
40%
24%
6%
30%
64%
DK
1016
6%
18%
35%
36%
5%
24%
71%
D-W
1006
5%
20%
35%
33%
7%
25%
68%
DE
1523
7%
21%
35%
31%
6%
28%
66%
D-E
517
14%
27%
34%
21%
4%
41%
55%
EE
1003
12%
33%
26%
15%
14%
45%
41%
EL
1000
4%
23%
42%
28%
3%
27%
70%
ES
1003
5%
24%
26%
22%
23%
29%
48%
FR1035
5%
17%
35%
32%
11%
22%
67%
IE1000
12%
38%
18%
15%
17%
50%
33%
IT1060
7%
25%
31%
22%
15%
32%
53%
CY
504
19%
16%
21%
25%
19%
35%
46%
CY (
tcc)
500
10%
5%
13%
46%
26%
15%
59%
LV1001
9%
31%
29%
19%
12%
40%
48%
LT1010
8%
24%
28%
26%
14%
32%
54%
LU504
9%
21%
36%
26%
8%
30%
62%
HU
1023
6%
13%
31%
45%
5%
19%
76%
MT
500
4%
10%
28%
21%
37%
14%
49%
NL
1044
14%
34%
19%
28%
5%
48%
47%
AT
1000
6%
19%
34%
32%
9%
25%
66%
PL1000
7%
21%
39%
18%
15%
28%
57%
PT1000
7%
21%
27%
13%
32%
28%
40%
RO
1043
9%
20%
30%
16%
25%
29%
46%
SI
1008
6%
17%
33%
38%
6%
23%
71%
SK
1025
4%
17%
49%
23%
7%
21%
72%
FI1017
5%
26%
45%
19%
5%
31%
64%
SE
1017
4%
20%
32%
39%
5%
24%
71%
UK
1314
11%
33%
29%
16%
11%
44%
45%
HR
1000
4%
27%
32%
23%
14%
31%
55%
TR
1005
8%
14%
16%
25%
37%
22%
41%
MK
1009
16%
24%
19%
26%
15%
40%
45%
QE4.3
Pour
chac
une
des
affirm
atio
ns
suiv
ante
s,ve
uill
ezm
edire
sivo
us
êtes
tout
àfa
itd’a
ccord
,plu
tôt
d’a
ccord
,plu
tôt
pas
d’a
ccord
ou p
as d
u t
out
d’a
ccord
. Q
E4.3
For
each
of
the
follo
win
gst
atem
ents
,ple
ase
tell
me
whet
her
you
tota
llyag
ree,
tend
toag
ree,
tend
todis
agre
eor
tota
llydis
agre
e.
Les
émis
sions
de
CO
2 (
dio
xyde
carb
one/
gaz
car
boniq
ue)
n’o
nt
qu’u
n e
ffet
mar
gin
al s
ur
le c
han
gem
ent
clim
atiq
ue
Em
issi
on o
f CO
2 (
Car
bon d
ioxi
de)
has
only
a m
argin
al im
pac
t on c
limat
e ch
ange

TO
TA
L
Tout à fait d’accord/
Totally agree
Plutôt d’accord/
Tend to agree
Plutôt pas d’accord/Tend to disagree
Pas du tout d’accord/
Totally disagree
NSP/DK
D'accord/Agree
Pas d'accord/Disagree
UE27
EU
27
26718
17%
45%
16%
5%
17%
62%
21%
BE
1018
16%
48%
23%
5%
8%
64%
28%
BG
1000
13%
40%
10%
5%
32%
53%
15%
CZ
1050
14%
47%
24%
4%
11%
61%
28%
DK
1016
24%
47%
16%
4%
9%
71%
20%
D-W
1006
20%
46%
17%
6%
11%
66%
23%
DE
1523
21%
45%
17%
6%
11%
66%
23%
D-E
517
25%
42%
20%
6%
7%
67%
26%
EE
1003
12%
42%
26%
6%
14%
54%
32%
EL
1000
24%
50%
18%
5%
3%
74%
23%
ES
1003
14%
41%
11%
2%
32%
55%
13%
FR1035
16%
45%
19%
6%
14%
61%
25%
IE1000
19%
49%
9%
3%
20%
68%
12%
IT1060
18%
48%
13%
5%
16%
66%
18%
CY
504
40%
41%
4%
3%
12%
81%
7%
CY (
tcc)
500
19%
18%
12%
15%
36%
37%
27%
LV1001
8%
36%
27%
12%
17%
44%
39%
LT1010
9%
41%
20%
9%
21%
50%
29%
LU504
15%
48%
19%
8%
10%
63%
27%
HU
1023
14%
49%
17%
5%
15%
63%
22%
MT
500
14%
29%
9%
5%
43%
43%
14%
NL
1044
16%
36%
25%
10%
13%
52%
35%
AT
1000
21%
47%
16%
3%
13%
68%
19%
PL1000
12%
51%
14%
3%
20%
63%
17%
PT1000
14%
40%
12%
2%
32%
54%
14%
RO
1043
18%
34%
13%
7%
28%
52%
20%
SI
1008
29%
40%
15%
6%
10%
69%
21%
SK
1025
17%
55%
14%
4%
10%
72%
18%
FI1017
10%
46%
27%
6%
11%
56%
33%
SE
1017
29%
43%
11%
6%
11%
72%
17%
UK
1314
14%
47%
18%
5%
16%
61%
23%
HR
1000
16%
45%
13%
5%
21%
61%
18%
TR
1005
10%
19%
13%
17%
41%
29%
30%
MK
1009
21%
31%
13%
11%
24%
52%
24%
QE4.4
Pour
chac
une
des
affirm
atio
ns
suiv
ante
s,ve
uill
ezm
edire
sivo
us
êtes
tout
àfa
itd’a
ccord
,plu
tôt
d’a
ccord
,plu
tôt
pas
d’a
ccord
ou p
as d
u t
out
d’a
ccord
. Q
E4.4
For
each
of
the
follo
win
gst
atem
ents
,ple
ase
tell
me
whet
her
you
tota
llyag
ree,
tend
toag
ree,
tend
todis
agre
eor
tota
llydis
agre
e.
La lutt
e co
ntr
e le
chan
gem
ent
clim
atiq
ue
peu
t av
oir u
n e
ffet
posi
tif
sur
l’éco
nom
ie e
uro
pée
nne
Fighting c
limat
e ch
ange
can h
ave
a posi
tive
im
pac
t on t
he
Euro
pea
n e
conom
y
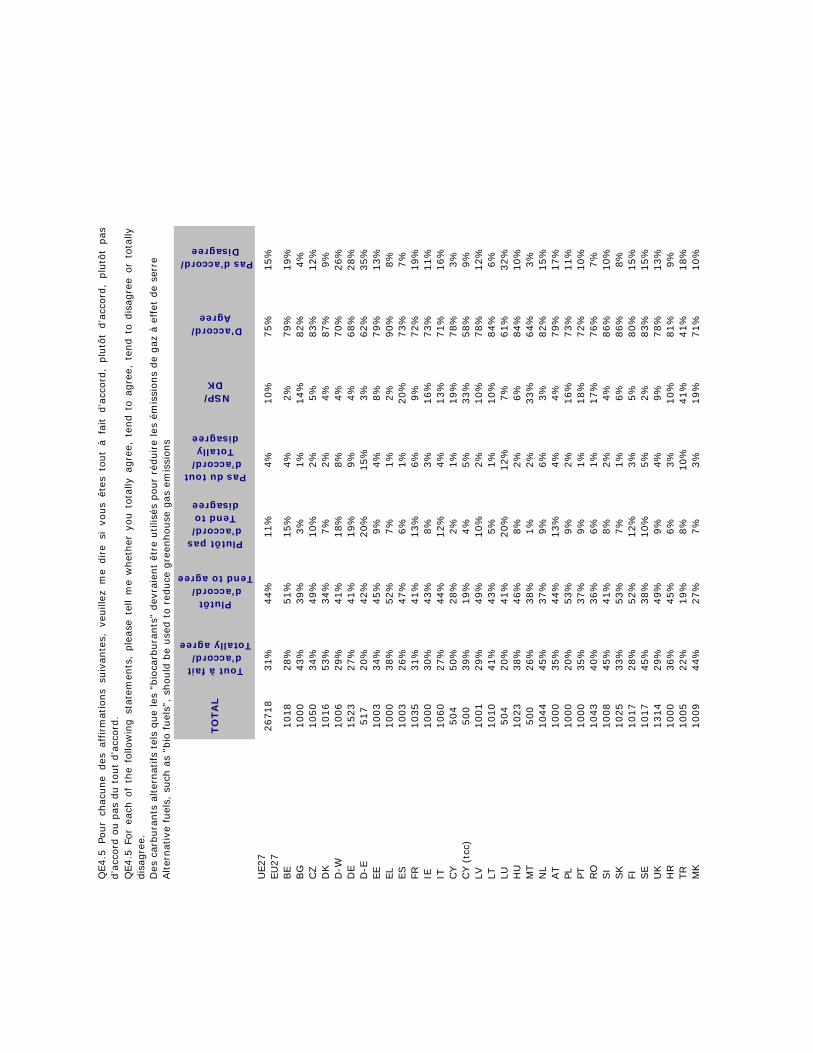
TO
TA
L
Tout à fait d’accord/
Totally agree
Plutôt d’accord/
Tend to agree
Plutôt pas d’accord/Tend to disagree
Pas du tout d’accord/
Totally disagree
NSP/DK
D'accord/Agree
Pas d'accord/Disagree
UE27
EU
27
26718
31%
44%
11%
4%
10%
75%
15%
BE
1018
28%
51%
15%
4%
2%
79%
19%
BG
1000
43%
39%
3%
1%
14%
82%
4%
CZ
1050
34%
49%
10%
2%
5%
83%
12%
DK
1016
53%
34%
7%
2%
4%
87%
9%
D-W
1006
29%
41%
18%
8%
4%
70%
26%
DE
1523
27%
41%
19%
9%
4%
68%
28%
D-E
517
20%
42%
20%
15%
3%
62%
35%
EE
1003
34%
45%
9%
4%
8%
79%
13%
EL
1000
38%
52%
7%
1%
2%
90%
8%
ES
1003
26%
47%
6%
1%
20%
73%
7%
FR1035
31%
41%
13%
6%
9%
72%
19%
IE1000
30%
43%
8%
3%
16%
73%
11%
IT1060
27%
44%
12%
4%
13%
71%
16%
CY
504
50%
28%
2%
1%
19%
78%
3%
CY (
tcc)
500
39%
19%
4%
5%
33%
58%
9%
LV1001
29%
49%
10%
2%
10%
78%
12%
LT1010
41%
43%
5%
1%
10%
84%
6%
LU504
20%
41%
20%
12%
7%
61%
32%
HU
1023
38%
46%
8%
2%
6%
84%
10%
MT
500
26%
38%
1%
2%
33%
64%
3%
NL
1044
45%
37%
9%
6%
3%
82%
15%
AT
1000
35%
44%
13%
4%
4%
79%
17%
PL1000
20%
53%
9%
2%
16%
73%
11%
PT1000
35%
37%
9%
1%
18%
72%
10%
RO
1043
40%
36%
6%
1%
17%
76%
7%
SI
1008
45%
41%
8%
2%
4%
86%
10%
SK
1025
33%
53%
7%
1%
6%
86%
8%
FI1017
28%
52%
12%
3%
5%
80%
15%
SE
1017
45%
38%
10%
5%
2%
83%
15%
UK
1314
29%
49%
9%
4%
9%
78%
13%
HR
1000
36%
45%
6%
3%
10%
81%
9%
TR
1005
22%
19%
8%
10%
41%
41%
18%
MK
1009
44%
27%
7%
3%
19%
71%
10%
QE4.5
Pour
chac
une
des
affirm
atio
ns
suiv
ante
s,ve
uill
ezm
edire
sivo
us
êtes
tout
àfa
itd’a
ccord
,plu
tôt
d’a
ccord
,plu
tôt
pas
d’a
ccord
ou p
as d
u t
out
d’a
ccord
. Q
E4.5
For
each
of
the
follo
win
gst
atem
ents
,ple
ase
tell
me
whet
her
you
tota
llyag
ree,
tend
toag
ree,
tend
todis
agre
eor
tota
llydis
agre
e.
Des
car
bura
nts
alter
nat
ifs
tels
que
les
"bio
carb
ura
nts
" dev
raie
nt
être
utilis
és p
our
réduire
les
émis
sions
de
gaz
à e
ffet
de
serr
eAlter
nat
ive
fuel
s, s
uch
as
"bio
fuel
s",
should
be
use
d t
o r
educe
gre
enhouse
gas
em
issi
ons
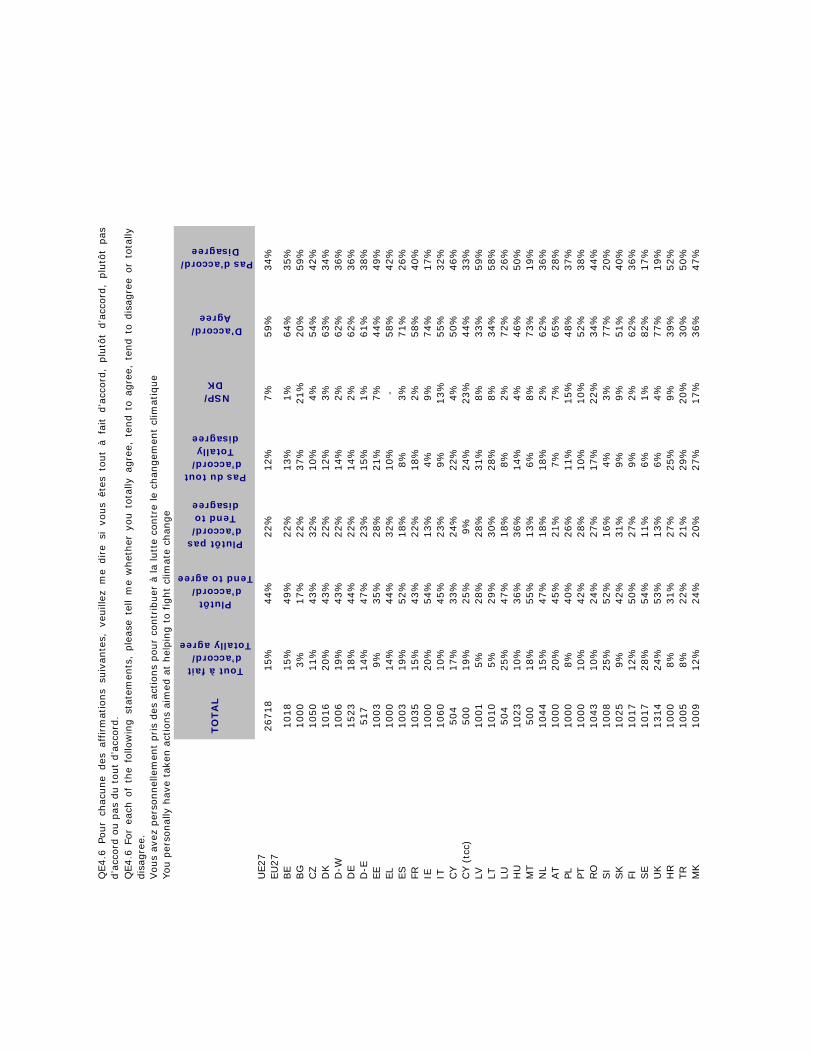
TO
TA
L
Tout à fait d’accord/
Totally agree
Plutôt d’accord/
Tend to agree
Plutôt pas d’accord/Tend to disagree
Pas du tout d’accord/
Totally disagree
NSP/DK
D'accord/Agree
Pas d'accord/Disagree
UE27
EU
27
26718
15%
44%
22%
12%
7%
59%
34%
BE
1018
15%
49%
22%
13%
1%
64%
35%
BG
1000
3%
17%
22%
37%
21%
20%
59%
CZ
1050
11%
43%
32%
10%
4%
54%
42%
DK
1016
20%
43%
22%
12%
3%
63%
34%
D-W
1006
19%
43%
22%
14%
2%
62%
36%
DE
1523
18%
44%
22%
14%
2%
62%
36%
D-E
517
14%
47%
23%
15%
1%
61%
38%
EE
1003
9%
35%
28%
21%
7%
44%
49%
EL
1000
14%
44%
32%
10%
- 58%
42%
ES
1003
19%
52%
18%
8%
3%
71%
26%
FR1035
15%
43%
22%
18%
2%
58%
40%
IE1000
20%
54%
13%
4%
9%
74%
17%
IT1060
10%
45%
23%
9%
13%
55%
32%
CY
504
17%
33%
24%
22%
4%
50%
46%
CY (
tcc)
500
19%
25%
9%
24%
23%
44%
33%
LV1001
5%
28%
28%
31%
8%
33%
59%
LT1010
5%
29%
30%
28%
8%
34%
58%
LU504
25%
47%
18%
8%
2%
72%
26%
HU
1023
10%
36%
36%
14%
4%
46%
50%
MT
500
18%
55%
13%
6%
8%
73%
19%
NL
1044
15%
47%
18%
18%
2%
62%
36%
AT
1000
20%
45%
21%
7%
7%
65%
28%
PL1000
8%
40%
26%
11%
15%
48%
37%
PT1000
10%
42%
28%
10%
10%
52%
38%
RO
1043
10%
24%
27%
17%
22%
34%
44%
SI
1008
25%
52%
16%
4%
3%
77%
20%
SK
1025
9%
42%
31%
9%
9%
51%
40%
FI1017
12%
50%
27%
9%
2%
62%
36%
SE
1017
28%
54%
11%
6%
1%
82%
17%
UK
1314
24%
53%
13%
6%
4%
77%
19%
HR
1000
8%
31%
27%
25%
9%
39%
52%
TR
1005
8%
22%
21%
29%
20%
30%
50%
MK
1009
12%
24%
20%
27%
17%
36%
47%
QE4.6
Pour
chac
une
des
affirm
atio
ns
suiv
ante
s,ve
uill
ezm
edire
sivo
us
êtes
tout
àfa
itd’a
ccord
,plu
tôt
d’a
ccord
,plu
tôt
pas
d’a
ccord
ou p
as d
u t
out
d’a
ccord
. Q
E4.6
For
each
of
the
follo
win
gst
atem
ents
,ple
ase
tell
me
whet
her
you
tota
llyag
ree,
tend
toag
ree,
tend
todis
agre
eor
tota
llydis
agre
e.
Vous
avez
per
sonnel
lem
ent
pris
des
act
ions
pour
contr
ibuer
à la
lutt
e co
ntr
e le
chan
gem
ent
clim
atiq
ue
You p
erso
nal
ly h
ave
take
n a
ctio
ns
aim
ed a
t hel
pin
g t
o f
ight
clim
ate
chan
ge