europeana dsi 2 access to digital resources of … d4_4_europeana...europeana dsi 2– access to...
TRANSCRIPT
Europeana DSI 2– Access to Digital
Resources of European Heritage
Deliverable
D4.4. Report on ENUMERATE Core Survey 4
Revision final
Date of submission 31.08.2017
Author(s) Gerhard Jan Nauta, Wietske van den Heuvel and Stephanie
Teunisse, DEN Foundation (NL)
Dissemination Level Public
D4.4: Report on ENUMERATE survey
2
REVISION HISTORY AND STATEMENT OF ORIGINALITY
Revision History
Revision
No. Date Author Organisation Description
0.1 15/04/2017 Gerhard Jan Nauta DEN Foundation First draft of the report
0.2 14/07/2017
Wietske van den
Heuvel, Gerhard Jan
Nauta
DEN Foundation Full structure, without
graphs and tables
0.3 28/07/2017
Wietske van den
Heuvel, Gerhard Jan
Nauta
DEN Foundation
Calculating results,
inserting graphs, checking
numbers
0.4 04/08/2017 Gerhard Jan Nauta DEN Foundation Rewriting body text
0.5 14/08/2017 Stephanie Teunisse,
Gerhard Jan Nauta DEN Foundation
Updating various
paragraphs based on
corrected data and graphs
0.6 22/08/2017
Wietske van den
Heuvel, Stephanie
Teunisse, Gerhard
Jan Nauta
DEN Foundation Editorial work
1 31/08/2017
Wietske van den
Heuvel, Gerhard Jan
Nauta, Marco de
Niet, Stephanie
Teunisse
DEN Foundation Final version
Statement of originality: This deliverable contains original unpublished work except where clearly indicated otherwise.
Acknowledgement of previously published material and of the work of others has been made
through appropriate citation, quotation or both.
Acknowledgements: The authors would like to thank the following people and institutions who have contributed to this
research: Marco de Niet (DEN Foundation), Europeana Office, Martin Ure (Federal Chancellery
Austria), Anna Calderone (Belspo), Axenia Boneva (Ministry of Culture, Bulgaria), Yvona Havel
(Ministry of Culture, Czech Republic), Ülle Talihärm (Ministry of Culture, Estonia), Minna
Karvonen and Tarja Ahlgren (Ministry of Education and Culture, Finland), Monika Hagedorn-
Saupe (Institute for Museum Research, SMB), Eleni Malliou (National Documentation Center,
Greece), Maté Toth (National Library Széchényi, Hungary), Joan Ward (Libraries Development
Local Government Management Agency, Ireland), Antonella Fresa (Promotor, Italy), Jānis
Ziediņš (Ministry of Culture, Latvia), Laimis Mikelevičius (Ministry of Culture of the Republic of
Lithuania), Agata Krawczyk and Agnieszka Leszyńska (Ministry of Culture and National Heritage,
Poland), Margarida Lopes (National Library Portugal), Gorazd Vodeb and Mija Božič (National
University Library Slovenia), Concha Vilariño Periáñez (Ministry of Education, Culture and Sport,
Spain), Moa Ranung (Digisam, Sweden), Genevieve Clavel-Merrin (National Library Switzerland).
D4.4: Report on ENUMERATE survey
3
Table of Contents
Executive Summary ........................................................................................................ 5
1. Introduction: the state of digitisation in European memory institutions ................ 8
2. Response to the survey ............................................................................................ 10
2.1 Response per country ............................................................................................ 10 2.2 Response per type of institution ............................................................................. 11 2.3 Institutions by Annual budget ................................................................................. 13 2.4 Institutions by Number of paid staff ........................................................................ 14
3. Collections and Digitisation activity [Supply] ......................................................... 15
3.1 Long-term collection care ....................................................................................... 15 3.2 Digital collections ................................................................................................... 15 3.3 Digital strategies .................................................................................................... 16
3.3.1 Do institutions have digital strategies? ............................................................. 16 3.3.2 What topics do the digital strategies cover? ..................................................... 17
3.4 Born digital collections ........................................................................................... 18 3.5 Object types ........................................................................................................... 20
3.5.1 Text-based resources (excluding archival materials) ....................................... 22 3.5.2 Visual 2D resources (excluding archival materials) .......................................... 22 3.5.3 Archival records ............................................................................................... 23 3.5.4 3D man-made resources .................................................................................. 23 3.5.5 Natural resources ............................................................................................. 24 3.5.6 Geography based resources ............................................................................ 24 3.5.7 Time-based resources ..................................................................................... 25 3.5.8 Digital interactive resources (“exclusively digital”) ............................................ 25
3.6 Digital cataloguing .................................................................................................. 26 3.7 Digitisation progress............................................................................................... 27
4. Digital access ............................................................................................................. 29
4.1 Availability online of heritage collections metadata ................................................ 29 4.2 Availability online of digitally reproduced and born digital heritage collections ....... 29 4.3 Copyright conditions............................................................................................... 31
4.3.1 Status of copyright conditions for metadata ..................................................... 32 4.3.2 Status of copyright conditions for full content ................................................... 32
4.4 Reasons for providing digital access ...................................................................... 33 4.5. Channels used to offer access to the digital collections ........................................ 33
4.5.1 Offline and online accessibility of digital collections ......................................... 34 4.5.2 Popularity of the main online access channels ................................................ 35
5. Participation ............................................................................................................... 37
5.1 Measuring the use of digital collections .................................................................. 37 5.1.1 Percentages of institutions measuring ............................................................. 37 5.1.2 How the institutions are measuring .................................................................. 38
5.2 Number of visits to the digital collections on the institutional website .................... 39 6. Digital preservation ................................................................................................... 41
6.1 Digital preservation strategy ................................................................................... 41 6.2 Use of international standards for digital preservation ........................................... 43
D4.4: Report on ENUMERATE survey
4
7. Digitisation Expenditures ......................................................................................... 45
7.1 Internal and external budgets ................................................................................. 45 7.2 Incidental and structural costs ................................................................................ 46 7.3 In-house costs and outsourced costs ..................................................................... 47 7.5 Paid staff and volunteers ........................................................................................ 50 7.6 Funding .................................................................................................................. 50
Appendix – Core Survey 4 Questionnaire ................................................................... 52
D4.4: Report on ENUMERATE survey
5
Executive Summary This Report on ENUMERATE Core Survey 4 [Core Survey 4, 2017] is part of a series and represents the fifth major study into the current state of digitisation in Europe: in 2008 the NUMERIC Study was done, followed in 2011 and 2013 by Core Survey 1 and Core Survey 2, which were organised by the ENUMERATE Thematic Network1. Subsequent surveys were run as part of the Europeana initiative. Core Survey 3 was effectuated between February and May 2015. The present Core Survey 4 firmly establishes the series of biennial research efforts. The survey was organised under the umbrella of Europeana DSI-2. The number of respondents is comparable to 2015: close to 1.000 institutions responded between May and July 2017. The first response dates from May 9th 2017; the last response was registered on July 3rd 2017.
What was different is the level of participation in the various European countries. In some countries (Greece, Poland, the Netherlands) response increased substantially, in others it topped off. As in earlier editions, the ENUMERATE Team was dependent on the cooperation of the network of national coordinators in the EU member states. The survey was published in 12 languages and response came from 28 countries.
The survey topics are here presented under the following headings:
Digital Collections
Digitisation Activity
Digital Access
Participation
Digital preservation
Digitisation expenditures
Highlights of the report’s findings are:
Digital Collections
82% of institutions in the sample have a digital collection or are engaged in digitisation activities (84% in Core Survey 3; 87% in Core Survey 2; 83% in Core Survey 1);
42% of the institutions have a written digital strategy (34% in Core Survey 1; 36% in Core Survey 2; 41% in Core Survey 3);
Of those institution having a digital strategy this strategy addresses: digitisation of analogue collections (90%); selection and acquisition of digital collections (39%); publishing digital collections (79%) and long-term digital preservation (64%);
Most institutions curate a rich mix of heritage materials, which confirms the outcomes of both Core Survey 1 to Core Survey 3;
Most mentioned object type as part of the heritage collection of the institutions is text based (89%) and visual 2D (89%) followed by archival records (74%), time based material (67%) and 3D man-made material (63%). These percentages are close to the percentages in earlier surveys.
Digitisation Activity
59% of the institutions have born digital items (52% in Core Survey 1, 53% in Core Survey 2, 60% in Core Survey 3);
1 The results from the previous surveys are published on the ENUMERATE Observatory,
http://pro.europeana.eu/structure/enumerate
D4.4: Report on ENUMERATE survey
6
On average 58% of the heritage collections has been catalogued in a collection database (this was also found in Core Survey 3);
On average 22% of the heritage collections has been digitally reproduced (in Core Survey 1, Core Survey 2 and Core Survey 3 these figures were 20%,17% and 23% respectively)
54% still needs to be reproduced (in Core Survey 1 this was 57%; in Core Survey 2 52%; in Core Survey 3 50%);
For an estimated 24% of the collections there is no need to digitally reproduce collection items (in Core Survey 3 this estimate was 27%).
Digital Access
Overall institutions report that they have 51% of their descriptive metadata online for general use. Libraries are at the high end for this indicator (76%), whereas museums have the lowest score (33%);
Overall institutions report that they have 36% of their digitally reproduced and born digital heritage collections online for general use. Again libraries are at the high end for this indicator (58%), whereas the category “Other types of institution” have the lowest score (21%);
As in previous core surveys Academic research is perceived2 as the most important reason to provide digital access to the collection (graded with a score of 8.8), followed by educational use of the collection (8.5). Least important reason is sales and commercial licensing (2.7);
42% of the digital objects managed by the institutions is not available online;
For the digital objects that are available online 51% is available on the institutional website, which is still the most popular channel for the institutions to provide access to their digital collections;
In Core Survey 4 respondents foresee a decrease (-4%) in the number of digital objects that will be available through the institutional website in in the next two years (in Core Survey 1 and Core Survey 2 there was an increase; in Core Survey 3 the decrease was estimated at -5%);
Channels for which a substantial growth is expected over the next two years are Social media platforms (+25%); Wikipedia (+14%); (other) aggregators (+11%) and Europeana (+5%);
Participation
49% of all institutions measure the use of digital collections, this is a slightly lower percentage than in previous surveys (42% in Core Survey 1, 51% in Core Survey 2; Core Survey 3 52%);
90% of the institutions that do measure the use, use web statistics (this is about the same percentage as in Core Survey 2 and 3);
A first tentative measurement of the average annual website based visits to digital collections per institution (n=189) is 1.066.613. The usefulness of this kind of data can only be determined after future surveys with a similar question.
Digital preservation
27% of the institutions have a written digital preservation strategy that is endorsed by the management (23% in Core Survey 1; 26% in Core Survey 2 and Core Survey 3);
2 Based on a scale of 1 to 10, where 1 is ‘not important’ and 10 is ‘very important’
D4.4: Report on ENUMERATE survey
7
45% of the institutions do not yet have a solution for long term preservation based on international standards for digital preservation (this was 48% in Core Survey 2; 47% in Core Survey 3)
National archives and national libraries are ‘front runners’ in using digital archives that meet the international criteria for long term preservation.
Digitisation Expenditures
The estimated average budget for digital collections is €446.271 (however, this figure is highly determined by a few institutions with very large budgets);
An average of 11 (Core Survey 3: 8) people are involved on a full-time basis in digital collection activities: 7 fte paid staff and 4 fte volunteers (the ratio in Core Survey 2 was 5:3; in Core Survey 3 it was 6:2);
About 53% of the costs are qualified as being incidental cost and 47% are structural costs. This is more or less the same ratio that emerged in Core Survey 2 and 3.
In Core Survey 4 73% of the costs are in-house costs (Core Survey 3 74%) and 27% are out-of-pocket costs for external service providers (in Core Survey 2 this was 26%);
Digital collection activities are funded by internal budgets (90% of the institutions). National public grants are available to 43% of the respondents. 18% receive regional or local public grants. The results are very similar to the results of Core Survey 1, 2 and 3.
General conclusions
Overall, the results of the 4th ENUMERATE core survey are in line with the findings in previous ENUMERATE surveys. This observation strengthens the ENUMERATE team in the assumption that the methodology and the conceptual framework of the ENUMERATE core survey is by now tried and tested.
Some results of CS4 demonstrate a sure but steady increase of the impact of digitisation on the institutions (e.g. the number of staff and volunteers); some appear to be steady across all surveys; others may even show a small decline compared to earlier findings. This does not necessarily mean that the cultural heritage sector is regressing. One possible explanation for the lower outcomes could be the changes among the population of respondents. Some results from previous editions of the ENUMERATE survey were sometimes criticized for being too positive, as the respondents may belong to the group of frontrunners in the area of digitisation of cultural heritage. So the lower values in this survey report might indicate a small correction on previous findings. However, as the data submitted by the respondents is treated anonymously, this cannot be verified.
Given the fact that the differences among the results of the four surveys are small (if at all present), the question is justified whether the distance in time between the surveys is significant enough. Perhaps the frequency of a biennial survey proves to be too high. The ENUMERATE team recommends to have a discussion with all the stakeholders of this survey (Europeana, EU-DG CNCT, DCHE and the national coordinators) to decide whether the ENUMERATE core survey should be held every 4 or 5 years. This may also solve another issue: the number of respondents to the ENUMERATE Core Surveys show a steady decline across the years. If there are no major changes to report, an institution will be less likely to participate again in a new survey.
Finally, the level of responses to Core Survey 4 proves the importance of the national coordinators. Only some countries will be able to process the ENUMERATE data into a national country report. We cannot stress enough the need for a strong commitment from and support for the national coordinators (who volunteered to do this) and the policy makers they represent. We call on all the stakeholders mentioned above to make this happen in future surveys.
D4.4: Report on ENUMERATE survey
8
1. Introduction: the state of digitisation in European memory institutions With Core Survey 4 the ENUMERATE team builds on the experience and results of earlier EU supported survey efforts, starting with the NUMERIC Study of 2008; Core Survey 1 and 2 in 2011 and 2013 - major accomplishments of the ENUMERATE Thematic Network -, and Core Survey 3, which was the first survey under the auspices of Europeana. The present Core Survey 4 firmly establishes the series of biennial research efforts among European memory institutions: institutions having collections that need to be preserved for future generations.3 The survey focusses on the state of digitisation, i.e. the size and growth of digital heritage collections; the channels through which these are published to the intended audiences, open for use and reuse; and the policies and costs involved. All mentioned survey efforts helped shaping the ENUMERATE Conceptual Framework, which is now a fairly consistent methodology for monitoring the state of [European] digital heritage collections: the progress made in the creation, management, use and preservation of digital collections in European cultural heritage institutions. Both the conceptual framework and the results of the subsequent surveys are made accessible on the Europeana Professional website.4 In this report are thus presented the results of Core Survey 4. Using part of the Europeana budget our research was funded by the European Commission within the Connecting Europe Facility (CEF). The available budget for developing and implementing the survey was modest compared to the first two editions (as part of the Thematic Network funding), but more or less similar to the budget for Core Survey 3. However, we had to redo the programming of the questionnaire. In Core Survey 3 we could mostly reuse the application that was developed for the preceding survey, but changes in the questionnaire - the content and structure was modified - forced the ENUMERATE Team to program the online questionnaire afresh. To avoid budget overruns instruments used to implement the survey, other than the online questionnaire, were left unaltered as much as possible. The Guide to Managing the ENUMERATE Core Survey 4 was an updated version of the guide used for Core Survey 3.5 Covering letters and other communication tools were reused with only minor adaptations. The existent network of national coordinators was revitalised to represent the ENUMERATE Team in all the EU member states. In about one third of the countries new representatives were invited to join the project. Unfortunately in 5 EU member states the search for (new) coordinators took too much time and was unsuccessful in the end. Also some other Europeana but non-EU member states participated again in the survey. An Amsterdam-based research & survey company, Bureau Lahaut, was contracted to program the twelve translations of the survey and assist in minor adjustments in the test phase. The ENUMERATE team at DEN took care of all other activities: launching the survey; inviting respondents in cases where lists of e-mail addresses were available; explaining the methodology; giving advice to national coordinators; responding to questions; etc.
3 Cf. question #4 of the Core Survey 4 questionnaire: http://pro.europeana.eu/page/core-survey-4 4 Refer to: http://pro.europeana.eu/enumerate/statistics/results. 5 Refer to: http://pro.europeana.eu/files/Europeana_Professional/Projects/Project_list/ENUMERATE/other_documentation/guide-to-managing-the-enumerate-core-survey-4- final.pdfhttp://pro.europeana.eu/files/Europeana_Professional/Projects/Project_list/ENUMERATE/other_documentation/questionnaire-cs-4-2017-dutch.pdf
D4.4: Report on ENUMERATE survey
9
Due to the limited budget, a central database with contact details could not be constructed, as was in fact also the case in Core Survey 3. It was up to the national coordinators, with the help of the guidance offered by the ENUMERATE team, to stipulate a procedure for inviting the memory institutions. In some countries a more or less complete database covering memory institutions was available (the GOLD scenario). In most countries however such a database is lacking. In these cases a sample of e-mail addresses based on a wide range of sources was used (SILVER scenario). In general social media and websites were also used to invite institutions to participate in the project. The Guide to Managing the ENUMERATE Core Survey 4 offers hints and tips to construct representative samples. The least labour intensive, but also the least successful approach in terms of responsiveness, was to use an open call to participate (BRONZE scenario). An open link to a so-called Enumerate core survey 4 language selection page was the access point to the online questionnaires for all respondents. Respondents were asked to identify themselves, in order to un-duplicate responses from more than one staff member from the same institution, and for the ENUMERATE team to be able to send personalised response forms. In this report results are presented fairly straightforward, the collected data have been anonymised and where possible. Generic comparisons are made with the results of the earlier NUMERIC and ENUMERATE Core Survey outcomes.
D4.4: Report on ENUMERATE survey
10
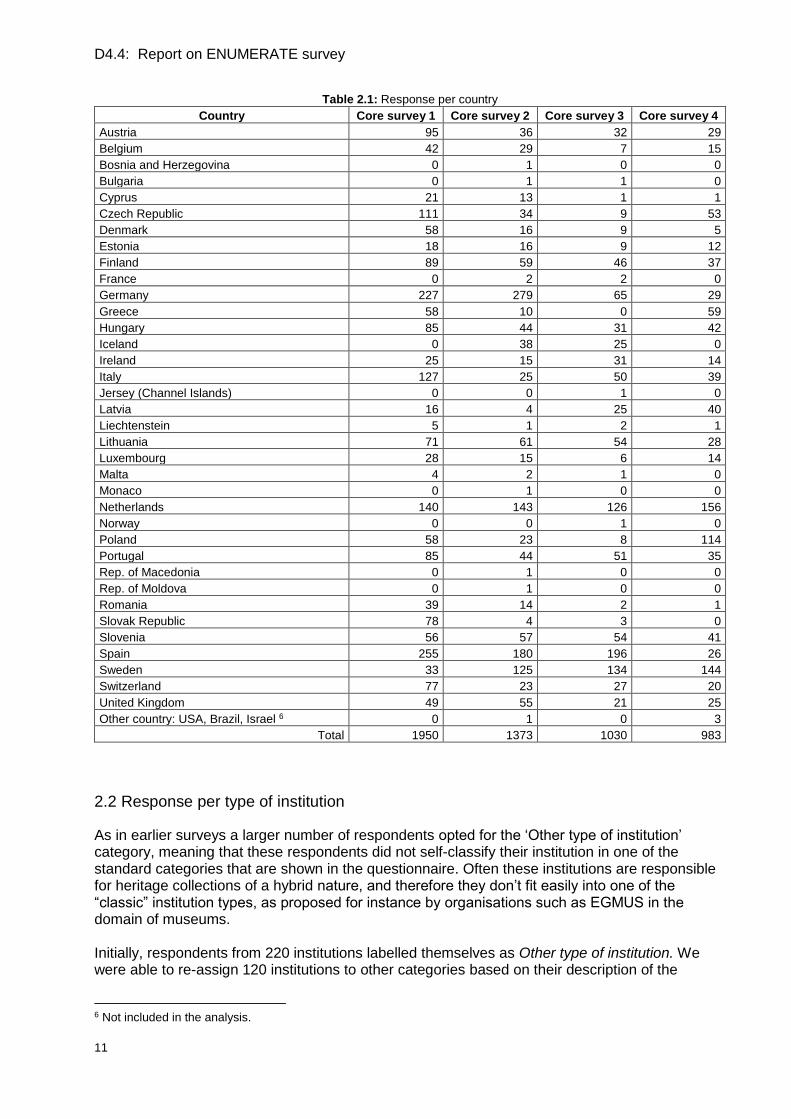
2. Response to the survey The first completed survey was registered on May 9th 2017. At the time of closing the survey (July 3rd 2017) the number of fully completed questionnaires was 806. A larger number of respondents showed some activity, however, and the number of actually usable responses amounts to 983. Respondents came from 28 countries, including a few non-EU and even non-European countries. The latter were left out in the analysis phase.
2.1 Response per country
The Netherlands, Poland and Sweden show the highest numbers of respondents. Quite a few Central and East European countries have good results too, for example the Czech Republic, Hungary, Lithuania and Slovenia. There is a striking decrease in the number of responses in Germany and Spain. On the whole the even distribution of response numbers in earlier core surveys has changed into a more pronounced picture: some countries perform remarkably well, in others the response is disappointing. Active involvement of the national coordinators proved to be the decisive factor.
D4.4: Report on ENUMERATE survey
11
Table 2.1: Response per country
Country Core survey 1 Core survey 2 Core survey 3 Core survey 4
Austria 95 36 32 29
Belgium 42 29 7 15
Bosnia and Herzegovina 0 1 0 0
Bulgaria 0 1 1 0
Cyprus 21 13 1 1
Czech Republic 111 34 9 53
Denmark 58 16 9 5
Estonia 18 16 9 12
Finland 89 59 46 37
France 0 2 2 0
Germany 227 279 65 29
Greece 58 10 0 59
Hungary 85 44 31 42
Iceland 0 38 25 0
Ireland 25 15 31 14
Italy 127 25 50 39
Jersey (Channel Islands) 0 0 1 0
Latvia 16 4 25 40
Liechtenstein 5 1 2 1
Lithuania 71 61 54 28
Luxembourg 28 15 6 14
Malta 4 2 1 0
Monaco 0 1 0 0
Netherlands 140 143 126 156
Norway 0 0 1 0
Poland 58 23 8 114
Portugal 85 44 51 35
Rep. of Macedonia 0 1 0 0
Rep. of Moldova 0 1 0 0
Romania 39 14 2 1
Slovak Republic 78 4 3 0
Slovenia 56 57 54 41
Spain 255 180 196 26
Sweden 33 125 134 144
Switzerland 77 23 27 20
United Kingdom 49 55 21 25
Other country: USA, Brazil, Israel 6 0 1 0 3
Total 1950 1373 1030 983
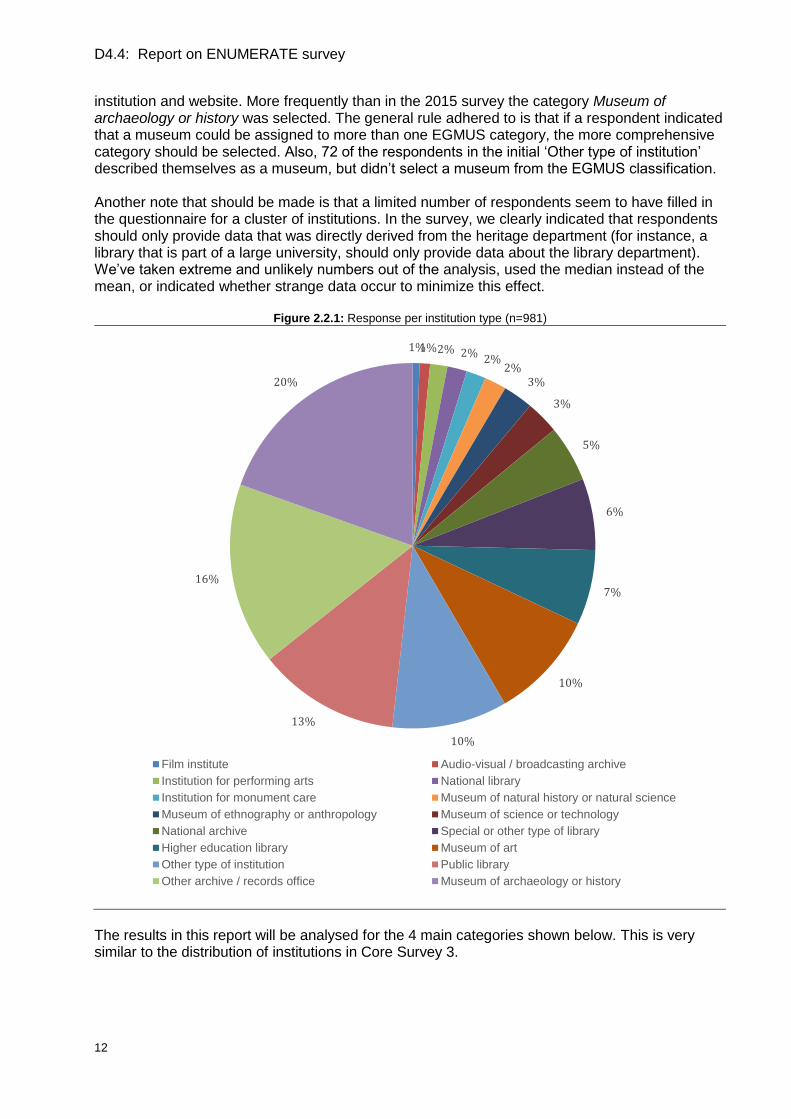
2.2 Response per type of institution
As in earlier surveys a larger number of respondents opted for the ‘Other type of institution’ category, meaning that these respondents did not self-classify their institution in one of the standard categories that are shown in the questionnaire. Often these institutions are responsible for heritage collections of a hybrid nature, and therefore they don’t fit easily into one of the “classic” institution types, as proposed for instance by organisations such as EGMUS in the domain of museums. Initially, respondents from 220 institutions labelled themselves as Other type of institution. We were able to re-assign 120 institutions to other categories based on their description of the
6 Not included in the analysis.
D4.4: Report on ENUMERATE survey
12
institution and website. More frequently than in the 2015 survey the category Museum of archaeology or history was selected. The general rule adhered to is that if a respondent indicated that a museum could be assigned to more than one EGMUS category, the more comprehensive category should be selected. Also, 72 of the respondents in the initial ‘Other type of institution’ described themselves as a museum, but didn’t select a museum from the EGMUS classification. Another note that should be made is that a limited number of respondents seem to have filled in the questionnaire for a cluster of institutions. In the survey, we clearly indicated that respondents should only provide data that was directly derived from the heritage department (for instance, a library that is part of a large university, should only provide data about the library department). We’ve taken extreme and unlikely numbers out of the analysis, used the median instead of the mean, or indicated whether strange data occur to minimize this effect.
Figure 2.2.1: Response per institution type (n=981)
The results in this report will be analysed for the 4 main categories shown below. This is very similar to the distribution of institutions in Core Survey 3.
1%1%2% 2%2%
2%3%
3%
5%
6%
7%
10%
10%
13%
16%
20%
Film institute Audio-visual / broadcasting archive
Institution for performing arts National library
Institution for monument care Museum of natural history or natural science
Museum of ethnography or anthropology Museum of science or technology
National archive Special or other type of library
Higher education library Museum of art
Other type of institution Public library
Other archive / records office Museum of archaeology or history
D4.4: Report on ENUMERATE survey
13
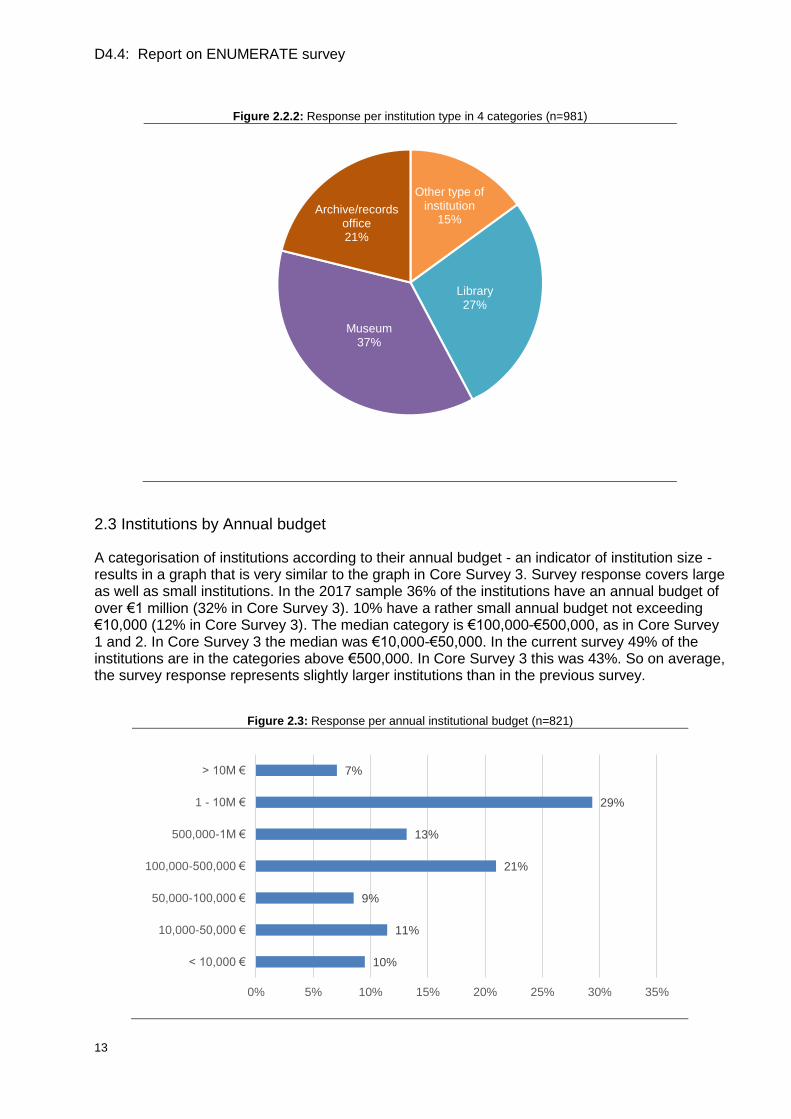
Figure 2.2.2: Response per institution type in 4 categories (n=981)
2.3 Institutions by Annual budget
A categorisation of institutions according to their annual budget - an indicator of institution size - results in a graph that is very similar to the graph in Core Survey 3. Survey response covers large as well as small institutions. In the 2017 sample 36% of the institutions have an annual budget of over €1 million (32% in Core Survey 3). 10% have a rather small annual budget not exceeding €10,000 (12% in Core Survey 3). The median category is €100,000-€500,000, as in Core Survey 1 and 2. In Core Survey 3 the median was €10,000-€50,000. In the current survey 49% of the institutions are in the categories above €500,000. In Core Survey 3 this was 43%. So on average, the survey response represents slightly larger institutions than in the previous survey.
Figure 2.3: Response per annual institutional budget (n=821)
Other type of institution
15%
Library27%
Museum37%
Archive/records office21%
10%
11%
9%
21%
13%
29%
7%
0% 5% 10% 15% 20% 25% 30% 35%
< 10,000 €
10,000-50,000 €
50,000-100,000 €
100,000-500,000 €
500,000-1M €
1 - 10M €
> 10M €

D4.4: Report on ENUMERATE survey
14
2.4 Institutions by Number of paid staff
Another indicator for the size of an institution is the number of paid staff in full-time equivalents (FTE). The average institution size in this survey was 64 FTE, which is considerably lower than in Core Survey 3 where the value was 118 FTE.
Figure 2.4.1: Average size of institutions by number of paid staff (n=802)
A methodological complication that shows up in this question - and that, moreover, may have caused the unlikely high average in Core Survey 3 - is the apparent variance in the statistical unit. If a few extreme outliers are excluded (10 in total) the averages per institutions are probably more realistic. See Figure 2.4.1.
Figure 2.4.2: Average and median size of institutions by number of paid staff; outliers removed (n=792)
Figure 2.4.2. shows the median and average values of paid staff numbers when the outliers are removed. (n=792). In this survey the median institution size is 16 FTE, whereas the values of the median in the previous core surveys varied between 12 and 15 FTE.7 7 As in previous surveys in this question it was explicitly asked to fill in the number of FTE of the staff involved in the heritage department of the institution. Although the instructions were straightforward - if your institution is part of a
63,6
92,4
94,1
48,7
42,5
0 20 40 60 80 100
Total
Other type of institution
Library
Museum
Archive/records office
53,9
76,2
70,5
48,7
35,5
16,2
30
30,5
18
8
0 20 40 60 80 100
Total
Other type of institution
Library
Museum
Archive/records office
FTE (median) FTE (average)
D4.4: Report on ENUMERATE survey
15
3. Collections and Digitisation activity [Supply]
3.1 Long-term collection care
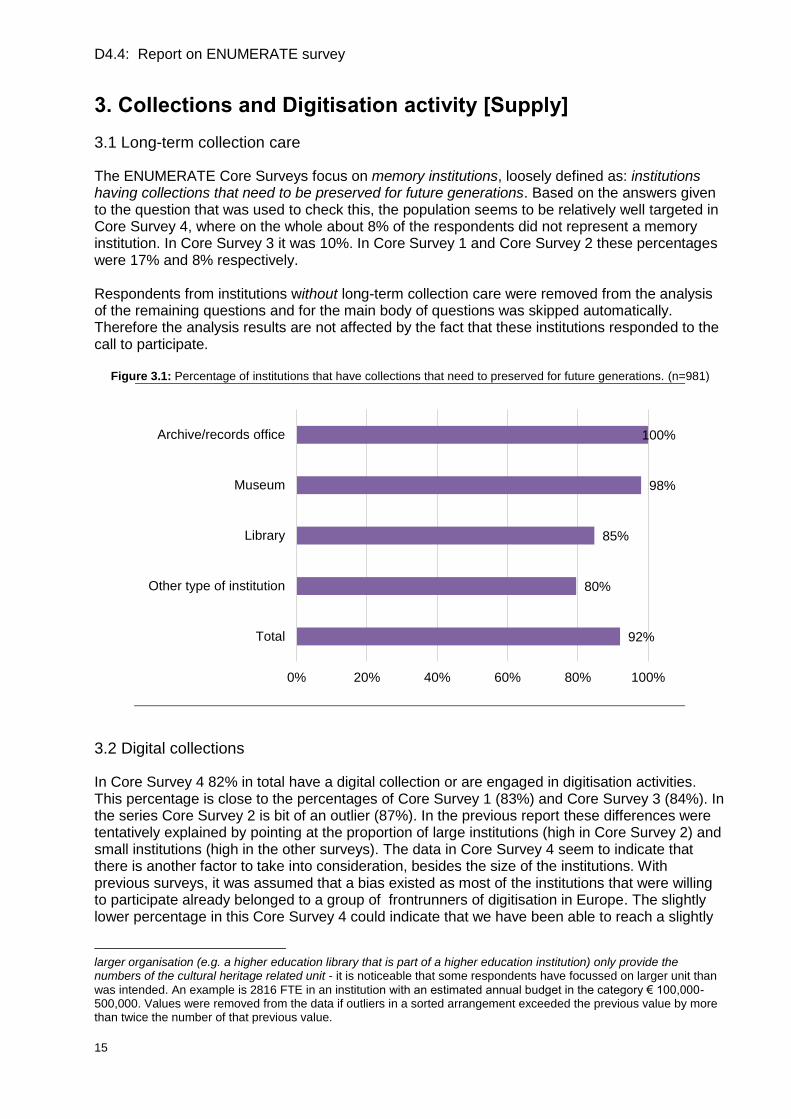
The ENUMERATE Core Surveys focus on memory institutions, loosely defined as: institutions having collections that need to be preserved for future generations. Based on the answers given to the question that was used to check this, the population seems to be relatively well targeted in Core Survey 4, where on the whole about 8% of the respondents did not represent a memory institution. In Core Survey 3 it was 10%. In Core Survey 1 and Core Survey 2 these percentages were 17% and 8% respectively. Respondents from institutions without long-term collection care were removed from the analysis of the remaining questions and for the main body of questions was skipped automatically. Therefore the analysis results are not affected by the fact that these institutions responded to the call to participate.
Figure 3.1: Percentage of institutions that have collections that need to preserved for future generations. (n=981)
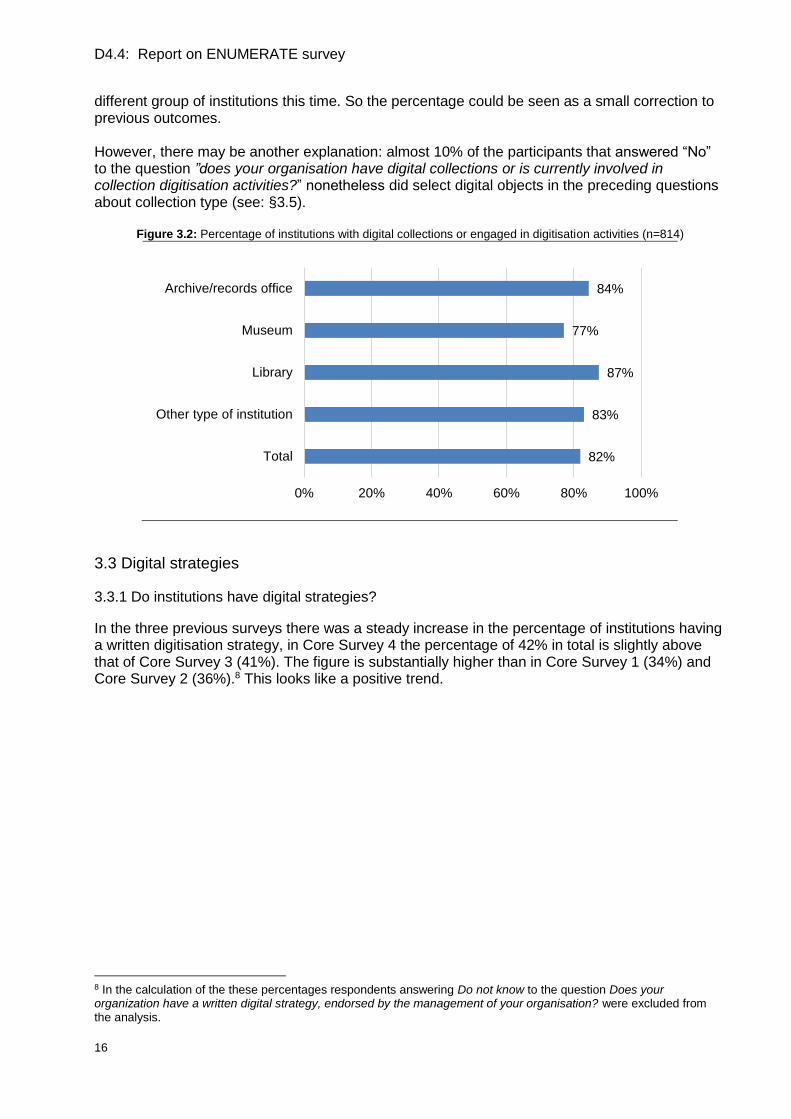
3.2 Digital collections
In Core Survey 4 82% in total have a digital collection or are engaged in digitisation activities. This percentage is close to the percentages of Core Survey 1 (83%) and Core Survey 3 (84%). In the series Core Survey 2 is bit of an outlier (87%). In the previous report these differences were tentatively explained by pointing at the proportion of large institutions (high in Core Survey 2) and small institutions (high in the other surveys). The data in Core Survey 4 seem to indicate that there is another factor to take into consideration, besides the size of the institutions. With previous surveys, it was assumed that a bias existed as most of the institutions that were willing to participate already belonged to a group of frontrunners of digitisation in Europe. The slightly lower percentage in this Core Survey 4 could indicate that we have been able to reach a slightly
larger organisation (e.g. a higher education library that is part of a higher education institution) only provide the numbers of the cultural heritage related unit - it is noticeable that some respondents have focussed on larger unit than
was intended. An example is 2816 FTE in an institution with an estimated annual budget in the category € 100,000-500,000. Values were removed from the data if outliers in a sorted arrangement exceeded the previous value by more than twice the number of that previous value.
92%
80%
85%
98%
100%
0% 20% 40% 60% 80% 100%
Total
Other type of institution
Library
Museum
Archive/records office
D4.4: Report on ENUMERATE survey
16
different group of institutions this time. So the percentage could be seen as a small correction to previous outcomes. However, there may be another explanation: almost 10% of the participants that answered “No” to the question ”does your organisation have digital collections or is currently involved in collection digitisation activities?” nonetheless did select digital objects in the preceding questions about collection type (see: §3.5).
Figure 3.2: Percentage of institutions with digital collections or engaged in digitisation activities (n=814)
3.3 Digital strategies
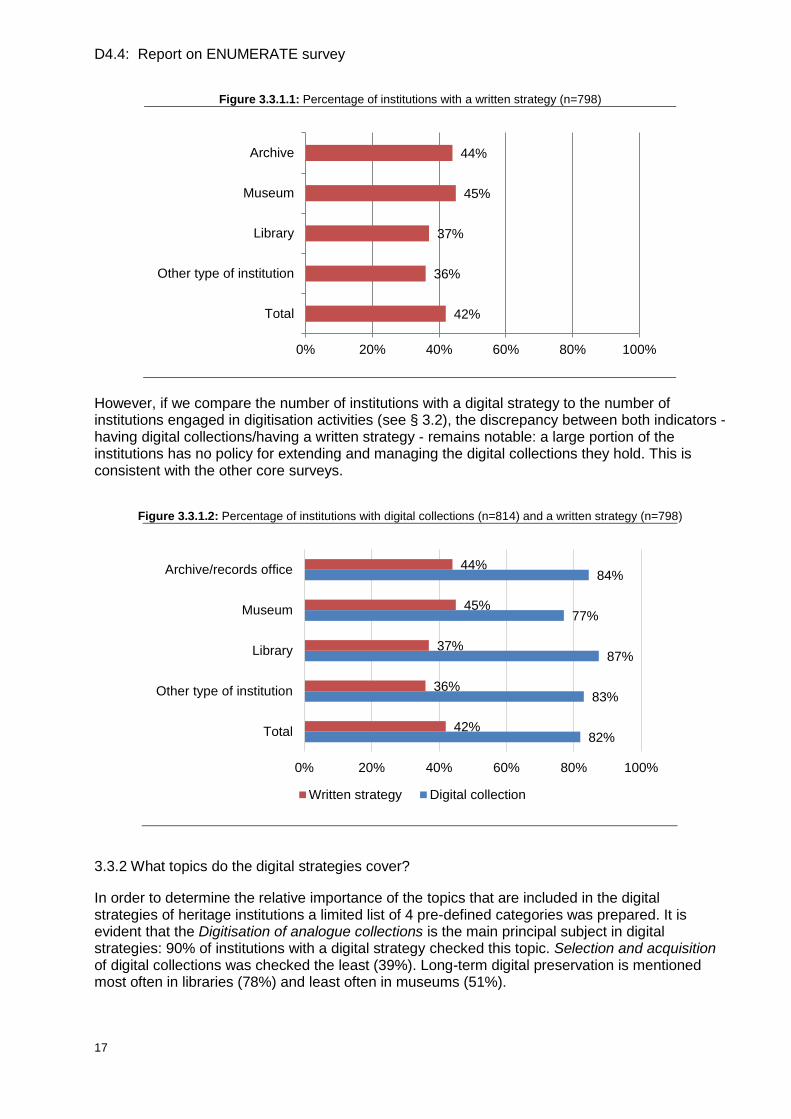
3.3.1 Do institutions have digital strategies?
In the three previous surveys there was a steady increase in the percentage of institutions having a written digitisation strategy, in Core Survey 4 the percentage of 42% in total is slightly above that of Core Survey 3 (41%). The figure is substantially higher than in Core Survey 1 (34%) and Core Survey 2 (36%).8 This looks like a positive trend.
8 In the calculation of the these percentages respondents answering Do not know to the question Does your organization have a written digital strategy, endorsed by the management of your organisation? were excluded from the analysis.
82%
83%
87%
77%
84%
0% 20% 40% 60% 80% 100%
Total
Other type of institution
Library
Museum
Archive/records office
D4.4: Report on ENUMERATE survey
17
Figure 3.3.1.1: Percentage of institutions with a written strategy (n=798)
However, if we compare the number of institutions with a digital strategy to the number of institutions engaged in digitisation activities (see § 3.2), the discrepancy between both indicators - having digital collections/having a written strategy - remains notable: a large portion of the institutions has no policy for extending and managing the digital collections they hold. This is consistent with the other core surveys.
Figure 3.3.1.2: Percentage of institutions with digital collections (n=814) and a written strategy (n=798)
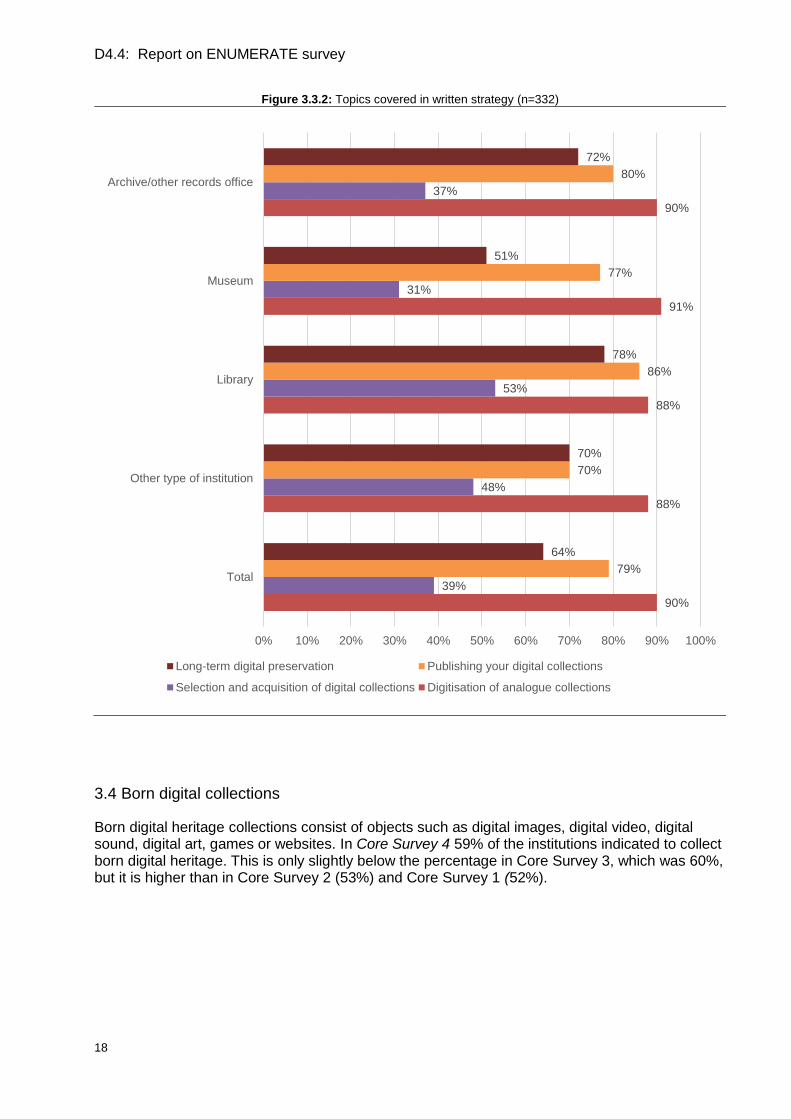
3.3.2 What topics do the digital strategies cover?
In order to determine the relative importance of the topics that are included in the digital strategies of heritage institutions a limited list of 4 pre-defined categories was prepared. It is evident that the Digitisation of analogue collections is the main principal subject in digital strategies: 90% of institutions with a digital strategy checked this topic. Selection and acquisition of digital collections was checked the least (39%). Long-term digital preservation is mentioned most often in libraries (78%) and least often in museums (51%).
42%
36%
37%
45%
44%
0% 20% 40% 60% 80% 100%
Total
Other type of institution
Library
Museum
Archive
82%
83%
87%
77%
84%
42%
36%
37%
45%
44%
0% 20% 40% 60% 80% 100%
Total
Other type of institution
Library
Museum
Archive/records office
Written strategy Digital collection
D4.4: Report on ENUMERATE survey
18
Figure 3.3.2: Topics covered in written strategy (n=332)
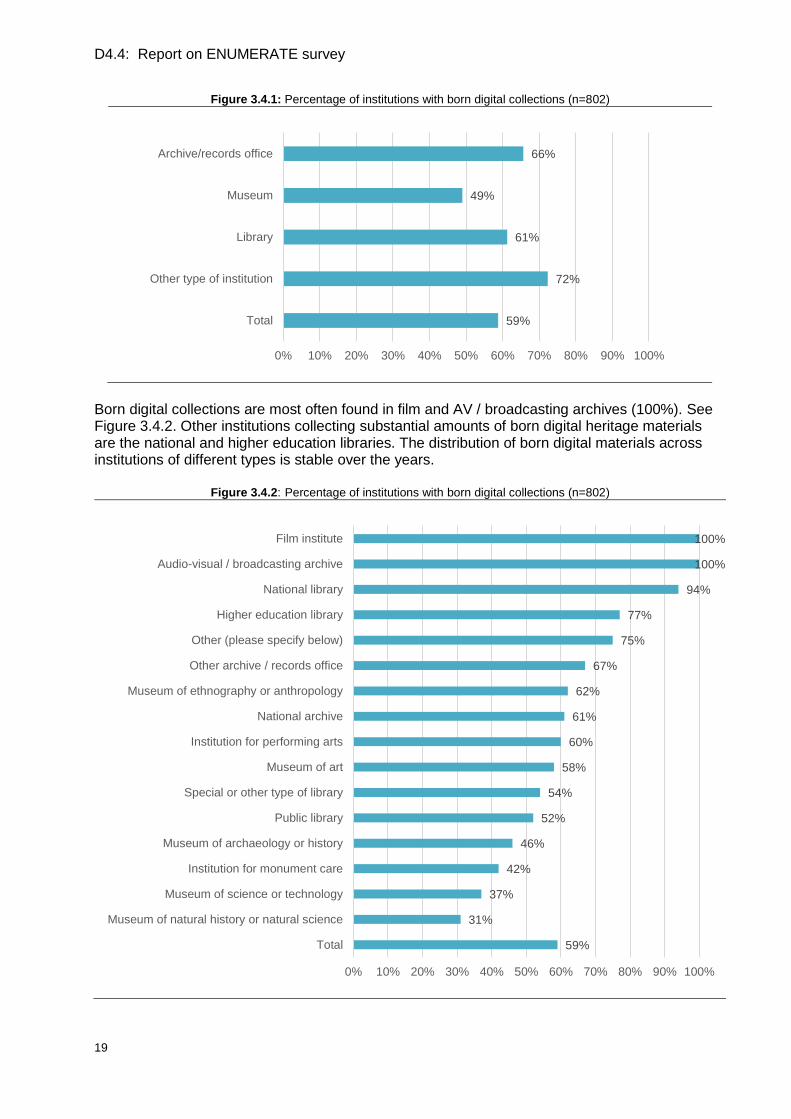
3.4 Born digital collections
Born digital heritage collections consist of objects such as digital images, digital video, digital sound, digital art, games or websites. In Core Survey 4 59% of the institutions indicated to collect born digital heritage. This is only slightly below the percentage in Core Survey 3, which was 60%, but it is higher than in Core Survey 2 (53%) and Core Survey 1 (52%).
90%
88%
88%
91%
90%
39%
48%
53%
31%
37%
79%
70%
86%
77%
80%
64%
70%
78%
51%
72%
0% 10% 20% 30% 40% 50% 60% 70% 80% 90% 100%
Total
Other type of institution
Library
Museum
Archive/other records office
Long-term digital preservation Publishing your digital collections
Selection and acquisition of digital collections Digitisation of analogue collections
D4.4: Report on ENUMERATE survey
19
Figure 3.4.1: Percentage of institutions with born digital collections (n=802)
Born digital collections are most often found in film and AV / broadcasting archives (100%). See Figure 3.4.2. Other institutions collecting substantial amounts of born digital heritage materials are the national and higher education libraries. The distribution of born digital materials across institutions of different types is stable over the years.
Figure 3.4.2: Percentage of institutions with born digital collections (n=802)
59%
72%
61%
49%
66%
0% 10% 20% 30% 40% 50% 60% 70% 80% 90% 100%
Total
Other type of institution
Library
Museum
Archive/records office
59%
31%
37%
42%
46%
52%
54%
58%
60%
61%
62%
67%
75%
77%
94%
100%
100%
0% 10% 20% 30% 40% 50% 60% 70% 80% 90% 100%
Total
Museum of natural history or natural science
Museum of science or technology
Institution for monument care
Museum of archaeology or history
Public library
Special or other type of library
Museum of art
Institution for performing arts
National archive
Museum of ethnography or anthropology
Other archive / records office
Other (please specify below)
Higher education library
National library
Audio-visual / broadcasting archive
Film institute
D4.4: Report on ENUMERATE survey
20
3.5 Object types
As in Core Survey 3 only a fairly simple, high-level question about the object types in the collection was included in the questionnaire: Please select the collection types that are part of the heritage collections of your institution. We classified heritage materials into the same eight main object types (classes) that were used in the previous core surveys. Respondents were asked to check all relevant collection types in the list, and to indicate whether their institution has these in their analogue and/or digital collections:
TEXT-BASED RESOURCES (excluding Archival Records)
VISUAL (2D) RESOURCES (excluding Archival Records)
ARCHIVAL RESOURCES (not included in 01 or 02)
3D MAN-MADE MOVABLE OBJECTS
NATURAL RESOURCES
GEOGRAPHY BASED RESOURCES
TIME BASED RESOURCES
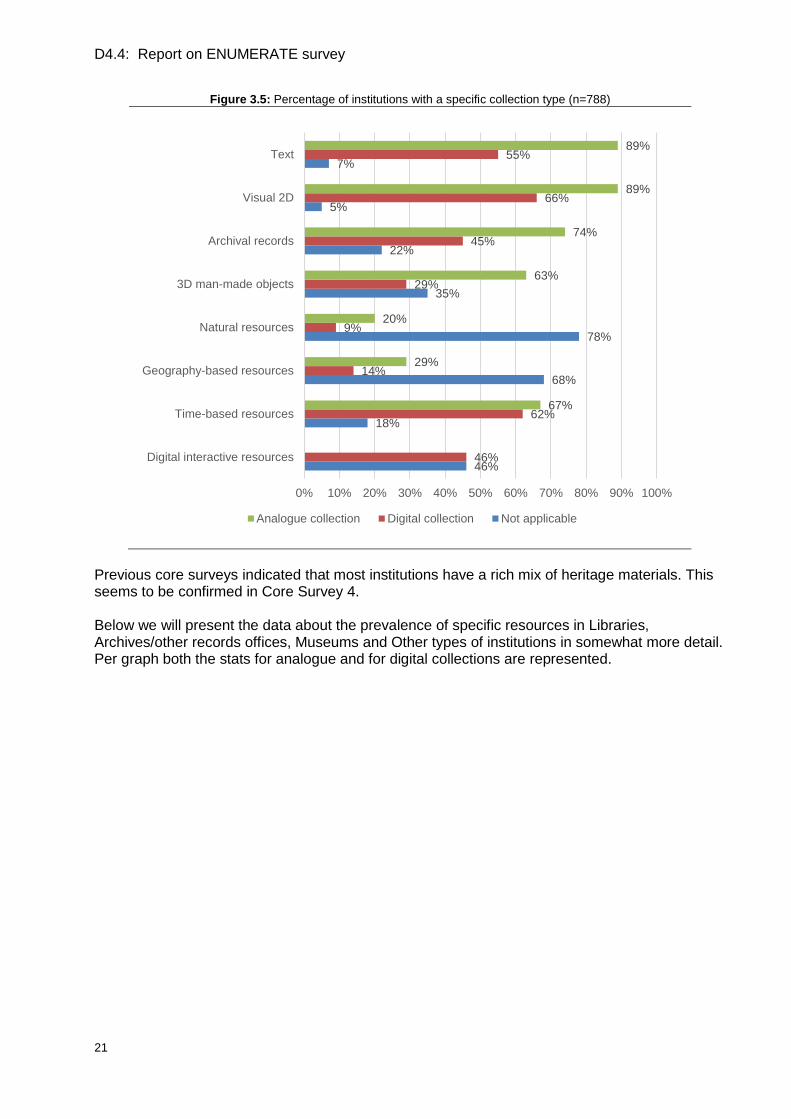
DIGITAL INTERACTIVE RESOURCES (EXCLUSIVELY DIGITAL) From the category of text based and visual (2D) resources, archival records were explicitly left out. This was done to avoid the problem of duplication that showed up in Core Survey 3, while the classification still mirrors conventional practice.9 Overall the results we found are very similar to the results in Core Survey 3. Most institutions have text-based objects and visual 2D objects in their collections. Over 60% of the institutions also have 3D man-made objects (this was 46% in Core survey 3). There is an increase in the number of institutions mentioning time-based resources (67% in the analogue collection; 62% in the digital collection; in Core Survey 3 these figures were 56% and 54% respectively). As compared to Core Survey 3 the number of institutions having digital interactive resources has not changed very much (now 46%; in 2015 it was 47%). This last category cannot be compared to the 57% mentioned in §3.4, because not all born digital materials are considered to be interactive (consider for example the differences between a digital photograph and a computer game).
9 The number of respondents is indicated as 788, which means in this case, that at 788 respondents checked at least one object type category,
D4.4: Report on ENUMERATE survey
21
Figure 3.5: Percentage of institutions with a specific collection type (n=788)
Previous core surveys indicated that most institutions have a rich mix of heritage materials. This seems to be confirmed in Core Survey 4. Below we will present the data about the prevalence of specific resources in Libraries, Archives/other records offices, Museums and Other types of institutions in somewhat more detail. Per graph both the stats for analogue and for digital collections are represented.
46%
18%
68%
78%
35%
22%
5%
7%
46%
62%
14%
9%
29%
45%
66%
55%
67%
29%
20%
63%
74%
89%
89%
0% 10% 20% 30% 40% 50% 60% 70% 80% 90% 100%
Digital interactive resources
Time-based resources
Geography-based resources
Natural resources
3D man-made objects
Archival records
Visual 2D
Text
Analogue collection Digital collection Not applicable
D4.4: Report on ENUMERATE survey
22
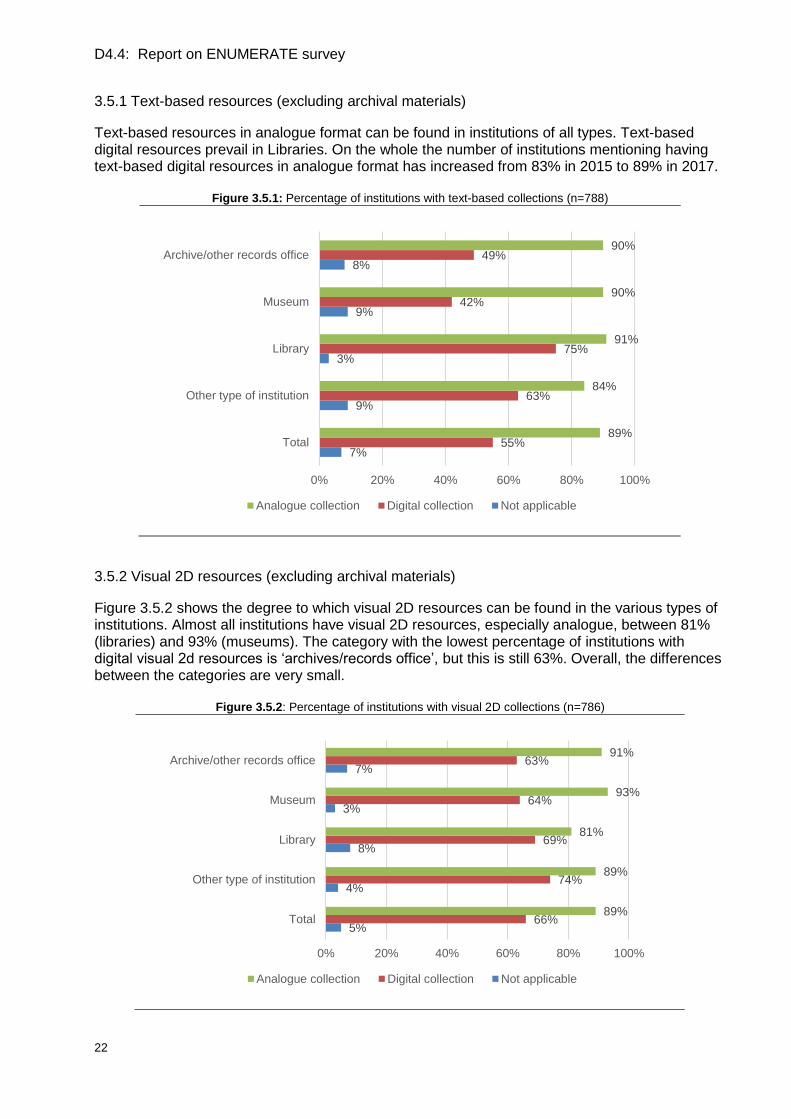
3.5.1 Text-based resources (excluding archival materials)
Text-based resources in analogue format can be found in institutions of all types. Text-based digital resources prevail in Libraries. On the whole the number of institutions mentioning having text-based digital resources in analogue format has increased from 83% in 2015 to 89% in 2017.
Figure 3.5.1: Percentage of institutions with text-based collections (n=788)
3.5.2 Visual 2D resources (excluding archival materials)
Figure 3.5.2 shows the degree to which visual 2D resources can be found in the various types of institutions. Almost all institutions have visual 2D resources, especially analogue, between 81% (libraries) and 93% (museums). The category with the lowest percentage of institutions with digital visual 2d resources is ‘archives/records office’, but this is still 63%. Overall, the differences between the categories are very small.
Figure 3.5.2: Percentage of institutions with visual 2D collections (n=786)
7%
9%
3%
9%
8%
55%
63%
75%
42%
49%
89%
84%
91%
90%
90%
0% 20% 40% 60% 80% 100%
Total
Other type of institution
Library
Museum
Archive/other records office
Analogue collection Digital collection Not applicable
5%
4%
8%
3%
7%
66%
74%
69%
64%
63%
89%
89%
81%
93%
91%
0% 20% 40% 60% 80% 100%
Total
Other type of institution
Library
Museum
Archive/other records office
Analogue collection Digital collection Not applicable
D4.4: Report on ENUMERATE survey
23
3.5.3 Archival records
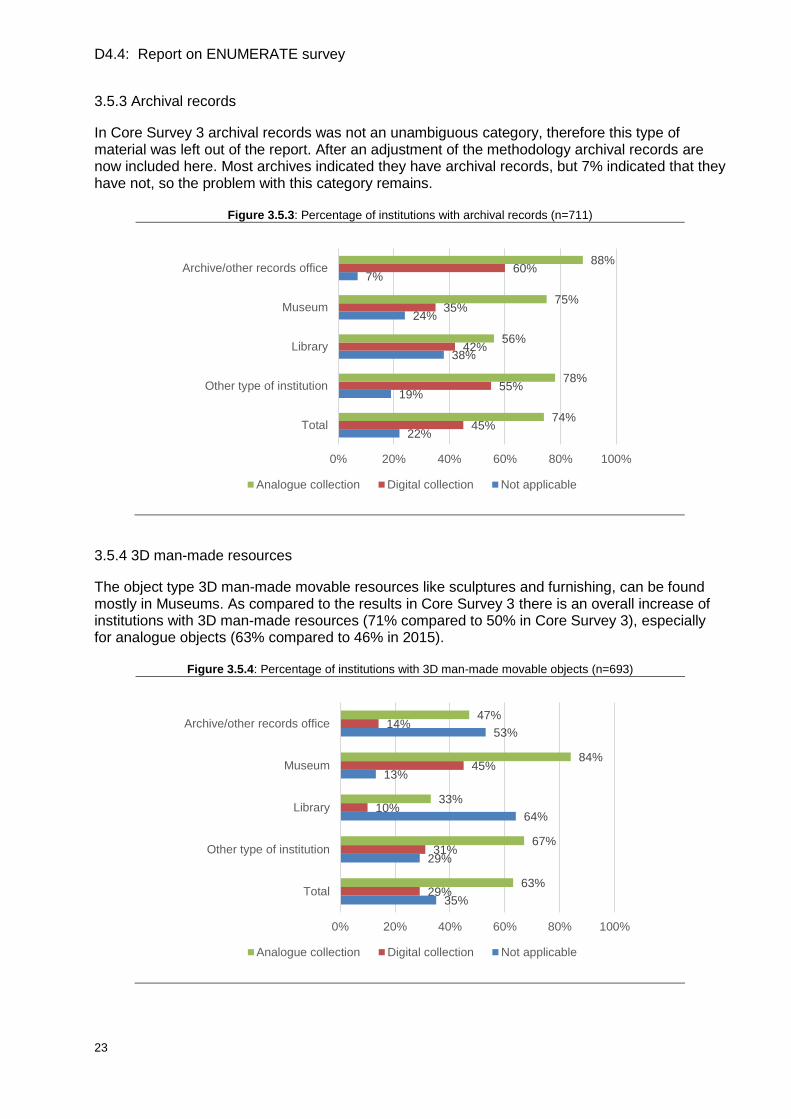
In Core Survey 3 archival records was not an unambiguous category, therefore this type of material was left out of the report. After an adjustment of the methodology archival records are now included here. Most archives indicated they have archival records, but 7% indicated that they have not, so the problem with this category remains.
Figure 3.5.3: Percentage of institutions with archival records (n=711)
3.5.4 3D man-made resources
The object type 3D man-made movable resources like sculptures and furnishing, can be found mostly in Museums. As compared to the results in Core Survey 3 there is an overall increase of institutions with 3D man-made resources (71% compared to 50% in Core Survey 3), especially for analogue objects (63% compared to 46% in 2015).
Figure 3.5.4: Percentage of institutions with 3D man-made movable objects (n=693)
22%
19%
38%
24%
7%
45%
55%
42%
35%
60%
74%
78%
56%
75%
88%
0% 20% 40% 60% 80% 100%
Total
Other type of institution
Library
Museum
Archive/other records office
Analogue collection Digital collection Not applicable
35%
29%
64%
13%
53%
29%
31%
10%
45%
14%
63%
67%
33%
84%
47%
0% 20% 40% 60% 80% 100%
Total
Other type of institution
Library
Museum
Archive/other records office
Analogue collection Digital collection Not applicable
D4.4: Report on ENUMERATE survey
24
3.5.5 Natural resources
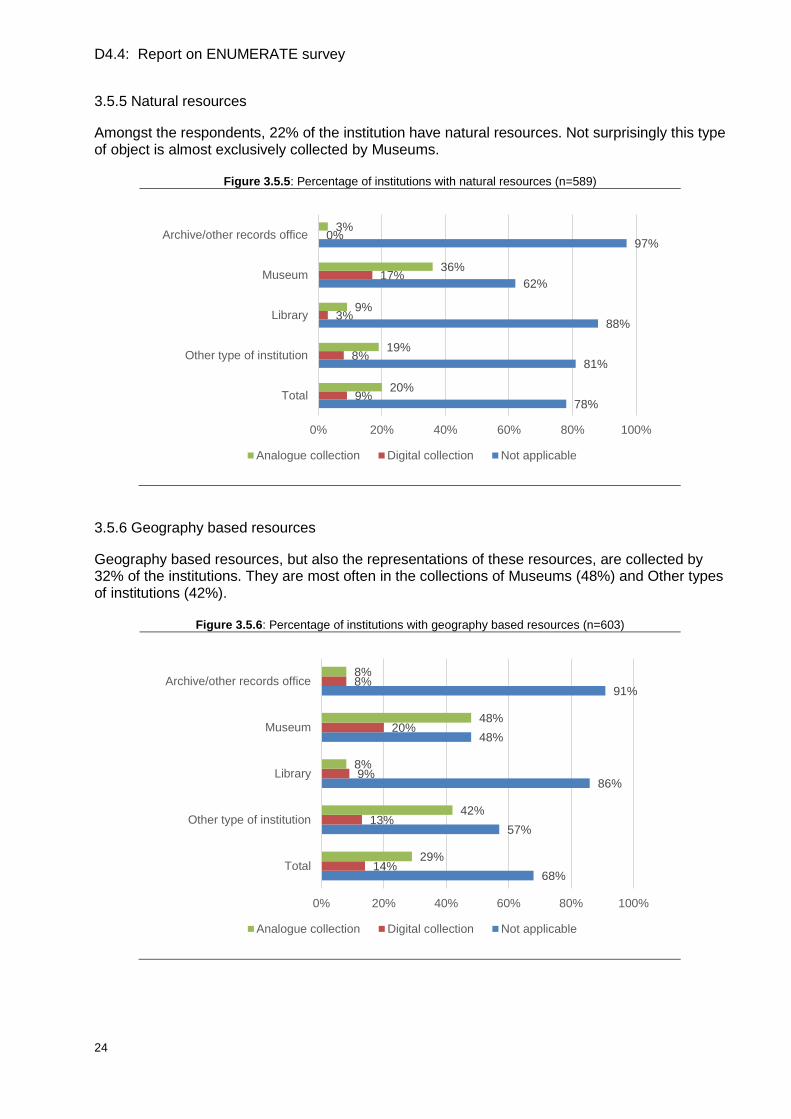
Amongst the respondents, 22% of the institution have natural resources. Not surprisingly this type of object is almost exclusively collected by Museums.
Figure 3.5.5: Percentage of institutions with natural resources (n=589)
3.5.6 Geography based resources
Geography based resources, but also the representations of these resources, are collected by 32% of the institutions. They are most often in the collections of Museums (48%) and Other types of institutions (42%).
Figure 3.5.6: Percentage of institutions with geography based resources (n=603)
78%
81%
88%
62%
97%
9%
8%
3%
17%
0%
20%
19%
9%
36%
3%
0% 20% 40% 60% 80% 100%
Total
Other type of institution
Library
Museum
Archive/other records office
Analogue collection Digital collection Not applicable
68%
57%
86%
48%
91%
14%
13%
9%
20%
8%
29%
42%
8%
48%
8%
0% 20% 40% 60% 80% 100%
Total
Other type of institution
Library
Museum
Archive/other records office
Analogue collection Digital collection Not applicable
D4.4: Report on ENUMERATE survey
25
3.5.7 Time-based resources
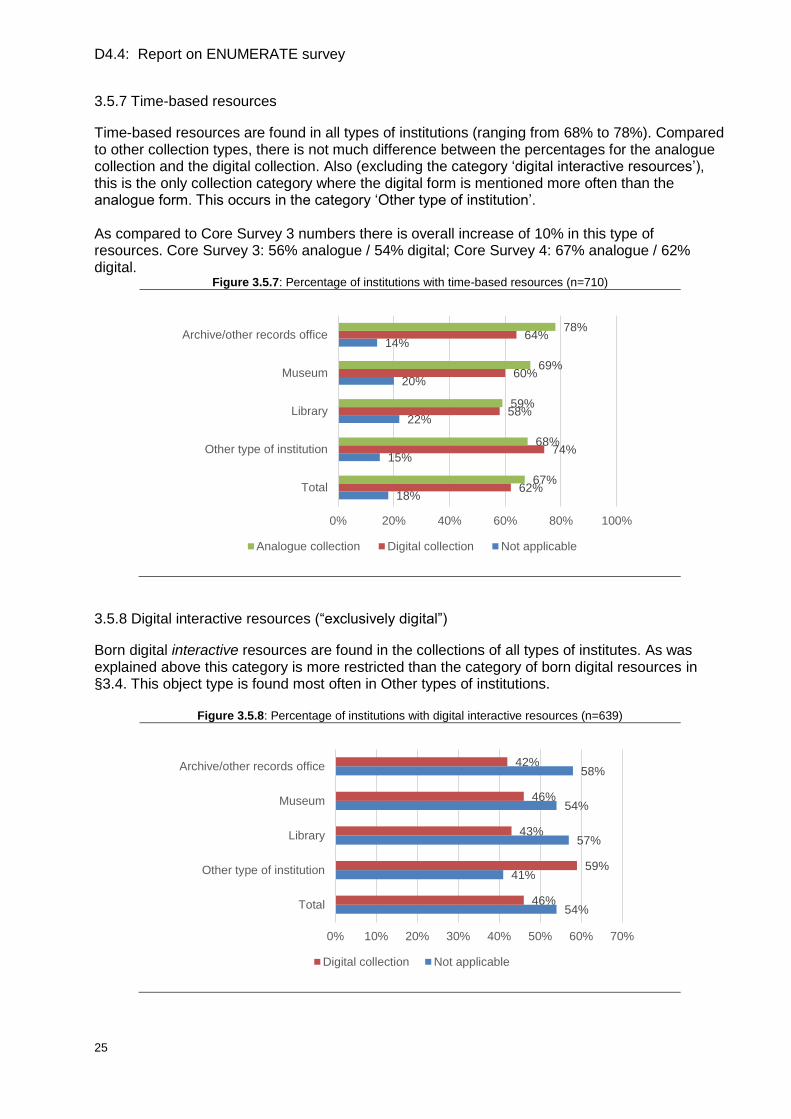
Time-based resources are found in all types of institutions (ranging from 68% to 78%). Compared to other collection types, there is not much difference between the percentages for the analogue collection and the digital collection. Also (excluding the category ‘digital interactive resources’), this is the only collection category where the digital form is mentioned more often than the analogue form. This occurs in the category ‘Other type of institution’. As compared to Core Survey 3 numbers there is overall increase of 10% in this type of resources. Core Survey 3: 56% analogue / 54% digital; Core Survey 4: 67% analogue / 62% digital.
Figure 3.5.7: Percentage of institutions with time-based resources (n=710)
3.5.8 Digital interactive resources (“exclusively digital”)
Born digital interactive resources are found in the collections of all types of institutes. As was explained above this category is more restricted than the category of born digital resources in §3.4. This object type is found most often in Other types of institutions.
Figure 3.5.8: Percentage of institutions with digital interactive resources (n=639)
18%
15%
22%
20%
14%
62%
74%
58%
60%
64%
67%
68%
59%
69%
78%
0% 20% 40% 60% 80% 100%
Total
Other type of institution
Library
Museum
Archive/other records office
Analogue collection Digital collection Not applicable
54%
41%
57%
54%
58%
46%
59%
43%
46%
42%
0% 10% 20% 30% 40% 50% 60% 70%
Total
Other type of institution
Library
Museum
Archive/other records office
Digital collection Not applicable
D4.4: Report on ENUMERATE survey
26
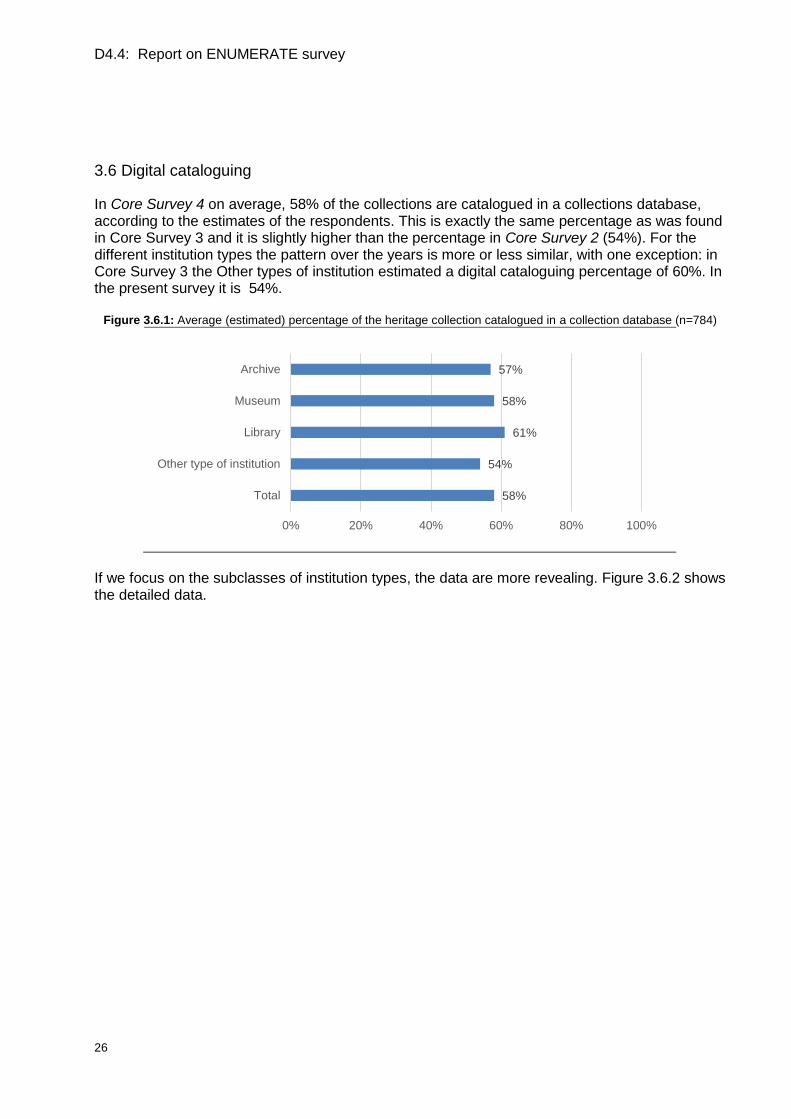
3.6 Digital cataloguing
In Core Survey 4 on average, 58% of the collections are catalogued in a collections database, according to the estimates of the respondents. This is exactly the same percentage as was found in Core Survey 3 and it is slightly higher than the percentage in Core Survey 2 (54%). For the different institution types the pattern over the years is more or less similar, with one exception: in Core Survey 3 the Other types of institution estimated a digital cataloguing percentage of 60%. In the present survey it is 54%.
Figure 3.6.1: Average (estimated) percentage of the heritage collection catalogued in a collection database (n=784)
If we focus on the subclasses of institution types, the data are more revealing. Figure 3.6.2 shows the detailed data.
58%
54%
61%
58%
57%
0% 20% 40% 60% 80% 100%
Total
Other type of institution
Library
Museum
Archive
D4.4: Report on ENUMERATE survey
27
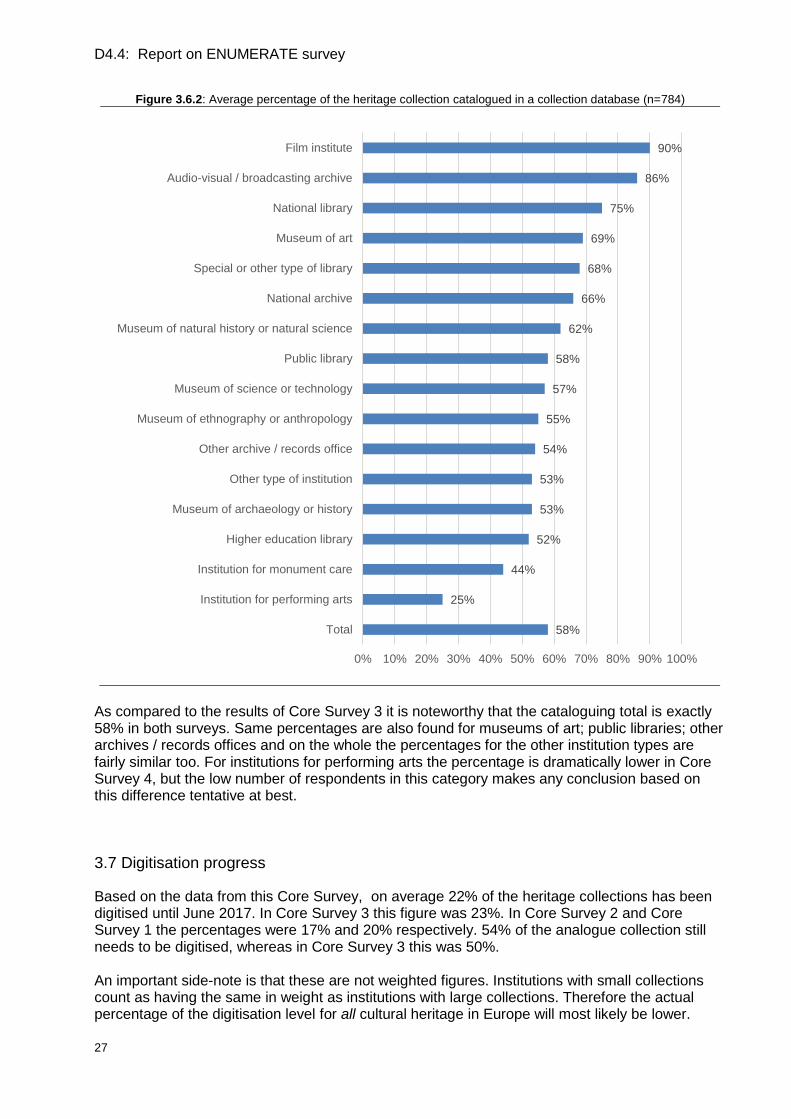
Figure 3.6.2: Average percentage of the heritage collection catalogued in a collection database (n=784)
As compared to the results of Core Survey 3 it is noteworthy that the cataloguing total is exactly 58% in both surveys. Same percentages are also found for museums of art; public libraries; other archives / records offices and on the whole the percentages for the other institution types are fairly similar too. For institutions for performing arts the percentage is dramatically lower in Core Survey 4, but the low number of respondents in this category makes any conclusion based on this difference tentative at best.
3.7 Digitisation progress
Based on the data from this Core Survey, on average 22% of the heritage collections has been digitised until June 2017. In Core Survey 3 this figure was 23%. In Core Survey 2 and Core Survey 1 the percentages were 17% and 20% respectively. 54% of the analogue collection still needs to be digitised, whereas in Core Survey 3 this was 50%. An important side-note is that these are not weighted figures. Institutions with small collections count as having the same in weight as institutions with large collections. Therefore the actual percentage of the digitisation level for all cultural heritage in Europe will most likely be lower.
58%
25%
44%
52%
53%
53%
54%
55%
57%
58%
62%
66%
68%
69%
75%
86%
90%
0% 10% 20% 30% 40% 50% 60% 70% 80% 90% 100%
Total
Institution for performing arts
Institution for monument care
Higher education library
Museum of archaeology or history
Other type of institution
Other archive / records office
Museum of ethnography or anthropology
Museum of science or technology
Public library
Museum of natural history or natural science
National archive
Special or other type of library
Museum of art
National library
Audio-visual / broadcasting archive
Film institute
D4.4: Report on ENUMERATE survey
28
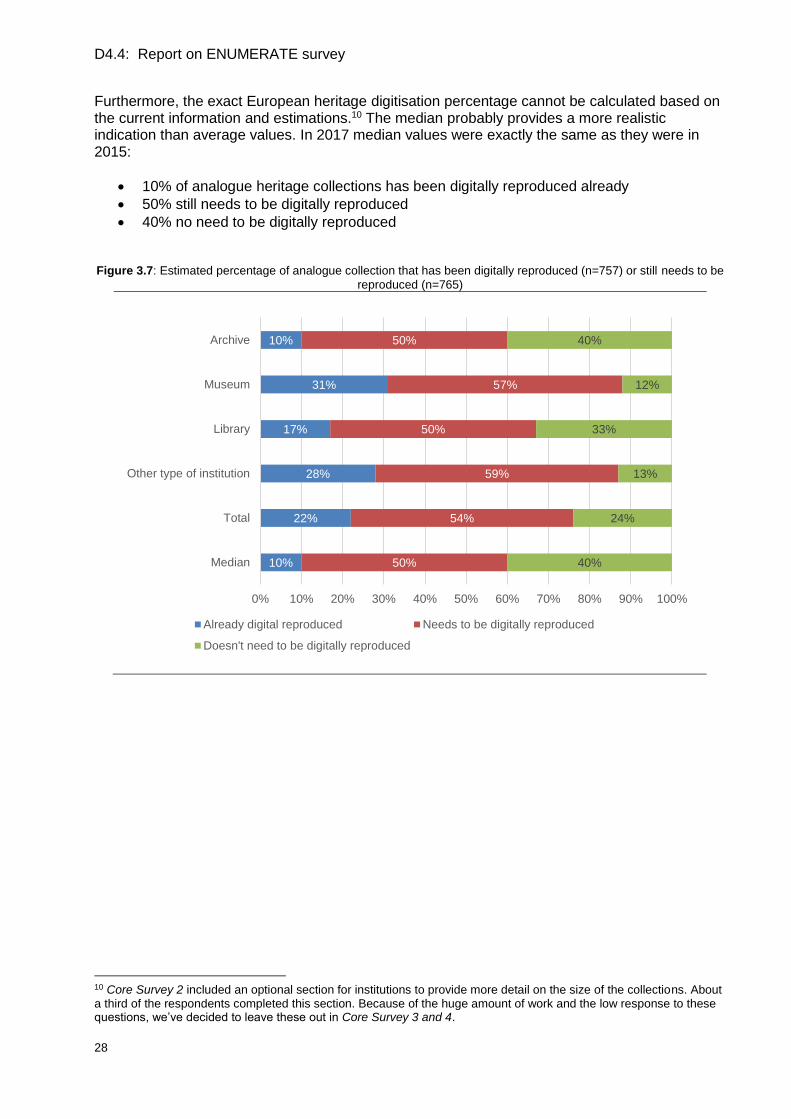
Furthermore, the exact European heritage digitisation percentage cannot be calculated based on the current information and estimations.10 The median probably provides a more realistic indication than average values. In 2017 median values were exactly the same as they were in 2015:
10% of analogue heritage collections has been digitally reproduced already
50% still needs to be digitally reproduced
40% no need to be digitally reproduced
Figure 3.7: Estimated percentage of analogue collection that has been digitally reproduced (n=757) or still needs to be
reproduced (n=765)
10 Core Survey 2 included an optional section for institutions to provide more detail on the size of the collections. About a third of the respondents completed this section. Because of the huge amount of work and the low response to these questions, we’ve decided to leave these out in Core Survey 3 and 4.
10%
22%
28%
17%
31%
10%
50%
54%
59%
50%
57%
50%
40%
24%
13%
33%
12%
40%
0% 10% 20% 30% 40% 50% 60% 70% 80% 90% 100%
Median
Total
Other type of institution
Library
Museum
Archive
Already digital reproduced Needs to be digitally reproduced
Doesn't need to be digitally reproduced
D4.4: Report on ENUMERATE survey
29
4. Digital access
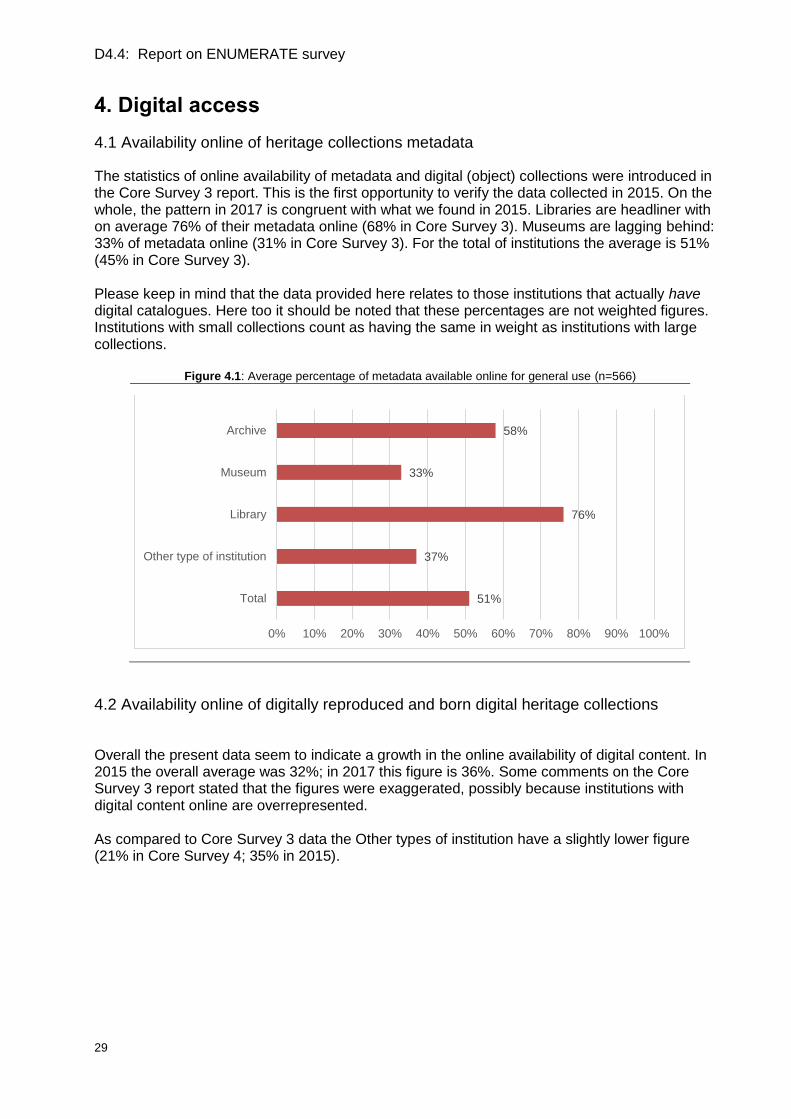
4.1 Availability online of heritage collections metadata
The statistics of online availability of metadata and digital (object) collections were introduced in the Core Survey 3 report. This is the first opportunity to verify the data collected in 2015. On the whole, the pattern in 2017 is congruent with what we found in 2015. Libraries are headliner with on average 76% of their metadata online (68% in Core Survey 3). Museums are lagging behind: 33% of metadata online (31% in Core Survey 3). For the total of institutions the average is 51% (45% in Core Survey 3). Please keep in mind that the data provided here relates to those institutions that actually have digital catalogues. Here too it should be noted that these percentages are not weighted figures. Institutions with small collections count as having the same in weight as institutions with large collections.
Figure 4.1: Average percentage of metadata available online for general use (n=566)
4.2 Availability online of digitally reproduced and born digital heritage collections
Overall the present data seem to indicate a growth in the online availability of digital content. In 2015 the overall average was 32%; in 2017 this figure is 36%. Some comments on the Core Survey 3 report stated that the figures were exaggerated, possibly because institutions with digital content online are overrepresented. As compared to Core Survey 3 data the Other types of institution have a slightly lower figure (21% in Core Survey 4; 35% in 2015).
51%
37%
76%
33%
58%
0% 10% 20% 30% 40% 50% 60% 70% 80% 90% 100%
Total
Other type of institution
Library
Museum
Archive
D4.4: Report on ENUMERATE survey
30
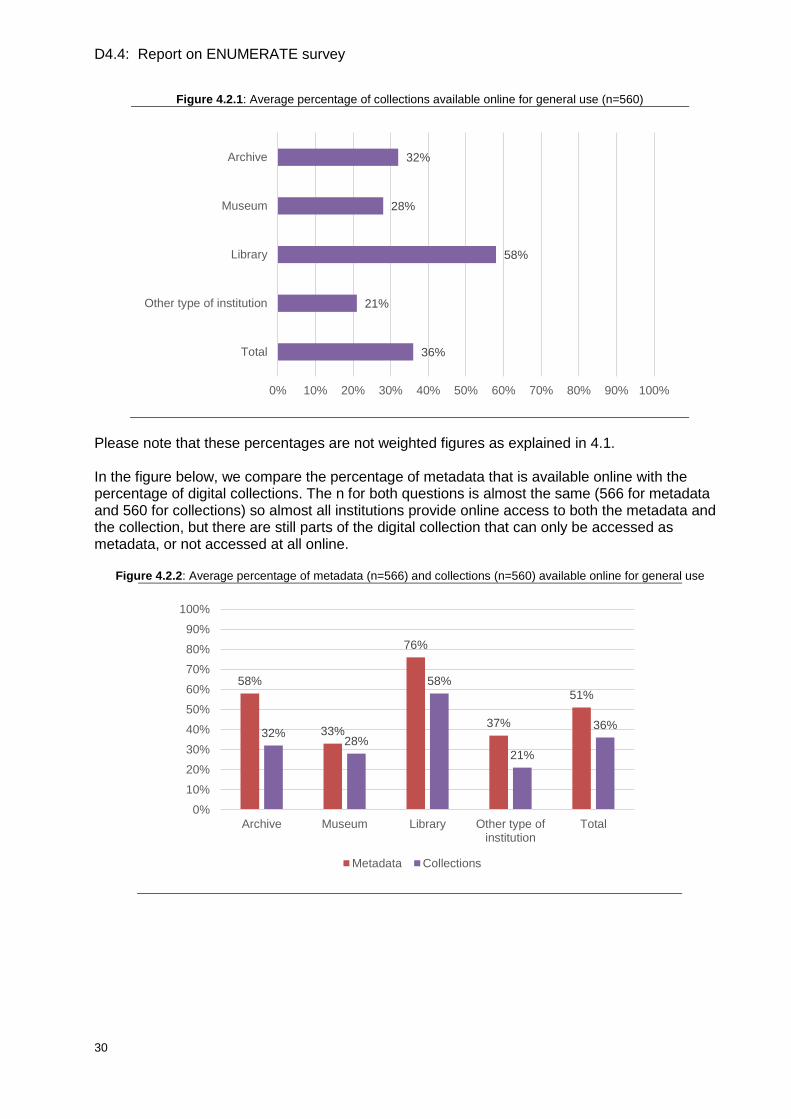
Figure 4.2.1: Average percentage of collections available online for general use (n=560)
Please note that these percentages are not weighted figures as explained in 4.1. In the figure below, we compare the percentage of metadata that is available online with the percentage of digital collections. The n for both questions is almost the same (566 for metadata and 560 for collections) so almost all institutions provide online access to both the metadata and the collection, but there are still parts of the digital collection that can only be accessed as metadata, or not accessed at all online.
Figure 4.2.2: Average percentage of metadata (n=566) and collections (n=560) available online for general use
36%
21%
58%
28%
32%
0% 10% 20% 30% 40% 50% 60% 70% 80% 90% 100%
Total
Other type of institution
Library
Museum
Archive
58%
33%
76%
37%
51%
32%28%
58%
21%
36%
0%
10%
20%
30%
40%
50%
60%
70%
80%
90%
100%
Archive Museum Library Other type ofinstitution
Total
Metadata Collections
D4.4: Report on ENUMERATE survey
31
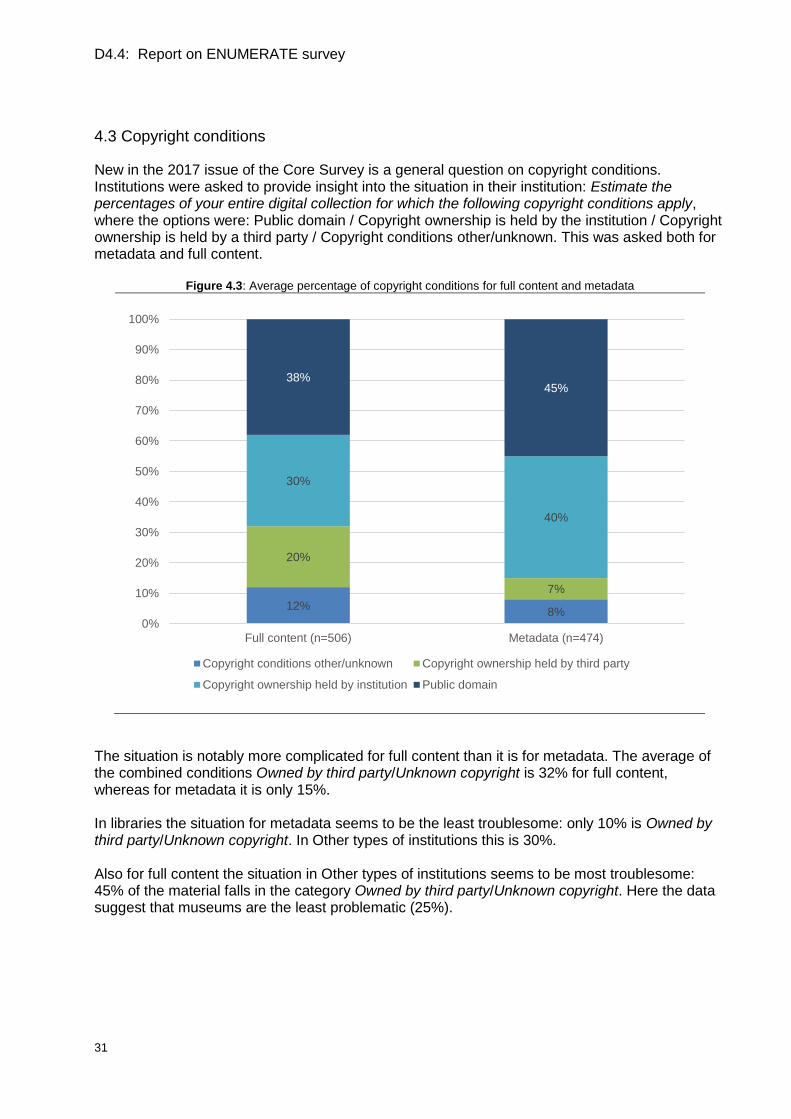
4.3 Copyright conditions
New in the 2017 issue of the Core Survey is a general question on copyright conditions. Institutions were asked to provide insight into the situation in their institution: Estimate the percentages of your entire digital collection for which the following copyright conditions apply, where the options were: Public domain / Copyright ownership is held by the institution / Copyright ownership is held by a third party / Copyright conditions other/unknown. This was asked both for metadata and full content.
Figure 4.3: Average percentage of copyright conditions for full content and metadata
The situation is notably more complicated for full content than it is for metadata. The average of the combined conditions Owned by third party/Unknown copyright is 32% for full content, whereas for metadata it is only 15%. In libraries the situation for metadata seems to be the least troublesome: only 10% is Owned by third party/Unknown copyright. In Other types of institutions this is 30%. Also for full content the situation in Other types of institutions seems to be most troublesome: 45% of the material falls in the category Owned by third party/Unknown copyright. Here the data suggest that museums are the least problematic (25%).
12%8%
20%
7%
30%
40%
38%45%
0%
10%
20%
30%
40%
50%
60%
70%
80%
90%
100%
Full content (n=506) Metadata (n=474)
Copyright conditions other/unknown Copyright ownership held by third party
Copyright ownership held by institution Public domain
D4.4: Report on ENUMERATE survey
32
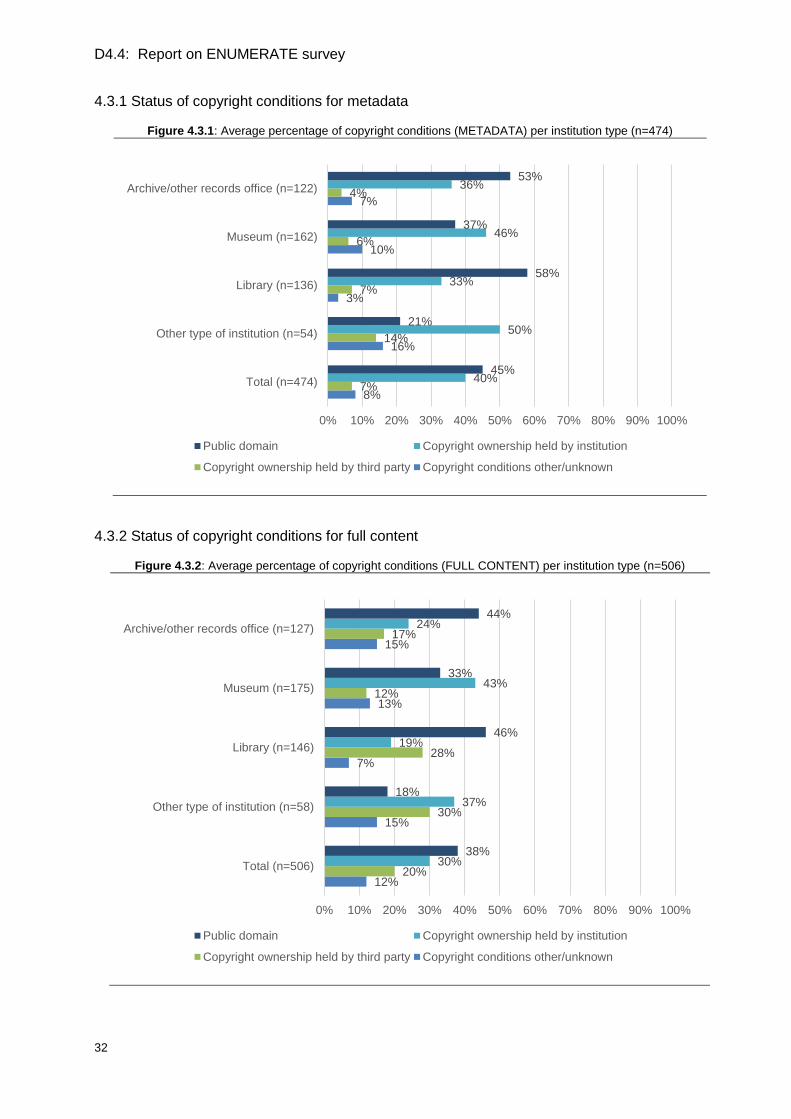
4.3.1 Status of copyright conditions for metadata
Figure 4.3.1: Average percentage of copyright conditions (METADATA) per institution type (n=474)
4.3.2 Status of copyright conditions for full content
Figure 4.3.2: Average percentage of copyright conditions (FULL CONTENT) per institution type (n=506)
8%
16%
3%
10%
7%
7%
14%
7%
6%
4%
40%
50%
33%
46%
36%
45%
21%
58%
37%
53%
0% 10% 20% 30% 40% 50% 60% 70% 80% 90% 100%
Total (n=474)
Other type of institution (n=54)
Library (n=136)
Museum (n=162)
Archive/other records office (n=122)
Public domain Copyright ownership held by institution
Copyright ownership held by third party Copyright conditions other/unknown
12%
15%
7%
13%
15%
20%
30%
28%
12%
17%
30%
37%
19%
43%
24%
38%
18%
46%
33%
44%
0% 10% 20% 30% 40% 50% 60% 70% 80% 90% 100%
Total (n=506)
Other type of institution (n=58)
Library (n=146)
Museum (n=175)
Archive/other records office (n=127)
Public domain Copyright ownership held by institution
Copyright ownership held by third party Copyright conditions other/unknown
D4.4: Report on ENUMERATE survey
33
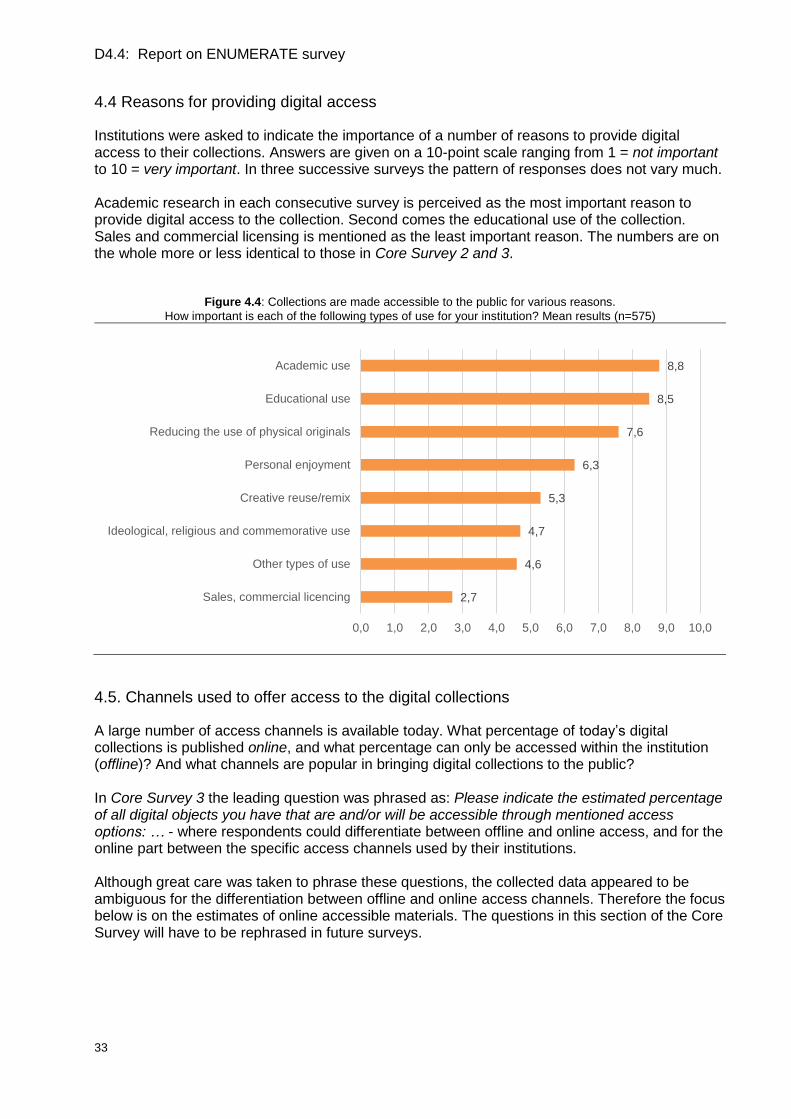
4.4 Reasons for providing digital access
Institutions were asked to indicate the importance of a number of reasons to provide digital access to their collections. Answers are given on a 10-point scale ranging from 1 = not important to 10 = very important. In three successive surveys the pattern of responses does not vary much. Academic research in each consecutive survey is perceived as the most important reason to provide digital access to the collection. Second comes the educational use of the collection. Sales and commercial licensing is mentioned as the least important reason. The numbers are on the whole more or less identical to those in Core Survey 2 and 3.
Figure 4.4: Collections are made accessible to the public for various reasons.
How important is each of the following types of use for your institution? Mean results (n=575)
4.5. Channels used to offer access to the digital collections
A large number of access channels is available today. What percentage of today’s digital collections is published online, and what percentage can only be accessed within the institution (offline)? And what channels are popular in bringing digital collections to the public? In Core Survey 3 the leading question was phrased as: Please indicate the estimated percentage of all digital objects you have that are and/or will be accessible through mentioned access options: … - where respondents could differentiate between offline and online access, and for the online part between the specific access channels used by their institutions. Although great care was taken to phrase these questions, the collected data appeared to be ambiguous for the differentiation between offline and online access channels. Therefore the focus below is on the estimates of online accessible materials. The questions in this section of the Core Survey will have to be rephrased in future surveys.
2,7
4,6
4,7
5,3
6,3
7,6
8,5
8,8
0,0 1,0 2,0 3,0 4,0 5,0 6,0 7,0 8,0 9,0 10,0
Sales, commercial licencing
Other types of use
Ideological, religious and commemorative use
Creative reuse/remix
Personal enjoyment
Reducing the use of physical originals
Educational use
Academic use
D4.4: Report on ENUMERATE survey
34
4.5.1 Offline and online accessibility of digital collections
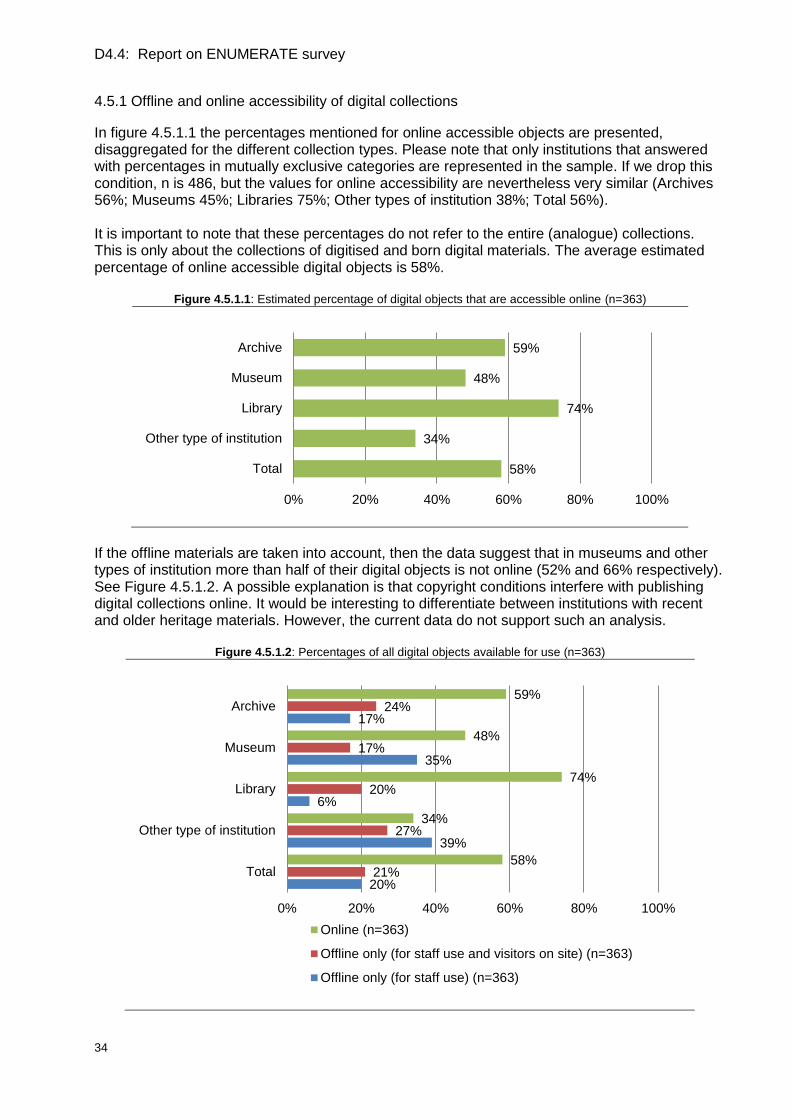
In figure 4.5.1.1 the percentages mentioned for online accessible objects are presented, disaggregated for the different collection types. Please note that only institutions that answered with percentages in mutually exclusive categories are represented in the sample. If we drop this condition, n is 486, but the values for online accessibility are nevertheless very similar (Archives 56%; Museums 45%; Libraries 75%; Other types of institution 38%; Total 56%). It is important to note that these percentages do not refer to the entire (analogue) collections. This is only about the collections of digitised and born digital materials. The average estimated percentage of online accessible digital objects is 58%.
Figure 4.5.1.1: Estimated percentage of digital objects that are accessible online (n=363)
If the offline materials are taken into account, then the data suggest that in museums and other types of institution more than half of their digital objects is not online (52% and 66% respectively). See Figure 4.5.1.2. A possible explanation is that copyright conditions interfere with publishing digital collections online. It would be interesting to differentiate between institutions with recent and older heritage materials. However, the current data do not support such an analysis.
Figure 4.5.1.2: Percentages of all digital objects available for use (n=363)
58%
34%
74%
48%
59%
0% 20% 40% 60% 80% 100%
Total
Other type of institution
Library
Museum
Archive
20%
39%
6%
35%
17%
21%
27%
20%
17%
24%
58%
34%
74%
48%
59%
0% 20% 40% 60% 80% 100%
Total
Other type of institution
Library
Museum
Archive
Online (n=363)
Offline only (for staff use and visitors on site) (n=363)
Offline only (for staff use) (n=363)
D4.4: Report on ENUMERATE survey
35
4.5.2 Popularity of the main online access channels
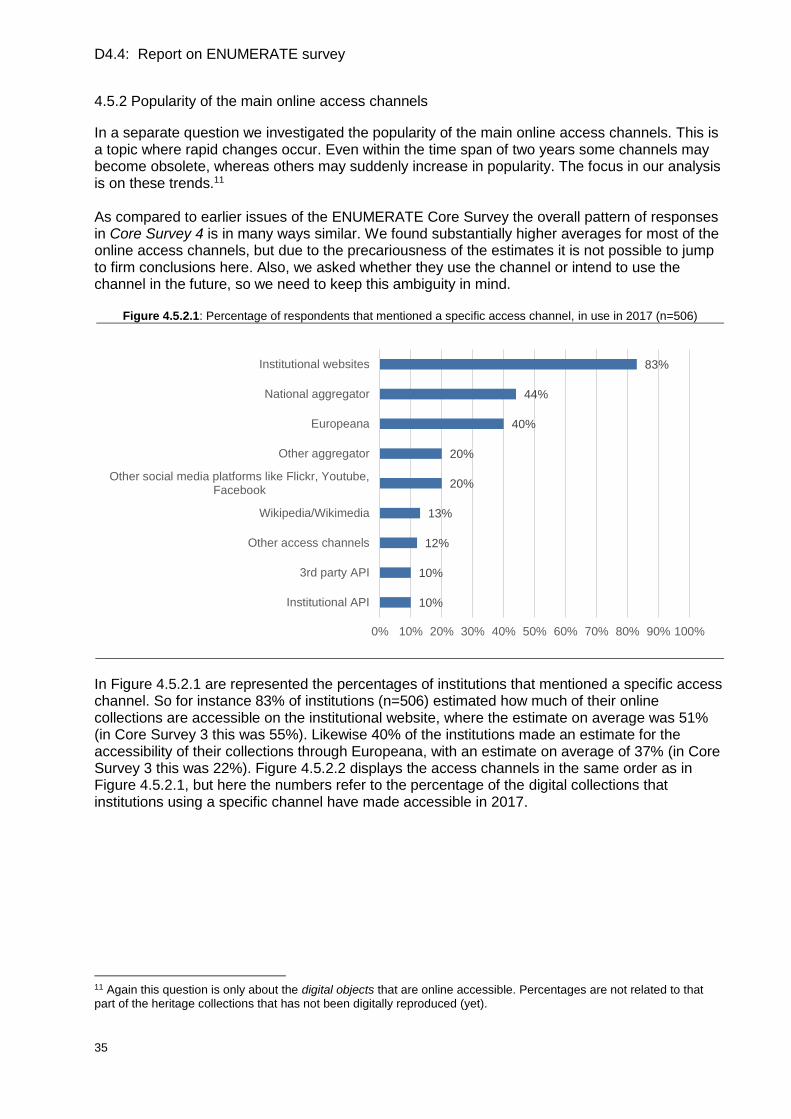
In a separate question we investigated the popularity of the main online access channels. This is a topic where rapid changes occur. Even within the time span of two years some channels may become obsolete, whereas others may suddenly increase in popularity. The focus in our analysis is on these trends.11 As compared to earlier issues of the ENUMERATE Core Survey the overall pattern of responses in Core Survey 4 is in many ways similar. We found substantially higher averages for most of the online access channels, but due to the precariousness of the estimates it is not possible to jump to firm conclusions here. Also, we asked whether they use the channel or intend to use the channel in the future, so we need to keep this ambiguity in mind.
Figure 4.5.2.1: Percentage of respondents that mentioned a specific access channel, in use in 2017 (n=506)
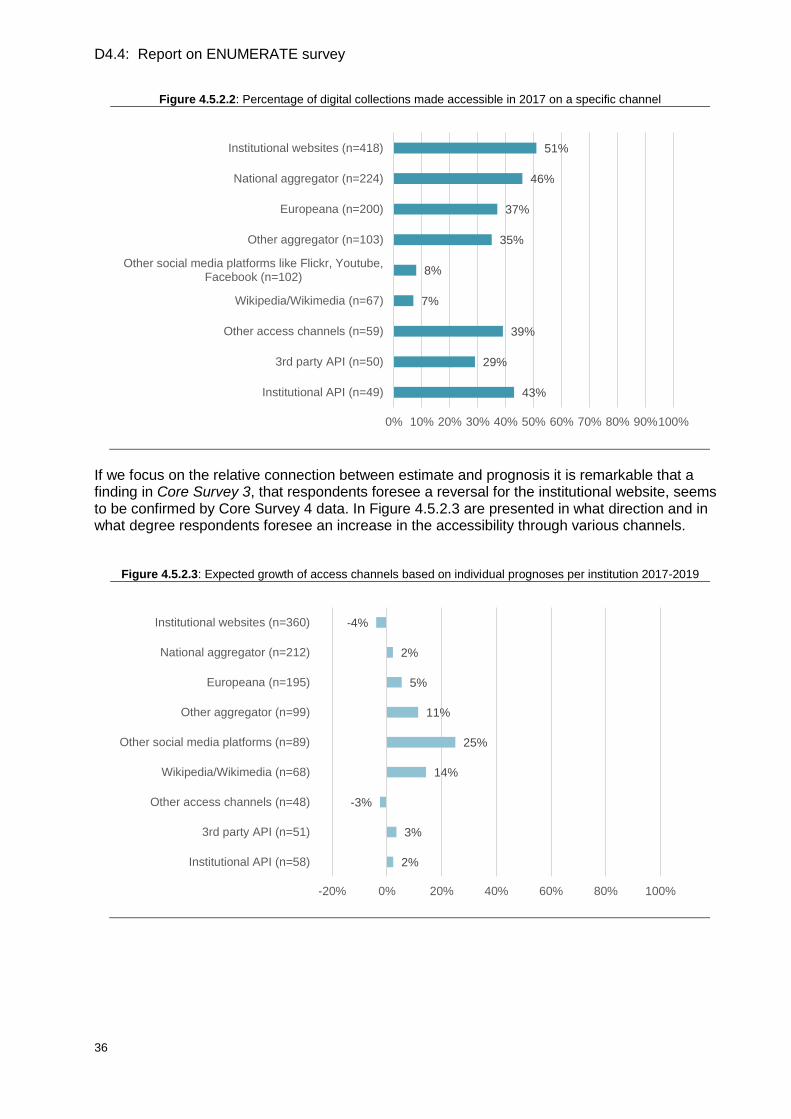
In Figure 4.5.2.1 are represented the percentages of institutions that mentioned a specific access channel. So for instance 83% of institutions (n=506) estimated how much of their online collections are accessible on the institutional website, where the estimate on average was 51% (in Core Survey 3 this was 55%). Likewise 40% of the institutions made an estimate for the accessibility of their collections through Europeana, with an estimate on average of 37% (in Core Survey 3 this was 22%). Figure 4.5.2.2 displays the access channels in the same order as in Figure 4.5.2.1, but here the numbers refer to the percentage of the digital collections that institutions using a specific channel have made accessible in 2017.
11 Again this question is only about the digital objects that are online accessible. Percentages are not related to that part of the heritage collections that has not been digitally reproduced (yet).
10%
10%
12%
13%
20%
20%
40%
44%
83%
0% 10% 20% 30% 40% 50% 60% 70% 80% 90% 100%
Institutional API
3rd party API
Other access channels
Wikipedia/Wikimedia
Other social media platforms like Flickr, Youtube,Facebook
Other aggregator
Europeana
National aggregator
Institutional websites
D4.4: Report on ENUMERATE survey
36
Figure 4.5.2.2: Percentage of digital collections made accessible in 2017 on a specific channel
If we focus on the relative connection between estimate and prognosis it is remarkable that a finding in Core Survey 3, that respondents foresee a reversal for the institutional website, seems to be confirmed by Core Survey 4 data. In Figure 4.5.2.3 are presented in what direction and in what degree respondents foresee an increase in the accessibility through various channels.
Figure 4.5.2.3: Expected growth of access channels based on individual prognoses per institution 2017-2019
43%
29%
39%
7%
8%
35%
37%
46%
51%
0% 10% 20% 30% 40% 50% 60% 70% 80% 90%100%
Institutional API (n=49)
3rd party API (n=50)
Other access channels (n=59)
Wikipedia/Wikimedia (n=67)
Other social media platforms like Flickr, Youtube,Facebook (n=102)
Other aggregator (n=103)
Europeana (n=200)
National aggregator (n=224)
Institutional websites (n=418)
2%
3%
-3%
14%
25%
11%
5%
2%
-4%
-20% 0% 20% 40% 60% 80% 100%
Institutional API (n=58)
3rd party API (n=51)
Other access channels (n=48)
Wikipedia/Wikimedia (n=68)
Other social media platforms (n=89)
Other aggregator (n=99)
Europeana (n=195)
National aggregator (n=212)
Institutional websites (n=360)
D4.4: Report on ENUMERATE survey
37
5. Participation In earlier issues of the Core Survey the four main headings to organise the selected digital collection indicators were Size/Growth of digital collections; Access to digital collections; the Cost of digital collections and Preservation. In Core Survey 4 we deliberately separated the heading Access into on the one hand all that is being done to offer access to digital collections, and on the other the actual use (and the monitoring of it) of these collections online. This chapter on participation addresses actual use.
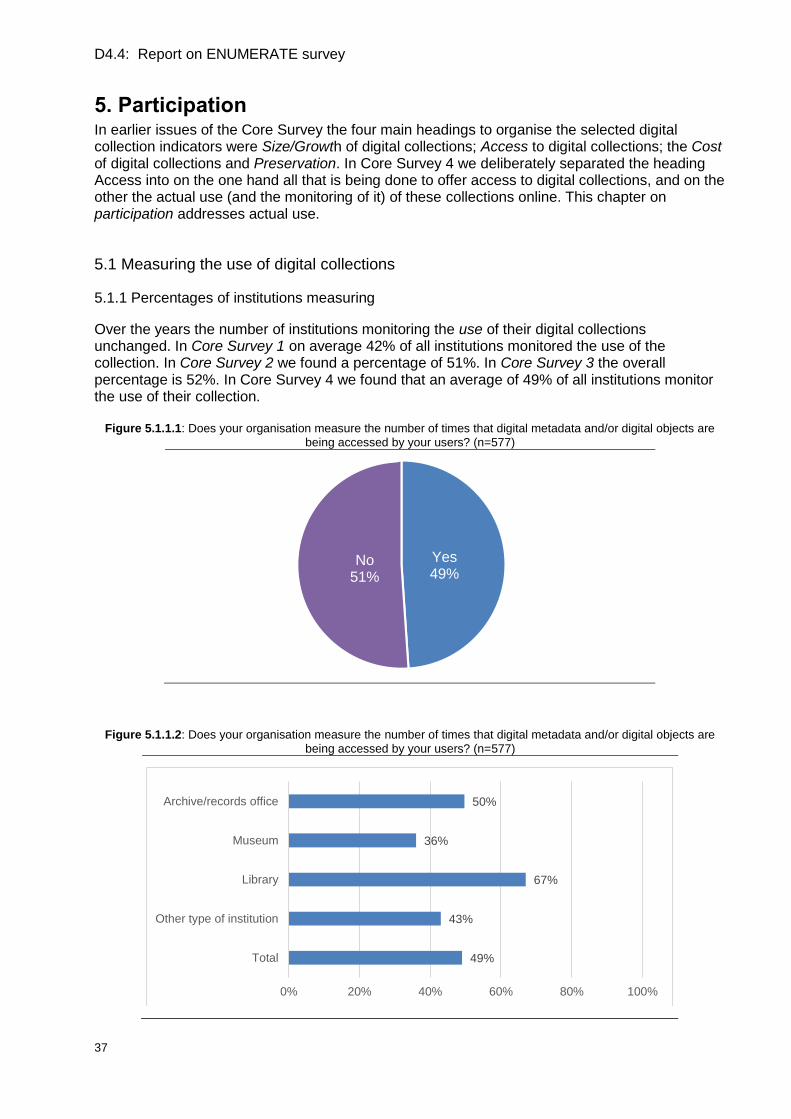
5.1 Measuring the use of digital collections
5.1.1 Percentages of institutions measuring
Over the years the number of institutions monitoring the use of their digital collections unchanged. In Core Survey 1 on average 42% of all institutions monitored the use of the collection. In Core Survey 2 we found a percentage of 51%. In Core Survey 3 the overall percentage is 52%. In Core Survey 4 we found that an average of 49% of all institutions monitor the use of their collection.
Figure 5.1.1.1: Does your organisation measure the number of times that digital metadata and/or digital objects are
being accessed by your users? (n=577)
Figure 5.1.1.2: Does your organisation measure the number of times that digital metadata and/or digital objects are
being accessed by your users? (n=577)
Yes49%
No51%
49%
43%
67%
36%
50%
0% 20% 40% 60% 80% 100%
Total
Other type of institution
Library
Museum
Archive/records office
D4.4: Report on ENUMERATE survey
38
5.1.2 How the institutions are measuring
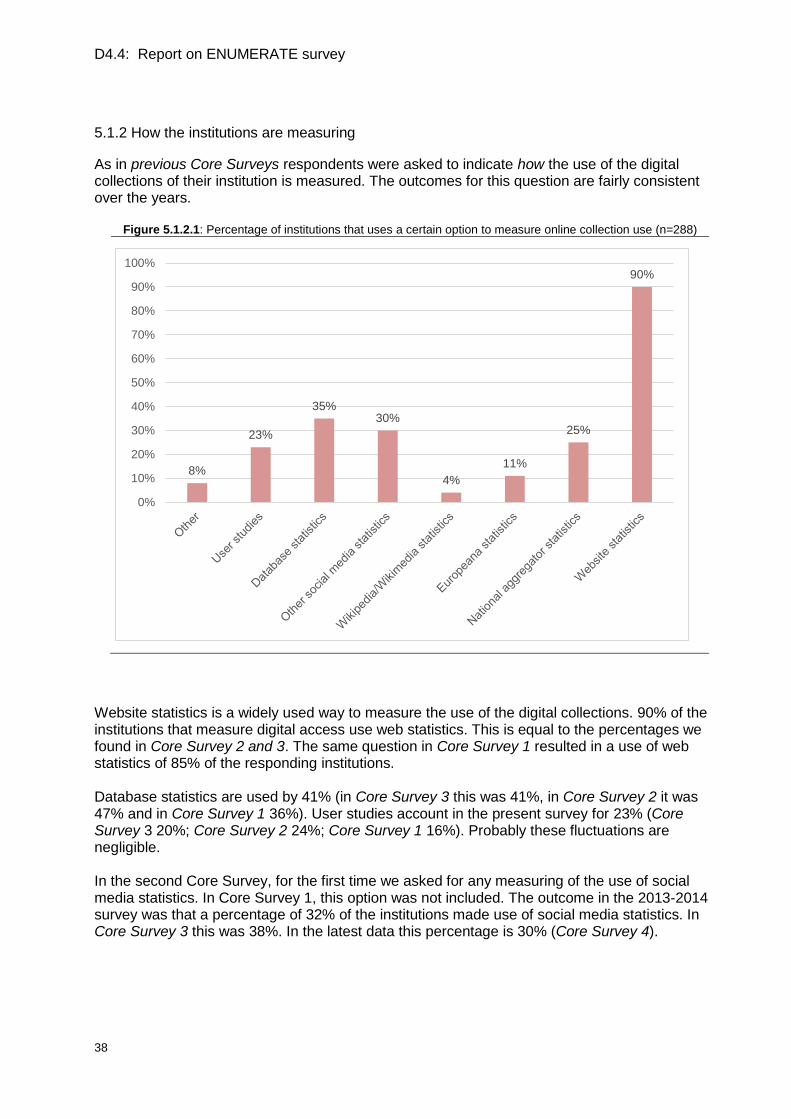
As in previous Core Surveys respondents were asked to indicate how the use of the digital collections of their institution is measured. The outcomes for this question are fairly consistent over the years.
Figure 5.1.2.1: Percentage of institutions that uses a certain option to measure online collection use (n=288)
Website statistics is a widely used way to measure the use of the digital collections. 90% of the institutions that measure digital access use web statistics. This is equal to the percentages we found in Core Survey 2 and 3. The same question in Core Survey 1 resulted in a use of web statistics of 85% of the responding institutions. Database statistics are used by 41% (in Core Survey 3 this was 41%, in Core Survey 2 it was 47% and in Core Survey 1 36%). User studies account in the present survey for 23% (Core Survey 3 20%; Core Survey 2 24%; Core Survey 1 16%). Probably these fluctuations are negligible. In the second Core Survey, for the first time we asked for any measuring of the use of social media statistics. In Core Survey 1, this option was not included. The outcome in the 2013-2014 survey was that a percentage of 32% of the institutions made use of social media statistics. In Core Survey 3 this was 38%. In the latest data this percentage is 30% (Core Survey 4).
8%
23%
35%30%
4%
11%
25%
90%
0%
10%
20%
30%
40%
50%
60%
70%
80%
90%
100%
D4.4: Report on ENUMERATE survey
39
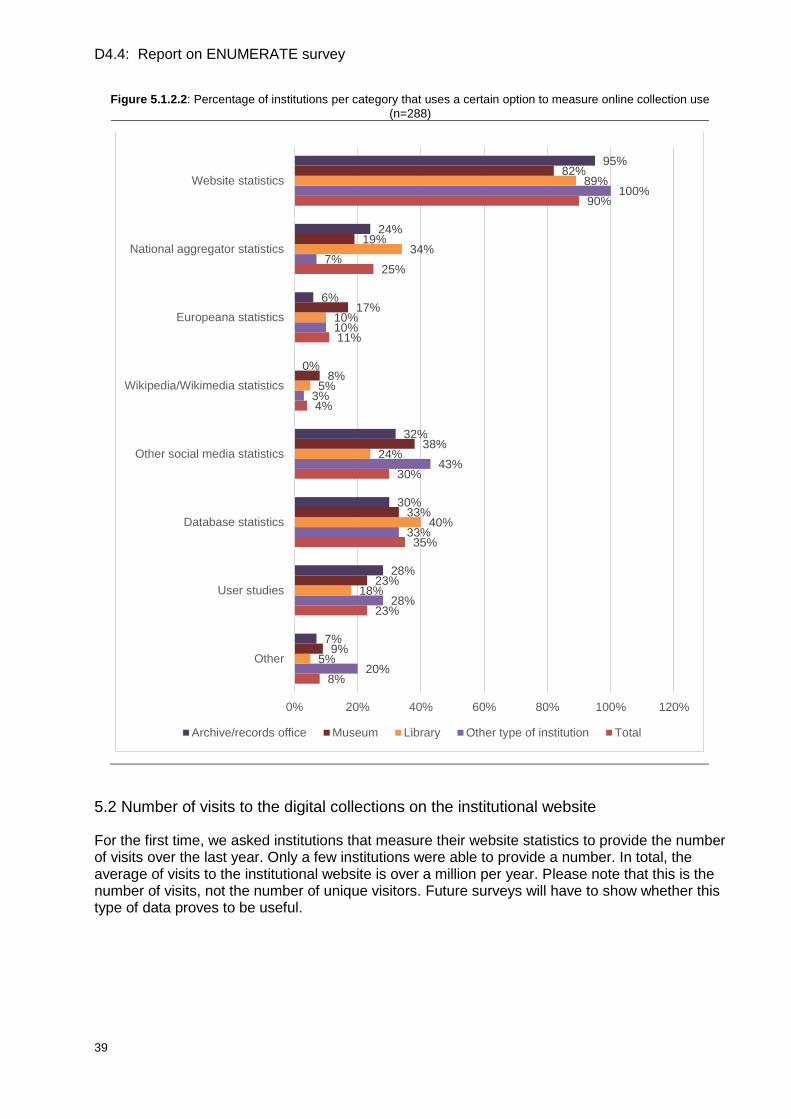
Figure 5.1.2.2: Percentage of institutions per category that uses a certain option to measure online collection use
(n=288)
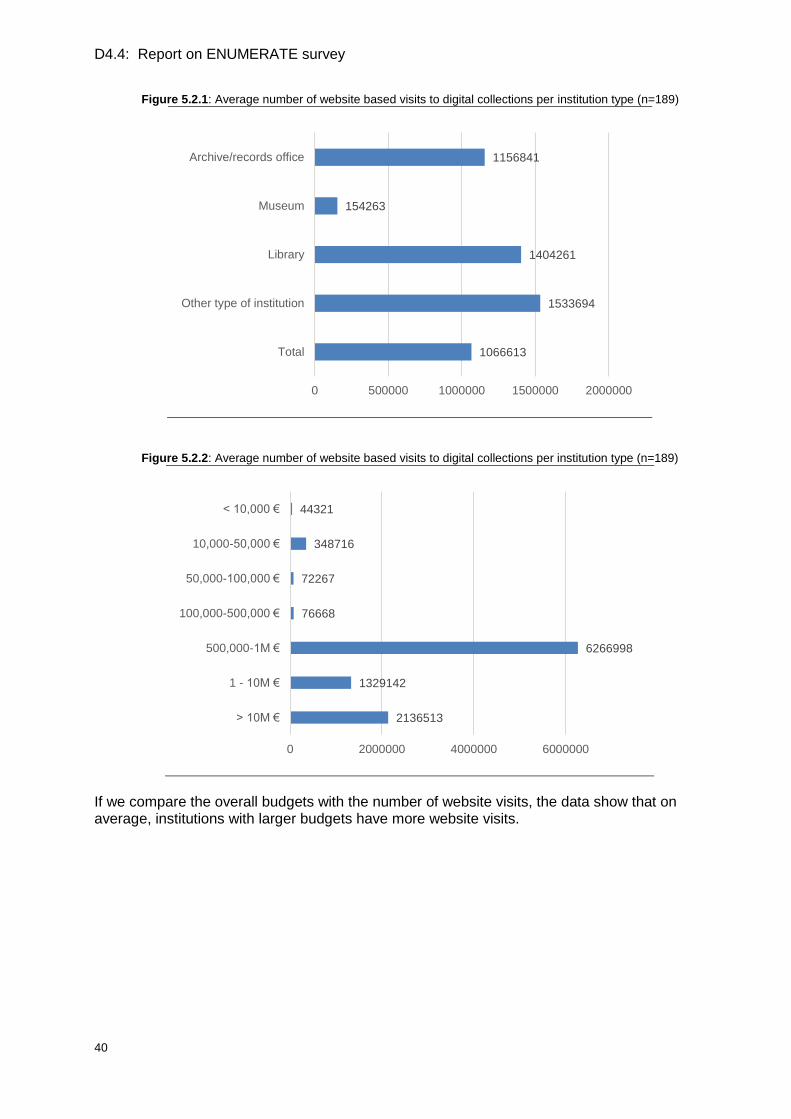
5.2 Number of visits to the digital collections on the institutional website
For the first time, we asked institutions that measure their website statistics to provide the number of visits over the last year. Only a few institutions were able to provide a number. In total, the average of visits to the institutional website is over a million per year. Please note that this is the number of visits, not the number of unique visitors. Future surveys will have to show whether this type of data proves to be useful.
8%
23%
35%
30%
4%
11%
25%
90%
20%
28%
33%
43%
3%
10%
7%
100%
5%
18%
40%
24%
5%
10%
34%
89%
9%
23%
33%
38%
8%
17%
19%
82%
7%
28%
30%
32%
0%
6%
24%
95%
0% 20% 40% 60% 80% 100% 120%
Other
User studies
Database statistics
Other social media statistics
Wikipedia/Wikimedia statistics
Europeana statistics
National aggregator statistics
Website statistics
Archive/records office Museum Library Other type of institution Total
D4.4: Report on ENUMERATE survey
40
Figure 5.2.1: Average number of website based visits to digital collections per institution type (n=189)
Figure 5.2.2: Average number of website based visits to digital collections per institution type (n=189)
If we compare the overall budgets with the number of website visits, the data show that on average, institutions with larger budgets have more website visits.
1066613
1533694
1404261
154263
1156841
0 500000 1000000 1500000 2000000
Total
Other type of institution
Library
Museum
Archive/records office
2136513
1329142
6266998
76668
72267
348716
44321
0 2000000 4000000 6000000
> 10M €
1 - 10M €
500,000-1M €
100,000-500,000 €
50,000-100,000 €
10,000-50,000 €
< 10,000 €
D4.4: Report on ENUMERATE survey
41
6. Digital preservation
6.1 Digital preservation strategy
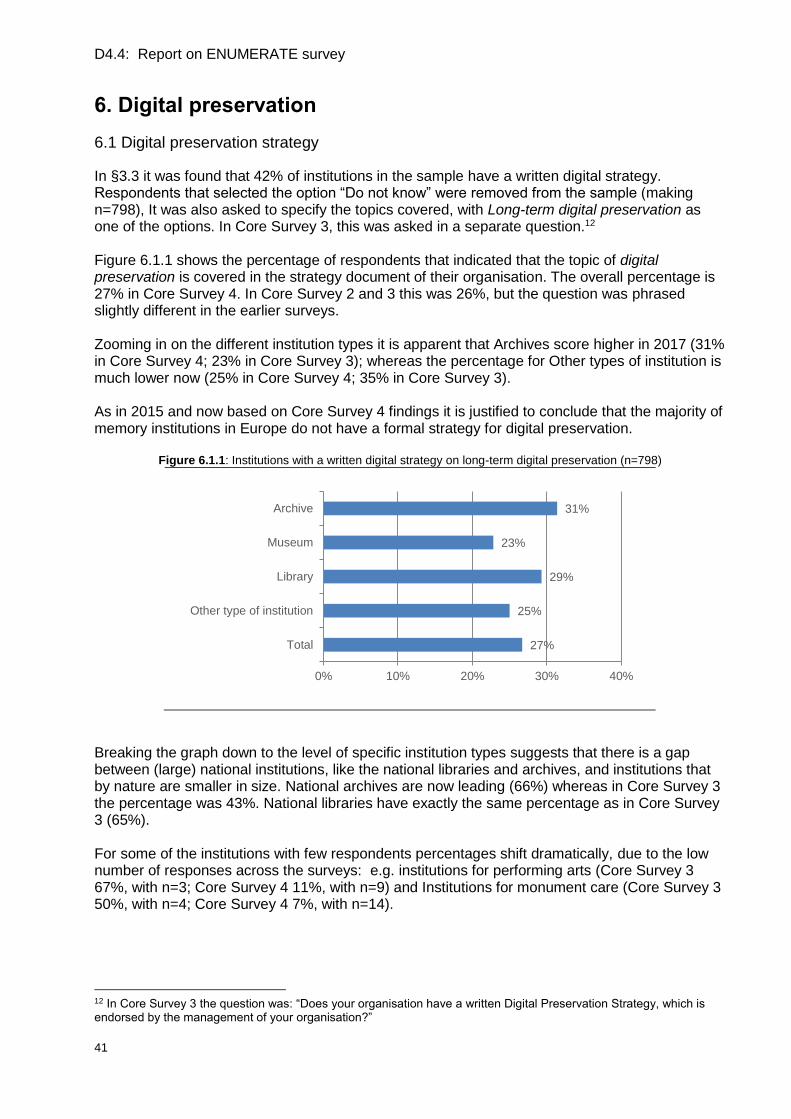
In §3.3 it was found that 42% of institutions in the sample have a written digital strategy. Respondents that selected the option “Do not know” were removed from the sample (making n=798), It was also asked to specify the topics covered, with Long-term digital preservation as one of the options. In Core Survey 3, this was asked in a separate question.12 Figure 6.1.1 shows the percentage of respondents that indicated that the topic of digital preservation is covered in the strategy document of their organisation. The overall percentage is 27% in Core Survey 4. In Core Survey 2 and 3 this was 26%, but the question was phrased slightly different in the earlier surveys. Zooming in on the different institution types it is apparent that Archives score higher in 2017 (31% in Core Survey 4; 23% in Core Survey 3); whereas the percentage for Other types of institution is much lower now (25% in Core Survey 4; 35% in Core Survey 3). As in 2015 and now based on Core Survey 4 findings it is justified to conclude that the majority of memory institutions in Europe do not have a formal strategy for digital preservation.
Figure 6.1.1: Institutions with a written digital strategy on long-term digital preservation (n=798)
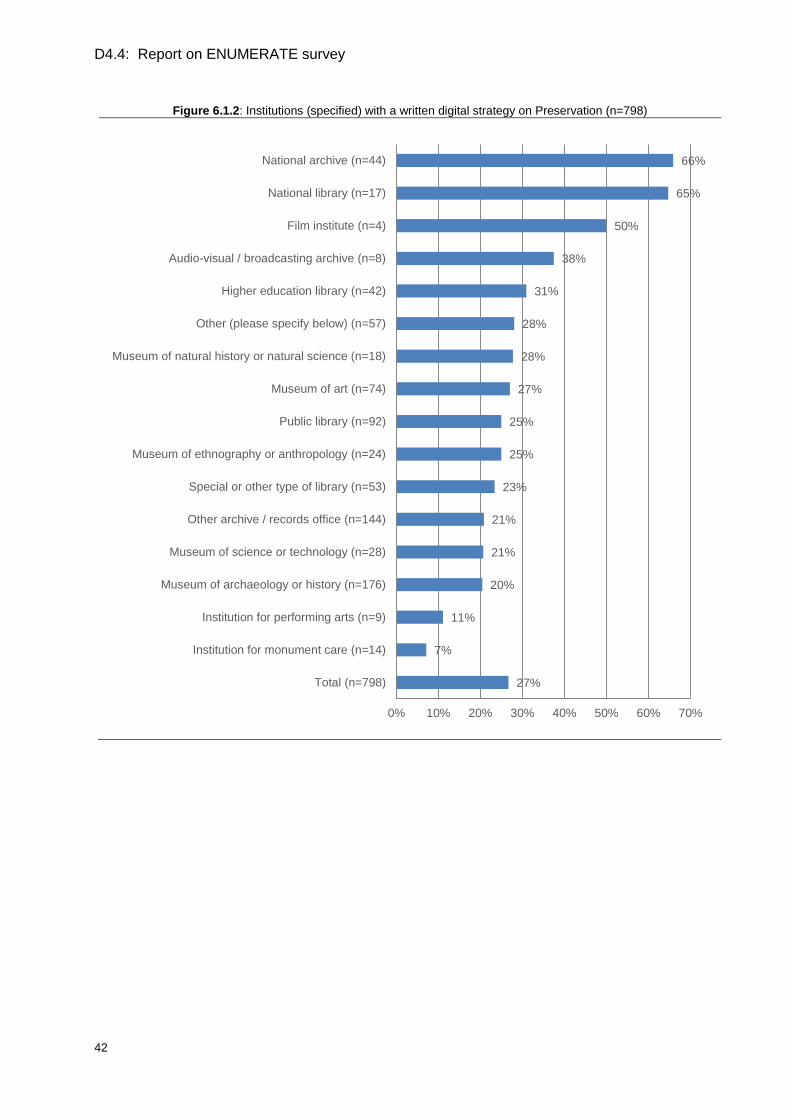
Breaking the graph down to the level of specific institution types suggests that there is a gap between (large) national institutions, like the national libraries and archives, and institutions that by nature are smaller in size. National archives are now leading (66%) whereas in Core Survey 3 the percentage was 43%. National libraries have exactly the same percentage as in Core Survey 3 (65%). For some of the institutions with few respondents percentages shift dramatically, due to the low number of responses across the surveys: e.g. institutions for performing arts (Core Survey 3 67%, with n=3; Core Survey 4 11%, with n=9) and Institutions for monument care (Core Survey 3 50%, with n=4; Core Survey 4 7%, with n=14).
12 In Core Survey 3 the question was: “Does your organisation have a written Digital Preservation Strategy, which is endorsed by the management of your organisation?”
27%
25%
29%
23%
31%
0% 10% 20% 30% 40%
Total
Other type of institution
Library
Museum
Archive
D4.4: Report on ENUMERATE survey
42
Figure 6.1.2: Institutions (specified) with a written digital strategy on Preservation (n=798)
27%
7%
11%
20%
21%
21%
23%
25%
25%
27%
28%
28%
31%
38%
50%
65%
66%
0% 10% 20% 30% 40% 50% 60% 70%
Total (n=798)
Institution for monument care (n=14)
Institution for performing arts (n=9)
Museum of archaeology or history (n=176)
Museum of science or technology (n=28)
Other archive / records office (n=144)
Special or other type of library (n=53)
Museum of ethnography or anthropology (n=24)
Public library (n=92)
Museum of art (n=74)
Museum of natural history or natural science (n=18)
Other (please specify below) (n=57)
Higher education library (n=42)
Audio-visual / broadcasting archive (n=8)
Film institute (n=4)
National library (n=17)
National archive (n=44)
D4.4: Report on ENUMERATE survey
43
6.2 Use of international standards for digital preservation
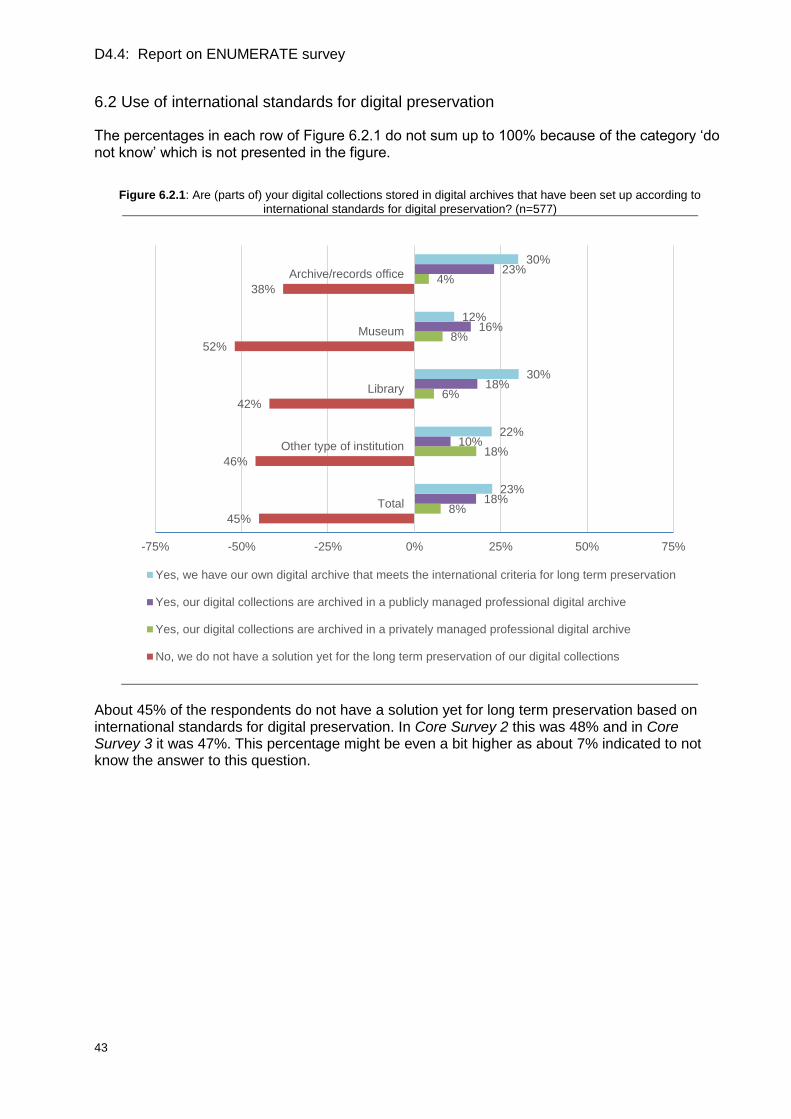
The percentages in each row of Figure 6.2.1 do not sum up to 100% because of the category ‘do not know’ which is not presented in the figure.
Figure 6.2.1: Are (parts of) your digital collections stored in digital archives that have been set up according to
international standards for digital preservation? (n=577)
About 45% of the respondents do not have a solution yet for long term preservation based on international standards for digital preservation. In Core Survey 2 this was 48% and in Core Survey 3 it was 47%. This percentage might be even a bit higher as about 7% indicated to not know the answer to this question.
45%
46%
42%
52%
38%
8%
18%
6%
8%
4%
18%
10%
18%
16%
23%
23%
22%
30%
12%
30%
-75% -50% -25% 0% 25% 50% 75%
Total
Other type of institution
Library
Museum
Archive/records office
Yes, we have our own digital archive that meets the international criteria for long term preservation
Yes, our digital collections are archived in a publicly managed professional digital archive
Yes, our digital collections are archived in a privately managed professional digital archive
No, we do not have a solution yet for the long term preservation of our digital collections
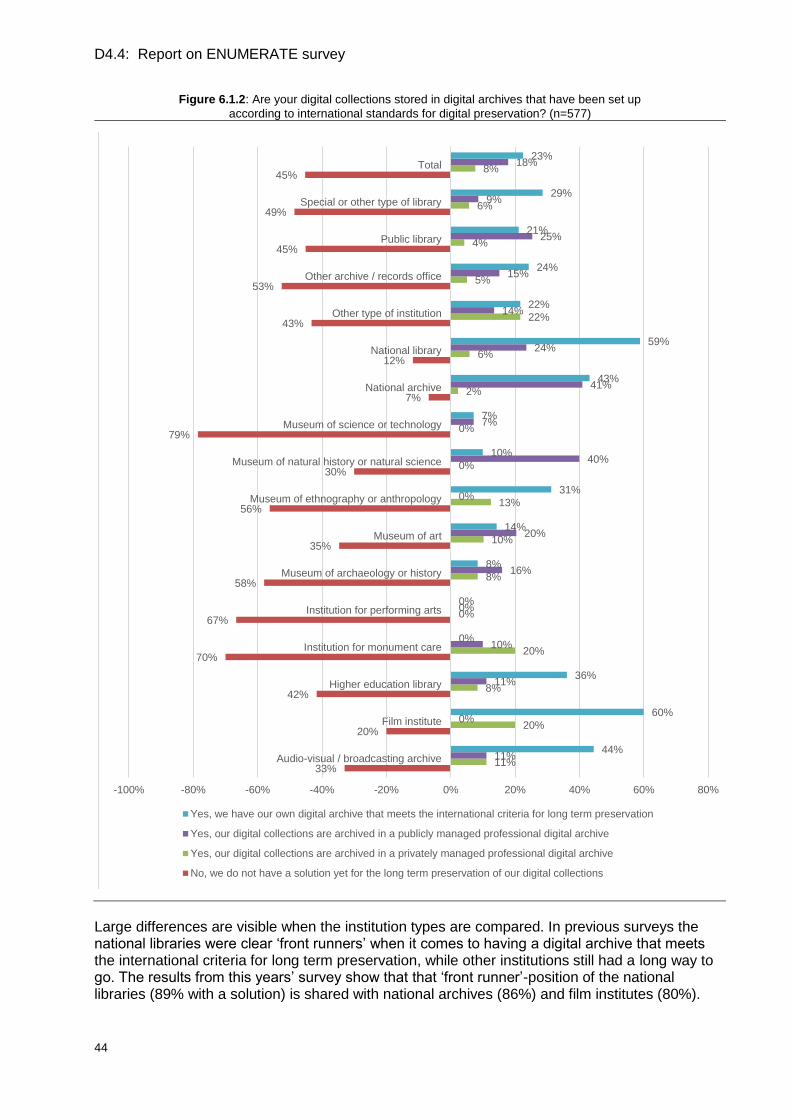
D4.4: Report on ENUMERATE survey
44
Figure 6.1.2: Are your digital collections stored in digital archives that have been set up
according to international standards for digital preservation? (n=577)
Large differences are visible when the institution types are compared. In previous surveys the national libraries were clear ‘front runners’ when it comes to having a digital archive that meets the international criteria for long term preservation, while other institutions still had a long way to go. The results from this years’ survey show that that ‘front runner’-position of the national libraries (89% with a solution) is shared with national archives (86%) and film institutes (80%).
33%
20%
42%
70%
67%
58%
35%
56%
30%
79%
7%
12%
43%
53%
45%
49%
45%
11%
20%
8%
20%
0%
8%
10%
13%
0%
0%
2%
6%
22%
5%
4%
6%
8%
11%
0%
11%
10%
0%
16%
20%
0%
40%
7%
41%
24%
14%
15%
25%
9%
18%
44%
60%
36%
0%
0%
8%
14%
31%
10%
7%
43%
59%
22%
24%
21%
29%
23%
-100% -80% -60% -40% -20% 0% 20% 40% 60% 80%
Audio-visual / broadcasting archive
Film institute
Higher education library
Institution for monument care
Institution for performing arts
Museum of archaeology or history
Museum of art
Museum of ethnography or anthropology
Museum of natural history or natural science
Museum of science or technology
National archive
National library
Other type of institution
Other archive / records office
Public library
Special or other type of library
Total
Yes, we have our own digital archive that meets the international criteria for long term preservation
Yes, our digital collections are archived in a publicly managed professional digital archive
Yes, our digital collections are archived in a privately managed professional digital archive
No, we do not have a solution yet for the long term preservation of our digital collections
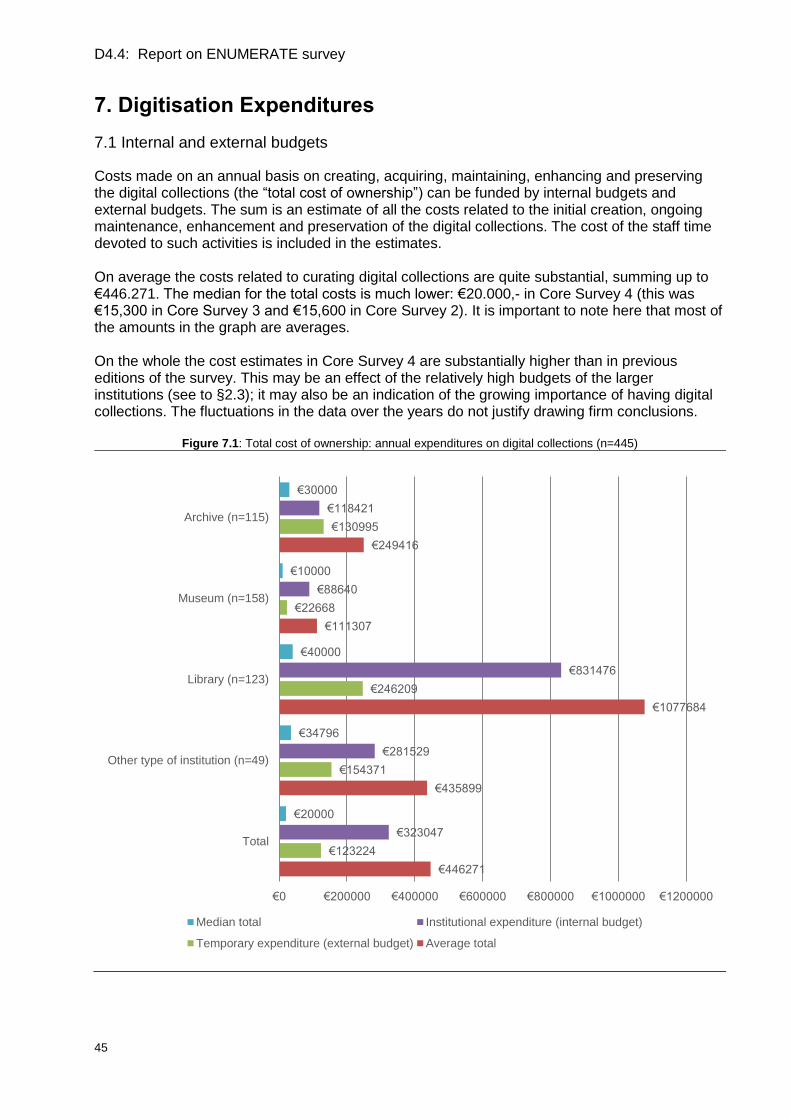
D4.4: Report on ENUMERATE survey
45
7. Digitisation Expenditures
7.1 Internal and external budgets
Costs made on an annual basis on creating, acquiring, maintaining, enhancing and preserving the digital collections (the “total cost of ownership”) can be funded by internal budgets and external budgets. The sum is an estimate of all the costs related to the initial creation, ongoing maintenance, enhancement and preservation of the digital collections. The cost of the staff time devoted to such activities is included in the estimates. On average the costs related to curating digital collections are quite substantial, summing up to €446.271. The median for the total costs is much lower: €20.000,- in Core Survey 4 (this was €15,300 in Core Survey 3 and €15,600 in Core Survey 2). It is important to note here that most of the amounts in the graph are averages. On the whole the cost estimates in Core Survey 4 are substantially higher than in previous editions of the survey. This may be an effect of the relatively high budgets of the larger institutions (see to §2.3); it may also be an indication of the growing importance of having digital collections. The fluctuations in the data over the years do not justify drawing firm conclusions.
Figure 7.1: Total cost of ownership: annual expenditures on digital collections (n=445)
€446271
€435899
€1077684
€111307
€249416
€123224
€154371
€246209
€22668
€130995
€323047
€281529
€831476
€88640
€118421
€20000
€34796
€40000
€10000
€30000
€0 €200000 €400000 €600000 €800000 €1000000 €1200000
Total
Other type of institution (n=49)
Library (n=123)
Museum (n=158)
Archive (n=115)
Median total Institutional expenditure (internal budget)
Temporary expenditure (external budget) Average total
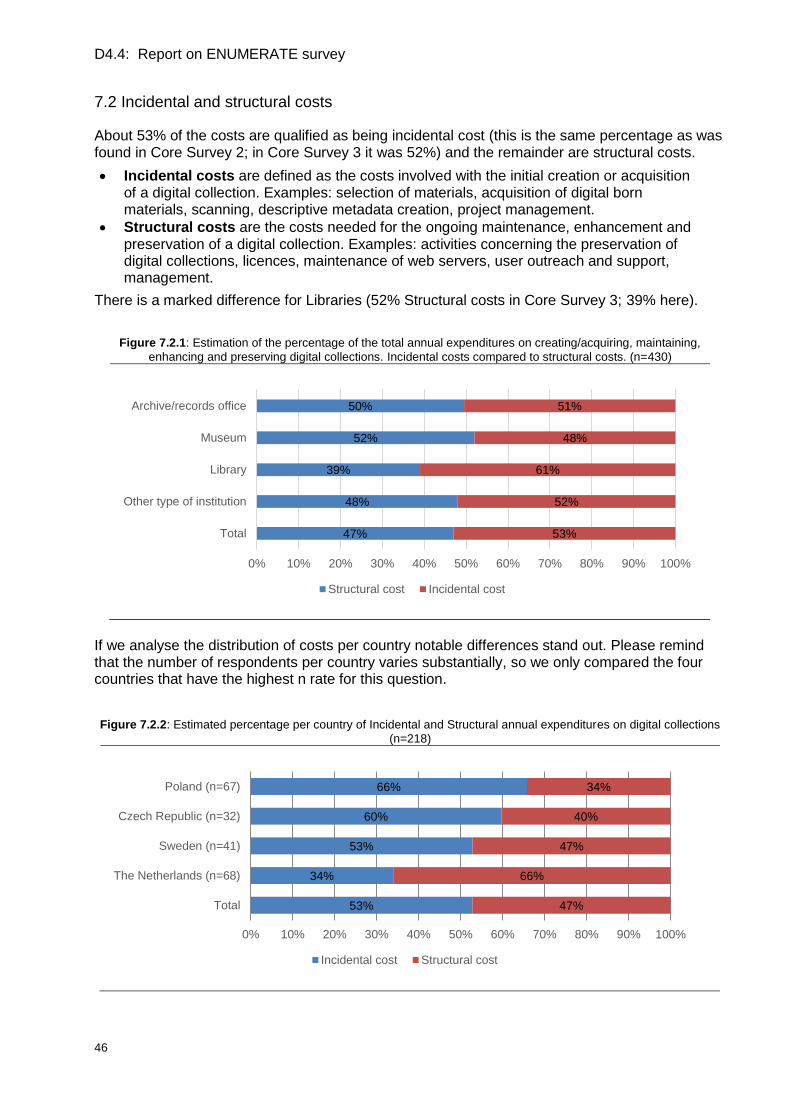
D4.4: Report on ENUMERATE survey
46
7.2 Incidental and structural costs
About 53% of the costs are qualified as being incidental cost (this is the same percentage as was found in Core Survey 2; in Core Survey 3 it was 52%) and the remainder are structural costs.
Incidental costs are defined as the costs involved with the initial creation or acquisition of a digital collection. Examples: selection of materials, acquisition of digital born materials, scanning, descriptive metadata creation, project management.
Structural costs are the costs needed for the ongoing maintenance, enhancement and preservation of a digital collection. Examples: activities concerning the preservation of digital collections, licences, maintenance of web servers, user outreach and support, management.
There is a marked difference for Libraries (52% Structural costs in Core Survey 3; 39% here).
Figure 7.2.1: Estimation of the percentage of the total annual expenditures on creating/acquiring, maintaining,
enhancing and preserving digital collections. Incidental costs compared to structural costs. (n=430)
If we analyse the distribution of costs per country notable differences stand out. Please remind that the number of respondents per country varies substantially, so we only compared the four countries that have the highest n rate for this question. Figure 7.2.2: Estimated percentage per country of Incidental and Structural annual expenditures on digital collections
(n=218)
47%
48%
39%
52%
50%
53%
52%
61%
48%
51%
0% 10% 20% 30% 40% 50% 60% 70% 80% 90% 100%
Total
Other type of institution
Library
Museum
Archive/records office
Structural cost Incidental cost
53%
34%
53%
60%
66%
47%
66%
47%
40%
34%
0% 10% 20% 30% 40% 50% 60% 70% 80% 90% 100%
Total
The Netherlands (n=68)
Sweden (n=41)
Czech Republic (n=32)
Poland (n=67)
Incidental cost Structural cost
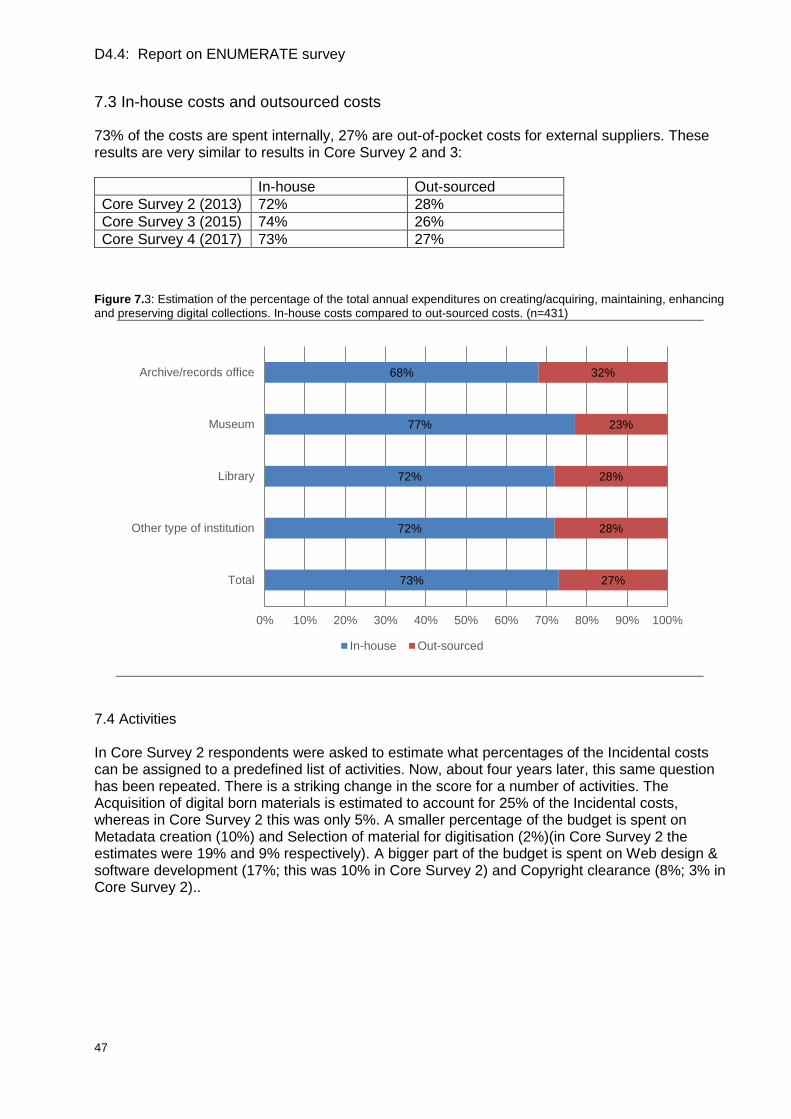
D4.4: Report on ENUMERATE survey
47
7.3 In-house costs and outsourced costs
73% of the costs are spent internally, 27% are out-of-pocket costs for external suppliers. These results are very similar to results in Core Survey 2 and 3:
In-house Out-sourced
Core Survey 2 (2013) 72% 28%
Core Survey 3 (2015) 74% 26%
Core Survey 4 (2017) 73% 27%
Figure 7.3: Estimation of the percentage of the total annual expenditures on creating/acquiring, maintaining, enhancing
and preserving digital collections. In-house costs compared to out-sourced costs. (n=431)
7.4 Activities In Core Survey 2 respondents were asked to estimate what percentages of the Incidental costs can be assigned to a predefined list of activities. Now, about four years later, this same question has been repeated. There is a striking change in the score for a number of activities. The Acquisition of digital born materials is estimated to account for 25% of the Incidental costs, whereas in Core Survey 2 this was only 5%. A smaller percentage of the budget is spent on Metadata creation (10%) and Selection of material for digitisation (2%)(in Core Survey 2 the estimates were 19% and 9% respectively). A bigger part of the budget is spent on Web design & software development (17%; this was 10% in Core Survey 2) and Copyright clearance (8%; 3% in Core Survey 2)..
73%
72%
72%
77%
68%
27%
28%
28%
23%
32%
0% 10% 20% 30% 40% 50% 60% 70% 80% 90% 100%
Total
Other type of institution
Library
Museum
Archive/records office
In-house Out-sourced
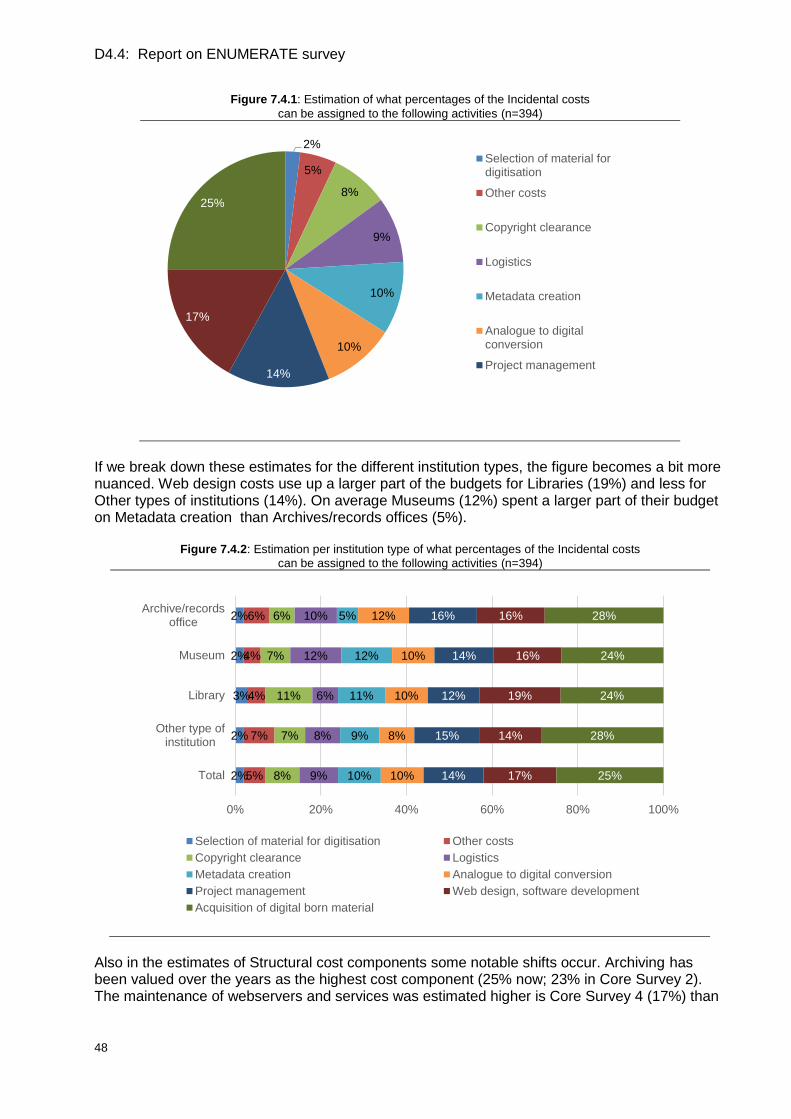
D4.4: Report on ENUMERATE survey
48
Figure 7.4.1: Estimation of what percentages of the Incidental costs
can be assigned to the following activities (n=394)
If we break down these estimates for the different institution types, the figure becomes a bit more nuanced. Web design costs use up a larger part of the budgets for Libraries (19%) and less for Other types of institutions (14%). On average Museums (12%) spent a larger part of their budget on Metadata creation than Archives/records offices (5%).
Figure 7.4.2: Estimation per institution type of what percentages of the Incidental costs
can be assigned to the following activities (n=394)
Also in the estimates of Structural cost components some notable shifts occur. Archiving has been valued over the years as the highest cost component (25% now; 23% in Core Survey 2). The maintenance of webservers and services was estimated higher is Core Survey 4 (17%) than
2%
5%
8%
9%
10%
10%
14%
17%
25%
Selection of material fordigitisation
Other costs
Copyright clearance
Logistics
Metadata creation
Analogue to digitalconversion
Project management
2%
2%
3%
2%
2%
5%
7%
4%
4%
6%
8%
7%
11%
7%
6%
9%
8%
6%
12%
10%
10%
9%
11%
12%
5%
10%
8%
10%
10%
12%
14%
15%
12%
14%
16%
17%
14%
19%
16%
16%
25%
28%
24%
24%
28%
0% 20% 40% 60% 80% 100%
Total
Other type ofinstitution
Library
Museum
Archive/recordsoffice
Selection of material for digitisation Other costs
Copyright clearance Logistics
Metadata creation Analogue to digital conversion
Project management Web design, software development
Acquisition of digital born material
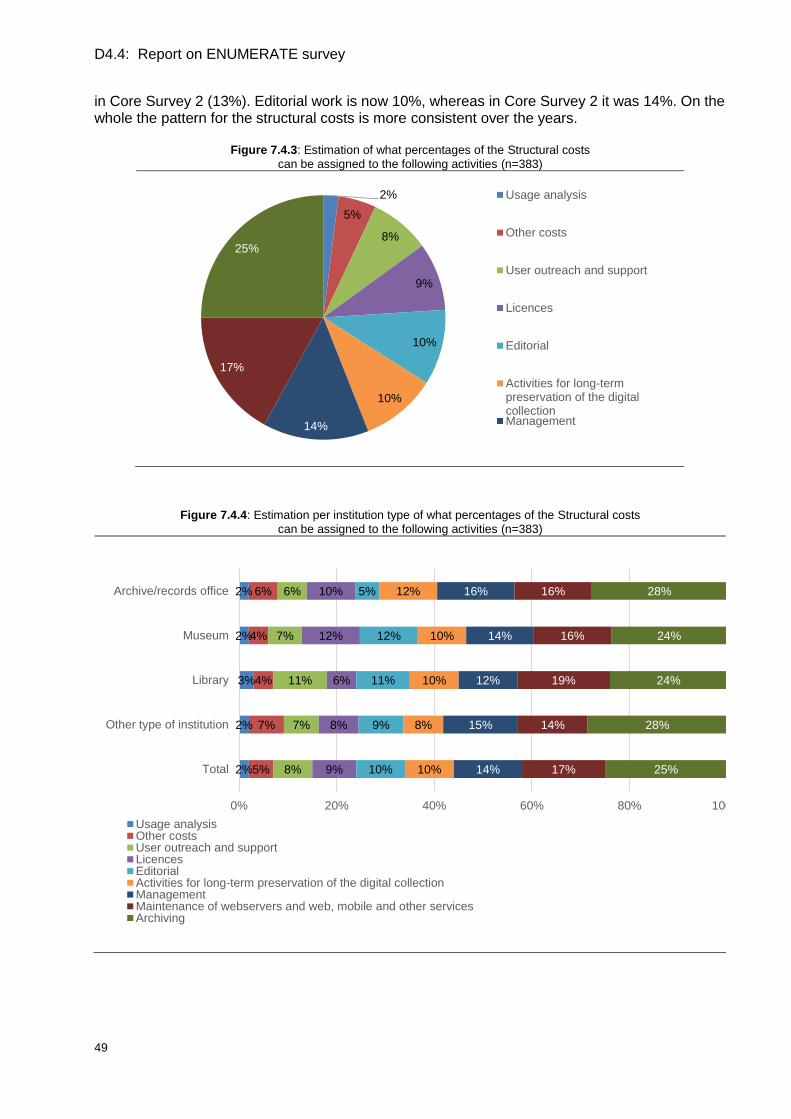
D4.4: Report on ENUMERATE survey
49
in Core Survey 2 (13%). Editorial work is now 10%, whereas in Core Survey 2 it was 14%. On the whole the pattern for the structural costs is more consistent over the years.
Figure 7.4.3: Estimation of what percentages of the Structural costs
can be assigned to the following activities (n=383)
Figure 7.4.4: Estimation per institution type of what percentages of the Structural costs
can be assigned to the following activities (n=383)
2%
5%
8%
9%
10%
10%
14%
17%
25%
Usage analysis
Other costs
User outreach and support
Licences
Editorial
Activities for long-termpreservation of the digitalcollectionManagement
2%
2%
3%
2%
2%
5%
7%
4%
4%
6%
8%
7%
11%
7%
6%
9%
8%
6%
12%
10%
10%
9%
11%
12%
5%
10%
8%
10%
10%
12%
14%
15%
12%
14%
16%
17%
14%
19%
16%
16%
25%
28%
24%
24%
28%
0% 20% 40% 60% 80% 100%
Total
Other type of institution
Library
Museum
Archive/records office
Usage analysisOther costsUser outreach and supportLicencesEditorialActivities for long-term preservation of the digital collectionManagementMaintenance of webservers and web, mobile and other servicesArchiving
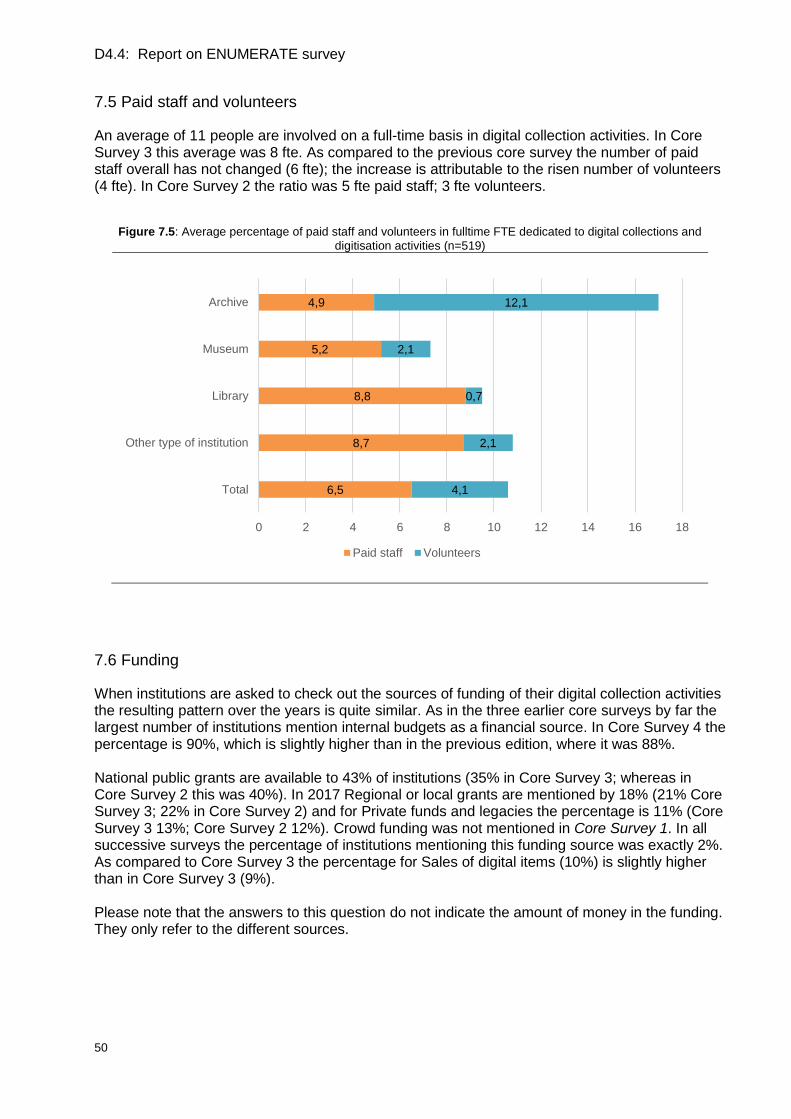
D4.4: Report on ENUMERATE survey
50
7.5 Paid staff and volunteers
An average of 11 people are involved on a full-time basis in digital collection activities. In Core Survey 3 this average was 8 fte. As compared to the previous core survey the number of paid staff overall has not changed (6 fte); the increase is attributable to the risen number of volunteers (4 fte). In Core Survey 2 the ratio was 5 fte paid staff; 3 fte volunteers.
Figure 7.5: Average percentage of paid staff and volunteers in fulltime FTE dedicated to digital collections and
digitisation activities (n=519)
7.6 Funding
When institutions are asked to check out the sources of funding of their digital collection activities the resulting pattern over the years is quite similar. As in the three earlier core surveys by far the largest number of institutions mention internal budgets as a financial source. In Core Survey 4 the percentage is 90%, which is slightly higher than in the previous edition, where it was 88%. National public grants are available to 43% of institutions (35% in Core Survey 3; whereas in Core Survey 2 this was 40%). In 2017 Regional or local grants are mentioned by 18% (21% Core Survey 3; 22% in Core Survey 2) and for Private funds and legacies the percentage is 11% (Core Survey 3 13%; Core Survey 2 12%). Crowd funding was not mentioned in Core Survey 1. In all successive surveys the percentage of institutions mentioning this funding source was exactly 2%. As compared to Core Survey 3 the percentage for Sales of digital items (10%) is slightly higher than in Core Survey 3 (9%). Please note that the answers to this question do not indicate the amount of money in the funding. They only refer to the different sources.
6,5
8,7
8,8
5,2
4,9
4,1
2,1
0,7
2,1
12,1
0 2 4 6 8 10 12 14 16 18
Total
Other type of institution
Library
Museum
Archive
Paid staff Volunteers
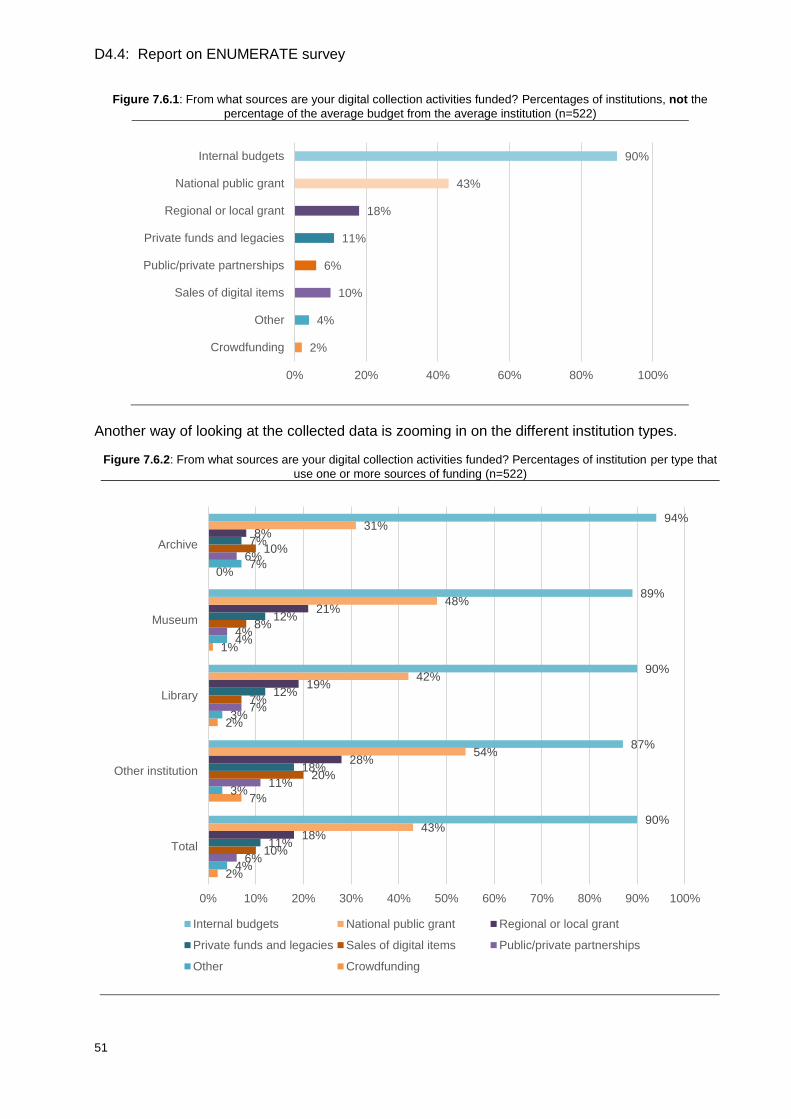
D4.4: Report on ENUMERATE survey
51
Figure 7.6.1: From what sources are your digital collection activities funded? Percentages of institutions, not the
percentage of the average budget from the average institution (n=522)
Another way of looking at the collected data is zooming in on the different institution types.
Figure 7.6.2: From what sources are your digital collection activities funded? Percentages of institution per type that
use one or more sources of funding (n=522)
2%
4%
10%
6%
11%
18%
43%
90%
0% 20% 40% 60% 80% 100%
Crowdfunding
Other
Sales of digital items
Public/private partnerships
Private funds and legacies
Regional or local grant
National public grant
Internal budgets
2%
7%
2%
1%
0%
4%
3%
3%
4%
7%
6%
11%
7%
4%
6%
10%
20%
7%
8%
10%
11%
18%
12%
12%
7%
18%
28%
19%
21%
8%
43%
54%
42%
48%
31%
90%
87%
90%
89%
94%
0% 10% 20% 30% 40% 50% 60% 70% 80% 90% 100%
Total
Other institution
Library
Museum
Archive
Internal budgets National public grant Regional or local grant
Private funds and legacies Sales of digital items Public/private partnerships
Other Crowdfunding
D4.4: Report on ENUMERATE survey
52
Appendix – Core Survey 4 Questionnaire ENUMERATE Core Survey 4 April 2017
1. Background (This information will not be published or shared in any form)
Name of institution / organisation
[input box] Website of your institution
[input box] Provide the address of your institution’s main website that is accessible for the general public.
Your name [input box]
Your e-mail address [input box]
SECTION 1/7. Organisational Information
2. Type / Domain of institution / organisation
Specify the primary heading you would assign to your institution. Please choose only one of the following:
o National archive
o Other archive / records office
o Audio-visual / broadcasting archive
o Film institute
o Institution for performing arts
o Museum of art
o Museum of archaeology or history
o Museum of natural history or natural science
o Museum of science or technology
o Museum of ethnography or anthropology
o National library
o Higher education library
o Public library
o Special or other type of library
o Institution for monument care
o Other (please specify below)
Other type of institution: [input box] 3. Country in which your institution is located
o Albania
o Andorra
o Armenia
o Austria
o Azerbaijan
o Belarus
o Belgium
o Bosnia and Herzegovina
D4.4: Report on ENUMERATE survey
53
o Bulgaria
o Croatia
o Cyprus
o Czech Republic
o Denmark
o Estonia
o Finland
o France
o Georgia
o Germany
o Greece
o Hungary
o Iceland
o Ireland
o Italy
o Kazakhstan
o Kosovo
o Latvia
o Liechtenstein
o Lithuania
o Luxembourg
o Macedonia
o Malta
o Moldova
o Monaco
o Montenegro
o Netherlands
o Norway
o Poland
o Portugal
o Romania
o Russia
o San Marino
o Serbia
o Slovakia
o Slovenia
o Spain
o Sweden
o Switzerland
o Turkey
o Ukraine
o United Kingdom (UK)
o Vatican City
o Other country (specify below)
Other country: [input box] 4. Does your institution have *collections* that need to be preserved for future generations?
[ ] Yes [ ] No Answer this question with 'No' if your institution does not hold heritage collections or if you only have collections (for example of books, films, music) that can be lend by or sold to users. ###If the answer is No, automatically proceed to o-o-o at the end of the survey.###
D4.4: Report on ENUMERATE survey
54
5. What is your institution’s total annual budget?
###Respondent can choose only one of the following:###
o < 10,000 €
o 10,000-50,000 €
o 50,000-100,000 €
o 100,000-500,000 €
o 500,000-1M €
o 1 - 10M €
o > 10M €
Provide the annual budget for the entire cultural heritage institution as indicated in the last published annual account. If your institution is part of a larger organisation (e.g. a higher education library that is part of a higher education institution) only provide the budget of the cultural heritage related unit. The total annual budget may include government funding, project funding, revenues from commercial activities, etc. If your
budget occurs in two categories (e.g. 50,000 €), please choose the lower category.
6. Total number of paid staff (in *full time equivalents*, not in number of people)
[input box] [only 1 decimal accepted, e.g.: 3,7] The number of *full time equivalents* should represent the total staff employed by your institution, including permanent and temporary staff, but excluding contractors and volunteers. Part-time staff needs to be added up to represent a full working week. If your institution is part of a larger organisation (e.g. a higher education library that is part of a higher education institution) only provide the numbers of the cultural heritage related unit. Note: the number of staff engaged in *digital collection activities* will be asked for later in the survey (see below).
SECTION 2/7. Digital Collections (Supply)
7. Does your organisation have a *written digital strategy*, endorsed by the management of your
organisation?
[ ] Yes [ ] No [ ] Do not know The strategy may be for any period up to 2022.
8. If Yes, what topics does your digital strategy cover: [ ] digitisation of analogue collections [ ] selection and acquisition of digital collections [ ] publishing your digital collections [ ] *long-term digital preservation* 9. Does your organisation collect *born digital heritage*?
[ ] Yes [ ] No [ ] Do not know Answer this question with ´yes´ if your institution collects any kind of *born digital heritage* materials (i.e. digital documents, digital art, harvested web content, software etc.) with the explicit intention of preserving these born digital materials for future generations.
10. Please select the collection types that are part of the heritage collections of your institution
Please specify the object types that are part of the heritage collections of your institution. The digital collection consists of digitally reproduced analogue objects and born digital objects. An
D4.4: Report on ENUMERATE survey
55
object that has been catalogued in a database with metadata records only, is not considered to be part of the ´digital collection´.
*Collection type* In analogue collection y/n
In digital collection y/n
Not applicable
(01) TEXT BASED RESOURCES (excluding Archival Records) (Rare printed books, Other printed books, Electronic books (eBooks), Newspapers, Journals, Other serials, Medieval Manuscripts, Other Manuscripts, Microforms and microfilms, Other text based)
(02) VISUAL (2D) RESOURCES (excluding Archival Records) (Drawings, Engravings / Prints, Maps and ground plans, Paintings, Photographs, Posters, Sheet music, Other visual resources)
(03) ARCHIVAL RECORDS (not included in 01 or 02) (Government documents, Other archival resources)
(04) 3D MAN-MADE MOVABLE OBJECTS (3 Dimensional works of art, Archaeologic Furnishings and Equipment, Other Furnishings and Equipment, Coins and medals, Other 3 dimensional man-made objects)
(05) NATURAL RESOURCES (Natural inert specimens, Natural living specimens)
(06) GEOGRAPHY BASED RESOURCES (Monuments and buildings, Landscapes, Archeological sites, Other geography based resources)
(07) TIME BASED RESOURCES (Audio files: Music, Audio files: Speech & other (excl. digital audio books; incl. oral history files), Digital audio books, Film, Video recordings, Other time based resources)
(08) DIGITAL INTERACTIVE RESOURCES (EXCLUSIVELY DIGITAL) (Databases (containing cultural heritage metadata), Digital (3D) designs or reconstructions of objects and buildings, Born-digital art objects, Digital research files (incl. GIS files), Games, Software (customised), Websites (and parts of websites), Other born-digital interactive resources)
Tests have indicated that answering the questions about the size of collections are rewarding, but may be challenging. Some institutions will want to be more specific than is possible here; others may find it difficult to give even the high level estimates asked for. We are convinced that institutions will benefit from an exercise in mapping out digital collections. Please contact us at [email protected] if you are able to supply this information. 11. Estimate the percentage of your entire heritage collection that has been catalogued in a
collection database:
[input box] The estimated percentage of your entire heritage collections that has been catalogued in a collection database concerns item level descriptions (metadata records) of analogue and born-digital heritage objects.
12. Estimate the percentage of your analogue heritage collections that has already been digitally
reproduced:
[input box] A digital reproduction is a digital surrogate of an original analogue object. Please note that an object that has only been catalogued in a database with metadata records is not considered to be “digitally reproduced”.
13. Estimate the percentage of your analogue heritage collections that still needs to be digitally
reproduced:
D4.4: Report on ENUMERATE survey
56
[input box]
14. Does your organisation have *digital collections* or is it currently involved in collection
*digitisation* activities?
[ ] Yes [ ] No ###If the answer is No, automatically proceed to the end of the survey.###
SECTION 3/7. Digital Access
15. What percentage of your descriptive metadata (as recorded in your collection databases) is
available online for general use:
[input box] This concerns the estimated percentage of the metadata records in your collection database(s) that is available for immediate use on demand by any internet connected person or system, without human intervention.
16. Estimate the percentage of your digitally reproduced and born digital heritage collections that is
available online for general use:
[input box] This concerns the estimated percentage of the digitally reproduced and born digital objects in your heritage collections that is available for immediate use on demand by any internet connected person or system, without human intervention.
17. Estimate the percentages of your entire digital collection for which the following copyright
conditions apply.
Rights Full content
Public domain %
Copyright ownership is held by the institution %
Copyright ownership is held by a third party %
Copyright conditions other/unknown %
100%
18. Estimate the percentages of your entire digital collection for which the following copyright
conditions apply.
Rights Metadata
Public domain %
Copyright ownership is held by the institution %
Copyright ownership is held by a third party %
Copyright conditions other/unknown %
100%
19. Please indicate the estimated percentage of all your digital objects that are and/or will be
accessible through the access options mentioned:
[ ] Offline only (for staff use only) [input box] [ ] Offline only (for staff use and visitors on site) [input box] [ ] Online [input box]
20. For the online part, please indicate through which channels in the table below:
D4.4: Report on ENUMERATE survey
57
Access channel % of digital objects
currently accessible
(estimation is OK)
% of digital objects
accessible 2 years from
now (estimation is
OK)
*Institutional website*
*National aggregator*
*Europeana*
*Other aggregator*
*Wikipedia/Wikimedia*
Other *Social media platforms* like *Instagram, Flickr, YouTube, Facebook
Institutional *API*
3rd party *API*
Other Access channels (specify below)
Other Access channels: [input box] Multiple access options for your individual digital collections are a possibility (i.e. Europeana and Wikipedia). Consequently, the sum total of your answers does not have to be 100%.
SECTION 4/7. Participation
21. Collections are made accessible to the public for various reasons. How important is each of the
following types of use for your institution?
Using a 10-points scale - where 1 equals "not at all important" to 10 "highly important" - please select only one number per row.
Type of use 1 2 3 4 5 6 7 8 9 10
Academic research ○ ○ ○ ○ ○ ○ ○ ○ ○ ○
Creative reuse/Remix ○ ○ ○ ○ ○ ○ ○ ○ ○ ○
Educational use ○ ○ ○ ○ ○ ○ ○ ○ ○ ○
Ideological, religious and commemorative use ○ ○ ○ ○ ○ ○ ○ ○ ○ ○
Personal enjoyment ○ ○ ○ ○ ○ ○ ○ ○ ○ ○
Reducing the use of the physical originals ○ ○ ○ ○ ○ ○ ○ ○ ○ ○
Sales, commercial licencing ○ ○ ○ ○ ○ ○ ○ ○ ○ ○
Other types of use (specify below) ○ ○ ○ ○ ○ ○ ○ ○ ○ ○
Other types of use: [input box] 22. Did your organisation collect user statistics for the digital collections in 2016?
[ ] Yes [ ] No [ ] Do not know In order to be able to answer this question with ‘yes’ any manner of measurement will suffice.
23. If Yes, how? [ ] *Website statistics* [ ] (National) aggregator statistics [ ] Europeana (Dashboard) statistics [ ] Wikipedia/Wikimedia statistics [ ] Other *Social media statistics* (e.g. Youtube, Twitter, Facebook, Flickr, Pinterest) [ ] *Database statistics* (not included in Website statistics and Social media statistics) [ ] *User studies*
D4.4: Report on ENUMERATE survey
58
[ ] Other: [input box] Please indicate all ways in which the access of digital metadata and objects is measured.
24. What is the number of visits of your digital collections at the website of your institution?
[input box] Please enter the overall yearly number of visits (year 2016). This number reveals how many visitors browse the collections. Please do NOT confuse this with the overall number of visits of your website. If you do not measure the use of your digital collections specifically, please skip this question.
SECTION 5/7. Digital Preservation
25. Are (parts of) your digital collections stored in digital archives that have been set up according
to *international standards* for *digital preservation*?
[ ] Yes, we have our own digital archive that meets the international criteria for long term preservation [ ] Yes, our digital collections are archived in a publicly managed professional digital archive [ ] Yes, our digital collections are archived in a privately managed professional digital archive [ ] No, we do not have a solution yet for the long term preservation of our digital collections based on international standards [ ] Do not know Answer this question with ‘yes’ if your institution is actively involved in safeguarding the digital heritage collections for future generations, based on international standards or best practices.
SECTION 6/7. Digitisation Expenditures
26. Please estimate your annual expenditure on your *digital collections* (*total cost of ownership*)
Please estimate the budget concerned
(€):
A:Institutional expenditure (internal budget): . . .
B: Temporary funded project expenditure (external budget): . . .
These budgets should be estimates of the costs related to the initial creation, ongoing maintenance, enhancement and preservation of your digital collections. Please attempt to include the cost of the staff time devoted to digital collection related activities in these estimates. If budget year does not coincide with the calendar, please choose the calendar year
that fits best (in terms of the number of months) Costs can be divided into incidental (upfront) costs and structural (ongoing) costs:
Incidental costs are defined as the costs having to do with the initial creation or acquisition
of a digital collection. Examples: selection of materials, acquisition of digital born materials,
scanning, descriptive metadata creation, project management.
Structural costs are the costs needed for the ongoing maintenance, enhancement and
preservation of a digital collection. Examples: activities concerning the preservation of
digital collections, licences, maintenance of webservers, user outreach and support,
management.
27. Please specify the year concerned:
A: [input box]
B: [input box]
D4.4: Report on ENUMERATE survey
59
28. Please estimate what percentage of the total annual expenditures on creating/acquiring,
maintaining, enhancing and preserving your *digital collections* can be assigned to *incidental
costs* and what percentage can be assigned to *structural costs*:
Incidental costs: Structural costs:
Percentage [should add up to 100%] … % … % 100%
29. Please estimate what percentage of the total annual expenditures on creating/acquiring,
maintaining, enhancing and preserving your *digital collections* is spent *In-house* and what
percentage is *Outsourced*:
In-house costs: Outsourced costs:
Percentage [should add up to 100%] … % … % 100%
The community of libraries, archives and museums would benefit from a better understanding of the costs involved in creating and preserving digital collections. Please help us by providing a more detailed account of your costs.
30. Please estimate what percentages of the *Incidental costs* can be assigned to the following
activities:
% Incidental cost category
Project management
Selection of material for digitisation
Acquisition of digital born material
Logistics (shipment of collection for digitisation, etc.)
Analogue to digital conversion (including all technical and staff costs associated with the act of preparing materials for scanning, the scanning itself, and quality control)
Copyright clearance
Metadata creation
Web design, software development
Other costs (specify below)
100%
The sum total adds up to 100%. Enter 0 if a cost item is not applicable. If you miss any items in the table, please help us and mention these under Other costs.
31. Other costs: [input box]
32. Please estimate what percentages of the *Structural costs* can be assigned to the following
activities:
% Structural cost category
Management
Archiving (storage, including backups)
Activities concerning the long-term preservation of the digital collection (including research activities but excluding Archiving costs)
Licences
Maintenance of webservers and web, mobile and other services
User outreach and support (including staff time for efforts to promote the use of the digital collections)
Usage analysis (including user surveys, interviews, and other activities)
Editorial (including content selection and updating)
D4.4: Report on ENUMERATE survey
60
Other costs (specify below)
100%
The sum total adds up to 100%. Enter 0 if a cost item is not applicable. If you miss any items in the table, please help us and mention these under Other costs.
33. Other costs: [input box] 34. What is the total number of people (in full-time equivalent) engaged in creating/acquiring,
maintaining, enhancing and preserving your *digital collections* on an annual basis?
Number of people (in full-time equivalent)
Paid staff: . . .
Volunteers:
. . .
Include the time of being engaged in activities related to creating/acquiring, maintaining, enhancing and preserving your *digital collections*, including: planning and managing in-house and contracted projects; preparing and digitising materials; enhancing digitised output to widen accessibility.
35. Please specify the year concerned:
A: [input box]
B: [input box]
36. From what sources are your digital collection activities funded?
o *Internal budgets*
o *Crowdfunding*
o *National Public grant/subsidy*
o *Regional/Local Public grant/subsidy*
o *Private funds and legacies*
o *Public/private partnership*
o *Sales of digital items*
o Other: [input box]
Indicate all the sources from which your digitisation activities are funded. SECTION 7/7. Comments
37. Please include any comments that you consider relevant for understanding the nature of
activities related to your digital collections or that could help us improving the questionnaire.
[free text field]
o-o-o Thank you for completing this survey! More information on the ENUMERATE project, and the results it has delivered, is available on http://pro.europeana.eu/structure/enumerate