european union, trade in goods with occupied...
TRANSCRIPT
European Commission
Directorate-Generalfor Trade
16-04-2018 1 Units A4 / G2
European Union, Trade in goods with Occupied Palestinian Territory
Table of Contentspg
European Union, Trade with Occupied Palestinian Territory
- Key Figures 2
- Imports / Exports 2017 2
- - AMA/NAMA product Groups 2
- - SITC product Groups 2
- - Top 5 - HS sections 2
- - Top 5 - SITC sections 2
- EU Trade flows and balance: Total goods: 2007 - 2017 3
- EU Trade flows by SITC section 2017 4
- EU Trade flows by SITC product grouping 2017 4
- EU Trade flows by SITC section 2014 - 2017 5
- EU Trade flows by SITC product grouping 2014 - 2017 5
- EU Trade flows by HS section 2017 6
- EU Trade flows by HS section 2014 - 2017 7
Occupied Palestinian Territory, Trade with World
- Occupied Palestinian Territory Trade flows and balance: Total goods: 2007 - 2017 8
- Occupied Palestinian Territory Top trading partners: Total goods: 2017 8
- Occupied Palestinian Territory Trade with partner regions: Total goods: 2017 8
European Union, Trade with World
- EU Trade flows and balance: Total goods: 2007 - 2017 9
- EU Top trading partners: Total goods: 2017 9
- EU Top product sections: Total goods: 2017 9
Methodological Notes
- HS Sections (Harmonized System) 10
- SITC Sections 10
- SITC (rev 3.) Product Groupings 10
Important note:Unless otherwise mentioned all figures for "EU" concern the European Union of 28 members for all indicated years.
European Commission
Directorate-Generalfor Trade
16-04-2018 2 Units A4 / G2
European Union, Trade with Occupied Palestinian Territory
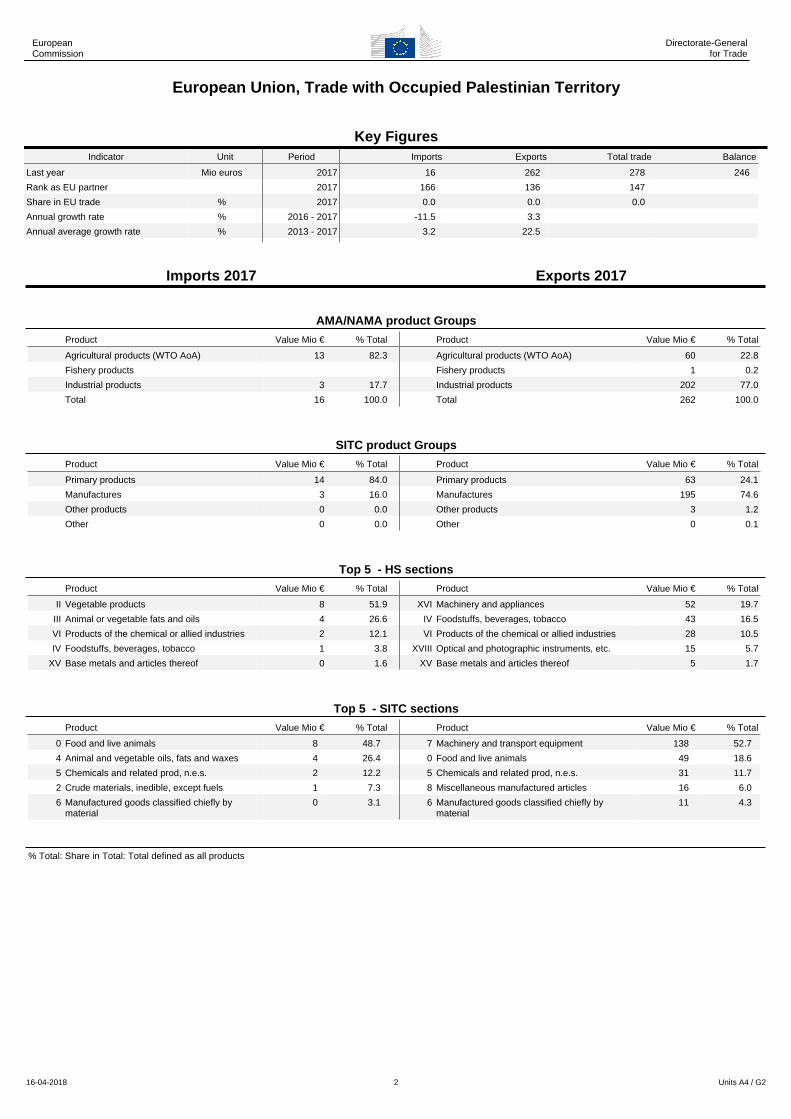
Key Figures
Indicator Unit Period Imports Exports Total trade Balance
Last year Mio euros 2017 16 262 278 246
Rank as EU partner 2017 166 136 147
Share in EU trade % 2017 0.0 0.0 0.0
Annual growth rate % 2016 - 2017 -11.5 3.3
Annual average growth rate % 2013 - 2017 3.2 22.5
Imports 2017 Exports 2017
AMA/NAMA product Groups
Product Value Mio € % Total Product Value Mio € % Total
Agricultural products (WTO AoA) 13 82.3 Agricultural products (WTO AoA) 60 22.8
Fishery products Fishery products 1 0.2
Industrial products 3 17.7 Industrial products 202 77.0
Total 16 100.0 Total 262 100.0
SITC product Groups
Product Value Mio € % Total Product Value Mio € % Total
Primary products 14 84.0 Primary products 63 24.1
Manufactures 3 16.0 Manufactures 195 74.6
Other products 0 0.0 Other products 3 1.2
Other 0 0.0 Other 0 0.1
Top 5 - HS sections
Product Value Mio € % Total Product Value Mio € % Total
II Vegetable products 8 51.9 XVI Machinery and appliances 52 19.7
III Animal or vegetable fats and oils 4 26.6 IV Foodstuffs, beverages, tobacco 43 16.5
VI Products of the chemical or allied industries 2 12.1 VI Products of the chemical or allied industries 28 10.5
IV Foodstuffs, beverages, tobacco 1 3.8 XVIII Optical and photographic instruments, etc. 15 5.7
XV Base metals and articles thereof 0 1.6 XV Base metals and articles thereof 5 1.7
Top 5 - SITC sections
Product Value Mio € % Total Product Value Mio € % Total
0 Food and live animals 8 48.7 7 Machinery and transport equipment 138 52.7
4 Animal and vegetable oils, fats and waxes 4 26.4 0 Food and live animals 49 18.6
5 Chemicals and related prod, n.e.s. 2 12.2 5 Chemicals and related prod, n.e.s. 31 11.7
2 Crude materials, inedible, except fuels 1 7.3 8 Miscellaneous manufactured articles 16 6.0
6 Manufactured goods classified chiefly by material
0 3.1 6 Manufactured goods classified chiefly by material
11 4.3
% Total: Share in Total: Total defined as all products
European Commission
Directorate-Generalfor Trade
16-04-2018 3 Units A4 / G2
European Union, Trade with Occupied Palestinian Territory
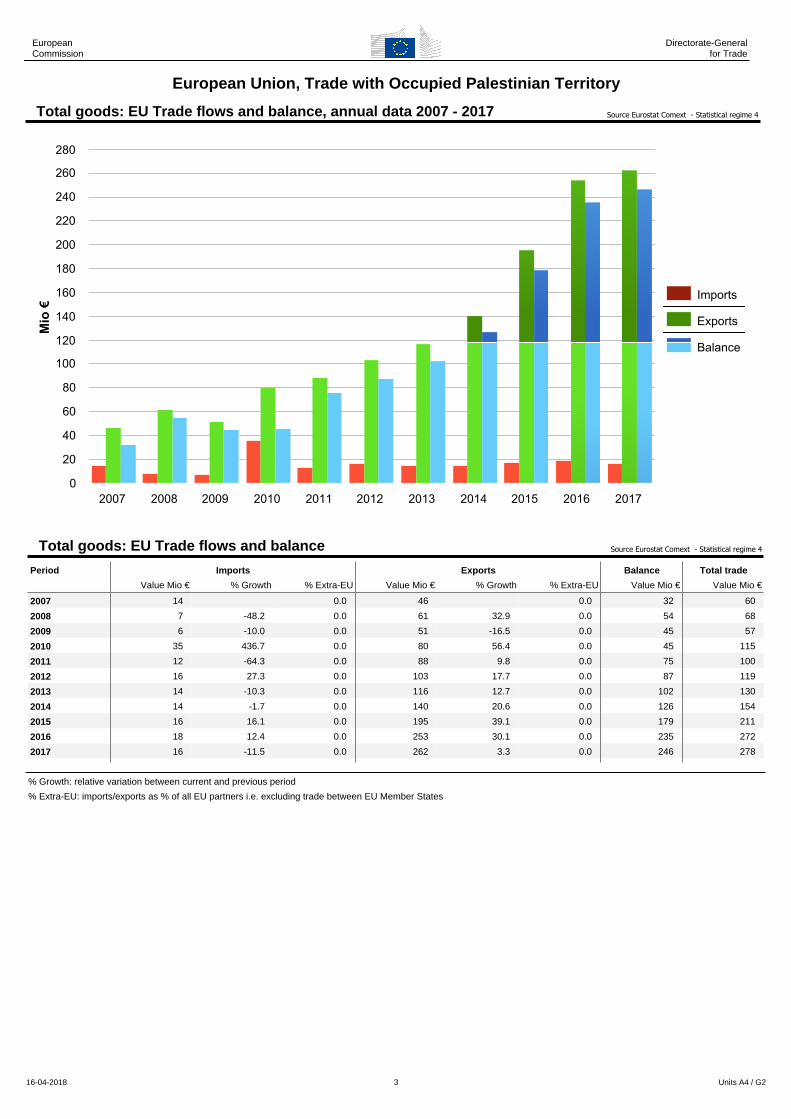
Total goods: EU Trade flows and balance, annual data 2007 - 2017 Source Eurostat Comext - Statistical regime 4
Total goods: EU Trade flows and balance Source Eurostat Comext - Statistical regime 4
Period Imports Exports Balance Total trade
Value Mio € % Growth % Extra-EU Value Mio € % Growth % Extra-EU Value Mio € Value Mio €
2007 14 0.0 46 0.0 32 60
2008 7 -48.2 0.0 61 32.9 0.0 54 68
2009 6 -10.0 0.0 51 -16.5 0.0 45 57
2010 35 436.7 0.0 80 56.4 0.0 45 115
2011 12 -64.3 0.0 88 9.8 0.0 75 100
2012 16 27.3 0.0 103 17.7 0.0 87 119
2013 14 -10.3 0.0 116 12.7 0.0 102 130
2014 14 -1.7 0.0 140 20.6 0.0 126 154
2015 16 16.1 0.0 195 39.1 0.0 179 211
2016 18 12.4 0.0 253 30.1 0.0 235 272
2017 16 -11.5 0.0 262 3.3 0.0 246 278
% Growth: relative variation between current and previous period
% Extra-EU: imports/exports as % of all EU partners i.e. excluding trade between EU Member States
European Commission
Directorate-Generalfor Trade
16-04-2018 4 Units A4 / G2
European Union, Trade with Occupied Palestinian Territory
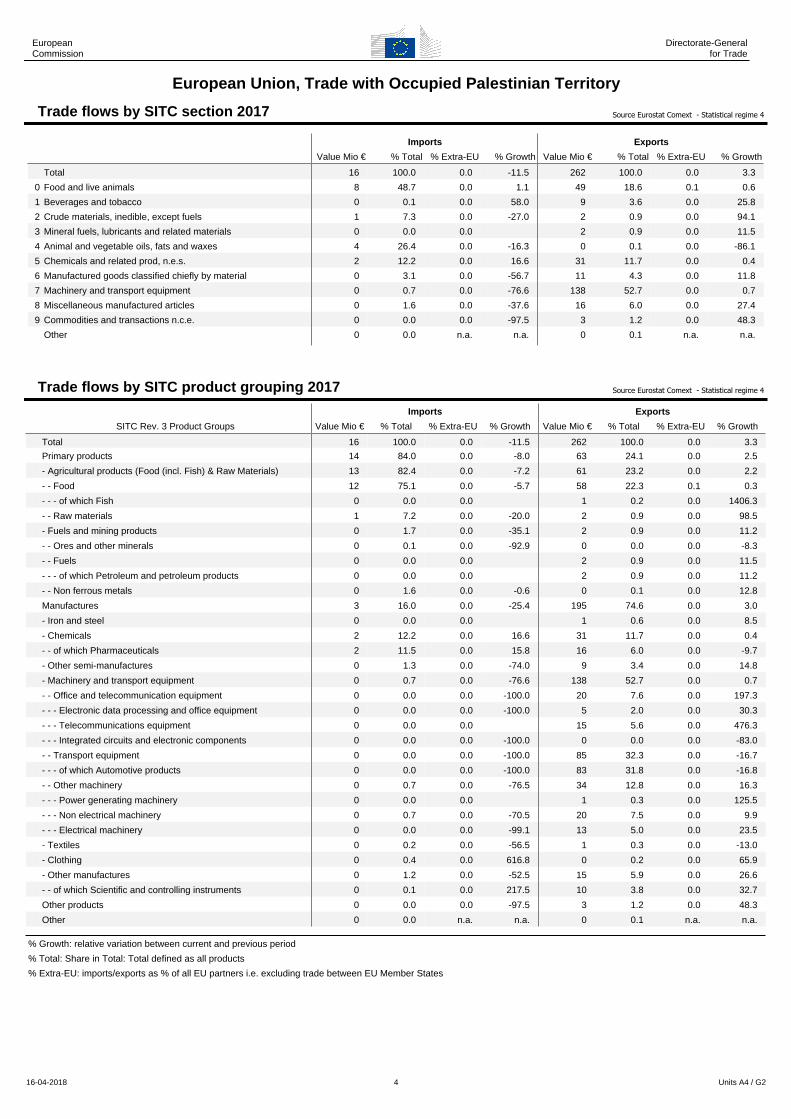
Trade flows by SITC section 2017 Source Eurostat Comext - Statistical regime 4
Imports Exports
Value Mio € % Total % Extra-EU % Growth Value Mio € % Total % Extra-EU % Growth
Total 16 100.0 0.0 -11.5 262 100.0 0.0 3.3
0 Food and live animals 8 48.7 0.0 1.1 49 18.6 0.1 0.6
1 Beverages and tobacco 0 0.1 0.0 58.0 9 3.6 0.0 25.8
2 Crude materials, inedible, except fuels 1 7.3 0.0 -27.0 2 0.9 0.0 94.1
3 Mineral fuels, lubricants and related materials 0 0.0 0.0 2 0.9 0.0 11.5
4 Animal and vegetable oils, fats and waxes 4 26.4 0.0 -16.3 0 0.1 0.0 -86.1
5 Chemicals and related prod, n.e.s. 2 12.2 0.0 16.6 31 11.7 0.0 0.4
6 Manufactured goods classified chiefly by material 0 3.1 0.0 -56.7 11 4.3 0.0 11.8
7 Machinery and transport equipment 0 0.7 0.0 -76.6 138 52.7 0.0 0.7
8 Miscellaneous manufactured articles 0 1.6 0.0 -37.6 16 6.0 0.0 27.4
9 Commodities and transactions n.c.e. 0 0.0 0.0 -97.5 3 1.2 0.0 48.3
Other 0 0.0 n.a. n.a. 0 0.1 n.a. n.a.
Trade flows by SITC product grouping 2017 Source Eurostat Comext - Statistical regime 4
Imports Exports
SITC Rev. 3 Product Groups Value Mio € % Total % Extra-EU % Growth Value Mio € % Total % Extra-EU % Growth
Total 16 100.0 0.0 -11.5 262 100.0 0.0 3.3
Primary products 14 84.0 0.0 -8.0 63 24.1 0.0 2.5
- Agricultural products (Food (incl. Fish) & Raw Materials) 13 82.4 0.0 -7.2 61 23.2 0.0 2.2
- - Food 12 75.1 0.0 -5.7 58 22.3 0.1 0.3
- - - of which Fish 0 0.0 0.0 1 0.2 0.0 1406.3
- - Raw materials 1 7.2 0.0 -20.0 2 0.9 0.0 98.5
- Fuels and mining products 0 1.7 0.0 -35.1 2 0.9 0.0 11.2
- - Ores and other minerals 0 0.1 0.0 -92.9 0 0.0 0.0 -8.3
- - Fuels 0 0.0 0.0 2 0.9 0.0 11.5
- - - of which Petroleum and petroleum products 0 0.0 0.0 2 0.9 0.0 11.2
- - Non ferrous metals 0 1.6 0.0 -0.6 0 0.1 0.0 12.8
Manufactures 3 16.0 0.0 -25.4 195 74.6 0.0 3.0
- Iron and steel 0 0.0 0.0 1 0.6 0.0 8.5
- Chemicals 2 12.2 0.0 16.6 31 11.7 0.0 0.4
- - of which Pharmaceuticals 2 11.5 0.0 15.8 16 6.0 0.0 -9.7
- Other semi-manufactures 0 1.3 0.0 -74.0 9 3.4 0.0 14.8
- Machinery and transport equipment 0 0.7 0.0 -76.6 138 52.7 0.0 0.7
- - Office and telecommunication equipment 0 0.0 0.0 -100.0 20 7.6 0.0 197.3
- - - Electronic data processing and office equipment 0 0.0 0.0 -100.0 5 2.0 0.0 30.3
- - - Telecommunications equipment 0 0.0 0.0 15 5.6 0.0 476.3
- - - Integrated circuits and electronic components 0 0.0 0.0 -100.0 0 0.0 0.0 -83.0
- - Transport equipment 0 0.0 0.0 -100.0 85 32.3 0.0 -16.7
- - - of which Automotive products 0 0.0 0.0 -100.0 83 31.8 0.0 -16.8
- - Other machinery 0 0.7 0.0 -76.5 34 12.8 0.0 16.3
- - - Power generating machinery 0 0.0 0.0 1 0.3 0.0 125.5
- - - Non electrical machinery 0 0.7 0.0 -70.5 20 7.5 0.0 9.9
- - - Electrical machinery 0 0.0 0.0 -99.1 13 5.0 0.0 23.5
- Textiles 0 0.2 0.0 -56.5 1 0.3 0.0 -13.0
- Clothing 0 0.4 0.0 616.8 0 0.2 0.0 65.9
- Other manufactures 0 1.2 0.0 -52.5 15 5.9 0.0 26.6
- - of which Scientific and controlling instruments 0 0.1 0.0 217.5 10 3.8 0.0 32.7
Other products 0 0.0 0.0 -97.5 3 1.2 0.0 48.3
Other 0 0.0 n.a. n.a. 0 0.1 n.a. n.a.
% Growth: relative variation between current and previous period
% Total: Share in Total: Total defined as all products
% Extra-EU: imports/exports as % of all EU partners i.e. excluding trade between EU Member States
European Commission
Directorate-Generalfor Trade
16-04-2018 5 Units A4 / G2
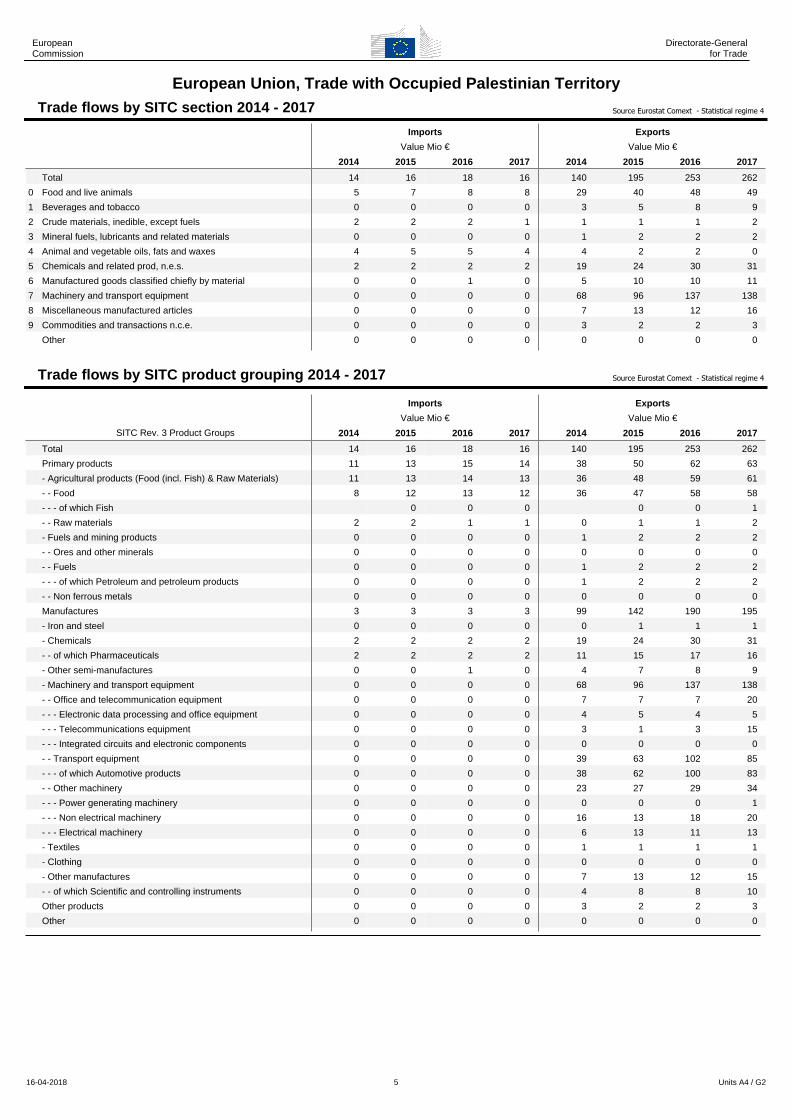
European Union, Trade with Occupied Palestinian TerritoryTrade flows by SITC section 2014 - 2017 Source Eurostat Comext - Statistical regime 4
Imports Exports
Value Mio € Value Mio €
2014 2015 2016 2017 2014 2015 2016 2017
Total 14 16 18 16 140 195 253 262
0 Food and live animals 5 7 8 8 29 40 48 49
1 Beverages and tobacco 0 0 0 0 3 5 8 9
2 Crude materials, inedible, except fuels 2 2 2 1 1 1 1 2
3 Mineral fuels, lubricants and related materials 0 0 0 0 1 2 2 2
4 Animal and vegetable oils, fats and waxes 4 5 5 4 4 2 2 0
5 Chemicals and related prod, n.e.s. 2 2 2 2 19 24 30 31
6 Manufactured goods classified chiefly by material 0 0 1 0 5 10 10 11
7 Machinery and transport equipment 0 0 0 0 68 96 137 138
8 Miscellaneous manufactured articles 0 0 0 0 7 13 12 16
9 Commodities and transactions n.c.e. 0 0 0 0 3 2 2 3
Other 0 0 0 0 0 0 0 0
Trade flows by SITC product grouping 2014 - 2017 Source Eurostat Comext - Statistical regime 4
Imports Exports
Value Mio € Value Mio €
SITC Rev. 3 Product Groups 2014 2015 2016 2017 2014 2015 2016 2017
Total 14 16 18 16 140 195 253 262
Primary products 11 13 15 14 38 50 62 63
- Agricultural products (Food (incl. Fish) & Raw Materials) 11 13 14 13 36 48 59 61
- - Food 8 12 13 12 36 47 58 58
- - - of which Fish 0 0 0 0 0 1
- - Raw materials 2 2 1 1 0 1 1 2
- Fuels and mining products 0 0 0 0 1 2 2 2
- - Ores and other minerals 0 0 0 0 0 0 0 0
- - Fuels 0 0 0 0 1 2 2 2
- - - of which Petroleum and petroleum products 0 0 0 0 1 2 2 2
- - Non ferrous metals 0 0 0 0 0 0 0 0
Manufactures 3 3 3 3 99 142 190 195
- Iron and steel 0 0 0 0 0 1 1 1
- Chemicals 2 2 2 2 19 24 30 31
- - of which Pharmaceuticals 2 2 2 2 11 15 17 16
- Other semi-manufactures 0 0 1 0 4 7 8 9
- Machinery and transport equipment 0 0 0 0 68 96 137 138
- - Office and telecommunication equipment 0 0 0 0 7 7 7 20
- - - Electronic data processing and office equipment 0 0 0 0 4 5 4 5
- - - Telecommunications equipment 0 0 0 0 3 1 3 15
- - - Integrated circuits and electronic components 0 0 0 0 0 0 0 0
- - Transport equipment 0 0 0 0 39 63 102 85
- - - of which Automotive products 0 0 0 0 38 62 100 83
- - Other machinery 0 0 0 0 23 27 29 34
- - - Power generating machinery 0 0 0 0 0 0 0 1
- - - Non electrical machinery 0 0 0 0 16 13 18 20
- - - Electrical machinery 0 0 0 0 6 13 11 13
- Textiles 0 0 0 0 1 1 1 1
- Clothing 0 0 0 0 0 0 0 0
- Other manufactures 0 0 0 0 7 13 12 15
- - of which Scientific and controlling instruments 0 0 0 0 4 8 8 10
Other products 0 0 0 0 3 2 2 3
Other 0 0 0 0 0 0 0 0
European Commission
Directorate-Generalfor Trade
16-04-2018 6 Units A4 / G2
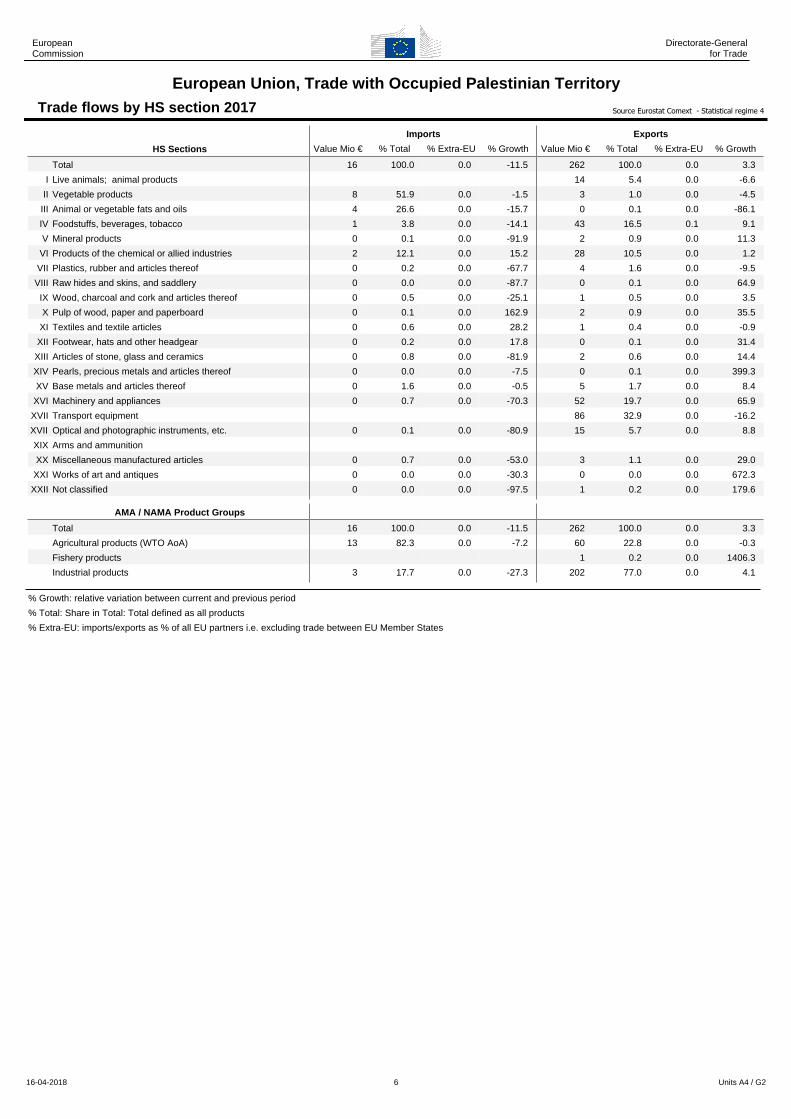
European Union, Trade with Occupied Palestinian TerritoryTrade flows by HS section 2017 Source Eurostat Comext - Statistical regime 4
Imports Exports
HS Sections Value Mio € % Total % Extra-EU % Growth Value Mio € % Total % Extra-EU % Growth
Total 16 100.0 0.0 -11.5 262 100.0 0.0 3.3
I Live animals; animal products 14 5.4 0.0 -6.6
II Vegetable products 8 51.9 0.0 -1.5 3 1.0 0.0 -4.5
III Animal or vegetable fats and oils 4 26.6 0.0 -15.7 0 0.1 0.0 -86.1
IV Foodstuffs, beverages, tobacco 1 3.8 0.0 -14.1 43 16.5 0.1 9.1
V Mineral products 0 0.1 0.0 -91.9 2 0.9 0.0 11.3
VI Products of the chemical or allied industries 2 12.1 0.0 15.2 28 10.5 0.0 1.2
VII Plastics, rubber and articles thereof 0 0.2 0.0 -67.7 4 1.6 0.0 -9.5
VIII Raw hides and skins, and saddlery 0 0.0 0.0 -87.7 0 0.1 0.0 64.9
IX Wood, charcoal and cork and articles thereof 0 0.5 0.0 -25.1 1 0.5 0.0 3.5
X Pulp of wood, paper and paperboard 0 0.1 0.0 162.9 2 0.9 0.0 35.5
XI Textiles and textile articles 0 0.6 0.0 28.2 1 0.4 0.0 -0.9
XII Footwear, hats and other headgear 0 0.2 0.0 17.8 0 0.1 0.0 31.4
XIII Articles of stone, glass and ceramics 0 0.8 0.0 -81.9 2 0.6 0.0 14.4
XIV Pearls, precious metals and articles thereof 0 0.0 0.0 -7.5 0 0.1 0.0 399.3
XV Base metals and articles thereof 0 1.6 0.0 -0.5 5 1.7 0.0 8.4
XVI Machinery and appliances 0 0.7 0.0 -70.3 52 19.7 0.0 65.9
XVII Transport equipment 86 32.9 0.0 -16.2
XVIII Optical and photographic instruments, etc. 0 0.1 0.0 -80.9 15 5.7 0.0 8.8
XIX Arms and ammunition
XX Miscellaneous manufactured articles 0 0.7 0.0 -53.0 3 1.1 0.0 29.0
XXI Works of art and antiques 0 0.0 0.0 -30.3 0 0.0 0.0 672.3
XXII Not classified 0 0.0 0.0 -97.5 1 0.2 0.0 179.6
AMA / NAMA Product Groups
Total 16 100.0 0.0 -11.5 262 100.0 0.0 3.3
Agricultural products (WTO AoA) 13 82.3 0.0 -7.2 60 22.8 0.0 -0.3
Fishery products 1 0.2 0.0 1406.3
Industrial products 3 17.7 0.0 -27.3 202 77.0 0.0 4.1
% Growth: relative variation between current and previous period
% Total: Share in Total: Total defined as all products
% Extra-EU: imports/exports as % of all EU partners i.e. excluding trade between EU Member States
European Commission
Directorate-Generalfor Trade
16-04-2018 7 Units A4 / G2
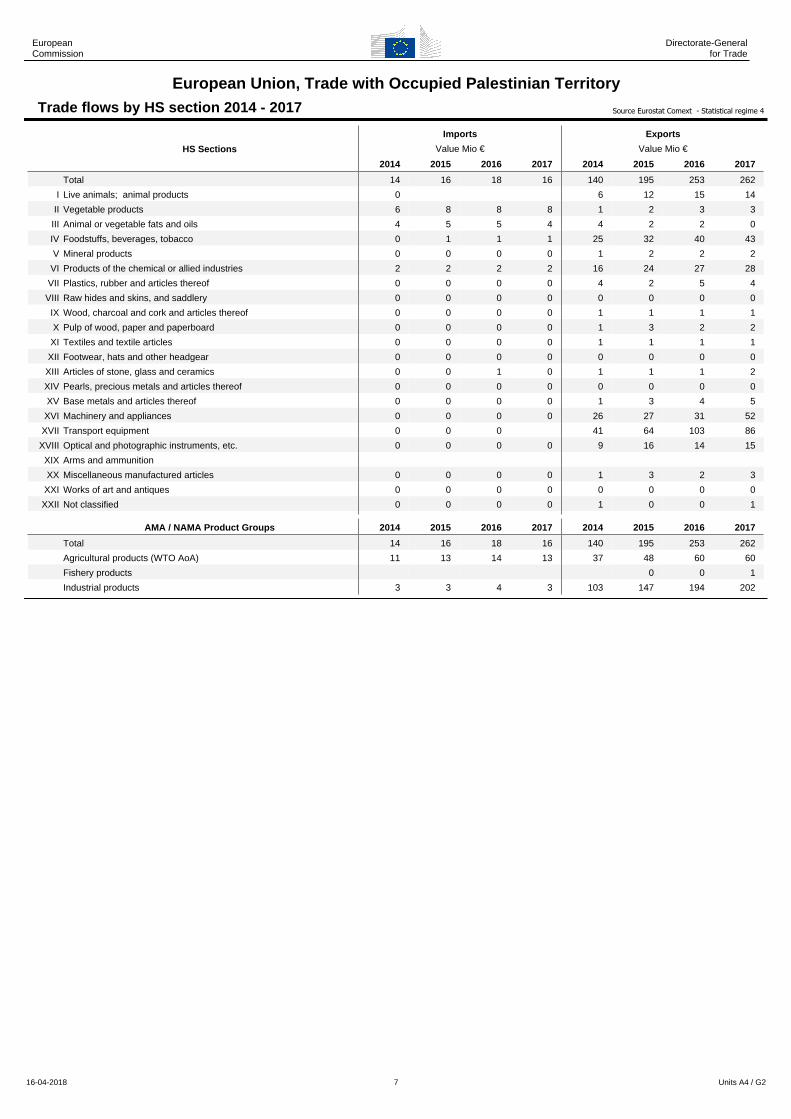
European Union, Trade with Occupied Palestinian TerritoryTrade flows by HS section 2014 - 2017 Source Eurostat Comext - Statistical regime 4
Imports Exports
HS Sections Value Mio € Value Mio €
2014 2015 2016 2017 2014 2015 2016 2017
Total 14 16 18 16 140 195 253 262
I Live animals; animal products 0 6 12 15 14
II Vegetable products 6 8 8 8 1 2 3 3
III Animal or vegetable fats and oils 4 5 5 4 4 2 2 0
IV Foodstuffs, beverages, tobacco 0 1 1 1 25 32 40 43
V Mineral products 0 0 0 0 1 2 2 2
VI Products of the chemical or allied industries 2 2 2 2 16 24 27 28
VII Plastics, rubber and articles thereof 0 0 0 0 4 2 5 4
VIII Raw hides and skins, and saddlery 0 0 0 0 0 0 0 0
IX Wood, charcoal and cork and articles thereof 0 0 0 0 1 1 1 1
X Pulp of wood, paper and paperboard 0 0 0 0 1 3 2 2
XI Textiles and textile articles 0 0 0 0 1 1 1 1
XII Footwear, hats and other headgear 0 0 0 0 0 0 0 0
XIII Articles of stone, glass and ceramics 0 0 1 0 1 1 1 2
XIV Pearls, precious metals and articles thereof 0 0 0 0 0 0 0 0
XV Base metals and articles thereof 0 0 0 0 1 3 4 5
XVI Machinery and appliances 0 0 0 0 26 27 31 52
XVII Transport equipment 0 0 0 41 64 103 86
XVIII Optical and photographic instruments, etc. 0 0 0 0 9 16 14 15
XIX Arms and ammunition
XX Miscellaneous manufactured articles 0 0 0 0 1 3 2 3
XXI Works of art and antiques 0 0 0 0 0 0 0 0
XXII Not classified 0 0 0 0 1 0 0 1
AMA / NAMA Product Groups 2014 2015 2016 2017 2014 2015 2016 2017
Total 14 16 18 16 140 195 253 262
Agricultural products (WTO AoA) 11 13 14 13 37 48 60 60
Fishery products 0 0 1
Industrial products 3 3 4 3 103 147 194 202
European Commission
Directorate-Generalfor Trade
16-04-2018 8 Units A4 / G2
Occupied Palestinian Territory, Trade with World
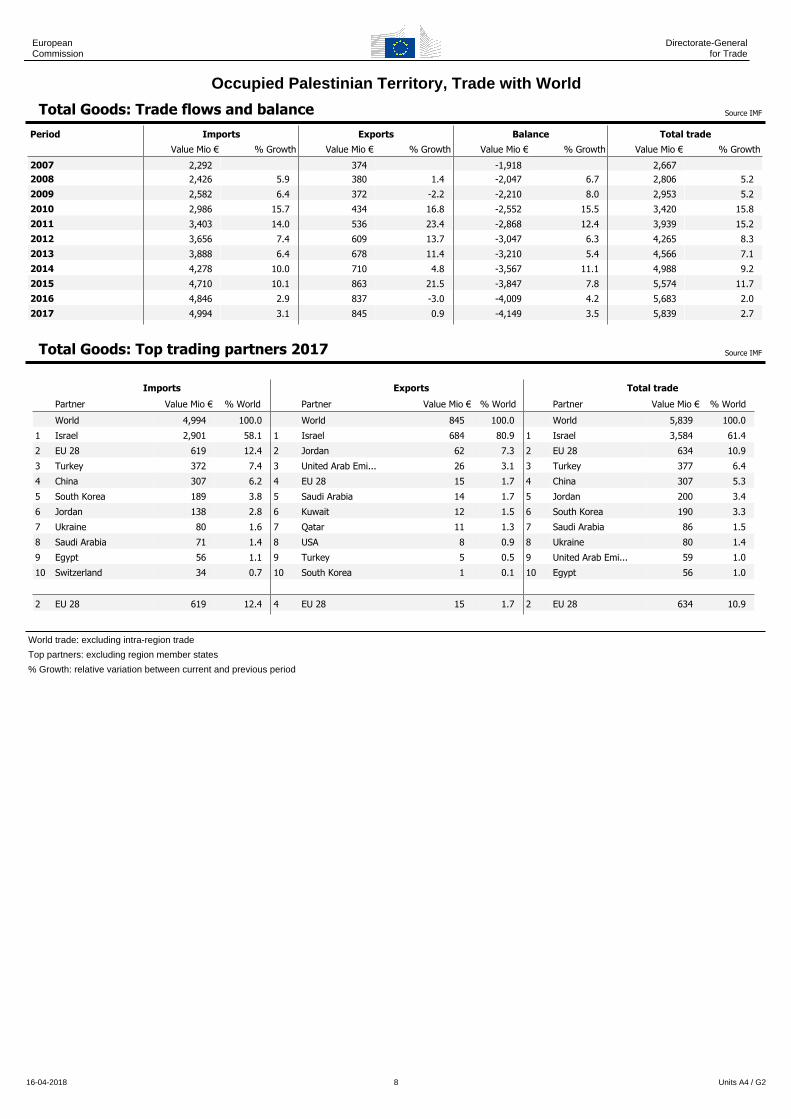
Total Goods: Trade flows and balance Source IMF
Period Imports Exports Balance Total trade
Value Mio € % Growth Value Mio € % Growth Value Mio € % Growth Value Mio € % Growth
2007 2,292 374 -1,918 2,667 2008 2,426 5.9 380 1.4 -2,047 6.7 2,806 5.2
2009 2,582 6.4 372 -2.2 -2,210 8.0 2,953 5.2
2010 2,986 15.7 434 16.8 -2,552 15.5 3,420 15.8
2011 3,403 14.0 536 23.4 -2,868 12.4 3,939 15.2
2012 3,656 7.4 609 13.7 -3,047 6.3 4,265 8.3
2013 3,888 6.4 678 11.4 -3,210 5.4 4,566 7.1
2014 4,278 10.0 710 4.8 -3,567 11.1 4,988 9.2
2015 4,710 10.1 863 21.5 -3,847 7.8 5,574 11.7
2016 4,846 2.9 837 -3.0 -4,009 4.2 5,683 2.0
2017 4,994 3.1 845 0.9 -4,149 3.5 5,839 2.7
Total Goods: Top trading partners 2017 Source IMF
Imports Exports Total trade
Partner Value Mio € % World Partner Value Mio € % World Partner Value Mio € % World
World 4,994 100.0 World 845 100.0 World 5,839 100.0
1 Israel 2,901 58.1 1 Israel 684 80.9 1 Israel 3,584 61.4
2 EU 28 619 12.4 2 Jordan 62 7.3 2 EU 28 634 10.9
3 Turkey 372 7.4 3 United Arab Emi... 26 3.1 3 Turkey 377 6.4
4 China 307 6.2 4 EU 28 15 1.7 4 China 307 5.3
5 South Korea 189 3.8 5 Saudi Arabia 14 1.7 5 Jordan 200 3.4
6 Jordan 138 2.8 6 Kuwait 12 1.5 6 South Korea 190 3.3
7 Ukraine 80 1.6 7 Qatar 11 1.3 7 Saudi Arabia 86 1.5
8 Saudi Arabia 71 1.4 8 USA 8 0.9 8 Ukraine 80 1.4
9 Egypt 56 1.1 9 Turkey 5 0.5 9 United Arab Emi... 59 1.0
10 Switzerland 34 0.7 10 South Korea 1 0.1 10 Egypt 56 1.0
--- --- ---
2 EU 28 619 12.4 4 EU 28 15 1.7 2 EU 28 634 10.9
World trade: excluding intra-region trade
Top partners: excluding region member states
% Growth: relative variation between current and previous period
European Commission
Directorate-Generalfor Trade
16-04-2018 9 Units A4 / G2
European Union, Trade with World
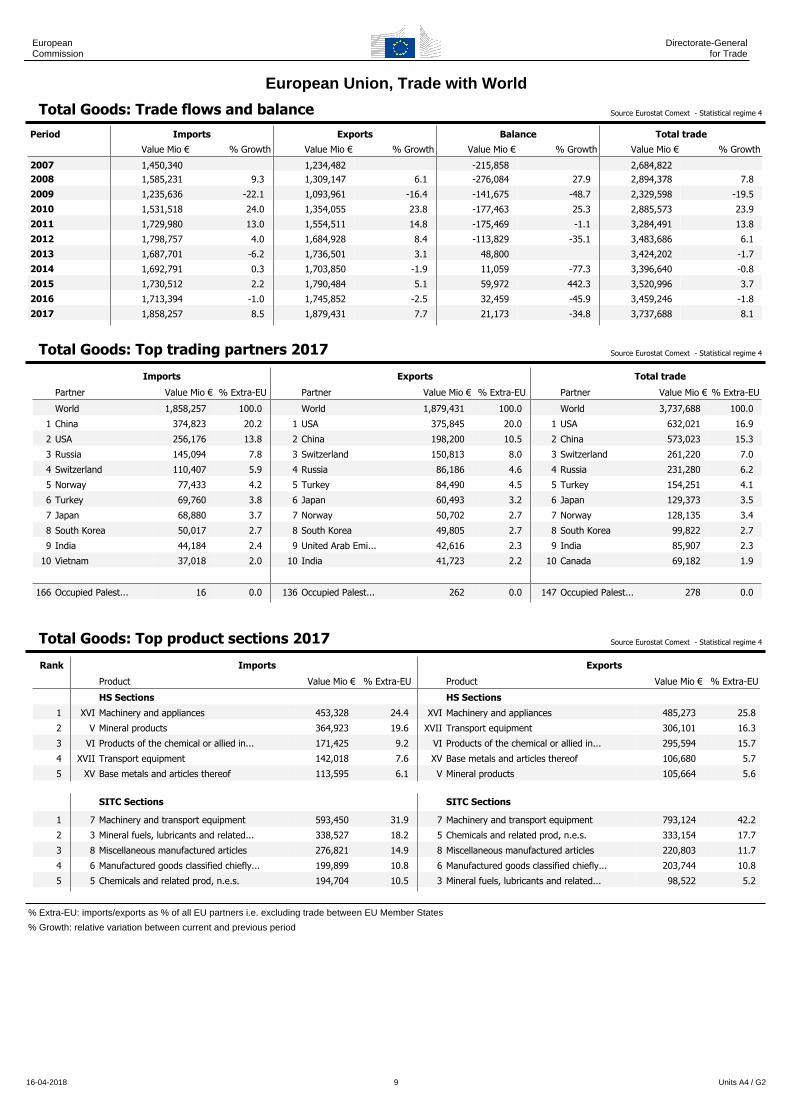
Total Goods: Trade flows and balance Source Eurostat Comext - Statistical regime 4
Period Imports Exports Balance Total trade
Value Mio € % Growth Value Mio € % Growth Value Mio € % Growth Value Mio € % Growth
2007 1,450,340 1,234,482 -215,858 2,684,822 2008 1,585,231 9.3 1,309,147 6.1 -276,084 27.9 2,894,378 7.8
2009 1,235,636 -22.1 1,093,961 -16.4 -141,675 -48.7 2,329,598 -19.5
2010 1,531,518 24.0 1,354,055 23.8 -177,463 25.3 2,885,573 23.9
2011 1,729,980 13.0 1,554,511 14.8 -175,469 -1.1 3,284,491 13.8
2012 1,798,757 4.0 1,684,928 8.4 -113,829 -35.1 3,483,686 6.1
2013 1,687,701 -6.2 1,736,501 3.1 48,800 3,424,202 -1.7
2014 1,692,791 0.3 1,703,850 -1.9 11,059 -77.3 3,396,640 -0.8
2015 1,730,512 2.2 1,790,484 5.1 59,972 442.3 3,520,996 3.7
2016 1,713,394 -1.0 1,745,852 -2.5 32,459 -45.9 3,459,246 -1.8
2017 1,858,257 8.5 1,879,431 7.7 21,173 -34.8 3,737,688 8.1
Total Goods: Top trading partners 2017 Source Eurostat Comext - Statistical regime 4
Imports Exports Total trade
Partner Value Mio € % Extra-EU Partner Value Mio € % Extra-EU Partner Value Mio € % Extra-EU
World 1,858,257 100.0 World 1,879,431 100.0 World 3,737,688 100.0
1 China 374,823 20.2 1 USA 375,845 20.0 1 USA 632,021 16.9
2 USA 256,176 13.8 2 China 198,200 10.5 2 China 573,023 15.3
3 Russia 145,094 7.8 3 Switzerland 150,813 8.0 3 Switzerland 261,220 7.0
4 Switzerland 110,407 5.9 4 Russia 86,186 4.6 4 Russia 231,280 6.2
5 Norway 77,433 4.2 5 Turkey 84,490 4.5 5 Turkey 154,251 4.1
6 Turkey 69,760 3.8 6 Japan 60,493 3.2 6 Japan 129,373 3.5
7 Japan 68,880 3.7 7 Norway 50,702 2.7 7 Norway 128,135 3.4
8 South Korea 50,017 2.7 8 South Korea 49,805 2.7 8 South Korea 99,822 2.7
9 India 44,184 2.4 9 United Arab Emi... 42,616 2.3 9 India 85,907 2.3
10 Vietnam 37,018 2.0 10 India 41,723 2.2 10 Canada 69,182 1.9
--- --- ---
166 Occupied Palest... 16 0.0 136 Occupied Palest... 262 0.0 147 Occupied Palest... 278 0.0
Total Goods: Top product sections 2017 Source Eurostat Comext - Statistical regime 4
Rank Imports Exports
Product Value Mio € % Extra-EU Product Value Mio € % Extra-EU
HS Sections HS Sections
1 XVI Machinery and appliances 453,328 24.4 XVI Machinery and appliances 485,273 25.8
2 V Mineral products 364,923 19.6 XVII Transport equipment 306,101 16.3
3 VI Products of the chemical or allied in... 171,425 9.2 VI Products of the chemical or allied in... 295,594 15.7
4 XVII Transport equipment 142,018 7.6 XV Base metals and articles thereof 106,680 5.7
5 XV Base metals and articles thereof 113,595 6.1 V Mineral products 105,664 5.6
SITC Sections SITC Sections
1 7 Machinery and transport equipment 593,450 31.9 7 Machinery and transport equipment 793,124 42.2
2 3 Mineral fuels, lubricants and related... 338,527 18.2 5 Chemicals and related prod, n.e.s. 333,154 17.7
3 8 Miscellaneous manufactured articles 276,821 14.9 8 Miscellaneous manufactured articles 220,803 11.7
4 6 Manufactured goods classified chiefly... 199,899 10.8 6 Manufactured goods classified chiefly... 203,744 10.8
5 5 Chemicals and related prod, n.e.s. 194,704 10.5 3 Mineral fuels, lubricants and related... 98,522 5.2
% Extra-EU: imports/exports as % of all EU partners i.e. excluding trade between EU Member States
% Growth: relative variation between current and previous period
European Commission
Directorate-Generalfor Trade
16-04-2018 10 Units A4 / G2
Methodological Notes
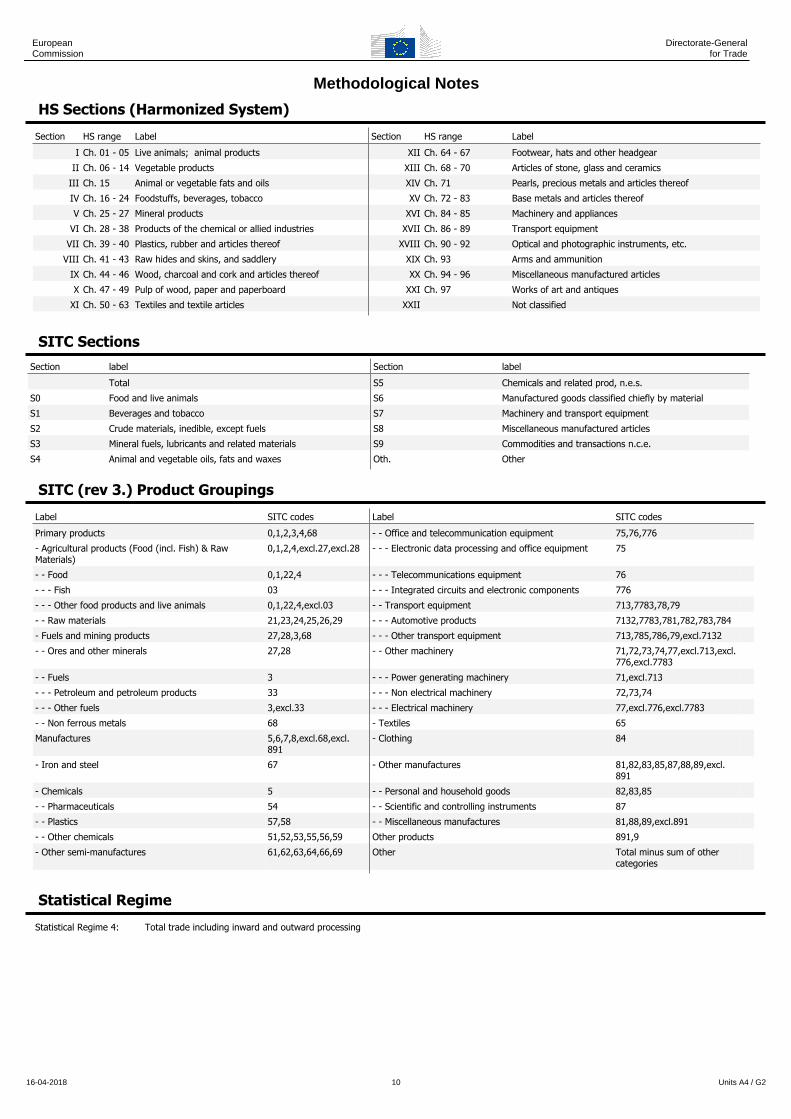
HS Sections (Harmonized System)
Section HS range Label Section HS range Label
I Ch. 01 - 05 Live animals; animal products XII Ch. 64 - 67 Footwear, hats and other headgear
II Ch. 06 - 14 Vegetable products XIII Ch. 68 - 70 Articles of stone, glass and ceramics
III Ch. 15 Animal or vegetable fats and oils XIV Ch. 71 Pearls, precious metals and articles thereof
IV Ch. 16 - 24 Foodstuffs, beverages, tobacco XV Ch. 72 - 83 Base metals and articles thereof
V Ch. 25 - 27 Mineral products XVI Ch. 84 - 85 Machinery and appliances
VI Ch. 28 - 38 Products of the chemical or allied industries XVII Ch. 86 - 89 Transport equipment
VII Ch. 39 - 40 Plastics, rubber and articles thereof XVIII Ch. 90 - 92 Optical and photographic instruments, etc.
VIII Ch. 41 - 43 Raw hides and skins, and saddlery XIX Ch. 93 Arms and ammunition
IX Ch. 44 - 46 Wood, charcoal and cork and articles thereof XX Ch. 94 - 96 Miscellaneous manufactured articles
X Ch. 47 - 49 Pulp of wood, paper and paperboard XXI Ch. 97 Works of art and antiques
XI Ch. 50 - 63 Textiles and textile articles XXII Not classified
SITC SectionsSection label Section label
Total S5 Chemicals and related prod, n.e.s.
S0 Food and live animals S6 Manufactured goods classified chiefly by material
S1 Beverages and tobacco S7 Machinery and transport equipment
S2 Crude materials, inedible, except fuels S8 Miscellaneous manufactured articles
S3 Mineral fuels, lubricants and related materials S9 Commodities and transactions n.c.e.
S4 Animal and vegetable oils, fats and waxes Oth. Other
SITC (rev 3.) Product Groupings
Label SITC codes Label SITC codes
Primary products 0,1,2,3,4,68 - - Office and telecommunication equipment 75,76,776
- Agricultural products (Food (incl. Fish) & Raw Materials)
0,1,2,4,excl.27,excl.28 - - - Electronic data processing and office equipment 75
- - Food 0,1,22,4 - - - Telecommunications equipment 76
- - - Fish 03 - - - Integrated circuits and electronic components 776
- - - Other food products and live animals 0,1,22,4,excl.03 - - Transport equipment 713,7783,78,79
- - Raw materials 21,23,24,25,26,29 - - - Automotive products 7132,7783,781,782,783,784
- Fuels and mining products 27,28,3,68 - - - Other transport equipment 713,785,786,79,excl.7132
- - Ores and other minerals 27,28 - - Other machinery 71,72,73,74,77,excl.713,excl.776,excl.7783
- - Fuels 3 - - - Power generating machinery 71,excl.713
- - - Petroleum and petroleum products 33 - - - Non electrical machinery 72,73,74
- - - Other fuels 3,excl.33 - - - Electrical machinery 77,excl.776,excl.7783
- - Non ferrous metals 68 - Textiles 65
Manufactures 5,6,7,8,excl.68,excl.891
- Clothing 84
- Iron and steel 67 - Other manufactures 81,82,83,85,87,88,89,excl.891
- Chemicals 5 - - Personal and household goods 82,83,85
- - Pharmaceuticals 54 - - Scientific and controlling instruments 87
- - Plastics 57,58 - - Miscellaneous manufactures 81,88,89,excl.891
- - Other chemicals 51,52,53,55,56,59 Other products 891,9
- Other semi-manufactures 61,62,63,64,66,69 Other Total minus sum of other categories
Statistical Regime
Statistical Regime 4: Total trade including inward and outward processing