european union international trade in servicesaei.pitt.edu/67469/1/2003-2007.pdf · 6 european...
TRANSCRIPT

Data 2003-2007
2009 edition
European Union international trade in servicesAnalytical aspects
S t a t i s t i c a l b o o k s
ISSN 1725-4477

2009 edition
S t a t i s t i c a l b o o k s
Data 2003-2007
European Union international trade in servicesAnalytical aspects

Europe Direct is a service to help you find answers to your questions about the European Union
Freephone number (*):
00 800 6 7 8 9 10 11(*) Certain mobile telephone operators do not allow access to 00 800 numbers or these calls may be billed.
More information on the European Union is available on the Internet (http://europa.eu).
Luxembourg: Office for Official Publications of the European Communities, 2009
ISBN 978-92-79-11305-5ISSN 1725-4477doi 10.2785/29093Cat. No. KS-EB-09-001-EN-N Theme: Economy and financeCollection: Statistical books
© European Communities, 2009
How to obtain EU publicationsOur priced publications are available from EU Bookshop (http://bookshop.europa.eu), where you can place an order with the sales agent of your choice.
The Publications Office has a worldwide network of sales agents. You can obtain their contact details by sending a fax to (352) 29 29-42758.

5 European Union international trade in services
Table of contents
Preface . . . . . . . . . . . . . . . . . . . . . . . . . . . . . . . . . . . . . . . . . . . . . . . . . . . . . . . . . . . . . . . . . . . . . . . . . . . . . . . . . . . . . . . . . . . . . . . . . . . . . . . . . . . . . . . . . . . . . 7
I Analytical aspects . . . . . . . . . . . . . . . . . . . . . . . . . . . . . . . . . . . . . . . . . . . . . . . . . . . . . . . . . . . . . . . . . . . . . . . . . . . . . . . . . . . . . . . . . . 9 EU International Trade in Services in 2007 . . . . . . . . . . . . . . . . . . . . . . . . . . . . . . . . . . . . . . . . . . . . . . . . . . . . . . . . . . . . . . . . . 11
II Description of the tables . . . . . . . . . . . . . . . . . . . . . . . . . . . . . . . . . . . . . . . . . . . . . . . . . . . . . . . . . . . . . . . . . . . . . . . . . . . . 21
III Statistical tables . . . . . . . . . . . . . . . . . . . . . . . . . . . . . . . . . . . . . . . . . . . . . . . . . . . . . . . . . . . . . . . . . . . . . . . . . . . . . . . . . . . . . . . . . . . . 29
Table 3.1: EU-27 trade in services, item breakdown with main partners . . . . . . . . . . . . . . . . . . . . . . . . . . . 31
Table 3.2: Geographical breakdown of trade in services for the EU, Norway, the USA and Japan . . . . . . . . . . . . . . . . . . . . . . . . . . . . . . . . . . . . . . . . . . . . . . . . . . . . . . . . . . . . . . . . . . . . . . . . . . . . . . . . . . . . . . . . . . . . . . . . . 35
Table 3.3: Trade of EU Member States, Switzerland, Norway, Croatia, Turkey, the USA and Japan with main partners . . . . . . . . . . . . . . . . . . . . . . . . . . . . . . . . . . . . . . . . . . . . . . . . . . . . . . . . . . . . . . . . . . . . . . . . . . . . . . . . . . . . . . . . 53
Table 3.4: EU trade in services for the years 2003 to 2007 broken down by items . . . . . . . . . . . . . . . . 87
Table 3.5: EU trade in services: complete geographical breakdown . . . . . . . . . . . . . . . . . . . . . . . . . . . . . . . . . 119
IV Methodological framework . . . . . . . . . . . . . . . . . . . . . . . . . . . . . . . . . . . . . . . . . . . . . . . . . . . . . . . . . . . . . . . . . . . . . 125
V Annexes . . . . . . . . . . . . . . . . . . . . . . . . . . . . . . . . . . . . . . . . . . . . . . . . . . . . . . . . . . . . . . . . . . . . . . . . . . . . . . . . . . . . . . . . . . . . . . . . . . . . . . . . . 133
Exchange rates . . . . . . . . . . . . . . . . . . . . . . . . . . . . . . . . . . . . . . . . . . . . . . . . . . . . . . . . . . . . . . . . . . . . . . . . . . . . . . . . . . . . . . . . . . . . . . . . . . . . . 135
BOP geographical zones . . . . . . . . . . . . . . . . . . . . . . . . . . . . . . . . . . . . . . . . . . . . . . . . . . . . . . . . . . . . . . . . . . . . . . . . . . . . . . . . . . . . . . . . . 136
BOP economic zones . . . . . . . . . . . . . . . . . . . . . . . . . . . . . . . . . . . . . . . . . . . . . . . . . . . . . . . . . . . . . . . . . . . . . . . . . . . . . . . . . . . . . . . . . . . . . 139

6 European Union international trade in services
Symbols and abbreviations usedMio Million
Bn ‘000 million
0 nul or data between -0.5 Mio EUR and 0.5 Mio EUR
: figure not available
.. not applicable
EUR euro
c.i.f cost, insurance and freight
f.o.b free on board
n.i.e. not included elsewhere
ACP African, Caribbean and Pacific countries signatories of the Lomé convention
ASEAN Association of South-East Asian Nations
BOP Balance of Payments
BPM5 Fifth edition of the International Monetary Fund Balance of Payments Manual
ECB European Central Bank
EFTA European Free Trade Association
EMU Economic and Monetary Union
EU European Union
EU-25 Total of the 25 Member States of the European Union (from 1st May 2004): Belgium, Czech Republic, Denmark, Germany, Estonia, Greece, Spain, France, Ireland, Italy, Cyprus, Latvia, Luxembourg, Hungary, Malta, Netherlands, Austria, Poland, Portugal, Slovenia, Slovakia, Finland, Sweden, United Kingdom)
EU-27 Total of the 27 Member States of the European Union (from 1st January 2007) (EU-25, Bulgaria, Romania)
Euro-area Member States of the Economic and Monetary Union: Belgium, Germany, Greece, Spain, France, Ireland, Italy, Luxembourg, the Netherlands, Austria, Portugal, Finland, Slovenia (from 1st January 2007).
Eurostat Statistical Office of the European Communities
GATS General Agreement on Trade in Services
IMF International Monetary Fund
OECD Organisation for Economic Co-operation and Development
OPEC Organisation of Petroleum Exporting Countries

7 European Union international trade in services
PrefaceThis publication is about annual international transactions in services between 2003 and 2007 and provides you with the most recent and comparable statistics of the EU, Norway, Croatia, the USA and Japan. Emphasis is put on trade in services and on the diversity of trading partners. Therefore, these statistics can be used to monitor the external commercial performance of different economies and thus assist trade negotiations in the context of the General Agreement on Trade in Services (GATS).
The publication is divided into two parts. The first part is analytical and gives the most recent portrait of European Union international transactions. It highlights the main trends of EU trade in services in 2007 and underlines the results of the EU with its main partner zones.
The second part presents statistics on international trade in services of the EU with its main partners (World, Extra-EU-27/EU-25, Canada, USA, Japan, Brazil, Russia, China, India and Hong Kong) for the main services categories as well as detailed items breakdown including 54 items of internationally tradable services. Statistics are also available for 2007 in relation to 55 countries and partner zones and 16 service items of the EU-27, Norway, Croatia, the United States and Japan. A complete geographical breakdown is also available for total services.
To allow comparisons, these figures have been harmonised according to a common methodology. All flows are expressed in Euro. Information is also given on the methodological framework of the 5th IMF manual which is used for current international transactions.
Your needs as a user are our main concern. We can only improve with your help, so feel free to make your comments and suggestions.
Mr Mushtaq HussainEurostat, Balance of Payments Unit
European CommissionBECH E4/818
L-2721 LuxembourgTel: +352 4301 35811, Fax: +352 4301 33859
E-mail: [email protected]
Data extracted: 2 February 2009


Analytical aspectsI


Analytical aspects I
11 European Union international trade in services
EU External Surplus in International Trade in Services in 2007 grew by 22.8%The European Union continued to be the biggest global player in international trade in services (ITS). In 2007, the EU s international trade in services recorded a surplus of €84.1 billion, compared to €68.5bn in 2006 and €54.1bn in 2005. The USA remained the EU’s main trading partner. Of all the EU Member States, the UK was the biggest contributor to extra-EU transactions.
Trade in services grows faster than trade in goods
Services play a major role in all modern economies. An efficient services sector is critical to trade and economic growth and to vibrant and resilient economies. Trade in services also plays an important role in creating wealth and jobs for all economies around the world, and is a catalyst for development. Services are the backbone of economies and trade around the world and provide vital support to the economy and industry as a whole, for example through finance, logistics and communications.
Increased trade in and availability of services will boost economic growth, business growth and de-velopment by improving the performance of other industries, since services provide key intermediate inputs, especially in an increasingly interlinked globalised world.
In 2007, their share of EU gross value added and employment were 70.7% and 69.6% respectively. Serv-ices have become increasingly important for the EU economy over recent decades.
Since the 1990s, the volume of exports of EU goods and services increased in a broadly similar pattern, both by about 6.5% per year on average. Consequently services maintained their share of roughly 22% of overall international trade during this period. Chart 1 shows that exports of services in 2007 grew faster than goods exports (7.4% against 4.3%), after lagging slightly behind in previ-ous years. This was mainly due to the expanding international supply of many services and to the increase in transportation prices.
Chart 1: EU GDP and exports of goods and services, 1997-2007 (At 2000 prices and exchange rates, annual percentage change)
Source: Eurostat
According to figures published by the International Monetary Fund1, total international trade in serv-ices (exports plus imports) in 2007 amounted to €4818.7 billion (of which intra-EU trade accounted for €1302.2 billion) — an increase of 9.5% in value since 2006.
1 IMF, Balance of Payments Statistics.
0
4
6
2
8
Ann
ual p
erce
ntag
e ch
ange
10
12
14
GDP
Services
Goods
1997 1998 1999 2000 2001 2002 2003 2004 2005 2006 2007
I
12 European Union international trade in services
Analytical aspects
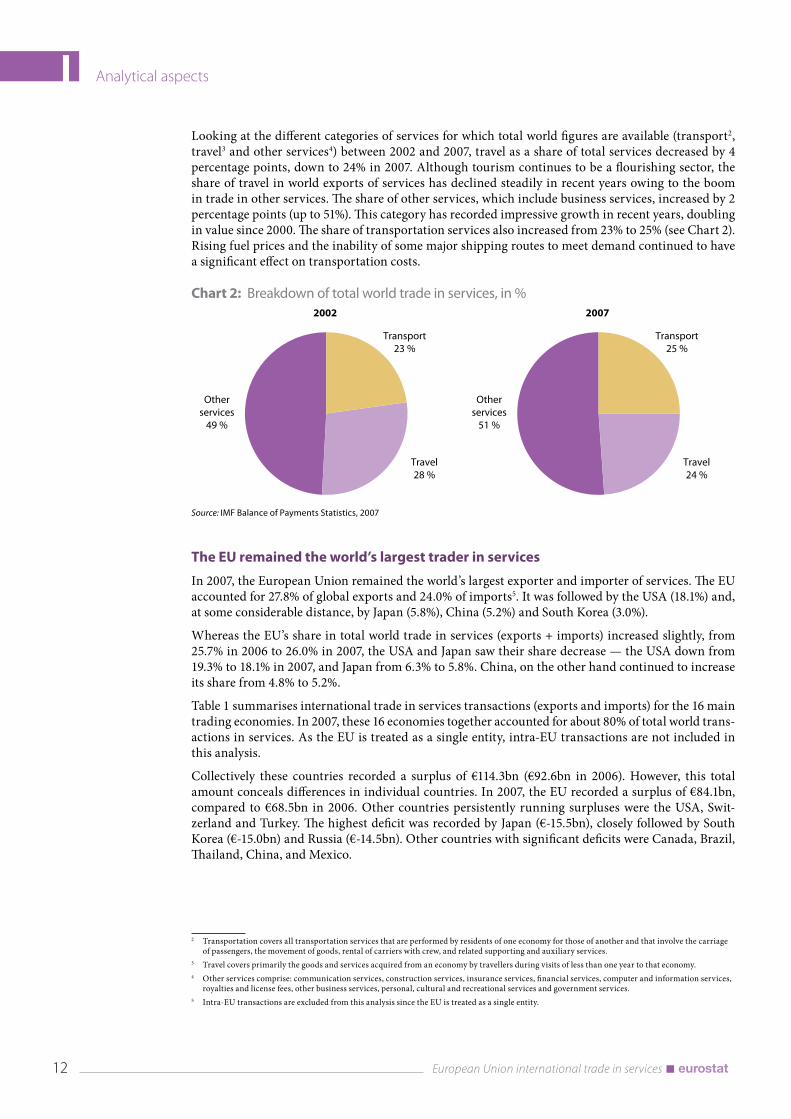
Looking at the different categories of services for which total world figures are available (transport2, travel3 and other services4) between 2002 and 2007, travel as a share of total services decreased by 4 percentage points, down to 24% in 2007. Although tourism continues to be a flourishing sector, the share of travel in world exports of services has declined steadily in recent years owing to the boom in trade in other services. The share of other services, which include business services, increased by 2 percentage points (up to 51%). This category has recorded impressive growth in recent years, doubling in value since 2000. The share of transportation services also increased from 23% to 25% (see Chart 2). Rising fuel prices and the inability of some major shipping routes to meet demand continued to have a significant effect on transportation costs.
Chart 2: Breakdown of total world trade in services, in %
Source: IMF Balance of Payments Statistics, 2007
The EU remained the world’s largest trader in services
In 2007, the European Union remained the world’s largest exporter and importer of services. The EU accounted for 27.8% of global exports and 24.0% of imports5. It was followed by the USA (18.1%) and, at some considerable distance, by Japan (5.8%), China (5.2%) and South Korea (3.0%).
Whereas the EU’s share in total world trade in services (exports + imports) increased slightly, from 25.7% in 2006 to 26.0% in 2007, the USA and Japan saw their share decrease — the USA down from 19.3% to 18.1% in 2007, and Japan from 6.3% to 5.8%. China, on the other hand continued to increase its share from 4.8% to 5.2%.
Table 1 summarises international trade in services transactions (exports and imports) for the 16 main trading economies. In 2007, these 16 economies together accounted for about 80% of total world trans-actions in services. As the EU is treated as a single entity, intra-EU transactions are not included in this analysis.
Collectively these countries recorded a surplus of €114.3bn (€92.6bn in 2006). However, this total amount conceals differences in individual countries. In 2007, the EU recorded a surplus of €84.1bn, compared to €68.5bn in 2006. Other countries persistently running surpluses were the USA, Swit-zerland and Turkey. The highest deficit was recorded by Japan (€-15.5bn), closely followed by South Korea (€-15.0bn) and Russia (€-14.5bn). Other countries with significant deficits were Canada, Brazil, Thailand, China, and Mexico.
2 Transportation covers all transportation services that are performed by residents of one economy for those of another and that involve the carriage of passengers, the movement of goods, rental of carriers with crew, and related supporting and auxiliary services.
3 Travel covers primarily the goods and services acquired from an economy by travellers during visits of less than one year to that economy.4 Other services comprise: communication services, construction services, insurance services, financial services, computer and information services,
royalties and license fees, other business services, personal, cultural and recreational services and government services.5 Intra-EU transactions are excluded from this analysis since the EU is treated as a single entity.
Otherservices
49 %
Transport23 %
Travel28 %
2002
Otherservices
51 %
Transport25 %
Travel24 %
2007

Analytical aspects I
13 European Union international trade in services
Table 1: Trade in services for main trading countries (in billion Euro)
2006 2007 Share of world (%) Rankexport import balance export import balance 2006 2007 2006 2007
EU-27 447.1 378.6 68.5 498.5 414.4 84.1 25.7 26.0 1 1United States of America 342.6 277.9 64.7 359.8 275.9 83.9 19.3 18.1 2 2Japan 93.4 108.0 -14.5 94.2 109.7 -15.5 6.3 5.8 3 3China 73.3 80.3 -7.0 89.2 94.9 -5.8 4.8 5.2 4 4South Korea 39.7 54.8 -15.1 46.0 61.0 -15.0 2.9 3.0 7 5Canada 47.3 57.9 -10.6 46.1 59.3 -13.2 3.3 3.0 5 6Singapore 47.1 49.3 -2.3 50.9 52.8 -1.9 3.0 2.9 6 7Russia 24.8 35.7 -10.9 28.7 43.2 -14.5 1.9 2.0 9 8Switzerland 41.4 22.9 18.5 45.9 24.8 21.0 2.0 2.0 8 9Norway 26.5 25.5 1.1 29.6 29.0 0.6 1.6 1.7 11 10Australia 26.4 25.7 0.7 29.5 28.4 1.1 1.6 1.6 10 11Thailand 19.8 26.3 -6.5 21.2 27.9 -6.8 1.4 1.4 12 12Brazil 15.5 23.2 -7.7 17.4 27.2 -9.7 1.2 1.3 13 13Malaysia 17.4 18.9 -1.5 20.6 20.4 0.2 1.1 1.2 14 14Turkey 20.2 9.1 11.0 21.0 10.9 10.1 0.9 0.9 16 15Mexico 13.1 18.2 -5.1 12.9 17.4 -4.4 1.0 0.9 15 16
Source: Eurostat; IMF
NB: ordered according to ranking in 2007
Surplus in transportation and other services, deficit in travel
In 2007, EU’s external trade in services recorded a surplus of €84.1 billion, up from €68.5 bn in 2006 and €54.1 bn in 2005.
The increased surplus in 2007 was mainly due to an increased surplus in financial services (+30.8 bn in 2007 compared with +24.2 bn in 2006), transportation services (+15.5 bn compared with +11.1 bn), computer and information services (+14.5 bn compared with +12.0), insurance services (+6.9 bn compared with +4.0 bn) and construction services (+8.1 bn compared with +6.6 bn), an improved bal-ance in personal, cultural and recreational services, where the deficit of 2.6 bn recorded in 2006 was reduced to 1.2 bn in 2007, partially offset by the improved deficit in travel (-8.6 bn compared with -15.4 bn) and in royalties and licence fees (-8.3 bn compared with -7.0 bn).
The significant surplus in “other business services”, which comprise merchanting and other trade-related services, operational leasing services and miscellaneous business, professional and technical services, remained stable (+35.5 bn compared with 35.2 bn).
On the credit side, insurance services experienced the biggest increase in relative terms (+28.3%) fol-lowed by financial services, communication services, construction services and computer and infor-mation services (+22.9%, +17.3%, +16.2% and +15.3% respectively). On the import side, double digit rates of expansion were seen in financial services, other business services, royalties and license fees and construction services.

I
14 European Union international trade in services
Analytical aspects
Table 2: EU international trade in services with the rest of the world (in bn Euro)
2005 2006 2007export import balance export import balance export import balance
Total Services 403.4 349.3 54.1 447.1 378.6 68.5 498.5 414.4 84.1 Transportation 103.2 87.9 15.3 109.3 98.2 11.1 119.2 103.7 15.5 Travel 65.7 84.8 -19.1 72.3 87.7 -15.4 75.6 94.2 -18.6 Other services 234.4 176.5 57.9 265.5 192.7 72.8 301.4 214.4 87.1 Communications services 7.3 7.9 -0.6 8.5 9.6 -1.1 10.0 10.4 -0.4 Construction services 12.2 6.1 6.0 13.7 7.1 6.6 15.9 7.8 8.1 Insurance services 6.1 8.3 -2.1 11.6 7.6 4.0 14.9 8.0 6.9 Financial services 35.0 14.2 20.9 41.9 17.7 24.2 51.5 20.8 30.8 Computer and information services 17.3 8.8 8.5 22.2 10.2 12.0 25.6 11.1 14.5 Royalties and license fees 23.5 32.1 -8.6 23.7 30.7 -7.0 26.1 34.4 -8.3 Other business services 120.4 86.7 33.7 130.9 95.7 35.2 144.3 108.9 35.5 Personal, cultural and recreational services 4.9 6.3 -1.4 4.7 7.2 -2.6 4.8 6.0 -1.2 Government services, n.i.e. 7.6 6.1 1.5 8.3 6.8 1.5 8.3 7.1 1.2 Services not allocated 0.1 0.1 0.0 0.0 0.0 0.0 2.3 2.2 0.1
0.0
5.0
10.0
15.0
20.0
25.0
30.0
Tran
spor
tatio
n
Trav
el
Com
mun
icat
ions
serv
ices
Con
stru
ctio
nse
rvic
es
Insu
ranc
ese
rvic
es
Fina
ncia
lse
rvic
es
Com
put
er a
ndin
form
atio
n se
rvic
es
Roya
lties
and
licen
se fe
es
Oth
er b
usin
ess
serv
ices
Pers
onal
, cul
tura
lan
d re
crea
tiona
lse
rvic
es
Gov
ernm
ent
serv
ices
, n.i.
e.
2006 2007
Chart 3 shows that, in terms of total transactions (exports plus imports), the share of financial services in total EU international trade in services increased, while the share of transportation and travel de-creased. The share of other service categories remained more or less stable.
Chart 3: Shares in EU ITS transactions with the rest of the world (in %)
Source: Eurostat

Analytical aspects I
15 European Union international trade in services
Trade between Member States exceeds Extra-EU trade
In 2007, nearly 59% of EU trade in services was between EU Member States (intra-EU transactions). Intra-EU exports (i.e. exports from Member States to Member States) amounted to €679.6bn — an increase of 9.5% in value terms since 2006. The value of total intra-EU imports in 2007 was €622.6bn.
Extra-EU exports (i.e. exports from Member States to third countries) increased by 11.5% over the same period, reaching €498.5bn. Extra-EU imports (imports into the EU from third countries) grew by 9.5% and were worth €414.4bn.
Chart 4: Intra-EU and Extra-EU exports of services, bn Euro
Source: Eurostat
The EU recorded surpluses with most of its partners
An analysis of the breakdown and underlying trend of EU transactions with the rest of the world (extra-EU transactions) shows that the USA continued to be the EU’s biggest trading partner. In 2007, 27.9% of total exports from the EU went to the USA and 30.8% of total imports came from the USA. The trade surplus with Russia almost doubled from €3.7bn in 2006 to €7.2bn in 2007, because exports to Russia increased at a faster rate than imports from Russia. The same was true of trade with China, resulting also in a considerable increase in the trade surplus. On the other hand, exports to Nigeria decreased by 21.1%, and imports increased by 9.5%. Consequently the trade surplus in 2007 was over 30% lower than in 2006.
Double digit growth in both exports and imports was recorded for trade with Switzerland, Norway, Canada, Hong Kong and Chile. The EU has considerable surpluses with most of its trading partners, but the largest deficits were recorded with Morocco, Croatia, Thailand, Egypt and Turkey, mainly due to deficits recorded under travel.
0.0
200.0
100.0
300.0
400.0
500.0
600.0
700.0
800.0
2005 2006 2007
€ b
illio
n

I
16 European Union international trade in services
Analytical aspects
Table 3: EU-27 trade with its main partners, total services (in € m)
Source: Eurostat
2006 2007Rank* Trading partner Export Import Balance Export Import Balance
1 Switzerland 53 252 38 146 15 107 61 503 43 987 17 5162 United States of America 133 753 122 029 11 724 139 135 127 717 11 4173 Russia 14 699 10 986 3 713 19 238 12 030 7 2084 Norway 16 275 10 677 5 599 19 008 11 912 7 0965 Japan 18 607 13 193 5 413 19 378 13 805 5 5736 Australia 9 180 6 028 3 151 10 747 6 284 4 4637 Singapore 10 426 6 034 4 392 11 397 7 133 4 2648 China 13 346 11 890 1 456 17 766 13 769 3 9969 South Korea 6 759 3 973 2 786 7 212 3 961 3 251
10 India 7 259 5 769 1 490 9 555 7 020 2 53511 Nigeria 4 912 1 560 3 352 3 874 1 708 2 16612 Canada 10 397 8 467 1 930 11 695 9 648 2 04713 Brazil 5 259 4 650 609 6 417 4 791 1 62614 Venezuela 1 541 762 779 2 102 719 1 38315 Chile 2 331 1 169 1 162 2 712 1 373 1 33916 South Africa 5 558 4 386 1 173 5 704 4 380 1 32417 Mexico 4 190 2 622 1 568 4 535 3 303 1 23218 Taiwan 3 390 2 021 1 369 3 722 2 550 1 17219 Indonesia 1 543 1 196 348 1 811 1 146 66620 Israel 3 241 2 430 812 3 518 2 853 66521 New Zealand 1 865 1 248 617 1 920 1 293 62722 Malaysia 2 117 1 896 221 2 342 1 865 47723 Argentina 1 813 1 710 103 2 038 1 751 28724 Uruguay 320 235 85 478 308 17125 Hong Kong 7 008 6 617 391 8 234 8 135 9926 Iceland 986 656 330 778 703 7527 Liechtenstein 426 512 -86 606 588 1828 Philippines 943 1 110 -167 1 016 1 079 -6329 Morocco 1 819 3 613 -1 794 2 104 4 407 -2 30330 Croatia 2 253 4 799 -2 546 2 333 4 931 -2 59831 Thailand 2 029 4 623 -2 594 2 151 4 926 -2 77632 Egypt 2 405 5 093 -2 688 2 610 5 700 -3 09133 Turkey 5 945 10 805 -4 860 6 617 11 900 -5 282
* ordered according to EU27 net in 2007

Analytical aspects I
17 European Union international trade in services
UK remains the EU champion in trade in services
The United Kingdom continued to be the largest exporter of services in 2007. Almost one quarter of all EU exports to the rest of the world came from the UK, followed by Germany and France.
Germany was the biggest importer, accounting for around 19% of total EU imports. It was followed by the UK and France. The United Kingdom also recorded the largest surplus in 2007 (€ +51.9bn), followed by Sweden and Greece. The highest deficit in 2007 was recorded by Ireland, followed by Ger-many and Italy.
Chart 5: Member States’ (MS) share in total extra-EU ITS transactions (in %), net (€ bn)
Left-hand scale shows MS share as a percentage; Right-hand scale shows balance in bn euro
Source: Eurostat
Pattern of specialisation in trade in services
The indices presented in Table 4 can be used to perform a detailed analysis of the trade specialisation of individual Member States. They compare a country’s share of individual service categories out of its total exports with the share of that category in total EU exports. The index is defined as the share of a service category in total exports of a country divided by the corresponding share of the EU total. So if the index exceeds 1, a country exports relatively more of that service category compared to the EU; therefore considered to be specialised in exporting that service category. If the index is less than 1, the country’s export share is less than that of the EU as a whole.
25
20
15
5
10
0
40
50
60
30
20
10
-10
-20
0
UK DE FR NL IT IE ES DK SE BE ATGR LU FI HU CZPL PT RO CY LTBG SI SK LV EE MT
MS
shar
e in
%
Net
in b
illio
n Eu
roNetMS share (%)

I
18 European Union international trade in services
Analytical aspects
Table 4: Member States’ trade specialisation pattern
Source: Eurostat
Trans-port Travel Commu-
nicationConstruc-
tionInsur-ance Financial Compu-
ter Royalties Other business Personal Govern-
mentBE 1.5 0.6 1.9 0.6 0.5 0.5 0.7 0.6 1.1 0.5 1.9BG 1.4 2.2 1.0 0.9 0.3 0.1 0.3 0.0 0.4 1.2 0.0CZ 1.4 1.7 1.3 0.8 0.0 0.2 0.8 0.1 0.7 1.1 0.1DK 3.0 0.4 0.6 0.2 0.2 0.0 0.4 0.9 0.5 0.9 0.8DE 1.1 0.7 0.8 2.4 1.1 0.5 1.0 0.9 1.2 0.5 2.0EE 1.9 1.0 1.1 1.9 0.1 0.3 0.6 0.1 0.8 0.2 0.9IE 0.2 0.3 0.3 0.0 5.3 1.1 5.9 0.4 1.1 0.3 0.6EL 2.5 1.6 0.4 0.4 0.4 0.0 0.1 0.0 0.2 0.5 0.2ES 0.8 2.0 0.5 1.4 0.5 0.5 0.7 0.1 0.8 1.3 0.5FR 1.1 1.6 1.1 1.5 0.3 0.1 0.2 1.6 0.8 1.3 0.5IT 0.7 1.7 1.1 1.2 0.5 0.3 0.1 0.2 1.2 0.9 0.9CY 1.1 1.3 0.5 1.0 0.5 0.8 0.6 0.1 0.8 0.9 3.9LV 2.4 0.8 0.9 0.6 0.2 0.7 0.5 0.1 0.6 0.3 0.7LT 2.7 1.3 1.0 0.7 0.1 0.1 0.1 0.0 0.2 0.4 0.8LU 0.2 0.3 1.2 0.3 1.4 6.7 0.4 0.2 0.4 0.9 0.4HU 0.9 1.2 1.1 1.0 0.1 0.2 0.8 1.5 1.1 7.9 0.5MT 0.6 1.2 0.8 0.1 0.5 0.7 0.3 1.3 0.9 19.1 0.7NL 1.1 0.5 1.4 0.9 0.2 0.2 1.0 3.3 1.3 0.6 1.5AT 1.0 1.5 1.2 1.0 0.9 0.3 0.6 0.4 1.0 0.4 0.7PL 1.5 1.6 0.7 2.3 0.0 0.1 0.4 0.1 0.7 0.7 0.2PT 1.2 1.9 1.4 1.5 0.2 0.1 0.2 0.1 0.7 1.1 0.7RO 1.1 0.6 4.1 1.1 0.1 1.6 1.0 0.1 0.9 1.0 0.3SI 1.4 1.9 0.9 1.5 0.1 0.1 0.5 0.1 0.7 0.6 0.1SK 1.5 1.3 1.4 0.7 0.1 0.4 0.5 0.6 0.6 4.5 0.4FI 0.7 0.5 0.7 0.7 0.2 0.2 1.4 1.5 2.0 0.1 0.4SE 0.8 0.8 1.1 0.7 0.6 0.3 1.8 2.0 1.3 0.5 0.6UK 0.5 0.6 1.1 0.3 1.6 2.5 0.9 1.4 1.1 1.4 1.0
Of all EU countries, Denmark is one of the main exporters of transportation services. Table 4 shows that share of transportation services out of Denmark’s total exports of services is three times more than the corresponding share for the EU as a whole. Other countries with relatively high share in this category are Lithuania, Greece and Latvia. At the other end of the scale, transportation services repre-sent the lowest relative share of total exports from Ireland and the United Kingdom.
Receipts from travel play a relatively much more important role in Bulgaria and Spain than in the EU as a whole. The shares of travel in Portuguese and Slovenian exports of services are about double the EU total. On the other hand, Ireland and Luxembourg earn relatively little from travel, compared with other Member States.
The share of communication services in Romanian total exports of services is about four times higher than the share for the EU as a whole. While most countries have a share close to the EU average, it is lowest in Ireland and Greece, followed by Spain and Cyprus.
Germany is the leading exporter of construction services, accounting for one third of all EU exports. The share of this service category in total German exports is 2.4 times higher than in the EU. The same is true for Poland. On the contrary, this figure is very low in Ireland, Malta and Denmark.
Irish exports of services feature a very high share of insurance services, 5.3 times higher than for total EU exports. In a number of countries this service category plays only a marginal role. Its share in Czech, Lithuanian, Romanian, Slovenian and Slovak exports is negligible when compared with the EU average.

Analytical aspects I
19 European Union international trade in services
The UK and Luxembourg are by far the largest exporters of financial services. The shares of financial services in the total export of services of Luxembourg and the UK are respectively 6.7 and 2.5 times higher than the share for the EU. For Danish, Greek, Bulgarian, Polish, Portuguese and Slovenian exports this share is the lowest by comparison with the EU average.
Ireland, the leading exporter of computer services, is also the sole champion in terms of relative shares of exports. The only other countries with a share above the EU share are Finland and Sweden.
In the service category royalties and license fees, the Netherlands and Sweden earn relatively more than the EU average. Bulgaria, Greece and Lithuania have the lowest share of exports of this service category.
The UK and Germany are the main exporters of other business services, which make up the biggest service category of EU exports. The shares of both countries are higher than that of EU as a whole. However, this category is much more significant in Finnish exports than in the EU as a whole. The op-posite applies to Greece and Lithuania.
Personal, cultural and recreational services are one of the two smallest service categories, accounting for about 1% of total EU exports. Its share in Maltese exports is by far the highest when compared with the EU average. Hungary and Slovakia also have high shares of this category, and Finland and Estonia have the lowest.
Government services are the other smallest category. In Cyprus its share is 3.9 times higher than the share in EU total exports. Other countries with above-average shares are Belgium and Germany. On the other hand this share is the smallest in Bulgaria, Czech Republic and Slovenia.
Looking at the individual Member States, it is possible to identify the following specialisation pattern in their structure of exports in services in relation to the pattern of the EU as a whole (the service categories whose share in the total exports of the individual Member States are the highest when com-pared to the corresponding shares for the EU as a whole):
Country Area of specialisation relative to EU average Country Area of specialisation relative to EU averageBE Communication services and government services LU Financial ServicesBG Travel HU Personal, cultural and recreational servicesCZ Travel MT Personal, cultural and recreational servicesDK Transportation NL Royalties and license feesDE Construction services and government services AT TravelEE Transportation and construction services PL Construction servicesIE Insurance and computer services PT TravelEL Transportation RO Communication servicesES Travel SI TravelFR Travel, Construction and royalties and license fees SK Personal, cultural and recreational servicesIT Travel FI Other business servicesCY Government services SE Royalties and license fees and computer servicesLV Transportation UK Financial servicesLT Transportation


Description of the tablesII


Description of the tables II
23 European Union international trade in services
Which table contains the information that you want?
DATA ON EU INTERNATIONAL TRADE IN SERVICES WITH ITS MAIN PARTNERS
Table 3.1, one can obtain information
– on credit (exports), debit (imports) and net flows, expressed in million of Euro;
– for the year 2007;
– of the EU-27;
– in relation to World (including intra zone flows), rest of the world (Extra-EU-27), the USA, Canada, Japan, Brazil, Russia, India, China and Hong Kong;
– for 54 different services items.
For example:
Table 3.1: total credit (export) of services, in 2007, from the EU-27 to the rest of the world (Extra-EU27) amounted to € 498 523 million.

II
24 European Union international trade in services
Description of the tables
A MORE PRECISE GEOGRAPHICAL DETAIL OF THE MAIN INTERNATIONAL TRANSACTIONS IN SERVICES
There are 16 tables, each referring to one service item
Tables 3.2.1 to 3.2.16 report information
– on credit, debit and net flows, expressed in million of EURO;
– for the year 2007;
– of 16 items of services (total services, transportation, travel, communication services, construc-tion…);
– of the EU-27, Croatia, Norway, the USA and Japan (in columns);
– in relation to 55 partner countries and zones (in rows).
For example:
Table 3.2.1: in 2007, EU-27 credit of services to Hong Kong were worth € 8 234 million. On the other hand, Japan imported (debit) from the USA services worth € 31 431 million.
Table 3.2.6. in 2007, EU-27 trade in Travel with Australia showed an export of € 2 890 million and import of € 2 628 million.

Description of the tables II
25 European Union international trade in services
DATA ON INTERNATIONAL TRADE IN SERVICES OF THE EU MEMBER STATES AND OTHER REPORTERS WITH MAIN PARTNERS
Each table of this set refers to one service item.
Tables 3.3.1 to 3.3.16 report information
– on credit, debit and net flows, expressed in million of EURO;
– for the year 2007;
– of 16 items of services (total services, transportation, travel, communication services, construction…);
– of the EU-27, all EU Member states, Switzerland, Norway, Croatia, Turkey, the USA and Japan (in rows);
– in relation to 10 partner countries (in columns).
For example:
Table 3.3.8.: in 2007, for Communication services, Belgium registered surpluses with all presented partners: World (€ 539 million), Switzerland (€ 26 million), Russia (€ 6 million), Canada (€ 13 million), USA (€ 83 million), Brazil (€ 6 million), China (€ 5 million), Hong Kong (€ 11 mil-lion), India (€ 4 million) and Japan (€ 18) million.
Table 3.3.13.: In 2007, most of the reporters registered deficits for Royalties and licence fees with the USA except France (€ 1 573 million), Slovakia (€ 2 million), Sweden (€ 320 million) and Norway (€ 143 million).

II
26 European Union international trade in services
Description of the tables
EU TRADE IN SERVICES FOR THE PERIOD 2003-2007
Each table of this set reports data of the European Union trade with one partner.
From tables 3.4.1 to 3.4.10, one can find information
– on credit, debit and net flows, expressed in million of EURO;
– of the EU-25 for the period 2003-2007;
– of the EU-27 for the period 2004-2007;
– in relation to partners World, Extra-EU-25, Extra-EU-27, Canada, the USA, Japan, Brazil, Russia, India, China and Hong Kong;
– for 54 services items.
For example:
Table 3.4.3.: Construction services imports from Canada to the EU have more than quadrupled between 2004 (€ 85 million) and 2007 (€ 364 million).
Table 3.4.5.: EU-27 trade in miscellaneous business, professional and technical services with Ja-pan turned from a surplus in 2004 (€ 1 701 million) to a deficit in 2007 (€ -628 million).

Description of the tables II
27 European Union international trade in services
EU TRADE IN SERVICES: COMPLETE GEOGRAPHICAL BREAKDOWN
This table refers to total services only.
In Table 3.5 one can find information
– on credit, debit and net flows, expressed in million of EURO;
– of the EU-27 for the period 2004-2007;
– in relation to 225 partner countries;
For example:
Table 3.5: EU-27 exports of services to South American countries continued to increase between 2004 and 2007: from € 9 494 million in 2004 to € 16 895 million in 2007.


Statistical tablesIII


EU-27 trade in services, item breakdown with main partners
III
32 European Union international trade in services
Statistical tablesTable 3.1
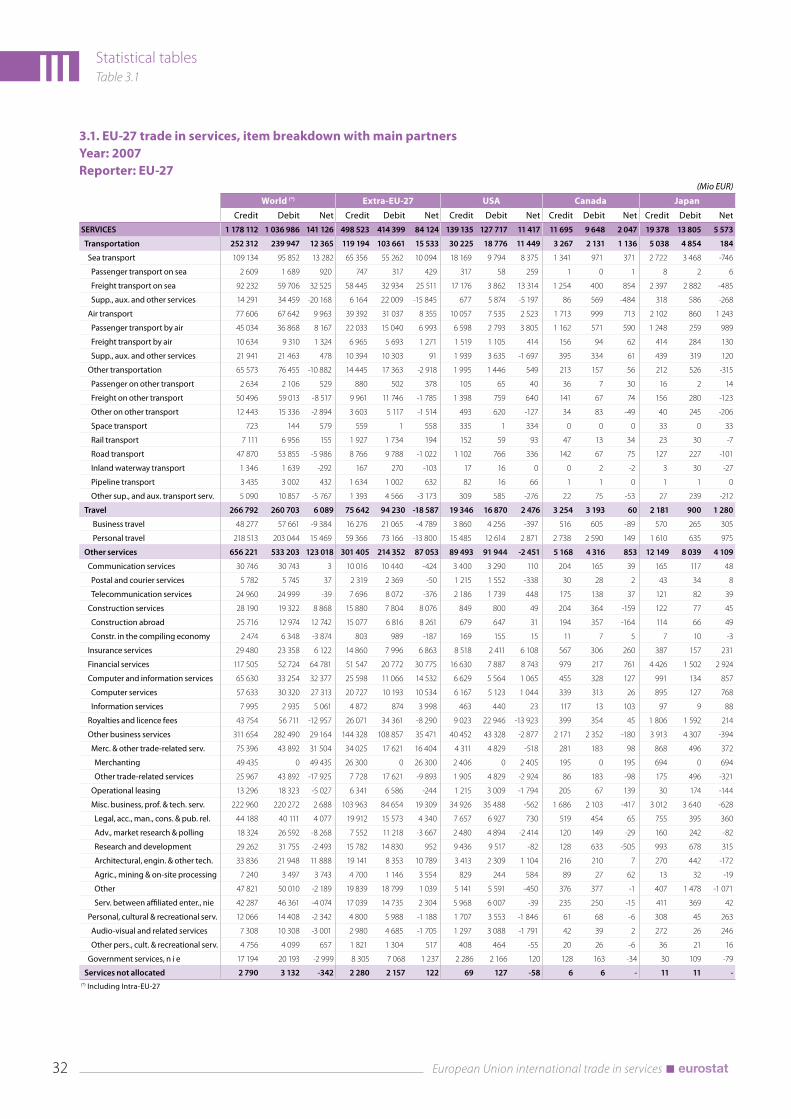
3.1. EU-27 trade in services, item breakdown with main partnersYear: 2007Reporter: EU-27
(Mio EUR)
World (*) Extra-EU-27 USA Canada Japan
Credit Debit Net Credit Debit Net Credit Debit Net Credit Debit Net Credit Debit Net
SERVICES 1 178 112 1 036 986 141 126 498 523 414 399 84 124 139 135 127 717 11 417 11 695 9 648 2 047 19 378 13 805 5 573
Transportation 252 312 239 947 12 365 119 194 103 661 15 533 30 225 18 776 11 449 3 267 2 131 1 136 5 038 4 854 184
Sea transport 109 134 95 852 13 282 65 356 55 262 10 094 18 169 9 794 8 375 1 341 971 371 2 722 3 468 -746
Passenger transport on sea 2 609 1 689 920 747 317 429 317 58 259 1 0 1 8 2 6
Freight transport on sea 92 232 59 706 32 525 58 445 32 934 25 511 17 176 3 862 13 314 1 254 400 854 2 397 2 882 -485
Supp., aux. and other services 14 291 34 459 -20 168 6 164 22 009 -15 845 677 5 874 -5 197 86 569 -484 318 586 -268
Air transport 77 606 67 642 9 963 39 392 31 037 8 355 10 057 7 535 2 523 1 713 999 713 2 102 860 1 243
Passenger transport by air 45 034 36 868 8 167 22 033 15 040 6 993 6 598 2 793 3 805 1 162 571 590 1 248 259 989
Freight transport by air 10 634 9 310 1 324 6 965 5 693 1 271 1 519 1 105 414 156 94 62 414 284 130
Supp., aux. and other services 21 941 21 463 478 10 394 10 303 91 1 939 3 635 -1 697 395 334 61 439 319 120
Other transportation 65 573 76 455 -10 882 14 445 17 363 -2 918 1 995 1 446 549 213 157 56 212 526 -315
Passenger on other transport 2 634 2 106 529 880 502 378 105 65 40 36 7 30 16 2 14
Freight on other transport 50 496 59 013 -8 517 9 961 11 746 -1 785 1 398 759 640 141 67 74 156 280 -123
Other on other transport 12 443 15 336 -2 894 3 603 5 117 -1 514 493 620 -127 34 83 -49 40 245 -206
Space transport 723 144 579 559 1 558 335 1 334 0 0 0 33 0 33
Rail transport 7 111 6 956 155 1 927 1 734 194 152 59 93 47 13 34 23 30 -7
Road transport 47 870 53 855 -5 986 8 766 9 788 -1 022 1 102 766 336 142 67 75 127 227 -101
Inland waterway transport 1 346 1 639 -292 167 270 -103 17 16 0 0 2 -2 3 30 -27
Pipeline transport 3 435 3 002 432 1 634 1 002 632 82 16 66 1 1 0 1 1 0
Other sup., and aux. transport serv. 5 090 10 857 -5 767 1 393 4 566 -3 173 309 585 -276 22 75 -53 27 239 -212
Travel 266 792 260 703 6 089 75 642 94 230 -18 587 19 346 16 870 2 476 3 254 3 193 60 2 181 900 1 280
Business travel 48 277 57 661 -9 384 16 276 21 065 -4 789 3 860 4 256 -397 516 605 -89 570 265 305
Personal travel 218 513 203 044 15 469 59 366 73 166 -13 800 15 485 12 614 2 871 2 738 2 590 149 1 610 635 975
Other services 656 221 533 203 123 018 301 405 214 352 87 053 89 493 91 944 -2 451 5 168 4 316 853 12 149 8 039 4 109
Communication services 30 746 30 743 3 10 016 10 440 -424 3 400 3 290 110 204 165 39 165 117 48
Postal and courier services 5 782 5 745 37 2 319 2 369 -50 1 215 1 552 -338 30 28 2 43 34 8
Telecommunication services 24 960 24 999 -39 7 696 8 072 -376 2 186 1 739 448 175 138 37 121 82 39
Construction services 28 190 19 322 8 868 15 880 7 804 8 076 849 800 49 204 364 -159 122 77 45
Construction abroad 25 716 12 974 12 742 15 077 6 816 8 261 679 647 31 194 357 -164 114 66 49
Constr. in the compiling economy 2 474 6 348 -3 874 803 989 -187 169 155 15 11 7 5 7 10 -3
Insurance services 29 480 23 358 6 122 14 860 7 996 6 863 8 518 2 411 6 108 567 306 260 387 157 231
Financial services 117 505 52 724 64 781 51 547 20 772 30 775 16 630 7 887 8 743 979 217 761 4 426 1 502 2 924
Computer and information services 65 630 33 254 32 377 25 598 11 066 14 532 6 629 5 564 1 065 455 328 127 991 134 857
Computer services 57 633 30 320 27 313 20 727 10 193 10 534 6 167 5 123 1 044 339 313 26 895 127 768
Information services 7 995 2 935 5 061 4 872 874 3 998 463 440 23 117 13 103 97 9 88
Royalties and licence fees 43 754 56 711 -12 957 26 071 34 361 -8 290 9 023 22 946 -13 923 399 354 45 1 806 1 592 214
Other business services 311 654 282 490 29 164 144 328 108 857 35 471 40 452 43 328 -2 877 2 171 2 352 -180 3 913 4 307 -394
Merc. & other trade-related serv. 75 396 43 892 31 504 34 025 17 621 16 404 4 311 4 829 -518 281 183 98 868 496 372
Merchanting 49 435 0 49 435 26 300 0 26 300 2 406 0 2 405 195 0 195 694 0 694
Other trade-related services 25 967 43 892 -17 925 7 728 17 621 -9 893 1 905 4 829 -2 924 86 183 -98 175 496 -321
Operational leasing 13 296 18 323 -5 027 6 341 6 586 -244 1 215 3 009 -1 794 205 67 139 30 174 -144
Misc. business, prof. & tech. serv. 222 960 220 272 2 688 103 963 84 654 19 309 34 926 35 488 -562 1 686 2 103 -417 3 012 3 640 -628
Legal, acc., man., cons. & pub. rel. 44 188 40 111 4 077 19 912 15 573 4 340 7 657 6 927 730 519 454 65 755 395 360
Adv., market research & polling 18 324 26 592 -8 268 7 552 11 218 -3 667 2 480 4 894 -2 414 120 149 -29 160 242 -82
Research and development 29 262 31 755 -2 493 15 782 14 830 952 9 436 9 517 -82 128 633 -505 993 678 315
Architectural, engin. & other tech. 33 836 21 948 11 888 19 141 8 353 10 789 3 413 2 309 1 104 216 210 7 270 442 -172
Agric., mining & on-site processing 7 240 3 497 3 743 4 700 1 146 3 554 829 244 584 89 27 62 13 32 -19
Other 47 821 50 010 -2 189 19 839 18 799 1 039 5 141 5 591 -450 376 377 -1 407 1 478 -1 071
Serv. between affiliated enter., nie 42 287 46 361 -4 074 17 039 14 735 2 304 5 968 6 007 -39 235 250 -15 411 369 42
Personal, cultural & recreational serv. 12 066 14 408 -2 342 4 800 5 988 -1 188 1 707 3 553 -1 846 61 68 -6 308 45 263
Audio-visual and related services 7 308 10 308 -3 001 2 980 4 685 -1 705 1 297 3 088 -1 791 42 39 2 272 26 246
Other pers., cult. & recreational serv. 4 756 4 099 657 1 821 1 304 517 408 464 -55 20 26 -6 36 21 16
Government services, n i e 17 194 20 193 -2 999 8 305 7 068 1 237 2 286 2 166 120 128 163 -34 30 109 -79
Services not allocated 2 790 3 132 -342 2 280 2 157 122 69 127 -58 6 6 - 11 11 -(*) Including Intra-EU-27

Statistical tablesTable 3.1 III
33 European Union international trade in services
3.1. EU-27 trade in services, item breakdown with main partnersYear: 2007Reporter: EU-27
(Mio EUR)
Brazil Russian Federation India China Hong Kong
Credit Debit Net Credit Debit Net Credit Debit Net Credit Debit Net Credit Debit Net
6 417 4 791 1 626 19 238 12 030 7 208 9 555 7 020 2 535 17 766 13 769 3 996 8 234 8 135 99 SERVICES
2 320 1 577 743 3 998 5 624 -1 626 2 743 1 544 1 198 5 513 6 567 -1 054 3 707 3 573 134 Transportation
1 160 799 361 713 3 175 -2 462 1 202 754 449 3 809 4 013 -204 2 333 2 242 91 Sea transport
0 0 0 2 2 0 0 0 0 0 0 0 8 2 6 Passenger transport on sea
1 122 456 665 548 2 793 -2 246 1 156 350 807 3 596 2 964 632 1 893 1 680 213 Freight transport on sea
38 342 -304 163 379 -216 46 404 -358 213 1 049 -837 432 562 -130 Supp., aux. and other services
1 046 503 543 814 655 159 1 365 683 682 1 427 1 624 -197 1 285 904 381 Air transport
861 178 683 488 191 298 714 388 326 507 520 -13 258 344 -86 Passenger transport by air
106 65 41 43 120 -77 286 121 164 711 900 -188 830 408 422 Freight transport by air
79 258 -179 283 343 -60 364 175 189 207 206 1 196 153 43 Supp., aux. and other services
116 275 -160 2 473 1 792 681 175 107 68 281 930 -649 89 425 -336 Other transportation
5 0 4 45 36 9 6 0 6 10 2 8 9 0 8 Passenger on other transport
81 259 -177 1 692 1 467 225 114 69 45 218 639 -421 51 115 -64 Freight on other transport
28 17 12 733 289 444 58 41 17 53 289 -235 30 310 -281 Other on other transport
0 0 0 0 0 0 47 0 47 0 0 0 0 0 0 Space transport
2 4 -2 204 376 -172 9 3 6 14 49 -35 14 10 4 Rail transport
93 257 -164 1 094 852 242 82 67 15 220 585 -365 51 94 -43 Road transport
2 1 0 7 11 -3 2 1 1 4 10 -6 0 12 -12 Inland waterway transport
1 1 0 1 051 326 726 1 1 0 2 1 1 0 1 -1 Pipeline transport
17 13 4 117 229 -113 37 37 0 42 286 -244 25 308 -283 Other sup., and aux. transport serv.
1 403 1 408 -5 3 975 1 762 2 213 924 2 026 -1 102 1 882 2 913 -1 031 502 459 43 Travel
285 313 -28 874 537 338 335 410 -75 533 902 -369 126 132 -6 Business travel
1 119 1 095 24 3 100 1 225 1 876 590 1 614 -1 024 1 347 2 012 -665 376 327 49 Personal travel
2 694 1 804 890 11 260 4 636 6 624 5 884 3 448 2 435 10 369 4 265 6 104 4 026 4 100 -74 Other services
123 77 45 296 245 51 152 215 -63 233 187 46 150 169 -20 Communication services
9 6 3 14 15 0 30 11 19 147 48 98 34 53 -20 Postal and courier services
113 71 42 281 231 50 122 205 -83 86 139 -53 116 116 0 Telecommunication services
407 112 295 899 503 396 353 149 204 543 400 142 31 87 -55 Construction services
389 105 283 870 476 394 343 135 208 539 319 220 25 56 -31 Construction abroad
19 7 12 29 27 2 11 14 -4 4 82 -78 7 31 -24 Constr. in the compiling economy
95 48 48 136 179 -43 56 47 10 109 281 -172 95 79 15 Insurance services
206 129 77 1 616 266 1 350 349 97 252 453 181 273 1 254 1 196 57 Financial services
242 61 181 1 274 113 1 160 544 1 064 -520 541 171 370 166 40 126 Computer and information services
232 59 172 1 247 98 1 150 512 1 039 -528 536 168 367 148 37 111 Computer services
9 2 8 28 16 12 32 25 8 6 1 4 17 2 15 Information services
414 21 393 502 84 417 355 46 310 1 179 120 1 059 165 119 46 Royalties and licence fees
1 086 1 211 -125 6 221 3 058 3 163 3 778 1 731 2 046 7 127 2 796 4 331 2 109 2 332 -222 Other business services
-207 243 -449 3 353 442 2 911 2 607 273 2 333 4 183 518 3 665 666 754 -87 Merc. & other trade-related serv.
-261 0 -261 3 237 0 3 237 2 552 0 2 552 4 062 0 4 061 518 0 518 Merchanting
56 243 -187 116 442 -327 54 273 -220 121 518 -396 147 754 -606 Other trade-related services
112 7 105 208 142 65 194 12 182 657 58 599 12 51 -39 Operational leasing
1 182 962 220 2 658 2 471 187 978 1 447 -470 2 285 2 218 67 1 429 1 527 -98 Misc. business, prof. & tech. serv.
100 105 -6 482 307 175 158 288 -129 228 442 -214 253 371 -118 Legal, acc., man., cons. & pub. rel.
17 51 -33 78 719 -641 34 62 -27 109 223 -114 108 123 -14 Adv., market research & polling
76 91 -16 49 88 -39 47 432 -385 277 402 -125 374 114 260 Research and development
158 65 93 982 334 648 258 221 37 883 201 682 170 140 29 Architectural, engin. & other tech.
254 29 225 394 21 373 74 9 65 54 28 25 5 6 -2 Agric., mining & on-site processing
143 137 5 462 572 -110 271 222 48 374 505 -131 166 487 -321 Other
432 483 -51 212 426 -214 135 212 -77 361 415 -54 353 283 69 Serv. between affiliated enter., nie
82 61 20 101 64 37 97 17 81 24 26 -2 52 58 -7 Personal, cultural & recreational serv.
76 11 65 48 26 21 76 6 70 9 10 -1 32 46 -14 Audio-visual and related services
7 50 -43 53 38 16 21 11 10 15 17 -1 19 13 6 Other pers., cult. & recreational serv.
40 84 -44 217 123 94 199 83 117 160 104 56 6 20 -14 Government services, n i e
- 2 -2 5 9 -4 5 1 5 1 24 -23 -1 2 -3 Services not allocated


Geographical breakdown of trade in services for EU, Norway, the USA and Japan


Statistical tablesTable 3.2 III
37 European Union international trade in services
3.2.1 Geographical breakdown of trade in services for the EU, Croatia, Norway, the USA and JapanYear: 2007Item: Total services
(Mio EUR)
EU-27 Croatia Norway USA(1) Japan
Credit Debit Net Credit Debit Net Credit Debit Net Credit Debit Net Credit Debit Net
WORLD 1 178 112 1 036 986 141 126 9 151 2 857 6 294 29 540 28 910 630 359 837 275 895 83 942 94 212 109 717 -15 505
EXTRA-EU-27 498 523 414 399 84 124 1 776 1 014 762 11 926 7 459 4 468 226 679 169 514 57 165 : : :
EFTA 81 901 57 189 24 711 421 141 281 833 493 339 : : : : : :
Iceland 778 703 75 2 1 1 42 35 7 : : : : : :
Liechtenstein 606 588 18 3 27 -24 22 3 19 : : : : : :
Switzerland 61 503 43 987 17 516 325 102 223 768 455 313 10 365 6 414 3 950 1 264 2 123 -859
Norway 19 008 11 912 7 096 92 11 81 : : : : : : : : :
Other European countries 42 153 38 534 3 619 717 493 224 159 290 -131 : : : : : :
Croatia 2 333 4 931 -2 598 : : : : : : : : : : : :
Russia 19 238 12 030 7 208 104 50 53 12 38 -26 : : : 370 346 24
Turkey 6 617 11 900 -5 282 15 14 1 3 190 -187 : : : : : :
Africa 28 706 31 946 -3 240 33 23 10 139 198 -59 7 780 4 244 3 535 1 332 1 272 59
North African countries 8 833 15 785 -6 951 17 13 4 9 69 -59 : : : : : :
Egypt 2 610 5 700 -3 091 1 5 -4 : : : : : : : : :
Morocco 2 104 4 407 -2 303 0 1 0 : : : : : : : : :
Other African countries 19 869 16 160 3 709 16 10 5 131 127 3 : : : : : :
Nigeria 3 874 1 708 2 166 0 - 0 : : : : : : : : :
South Africa 5 704 4 380 1 324 1 1 0 : : : 1 554 1 081 474 282 241 41
America 186 872 168 150 18 722 329 248 81 9 130 4 998 4 132 : : : 27 025 32 646 -5 622
Canada 11 695 9 648 2 047 68 36 32 406 299 107 31 575 18 353 13 221 1 532 1 215 317
USA 139 135 127 717 11 417 240 180 60 8 224 4 409 3 815 : : : 25 493 31 431 -5 938
Central American countries 19 044 19 618 -574 14 26 -11 393 177 217 : : : : : :
Mexico 4 535 3 303 1 232 0 1 -1 : : : 17 368 11 525 5 843 563 301 262
South American countries 16 895 11 040 5 855 6 6 1 109 93 16 : : : : : :
Argentina 2 038 1 751 287 0 1 -1 : : : 2 023 924 1 099 : : :
Brazil 6 417 4 791 1 626 6 4 2 103 60 43 7 241 2 956 4 285 435 190 245
Chile 2 712 1 373 1 339 0 0 0 : : : : : : : : :
Uruguay 478 308 171 0 0 0 : : : : : : : : :
Venezuela 2 102 719 1 383 0 0 0 : : : 2 834 490 2 344 : : :
Asia 120 501 89 552 30 950 54 50 4 1 339 1 212 127 : : : 32 696 31 217 1 479
Near & Middle East countries 29 794 16 779 13 014 14 14 0 143 99 44 : : : : : :
Israel 3 518 2 853 665 5 5 0 : : : : : : : : :
Other Near & Middle East countries 2 262 2 309 -47 3 3 0 17 16 0 : : : : : :
Other Asian countries 90 702 72 770 17 932 41 36 5 1 197 1 101 96 : : : : : :
China 17 766 13 769 3 996 7 7 1 30 64 -34 : : : 5 956 5 945 11
Hong-Kong 8 234 8 135 99 4 7 -3 142 147 -5 4 239 5 065 -827 200 4 347 -4 148
Indonesia 1 811 1 146 666 1 1 0 : : : : : : 1 157 1 189 -32
India 9 555 7 020 2 535 4 5 -1 26 37 -11 6 936 7 051 -115 857 407 450
Japan 19 378 13 805 5 573 11 3 8 598 255 343 30 028 19 120 10 908 : : :
Malaysia 2 342 1 865 477 0 1 -1 : : : : : : 245 977 -732
Philippines 1 016 1 079 -63 0 0 0 : : : : : : 1 015 1 273 -259
Singapore 11 397 7 133 4 264 2 1 1 : : : 5 421 3 103 2 318 7 282 5 909 1 373
Thailand 2 151 4 926 -2 776 0 0 0 : : : : : : 3 081 2 040 1 041
Taiwan 3 722 2 550 1 172 0 2 -1 : : : 5 681 5 416 265 6 576 3 037 3 539
Oceania and Polar regions 13 219 8 265 4 954 7 14 -7 326 259 67 : : : 1 607 4 738 -3 131
Australia 10 747 6 284 4 463 5 2 3 294 230 64 8 081 4 510 3 571 1 215 2 748 -1 533
New Zealand 1 920 1 293 627 1 0 0 27 18 9 : : : 216 389 -173
OECD countries* 943 142 836 762 106 380 7 199 1 831 5 369 : : : : : : 60 550 68 620 -8 070
Central & Eastern Europe countries* 4 985 7 759 -2 775 : : : : : : : : : : : :
Euro-Mediterranean Partnership* 19 270 31 189 -11 919 29 34 -5 : : : : : : : : :
ACP countries* 22 458 20 835 1 623 23 28 -5 : : : : : : : : :
OPEC* 35 499 17 930 17 569 19 9 11 : : : 14 503 10 449 4 054 : : :
Maghreb countries* 5 153 9 211 -4 058 5 6 -1 : : : : : : : : :
Mashrek countries* 3 971 7 210 -3 239 4 8 -4 : : : : : : : : :
ASEAN* 20 006 17 452 2 554 3 3 0 : : : : : : 13 237 11 958 1 278
c: confidential data* see annexes for the composition of economic zones(1) USA data have been harmonized by Eurostat

III
38 European Union international trade in services
Statistical tablesTable 3.2
3.2.2 Geographical breakdown of trade in services for the EU, Croatia, Norway, the USA and JapanYear: 2007Item: Transportation
(Mio EUR)
EU-27 Croatia Norway USA(1) Japan
Credit Debit Net Credit Debit Net Credit Debit Net Credit Debit Net Credit Debit Net
WORLD 252 312 239 947 12 365 1 084 631 453 13 874 9 573 4 301 56 309 69 709 -13 399 30 661 35 780 -5 120
EXTRA-EU-27 119 194 103 661 15 533 287 202 85 6 633 3 434 3 199 38 272 43 337 -5 065 : : :
EFTA 14 524 11 794 2 730 71 29 42 499 138 362 : : : : : :
Iceland 150 175 -25 0 0 0 27 2 25 : : : : : :
Liechtenstein 164 99 65 1 16 -16 20 0 20 : : : : : :
Switzerland 10 192 7 405 2 788 56 12 44 453 136 317 730 959 -229 498 498 0
Norway 4 018 4 115 -98 14 1 13 : : : 617 997 -380 : : :
Other European countries 8 201 12 479 -4 278 95 91 4 35 64 -29 : : : : : :
Croatia 422 694 -272 : : : : : : : : : : : :
Russia 3 998 5 624 -1 626 4 1 4 9 25 -15 : : : 140 121 19
Turkey 1 816 3 423 -1 608 3 9 -6 2 22 -20 : : : : : :
Africa 8 049 9 660 -1 610 25 15 11 73 131 -59 1 059 538 521 643 844 -200
North African countries 2 270 4 694 -2 424 12 9 3 1 61 -61 : : : : : :
Egypt 645 1 434 -788 1 3 -3 : : : : : : : : :
Morocco 650 1 145 -496 0 0 0 : : : : : : : : :
Other African countries 5 778 4 967 810 14 6 8 73 70 3 : : : : : :
Nigeria 665 479 186 0 - 0 : : : : : : : : :
South Africa 1 738 1 167 571 0 0 0 : : : 163 182 -19 138 166 -28
America 42 843 28 740 14 104 70 50 20 4 889 2 025 2 864 : : : 6 217 4 281 1 936
Canada 3 267 2 131 1 136 10 22 -12 191 229 -38 4 919 3 878 1 040 359 262 97
USA 30 225 18 776 11 449 53 16 37 4 281 1 575 2 706 : : : 5 858 4 019 1 839
Central American countries 3 475 4 077 -603 6 11 -5 329 154 175 : : : : : :
Mexico 1 028 694 334 0 - 0 : : : 2 764 1 354 1 410 146 58 88
South American countries 5 834 3 745 2 088 0 1 -1 89 67 21 : : : : : :
Argentina 679 480 199 0 0 0 : : : 390 148 242 : : :
Brazil 2 320 1 577 743 0 0 0 85 49 36 1 250 567 683 141 27 114
Chile 1 109 764 344 0 0 0 : : : 280 242 39 : : :
Uruguay 222 102 120 - 0 0 : : : : : : : : :
Venezuela 505 322 183 0 - 0 : : : 531 136 395 : : :
Asia 32 558 33 565 -1 007 19 17 2 892 845 48 : : : 13 118 12 688 430
Near & Middle East countries 5 329 4 632 697 5 6 -1 90 43 47 : : : : : :
Israel 996 574 422 3 1 2 : : : 763 702 61 : : :
Other Near & Middle East countries 634 729 -94 1 2 -2 15 2 13 : : : : : :
Other Asian countries 27 228 28 932 -1 704 14 11 3 803 801 2 : : : : : :
China 5 513 6 567 -1 054 0 3 -2 5 39 -34 2 387 2 971 -584 2 862 2 280 582
Hong-Kong 3 707 3 573 134 2 5 -3 99 102 -3 1 127 2 493 -1 367 1 970 2 608 -638
Indonesia 447 410 37 1 0 1 : : : 177 28 149 316 79 237
India 2 743 1 544 1 198 2 0 2 18 26 -7 1 108 401 707 196 76 120
Japan 5 038 4 854 184 4 0 3 439 183 256 5 479 5 774 -295 : : :
Malaysia 515 762 -247 0 1 0 : : : 271 211 61 423 367 56
Philippines 239 362 -123 0 0 0 : : : 357 552 -195 289 472 -183
Singapore 3 190 3 096 94 1 0 1 : : : 620 1 213 -593 2 079 2 910 -831
Thailand 846 1 374 -529 0 0 0 : : : 255 238 17 867 417 449
Taiwan 1 000 1 213 -213 0 1 -1 : : : 2 037 4 015 -1 977 1 691 1 156 535
Oceania and Polar regions 3 756 1 743 2 014 5 2 3 245 231 14 : : : 655 1 112 -457
Australia 2 685 1 114 1 571 3 0 3 222 203 18 715 949 -233 496 750 -254
New Zealand 800 266 534 0 0 0 14 16 -2 201 561 -360 72 167 -95
OECD countries* 190 717 175 126 15 591 850 342 508 : : : : : : 16 605 17 021 -416
Central & Eastern Europe countries* 939 1 472 -533 : : : : : : : : : : : :
Euro-Mediterranean Partnership* 5 278 8 308 -3 029 8 21 -13 : : : : : : : : :
ACP countries* 6 090 6 013 78 18 14 4 : : : : : : : : :
OPEC* 6 547 6 413 134 12 3 9 : : : : : : : : :
Maghreb countries* 1 381 2 663 -1 282 0 5 -5 : : : : : : : : :
Mashrek countries* 1 105 1 758 -653 1 6 -4 : : : : : : : : :
ASEAN* 5 422 6 332 -910 2 1 1 : : : : : : 4 112 4 286 -174
c: confidential data* see annexes for the composition of economic zones(1) USA data have been harmonized by Eurostat

Statistical tablesTable 3.2 III
39 European Union international trade in services
3.2.3 Geographical breakdown of trade in services for the EU, Croatia, Norway, the USA and JapanYear: 2007Item: Sea transport
(Mio EUR)
EU-27 Croatia Norway USA(1) Japan
Credit Debit Net Credit Debit Net Credit Debit Net Credit Debit Net Credit Debit Net
WORLD 109 134 95 852 13 282 422 113 309 10 680 6 710 3 970 3 993 26 698 -22 705 23 292 25 297 -2 005
EXTRA-EU-27 65 356 55 262 10 094 123 38 85 5 803 3 068 2 735 : : : : : :
EFTA 6 312 6 133 180 36 4 32 453 104 349 : : : : : :
Iceland 50 38 12 - 0 0 23 2 21 : : : : : :
Liechtenstein 58 58 0 1 0 1 15 0 15 : : : : : :
Switzerland 4 654 3 283 1 370 31 4 27 415 102 312 : : : : : :
Norway 1 552 2 752 -1 201 5 0 4 : : : : : : : : :
Other European countries 2 214 5 813 -3 599 30 5 25 30 57 -27 : : : : : :
Croatia 108 321 -213 : : : : : : : : : : : :
Russia 713 3 175 -2 462 0 0 0 7 24 -18 : : : : : :
Turkey 846 1 626 -780 1 2 0 2 21 -18 : : : : : :
Africa 3 890 4 545 -655 23 8 15 56 129 -73 : : : : : :
North African countries 1 186 2 059 -873 11 3 8 1 60 -60 : : : : : :
Egypt 357 909 -553 1 3 -2 : : : : : : : : :
Morocco 319 236 83 0 0 0 : : : : : : : : :
Other African countries 2 706 2 485 221 12 5 7 56 69 -13 : : : : : :
Nigeria 238 292 -54 : : : : : : : : : : : :
South Africa 847 557 290 0 0 0 : : : : : : : : :
America 25 061 14 945 10 116 21 15 6 4 247 1 736 2 511 : : : : : :
Canada 1 341 971 371 0 0 0 123 181 -58 : : : : : :
USA 18 169 9 794 8 375 16 3 13 3 817 1 335 2 482 : : : : : :
Central American countries 2 365 2 246 119 4 11 -6 219 153 65 : : : : : :
Mexico 530 333 197 0 - 0 : : : : : : : : :
South American countries 3 149 1 928 1 221 0 0 0 89 67 22 : : : : : :
Argentina 283 201 82 - 0 0 : : : : : : : : :
Brazil 1 160 799 361 0 0 0 85 49 36 : : : : : :
Chile 917 494 423 : : : : : : : : : : : :
Uruguay 139 51 88 - 0 0 : : : : : : : : :
Venezuela 170 134 35 0 - 0 : : : : : : : : :
Asia 19 766 18 834 932 10 5 5 801 818 -17 : : : : : :
Near & Middle East countries 2 590 1 975 616 1 3 -1 77 43 34 : : : : : :
Israel 500 256 243 0 0 0 : : : : : : : : :
Other Near & Middle East countries 255 352 -97 0 2 -2 11 2 9 : : : : : :
Other Asian countries 17 175 16 858 317 8 3 6 725 774 -49 : : : : : :
China 3 809 4 013 -204 0 1 -1 5 39 -34 : : : : : :
Hong-Kong 2 333 2 242 91 2 1 1 89 98 -9 : : : : : :
Indonesia 242 297 -55 0 0 0 : : : : : : : : :
India 1 202 754 449 2 0 2 18 25 -7 : : : : : :
Japan 2 722 3 468 -746 3 0 3 390 180 209 : : : : : :
Malaysia 301 340 -39 0 0 0 : : : : : : : : :
Philippines 102 281 -180 0 0 0 : : : : : : : : :
Singapore 2 533 2 093 440 1 0 1 : : : : : : : : :
Thailand 386 352 35 0 0 0 : : : : : : : : :
Taiwan 790 842 -52 0 0 0 : : : : : : : : :
Oceania and Polar regions 2 661 1 023 1 639 1 1 0 216 224 -8 : : : : : :
Australia 1 828 711 1 117 1 0 1 196 201 -5 : : : : : :
New Zealand 607 162 445 0 0 0 14 11 2 : : : : : :
OECD countries* 76 798 63 257 13 541 310 58 252 : : : : : : : : :
Central & Eastern Europe countries* 238 506 -268 : : : : : : : : : : : :
Euro-Mediterranean Partnership* 2 530 3 761 -1 232 3 7 -4 : : : : : : : : :
ACP countries* 3 281 3 057 223 15 13 2 : : : : : : : : :
OPEC* 3 527 3 458 69 11 1 11 : : : : : : : : :
Maghreb countries* 691 859 -168 0 0 0 : : : : : : : : :
Mashrek countries* 507 1 060 -552 1 5 -4 : : : : : : : : :
ASEAN* 3 668 3 568 99 1 0 1 : : : : : : : : :
c: confidential data* see annexes for the composition of economic zones(1) USA data have been harmonized by Eurostat
III
40 European Union international trade in services
Statistical tablesTable 3.2
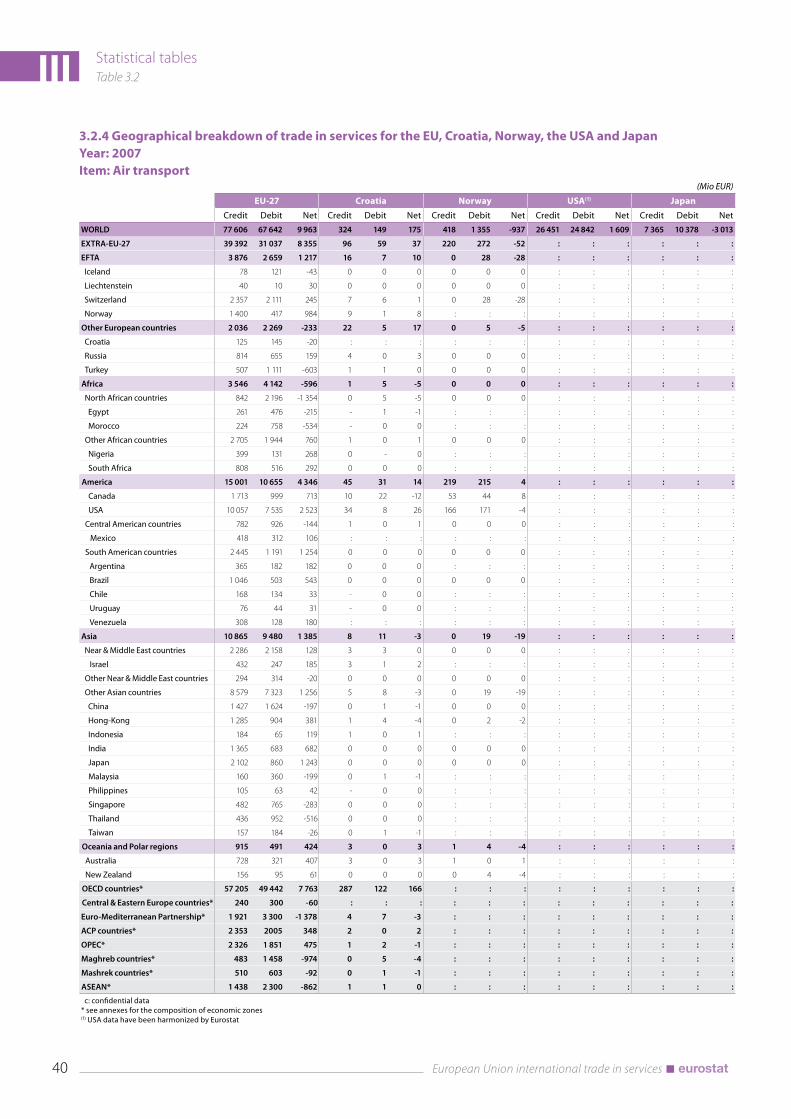
3.2.4 Geographical breakdown of trade in services for the EU, Croatia, Norway, the USA and JapanYear: 2007Item: Air transport
(Mio EUR)
EU-27 Croatia Norway USA(1) Japan
Credit Debit Net Credit Debit Net Credit Debit Net Credit Debit Net Credit Debit Net
WORLD 77 606 67 642 9 963 324 149 175 418 1 355 -937 26 451 24 842 1 609 7 365 10 378 -3 013
EXTRA-EU-27 39 392 31 037 8 355 96 59 37 220 272 -52 : : : : : :
EFTA 3 876 2 659 1 217 16 7 10 0 28 -28 : : : : : :
Iceland 78 121 -43 0 0 0 0 0 0 : : : : : :
Liechtenstein 40 10 30 0 0 0 0 0 0 : : : : : :
Switzerland 2 357 2 111 245 7 6 1 0 28 -28 : : : : : :
Norway 1 400 417 984 9 1 8 : : : : : : : : :
Other European countries 2 036 2 269 -233 22 5 17 0 5 -5 : : : : : :
Croatia 125 145 -20 : : : : : : : : : : : :
Russia 814 655 159 4 0 3 0 0 0 : : : : : :
Turkey 507 1 111 -603 1 1 0 0 0 0 : : : : : :
Africa 3 546 4 142 -596 1 5 -5 0 0 0 : : : : : :
North African countries 842 2 196 -1 354 0 5 -5 0 0 0 : : : : : :
Egypt 261 476 -215 - 1 -1 : : : : : : : : :
Morocco 224 758 -534 - 0 0 : : : : : : : : :
Other African countries 2 705 1 944 760 1 0 1 0 0 0 : : : : : :
Nigeria 399 131 268 0 - 0 : : : : : : : : :
South Africa 808 516 292 0 0 0 : : : : : : : : :
America 15 001 10 655 4 346 45 31 14 219 215 4 : : : : : :
Canada 1 713 999 713 10 22 -12 53 44 8 : : : : : :
USA 10 057 7 535 2 523 34 8 26 166 171 -4 : : : : : :
Central American countries 782 926 -144 1 0 1 0 0 0 : : : : : :
Mexico 418 312 106 : : : : : : : : : : : :
South American countries 2 445 1 191 1 254 0 0 0 0 0 0 : : : : : :
Argentina 365 182 182 0 0 0 : : : : : : : : :
Brazil 1 046 503 543 0 0 0 0 0 0 : : : : : :
Chile 168 134 33 - 0 0 : : : : : : : : :
Uruguay 76 44 31 - 0 0 : : : : : : : : :
Venezuela 308 128 180 : : : : : : : : : : : :
Asia 10 865 9 480 1 385 8 11 -3 0 19 -19 : : : : : :
Near & Middle East countries 2 286 2 158 128 3 3 0 0 0 0 : : : : : :
Israel 432 247 185 3 1 2 : : : : : : : : :
Other Near & Middle East countries 294 314 -20 0 0 0 0 0 0 : : : : : :
Other Asian countries 8 579 7 323 1 256 5 8 -3 0 19 -19 : : : : : :
China 1 427 1 624 -197 0 1 -1 0 0 0 : : : : : :
Hong-Kong 1 285 904 381 1 4 -4 0 2 -2 : : : : : :
Indonesia 184 65 119 1 0 1 : : : : : : : : :
India 1 365 683 682 0 0 0 0 0 0 : : : : : :
Japan 2 102 860 1 243 0 0 0 0 0 0 : : : : : :
Malaysia 160 360 -199 0 1 -1 : : : : : : : : :
Philippines 105 63 42 - 0 0 : : : : : : : : :
Singapore 482 765 -283 0 0 0 : : : : : : : : :
Thailand 436 952 -516 0 0 0 : : : : : : : : :
Taiwan 157 184 -26 0 1 -1 : : : : : : : : :
Oceania and Polar regions 915 491 424 3 0 3 1 4 -4 : : : : : :
Australia 728 321 407 3 0 3 1 0 1 : : : : : :
New Zealand 156 95 61 0 0 0 0 4 -4 : : : : : :
OECD countries* 57 205 49 442 7 763 287 122 166 : : : : : : : : :
Central & Eastern Europe countries* 240 300 -60 : : : : : : : : : : : :
Euro-Mediterranean Partnership* 1 921 3 300 -1 378 4 7 -3 : : : : : : : : :
ACP countries* 2 353 2005 348 2 0 2 : : : : : : : : :
OPEC* 2 326 1 851 475 1 2 -1 : : : : : : : : :
Maghreb countries* 483 1 458 -974 0 5 -4 : : : : : : : : :
Mashrek countries* 510 603 -92 0 1 -1 : : : : : : : : :
ASEAN* 1 438 2 300 -862 1 1 0 : : : : : : : : :
c: confidential data* see annexes for the composition of economic zones(1) USA data have been harmonized by Eurostat

Statistical tablesTable 3.2 III
41 European Union international trade in services
3.2.5 Geographical breakdown of trade in services for the EU, Croatia, Norway, the USA and JapanYear: 2007Item: Other transportation
(Mio EUR)
EU-27 Croatia Norway USA(1) Japan
Credit Debit Net Credit Debit Net Credit Debit Net Credit Debit Net Credit Debit Net
WORLD 65 573 76 455 -10 882 338 369 -31 2 776 1 508 1 269 25 865 18 169 7 696 4 105 -101
EXTRA-EU-27 14 445 17 363 -2 918 68 105 -37 610 93 517 : : : : : :
EFTA 4 341 3002 1 339 19 18 0 46 6 41 : : : : : :
Iceland 24 15 9 0 0 0 3 0 3 : : : : : :
Liechtenstein 65 30 35 0 16 -16 4 0 4 : : : : : :
Switzerland 3 184 2009 1 175 18 2 16 38 6 33 : : : : : :
Norway 1067 948 119 0 0 0 : : : : : : : : :
Other European countries 3 950 4 397 -448 43 81 -39 5 2 3 : : : : : :
Croatia 190 227 -38 : : : : : : : : : : : :
Russia 2 473 1 792 681 0 0 0 3 0 3 : : : : : :
Turkey 461 687 -226 0 7 -6 0 2 -2 : : : : : :
Africa 610 973 -364 1 1 0 17 1 15 : : : : : :
North African countries 243 437 -194 0 0 0 0 0 0 : : : : : :
Egypt 27 48 -21 0 0 0 : : : : : : : : :
Morocco 109 151 -42 - 0 0 : : : : : : : : :
Other African countries 368 537 -169 1 1 0 17 1 16 : : : : : :
Nigeria 28 57 -29 : : : : : : : : : : : :
South Africa 83 93 -9 0 0 0 : : : : : : : : :
America 2 782 3 136 -354 4 4 -1 423 74 349 : : : : : :
Canada 213 157 56 0 0 0 15 3 12 : : : : : :
USA 1 995 1 446 549 3 4 -1 297 69 228 : : : : : :
Central American countries 330 907 -577 1 0 0 111 1 110 : : : : : :
Mexico 80 48 32 : : : : : : : : : : : :
South American countries 239 627 -387 0 0 0 0 0 0 : : : : : :
Argentina 31 97 -66 : : : : : : : : : : : :
Brazil 116 275 -160 0 0 0 0 0 0 : : : : : :
Chile 23 135 -112 0 0 0 : : : : : : : : :
Uruguay 6 5 1 : : : : : : : : : : : :
Venezuela 30 61 -31 : : : : : : : : : : : :
Asia 1 927 5 252 -3 325 1 1 0 91 8 83 : : : : : :
Near & Middle East countries 454 499 -44 0 0 0 13 0 13 : : : : : :
Israel 64 69 -5 0 0 0 : : : : : : : : :
Other Near & Middle East countries 82 62 20 0 0 0 4 0 4 : : : : : :
Other Asian countries 1 473 4 754 -3 281 1 0 0 78 8 70 : : : : : :
China 281 930 -649 0 0 0 0 0 0 : : : : : :
Hong-Kong 89 425 -336 0 0 0 10 1 9 : : : : : :
Indonesia 22 47 -25 0 0 0 : : : : : : : : :
India 175 107 68 0 0 0 0 0 0 : : : : : :
Japan 212 526 -315 0 0 0 50 3 47 : : : : : :
Malaysia 54 59 -5 0 - 0 : : : : : : : : :
Philippines 32 16 15 : : : : : : : : : : : :
Singapore 175 239 -65 0 0 0 : : : : : : : : :
Thailand 24 71 -47 0 - 0 : : : : : : : : :
Taiwan 52 183 -132 0 0 0 : : : : : : : : :
Oceania and Polar regions 180 227 -47 0 0 0 27 2 25 : : : : : :
Australia 130 82 48 0 0 0 25 2 23 : : : : : :
New Zealand 34 8 26 0 0 0 0 0 0 : : : : : :
OECD countries* 56 716 62 430 -5 714 252 163 90 : : : : : : : : :
Central & Eastern Europe countries* 463 668 -204 : : : : : : : : : : : :
Euro-Mediterranean Partnership* 827 1 246 -418 1 7 -6 : : : : : : : : :
ACP countries* 456 949 -492 2 0 1 : : : : : : : : :
OPEC* 692 1 102 -410 0 0 0 : : : : : : : : :
Maghreb countries* 205 348 -143 - 0 0 : : : : : : : : :
Mashrek countries* 89 96 -7 0 0 0 : : : : : : : : :
ASEAN* 316 462 -146 0 0 0 : : : : : : : : :
c: confidential data* see annexes for the composition of economic zones(1) USA data have been harmonized by Eurostat

III
42 European Union international trade in services
Statistical tablesTable 3.2
3.2.6 Geographical breakdown of trade in services for the EU, Croatia, Norway, the USA and JapanYear: 2007Item: Travel
(Mio EUR)
EU-27 Croatia Norway USA(1) Japan
Credit Debit Net Credit Debit Net Credit Debit Net Credit Debit Net Credit Debit Net
WORLD 266 792 260 703 6 089 6 734 717 6 017 3 069 10 242 -7 172 86 992 59 170 27 823 6 819 19 344 -12 525
EXTRA-EU-27 75 642 94 230 -18 587 1 136 375 761 422 947 -525 62 651 41 206 21 445 : : :
EFTA 17 751 10 279 7 471 269 6 263 47 15 32 : : : : : :
Iceland 361 338 23 0 0 0 1 15 -14 : : : : : :
Liechtenstein 50 51 -1 0 - 0 0 0 0 : : : : : :
Switzerland 10 804 7 382 3 422 208 5 203 46 0 46 703 534 169 20 163 -142
Norway 6 536 2 509 4 027 60 0 60 : : : 434 131 304 : : :
Other European countries 9 606 15 687 -6 081 465 248 217 31 169 -138 : : : : : :
Croatia 795 3 469 -2 673 : : : : : : : : : : : :
Russia 3 975 1 762 2 213 90 11 79 0 0 0 : : : 48 52 -4
Turkey 1 077 6 464 -5 387 10 2 8 1 154 -153 : : : : : :
Africa 3 441 13 524 -10 083 : : : 3 0 3 1 780 1 735 45 18 18 0
North African countries 1 319 8 214 -6 895 : : : 1 0 1 : : : : : :
Egypt 348 3 407 -3 059 : : : : : : : : : : : :
Morocco 422 2 389 -1 967 : : : : : : : : : : : :
Other African countries 2 123 5 310 -3 187 : : : 3 0 3 : : : : : :
Nigeria 356 314 42 : : : : : : : : : : : :
South Africa 798 1 662 -864 : : : : : : 316 425 -109 4 18 -14
America 27 473 29 491 -2 018 170 66 105 314 727 -413 : : : 740 5 537 -4 797
Canada 3 254 3 193 60 52 6 46 31 0 31 10 318 5 437 4 881 124 428 -304
USA 19 346 16 870 2 476 113 59 54 276 717 -441 : : : 616 5 109 -4 492
Central American countries 1 397 5 814 -4 418 : : : 6 0 6 : : : : : :
Mexico 995 1 794 -798 : : : : : : 6 452 7 778 -1 327 25 71 -46
South American countries 3 452 3 509 -56 6 1 4 1 10 -9 : : : : : :
Argentina 393 652 -259 : : : : : : 692 517 175 : : :
Brazil 1 403 1 408 -5 6 1 4 - - - 1 910 745 1 165 17 39 -22
Chile 675 296 380 : : : : : : 362 257 105 : : :
Uruguay 59 55 3 : : : : : : : : : : : :
Venezuela 529 209 320 : : : : : : 1 302 223 1 079 : : :
Asia 11 588 16 953 -5 364 13 3 9 1 36 -35 : : : 5 083 7 837 -2 755
Near & Middle East countries 3 205 3 666 -460 : : : 0 2 -2 : : : : : :
Israel 765 856 -92 : : : : : : 872 467 405 : : :
Other Near & Middle East countries 375 491 -116 : : : 0 2 -2 : : : : : :
Other Asian countries 8 384 13 286 -4 902 13 3 9 0 34 -33 : : : : : :
China 1 882 2 913 -1 031 6 1 4 0 1 -1 2 900 1 899 1 000 1 680 1 814 -135
Hong-Kong 502 459 43 : : : - - - 530 952 -422 317 728 -411
Indonesia 160 389 -229 : : : : : : 298 114 184 59 398 -339
India 924 2 026 -1 102 0 1 -1 - - - 3 621 1 537 2 085 52 62 -10
Japan 2 181 900 1 280 7 1 5 25 10 14 8 976 2 528 6 448 : : :
Malaysia 306 384 -78 : : : : : : 230 115 115 95 225 -131
Philippines 119 409 -290 : : : : : : 523 390 134 69 310 -242
Singapore 305 286 19 : : : : : : 447 315 131 115 391 -276
Thailand 305 2 950 -2 645 : : : : : : 347 532 -185 140 800 -660
Taiwan 345 136 209 : : : : : : 1 332 773 558 1 074 902 172
Oceania and Polar regions 3 502 3 621 -118 : : : 26 0 26 : : : 179 2 332 -2 153
Australia 2 890 2 628 262 : : : 25 0 25 2 184 1 183 1 001 153 796 -643
New Zealand 597 798 -201 : : : 5 0 5 425 492 -66 24 158 -134
OECD countries* 233 908 202 035 31 873 5 355 325 5 030 : : : : : : 2 918 11 848 -8 930
Central & Eastern Europe countries* 1 599 3 717 -2 118 : : : : : : : : : : : :
Euro-Mediterranean Partnership* 3 093 14 921 -11 828 10 2 8 : : : : : : : : :
ACP countries* 2 096 6 916 -4 820 : : : : : : : : : : : :
OPEC* 4 106 4 240 -134 : : : : : : : : : : : :
Maghreb countries* 916 4 387 -3 472 : : : : : : : : : : : :
Mashrek countries* 523 3 640 -3 117 : : : : : : : : : : : :
ASEAN* 1 282 5 044 -3 762 : : : : : : : : : 539 2 285 -1 745
c: confidential data* see annexes for the composition of economic zones(1) USA data have been harmonized by Eurostat

Statistical tablesTable 3.2 III
43 European Union international trade in services
3.2.7 Geographical breakdown of trade in services for the EU, Croatia, Norway, the USA and JapanYear: 2007Item: Other services
(Mio EUR)
EU-27 Croatia Norway USA(1) Japan
Credit Debit Net Credit Debit Net Credit Debit Net Credit Debit Net Credit Debit Net
WORLD 656 221 533 203 123 018 1 334 1 510 -176 12 596 9 095 3 501 216 536 147 016 69 519 56 732 54 593 2 140
EXTRA-EU-27 301 405 214 352 87 053 353 437 -84 4 871 3 078 1 793 125 756 84 970 40 785 : : :
EFTA 49 596 35 070 14 526 81 106 -25 286 340 -54 : : : : : :
Iceland 269 186 84 : : : 15 18 -3 : : : : : :
Liechtenstein 390 439 -49 : : : 2 3 0 : : : : : :
Switzerland 40 485 29 173 11 312 60 85 -25 269 319 -50 8 933 4 922 4 011 746 1 463 -717
Norway 8 446 5 275 3 170 - 10 7 : : : : : : : : :
Other European countries 24 343 10 351 13 993 157 154 4 92 57 35 : : : : : :
Croatia 1 116 767 349 : : : : : : : : : : : :
Russia 11 260 4 636 6 624 - 38 -29 3 13 -10 : : : 182 173 10
Turkey 3 725 2 008 1 716 : : : 0 14 -14 : : : : : :
Africa 17 210 8 753 8 458 7 - -1 63 67 -4 4 940 1 971 2 969 671 410 260
North African countries 5 244 2 871 2 373 - - 1 8 7 1 : : : : : :
Egypt 1 617 858 759 : : : : : : : : : : : :
Morocco 1 031 872 159 : : : : : : : : : : : :
Other African countries 11 971 5 877 6 094 2 - -2 55 58 -3 : : : : : :
Nigeria 2 852 915 1 938 : : : : : : : : : : : :
South Africa 3 164 1 550 1 614 : : : : : : 1 076 474 601 139 57 82
America 116 473 109 788 6 685 89 132 -43 3 927 2 246 1 680 : : : 20 068 22 828 -2 761
Canada 5 168 4 316 853 - - -2 184 70 114 16 338 9 038 7 300 1 050 526 524
USA 89 493 91 944 -2 451 74 105 -32 3 667 2 117 1 550 : : : 19 018 22 303 -3 285
Central American countries 14 166 9 727 4 439 : : : 58 22 36 : : : : : :
Mexico 2 513 818 1 696 : : : : : : 8 152 2 393 5 759 392 171 220
South American countries 7 607 3 779 3 829 : : : 19 16 3 : : : : : :
Argentina 967 617 350 : : : : : : 941 260 682 : : :
Brazil 2 694 1 804 890 : : : 18 11 7 4 081 1 644 2 437 277 124 153
Chile 924 316 608 : : : : : : : : : : : :
Uruguay 198 149 48 : : : : : : : : : : : :
Venezuela 1 068 192 876 : : : : : : 1 000 130 870 : : :
Asia 76 327 38 979 37 347 - 29 -7 446 332 115 : : : 14 495 10 691 3 804
Near & Middle East countries 21 256 8 466 12 790 - - 0 53 54 -1 : : : : : :
Israel 1 757 1 423 334 : : : : : : : : : : : :
Other Near & Middle East countries 1 254 1 091 163 - - 2 1 13 -11 : : : : : :
Other Asian countries 55 065 30 504 24 561 - 21 -7 394 267 127 : : : : : :
China 10 369 4 265 6 104 : : : 25 24 1 : : : 1 414 1 850 -436
Hong-Kong 4 026 4 100 -74 : : : 43 45 -2 2 582 1 620 962 -2 087 1 012 -3 099
Indonesia 1 203 348 854 : : : : : : : : : 783 712 71
India 5 884 3 448 2 435 - 4 -2 8 11 -3 2 206 5 113 -2 906 609 269 340
Japan 12 149 8 039 4 109 - 1 0 134 62 72 15 573 10 818 4 755 : : :
Malaysia 1 520 717 804 : : : : : : : : : -273 385 -658
Philippines 659 307 353 : : : : : : : : : 658 491 166
Singapore 7 902 3 742 4 160 : : : : : : 4 354 1 574 2 780 5 088 2 608 2 480
Thailand 1 002 599 403 : : : : : : : : : 2 075 823 1 252
Taiwan 2 378 1 207 1 171 : : : : : : 2 312 628 1 684 3 810 979 2 832
Oceania and Polar regions 5 955 2 898 3 057 : : : 56 28 27 : : : 773 1 294 -521
Australia 5 169 2 533 2 635 - - -1 48 26 21 5 182 2 379 2 803 566 1 202 -636
New Zealand 526 222 304 - - 0 8 2 6 : : : 121 64 56
OECD countries* 517 902 458 452 59 451 995 1 163 -168 : : : : : : 41 027 39 750 1 277
Central & Eastern Europe countries* 2 419 2 557 -139 : : : : : : : : : : : :
Euro-Mediterranean Partnership* 10 896 7 947 2 949 - - 0 : : : : : : : : :
ACP countries* 14 270 7 899 6 371 5 - -10 : : : : : : : : :
OPEC* 24 829 7 258 17 571 - - 1 : : : : : : : : :
Maghreb countries* 2 855 2 157 697 - - 3 : : : : : : : : :
Mashrek countries* 2 340 1 809 532 - - 1 : : : : : : : : :
ASEAN* 13 300 6 075 7 224 : : : : : : : : : 8 585 5 387 3 198
c: confidential data* see annexes for the composition of economic zones(1) USA data have been harmonized by Eurostat

III
44 European Union international trade in services
Statistical tablesTable 3.2
3.2.8 Geographical breakdown of trade in services for the EU, Croatia, Norway, the USA and JapanYear: 2007Item: Communication services
(Mio EUR)
EU-27 Croatia Norway USA(1) Japan
Credit Debit Net Credit Debit Net Credit Debit Net Credit Debit Net Credit Debit Net
WORLD 30 746 30 743 3 351 115 236 431 297 135 6 280 5 762 518 404 751 -346
EXTRA-EU-27 10 016 10 440 -424 32 26 6 142 30 113 : : : : : :
EFTA 1 563 1 451 112 8 4 4 5 1 4 : : : : : :
Iceland 28 13 14 0 0 0 0 0 0 : : : : : :
Liechtenstein 8 33 -25 0 0 0 0 0 0 : : : : : :
Switzerland 1 052 1 027 25 6 4 2 5 1 4 : : : 4 0 4
Norway 473 379 94 2 0 1 : : : : : : : : :
Other European countries 791 1 026 -236 18 18 0 0 5 -4 : : : : : :
Croatia 71 135 -63 : : : : : : : : : : : :
Russia 296 245 51 4 0 4 0 0 0 : : : 1 1 0
Turkey 181 265 -83 0 0 0 0 5 -5 : : : : : :
Africa 881 1 014 -132 0 0 0 4 0 4 : : : 0 8 -7
North African countries 277 533 -255 0 0 0 3 0 3 : : : : : :
Egypt 73 104 -32 0 0 0 : : : : : : : : :
Morocco 113 292 -179 - 0 0 : : : : : : : : :
Other African countries 604 478 126 0 0 0 1 0 1 : : : : : :
Nigeria 107 87 20 : : : : : : : : : : : :
South Africa 128 72 56 0 0 0 : : : : : : 0 0 0
America 4 094 4 904 -810 6 2 4 125 20 106 : : : 114 184 -69
Canada 204 165 39 1 0 1 6 0 6 : : : 7 5 2
USA 3 400 3 290 110 5 1 3 119 19 100 : : : 108 179 -71
Central American countries 173 1 190 -1 018 0 0 0 0 0 0 : : : : : :
Mexico 34 37 -3 - 0 0 : : : : : : 0 : :
South American countries 310 247 63 0 0 0 0 0 0 : : : : : :
Argentina 54 41 12 0 0 0 : : : : : : : : :
Brazil 123 77 45 0 0 0 0 0 0 : : : 1 5 -4
Chile 30 27 3 0 0 0 : : : : : : : : :
Uruguay 5 6 0 : : : : : : : : : : : :
Venezuela 25 8 17 0 0 0 : : : : : : : : :
Asia 1 826 1 653 174 1 2 -1 7 4 3 : : : 208 289 -81
Near & Middle East countries 610 497 113 0 1 -1 0 0 0 : : : : : :
Israel 108 138 -30 0 1 -1 : : : : : : : : :
Other Near & Middle East countries 79 94 -15 0 0 0 0 0 0 : : : : : :
Other Asian countries 1 212 1 158 54 1 1 0 7 4 3 : : : : : :
China 233 187 46 0 0 0 0 0 0 : : : 46 65 -19
Hong-Kong 150 169 -20 1 0 0 1 0 1 : : : 28 33 -5
Indonesia 31 24 7 - 0 0 : : : : : : 6 10 -4
India 152 215 -63 0 0 0 0 0 0 : : : 1 2 -1
Japan 165 117 48 0 0 0 0 1 -1 : : : : : :
Malaysia 67 49 18 0 0 0 : : : : : : 15 17 -2
Philippines 28 46 -18 0 0 0 : : : : : : 11 63 -52
Singapore 117 112 5 0 0 0 : : : : : : 11 22 -11
Thailand 48 57 -9 0 0 0 : : : : : : 10 18 -8
Taiwan 49 39 10 0 0 0 : : : : : : 20 13 7
Oceania and Polar regions 328 164 164 0 0 0 0 0 0 : : : 12 17 -6
Australia 254 134 120 0 0 0 0 0 0 : : : 10 14 -5
New Zealand 48 25 22 0 0 0 0 0 0 : : : 1 3 -1
OECD countries* 26 031 25 154 877 283 84 199 : : : : : : 242 470 -228
Central & Eastern Europe countries* 136 393 -257 : : : : : : : : : : : :
Euro-Mediterranean Partnership* 573 1 021 -447 0 1 -1 : : : : : : : : :
ACP countries* 516 596 -80 0 0 0 : : : : : : : : :
OPEC* 770 439 331 0 0 0 : : : : : : : : :
Maghreb countries* 184 420 -236 - 0 0 : : : : : : : : :
Mashrek countries* 114 176 -62 0 0 0 : : : : : : : : :
ASEAN* 309 297 11 0 0 0 : : : : : : 54 133 -79
c: confidential data* see annexes for the composition of economic zones(1) USA data have been harmonized by Eurostat

Statistical tablesTable 3.2 III
45 European Union international trade in services
3.2.9 Geographical breakdown of trade in services for the EU, Croatia, Norway, the USA and JapanYear: 2007Item: Construction services
(Mio EUR)
EU-27 Croatia Norway USA(1) Japan
Credit Debit Net Credit Debit Net Credit Debit Net Credit Debit Net Credit Debit Net
WORLD 28 190 19 322 8 868 62 8 53 251 40 211 4 720 1 351 3 370 7 532 5 792 1 739
EXTRA-EU-27 15 880 7 804 8 076 23 3 20 60 20 40 : : : : : :
EFTA 1 651 848 803 2 0 2 6 0 5 : : : : : :
Iceland 63 2 60 1 0 1 3 0 3 : : : : : :
Liechtenstein 5 22 -16 0 0 0 0 0 0 : : : : : :
Switzerland 603 514 89 1 0 1 2 0 2 : : : 24 43 -20
Norway 979 311 668 1 0 1 : : : : : : : : :
Other European countries 1 516 886 631 7 2 5 1 0 1 : : : : : :
Croatia 94 81 13 : : : : : : : : : : : :
Russia 899 503 396 1 0 1 0 0 0 : : : 141 22 119
Turkey 173 116 56 : : : 0 0 0 : : : : : :
Africa 3 482 1 162 2 320 4 - 4 0 0 0 : : : 334 151 183
North African countries 926 369 557 4 - 4 0 0 0 : : : : : :
Egypt 193 119 74 - 0 0 : : : : : : : : :
Morocco 82 34 47 : : : : : : : : : : : :
Other African countries 2 557 794 1 764 0 - 0 0 0 0 : : : : : :
Nigeria 820 407 413 : : : : : : : : : : : :
South Africa 318 88 231 : : : : : : : : : 41 0 40
America 2 444 1 543 901 0 0 0 29 1 28 : : : 141 125 16
Canada 204 364 -159 0 - 0 0 0 0 : : : 10 8 2
USA 849 800 49 0 0 0 29 0 29 : : : 131 118 13
Central American countries 360 176 184 : : : 0 0 0 : : : : : :
Mexico 117 98 19 : : : : : : : : : 59 122 -63
South American countries 1 030 204 825 : : : 0 1 -1 : : : : : :
Argentina 58 23 34 : : : : : : : : : : : :
Brazil 407 112 295 : : : 0 1 -1 : : : 17 9 8
Chile 91 8 83 : : : : : : : : : : : :
Uruguay 21 16 5 : : : : : : : : : : : :
Venezuela 207 18 189 : : : : : : : : : : : :
Asia 6 566 3 264 3 303 9 0 8 17 19 -2 : : : 2 267 2 198 69
Near & Middle East countries 4 374 1 499 2 876 2 - 2 4 0 4 : : : : : :
Israel 37 17 20 : : : : : : : : : : : :
Other Near & Middle East countries 304 266 38 2 - 2 0 0 0 : : : : : :
Other Asian countries 2 193 1 764 430 7 0 7 13 19 -6 : : : : : :
China 543 400 142 : : : 0 0 0 : : : 90 45 45
Hong-Kong 31 87 -55 - 0 0 3 0 3 : : : 15 31 -16
Indonesia 32 25 7 : : : : : : : : : 224 155 69
India 353 149 204 1 0 1 0 0 0 : : : 55 92 -37
Japan 122 77 45 - 0 0 0 0 0 : : : : : :
Malaysia 154 76 79 : : : : : : : : : 183 140 43
Philippines 10 10 0 : : : : : : : : : 362 207 155
Singapore 119 118 1 : : : : : : : : : 258 458 -199
Thailand 65 32 33 : : : : : : : : : 403 419 -16
Taiwan 106 48 58 : : : : : : : : : 314 314 0
Oceania and Polar regions 176 84 92 : : : 7 0 7 : : : 140 258 -118
Australia 139 70 69 0 - 0 7 0 7 : : : 82 224 -143
New Zealand 18 5 14 - 0 0 0 0 0 : : : 36 31 5
OECD countries* 14 428 13 617 811 35 4 31 : : : : : : 686 1 288 -602
Central & Eastern Europe countries* 117 180 -64 : : : : : : : : : : : :
Euro-Mediterranean Partnership* 942 546 396 6 - 6 : : : : : : : : :
ACP countries* 2 686 845 1 841 0 - 0 : : : : : : : : :
OPEC* 3 046 803 2 244 4 - 4 : : : : : : : : :
Maghreb countries* 416 174 242 4 - 4 : : : : : : : : :
Mashrek countries* 306 225 82 2 - 2 : : : : : : : : :
ASEAN* 480 318 163 : : : : : : : : : 1 697 1 553 143
c: confidential data* see annexes for the composition of economic zones(1) USA data have been harmonized by Eurostat

III
46 European Union international trade in services
Statistical tablesTable 3.2
3.2.10 Geographical breakdown of trade in services for the EU, Croatia, Norway, the USA and JapanYear: 2007Item: Insurance services
(Mio EUR)
EU-27 Croatia Norway USA(1) Japan
Credit Debit Net Credit Debit Net Credit Debit Net Credit Debit Net Credit Debit Net
WORLD 29 480 23 358 6 122 23 51 -29 210 159 51 7 505 31 201 -23 696 980 3 005 -2 024
EXTRA-EU-27 14 860 7 996 6 863 7 2 5 61 51 9 5 286 19 412 -14 126 : : :
EFTA 654 2 705 -2 051 1 1 -1 1 3 -1 : : : : : :
Iceland 13 3 11 - 0 0 0 0 0 : : : : : :
Liechtenstein 10 53 -42 0 - 0 0 0 0 : : : : : :
Switzerland 431 2 379 -1 948 1 1 -1 1 3 -1 398 5 472 -5 075 22 212 -190
Norway 200 272 -72 0 0 0 : : : 28 18 11 : : :
Other European countries 618 219 398 6 0 5 0 0 0 : : : : : :
Croatia 51 12 40 : : : : : : : : : : : :
Russia 136 179 -43 0 0 0 0 0 0 : : : 7 2 5
Turkey 159 78 81 0 0 0 0 0 0 : : : : : :
Africa 502 324 178 0 0 0 0 0 0 36 22 14 18 6 12
North African countries 106 100 7 0 - 0 0 0 0 : : : : : :
Egypt 27 14 13 : : : : : : : : : : : :
Morocco 31 14 16 0 - 0 : : : : : : : : :
Other African countries 395 223 172 0 0 0 0 0 0 : : : : : :
Nigeria 30 20 11 : : : : : : : : : : : :
South Africa 219 158 61 0 0 0 : : : 11 17 -6 2 1 1
America 10 618 3 347 7 271 1 0 1 53 47 6 : : : 254 931 -678
Canada 567 306 260 0 0 0 2 1 2 1 427 730 698 -20 7 -27
USA 8 518 2 411 6 108 1 0 0 48 41 6 : : : 274 924 -650
Central American countries 964 505 459 0 0 0 2 5 -2 : : : : : :
Mexico 209 32 177 : : : : : : 214 15 198 7 3 4
South American countries 563 124 439 0 0 0 0 0 0 : : : : : :
Argentina 75 13 63 : : : : : : 26 8 18 : : :
Brazil 95 48 48 0 0 0 0 0 0 53 15 39 7 4 4
Chile 108 23 85 - 0 0 : : : 42 3 39 : : :
Uruguay 4 2 2 : : : : : : : : : : : :
Venezuela 78 15 63 : : : : : : 20 6 15 : : :
Asia 1 578 948 631 0 0 0 4 1 3 : : : 242 172 71
Near & Middle East countries 402 107 295 0 0 0 1 0 1 : : : : : :
Israel 91 20 71 0 - 0 : : : 36 4 31 : : :
Other Near & Middle East countries 43 15 28 0 0 0 0 0 0 : : : : : :
Other Asian countries 1 177 838 339 0 0 0 4 1 3 : : : : : :
China 109 281 -172 0 0 0 0 0 0 35 7 28 57 24 33
Hong-Kong 95 79 15 - 0 0 1 0 1 89 8 81 38 35 3
Indonesia 43 20 24 : : : : : : 9 13 -4 18 9 10
India 56 47 10 - 0 0 0 0 0 19 8 11 4 2 2
Japan 387 157 231 0 0 0 1 0 1 1 130 147 984 : : :
Malaysia 52 33 18 : : : : : : 15 15 0 21 4 17
Philippines 26 9 17 : : : : : : 12 1 11 6 5 1
Singapore 158 50 108 0 - 0 : : : 50 11 39 8 67 -59
Thailand 32 27 5 - 0 0 : : : 18 1 17 16 4 12
Taiwan 46 35 11 0 0 0 : : : 59 14 45 32 7 26
Oceania and Polar regions 521 217 304 0 0 0 1 0 1 : : : 16 11 5
Australia 485 205 280 0 0 0 1 0 1 155 36 119 13 10 3
New Zealand 28 10 18 0 0 0 0 0 0 15 1 14 2 0 1
OECD countries* 25 491 21 081 4 410 14 47 -33 : : : : : : 640 2 470 -1 830
Central & Eastern Europe countries* 61 55 6 : : : : : : : : : : : :
Euro-Mediterranean Partnership* 431 177 254 0 0 0 : : : : : : : : :
ACP countries* 678 91 587 0 0 0 : : : : : : : : :
OPEC* 778 268 510 0 0 0 : : : : : : : : :
Maghreb countries* 85 62 23 0 - 0 : : : : : : : : :
Mashrek countries* 88 22 66 0 0 0 : : : : : : : : :
ASEAN* 322 150 172 0 0 0 : : : : : : 87 91 -4
c: confidential data* see annexes for the composition of economic zones(1) USA data have been harmonized by Eurostat

Statistical tablesTable 3.2 III
47 European Union international trade in services
3.2.11 Geographical breakdown of trade in services for the EU, Croatia, Norway, the USA and JapanYear: 2007Item: Financial services
(Mio EUR)
EU-27 Croatia Norway USA(1) Japan
Credit Debit Net Credit Debit Net Credit Debit Net Credit Debit Net Credit Debit Net
WORLD 117 505 52 724 64 781 37 61 -24 743 815 -72 42 514 13 811 28 703 4 529 2 634 1 894
EXTRA-EU-27 51 547 20 772 30 775 17 22 -5 159 163 -4 24 573 6 058 18 515 : : :
EFTA 8 848 4 802 4 047 1 1 -1 15 11 4 : : : : : :
Iceland 94 39 55 0 - 0 2 0 2 : : : : : :
Liechtenstein 83 43 40 0 0 0 0 0 0 : : : : : :
Switzerland 7 530 4 414 3 116 0 1 -1 14 11 3 652 326 326 14 35 -21
Norway 1 141 302 839 0 0 0 : : : 290 42 248 : : :
Other European countries 5 388 1 142 4 245 14 17 -3 3 3 0 : : : : : :
Croatia 137 10 127 : : : : : : : : : : : :
Russia 1 616 266 1 350 0 0 0 0 0 0 : : : 4 0 4
Turkey 473 329 145 0 0 0 0 0 0 : : : : : :
Africa 1 386 205 1 182 0 0 0 1 1 1 509 265 244 3 2 1
North African countries 364 49 315 0 0 0 0 0 0 : : : : : :
Egypt 194 18 176 0 0 0 : : : : : : : : :
Morocco 22 13 10 - 0 0 : : : : : : : : :
Other African countries 1 020 157 863 0 0 0 1 1 1 : : : : : :
Nigeria 91 11 80 : : : : : : : : : : : :
South Africa 461 77 384 0 0 0 : : : 209 54 155 0 0 0
America 22 557 9 118 13 439 2 3 -1 126 116 10 : : : 1 902 1 067 834
Canada 979 217 761 0 0 0 2 0 2 2 753 633 2 120 6 8 -2
USA 16 630 7 887 8 743 2 3 -1 123 115 8 : : : 1 895 1 060 836
Central American countries 4 366 665 3 701 0 0 0 1 0 1 : : : : : :
Mexico 171 48 123 : : : : : : 742 231 511 5 0 5
South American countries 583 348 235 0 0 0 0 1 -1 : : : : : :
Argentina 55 26 29 0 0 0 : : : 212 30 182 : : :
Brazil 206 129 77 0 0 0 0 1 -1 774 102 672 22 3 19
Chile 48 34 15 - 0 0 : : : 109 20 90 : : :
Uruguay 21 6 15 0 - 0 : : : : : : : : :
Venezuela 35 16 19 : : : : : : 130 7 123 : : :
Asia 11 138 4 508 6 630 0 0 0 6 31 -25 : : : 439 263 176
Near & Middle East countries 1 188 239 950 0 0 0 1 1 0 : : : : : :
Israel 129 34 94 0 0 0 : : : 151 31 120 : : :
Other Near & Middle East countries 83 16 67 0 0 0 0 0 0 : : : : : :
Other Asian countries 9 950 4 271 5 679 0 0 0 5 30 -24 : : : : : :
China 453 181 273 0 0 0 0 0 0 682 64 618 6 33 -27
Hong-Kong 1 254 1 196 57 0 0 0 2 3 -1 1 072 704 368 344 125 220
Indonesia 52 15 37 - 0 0 : : : 79 27 52 8 0 7
India 349 97 252 0 0 0 0 0 0 291 167 124 3 16 -13
Japan 4 426 1 502 2 924 0 0 0 2 7 -5 1 850 1 003 847 : : :
Malaysia 213 25 188 0 0 0 : : : 90 30 61 3 0 2
Philippines 38 6 32 : : : : : : 58 74 -16 5 1 5
Singapore 920 531 389 0 0 0 : : : 546 251 295 41 62 -21
Thailand 124 27 97 - 0 0 : : : 79 31 48 7 2 5
Taiwan 952 361 591 0 0 0 : : : 289 93 196 2 9 -6
Oceania and Polar regions 1 026 371 655 0 0 0 6 1 5 : : : 30 37 -7
Australia 888 336 552 0 0 0 2 1 1 1 194 320 874 29 37 -7
New Zealand 79 11 68 0 0 0 5 0 5 0 0 0 0 0 0
OECD countries* 98 285 46 953 51 331 22 40 -18 : : : : : : 3 696 2 322 1 374
Central & Eastern Europe countries* 305 113 192 : : : : : : : : : : : :
Euro-Mediterranean Partnership* 1 139 639 500 0 0 0 : : : : : : : : :
ACP countries* 2 074 456 1 619 0 0 0 : : : : : : : : :
OPEC* 3 203 504 2 699 0 0 0 : : : : : : : : :
Maghreb countries* 153 96 57 - 0 0 : : : : : : : : :
Mashrek countries* 344 83 261 0 0 0 : : : : : : : : :
ASEAN* 1 395 612 783 0 0 0 : : : : : : 66 66 1
c: confidential data* see annexes for the composition of economic zones(1) USA data have been harmonized by Eurostat

III
48 European Union international trade in services
Statistical tablesTable 3.2
3.2.12 Geographical breakdown of trade in services for the EU, Croatia, Norway, the USA and JapanYear: 2007Item: Computer and information services
(Mio EUR)
EU-27 Croatia Norway USA(1) Japan
Credit Debit Net Credit Debit Net Credit Debit Net Credit Debit Net Credit Debit Net
WORLD 65 630 33 254 32 377 84 158 -73 838 1 216 -378 9 287 10 810 -1 523 705 2 632 -1 927
EXTRA-EU-27 25 598 11 066 14 532 22 37 -14 206 498 -292 : : : : : :
EFTA 6 281 1 993 4 287 4 11 -7 14 10 4 : : : : : :
Iceland 69 10 58 0 0 0 2 6 -4 : : : : : :
Liechtenstein 12 27 -15 0 0 0 0 0 0 : : : : : :
Switzerland 5 384 1 533 3 851 3 10 -7 13 4 8 : : : 34 245 -212
Norway 816 422 393 1 1 0 : : : : : : : : :
Other European countries 2 171 243 1 928 10 2 8 2 1 1 : : : : : :
Croatia 120 21 99 : : : : : : : : : : : :
Russia 1 274 113 1 160 1 1 0 0 1 -1 : : : 0 : :
Turkey 323 31 292 0 0 0 0 0 0 : : : : : :
Africa 1 754 175 1 579 1 1 0 0 0 0 : : : 3 : :
North African countries 450 31 419 0 - 0 0 0 0 : : : : : :
Egypt 254 12 241 0 - 0 : : : : : : : : :
Morocco 54 11 43 0 - 0 : : : : : : : : :
Other African countries 1 306 145 1 161 0 1 0 0 0 0 : : : : : :
Nigeria 66 1 65 : : : : : : : : : : : :
South Africa 600 116 484 0 0 0 : : : : : : 3 : :
America 8 227 6 070 2 157 7 20 -14 180 475 -296 : : : 381 1 208 -827
Canada 455 328 127 1 0 1 1 1 0 : : : 1 16 -15
USA 6 629 5 564 1 065 5 20 -14 178 474 -296 : : : 380 1 192 -813
Central American countries 526 68 458 0 0 0 1 1 0 : : : : : :
Mexico 259 30 228 - 0 0 : : : : : : 1 : :
South American countries 610 110 500 0 0 0 0 0 0 : : : : : :
Argentina 103 29 73 0 0 0 : : : : : : : : :
Brazil 242 61 181 - 0 0 0 0 0 : : : 1 0 1
Chile 81 6 75 0 - 0 : : : : : : : : :
Uruguay 3 6 -3 - 0 0 : : : : : : : : :
Venezuela 64 2 62 : : : : : : : : : : : :
Asia 6 025 2 341 3 684 1 2 -1 9 10 -1 : : : 207 720 -513
Near & Middle East countries 2 389 414 1 976 1 1 -1 5 3 2 : : : : : :
Israel 459 328 131 0 1 -1 : : : : : : : : :
Other Near & Middle East countries 174 10 164 0 0 0 1 0 0 : : : : : :
Other Asian countries 3 631 1 925 1 706 1 1 0 4 7 -3 : : : : : :
China 541 171 370 0 0 0 0 0 0 : : : 34 323 -290
Hong-Kong 166 40 126 0 0 0 0 1 -1 : : : 7 21 -14
Indonesia 110 25 85 0 0 0 : : : : : : 3 : :
India 544 1 064 -520 0 1 -1 0 2 -2 : : : 7 62 -55
Japan 991 134 857 0 0 0 2 1 1 : : : : : :
Malaysia 141 42 99 0 0 0 : : : : : : 2 1 1
Philippines 106 33 74 0 0 0 : : : : : : 0 23 -23
Singapore 226 215 11 0 0 0 : : : : : : 93 202 -108
Thailand 60 27 33 : : : : : : : : : 15 : :
Taiwan 182 119 64 0 0 0 : : : : : : 4 55 -52
Oceania and Polar regions 664 111 554 0 0 0 1 2 -1 : : : 1 53 -52
Australia 578 89 489 0 0 0 1 2 -1 : : : 1 53 -51
New Zealand 46 15 31 0 0 0 0 0 0 : : : 0 1 -1
OECD countries* 54 981 29 962 25 019 61 138 -77 : : : : : : 536 1 933 -1 397
Central & Eastern Europe countries* 245 147 98 : : : : : : : : : : : :
Euro-Mediterranean Partnership* 1 263 491 773 1 1 -1 : : : : : : : : :
ACP countries* 1 589 273 1 316 0 1 -1 : : : : : : : : :
OPEC* 2 484 346 2 138 0 0 0 : : : : : : : : :
Maghreb countries* 196 48 148 0 - 0 : : : : : : : : :
Mashrek countries* 327 39 288 0 0 0 : : : : : : : : :
ASEAN* 732 349 382 0 0 0 : : : : : : 113 228 -115
c: confidential data* see annexes for the composition of economic zones(1) USA data have been harmonized by Eurostat

Statistical tablesTable 3.2 III
49 European Union international trade in services
3.2.13 Geographical breakdown of trade in services for the EU, Croatia, Norway, the USA and JapanYear: 2007Item: Royalties and licence fees
(Mio EUR)
EU-27 Croatia Norway USA(1) Japan
Credit Debit Net Credit Debit Net Credit Debit Net Credit Debit Net Credit Debit Net
WORLD 43 754 56 711 -12 957 29 156 -127 513 452 62 60 280 18 277 42 004 16 949 12 169 4 780
EXTRA-EU-27 26 071 34 361 -8 290 18 46 -28 336 212 124 31 990 9 589 22 401 : : :
EFTA 2 475 3 242 -767 1 26 -25 9 67 -59 : : : : : :
Iceland 20 12 8 - 0 0 0 0 0 : : : : : :
Liechtenstein 17 27 -11 0 1 -1 0 0 0 : : : : : :
Switzerland 1 967 3 051 -1 084 1 24 -24 9 67 -58 5 448 2 308 3 140 231 282 -51
Norway 473 152 321 0 0 0 : : : 280 77 204 : : :
Other European countries 877 158 719 9 1 7 0 0 0 : : : : : :
Croatia 48 7 41 : : : : : : : : : : : :
Russia 502 84 417 0 0 0 0 0 0 : : : 1 1 0
Turkey 185 13 172 0 0 0 0 0 0 : : : : : :
Africa 607 234 374 0 0 0 0 2 -2 694 21 673 131 10 121
North African countries 126 69 57 0 0 0 0 0 0 : : : : : :
Egypt 44 7 37 0 0 0 : : : : : : : : :
Morocco 18 58 -40 : : : : : : : : : : : :
Other African countries 483 164 320 0 0 0 0 2 -2 : : : : : :
Nigeria 55 19 37 : : : : : : : : : : : :
South Africa 320 31 289 0 0 0 : : : 393 15 379 128 : :
America 11 935 27 649 -15 714 8 17 -9 302 139 164 : : : 7 592 8 404 -812
Canada 399 354 45 0 0 0 12 2 10 4 592 546 4 047 533 26 507
USA 9 023 22 946 -13 923 8 16 -8 280 136 143 : : : 7 058 8 378 -1 319
Central American countries 1 785 4 277 -2 493 0 0 0 0 0 0 : : : : : :
Mexico 424 22 403 0 0 0 : : : 1 573 98 1 475 267 1 267
South American countries 725 57 668 0 0 0 10 0 10 : : : : : :
Argentina 95 16 79 0 0 0 : : : 223 10 212 : : :
Brazil 414 21 393 0 0 0 10 0 10 1 076 4 1 072 206 1 205
Chile 44 6 38 0 0 0 : : : 111 1 110 : : :
Uruguay 4 2 2 - 0 0 : : : : : : : : :
Venezuela 101 2 99 : : : : : : 233 2 231 : : :
Asia 9 013 2 508 6 505 0 1 -1 24 4 20 : : : 4 920 1 232 3 688
Near & Middle East countries 680 423 256 0 1 -1 0 0 0 : : : : : :
Israel 104 61 43 0 0 0 : : : 212 147 65 : : :
Other Near & Middle East countries 29 13 16 - 0 0 0 0 0 : : : : : :
Other Asian countries 8 332 2 084 6 248 0 1 -1 24 3 20 : : : : : :
China 1 179 120 1 059 0 0 0 0 0 0 1 371 84 1 287 1 316 14 1 302
Hong-Kong 165 119 46 0 0 0 0 1 -1 389 24 365 246 25 221
Indonesia 90 1 89 - 0 0 : : : 122 2 120 349 3 347
India 355 46 310 0 1 -1 0 0 0 659 72 587 244 2 241
Japan 1 806 1 592 214 0 0 0 12 1 11 5 399 5 410 -11 : : :
Malaysia 132 4 128 - 0 0 : : : 211 3 208 239 2 237
Philippines 68 12 56 - 0 0 : : : 123 3 120 135 0 134
Singapore 3 448 37 3 411 0 0 0 : : : 1 371 65 1 306 222 918 -696
Thailand 91 4 87 0 0 0 : : : 163 3 161 1 091 132 958
Taiwan 177 11 166 0 0 0 : : : 586 23 563 629 11 618
Oceania and Polar regions 828 196 632 0 1 -1 1 1 0 : : : 227 27 200
Australia 761 181 580 0 1 -1 1 1 0 1 537 304 1 232 222 26 196
New Zealand 62 12 49 0 - 0 0 0 0 163 11 152 5 : :
OECD countries* 33 277 50 605 -17 328 18 143 -124 : : : : : : 11 977 10 950 1 027
Central & Eastern Europe countries* 81 117 -36 : : : : : : : : : : : :
Euro-Mediterranean Partnership* 522 336 187 0 0 0 : : : : : : : : :
ACP countries* 801 671 130 0 0 0 : : : : : : : : :
OPEC* 1 179 400 779 0 0 0 : : : : : : : : :
Maghreb countries* 85 115 -30 - 0 0 : : : : : : : : :
Mashrek countries* 109 60 49 0 0 0 : : : : : : : : :
ASEAN* 3 870 63 3 807 0 0 0 : : : : : : 2 089 1 067 1 022
c: confidential data* see annexes for the composition of economic zones(1) USA data have been harmonized by Eurostat

III
50 European Union international trade in services
Statistical tablesTable 3.2
3.2.14 Geographical breakdown of trade in services for the EU, Croatia, Norway, the USA and JapanYear: 2007Item: Other business services
(Mio EUR)
EU-27 Croatia Norway USA(1) Japan
Credit Debit Net Credit Debit Net Credit Debit Net Credit Debit Net Credit Debit Net
WORLD 311 654 282 490 29 164 700 844 -144 9 096 5 109 3 987 60 031 38 166 21 865 24 019 25 420 -1 401
EXTRA-EU-27 144 328 108 857 35 471 221 252 -31 3 778 1 721 2 057 : : : : : :
EFTA 27 088 18 075 9 013 61 51 10 228 215 14 : : : : : :
Iceland -32 96 -127 0 0 0 7 10 -3 : : : : : :
Liechtenstein 245 228 16 2 9 -7 2 3 0 : : : : : :
Switzerland 22 793 14 535 8 258 45 34 12 219 202 17 : : : 401 441 -40
Norway 4 080 3 218 862 14 8 5 : : : : : : : : :
Other European countries 12 004 5 954 6 050 89 105 -15 82 26 56 : : : : : :
Croatia 570 460 110 : : : : : : : : : : : :
Russia 6 221 3 058 3 163 3 36 -33 2 8 -6 : : : 22 108 -86
Turkey 2 039 1 071 967 1 2 0 0 3 -3 : : : : : :
Africa 7 289 4 297 2 992 2 5 -3 46 37 9 : : : 182 204 -22
North African countries 2 709 1 528 1 181 1 2 -1 0 2 -2 : : : : : :
Egypt 770 508 262 0 1 -1 : : : : : : : : :
Morocco 584 389 194 0 0 0 : : : : : : : : :
Other African countries 4 581 2 768 1 814 1 3 -2 46 34 11 : : : : : :
Nigeria 1 571 338 1 233 0 - 0 : : : : : : : : :
South Africa 949 926 24 0 0 0 : : : : : : -35 43 -77
America 51 812 50 546 1 266 62 65 -3 3 043 1 235 1 808 : : : 8 574 10 143 -1 569
Canada 2 171 2 352 -180 3 6 -4 151 59 92 : : : 507 422 85
USA 40 452 43 328 -2 877 52 46 5 2 831 1 161 1 670 : : : 8 066 9 721 -1 655
Central American countries 5 790 2 640 3 150 7 12 -5 54 8 46 : : : : : :
Mexico 1 250 504 745 0 1 -1 : : : : : : 52 37 15
South American countries 3 388 2 235 1 153 0 0 0 9 6 2 : : : : : :
Argentina 485 361 124 0 0 0 : : : : : : : : :
Brazil 1 086 1 211 -125 0 0 0 8 3 5 : : : 22 89 -67
Chile 498 161 337 0 0 0 : : : : : : : : :
Uruguay 134 78 56 - 0 0 : : : : : : : : :
Venezuela 541 112 429 0 0 0 : : : : : : : : :
Asia 37 497 21 932 15 565 11 19 -8 340 184 156 : : : 5 913 5 433 480
Near & Middle East countries 10 861 4 621 6 240 6 4 1 33 22 11 : : : : : :
Israel 775 729 46 1 1 0 : : : : : : : : :
Other Near & Middle East countries 362 481 -119 1 1 0 1 2 -1 : : : : : :
Other Asian countries 26 640 17 306 9 333 5 14 -10 307 163 144 : : : : : :
China 7 127 2 796 4 331 1 2 0 16 10 6 : : : -145 1 276 -1 421
Hong-Kong 2 109 2 332 -222 1 1 -1 34 39 -5 : : : -2 794 683 -3 477
Indonesia 732 196 536 0 0 0 : : : : : : 172 532 -360
India 3 778 1 731 2 046 1 2 -1 8 2 5 : : : 292 90 202
Japan 3 913 4 307 -394 0 0 0 106 49 57 : : : : : :
Malaysia 735 464 272 0 0 0 : : : : : : -748 205 -953
Philippines 349 175 174 0 0 0 : : : : : : 120 180 -60
Singapore 2 802 2 623 179 1 1 0 : : : : : : 4 423 765 3 658
Thailand 528 385 143 0 0 0 : : : : : : 529 236 293
Taiwan 822 583 239 0 0 0 : : : : : : 2 799 557 2 243
Oceania and Polar regions 2 146 1 632 514 2 10 -9 38 24 14 : : : 328 831 -503
Australia 1 845 1 419 426 1 1 1 35 22 13 : : : 197 791 -593
New Zealand 213 134 79 0 0 0 3 2 1 : : : 73 20 53
OECD countries* 243 423 241 812 1 611 523 612 -88 : : : : : : 21 821 18 715 3 105
Central & Eastern Europe countries* 1 165 1 274 -109 : : : : : : : : : : : :
Euro-Mediterranean Partnership* 5 432 4 094 1 338 4 5 -1 : : : : : : : : :
ACP countries* 5 129 3 638 1 491 4 13 -9 : : : : : : : : :
OPEC* 12 465 3 950 8 515 2 4 -2 : : : : : : : : :
Maghreb countries* 1 567 1 107 460 0 0 0 : : : : : : : : :
Mashrek countries* 900 960 -60 1 2 -1 : : : : : : : : :
ASEAN* 5 820 4 012 1 808 1 1 0 : : : : : : 4 404 2 079 2 325
c: confidential data* see annexes for the composition of economic zones(1) USA data have been harmonized by Eurostat

Statistical tablesTable 3.2 III
51 European Union international trade in services
3.2.15 Geographical breakdown of trade in services for the EU, Croatia, Norway, the USA and JapanYear: 2007Item: Personal, cultural and recreational services
(Mio EUR)
EU-27 Croatia Norway USA(1) Japan
Credit Debit Net Credit Debit Net Credit Debit Net Credit Debit Net Credit Debit Net
WORLD 12 066 14 408 -2 342 48 68 -20 342 412 -70 10 976 1 051 9 925 114 962 -848
EXTRA-EU-27 4 800 5 988 -1 188 11 28 -16 49 80 -30 4 374 865 3 509 : : :
EFTA 919 1 495 -577 4 10 -6 1 7 -6 : : : : : :
Iceland 10 8 2 0 0 0 0 1 -1 : : : : : :
Liechtenstein 10 5 5 0 0 0 0 0 0 : : : : : :
Switzerland 641 1 301 -661 4 9 -6 1 6 -5 77 1 76 8 195 -186
Norway 257 182 75 0 0 0 : : : 96 0 96 : : :
Other European countries 262 164 98 4 3 1 1 0 1 : : : : : :
Croatia 17 16 1 : : : : : : : : : : : :
Russia 101 64 37 0 0 0 0 0 0 : : : 1 2 -1
Turkey 39 20 19 1 0 0 0 0 0 : : : : : :
Africa 272 132 140 0 0 0 0 2 -2 102 4 99 0 : :
North African countries 68 50 19 0 0 0 0 0 0 : : : : : :
Egypt 14 18 -4 0 0 0 : : : : : : : : :
Morocco 10 20 -10 0 0 0 : : : : : : : : :
Other African countries 205 81 124 0 0 0 0 2 -2 : : : : : :
Nigeria 20 3 18 0 - 0 : : : : : : : : :
South Africa 66 23 43 0 0 0 : : : 90 1 90 : : :
America 1 970 3 796 -1 826 2 15 -13 24 64 -39 : : : 49 441 -392
Canada 61 68 -6 1 0 0 1 0 0 889 60 829 : 16 :
USA 1 707 3 553 -1 846 1 12 -11 24 63 -40 : : : 49 425 -376
Central American countries 81 46 34 0 1 -1 0 0 0 : : : : : :
Mexico 34 17 17 0 0 0 : : : 280 98 182 : : :
South American countries 117 125 -8 0 2 -2 0 0 0 : : : : : :
Argentina 18 29 -11 0 0 0 : : : 35 51 -16 : : :
Brazil 82 61 20 0 2 -2 0 0 0 341 242 99 : 5 :
Chile 4 8 -5 0 0 0 : : : 17 10 7 : : :
Uruguay 1 16 -15 - 0 0 : : : : : : : : :
Venezuela 4 3 1 0 - 0 : : : 61 31 30 : : :
Asia 1 030 281 749 1 1 1 22 6 16 : : : 29 48 -20
Near & Middle East countries 316 71 245 1 1 0 2 3 -1 : : : : : :
Israel 28 32 -4 0 0 0 : : : 35 1 34 : : :
Other Near & Middle East countries 71 9 63 0 0 0 0 0 0 : : : : : :
Other Asian countries 714 210 504 1 0 0 21 4 17 : : : : : :
China 24 26 -2 0 0 0 8 0 8 123 1 123 2 11 -9
Hong-Kong 52 58 -7 0 0 0 0 0 0 56 5 51 10 3 7
Indonesia 20 1 18 0 0 0 : : : 36 0 36 0 : :
India 97 17 81 0 0 0 0 2 -2 42 1 41 : : :
Japan 308 45 263 0 0 0 2 0 2 792 16 776 : : :
Malaysia 12 8 4 0 0 0 : : : 19 1 18 1 : :
Philippines 5 3 2 - 0 0 : : : 29 3 26 : 1 :
Singapore 79 20 59 0 0 0 : : : 36 2 34 4 7 -3
Thailand 3 5 -1 0 0 0 : : : 31 1 31 : 0 :
Taiwan 4 5 0 0 0 0 : : : 65 25 40 1 1 0
Oceania and Polar regions 213 48 165 0 0 0 0 0 0 : : : 1 5 -5
Australia 194 42 152 0 0 0 0 0 0 487 277 210 0 5 -5
New Zealand 11 5 6 0 0 0 0 0 0 83 : : 0 0 0
OECD countries* 10 433 13 559 -3 126 37 57 -21 : : : : : : 95 905 -810
Central & Eastern Europe countries* 36 54 -17 : : : : : : : : : : : :
Euro-Mediterranean Partnership* 131 130 1 1 0 0 : : : : : : : : :
ACP countries* 177 130 47 0 0 0 : : : : : : : : :
OPEC* 282 116 166 1 0 0 : : : : : : : : :
Maghreb countries* 26 40 -14 0 0 0 : : : : : : : : :
Mashrek countries* 31 24 7 0 0 0 : : : : : : : : :
ASEAN* 129 42 87 0 0 0 : : : : : : 5 8 -4
c: confidential data* see annexes for the composition of economic zones(1) USA data have been harmonized by Eurostat

III
52 European Union international trade in services
Statistical tablesTable 3.2
3.2.16 Geographical breakdown of trade in services for the EU, Croatia, Norway, the USA and JapanYear: 2007Item: Government services, n.i.e.
(Mio EUR)
EU-27 Croatia Norway USA(1) Japan
Credit Debit Net Credit Debit Net Credit Debit Net Credit Debit Net Credit Debit Net
WORLD 17 194 20 193 -2 999 1 49 -48 171 596 -424 14 942 26 590 -11 648 1 501 1 228 273
EXTRA-EU-27 8 305 7 068 1 237 0 21 -21 79 302 -222 : : : : : :
EFTA 116 459 -342 0 2 -2 6 26 -20 : : : : : :
Iceland 5 3 2 : : : 1 2 -1 : : : : : :
Liechtenstein 0 1 -1 : : : 0 0 0 : : : : : :
Switzerland 84 419 -335 0 1 -1 5 25 -19 : : : 8 9 -2
Norway 28 37 -9 - 1 -1 : : : : : : : : :
Other European countries 717 558 159 0 5 -5 3 22 -19 : : : : : :
Croatia 8 26 -18 : : : : : : : : : : : :
Russia 217 123 94 - 1 -1 0 4 -4 : : : 6 37 -30
Turkey 153 84 69 - 1 -1 0 6 -6 : : : : : :
Africa 1 038 1 212 -175 0 2 -2 12 25 -14 : : : 0 29 -29
North African countries 218 144 74 - 1 -1 5 5 0 : : : : : :
Egypt 50 59 -9 - 1 -1 : : : : : : : : :
Morocco 119 42 77 - 0 0 : : : : : : : : :
Other African countries 819 1 069 -250 0 0 0 7 18 -11 : : : : : :
Nigeria 93 32 61 : : : : : : : : : : : :
South Africa 102 60 43 0 0 0 : : : : : : 0 12 -12
America 2 816 2 815 1 0 9 -9 43 149 -106 : : : 1 062 325 737
Canada 128 163 -34 - 1 -1 8 7 2 : : : 6 18 -13
USA 2 286 2 166 120 0 7 -7 34 107 -72 : : : 1 057 306 750
Central American countries 122 160 -38 : : : 0 8 -8 : : : : : :
Mexico 18 31 -13 : : : : : : : : : : 8 :
South American countries 281 328 -48 - 1 -1 0 7 -7 : : : : : :
Argentina 26 79 -53 - 0 0 : : : : : : : : :
Brazil 40 84 -44 - 0 0 0 6 -6 : : : 0 9 -9
Chile 21 45 -24 - 0 0 : : : : : : : : :
Uruguay 6 19 -14 : : : : : : : : : : : :
Venezuela 14 16 -3 - 0 0 : : : : : : : : :
Asia 1 653 1 546 107 - 3 -3 16 72 -56 : : : 269 335 -66
Near & Middle East countries 435 595 -161 - 1 -1 7 25 -18 : : : : : :
Israel 27 63 -36 - 1 -1 : : : : : : : : :
Other Near & Middle East countries 108 187 -78 - 0 0 0 10 -10 : : : : : :
Other Asian countries 1 216 948 268 - 3 -3 9 36 -27 : : : : : :
China 160 104 56 - 1 -1 0 13 -13 : : : 8 58 -50
Hong-Kong 6 20 -14 : : : 0 0 0 : : : 19 56 -37
Indonesia 94 43 51 - 0 0 : : : : : : 2 4 -2
India 199 83 117 - 0 0 0 5 -5 : : : 2 2 0
Japan 30 109 -79 - 1 -1 8 2 6 : : : : : :
Malaysia 15 16 -2 - 0 0 : : : : : : 12 15 -3
Philippines 30 14 15 : : : : : : : : : 18 11 7
Singapore 34 37 -3 : : : : : : : : : 27 107 -80
Thailand 52 36 16 : : : : : : : : : 5 12 -7
Taiwan 40 8 32 : : : : : : : : : 9 12 -3
Oceania and Polar regions 52 75 -23 - 1 -1 0 0 0 : : : 18 55 -37
Australia 25 56 -31 - 1 -1 0 0 0 : : : 11 42 -31
New Zealand 23 5 18 - 0 0 0 0 0 : : : 3 9 -6
OECD countries* 11 559 15 714 -4 155 0 38 -37 : : : : : : 1 335 697 638
Central & Eastern Europe countries* 274 224 50 : : : : : : : : : : : :
Euro-Mediterranean Partnership* 462 515 -53 - 3 -3 : : : : : : : : :
ACP countries* 620 1 200 -580 0 0 0 : : : : : : : : :
OPEC* 622 432 190 - 1 -1 : : : : : : : : :
Maghreb countries* 145 96 48 - 1 -1 : : : : : : : : :
Mashrek countries* 122 221 -99 - 1 -1 : : : : : : : : :
ASEAN* 244 234 10 - 1 -1 : : : : : : 71 162 -91
c: confidential data* see annexes for the composition of economic zones(1) USA data have been harmonized by Eurostat

Trade of EU Member States, Switzerland, Norway, Croatia, Turkey, the USA and Japan with main partners
6

III
54 European Union international trade in services
Statistical tablesTable 3.3
3.3.1 Trade of EU Member States, Switzerland, Norway, Croatia, Turkey, the USA and Japan with main partnersYear: 2007Total services
(Mio EUR)
World Switzerland Russian Federation Canada USA
Credit Debit Net Credit Debit Net Credit Debit Net Credit Debit Net Credit Debit Net
EU-27 1 178 112 1 036 986 141 126 61 503 43 987 17 516 19 238 12 030 7 208 11 695 9 648 2 047 139 135 127 717 11 417
Belgium 57 644 52 821 4 823 3 109 1 707 1 402 217 225 -7 252 239 13 5 483 4 135 1 347
Bulgaria 4 625 3 510 1 115 83 84 -2 300 74 227 15 11 5 134 81 54
Czech Republic 12 482 10 443 2 039 280 282 -2 552 187 366 46 60 -14 496 503 -7
Denmark 44 773 39 212 5 561 1 220 1 040 180 426 316 110 310 192 118 5 750 5 266 484
Germany 158 185 188 717 -30 533 14 615 11 029 3 586 c c 148 1 622 c -348 20 643 20 856 -212
Estonia 3 199 2 237 963 132 19 112 343 151 192 12 5 7 97 69 28
Ireland 65 633 68 549 -2 916 1 296 598 698 1 023 167 856 574 278 296 5 841 23 961 -18 120
Greece 31 337 14 745 16 592 1 735 516 1 219 276 240 36 255 45 210 7 776 2 681 5 095
Spain 94 151 71 999 22 152 5 141 3 498 1 643 647 563 84 586 950 -364 6 953 6 485 468
France 106 268 95 299 10 969 5 364 4 917 447 1 049 1 598 -549 1 547 1 544 3 12 419 9 611 2 808
Italy 81 613 88 591 -6 978 4 913 4 899 14 662 608 54 922 724 198 7 861 7 105 756
Cyprus 6 403 2 733 3 670 90 52 38 451 80 371 16 7 9 545 201 344
Latvia 2 681 1 974 708 176 24 151 166 133 33 26 4 21 143 83 60
Lithuania 2 931 2 471 461 45 16 28 624 378 246 2 2 0 82 61 22
Luxembourg 47 008 27 276 19 732 4 836 4 164 672 79 33 46 76 52 23 2 298 1 793 505
Hungary 12 443 11 393 1 050 341 344 -3 217 154 63 100 59 42 862 1 501 -640
Malta 2 464 1 614 850 49 21 28 32 5 27 7 41 -34 94 71 23
Netherlands 81 534 71 721 9 813 2 693 2 781 -87 1 162 554 608 652 504 148 7 569 9 296 -1 728
Austria 40 370 28 407 11 963 2 353 1 199 1 154 703 625 78 134 113 21 1 291 885 406
Poland 20 884 17 500 3 385 933 524 409 722 388 334 119 66 53 1 229 1 337 -108
Portugal 16 852 10 164 6 687 723 807 -85 46 26 20 155 65 90 857 607 250
Romania 7 632 7 403 228 340 221 119 68 179 -110 106 94 12 502 289 213
Slovenia 4 291 3 098 1 193 112 94 17 69 91 -22 6 63 -57 73 105 -32
Slovakia 5 134 4 745 388 116 114 2 556 100 456 14 12 2 162 184 -22
Finland 16 829 16 082 747 337 283 54 2 708 1 141 1 567 137 210 -73 511 1 662 -1 151
Sweden 46 315 34 915 11 400 1 839 699 1 140 652 288 364 521 377 144 4 780 4 842 -62
United Kingdom 204 049 147 098 56 951 8 638 3 973 4 664 2 877 1 263 1 615 3 482 1 960 1 523 44 685 24 013 20 672
EU institutions 384 12 268 -11 884 : : : : : : : : : : : :
Switzerland 48 415 21 541 26 873 : : : : : : : : : : : :
Norway 29 540 28 910 630 768 455 313 12 38 -26 406 299 107 8 224 4 409 3 815
Croatia 9 151 2 857 6 294 325 102 223 104 50 53 68 36 32 240 180 60
Turkey 21 055 10 925 10 130 : : : : : : : : : : : :
USA (1) 359 837 275 895 83 942 10 365 6 414 3 950 : : : 31 575 18 353 13 221 : : :
Japan 94 212 109 717 -15 505 1 264 2 123 -859 370 346 24 1 532 1 215 317 25 493 31 431 -5 938(1) USA data have been harmonized by Eurostatc: confidential data* China excl. Hong Kong

Statistical tablesTable 3.3 III
55 European Union international trade in services
3.3.1 Trade of EU Member States, Switzerland, Norway, Croatia, Turkey, the USA and Japan with main partners Year: 2007Total services
(Mio EUR)
Brazil China* Hong Kong India Japan
Credit Debit Net Credit Debit Net Credit Debit Net Credit Debit Net Credit Debit Net
6 417 4 791 1 626 17 766 13 769 3 996 8 234 8 135 99 9 555 7 020 2 535 19 378 13 805 5 573 EU-27
171 134 37 588 354 234 491 762 -271 220 178 42 1 008 386 622 Belgium
14 2 12 4 13 -9 2 5 -3 4 2 2 20 6 14 Bulgaria
7 12 -5 33 283 -250 19 12 7 16 17 -1 81 250 -170 Czech Republic
580 229 351 1 948 824 1 124 607 537 70 635 332 303 1 144 913 230 Denmark
1 051 c 277 3 219 c 151 1 140 1 943 -803 1 208 c -125 3 597 2 542 1 055 Germany
1 1 0 5 25 -20 14 12 2 1 3 -2 6 7 -2 Estonia
100 12 88 2 127 126 2 001 181 132 49 359 89 270 888 569 319 Ireland
69 27 43 153 245 -92 466 103 363 c c 34 150 76 74 Greece
568 498 70 194 1 210 -1 016 103 200 -97 100 288 -188 424 605 -181 Spain
517 659 -142 2 376 2 381 -5 755 858 -103 1 009 615 394 1 268 1 607 -339 France
558 648 -90 418 1 151 -733 202 461 -259 394 359 35 981 737 244 Italy
1 14 -14 12 36 -24 7 5 2 9 6 3 33 29 4 Cyprus
9 0 9 1 24 -23 3 3 0 0 7 -7 1 4 -3 Latvia
0 1 -1 1 24 -23 2 3 -1 6 1 5 2 4 -2 Lithuania
94 28 66 217 83 134 554 204 350 22 32 -10 928 359 569 Luxembourg
90 14 76 53 48 4 15 53 -38 22 17 5 627 226 401 Hungary
1 2 -1 5 12 -7 0 2 -2 1 3 -3 12 5 8 Malta
1 196 775 422 1 148 1 117 31 1 079 542 537 554 536 18 1 080 741 339 Netherlands
50 70 -20 409 248 161 149 226 -77 124 135 -11 242 146 96 Austria
5 7 -2 28 137 -109 19 25 -6 43 26 17 61 126 -66 Poland
563 351 212 9 35 -27 c c c 27 21 6 45 39 5 Portugal
2 5 -4 20 35 -15 8 8 0 12 7 5 26 4 22 Romania
1 1 0 3 5 -3 5 7 -2 2 3 -1 7 1 6 Slovenia
0 1 -1 2 21 -19 2 33 -31 4 2 3 11 12 -1 Slovakia
17 34 -17 2 152 442 1 710 37 27 10 c c 1 799 235 163 73 Finland
130 74 55 658 359 298 172 264 -92 246 124 122 319 289 30 Sweden
625 412 213 1 986 1 463 523 2 185 1 686 498 2 437 2 614 -177 6 180 3 944 2 236 United Kingdom
: : : : : : : : : : : : : : : EU institutions
: : : : : : : : : : : : : : : Switzerland
103 60 43 30 64 -34 142 147 -5 26 37 -11 598 255 343 Norway
6 4 2 7 7 1 4 7 -3 4 5 -1 11 3 8 Croatia
: : : : : : : : : : : : : : : Turkey
7 241 2 956 4 285 : : : 4 239 5 065 -827 6 936 7 051 -115 30 028 19 120 10 908 USA (1)
435 190 245 5 956 5 945 11 200 4 347 -4 148 857 407 450 : : : Japan (1) USA data have been harmonized by Eurostat
c: confidential data* China excl. Hong Kong

III
56 European Union international trade in services
Statistical tablesTable 3.3
3.3.2 Trade of EU Member States, Switzerland, Norway, Croatia, Turkey, the USA and Japan with main partnersYear: 2007Transportation
(Mio EUR)
World Switzerland Russian Federation Canada USA
Credit Debit Net Credit Debit Net Credit Debit Net Credit Debit Net Credit Debit Net
EU-27 252 312 239 947 12 365 10 192 7 405 2 788 3 998 5 624 -1 626 3 267 2 131 1 136 30 225 18 776 11 449
Belgium 18 106 14 878 3 228 1 260 590 670 57 49 8 142 65 77 744 542 201
Bulgaria 1 385 1 186 198 9 14 -6 154 10 144 3 3 -1 17 13 4
Czech Republic 3 668 2 634 1 034 40 22 18 219 77 141 4 8 -4 62 61 0
Denmark 29 087 21 133 7 954 971 618 352 205 245 -40 232 124 108 4 408 2 869 1 539
Germany 37 508 44 991 -7 482 1 511 1 150 361 441 897 -456 834 691 143 4 046 3 591 455
Estonia 1 309 925 384 93 3 90 146 83 63 1 1 -1 30 23 7
Ireland 2 566 2 048 518 15 96 -81 0 0 0 8 17 -9 169 336 -167
Greece 16 939 7 771 9 168 c c 985 c c -123 c c 23 6 788 2 132 4 656
Spain 15 689 17 993 -2 304 355 424 -69 c c c 100 76 24 980 933 47
France 24 359 27 459 -3 100 733 858 -125 304 1 139 -835 386 218 168 2 882 2 203 679
Italy 12 860 19 928 -7 068 368 947 -579 110 225 -115 192 138 54 955 575 380
Cyprus 1 543 882 662 3 8 -5 86 20 66 7 2 5 208 53 155
Latvia 1 350 576 774 151 6 146 96 61 34 23 3 20 96 21 74
Lithuania 1 709 1 141 568 29 4 24 448 244 204 1 1 0 51 31 20
Luxembourg 2 505 1 266 1 238 c c c c c c c c c c c c
Hungary 2 385 2 262 123 72 75 -2 45 20 25 17 12 5 85 88 -3
Malta 317 217 100 c c 2 c c 3 c c 0 6 16 -10
Netherlands 20 040 15 182 4 858 871 860 11 -3 320 -324 286 102 183 1 616 1 074 542
Austria 8 753 8 746 7 420 333 87 100 434 -334 46 43 3 222 232 -10
Poland 6 708 4 112 2 596 402 47 355 406 211 195 49 10 39 613 373 239
Portugal 4 284 3 218 1 066 249 158 90 c c c c c c 301 181 120
Romania 1 849 2 385 -536 99 45 54 54 175 -121 63 40 24 30 15 15
Slovenia 1 259 734 525 42 16 26 7 4 3 1 39 -38 14 13 1
Slovakia 1 638 1 336 301 20 26 -7 516 47 469 0 1 -1 30 40 -10
Finland 2 376 4 146 -1 770 16 40 -24 110 452 -342 c c -50 85 171 -85
Sweden 8 086 5 542 2 543 392 106 286 165 111 54 235 65 170 1 068 308 760
United Kingdom 24 033 27 232 -3 199 443 552 -110 164 219 -56 517 342 175 4 533 2 811 1 721
EU institutions 0 22 -22 : : : : : : : : : : : :
Switzerland 3 987 2 632 1 355 : : : : : : : : : : : :
Norway 13 874 9 573 4 301 453 136 317 9 25 -15 191 229 -38 4 281 1 575 2 706
Croatia 1 084 631 453 56 12 44 4 1 4 10 22 -12 53 16 37
Turkey 4 512 4 757 -244 : : : : : : : : : : : :
USA (1) 56 309 69 709 -13 399 730 959 -229 : : : 4 919 3 878 1 040 : : :
Japan 30 661 35 780 -5 120 498 498 0 140 121 19 359 262 97 5 858 4 019 1 839(1) USA data have been harmonized by Eurostatc: confidential data* China excl. Hong Kong

Statistical tablesTable 3.3 III
57 European Union international trade in services
3.3.2 Trade of EU Member States, Switzerland, Norway, Croatia, Turkey, the USA and Japan with main partners Year: 2007Transportation
(Mio EUR)
Brazil China* Hong Kong India Japan
Credit Debit Net Credit Debit Net Credit Debit Net Credit Debit Net Credit Debit Net
2 320 1 577 743 5 513 6 567 -1 054 3 707 3 573 134 2 743 1 544 1 198 5 038 4 854 184 EU-27
124 49 75 465 206 259 415 595 -179 162 47 116 221 158 64 Belgium
1 1 0 2 4 -2 1 3 -2 1 1 1 3 1 2 Bulgaria
4 9 -5 23 272 -248 17 9 8 9 10 -1 15 68 -53 Czech Republic
545 188 357 1 710 650 1 060 523 487 35 598 216 382 918 818 100 Denmark
401 179 222 1 248 809 439 695 1 190 -495 583 203 380 1 343 1 124 218 Germany
0 1 0 3 22 -19 2 11 -9 0 2 -1 1 5 -4 Estonia
0 0 0 0 0 0 0 0 0 0 0 0 4 58 -54 Ireland
c c 23 c c -39 c c 357 c c 35 c c 60 Greece
180 187 -7 84 945 -861 c c c c c c 58 313 -255 Spain
285 322 -37 694 1 341 -647 263 269 -6 248 184 64 704 831 -127 France
114 75 39 98 351 -253 74 222 -148 208 54 154 288 409 -121 Italy
0 14 -14 7 32 -25 5 2 3 0 3 -3 28 26 2 Cyprus
9 0 9 1 19 -16 3 1 0 0 1 -1 0 1 -1 Latvia
0 1 -1 0 23 -22 2 2 0 0 1 -1 0 3 -3 Lithuania
c c c c c c c c c c c c c c c Luxembourg
2 1 1 21 31 -10 7 43 -35 1 2 -1 21 25 -5 Hungary
c c -2 c c -9 c c -2 c c -2 c c -3 Malta
94 242 -148 164 650 -486 346 195 150 103 65 37 332 361 -28 Netherlands
7 32 -25 44 145 -101 91 148 -57 65 63 2 121 93 28 Austria
2 3 -1 19 100 -81 11 19 -8 9 8 1 10 21 -10 Poland
352 138 214 c c c c c c c c c c c c Portugal
0 4 -4 11 3 8 4 5 -2 5 3 2 1 1 0 Romania
0 0 0 1 1 0 4 1 3 0 0 0 1 0 1 Slovenia
0 0 0 0 16 -16 1 3 -2 3 1 3 0 4 -4 Slovakia
c c -20 c c -100 c c 22 c c 1 c c 75 Finland
39 17 22 18 66 -47 10 6 4 10 11 -2 15 54 -39 Sweden
118 76 42 592 469 123 479 213 266 593 497 96 666 319 348 United Kingdom
: : : : : : : : : : : : : : : EU institutions
: : : : : : : : : : : : : : : Switzerland
85 49 36 5 39 -34 99 102 -3 18 26 -7 439 183 256 Norway
0 0 0 0 3 -2 2 5 -3 2 0 2 4 0 3 Croatia
: : : : : : : : : : : : : : : Turkey
1 250 567 683 2 387 2 971 -584 1 127 2 493 -1 367 1 108 401 707 5 479 5 774 -295 USA (1)
141 27 114 2 862 2 280 582 1 970 2 608 -638 196 76 120 : : : Japan (1) USA data have been harmonized by Eurostat
c: confidential data* China excl. Hong Kong

III
58 European Union international trade in services
Statistical tablesTable 3.3
3.3.3 Trade of EU Member States, Switzerland, Norway, Croatia, Turkey, the USA and Japan with main partnersYear: 2007Sea transport
(Mio EUR)
World Switzerland Russian Federation Canada USA
Credit Debit Net Credit Debit Net Credit Debit Net Credit Debit Net Credit Debit Net
EU-27 109 134 95 852 13 282 4 654 3 283 1 370 713 3 175 -2 462 1 341 971 371 18 169 9 794 8 375
Belgium 9 290 6 095 3 195 594 355 240 21 16 5 133 40 93 389 199 190
Bulgaria 94 426 -332 2 6 -4 3 3 0 1 1 0 4 4 1
Czech Republic 40 132 -93 1 5 -4 0 0 0 1 0 0 4 2 2
Denmark 23 106 16 974 6 132 867 554 313 139 229 -90 222 118 104 4 131 2 683 1 448
Germany 19 547 16 096 3 451 837 281 556 129 562 -432 540 387 153 2 499 2 012 487
Estonia 625 389 237 23 0 22 23 21 1 0 0 0 15 10 5
Ireland - - - - - - 0 0 0 0 - - - - -
Greece 15 679 5 427 10 252 c c 1 032 c c -14 c c 3 c c 4 769
Spain 2 347 4 729 -2 382 c c c c c c c c c c c c
France 6 778 10 331 -3 553 298 341 -43 17 885 -868 87 39 48 478 484 -6
Italy 5 013 8 201 -3 188 135 553 -418 19 151 -132 12 87 -75 83 135 -52
Cyprus 1 023 559 464 2 6 -4 74 18 56 7 1 6 194 48 146
Latvia 518 137 380 66 0 66 16 6 10 0 1 0 33 6 27
Lithuania 165 282 -117 0 0 0 4 92 -88 0 0 0 11 15 -4
Luxembourg 59 75 -16 c c c c c c c c c c c c
Hungary 22 81 -59 0 3 -2 0 0 0 0 0 0 4 1 3
Malta 123 138 -15 c c 0 c c -1 c c 0 3 10 -7
Netherlands 6 900 5 765 1 135 218 621 -403 -21 12 -33 62 27 35 671 453 218
Austria c c c c c c c c c c c c c c c
Poland 889 984 -96 26 9 17 11 14 -3 5 1 4 219 175 44
Portugal 569 1 195 -627 c c c c c c c c c c c c
Romania 287 617 -330 38 16 22 1 48 -47 0 0 0 9 5 4
Slovenia 216 179 38 16 0 15 0 0 0 0 0 0 6 3 3
Slovakia 4 66 -62 0 1 -1 0 0 0 0 0 0 0 13 -13
Finland 1 311 2 974 -1 663 0 17 -17 42 367 -325 20 27 -7 25 68 -43
Sweden 3 589 3 006 583 10 14 -4 142 104 38 162 60 101 778 252 525
United Kingdom 10 166 8 725 1 441 107 79 28 34 158 -124 37 108 -72 1 559 644 915
EU institutions : : : : : : : : : : : : : : :
Switzerland : : : : : : : : : : : : : : :
Norway 10 680 6 710 3 970 415 102 312 7 24 -18 123 181 -58 3 817 1 335 2 482
Croatia 422 113 309 31 4 27 0 0 0 0 0 0 16 3 13
Turkey 546 3 386 -2 840 : : : : : : : : : : : :
USA (1) 3 993 26 698 -22 705 : : : : : : : : : : : :
Japan 23 292 25 297 -2 005 : : : : : : : : : : : :(1) USA data have been harmonized by Eurostatc: confidential data* China excl. Hong Kong

Statistical tablesTable 3.3 III
59 European Union international trade in services
3.3.3 Trade of EU Member States, Switzerland, Norway, Croatia, Turkey, the USA and Japan with main partners Year: 2007Sea transport
(Mio EUR)
Brazil China* Hong Kong India Japan
Credit Debit Net Credit Debit Net Credit Debit Net Credit Debit Net Credit Debit Net
1 160 799 361 3 809 4 013 -204 2 333 2 242 91 1 202 754 449 2 722 3 468 -746 EU-27
111 45 66 451 157 293 406 401 5 142 38 104 195 139 56 Belgium
1 1 0 1 3 -2 0 2 -2 0 1 -1 1 1 0 Bulgaria
0 0 0 2 4 -1 2 2 1 0 0 0 1 2 0 Czech Republic
539 187 352 1 690 618 1 072 510 437 73 591 205 385 895 799 96 Denmark
285 119 166 726 371 355 479 711 -232 233 88 145 834 675 159 Germany
0 0 0 1 11 -11 0 8 -8 0 1 -1 0 3 -3 Estonia
0 0 0 0 0 0 0 0 0 0 0 0 - - - Ireland
c c 27 c c 5 c c 371 c c 45 116 48 69 Greece
c c c c c c c c c c c c c c c Spain
62 158 -96 192 944 -752 59 83 -24 62 92 -30 132 557 -425 France
6 15 -9 46 205 -159 33 135 -102 8 11 -3 67 315 -248 Italy
0 9 -9 7 23 -16 5 1 3 0 2 -2 28 21 7 Cyprus
9 0 9 1 16 -14 1 0 0 0 1 -1 0 1 -1 Latvia
0 1 -1 0 19 -19 0 1 -1 0 1 -1 0 2 -2 Lithuania
c c c c c c c c c c c c c c c Luxembourg
0 0 0 1 3 -3 1 1 0 0 0 0 3 10 -7 Hungary
c c -1 c c -7 c c -1 c c -1 c c -3 Malta
12 30 -18 20 112 -92 124 122 2 18 31 -12 98 302 -203 Netherlands
c c c c c c c c c c c c c c c Austria
0 1 0 5 47 -43 5 12 -7 1 1 0 3 10 -7 Poland
c c c c c c c c c c c c c c c Portugal
0 1 -1 11 1 10 3 2 2 1 1 0 0 0 0 Romania
0 0 0 0 1 0 1 0 1 0 0 0 1 0 1 Slovenia
0 0 0 0 1 -1 0 1 -1 0 0 0 0 0 0 Slovakia
0 20 -20 0 162 -162 0 3 -3 0 7 -7 c c -45 Finland
30 16 13 11 55 -44 4 5 -1 7 8 -1 9 49 -40 Sweden
34 37 -3 441 362 79 172 121 51 56 158 -102 279 189 91 United Kingdom
: : : : : : : : : : : : : : : EU institutions
: : : : : : : : : : : : : : : Switzerland
85 49 36 5 39 -34 89 98 -9 18 25 -7 390 180 209 Norway
0 0 0 0 1 -1 2 1 1 2 0 2 3 0 3 Croatia
: : : : : : : : : : : : : : : Turkey
: : : : : : : : : : : : : : : USA (1)
: : : : : : : : : : : : : : : Japan (1) USA data have been harmonized by Eurostat
c: confidential data* China excl. Hong Kong

III
60 European Union international trade in services
Statistical tablesTable 3.3
3.3.4 Trade of EU Member States, Switzerland, Norway, Croatia, Turkey, the USA and Japan with main partnersYear: 2007Air transport
(Mio EUR)
World Switzerland Russian Federation Canada USA
Credit Debit Net Credit Debit Net Credit Debit Net Credit Debit Net Credit Debit Net
EU-27 77 606 67 642 9 963 2 357 2 111 245 814 655 159 1 713 999 713 10 057 7 535 2 523
Belgium 2 651 3 089 -438 353 76 277 10 6 3 5 22 -17 248 284 -36
Bulgaria 225 227 -2 2 3 -1 9 3 6 1 2 -2 4 4 1
Czech Republic 915 582 333 3 4 -1 3 2 1 2 4 -2 25 20 5
Denmark 2 628 1 379 1 248 52 14 38 26 1 25 4 2 2 214 132 82
Germany 12 276 10 255 2 022 366 428 -62 119 179 -60 265 236 29 1 298 1 238 60
Estonia 144 179 -35 0 1 -1 8 5 2 c 1 c 6 9 -3
Ireland - - - - - - 0 0 0 - - - - - -
Greece 845 450 396 57 c c c c c c c c 94 c c
Spain 8 532 5 779 2 753 c c c c c c c c c c c c
France 11 051 11 011 40 134 320 -186 157 146 11 284 168 116 1 865 1 504 361
Italy 4 921 6 412 -1 491 99 172 -73 57 38 19 173 51 122 839 440 399
Cyprus 492 317 175 1 2 -1 3 2 1 0 1 -1 11 5 7
Latvia 200 190 10 3 1 1 9 6 3 13 1 11 7 13 -6
Lithuania 54 55 -1 1 1 0 1 3 -2 0 0 0 0 2 -2
Luxembourg 1 686 556 1 130 c c c c c c c c c c c c
Hungary 970 795 175 18 49 -31 11 10 1 16 7 9 32 29 4
Malta c c 117 c c 3 c c 4 c c 0 c c -2
Netherlands 6 185 2 834 3 351 121 38 83 29 44 -15 206 50 157 787 473 314
Austria c c c c c c c c c c c c c c c
Poland 877 816 61 15 16 -2 34 13 21 37 6 31 236 166 70
Portugal 2 699 1 356 1 343 c c c c c c c c c c c c
Romania 386 266 119 7 13 -6 0 8 -7 58 35 23 14 5 9
Slovenia 136 107 29 7 2 5 3 0 3 1 38 -38 7 2 5
Slovakia 256 226 30 1 6 -5 0 1 -1 0 0 0 26 21 5
Finland 930 c c c c c c c c c c c c c c
Sweden 1 893 1 730 162 17 71 -54 10 5 5 0 0 0 23 34 -11
United Kingdom 11 826 15 424 -3 598 313 305 7 130 61 69 465 234 231 2 943 2 167 776
EU institutions : : : : : : : : : : : : : : :
Switzerland : : : : : : : : : : : : : : :
Norway 418 1 355 -937 0 28 -28 0 0 0 53 44 8 166 171 -4
Croatia 324 149 175 7 6 1 4 0 3 10 22 -12 34 8 26
Turkey 2 951 1 173 1 778 : : : : : : : : : : : :
USA (1) 26 451 24 842 1 609 : : : : : : : : : : : :
Japan 7 365 10 378 -3 013 : : : : : : : : : : : :(1) USA data have been harmonized by Eurostatc: confidential data* China excl. Hong Kong

Statistical tablesTable 3.3 III
61 European Union international trade in services
3.3.4 Trade of EU Member States, Switzerland, Norway, Croatia, Turkey, the USA and Japan with main partners Year: 2007Air transport
(Mio EUR)
Brazil China* Hong Kong India Japan
Credit Debit Net Credit Debit Net Credit Debit Net Credit Debit Net Credit Debit Net
1 046 503 543 1 427 1 624 -197 1 285 904 381 1 365 683 682 2 102 860 1 243 EU-27
7 1 6 5 21 -17 2 179 -177 15 6 9 9 9 1 Belgium
0 0 0 0 1 -1 1 0 1 0 0 0 1 0 1 Bulgaria
2 3 0 13 63 -50 12 5 8 4 2 2 6 7 0 Czech Republic
3 1 2 13 18 -5 8 31 -23 4 8 -4 19 17 2 Denmark
91 50 41 426 222 203 196 173 22 302 92 211 463 153 310 Germany
c c c 2 10 -8 1 1 0 0 1 -1 c c -1 Estonia
0 0 0 0 0 0 0 0 0 0 0 0 0 - - Ireland
c c c c c c c c c c c c 2 c c Greece
c c c c c c c c c c c c c c c Spain
190 155 35 406 380 26 194 169 25 118 87 31 490 259 231 France
106 60 46 51 146 -95 41 87 -46 199 43 156 216 94 122 Italy
0 5 -5 0 9 -9 0 1 -1 0 1 -1 0 5 -5 Cyprus
0 0 0 0 3 -3 0 1 -1 0 0 0 0 0 0 Latvia
0 0 0 0 3 -3 2 1 2 0 0 0 0 1 -1 Lithuania
c c c c c c c c c c c c c c c Luxembourg
1 0 1 15 19 -4 2 35 -33 1 1 -1 5 3 2 Hungary
c c 0 c c -1 c c -1 c c -1 c c 0 Malta
70 30 40 135 486 -351 217 72 145 64 32 32 231 53 178 Netherlands
c c c c c c c c c c c c c c c Austria
1 1 0 7 9 -1 2 2 -1 7 1 6 4 2 2 Poland
c c c c c c c c c c c c c c c Portugal
0 1 -1 0 0 0 0 0 0 0 0 0 0 0 0 Romania
0 0 0 0 0 0 3 1 2 0 0 0 0 0 0 Slovenia
0 0 0 0 2 -2 0 1 -1 3 0 3 0 0 0 Slovakia
c c c c c c c c c c c c c c c Finland
1 0 1 6 3 3 0 0 0 1 1 0 5 5 1 Sweden
85 39 45 146 107 39 298 92 206 533 339 194 378 130 248 United Kingdom
: : : : : : : : : : : : : : : EU institutions
: : : : : : : : : : : : : : : Switzerland
0 0 0 0 0 0 0 2 -2 0 0 0 0 0 0 Norway
0 0 0 0 1 -1 1 4 -4 0 0 0 0 0 0 Croatia
: : : : : : : : : : : : : : : Turkey
: : : : : : : : : : : : : : : USA (1)
: : : : : : : : : : : : : : : Japan (1) USA data have been harmonized by Eurostat
c: confidential data* China excl. Hong Kong

III
62 European Union international trade in services
Statistical tablesTable 3.3
3.3.5 Trade of EU Member States, Switzerland, Norway, Croatia, Turkey, the USA and Japan with main partnersYear: 2007Other transportation
(Mio EUR)
World Switzerland Russian Federation Canada USA
Credit Debit Net Credit Debit Net Credit Debit Net Credit Debit Net Credit Debit Net
EU-27 65 573 76 455 -10 882 3 184 2 009 1 175 2 473 1 792 681 213 157 56 1 995 1 446 549
Belgium 6 165 5 694 470 313 159 154 27 27 -1 4 3 1 107 59 48
Bulgaria 1 066 533 532 6 6 -1 143 4 139 2 1 1 9 5 4
Czech Republic 2 713 1 920 794 36 13 24 215 75 140 2 4 -2 32 39 -7
Denmark 3 354 2 780 574 51 50 1 41 16 26 6 4 2 63 54 9
Germany 5 685 18 640 -12 955 309 442 -133 193 156 37 29 68 -39 249 341 -92
Estonia 540 358 182 70 1 69 116 56 59 c 0 c 9 4 5
Ireland 0 - - 0 - - 0 0 0 c c 0 0 - -
Greece 415 1 895 -1 480 18 c c c c c c c c c c c
Spain 4 810 7 486 -2 676 c c c c c c c c c c c c
France 6 530 6 117 413 301 197 104 131 108 23 15 11 4 539 215 324
Italy 2 926 5 315 -2 389 134 222 -88 34 36 -2 7 0 7 33 0 33
Cyprus 29 6 23 0 0 0 9 0 9 0 0 0 2 1 1
Latvia 631 249 383 81 3 79 70 49 21 10 0 10 56 3 54
Lithuania 1 490 804 686 27 3 24 443 149 294 1 0 1 40 13 27
Luxembourg 759 635 124 c c c c c c c c c c c c
Hungary 1 393 1 385 7 54 23 31 34 10 23 1 5 -4 48 57 -9
Malta c c -1 0 0 0 0 0 0 0 0 0 c c 0
Netherlands 6 955 6 582 373 532 201 331 -11 264 -275 17 26 -9 159 149 10
Austria c c c c c c c c c c c c c c c
Poland 4 942 2 312 2 630 361 21 340 361 183 177 7 3 4 157 32 125
Portugal 1 016 667 349 c c c c c c c c c c c c
Romania 1 176 1 502 -326 54 16 38 53 120 -67 5 4 1 6 5 2
Slovenia 906 448 458 19 14 5 3 3 0 0 0 0 1 7 -6
Slovakia 1 378 1 045 333 19 19 -1 516 46 470 0 1 0 4 6 -2
Finland 136 c c c c c c c c c c c c c c
Sweden 2 603 806 1 798 365 21 344 13 2 11 73 4 69 267 22 246
United Kingdom 2 041 3 083 -1 042 23 168 -145 0 0 0 16 0 16 31 0 31
EU institutions : : : : : : : : : : : : : : :
Switzerland : : : : : : : : : : : : : : :
Norway 2 776 1 508 1 269 38 6 33 3 0 3 15 3 12 297 69 228
Croatia 338 369 -31 18 2 16 0 0 0 0 0 0 3 4 -1
Turkey 1 016 198 817 : : : : : : : : : : : :
USA (1) 25 865 18 169 7 696 : : : : : : : : : : : :
Japan 4 105 -101 : : : : : : : : : : : :(1) USA data have been harmonized by Eurostatc: confidential data* China excl. Hong Kong

Statistical tablesTable 3.3 III
63 European Union international trade in services
3.3.5 Trade of EU Member States, Switzerland, Norway, Croatia, Turkey, the USA and Japan with main partners Year: 2007Other transportation
(Mio EUR)
Brazil China* Hong Kong India Japan
Credit Debit Net Credit Debit Net Credit Debit Net Credit Debit Net Credit Debit Net
116 275 -160 281 930 -649 89 425 -336 175 107 68 212 526 -315 EU-27
6 3 3 10 27 -18 7 14 -7 5 2 3 17 10 7 Belgium
1 0 1 1 1 0 0 0 0 1 0 1 1 0 1 Bulgaria
2 6 -5 8 205 -197 3 3 0 5 9 -3 8 60 -52 Czech Republic
3 1 2 7 14 -7 4 20 -16 3 2 1 4 2 2 Denmark
25 9 15 96 216 -120 20 306 -286 48 23 25 45 296 -250 Germany
c c c 0 0 0 1 1 -1 0 0 0 c c 0 Estonia
0 0 0 0 0 0 0 0 0 0 0 0 c - - Ireland
0 c c 2 c c 1 c c 1 c c c 11 c Greece
c c c c c c c c c c c c c c c Spain
34 9 25 97 16 81 10 17 -7 68 6 62 81 15 66 France
2 0 2 1 0 1 0 0 0 1 0 1 5 0 5 Italy
0 0 0 0 0 0 0 0 0 0 0 0 0 0 0 Cyprus
0 0 0 0 0 0 1 0 0 0 0 0 0 0 0 Latvia
0 0 0 0 1 -1 0 1 -1 0 0 0 0 0 0 Lithuania
c c c c c c c c c c c c c c c Luxembourg
0 0 0 5 9 -4 4 7 -2 0 0 0 13 12 0 Hungary
0 0 0 0 0 0 0 0 0 0 0 0 0 0 0 Malta
13 182 -170 9 52 -43 5 2 4 20 2 18 3 6 -3 Netherlands
c c c c c c c c c c c c c c c Austria
1 2 -1 7 44 -38 3 4 -1 2 7 -5 3 9 -6 Poland
c c c c c c c c c c c c c c c Portugal
0 2 -2 0 2 -2 0 4 -3 4 2 2 0 1 -1 Romania
0 0 0 0 0 0 0 0 0 0 0 0 0 0 0 Slovenia
0 0 0 0 13 -13 1 0 0 0 1 -1 0 4 -4 Slovakia
0 c c 0 c c 0 c c 0 c c 0 c c Finland
8 0 8 1 8 -7 6 1 4 1 2 0 1 1 0 Sweden
0 0 0 4 0 4 9 0 9 4 0 4 9 0 9 United Kingdom
: : : : : : : : : : : : : : : EU institutions
: : : : : : : : : : : : : : : Switzerland
0 0 0 0 0 0 10 1 9 0 0 0 50 3 47 Norway
0 0 0 0 0 0 0 0 0 0 0 0 0 0 0 Croatia
: : : : : : : : : : : : : : : Turkey
: : : : : : : : : : : : : : : USA (1)
: : : : : : : : : : : : : : : Japan (1) USA data have been harmonized by Eurostat
c: confidential data* China excl. Hong Kong

III
64 European Union international trade in services
Statistical tablesTable 3.3
3.3.6 Trade of EU Member States, Switzerland, Norway, Croatia, Turkey, the USA and Japan with main partnersYear: 2007Travel
(Mio EUR)
World Switzerland Russian Federation Canada USA
Credit Debit Net Credit Debit Net Credit Debit Net Credit Debit Net Credit Debit Net
EU-27 266 792 260 703 6 089 10 804 7 382 3 422 3 975 1 762 2 213 3 254 3 193 60 19 346 16 870 2 476
Belgium 7 939 12 583 -4 645 72 158 -86 33 42 -9 29 55 -26 232 387 -155
Bulgaria 2 287 1 332 955 12 13 -1 124 12 112 6 4 2 34 24 10
Czech Republic 4 828 2 645 2 183 36 36 0 266 3 263 24 29 -5 195 133 62
Denmark 4 534 6 386 -1 852 43 34 8 19 35 -16 28 20 9 217 372 -154
Germany 26 289 60 619 -34 331 2 691 2 512 179 c c c c c c 2 234 2 717 -483
Estonia 754 487 267 2 4 -2 116 32 84 2 2 0 14 15 -1
Ireland 4 426 6 389 -1 963 66 0 66 0 0 0 61 0 61 793 1 054 -261
Greece 11 320 2 487 8 833 c c 216 c c 184 c c 191 c c 642
Spain 42 171 14 360 27 811 744 219 525 c c c 271 628 -357 2 716 1 354 1 362
France 39 568 26 781 12 787 2 889 1 440 1 449 123 193 -70 649 687 -38 2 044 977 1 067
Italy 31 091 19 892 11 199 2 183 1 106 1 077 377 218 159 493 155 338 3 657 1 688 1 969
Cyprus 1 955 1 071 885 34 8 26 152 36 116 4 3 1 17 60 -43
Latvia 490 677 -187 6 10 -4 53 56 -3 1 0 1 10 24 -14
Lithuania 839 834 5 1 2 -1 147 109 38 1 0 1 5 2 3
Luxembourg 2 919 2 592 327 c c c c c c c c c c c c
Hungary 3 449 2 147 1 302 62 56 6 17 12 5 51 21 31 180 116 64
Malta 664 272 392 c c 9 c c 15 c c 4 c c 7
Netherlands 9 710 13 912 -4 203 128 203 -74 74 50 24 85 113 -29 633 760 -127
Austria 13 780 7 702 6 078 599 209 390 226 43 183 42 38 4 344 186 158
Poland 7 686 5 654 2 032 27 50 -23 141 31 110 44 24 20 188 222 -34
Portugal 7 393 2 858 4 535 145 51 94 26 7 19 92 29 63 295 108 187
Romania 1 066 1 114 -47 9 18 -9 9 1 8 14 21 -7 60 94 -35
Slovenia 1 811 831 980 17 4 14 21 2 19 3 0 3 16 3 14
Slovakia 1 473 1 117 356 30 8 22 29 12 16 7 3 5 36 32 4
Finland 2 070 2 907 -838 38 33 5 542 127 415 15 16 -2 93 165 -73
Sweden 8 770 10 186 -1 417 126 102 24 0 0 0 126 44 82 590 605 -15
United Kingdom 27 510 52 836 -25 327 564 963 -399 412 164 248 850 836 15 3 960 5 630 -1 670
EU institutions 0 32 -32 : : : : : : : : : : : :
Switzerland 8 902 7 486 1 416 : : : : : : : : : : : :
Norway 3 069 10 242 -7 172 46 0 46 0 0 0 31 0 31 276 717 -441
Croatia 6 734 717 6 017 208 5 203 90 11 79 52 6 46 113 59 54
Turkey 13 489 2 379 11 111 : : : : : : : : : : : :
USA (1) 86 992 59 170 27 823 703 534 169 : : : 10 318 5 437 4 881 : : :
Japan 6 819 19 344 -12 525 20 163 -142 48 52 -4 124 428 -304 616 5 109 -4 492(1) USA data have been harmonized by Eurostatc: confidential data* China excl. Hong Kong

Statistical tablesTable 3.3 III
65 European Union international trade in services
3.3.6 Trade of EU Member States, Switzerland, Norway, Croatia, Turkey, the USA and Japan with main partners Year: 2007Travel
(Mio EUR)
Brazil China* Hong Kong India Japan
Credit Debit Net Credit Debit Net Credit Debit Net Credit Debit Net Credit Debit Net
1 403 1 408 -5 1 882 2 913 -1 031 502 459 43 924 2 026 -1 102 2 181 900 1 280 EU-27
12 40 -28 27 30 -3 2 19 -17 19 18 2 46 16 30 Belgium
1 0 1 2 3 -1 0 0 0 2 1 1 6 1 5 Bulgaria
2 1 1 7 1 7 0 0 0 3 0 2 66 0 66 Czech Republic
4 24 -20 25 93 -68 0 6 -6 0 10 -9 37 10 27 Denmark
c c c c c c c c c c c c c c c Germany
1 0 0 1 0 1 0 0 0 1 1 0 3 2 1 Estonia
0 0 0 136 0 136 0 0 0 0 0 0 34 17 17 Ireland
29 7 22 c c -35 11 2 9 c c 2 c c 12 Greece
225 121 104 23 105 -82 c c c c c c 146 36 110 Spain
245 221 24 378 692 -314 35 36 -1 73 215 -142 346 233 113 France
320 437 -117 211 404 -193 24 51 -27 135 173 -38 439 131 308 Italy
0 0 0 3 3 0 0 2 -1 1 2 -1 0 1 -1 Cyprus
0 0 0 1 4 -3 0 0 0 0 6 -4 1 3 -1 Latvia
0 0 0 0 0 0 0 0 0 1 0 1 1 0 1 Lithuania
c c c c c c c c c c c c c c c Luxembourg
20 6 14 0 5 -5 0 3 -3 0 6 -6 112 2 111 Hungary
1 0 1 c c 1 0 0 0 c c 0 c c 6 Malta
43 39 4 65 141 -76 10 0 10 35 43 -8 83 22 61 Netherlands
12 28 -16 36 37 -1 9 19 -10 12 28 -16 56 16 40 Austria
3 0 3 5 26 -21 1 0 1 1 0 1 44 12 32 Poland
176 170 6 4 18 -14 c c c 3 4 -1 25 4 21 Portugal
1 0 1 4 17 -14 0 0 0 2 0 2 8 1 7 Romania
1 0 0 1 1 1 0 0 0 0 0 0 6 0 6 Slovenia
0 0 0 0 0 0 0 0 0 0 0 0 2 1 1 Slovakia
0 0 0 40 68 -28 0 0 0 0 0 0 59 21 38 Finland
0 0 0 0 0 0 0 0 0 0 0 0 47 40 8 Sweden
222 143 79 679 421 259 297 240 57 560 1 236 -677 362 212 151 United Kingdom
: : : : : : : : : : : : : : : EU institutions
: : : : : : : : : : : : : : : Switzerland
- - - 0 1 -1 - - - - - - 25 10 14 Norway
6 1 4 6 1 4 : : : 0 1 -1 7 1 5 Croatia
: : : : : : : : : : : : : : : Turkey
1 910 745 1 165 2 900 1 899 1 000 530 952 -422 3 621 1 537 2 085 8 976 2 528 6 448 USA (1)
17 39 -22 1 680 1 814 -135 317 728 -411 52 62 -10 : : : Japan (1) USA data have been harmonized by Eurostat
c: confidential data* China excl. Hong Kong

III
66 European Union international trade in services
Statistical tablesTable 3.3
3.3.7 Trade of EU Member States, Switzerland, Norway, Croatia, Turkey, the USA and Japan with main partnersYear: 2007Other services
(Mio EUR)
World Switzerland Russian Federation Canada USA
Credit Debit Net Credit Debit Net Credit Debit Net Credit Debit Net Credit Debit Net
EU-27 656 221 533 203 123 018 40 485 29 173 11 312 11 260 4 636 6 624 5 168 4 316 853 89 493 91 944 -2 451
Belgium 28 960 22 382 6 577 1 767 932 837 126 128 -2 79 115 -36 4 441 3 088 1 354
Bulgaria 954 992 -38 62 57 5 22 52 -30 7 3 4 84 43 41
Czech Republic 3 980 5 163 -1 183 204 224 -20 67 106 -39 18 23 -4 239 309 -70
Denmark 11 152 11 693 -541 207 388 -181 201 35 166 50 48 1 1 124 2 025 -901
Germany 94 387 83 108 11 279 10 414 7 368 3 046 1 752 1 119 633 641 831 -192 14 363 14 548 -183
Estonia 1 137 825 312 37 12 25 81 35 45 9 2 7 52 31 21
Ireland 58 640 60 114 -1 474 1 210 503 707 1 024 167 857 505 259 246 4 878 22 572 -17 694
Greece 3 078 4 487 -1 410 166 147 19 14 40 -25 c c -3 c c -203
Spain 36 290 39 645 -3 355 4 041 2 855 1 186 130 78 52 213 244 -31 3 257 4 197 -940
France 42 342 41 058 1 284 1 741 2 619 -878 621 264 357 510 640 -130 7 493 6 430 1 063
Italy 37 662 48 771 -11 109 2 362 2 846 -484 175 165 10 237 431 -194 3 249 4 842 -1 593
Cyprus 2 904 781 2 124 53 36 18 213 24 189 4 2 3 319 87 232
Latvia 844 720 124 19 9 10 17 16 1 1 0 0 34 37 -3
Lithuania 382 495 -113 15 10 4 29 25 4 0 1 -1 26 28 -2
Luxembourg 41 584 23 418 18 166 4 516 3 993 523 67 24 43 56 29 27 2 099 1 700 400
Hungary 6 609 6 984 -375 206 213 -7 155 121 34 32 26 6 597 1 298 -701
Malta 1 482 1 125 357 29 12 16 11 2 9 2 40 -38 c c 25
Netherlands 51 784 42 627 9 157 1 694 1 718 -23 1 091 183 908 282 288 -6 5 319 7 462 -2 143
Austria 17 837 11 958 5 879 1 336 659 677 377 148 229 45 32 13 725 466 259
Poland 6 490 7 733 -1 243 504 427 77 174 146 29 26 32 -7 428 741 -313
Portugal 5 175 4 088 1 087 329 598 -269 8 5 3 30 18 12 261 318 -58
Romania 4 716 3 904 812 232 159 73 5 3 2 29 33 -5 413 180 233
Slovenia 1 221 1 533 -312 53 75 -22 41 86 -44 2 24 -22 43 90 -47
Slovakia 1 879 2 142 -263 53 76 -23 11 40 -29 6 8 -2 92 106 -14
Finland 12 383 9 029 3 354 283 210 73 2 056 562 1 494 c c -21 333 1 327 -994
Sweden 29 460 19 186 10 273 1 321 491 830 487 177 310 160 269 -108 3 122 3 929 -808
United Kingdom 152 506 67 030 85 477 7 631 2 458 5 173 2 301 880 1 422 2 114 782 1 333 36 193 15 571 20 621
EU institutions 384 12 214 -11 831 : : : : : : : : : : : :
Switzerland : : : : : : : : : : : : : : :
Norway 12 596 9 095 3 501 269 319 -50 3 13 -10 184 70 114 3 667 2 117 1 550
Croatia 1 334 1 510 -176 60 85 -25 - 38 -29 - - -2 74 105 -32
Turkey 3 054 3 790 -736 : : : : : : : : : : : :
USA (1) 216 536 147 016 69 519 8 933 4 922 4 011 : : : 16 338 9 038 7 300 : : :
Japan 56 732 54 593 2 140 746 1 463 -717 182 173 10 1 050 526 524 19 018 22 303 -3 285(1) USA data have been harmonized by Eurostatc: confidential data* China excl. Hong Kong

Statistical tablesTable 3.3 III
67 European Union international trade in services
3.3.7 Trade of EU Member States, Switzerland, Norway, Croatia, Turkey, the USA and Japan with main partners Year: 2007Other services
(Mio EUR)
Brazil China* Hong Kong India Japan
Credit Debit Net Credit Debit Net Credit Debit Net Credit Debit Net Credit Debit Net
2 694 1 804 890 10 369 4 265 6 104 4 026 4 100 -74 5 884 3 448 2 435 12 149 8 039 4 109 EU-27
35 44 -10 94 96 -3 73 147 -74 36 111 -75 726 203 523 Belgium
12 1 11 0 6 -6 2 3 -1 2 1 1 12 3 9 Bulgaria
1 2 -1 3 11 -8 2 3 -1 4 6 -2 -1 181 -182 Czech Republic
30 17 14 214 81 132 85 43 41 37 107 -70 188 85 104 Denmark
564 430 133 1 749 1 459 288 368 729 -361 574 908 -334 2 031 1 305 726 Germany
0 0 0 2 3 -1 11 0 11 0 1 -1 1 1 0 Estonia
98 13 85 1 988 125 1 863 182 133 49 357 86 271 854 492 362 Ireland
c c -2 c c -19 c c -3 2 6 -4 c c 2 Greece
164 190 -26 87 158 -71 46 119 -73 42 122 -80 220 255 -35 Spain
-13 116 -129 1 304 349 955 457 552 -95 688 216 472 219 542 -323 France
124 136 -12 109 396 -287 104 188 -84 51 132 -81 254 197 57 Italy
1 0 1 2 1 1 2 2 1 9 1 8 4 1 3 Cyprus
0 0 0 -1 1 -3 0 0 0 0 0 0 0 0 0 Latvia
0 0 0 0 1 0 0 1 -1 5 0 5 0 1 -1 Lithuania
91 24 66 129 40 89 298 185 114 13 23 -11 899 348 551 Luxembourg
68 7 61 32 13 19 8 7 0 21 9 12 494 200 295 Hungary
c c 0 3 1 1 c c 0 0 1 -1 5 1 5 Malta
1 059 493 566 919 325 594 723 346 377 416 428 -12 664 358 306 Netherlands
30 9 21 328 65 263 49 58 -9 45 44 1 66 37 29 Austria
0 4 -4 4 11 -7 7 6 1 32 17 15 6 94 -88 Poland
35 42 -7 2 11 -8 9 12 -2 9 9 0 11 4 7 Portugal
1 1 -1 5 14 -9 5 3 2 4 4 1 18 2 15 Romania
0 1 0 1 4 -3 1 6 -5 1 2 -1 1 1 0 Slovenia
0 1 0 2 4 -2 1 30 -29 1 1 0 9 7 2 Slovakia
c c 2 c c 1 837 c c -12 2 013 215 1 798 c c -40 Finland
91 57 34 639 293 346 162 258 -95 237 113 124 257 195 62 Sweden
285 193 92 715 573 142 1 409 1 233 175 1 284 881 403 5 151 3 414 1 737 United Kingdom
: : : : : : : : : : : : : : : EU institutions
: : : : : : : : : : : : : : : Switzerland
18 11 7 25 24 1 43 45 -2 8 11 -3 134 62 72 Norway
: : : : : : : : : - 4 -2 - 1 0 Croatia
: : : : : : : : : : : : : : : Turkey
4 081 1 644 2 437 : : : 2 582 1 620 962 2 206 5 113 -2 906 15 573 10 818 4 755 USA (1)
277 124 153 1 414 1 850 -436 -2 087 1 012 -3 099 609 269 340 : : : Japan (1) USA data have been harmonized by Eurostat
c: confidential data* China excl. Hong Kong

III
68 European Union international trade in services
Statistical tablesTable 3.3
3.3.8 Trade of EU Member States, Switzerland, Norway, Croatia, Turkey, the USA and Japan with main partnersYear: 2007Communication services
(Mio EUR)
World Switzerland Russian Federation Canada USA
Credit Debit Net Credit Debit Net Credit Debit Net Credit Debit Net Credit Debit Net
EU-27 30 746 30 743 3 1 052 1 027 25 296 245 51 204 165 39 3 400 3 290 110
Belgium 2 819 2 280 539 155 129 26 26 20 6 25 12 13 349 266 83
Bulgaria 120 81 38 1 2 -1 2 1 1 0 1 -1 9 1 8
Czech Republic 419 382 36 16 8 8 8 2 6 0 1 0 12 12 0
Denmark 691 654 37 18 8 10 8 9 -1 5 4 1 34 57 -23
Germany 3 460 4 976 -1 517 275 393 -117 40 52 -12 18 16 2 762 1 119 -357
Estonia 91 84 7 1 1 -1 6 5 1 c c c 3 2 2
Ireland 485 833 -348 0 6 -6 0 - - 0 0 0 21 22 -1
Greece c c c c c c c c 0 c c c 19 16 3
Spain 1 243 2 195 -952 c c c c c c c c c c c c
France 3 058 1 957 1 101 114 55 59 35 3 32 14 12 2 186 110 76
Italy 2 245 3 215 -970 60 110 -50 14 11 3 24 7 17 243 199 44
Cyprus 86 103 -17 0 1 -1 2 1 1 0 0 0 5 9 -4
Latvia 60 77 -19 1 0 1 3 1 1 1 0 0 3 3 -1
Lithuania 73 69 4 2 0 2 9 10 -1 0 0 0 6 3 3
Luxembourg 1 512 762 750 c c c c c c c c c c c c
Hungary 356 393 -37 10 4 6 2 5 -2 2 1 1 21 31 -10
Malta 51 35 16 c c 0 c c 1 c c -4 2 3 -2
Netherlands 3 058 2 796 263 133 80 53 17 15 2 16 22 -6 299 146 153
Austria c c c c c c c c c c c c c c c
Poland 369 510 -141 12 8 4 3 6 -3 4 1 3 25 64 -39
Portugal 616 408 209 17 8 9 c c c c c c 33 17 17
Romania 809 425 384 5 6 -2 1 1 0 1 1 0 76 12 65
Slovenia 105 130 -24 3 3 0 1 3 -2 0 0 0 3 1 2
Slovakia 187 108 79 1 1 0 0 1 0 0 0 0 3 3 0
Finland 311 311 0 c c c 14 9 4 c c c 21 8 13
Sweden 1 297 1 390 -93 29 36 -7 28 28 0 4 12 -8 83 84 0
United Kingdom c c c c c c c c c c c c c c c
EU institutions 0 36 -36 : : : : : : : : : : : :
Switzerland 780 584 196 : : : : : : : : : : : :
Norway 431 297 135 5 1 4 0 0 0 6 0 6 119 19 100
Croatia 351 115 236 6 4 2 4 0 4 1 0 1 5 1 3
Turkey 369 223 147 : : : : : : : : : : : :
USA (1) 6 280 5 762 518 : : : : : : : : : : : :
Japan 404 751 -346 4 0 4 1 1 0 7 5 2 108 179 -71(1) USA data have been harmonized by Eurostatc: confidential data* China excl. Hong Kong

Statistical tablesTable 3.3 III
69 European Union international trade in services
3.3.8 Trade of EU Member States, Switzerland, Norway, Croatia, Turkey, the USAnd Japan with main partners Year: 2007Communication services
(Mio EUR)
Brazil China* Hong Kong India Japan
Credit Debit Net Credit Debit Net Credit Debit Net Credit Debit Net Credit Debit Net
123 77 45 233 187 46 150 169 -20 152 215 -63 165 117 48 EU-27
9 4 6 13 8 5 21 9 11 16 12 4 26 8 18 Belgium
0 0 0 0 1 -1 0 1 -1 0 0 0 0 0 0 Bulgaria
0 0 0 0 0 0 0 0 0 0 0 0 0 0 0 Czech Republic
0 1 -1 1 3 -2 2 3 -1 1 3 -3 1 1 0 Denmark
5 11 -6 19 26 -7 23 28 -5 6 20 -14 13 39 -26 Germany
0 0 0 0 0 0 0 0 0 c c 0 0 0 0 Estonia
0 0 0 0 0 0 0 0 0 0 0 0 0 - - Ireland
c c c c c c c c 0 c c -1 c c 0 Greece
c c c c c c c c c c c c c c c Spain
9 3 6 9 7 2 6 16 -10 9 13 -4 13 8 5 France
14 8 6 2 7 -5 6 6 0 1 12 -11 7 2 5 Italy
0 0 0 0 0 0 0 1 0 0 0 0 0 0 0 Cyprus
0 0 0 0 0 0 0 0 0 0 0 0 0 0 0 Latvia
0 0 0 0 0 0 0 0 0 0 0 0 0 0 0 Lithuania
c c c c c c c c c c c c c c c Luxembourg
0 0 0 0 1 0 0 0 0 0 0 0 1 0 0 Hungary
c c 0 c c 0 c c 0 c c 0 c c 0 Malta
17 11 6 134 28 106 29 38 -9 43 13 31 22 17 5 Netherlands
c c c c c c c c c c c c c c c Austria
0 0 0 0 1 -1 1 1 0 0 2 -2 1 0 0 Poland
14 5 8 c c c c c c c c c c c c Portugal
0 0 0 1 9 -8 1 1 0 1 1 0 11 0 11 Romania
0 0 0 0 0 0 0 0 0 0 0 0 0 0 0 Slovenia
0 0 0 0 0 0 0 0 0 0 0 0 0 0 0 Slovakia
c c c c c c c c 1 c c -2 4 1 3 Finland
0 1 -1 2 8 -6 3 4 0 3 3 0 1 5 -4 Sweden
c c c c c c c c c c c c c c c United Kingdom
: : : : : : : : : : : : : : : EU institutions
: : : : : : : : : : : : : : : Switzerland
0 0 0 0 0 0 1 0 1 0 0 0 0 1 -1 Norway
0 0 0 0 0 0 1 0 0 0 0 0 0 0 0 Croatia
: : : : : : : : : : : : : : : Turkey
: : : : : : : : : : : : : : : USA (1)
1 5 -4 46 65 -19 28 33 -5 1 2 -1 : : : Japan (1) USA data have been harmonized by Eurostat
c: confidential data* China excl. Hong Kong

III
70 European Union international trade in services
Statistical tablesTable 3.3
3.3.9 Trade of EU Member States, Switzerland, Norway, Croatia, Turkey, the USA and Japan with main partnersYear: 2007Construction services
(Mio EUR)
World Switzerland Russian Federation Canada USA
Credit Debit Net Credit Debit Net Credit Debit Net Credit Debit Net Credit Debit Net
EU-27 28 190 19 322 8 868 603 514 89 899 503 396 204 364 -159 849 800 49
Belgium 789 580 209 4 4 0 4 1 3 0 1 -1 2 5 -4
Bulgaria 99 12 87 8 0 8 8 0 8 2 0 2 2 0 2
Czech Republic 226 132 94 5 0 5 7 41 -34 0 0 0 1 5 -4
Denmark 210 130 79 1 0 1 1 0 1 0 0 0 2 5 -3
Germany 8 988 6 623 2 365 221 234 -13 287 182 105 58 68 -11 214 190 24
Estonia 144 70 74 0 0 0 8 7 1 0 0 0 0 0 0
Ireland 0 9 -9 0 0 0 0 0 0 0 0 0 0 0 0
Greece 264 c c 11 5 6 3 1 2 c c c 3 7 -4
Spain 3 050 1 368 1 682 c c c c c c c c c c c c
France 3 862 1 539 2 323 86 54 32 13 13 0 19 5 14 97 58 39
Italy 2 268 2 496 -228 96 86 10 40 28 12 84 275 -191 157 207 -50
Cyprus 148 21 127 1 0 1 4 0 4 0 0 0 17 3 14
Latvia 36 113 -77 0 0 0 1 3 -1 0 0 0 0 0 0
Lithuania 49 62 -13 0 0 0 6 0 6 0 0 0 0 2 -2
Luxembourg 348 464 -116 c c c c c c c c c c c c
Hungary 289 212 77 1 2 -1 34 11 23 0 0 0 0 1 -1
Malta c c -44 0 0 0 0 0 0 0 0 0 0 0 0
Netherlands 1 846 988 858 11 15 -5 100 40 60 6 5 1 26 65 -40
Austria c c c c c c c c c c c c c c c
Poland 1 172 652 520 10 6 3 100 75 25 1 0 1 10 2 8
Portugal 595 120 475 5 1 5 c c c c c c 16 1 14
Romania 210 366 -155 1 2 0 0 0 0 0 0 0 54 14 40
Slovenia 151 160 -9 4 4 0 27 15 13 1 0 1 2 1 1
Slovakia 89 223 -134 0 3 -3 0 0 0 0 0 0 0 0 0
Finland 272 233 39 1 0 0 129 78 51 c c c 9 9 0
Sweden 751 610 141 31 31 0 6 1 5 15 1 14 5 35 -30
United Kingdom c c c c c c c c c c c c c c c
EU institutions 0 14 -14 : : : : : : : : : : : :
Switzerland : : : : : : : : : : : : : : :
Norway 251 40 211 2 0 2 0 0 0 0 0 0 29 0 29
Croatia 62 8 53 1 0 1 1 0 1 0 - 0 0 0 0
Turkey 625 71 554 : : : : : : : : : : : :
USA (1) 4 720 1 351 3 370 : : : : : : : : : : : :
Japan 7 532 5 792 1 739 24 43 -20 141 22 119 10 8 2 131 118 13(1) USA data have been harmonized by Eurostatc: confidential data* China excl. Hong Kong

Statistical tablesTable 3.3 III
71 European Union international trade in services
3.3.9 Trade of EU Member States, Switzerland, Norway, Croatia, Turkey, the USA and Japan with main partners Year: 2007Construction services
(Mio EUR)
Brazil China* Hong Kong India Japan
Credit Debit Net Credit Debit Net Credit Debit Net Credit Debit Net Credit Debit Net
407 112 295 543 400 142 31 87 -55 353 149 204 122 77 45 EU-27
2 0 2 2 1 0 -3 0 -3 0 0 -1 4 0 4 Belgium
0 0 0 0 0 0 0 0 0 0 0 0 2 0 2 Bulgaria
0 0 0 0 0 0 0 1 0 1 0 1 1 0 1 Czech Republic
1 0 0 4 0 3 0 0 0 1 0 1 1 0 1 Denmark
53 50 3 404 216 188 10 34 -24 136 70 66 82 57 26 Germany
0 0 0 0 0 0 0 0 0 0 0 0 0 0 0 Estonia
0 0 0 0 0 0 0 0 0 0 0 0 0 0 0 Ireland
0 0 0 0 0 0 c 0 c 0 0 0 0 0 0 Greece
c c c c c c c c c c c c c c c Spain
214 8 206 19 62 -43 12 25 -13 91 22 69 19 4 15 France
6 3 3 5 33 -28 1 3 -2 6 5 1 1 2 -1 Italy
0 0 0 0 0 0 0 0 0 0 0 0 0 0 0 Cyprus
0 0 0 0 0 0 0 0 0 0 0 0 0 0 0 Latvia
0 0 0 0 0 0 0 0 0 0 0 0 0 0 0 Lithuania
c c c c c c c c c c c c c c c Luxembourg
0 0 0 0 2 -2 0 0 0 0 0 0 0 5 -5 Hungary
0 0 0 0 0 0 0 0 0 0 0 0 0 0 0 Malta
64 38 26 40 21 19 0 1 0 78 39 39 1 2 0 Netherlands
c c c c c c c c c c c c c c c Austria
0 0 0 1 0 1 1 0 1 0 0 0 0 1 -1 Poland
1 1 1 c c c c c c c c c c c c Portugal
0 0 0 0 0 0 0 0 0 0 0 0 2 0 2 Romania
0 0 0 0 0 0 0 0 0 1 0 1 0 0 0 Slovenia
0 0 0 0 0 0 0 0 0 0 0 0 3 1 2 Slovakia
2 1 1 1 1 1 c 0 c 1 1 0 0 0 0 Finland
4 2 2 23 3 20 5 1 4 8 2 6 2 2 -1 Sweden
c c c c c c c c c c c c c c c United Kingdom
: : : : : : : : : : : : : : : EU institutions
: : : : : : : : : : : : : : : Switzerland
0 1 -1 0 0 0 3 0 3 0 0 0 0 0 0 Norway
: : : : : : - 0 0 1 0 1 - 0 0 Croatia
: : : : : : : : : : : : : : : Turkey
: : : : : : : : : : : : : : : USA (1)
17 9 8 90 45 45 15 31 -16 55 92 -37 : : : Japan (1) USA data have been harmonized by Eurostat
c: confidential data* China excl. Hong Kong

III
72 European Union international trade in services
Statistical tablesTable 3.3
3.3.10 Trade of EU Member States, Switzerland, Norway, Croatia, Turkey, the USA and Japan with main partnersYear: 2007Insurance services
(Mio EUR)
World Switzerland Russian Federation Canada USA
Credit Debit Net Credit Debit Net Credit Debit Net Credit Debit Net Credit Debit Net
EU-27 29 480 23 358 6 122 431 2 379 -1 948 136 179 -43 567 306 260 8 518 2 411 6 108
Belgium 730 530 200 56 40 16 1 0 1 2 1 1 47 19 29
Bulgaria 35 98 -63 2 6 -5 4 2 2 0 0 0 2 5 -3
Czech Republic 9 181 -173 0 11 -11 0 0 0 0 0 0 0 10 -10
Denmark 272 386 -114 10 14 -4 1 2 -1 1 1 0 18 58 -41
Germany 4 200 2 320 1 880 123 1 195 -1 072 48 24 24 5 65 -60 772 91 681
Estonia 10 1 10 c c 1 0 0 0 c c c 0 0 0
Ireland 8 707 7 096 1 611 20 123 -103 4 1 3 177 166 11 1 901 1 322 579
Greece c c c c c -28 c c -27 c c -1 c c -87
Spain 1 174 1 941 -767 c c c c c c c c c c c c
France 764 1 533 -769 -164 301 -465 16 36 -20 45 32 13 185 157 28
Italy 1 033 2 339 -1 306 120 140 -20 10 12 -2 0 2 -2 98 72 26
Cyprus 84 61 23 2 6 -4 3 0 3 0 0 0 14 2 11
Latvia 13 39 -26 0 0 0 0 0 0 0 0 0 0 0 0
Lithuania -9 60 -69 0 1 -1 0 0 0 0 0 0 0 2 -2
Luxembourg 1 703 1 037 666 c c c c c c c c c c c c
Hungary 16 149 -133 0 21 -21 0 0 0 0 0 0 0 7 -7
Malta 30 70 -39 c c -1 c c 0 c c -1 c c -3
Netherlands 447 753 -306 38 39 0 0 20 -19 1 3 -2 32 60 -28
Austria c c c c c c c c c c c c c c c
Poland 14 336 -322 -3 2 -5 6 6 -1 0 1 -1 4 28 -23
Portugal 98 188 -90 17 17 0 c c c c c c 2 3 -1
Romania 17 130 -113 0 5 -5 0 0 0 0 2 -2 1 10 -8
Slovenia 16 21 -4 0 1 -1 0 0 0 0 0 0 0 0 0
Slovakia 17 80 -63 0 5 -4 0 0 0 0 0 0 1 6 -5
Finland 101 75 26 0 0 0 0 0 1 0 0 0 2 5 -3
Sweden 682 274 408 6 34 -28 3 2 2 1 1 0 100 93 7
United Kingdom c c c c c c c c c c c c c c c
EU institutions 0 2 -2 : : : : : : : : : : : :
Switzerland 3 539 382 3 156 : : : : : : : : : : : :
Norway 210 159 51 1 3 -1 0 0 0 2 1 2 48 41 6
Croatia 23 51 -29 1 1 -1 0 0 0 0 0 0 1 0 0
Turkey 471 1 125 -655 : : : : : : : : : : : :
USA (1) 7 505 31 201 -23 696 398 5 472 -5 075 : : : 1 427 730 698 : : :
Japan 980 3 005 -2 024 22 212 -190 7 2 5 -20 7 -27 274 924 -650(1) USA data have been harmonized by Eurostatc: confidential data* China excl. Hong Kong

Statistical tablesTable 3.3 III
73 European Union international trade in services
3.3.10 Trade of EU Member States, Switzerland, Norway, Croatia, Turkey, the USA and Japan with main partners Year: 2007Insurance services
(Mio EUR)
Brazil China* Hong Kong India Japan
Credit Debit Net Credit Debit Net Credit Debit Net Credit Debit Net Credit Debit Net
95 48 48 109 281 -172 95 79 15 56 47 10 387 157 231 EU-27
1 0 1 1 2 -1 2 3 0 1 2 -1 1 1 0 Belgium
0 0 0 0 0 0 0 0 0 0 0 0 0 0 0 Bulgaria
0 0 0 0 0 0 0 0 0 0 0 0 0 4 -4 Czech Republic
7 4 3 4 8 -5 7 2 5 0 1 -1 2 3 0 Denmark
35 2 33 12 0 12 7 17 -10 1 1 0 192 38 154 Germany
0 0 0 0 0 0 0 0 0 0 0 0 0 0 0 Estonia
4 1 3 40 30 10 14 8 6 13 9 4 20 18 2 Ireland
c c -1 c c -14 c c -2 c c -2 c c -3 Greece
c c c c c c c c c c c c c c c Spain
8 5 3 24 32 -8 11 -4 15 5 -1 6 12 11 1 France
0 4 -4 4 21 -17 3 2 1 1 4 -3 5 4 1 Italy
0 0 0 0 0 0 0 0 0 0 0 0 0 0 0 Cyprus
0 0 0 0 0 0 0 0 0 0 0 0 0 0 0 Latvia
0 0 0 0 0 0 0 0 0 0 0 0 0 0 0 Lithuania
c c c c c c c c c c c c c c c Luxembourg
0 0 0 0 0 0 0 0 0 0 0 0 0 0 0 Hungary
c c 0 c c -1 c c 0 c c 0 c c 0 Malta
1 12 -11 1 47 -47 0 3 -3 0 3 -3 0 19 -18 Netherlands
c c c c c c c c c c c c c c c Austria
0 0 0 0 0 0 1 0 1 0 0 0 1 0 0 Poland
0 1 -1 c c c c c c c c c c c c Portugal
0 0 0 0 0 0 0 0 0 0 0 0 0 0 0 Romania
0 0 0 0 0 0 0 0 0 0 0 0 0 0 0 Slovenia
0 0 0 0 0 0 0 0 0 0 0 0 1 0 1 Slovakia
0 0 0 0 0 0 0 0 0 0 0 0 1 0 0 Finland
1 1 0 4 1 3 3 1 2 3 2 1 12 3 9 Sweden
c c c c c c c c c c c c c c c United Kingdom
: : : : : : : : : : : : : : : EU institutions
: : : : : : : : : : : : : : : Switzerland
0 0 0 0 0 0 1 0 1 0 0 0 1 0 1 Norway
0 0 0 0 0 0 - 0 0 - 0 0 0 0 0 Croatia
: : : : : : : : : : : : : : : Turkey
53 15 39 35 7 28 89 8 81 19 8 11 1 130 147 984 USA (1)
7 4 4 57 24 33 38 35 3 4 2 2 : : : Japan (1) USA data have been harmonized by Eurostat
c: confidential data* China excl. Hong Kong

III
74 European Union international trade in services
Statistical tablesTable 3.3
3.3.11 Trade of EU Member States, Switzerland, Norway, Croatia, Turkey, the USA and Japan with main partnersYear: 2007Financial services
(Mio EUR)
World Switzerland Russian Federation Canada USA
Credit Debit Net Credit Debit Net Credit Debit Net Credit Debit Net Credit Debit Net
EU-27 117 505 52 724 64 781 7 530 4 414 3 116 1 616 266 1 350 979 217 761 16 630 7 887 8 743
Belgium 2 677 1 973 704 66 194 -128 6 3 3 11 2 9 288 199 89
Bulgaria 24 74 -50 2 4 -2 1 1 0 0 0 0 1 2 -1
Czech Republic 218 546 -328 2 5 -3 6 1 5 0 0 0 10 25 -15
Denmark 156 164 -8 1 0 0 0 0 0 0 0 0 2 27 -25
Germany 8 538 5 551 2 987 379 570 -191 58 6 53 29 16 13 719 633 87
Estonia 94 63 32 1 2 -1 6 3 3 0 0 0 1 1 0
Ireland 7 396 4 685 2 711 169 54 115 7 12 -5 47 4 43 964 1 701 -737
Greece c c c c c 2 c c c c c c 11 15 -4
Spain 4 307 3 866 441 c c c c c c c c c c c c
France 1 477 2 827 -1 350 48 140 -92 19 24 -5 8 17 -9 171 431 -260
Italy 2 804 1 036 1 768 36 31 5 0 0 0 0 0 0 397 142 255
Cyprus 528 116 412 2 5 -3 43 3 40 1 0 1 7 15 -8
Latvia 193 40 154 0 1 -1 0 0 0 0 0 0 0 0 0
Lithuania 27 16 11 1 4 -2 1 0 1 0 0 0 1 0 1
Luxembourg 31 348 15 800 15 548 4 251 2 674 1 577 11 3 8 27 12 15 1 636 1 282 354
Hungary 187 214 -27 7 12 -5 3 1 2 1 0 1 21 14 7
Malta 169 231 -62 c c 1 c c 0 c c -6 61 5 57
Netherlands 1 249 1 707 -459 11 72 -61 2 5 -3 9 22 -14 396 207 189
Austria 1 084 530 554 65 25 40 77 49 28 5 0 5 49 17 32
Poland 241 330 -89 7 17 -10 1 1 0 0 2 -2 27 22 5
Portugal 246 217 28 3 9 -6 c c c c c c 25 7 19
Romania 1 242 1 173 69 66 69 -4 0 0 0 1 0 1 53 41 12
Slovenia 42 59 -17 0 1 -1 2 0 2 0 0 0 0 0 0
Slovakia 200 348 -149 4 5 -1 0 3 -3 0 1 -1 5 15 -10
Finland 303 155 148 1 1 0 c c c c c c 5 5 -1
Sweden 1 355 694 661 23 33 -9 6 2 4 4 4 0 69 86 -17
United Kingdom c c c c c c c c c c c c c c c
EU institutions 49 11 38 : : : : : : : : : : : :
Switzerland 14 958 1 304 13 653 : : : : : : : : : : : :
Norway 743 815 -72 14 11 3 0 0 0 2 0 2 123 115 8
Croatia 37 61 -24 0 1 -1 0 0 0 0 0 0 2 3 -1
Turkey 288 455 -166 : : : : : : : : : : : :
USA (1) 42 514 13 811 28 703 652 326 326 : : : 2 753 633 2 120 : : :
Japan 4 529 2 634 1 894 14 35 -21 4 0 4 6 8 -2 1 895 1 060 836(1) USA data have been harmonized by Eurostatc: confidential data* China excl. Hong Kong

Statistical tablesTable 3.3 III
75 European Union international trade in services
3.3.11 Trade of EU Member States, Switzerland, Norway, Croatia, Turkey, the USA and Japan with main partnersYear: 2007Financial services
(Mio EUR)
Brazil China* Hong Kong India Japan
Credit Debit Net Credit Debit Net Credit Debit Net Credit Debit Net Credit Debit Net
206 129 77 453 181 273 1 254 1 196 57 349 97 252 4 426 1 502 2 924 EU-27
2 3 -1 19 18 1 32 24 7 2 2 0 19 5 14 Belgium
0 0 0 0 0 0 0 0 0 0 0 0 0 0 0 Bulgaria
0 0 0 0 0 0 0 0 0 0 0 0 0 0 0 Czech Republic
0 0 0 0 0 0 0 0 0 0 0 0 0 0 0 Denmark
9 3 6 9 8 1 18 91 -73 11 4 7 17 115 -99 Germany
0 0 0 0 0 0 0 0 0 0 0 0 0 0 0 Estonia
c - 42 c - -33 111 48 63 20 21 -1 225 99 126 Ireland
0 c c 1 0 0 c c 2 c c c 0 c c Greece
c c c c c c c c c c c c c c c Spain
2 2 0 1 1 0 22 196 -174 0 2 -2 7 200 -193 France
0 2 -2 0 1 -1 1 1 0 0 1 -1 3 0 3 Italy
0 0 0 0 0 0 0 0 0 1 0 1 0 0 0 Cyprus
0 0 0 0 0 0 0 0 0 0 0 0 0 0 0 Latvia
0 0 0 0 0 0 0 0 0 0 0 0 0 0 0 Lithuania
19 19 0 100 15 85 286 126 160 7 10 -3 862 308 554 Luxembourg
0 0 0 1 1 0 0 0 0 0 0 0 0 1 -1 Hungary
0 0 0 c c 0 c c 0 c c 0 c c 0 Malta
17 1 16 c c 0 8 0 8 1 1 -1 c c -61 Netherlands
0 0 0 2 1 1 0 1 -1 0 0 0 1 0 1 Austria
0 0 0 0 3 -3 0 0 0 0 0 0 0 0 0 Poland
2 2 -1 c c c c c c c c c c c c Portugal
0 0 0 0 0 0 0 0 0 0 0 0 0 1 -1 Romania
0 0 0 0 0 0 0 0 0 0 0 0 0 0 0 Slovenia
0 0 0 0 0 0 0 0 0 0 0 0 1 0 1 Slovakia
c c c c c 0 c c -1 0 c c c c c Finland
1 1 0 2 1 1 3 2 1 1 0 1 12 11 1 Sweden
c c c c c c c c c c c c c c c United Kingdom
: : : : : : : : : : : : : : : EU institutions
: : : : : : : : : : : : : : : Switzerland
0 1 -1 0 0 0 2 3 -1 0 0 0 2 7 -5 Norway
0 0 0 0 0 0 0 0 0 0 0 0 0 0 0 Croatia
: : : : : : : : : : : : : : : Turkey
774 102 672 682 64 618 1 072 704 368 291 167 124 1 850 1 003 847 USA (1)
22 3 19 6 33 -27 344 125 220 3 16 -13 : : : Japan (1) USA data have been harmonized by Eurostat
c: confidential data* China excl. Hong Kong

III
76 European Union international trade in services
Statistical tablesTable 3.3
3.3.12 Trade of EU Member States, Switzerland, Norway, Croatia, Turkey, the USA and Japan with main partnersYear: 2007Computer and information services
(Mio EUR)
World Switzerland Russian Federation Canada USA
Credit Debit Net Credit Debit Net Credit Debit Net Credit Debit Net Credit Debit Net
EU-27 65 630 33 254 32 377 5 384 1 533 3 851 1 274 113 1 160 455 328 127 6 629 5 564 1 065
Belgium 2 193 1 653 540 67 27 41 41 4 37 2 7 -5 148 197 -49
Bulgaria 85 51 34 2 2 0 0 0 0 0 1 -1 13 4 9
Czech Republic 579 548 31 21 21 0 32 8 24 0 1 -1 56 56 0
Denmark 989 1 152 -163 19 35 -15 12 1 11 2 5 -3 122 126 -3
Germany 8 855 8 523 332 461 703 -242 201 38 163 146 156 -10 1 851 1 787 65
Estonia 102 52 51 1 1 0 1 1 0 0 0 0 11 6 5
Ireland 21 578 584 20 994 635 4 631 - 0 - - - - 391 197 194
Greece c c c c c -3 c c 1 c c 0 24 24 0
Spain 3 862 1 893 1 969 c c c c c c c c c c c c
France 1 319 1 599 -280 21 30 -9 2 0 2 4 8 -4 387 436 -49
Italy 636 1 282 -646 48 49 -1 1 0 1 5 3 2 44 129 -85
Cyprus 199 28 171 2 0 1 18 2 16 1 0 0 52 6 46
Latvia 73 64 9 1 0 1 1 1 0 0 0 0 9 3 7
Lithuania 17 20 -2 0 1 -1 0 0 0 0 0 0 2 1 1
Luxembourg 955 476 479 c c c c c c c c c c c c
Hungary 527 479 49 7 16 -9 2 0 1 3 3 0 87 64 23
Malta 37 53 -16 c c -1 c c 1 c c 0 0 4 -4
Netherlands 4 668 3 969 699 79 128 -49 72 3 69 36 45 -8 543 476 67
Austria c c c c c c c c c c c c c c c
Poland 480 635 -155 11 26 -15 4 3 1 4 2 2 99 97 2
Portugal 196 277 -81 2 9 -7 c c c c c c 10 20 -10
Romania 436 335 101 12 18 -5 1 0 0 11 1 10 114 19 95
Slovenia 108 135 -26 2 5 -3 0 0 0 0 0 0 19 21 -3
Slovakia 153 174 -21 6 12 -5 0 1 0 2 2 0 16 9 6
Finland 1 322 1 072 250 34 30 5 38 4 34 9 5 3 76 147 -72
Sweden 4 747 2 208 2 539 121 32 89 24 22 2 30 25 5 367 367 0
United Kingdom c c c c c c c c c c c c c c c
EU institutions 5 535 -530 : : : : : : : : : : : :
Switzerland : : : : : : : : : : : : : : :
Norway 838 1 216 -378 13 4 8 0 1 -1 1 1 0 178 474 -296
Croatia 84 158 -73 3 10 -7 1 1 0 1 0 1 5 20 -14
Turkey 11 19 -8 : : : : : : : : : : : :
USA (1) 9 287 10 810 -1 523 : : : : : : : : : : : :
Japan 705 2 632 -1 927 34 245 -212 0 : : 1 16 -15 380 1 192 -813(1) USA data have been harmonized by Eurostatc: confidential data* China excl. Hong Kong
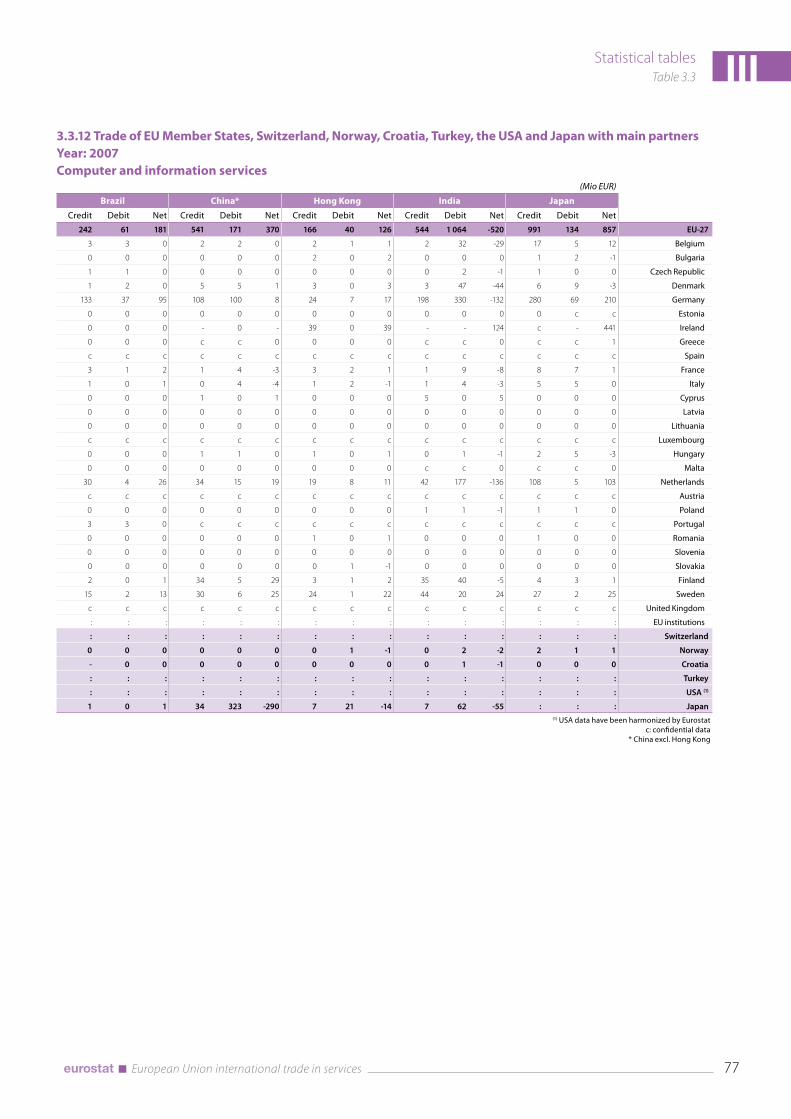
Statistical tablesTable 3.3 III
77 European Union international trade in services
3.3.12 Trade of EU Member States, Switzerland, Norway, Croatia, Turkey, the USA and Japan with main partners Year: 2007Computer and information services
(Mio EUR)
Brazil China* Hong Kong India Japan
Credit Debit Net Credit Debit Net Credit Debit Net Credit Debit Net Credit Debit Net
242 61 181 541 171 370 166 40 126 544 1 064 -520 991 134 857 EU-27
3 3 0 2 2 0 2 1 1 2 32 -29 17 5 12 Belgium
0 0 0 0 0 0 2 0 2 0 0 0 1 2 -1 Bulgaria
1 1 0 0 0 0 0 0 0 0 2 -1 1 0 0 Czech Republic
1 2 0 5 5 1 3 0 3 3 47 -44 6 9 -3 Denmark
133 37 95 108 100 8 24 7 17 198 330 -132 280 69 210 Germany
0 0 0 0 0 0 0 0 0 0 0 0 0 c c Estonia
0 0 0 - 0 - 39 0 39 - - 124 c - 441 Ireland
0 0 0 c c 0 0 0 0 c c 0 c c 1 Greece
c c c c c c c c c c c c c c c Spain
3 1 2 1 4 -3 3 2 1 1 9 -8 8 7 1 France
1 0 1 0 4 -4 1 2 -1 1 4 -3 5 5 0 Italy
0 0 0 1 0 1 0 0 0 5 0 5 0 0 0 Cyprus
0 0 0 0 0 0 0 0 0 0 0 0 0 0 0 Latvia
0 0 0 0 0 0 0 0 0 0 0 0 0 0 0 Lithuania
c c c c c c c c c c c c c c c Luxembourg
0 0 0 1 1 0 1 0 1 0 1 -1 2 5 -3 Hungary
0 0 0 0 0 0 0 0 0 c c 0 c c 0 Malta
30 4 26 34 15 19 19 8 11 42 177 -136 108 5 103 Netherlands
c c c c c c c c c c c c c c c Austria
0 0 0 0 0 0 0 0 0 1 1 -1 1 1 0 Poland
3 3 0 c c c c c c c c c c c c Portugal
0 0 0 0 0 0 1 0 1 0 0 0 1 0 0 Romania
0 0 0 0 0 0 0 0 0 0 0 0 0 0 0 Slovenia
0 0 0 0 0 0 0 1 -1 0 0 0 0 0 0 Slovakia
2 0 1 34 5 29 3 1 2 35 40 -5 4 3 1 Finland
15 2 13 30 6 25 24 1 22 44 20 24 27 2 25 Sweden
c c c c c c c c c c c c c c c United Kingdom
: : : : : : : : : : : : : : : EU institutions
: : : : : : : : : : : : : : : Switzerland
0 0 0 0 0 0 0 1 -1 0 2 -2 2 1 1 Norway
- 0 0 0 0 0 0 0 0 0 1 -1 0 0 0 Croatia
: : : : : : : : : : : : : : : Turkey
: : : : : : : : : : : : : : : USA (1)
1 0 1 34 323 -290 7 21 -14 7 62 -55 : : : Japan (1) USA data have been harmonized by Eurostat
c: confidential data* China excl. Hong Kong

III
78 European Union international trade in services
Statistical tablesTable 3.3
3.3.13 Trade of EU Member States, Switzerland, Norway, Croatia, Turkey, the USA and Japan with main partnersYear: 2007Royalties and licence fees
(Mio EUR)
World Switzerland Russian Federation Canada USA
Credit Debit Net Credit Debit Net Credit Debit Net Credit Debit Net Credit Debit Net
EU-27 43 754 56 711 -12 957 1 967 3 051 -1 084 502 84 417 399 354 45 9 023 22 946 -13 923
Belgium 1 194 1 365 -171 114 58 57 17 36 -19 1 1 0 250 500 -250
Bulgaria 8 53 -46 1 5 -4 0 1 -1 0 0 0 1 9 -8
Czech Republic 25 473 -448 0 65 -65 1 0 1 0 0 0 3 35 -32
Denmark 1 489 971 518 36 33 3 46 1 45 6 5 1 169 351 -182
Germany 5 382 7 092 -1 709 744 757 -13 29 3 25 44 48 -4 1 225 2 818 -1 593
Estonia 7 29 -22 1 0 0 3 1 2 0 c c 1 4 -4
Ireland 860 17 254 -16 394 c - -6 0 0 0 12 2 10 219 9 721 -9 502
Greece c c c c c -27 c c c c c -1 c c -43
Spain 389 2 465 -2 076 c c c c c c c c c c c c
France 6 455 3 366 3 089 63 641 -578 11 5 6 163 23 140 2 684 1 111 1 573
Italy 742 1 207 -465 111 102 9 6 1 5 1 28 -27 63 215 -152
Cyprus 15 39 -24 0 1 0 0 0 0 0 0 0 1 3 -2
Latvia 9 29 -20 0 3 -3 1 1 0 0 0 0 0 3 -3
Lithuania 0 16 -16 0 1 -1 0 0 0 0 0 0 0 4 -4
Luxembourg 281 286 -5 c c c c c c c c c c c c
Hungary 671 1 294 -622 11 47 -36 2 2 0 5 2 2 74 334 -260
Malta 117 31 86 c c -4 c c 0 c c -1 c c -2
Netherlands 10 029 7 345 2 684 313 152 161 143 2 140 53 85 -31 596 2 941 -2 345
Austria c c c c c c c c c c c c c c c
Poland 76 1 144 -1 069 8 159 -151 1 1 0 0 3 -3 19 169 -150
Portugal 77 330 -253 7 39 -32 c c c c c c 2 44 -42
Romania 30 177 -147 0 6 -6 0 0 0 0 7 -7 12 17 -5
Slovenia 14 122 -109 0 5 -5 0 0 0 0 0 0 1 19 -18
Slovakia 109 90 18 8 9 -1 0 0 0 2 1 0 13 11 2
Finland 912 1 032 -119 30 44 -14 c 4 c c c -5 70 435 -365
Sweden 3 461 1 315 2 146 56 100 -44 22 6 16 14 6 7 655 335 320
United Kingdom c c c c c c c c c c c c c c c
EU institutions 0 154 -153 : : : : : : : : : : : :
Switzerland 6 520 8 163 -1 642 : : : : : : : : : : : :
Norway 513 452 62 9 67 -58 0 0 0 12 2 10 280 136 143
Croatia 29 156 -127 1 24 -24 0 0 0 0 0 0 8 16 -8
Turkey 0 472 -472 : : : : : : : : : : : :
USA (1) 60 280 18 277 42 004 5 448 2 308 3 140 : : : 4 592 546 4 047 : : :
Japan 16 949 12 169 4 780 231 282 -51 1 1 0 533 26 507 7 058 8 378 -1 319(1) USA data have been harmonized by Eurostatc: confidential data* China excl. Hong Kong

Statistical tablesTable 3.3 III
79 European Union international trade in services
3.3.13 Trade of EU Member States, Switzerland, Norway, Croatia, Turkey, the USA and Japan with main partners Year: 2007Royalties and licence fees
(Mio EUR)
Brazil China* Hong Kong India Japan
Credit Debit Net Credit Debit Net Credit Debit Net Credit Debit Net Credit Debit Net
414 21 393 1 179 120 1 059 165 119 46 355 46 310 1 806 1 592 214 EU-27
5 0 4 9 2 8 2 0 1 1 3 -2 4 135 -131 Belgium
0 0 0 0 0 0 0 0 0 0 0 0 0 0 0 Bulgaria
0 0 0 0 0 0 0 0 0 0 0 0 0 40 -40 Czech Republic
3 0 3 66 1 65 5 0 4 3 0 3 113 2 111 Denmark
67 5 61 195 147 48 16 7 9 22 6 16 258 177 81 Germany
0 0 0 0 0 0 0 0 0 0 c c 0 c c Estonia
0 0 0 0 - - 0 0 0 0 0 0 - c 11 Ireland
0 0 0 c c 0 0 0 0 c 0 c c c -1 Greece
c c c c c c c c c c c c c c c Spain
28 4 24 37 5 32 10 0 10 7 21 -14 131 32 99 France
36 0 36 7 0 7 21 0 21 4 0 4 38 27 11 Italy
0 0 0 0 0 0 0 0 0 0 0 0 0 0 0 Cyprus
0 0 0 0 0 0 0 0 0 0 0 0 0 0 0 Latvia
0 0 0 0 0 0 0 0 0 0 0 0 0 0 0 Lithuania
c c c c c c c c c c c c c c c Luxembourg
0 0 0 10 0 10 0 0 0 0 0 0 291 131 160 Hungary
0 0 0 0 0 0 0 0 0 0 0 0 0 0 0 Malta
210 5 205 174 8 167 60 100 -41 24 1 22 304 61 243 Netherlands
c c c c c c c c c c c c c c c Austria
0 0 0 0 0 0 0 0 0 0 0 0 0 34 -34 Poland
0 1 0 c c c c c c c c c c c c Portugal
0 0 0 0 1 -1 0 0 0 0 0 0 1 0 1 Romania
0 0 0 0 0 0 0 0 0 0 0 0 0 0 0 Slovenia
0 0 0 0 0 0 0 0 0 0 0 0 0 4 -4 Slovakia
1 0 1 195 1 193 1 0 1 c 5 c 10 10 0 Finland
26 0 26 408 1 407 12 2 10 18 4 14 130 73 57 Sweden
c c c c c c c c c c c c c c c United Kingdom
: : : : : : : : : : : : : : : EU institutions
: : : : : : : : : : : : : : : Switzerland
10 0 10 0 0 0 0 1 -1 0 0 0 12 1 11 Norway
0 0 0 0 0 0 0 0 0 0 1 -1 0 0 0 Croatia
: : : : : : : : : : : : : : : Turkey
1 076 4 1 072 1 371 84 1 287 389 24 365 659 72 587 5 399 5 410 -11 USA (1)
206 1 205 1 316 14 1 302 246 25 221 244 2 241 : : : Japan (1) USA data have been harmonized by Eurostat
c: confidential data* China excl. Hong Kong

III
80 European Union international trade in services
Statistical tablesTable 3.3
3.3.14 Trade of EU Member States, Switzerland, Norway, Croatia, Turkey, the USA and Japan with main partnersYear: 2007Other business services
(Mio EUR)
World Switzerland Russian Federation Canada USA
Credit Debit Net Credit Debit Net Credit Debit Net Credit Debit Net Credit Debit Net
EU-27 311 654 282 490 29 164 22 793 14 535 8 258 6 221 3 058 3 163 2 171 2 352 -180 40 452 43 328 -2 877
Belgium 16 658 13 485 3 173 1 304 468 836 31 64 -33 38 90 -52 3 354 1 831 1 523
Bulgaria 523 594 -71 41 34 7 6 48 -41 5 2 3 39 22 16
Czech Republic 2 338 2 719 -381 159 100 59 1 53 -51 17 19 -2 151 131 21
Denmark 6 388 6 294 93 114 145 -31 118 19 99 29 31 -1 756 1 147 -391
Germany 49 581 44 594 4 988 8 140 3 261 4 879 1 062 786 276 311 425 -114 7 036 6 753 283
Estonia 637 483 154 33 7 26 49 16 33 8 0 8 33 15 18
Ireland 18 904 29 488 -10 584 380 304 76 c - 115 245 73 172 1 306 9 574 -8 268
Greece c c c 97 44 52 6 5 1 6 4 2 104 122 -18
Spain 20 353 23 811 -3 458 c c c c c c c c c c c c
France 23 215 24 999 -1 784 1 494 1 109 385 501 160 341 237 508 -271 3 481 3 667 -186
Italy 26 056 33 449 -7 393 1 691 1 867 -176 100 98 2 121 97 24 2 129 3 216 -1 087
Cyprus 1 425 259 1 166 45 9 37 138 17 121 2 1 2 212 17 194
Latvia 426 326 100 16 4 11 7 7 0 0 0 0 23 27 -4
Lithuania 180 171 9 11 3 8 10 6 4 0 0 0 12 11 1
Luxembourg 4 713 4 121 591 154 1 225 -1 071 14 16 -2 15 9 6 276 189 87
Hungary 3 465 3 382 83 168 96 72 105 96 9 19 17 2 319 424 -105
Malta 567 628 -61 21 4 17 3 2 1 2 27 -25 7 31 -25
Netherlands 28 163 23 985 4 177 1 071 1 148 -77 649 84 565 128 94 34 3 297 3 374 -77
Austria 11 057 5 498 5 559 963 339 624 213 60 153 23 20 3 374 231 143
Poland 3 929 3 632 297 447 188 259 59 48 10 15 19 -4 231 290 -59
Portugal 2 974 1 988 986 256 476 -220 c c c c c c 126 147 -21
Romania 1 860 1 134 726 142 45 97 3 1 2 16 21 -6 96 58 38
Slovenia 752 802 -50 40 48 -8 9 56 -48 1 22 -21 18 36 -17
Slovakia 860 957 -96 21 37 -16 5 34 -29 2 2 0 40 51 -11
Finland 9 059 6 099 2 959 204 117 87 c c 1 301 65 85 -21 138 714 -576
Sweden 16 536 12 401 4 136 1 044 219 824 398 114 284 92 218 -126 1 835 2 916 -1 081
United Kingdom c c c c c c c c c c c c c c c
EU institutions 53 3 980 -3 927 : : : : : : : : : : : :
Switzerland 8 686 802 7 884 : : : : : : : : : : : :
Norway 9 096 5 109 3 987 219 202 17 2 8 -6 151 59 92 2 831 1 161 1 670
Croatia 700 844 -144 45 34 12 3 36 -33 3 6 -4 52 46 5
Turkey 144 751 -607 : : : : : : : : : : : :
USA (1) 60 031 38 166 21 865 : : : : : : : : : : : :
Japan 24 019 25 420 -1 401 401 441 -40 22 108 -86 507 422 85 8 066 9 721 -1 655(1) USA data have been harmonized by Eurostatc: confidential data* China excl. Hong Kong

Statistical tablesTable 3.3 III
81 European Union international trade in services
3.3.14 Trade of EU Member States, Switzerland, Norway, Croatia, Turkey, the USA and Japan with main partners Year: 2007Other business services
(Mio EUR)
Brazil China* Hong Kong India Japan
Credit Debit Net Credit Debit Net Credit Debit Net Credit Debit Net Credit Debit Net
1 086 1 211 -125 7 127 2 796 4 331 2 109 2 332 -222 3 778 1 731 2 046 3 913 4 307 -394 EU-27
13 34 -22 48 63 -16 17 106 -88 14 60 -46 654 49 605 Belgium
12 0 12 0 5 -5 1 2 -2 2 1 1 9 1 8 Bulgaria
0 1 0 1 9 -7 1 1 0 3 4 -1 -3 136 -139 Czech Republic
15 9 7 126 59 68 68 37 31 25 54 -29 59 67 -8 Denmark
254 309 -55 978 944 34 269 542 -273 187 465 -278 1 181 792 389 Germany
0 0 0 0 1 -1 11 0 11 0 0 0 0 0 0 Estonia
c - 40 1 612 74 1 538 18 77 -59 184 40 144 134 381 -247 Ireland
c c 0 c c -2 6 7 -1 c c -1 11 3 8 Greece
c c c c c c c c c c c c c c c Spain
-283 77 -360 1 203 221 982 388 304 84 564 114 450 10 259 -249 France
67 72 -5 91 299 -208 71 169 -98 38 99 -61 188 145 43 Italy
1 0 0 0 0 0 1 1 0 1 0 1 4 1 3 Cyprus
0 0 0 -1 1 -3 0 0 0 0 0 0 0 0 0 Latvia
0 0 0 0 0 0 0 0 0 5 0 5 0 0 0 Lithuania
4 4 0 10 11 -1 8 56 -48 2 4 -2 15 20 -5 Luxembourg
2 1 1 17 6 11 6 2 4 20 7 13 34 47 -13 Hungary
0 0 0 1 0 1 0 0 0 0 0 0 4 0 4 Malta
702 417 285 432 189 244 607 168 439 152 183 -31 215 154 61 Netherlands
23 7 16 305 47 258 29 30 -1 36 33 3 44 27 17 Austria
0 2 -2 1 4 -3 4 4 0 31 12 19 3 55 -52 Poland
14 19 -5 c c c c c c c c c c c c Portugal
0 0 0 3 3 0 3 1 2 3 2 1 4 1 4 Romania
0 1 0 0 2 -2 0 5 -5 0 2 -2 1 0 1 Slovenia
0 0 0 0 2 -2 0 29 -28 0 0 0 2 0 2 Slovakia
10 11 -1 c c 1 614 4 19 -14 c c 1 675 27 71 -44 Finland
44 49 -5 170 272 -102 113 246 -133 158 81 78 73 97 -24 Sweden
c c c c c c c c c c c c c c c United Kingdom
: : : : : : : : : : : : : : : EU institutions
: : : : : : : : : : : : : : : Switzerland
8 3 5 16 10 6 34 39 -5 8 2 5 106 49 57 Norway
0 0 0 1 2 0 1 1 -1 1 2 -1 0 0 0 Croatia
: : : : : : : : : : : : : : : Turkey
: : : : : : : : : : : : : : : USA (1)
22 89 -67 -145 1 276 -1 421 -2 794 683 -3 477 292 90 202 : : : Japan (1) USA data have been harmonized by Eurostat
c: confidential data* China excl. Hong Kong

III
82 European Union international trade in services
Statistical tablesTable 3.3
3.3.15 Trade of EU Member States, Switzerland, Norway, Croatia, Turkey, the USA and Japan with main partnersYear: 2007Personal, cultural and recreational services
(Mio EUR)
World Switzerland Russian Federation Canada USA
Credit Debit Net Credit Debit Net Credit Debit Net Credit Debit Net Credit Debit Net
EU-27 12 066 14 408 -2 342 641 1 301 -661 101 64 37 61 68 -6 1 707 3 553 -1 846
Belgium 267 372 -105 1 12 -11 0 0 0 0 0 0 3 29 -25
Bulgaria 58 21 36 7 6 2 2 0 2 0 0 0 17 2 16
Czech Republic 141 115 26 0 14 -13 0 0 0 1 1 0 6 33 -27
Denmark 421 1 148 -728 5 93 -88 1 1 1 1 2 -2 9 160 -151
Germany 778 2 035 -1 258 61 209 -149 0 9 -9 3 6 -3 384 805 -421
Estonia 8 6 2 0 0 0 0 0 0 c c c 1 1 0
Ireland 178 120 58 0 0 0 0 0 0 0 4 -4 68 28 40
Greece c c c c c 19 c c 0 c c 0 c c -20
Spain 1 212 1 764 -552 c c c c c c c c c c c c
France 1 432 2 310 -878 76 274 -198 16 9 7 15 24 -9 237 388 -151
Italy 788 1 469 -681 168 236 -68 4 1 3 1 0 1 60 282 -222
Cyprus 56 60 -3 1 13 -12 3 0 2 0 0 0 10 5 5
Latvia 7 16 -9 0 0 0 0 0 0 0 0 0 0 1 -1
Lithuania 12 2 10 0 0 0 2 0 2 0 0 0 0 0 0
Luxembourg 450 447 2 c c c c c c c c c c c c
Hungary 1 011 694 317 1 12 -11 3 1 3 1 1 0 69 419 -350
Malta 482 11 471 c c 5 c c 5 c c 0 c c 0
Netherlands 492 522 -30 16 66 -50 3 1 2 3 6 -3 61 155 -94
Austria c c c c c c c c c c c c c c c
Poland 141 220 -79 11 12 -1 1 1 0 1 2 -1 8 39 -31
Portugal 191 367 -176 18 34 -16 c c c c c c 11 58 -46
Romania 78 76 2 5 6 -2 0 0 0 0 0 0 7 6 1
Slovenia 28 72 -45 3 9 -5 1 10 -9 0 1 0 0 5 -5
Slovakia 235 102 133 12 5 8 2 0 1 1 1 0 10 7 2
Finland 14 33 -19 1 1 0 c c 1 0 0 0 1 1 0
Sweden 241 192 49 9 2 7 0 0 0 1 0 1 2 2 0
United Kingdom c c c c c c c c c c c c c c c
EU institutions 0 27 -27 : : : : : : : : : : : :
Switzerland 2 69 -67 : : : : : : : : : : : :
Norway 342 412 -70 1 6 -5 0 0 0 1 0 0 24 63 -40
Croatia 48 68 -20 4 9 -6 0 0 0 1 0 0 1 12 -11
Turkey 709 81 628 : : : : : : : : : : : :
USA (1) 10 976 1 051 9 925 77 1 76 : : : 889 60 829 : : :
Japan 114 962 -848 8 195 -186 1 2 -1 : 16 : 49 425 -376(1) USA data have been harmonized by Eurostatc: confidential data* China excl. Hong Kong

Statistical tablesTable 3.3 III
83 European Union international trade in services
3.3.15 Trade of EU Member States, Switzerland, Norway, Croatia, Turkey, the USA and Japan with main partnersYear: 2007Personal, cultural and recreational services
(Mio EUR)
Brazil China* Hong Kong India Japan
Credit Debit Net Credit Debit Net Credit Debit Net Credit Debit Net Credit Debit Net
82 61 20 24 26 -2 52 58 -7 97 17 81 308 45 263 EU-27
0 0 0 0 0 0 0 4 -3 0 0 0 1 0 1 Belgium
0 1 -1 0 0 0 0 0 0 0 0 0 0 0 0 Bulgaria
0 0 0 0 0 0 0 0 0 0 0 0 0 0 0 Czech Republic
0 0 0 0 1 -1 0 1 -1 0 0 0 1 1 0 Denmark
0 1 0 1 1 -1 0 1 -1 0 1 -1 2 7 -5 Germany
0 c c 0 c c c 0 c 0 0 0 c c c Estonia
0 0 0 0 0 0 0 0 0 0 0 0 24 0 24 Ireland
c c 0 c c 0 c c c c c 0 c c 0 Greece
c c c c c c c c c c c c c c c Spain
4 6 -2 10 17 -7 5 13 -8 3 10 -7 18 11 7 France
0 22 -22 0 0 0 0 1 -1 0 1 -1 3 2 1 Italy
0 0 0 0 0 0 0 0 0 0 0 0 0 0 0 Cyprus
0 0 0 0 0 0 0 0 0 0 0 0 0 0 0 Latvia
0 0 0 0 0 0 0 0 0 0 0 0 0 0 0 Lithuania
c c c c c c c c c c c c c c c Luxembourg
66 6 61 0 0 0 1 5 -4 0 0 0 166 8 158 Hungary
c c 0 c c 1 c c 0 c c 0 c c 1 Malta
5 0 5 0 1 -1 0 25 -25 1 0 0 3 1 2 Netherlands
c c c c c c c c c c c c c c c Austria
0 0 0 0 0 0 0 0 0 0 0 0 1 1 -1 Poland
1 8 -7 c c c c c c c c c c c c Portugal
0 0 0 0 0 0 0 0 0 0 0 0 0 0 0 Romania
0 0 0 0 0 0 0 0 0 0 0 0 0 0 0 Slovenia
0 0 0 1 0 1 0 0 0 0 0 0 0 0 0 Slovakia
0 0 0 1 0 1 0 c c c c 0 c c 0 Finland
0 0 0 0 0 0 0 0 0 1 0 0 0 0 0 Sweden
c c c c c c c c c c c c c c c United Kingdom
: : : : : : : : : : : : : : : EU institutions
: : : : : : : : : : : : : : : Switzerland
0 0 0 8 0 8 0 0 0 0 2 -2 2 0 2 Norway
0 2 -2 0 0 0 0 0 0 0 0 0 0 0 0 Croatia
: : : : : : : : : : : : : : : Turkey
341 242 99 123 1 123 56 5 51 42 1 41 792 16 776 USA (1)
: 5 : 2 11 -9 10 3 7 : : : : : : Japan (1) USA data have been harmonized by Eurostat
c: confidential data* China excl. Hong Kong

III
84 European Union international trade in services
Statistical tablesTable 3.3
3.3.16 Trade of EU Member States, Switzerland, Norway, Croatia, Turkey, the USA and Japan with main partnersYear: 2007Government services, n.i.e.
(Mio EUR)
World Switzerland Russian Federation Canada USA
Credit Debit Net Credit Debit Net Credit Debit Net Credit Debit Net Credit Debit Net
EU-27 17 194 20 193 -2 999 84 419 -335 217 123 94 128 163 -34 2 286 2 166 120
Belgium 1 633 144 1 488 0 0 0 0 0 0 0 1 -1 0 42 -42
Bulgaria 2 7 -5 0 0 0 0 0 0 0 0 0 1 0 1
Czech Republic 26 66 -40 0 1 -1 12 2 11 0 1 -1 0 3 -3
Denmark 537 794 -257 2 59 -57 15 3 12 5 1 4 13 95 -82
Germany 4 605 1 394 3 211 10 46 -36 27 19 8 27 31 -5 1 400 352 1 048
Estonia 42 37 5 c c -1 7 2 5 c c 0 3 3 0
Ireland 532 45 487 c c 0 0 0 0 c c c 8 7 1
Greece c c -287 1 c c c c -2 c 4 c c c -30
Spain 700 342 358 c c c c c c c c c c c c
France 760 928 -168 3 15 -12 8 14 -6 5 11 -6 65 72 -7
Italy 1 090 2 278 -1 188 32 225 -193 0 14 -14 1 19 -18 58 380 -322
Cyprus 363 93 269 0 1 -1 1 0 1 0 0 0 1 26 -25
Latvia 29 17 11 0 0 0 3 1 1 0 0 0 0 0 0
Lithuania 33 80 -48 0 0 0 1 8 -7 0 1 0 4 4 0
Luxembourg 274 24 251 c c c c c c c c c c c c
Hungary 86 168 -82 0 2 -2 4 6 -2 1 1 0 6 5 1
Malta c c 5 c c -1 c c 1 c c 0 c c 3
Netherlands 1 833 562 1 272 21 17 4 105 13 92 30 8 23 70 37 32
Austria c c c c c c c c c c c c c c c
Poland 68 274 -206 0 9 -9 1 5 -5 0 2 -2 5 31 -26
Portugal 182 193 -11 1 4 -3 c c c c c c 36 23 13
Romania 34 89 -55 1 2 -1 1 1 -1 1 1 -1 1 5 -4
Slovenia 5 32 -27 0 1 -1 1 1 0 0 0 0 0 6 -6
Slovakia 30 60 -29 0 1 -1 2 1 1 0 1 -1 4 4 0
Finland 89 18 71 c c c 1 1 0 1 c c 11 2 9
Sweden 389 103 286 2 4 -2 0 2 -2 0 1 -1 6 13 -7
United Kingdom 3 045 4 526 -1 480 4 4 0 15 15 0 44 73 -29 504 966 -462
EU institutions 277 7 455 -7 179 : : : : : : : : : : : :
Switzerland 1 042 119 922 : : : : : : : : : : : :
Norway 171 596 -424 5 25 -19 0 4 -4 8 7 2 34 107 -72
Croatia 1 49 -48 0 1 -1 - 1 -1 - 1 -1 0 7 -7
Turkey 438 594 -156 : : : : : : : : : : : :
USA (1) 14 942 26 590 -11 648 : : : : : : : : : : : :
Japan 1 501 1 228 273 8 9 -2 6 37 -30 6 18 -13 1 057 306 750(1) USA data have been harmonized by Eurostatc: confidential data* China excl. Hong Kong

Statistical tablesTable 3.3 III
85 European Union international trade in services
3.3.16 Trade of EU Member States, Switzerland, Norway, Croatia, Turkey, the USA and Japan with main partners Year: 2007Government services, n.i.e.
(Mio EUR)
Brazil China* Hong Kong India Japan
Credit Debit Net Credit Debit Net Credit Debit Net Credit Debit Net Credit Debit Net
40 84 -44 160 104 56 6 20 -14 199 83 117 30 109 -79 EU-27
0 0 0 0 0 0 0 0 0 0 0 0 0 0 0 Belgium
0 0 0 0 0 0 0 0 0 0 0 0 0 0 0 Bulgaria
0 0 0 1 1 0 0 0 0 0 0 0 0 0 0 Czech Republic
3 1 1 7 4 3 0 0 0 4 1 3 5 2 3 Denmark
8 12 -4 23 17 5 1 2 -1 13 11 2 6 11 -4 Germany
0 c c 1 c c c 0 c c 0 c c c 0 Estonia
0 0 0 0 0 0 0 0 0 c c 0 0 c c Ireland
0 1 -1 c 3 c 0 0 0 c c -1 c 3 c Greece
c c c c c c c c c c c c c c c Spain
2 10 -8 0 0 0 0 0 0 8 26 -18 1 10 -9 France
0 25 -25 0 31 -31 0 4 -4 0 6 -6 4 10 -6 Italy
0 0 0 0 0 0 0 0 0 1 0 1 0 0 0 Cyprus
0 0 0 0 0 0 0 0 0 0 0 0 0 0 0 Latvia
0 0 0 0 1 0 0 0 0 0 0 0 0 1 -1 Lithuania
c c c c c c c c c c c c c c c Luxembourg
0 1 0 2 2 -1 0 0 0 0 1 0 1 2 -2 Hungary
0 0 0 c c 0 0 0 0 c c 0 c c 0 Malta
13 5 9 c c 88 0 4 -4 75 10 65 c c -28 Netherlands
c c c c c c c c c c c c c c c Austria
0 2 -2 2 2 0 0 1 -1 0 1 -1 0 1 -1 Poland
0 3 -3 c c c c c c c c c c c c Portugal
0 1 -1 0 1 0 0 0 0 0 1 0 0 0 0 Romania
0 0 0 0 0 0 0 0 0 0 0 0 0 0 0 Slovenia
0 0 0 0 1 -1 0 0 0 1 0 0 1 1 0 Slovakia
0 0 0 0 c c 0 0 0 0 0 0 1 c c Finland
0 1 -1 0 2 -2 0 1 -1 0 0 0 0 2 -2 Sweden
9 12 -3 16 10 6 4 6 -1 96 18 79 6 10 -4 United Kingdom
: : : : : : : : : : : : : : : EU institutions
: : : : : : : : : : : : : : : Switzerland
0 6 -6 0 13 -13 0 0 0 0 5 -5 8 2 6 Norway
- 0 0 - 1 -1 : : : - 0 0 - 1 -1 Croatia
: : : : : : : : : : : : : : : Turkey
: : : : : : : : : : : : : : : USA (1)
0 9 -9 8 58 -50 19 56 -37 2 2 0 : : : Japan (1) USA data have been harmonized by Eurostat
c: confidential data* China excl. Hong Kong


EU trade in services: 2003–2007, broken down by items


Statistical tablesTable 3.4 III
89 European Union international trade in services
3.4.1 EU trade in services broken down by itemsReporter: EU-25 (from 2003 to 2007) EU-27 (from 2004 to 2007)Partner: World
(Mio EUR)
EU-25 EU-27
2003 2004 2005 2006 2007 2004 2005 2006 2007
CREDITSERVICES 804 538 874 341 956 851 1 057 862 1 165 855 880 510 964 511 1 067 559 1 178 112
Transportation 161 581 186 296 207 030 224 622 249 078 188 375 209 182 227 372 252 312
Sea transport 67 373 82 748 92 586 95 620 108 754 82 963 92 858 96 011 109 134
Passenger transport on sea 2 833 2 762 2 439 2 429 2 564 2 787 2 466 2 458 2 609
Freight transport on sea 53 247 67 602 78 447 80 271 92 077 67 666 78 541 80 404 92 232
Supp., aux. and other services 11 291 12 382 11 697 12 918 14 110 12 508 11 848 13 146 14 291
Air transport 56 655 62 003 68 113 72 135 76 994 62 330 68 572 72 695 77 606
Passenger transport by air 34 425 36 865 40 277 42 840 44 640 37 018 40 568 43 187 45 034
Freight transport by air 7 371 8 193 9 664 9 573 10 567 8 203 9 712 9 638 10 634
Supp., aux. and other services 14 859 16 947 18 175 19 722 21 791 17 110 18 295 19 870 21 941
Other transportation 37 554 41 546 46 332 56 869 63 331 43 082 47 753 58 668 65 573
Passenger on other transport : 1 867 2 034 2 146 2 125 2 255 2 464 2 598 2 634
Freight on other transport : 33 643 37 328 44 713 48 810 34 773 38 293 46 022 50 496
Other on other transport : 6 035 6 970 10 012 12 396 6 053 6 997 10 048 12 443
Space transport 315 268 315 390 723 268 315 390 723
Rail transport 5 542 5 455 5 766 5 887 6 769 5 592 5 984 6 200 7 111
Road transport 26 665 30 367 33 984 42 540 46 236 31 624 34 951 43 733 47 870
Inland waterway transport 239 400 569 1 031 1 242 434 654 1 147 1 346
Pipeline transport 2 662 2 511 2 732 3 331 3 275 2 607 2 882 3 508 3 435
Other sup., and aux. transport serv. 2 127 2 545 2 965 3 693 5 086 2 555 2 965 3 693 5 090
Travel 211 709 225 756 234 534 250 998 263 439 227 953 237 339 254 093 266 792
Business travel : 37 302 40 633 44 615 47 280 37 527 41 271 45 497 48 277
Personal travel : 188 455 193 900 206 383 216 157 190 427 196 067 208 597 218 513
Other services 422 845 462 084 514 864 582 127 650 551 463 978 517 566 585 979 656 221
Communication services 19 639 21 431 24 548 28 011 29 817 21 734 25 207 29 013 30 746
Postal and courier services 4 009 4 301 5 211 5 453 5 593 4 367 5 359 5 769 5 782
Telecommunication services 15 629 17 134 19 337 22 557 24 220 17 370 19 846 23 244 24 960
Construction services 19 027 18 532 23 281 25 675 27 881 18 728 23 521 26 002 28 190
Construction abroad 17 417 17 193 21 557 23 585 25 578 17 298 21 664 23 704 25 716
Constr. in the compiling economy 1 610 1 341 1 724 2 090 2 302 1 432 1 857 2 298 2 474
Insurance services 30 180 25 351 18 404 25 494 29 428 25 394 18 450 25 541 29 480
Financial services 54 313 64 170 76 106 94 910 116 240 64 260 76 205 95 033 117 505
Computer and information services 39 632 47 194 49 872 57 861 65 109 47 330 50 166 58 279 65 630
Computer services 34 492 40 699 42 964 49 617 57 121 40 831 43 250 50 026 57 633
Information services 5 138 6 498 6 908 8 244 7 986 6 502 6 915 8 252 7 995
Royalties and licence fees 30 259 34 636 39 224 39 922 43 716 34 649 39 268 39 961 43 754
Other business services 202 700 221 691 255 600 281 783 309 272 222 540 256 783 283 551 311 654
Merc. & other trade-related serv. 38 204 44 679 55 371 63 624 75 212 44 704 55 513 63 790 75 396
Merchanting 14 795 25 552 34 220 40 813 49 382 25 543 34 223 40 860 49 435
Other trade-related services 23 408 19 129 21 151 22 813 25 836 19 163 21 290 22 933 25 967
Operational leasing 6 683 7 534 10 648 13 412 13 222 7 553 10 682 13 459 13 296
Misc. business, prof. & tech. serv. 157 817 169 485 189 583 204 747 220 836 170 289 190 589 206 302 222 960
Legal, acc., man., cons. & pub. rel. 29 411 30 506 33 140 39 914 43 704 30 617 33 392 40 294 44 188
Adv., market research & polling 13 008 14 503 17 454 17 133 18 010 14 558 17 588 17 355 18 324
Research and development 20 011 22 996 26 734 27 840 29 192 23 011 26 770 27 896 29 262
Architectural, engin. & other tech. 24 452 26 957 29 752 32 519 33 654 27 043 29 886 32 732 33 836
Agric., mining & on-site processing 2 629 3 893 5 332 6 171 6 887 3 927 5 396 6 284 7 240
Other 37 943 37 778 38 823 43 373 47 611 38 169 38 942 43 547 47 821
Serv. between affiliated enter., nie 30 359 32 848 38 347 37 796 41 775 32 961 38 616 38 193 42 287
Personal, cultural & recreational serv. 9 915 11 450 11 428 11 157 11 930 11 657 11 533 11 267 12 066
Audio-visual and related services 6 940 8 454 7 760 7 018 7 226 8 500 7 819 7 069 7 308
Other pers., cult. & recreational serv. 2 977 2 997 3 670 4 137 4 702 3 158 3 717 4 197 4 756
Government services, n i e 17 180 17 629 16 400 17 314 17 158 17 686 16 434 17 332 17 194
Services not allocated 8 403 200 424 116 2 790 200 425 116 2 790

III
90 European Union international trade in services
Statistical tablesTable 3.4
3.4.1 EU trade in services broken down by itemsReporter: EU-25 (from 2003 to 2007) EU-27 (from 2004 to 2007)Partner: World
(Mio EUR)
EU-25 EU-27
2003 2004 2005 2006 2007 2004 2005 2006 2007
DEBITSERVICES 764 116 799 429 869 054 943 776 1 026 073 805 154 876 240 952 537 1 036 986
Transportation 159 044 180 618 196 511 218 125 236 375 182 696 198 976 221 086 239 947
Sea transport 63 338 74 219 79 052 88 658 94 809 74 701 79 759 89 528 95 852
Passenger transport on sea 1 205 1 266 1 280 1 425 1 641 1 304 1 316 1 465 1 689
Freight transport on sea 37 390 44 656 47 578 54 278 58 772 45 076 48 228 55 046 59 706
Supp., aux. and other services 24 743 28 297 30 193 32 956 34 398 28 321 30 215 33 018 34 459
Air transport 53 324 57 572 62 325 64 611 67 149 57 922 62 711 65 049 67 642
Passenger transport by air 28 491 30 832 33 759 35 133 36 583 31 072 34 002 35 387 36 868
Freight transport by air 5 562 6 925 7 701 8 605 9 191 6 995 7 788 8 702 9 310
Supp., aux. and other services 19 270 19 813 20 864 20 876 21 373 19 853 20 920 20 963 21 463
Other transportation 42 388 48 825 55 135 64 855 74 419 50 071 56 506 66 507 76 455
Passenger on other transport : 1 663 1 584 1 715 1 745 1 952 1 867 2 031 2 106
Freight on other transport : 38 406 43 257 51 528 57 373 39 287 44 316 52 834 59 013
Other on other transport : 8 756 10 292 11 611 15 302 8 831 10 322 11 642 15 336
Space transport 36 59 136 75 144 59 136 75 144
Rail transport 5 306 5 061 5 271 5 779 6 612 5 264 5 498 6 049 6 956
Road transport 29 416 34 688 39 246 47 166 52 342 35 624 40 257 48 397 53 855
Inland waterway transport 688 813 1 023 1 203 1 580 852 1 087 1 253 1 639
Pipeline transport 1 551 2 021 2 279 2 601 2 883 2 021 2 348 2 701 3 002
Other sup., and aux. transport serv. 5 391 6 182 7 178 8 032 10 857 6 250 7 178 8 032 10 857
Travel 216 787 222 733 235 879 244 123 258 257 224 267 237 680 246 326 260 703
Business travel : 46 652 50 822 55 464 55 848 47 751 52 099 57 048 57 661
Personal travel : 176 080 185 056 188 658 202 411 176 516 185 580 189 278 203 044
Other services 375 552 395 871 436 362 481 381 528 307 397 984 439 282 484 978 533 203
Communication services 20 922 21 687 24 571 29 341 30 237 21 891 24 898 29 785 30 743
Postal and courier services 4 835 4 917 5 237 5 674 5 726 4 923 5 244 5 681 5 745
Telecommunication services 16 089 16 771 19 335 23 669 24 511 16 969 19 654 24 106 24 999
Construction services 13 986 14 134 15 030 16 339 18 944 14 259 15 250 16 569 19 322
Construction abroad 10 421 10 131 10 600 11 252 12 918 10 138 10 648 11 308 12 974
Constr. in the compiling economy 3 561 4 002 4 431 5 088 6 027 4 121 4 603 5 262 6 348
Insurance services 20 066 20 210 20 919 22 354 23 130 20 369 21 100 22 559 23 358
Financial services 26 845 30 701 36 766 45 911 51 477 30 819 36 922 46 138 52 724
Computer and information services 20 933 22 887 26 174 29 422 32 868 22 971 26 489 29 798 33 254
Computer services 18 953 20 671 23 727 26 865 29 949 20 750 24 029 27 227 30 320
Information services 1 975 2 217 2 446 2 557 2 920 2 221 2 459 2 571 2 935
Royalties and licence fees 45 513 47 705 50 488 52 845 56 481 47 816 50 693 53 081 56 711
Other business services 199 658 209 262 230 873 251 488 280 762 210 389 232 197 253 191 282 490
Merc. & other trade-related serv. 36 391 35 137 34 710 38 284 43 750 35 193 34 817 38 437 43 892
Merchanting 0 0 0 0 0 0 0 0 0
Other trade-related services 36 391 35 137 34 710 38 284 43 750 35 193 34 817 38 437 43 892
Operational leasing 9 415 10 375 12 958 15 910 18 230 10 438 13 045 15 997 18 323
Misc. business, prof. & tech. serv. 153 851 163 757 183 204 197 294 218 778 164 766 184 334 198 757 220 272
Legal, acc., man., cons. & pub. rel. 28 789 29 824 30 754 34 965 39 443 30 089 31 278 35 562 40 111
Adv., market research & polling 16 176 20 895 24 619 25 091 26 483 20 939 24 713 25 197 26 592
Research and development 22 039 26 355 29 287 29 737 31 740 26 360 29 308 29 757 31 755
Architectural, engin. & other tech. 16 308 17 256 18 666 20 325 21 620 17 482 18 939 20 695 21 948
Agric., mining & on-site processing 2 112 2 260 2 934 3 291 3 448 2 267 2 987 3 351 3 497
Other 36 661 33 183 37 109 43 422 49 816 33 609 37 187 43 568 50 010
Serv. between affiliated enter., nie 31 768 33 988 39 834 40 465 46 230 34 024 39 922 40 629 46 361
Personal, cultural & recreational serv. 11 921 13 038 13 914 14 874 14 311 13 163 14 014 14 964 14 408
Audio-visual and related services 9 417 9 957 10 697 11 144 10 254 9 994 10 775 11 209 10 308
Other pers., cult. & recreational serv. 2 503 3 081 3 216 3 728 4 056 3 169 3 238 3 754 4 099
Government services, n i e 15 707 16 246 17 626 18 808 20 098 16 307 17 719 18 893 20 193
Services not allocated 12 734 207 304 145 3 132 207 303 145 3 132

Statistical tablesTable 3.4 III
91 European Union international trade in services
3.4.1 EU trade in services broken down by itemsReporter: EU-25 (from 2003 to 2007) EU-27 (from 2004 to 2007)Partner: World
(Mio EUR)
EU-25 EU-27
2003 2004 2005 2006 2007 2004 2005 2006 2007
NETSERVICES 40 422 74 912 87 797 114 086 139 783 75 356 88 271 115 022 141 126
Transportation 2 537 5 678 10 519 6 497 12 703 5 679 10 207 6 286 12 365
Sea transport 4 036 8 528 13 535 6 962 13 945 8 263 13 098 6 482 13 282
Passenger transport on sea 1 627 1 496 1 159 1 004 923 1 483 1 150 993 920
Freight transport on sea 15 857 22 946 30 869 25 993 33 304 22 590 30 313 25 358 32 525
Supp., aux. and other services -13 451 -15 915 -18 496 -20 038 -20 287 -15 813 -18 367 -19 873 -20 168
Air transport 3 331 4 432 5 788 7 524 9 845 4 408 5 862 7 647 9 963
Passenger transport by air 5 935 6 033 6 519 7 707 8 057 5 946 6 567 7 801 8 167
Freight transport by air 1 808 1 268 1 962 968 1 376 1 209 1 924 936 1 324
Supp., aux. and other services -4 412 -2 866 -2 689 -1 154 418 -2 743 -2 624 -1 093 478
Other transportation -4 834 -7 279 -8 803 -7 985 -11 089 -6 989 -8 753 -7 839 -10 882
Passenger on other transport : 204 450 431 380 302 597 567 529
Freight on other transport : -4 763 -5 929 -6 816 -8 564 -4 514 -6 023 -6 811 -8 517
Other on other transport : -2 721 -3 322 -1 599 -2 906 -2 778 -3 325 -1 594 -2 894
Space transport 280 209 180 315 579 209 180 315 579
Rail transport 236 394 495 108 157 328 486 150 155
Road transport -2 751 -4 321 -5 262 -4 626 -6 105 -4 001 -5 306 -4 664 -5 986
Inland waterway transport -449 -413 -454 -171 -339 -418 -433 -106 -292
Pipeline transport 1 111 490 453 730 392 587 534 807 432
Other sup., and aux. transport serv. -3 264 -3 637 -4 213 -4 339 -5 770 -3 695 -4 213 -4 339 -5 767
Travel -5 078 3 023 -1 344 6 875 5 182 3 686 -341 7 767 6 089
Business travel : -9 350 -10 189 -10 849 -8 568 -10 224 -10 828 -11 551 -9 384
Personal travel : 12 375 8 844 17 725 13 745 13 911 10 487 19 319 15 469
Other services 47 294 66 213 78 502 100 745 122 245 65 994 78 284 101 001 123 018
Communication services -1 284 -256 -23 -1 330 -419 -157 309 -771 3
Postal and courier services -826 -616 -26 -221 -133 -556 115 88 37
Telecommunication services -460 363 2 -1 112 -291 401 192 -862 -39
Construction services 5 040 4 398 8 251 9 335 8 937 4 469 8 271 9 432 8 868
Construction abroad 6 996 7 062 10 958 12 333 12 661 7 161 11 016 12 396 12 742
Constr. in the compiling economy -1 951 -2 662 -2 707 -2 998 -3 724 -2 689 -2 746 -2 964 -3 874
Insurance services 10 115 5 140 -2 516 3 140 6 298 5 025 -2 650 2 982 6 122
Financial services 27 469 33 469 39 340 49 000 64 763 33 441 39 282 48 895 64 781
Computer and information services 18 699 24 306 23 698 28 439 32 241 24 359 23 677 28 481 32 377
Computer services 15 538 20 027 19 237 22 752 27 172 20 081 19 221 22 799 27 313
Information services 3 164 4 281 4 461 5 687 5 067 4 281 4 456 5 681 5 061
Royalties and licence fees -15 254 -13 069 -11 264 -12 923 -12 765 -13 167 -11 425 -13 120 -12 957
Other business services 3 042 12 429 24 727 30 294 28 510 12 151 24 585 30 360 29 164
Merc. & other trade-related serv. 1 813 9 541 20 661 25 339 31 463 9 512 20 696 25 353 31 504
Merchanting 14 795 25 552 34 220 40 813 49 382 25 543 34 223 40 860 49 435
Other trade-related services -12 984 -16 008 -13 559 -15 471 -17 913 -16 030 -13 526 -15 504 -17 925
Operational leasing -2 732 -2 841 -2 310 -2 498 -5 009 -2 885 -2 364 -2 538 -5 027
Misc. business, prof. & tech. serv. 3 966 5 728 6 378 7 453 2 057 5 523 6 255 7 545 2 688
Legal, acc., man., cons. & pub. rel. 622 682 2 386 4 949 4 261 528 2 114 4 732 4 077
Adv., market research & polling -3 168 -6 392 -7 165 -7 957 -8 472 -6 381 -7 124 -7 841 -8 268
Research and development -2 029 -3 360 -2 553 -1 897 -2 548 -3 350 -2 538 -1 860 -2 493
Architectural, engin. & other tech. 8 144 9 701 11 086 12 194 12 034 9 561 10 946 12 037 11 888
Agric., mining & on-site processing 517 1 633 2 397 2 879 3 439 1 661 2 409 2 933 3 743
Other 1 282 4 596 1 714 -49 -2 205 4 560 1 756 -21 -2 189
Serv. between affiliated enter., nie -1 409 -1 140 -1 487 -2 668 -4 455 -1 064 -1 306 -2 436 -4 074
Personal, cultural & recreational serv. -2 005 -1 589 -2 486 -3 717 -2 381 -1 507 -2 480 -3 697 -2 342
Audio-visual and related services -2 478 -1 503 -2 937 -4 126 -3 028 -1 494 -2 956 -4 140 -3 001
Other pers., cult. & recreational serv. 473 -84 453 409 646 -11 479 443 657
Government services, n i e 1 473 1 383 -1 226 -1 494 -2 939 1 379 -1 285 -1 561 -2 999
Services not allocated -4 330 -7 121 -29 -341 -7 122 -29 -342

III
92 European Union international trade in services
Statistical tablesTable 3.4
3.4.2 EU trade in services broken down by itemsReporter: EU-25 (from 2003 to 2007) EU-27 (from 2004 to 2007)Partner: Extra EU-25 (from 2003 to 2007) Extra EU-27 (from 2004 to 2007)
(Mio EUR)
EU-25 EU-27
2003 2004 2005 2006 2007 2004 2005 2006 2007
CREDITSERVICES 342 976 367 313 405 466 449 692 502 313 365 630 403 396 447 080 498 523
Transportation 77 449 92 958 103 344 109 489 119 542 92 972 103 177 109 272 119 194
Sea transport 38 813 50 545 56 694 57 985 65 340 50 472 56 666 57 985 65 356
Passenger transport on sea 887 787 916 734 740 793 923 743 747
Freight transport on sea 32 862 43 765 50 860 51 683 58 504 43 686 50 803 51 608 58 445
Supp., aux. and other services 5 064 5 988 4 914 5 569 6 096 5 988 4 940 5 633 6 164
Air transport 28 168 31 928 35 488 38 317 39 693 31 796 35 307 38 047 39 392
Passenger transport by air 16 551 18 311 20 205 22 343 22 256 18 199 20 081 22 127 22 033
Freight transport by air 4 799 5 608 6 614 6 450 6 960 5 597 6 615 6 446 6 965
Supp., aux. and other services 6 814 8 013 8 672 9 523 10 480 8 002 8 616 9 474 10 394
Other transportation 10 470 10 482 11 166 13 187 14 509 10 705 11 199 13 242 14 445
Passenger on other transport : 691 708 723 759 792 821 845 880
Freight on other transport : 7 974 8 304 9 075 10 044 8 150 8 295 9 081 9 961
Other on other transport : 1 819 2 154 3 393 3 707 1 760 2 084 3 317 3 603
Space transport 256 248 230 261 559 248 230 261 559
Rail transport 1 942 1 644 1 739 1 722 1 906 1 659 1 752 1 735 1 927
Road transport 6 085 6 175 6 383 8 102 8 965 6 310 6 270 7 982 8 766
Inland waterway transport 64 94 92 129 155 89 106 161 167
Pipeline transport 1 152 1 254 1 469 1 539 1 495 1 349 1 618 1 708 1 634
Other sup., and aux. transport serv. 969 1 069 1 251 1 434 1 435 1 048 1 224 1 395 1 393
Travel 63 846 63 135 66 661 73 355 77 271 62 305 65 732 72 303 75 642
Business travel : 12 869 14 306 15 830 16 679 12 667 14 089 15 659 16 276
Personal travel : 50 265 52 353 57 525 60 592 49 638 51 644 56 643 59 366
Other services 199 177 211 197 235 378 266 833 303 223 210 327 234 396 265 488 301 405
Communication services 5 887 6 497 7 307 8 441 10 087 6 428 7 340 8 537 10 016
Postal and courier services 1 203 1 329 1 922 2 071 2 254 1 336 1 989 2 243 2 319
Telecommunication services 4 686 5 167 5 382 6 370 7 833 5 096 5 349 6 294 7 696
Construction services 10 085 9 689 12 338 13 799 16 230 9 665 12 166 13 666 15 880
Construction abroad 9 583 9 328 11 867 13 141 15 501 9 279 11 647 12 905 15 077
Constr. in the compiling economy 503 360 469 659 730 387 518 760 803
Insurance services 14 973 10 653 6 198 11 646 14 914 10 617 6 148 11 585 14 860
Financial services 25 106 29 507 35 088 41 967 51 541 29 447 35 047 41 927 51 547
Computer and information services 16 556 16 473 17 359 22 279 25 707 16 364 17 286 22 198 25 598
Computer services 13 486 13 500 14 319 18 193 20 827 13 395 14 249 18 117 20 727
Information services 3 068 2 975 3 044 4 087 4 881 2 972 3 037 4 082 4 872
Royalties and licence fees 17 390 20 503 23 597 23 773 26 172 20 453 23 520 23 696 26 071
Other business services 95 361 103 607 120 967 131 952 145 426 103 105 120 407 130 949 144 328
Merc. & other trade-related serv. 20 539 22 811 27 554 29 600 34 490 22 594 27 300 29 157 34 025
Merchanting 11 181 16 318 20 284 22 389 26 682 16 131 20 022 21 981 26 300
Other trade-related services 9 358 6 495 7 269 7 211 7 812 6 471 7 281 7 173 7 728
Operational leasing 2 635 3 294 4 867 6 361 6 407 3 271 4 830 6 302 6 341
Misc. business, prof. & tech. serv. 72 188 77 503 88 549 95 995 104 525 77 246 88 275 95 489 103 963
Legal, acc., man., cons. & pub. rel. 13 672 13 728 14 305 17 744 19 993 13 681 14 273 17 578 19 912
Adv., market research & polling 5 292 5 723 7 018 6 933 7 550 5 726 7 019 6 932 7 552
Research and development 10 918 12 454 14 297 14 698 15 791 12 444 14 278 14 692 15 782
Architectural, engin. & other tech. 13 074 14 628 17 107 18 737 19 463 14 523 16 982 18 500 19 141
Agric., mining & on-site processing 1 590 2 616 3 680 4 114 4 624 2 616 3 705 4 173 4 700
Other 16 143 16 394 17 103 19 084 20 050 16 369 16 931 18 921 19 839
Serv. between affiliated enter., nie 11 500 11 961 15 035 14 684 17 058 11 892 15 089 14 692 17 039
Personal, cultural & recreational serv. 4 483 5 353 4 885 4 684 4 830 5 353 4 868 4 668 4 800
Audio-visual and related services 3 363 4 205 3 464 3 113 3 002 4 174 3 457 3 095 2 980
Other pers., cult. & recreational serv. 1 121 1 152 1 425 1 572 1 826 1 180 1 411 1 576 1 821
Government services, n i e 9 339 8 915 7 639 8 291 8 317 8 894 7 615 8 263 8 305
Services not allocated 2 504 24 83 14 2 276 25 91 14 2 280

Statistical tablesTable 3.4 III
93 European Union international trade in services
3.4.2 EU trade in services broken down by itemsReporter: EU-25 (from 2003 to 2007) EU-27 (from 2004 to 2007)Partner: Extra EU-25 (from 2003 to 2007) Extra EU-27 (from 2004 to 2007)
(Mio EUR)
EU-25 EU-27
2003 2004 2005 2006 2007 2004 2005 2006 2007
DEBITSERVICES 304 470 323 394 352 493 381 439 417 936 321 013 349 282 378 555 414 399
Transportation 70 468 81 368 88 269 98 474 103 900 80 970 87 889 98 171 103 661
Sea transport 34 077 41 046 44 824 51 669 55 076 40 962 44 865 51 757 55 262
Passenger transport on sea 156 188 274 242 309 195 282 248 317
Freight transport on sea 18 497 23 265 25 431 29 778 32 549 23 304 25 595 29 948 32 934
Supp., aux. and other services 15 424 17 587 19 122 21 654 22 219 17 464 18 986 21 559 22 009
Air transport 25 352 28 349 30 492 30 895 31 243 28 149 30 211 30 664 31 037
Passenger transport by air 12 322 13 159 14 122 14 316 15 153 13 054 13 974 14 185 15 040
Freight transport by air 2 852 4 313 4 888 5 618 5 685 4 311 4 879 5 619 5 693
Supp., aux. and other services 10 177 10 879 11 481 10 962 10 403 10 784 11 357 10 861 10 303
Other transportation 11 039 11 972 12 955 15 910 17 583 11 857 12 815 15 752 17 363
Passenger on other transport : 313 314 393 452 364 372 442 502
Freight on other transport : 8 295 8 769 11 119 11 887 8 218 8 665 11 017 11 746
Other on other transport : 3 370 3 868 4 399 5 252 3 283 3 777 4 291 5 117
Space transport 34 57 132 69 1 57 132 69 1
Rail transport 1 395 1 148 1 271 1 542 1 708 1 134 1 262 1 561 1 734
Road transport 6 207 6 858 7 133 9 132 9 992 6 803 7 018 8 992 9 788
Inland waterway transport 115 164 195 223 262 167 210 230 270
Pipeline transport 619 745 865 1 116 966 742 886 1 147 1 002
Other sup., and aux. transport serv. 2 667 2 999 3 358 3 831 4 655 2 958 3 305 3 753 4 566
Travel 77 258 81 033 87 009 89 552 96 248 79 604 84 791 87 709 94 230
Business travel : 17 784 19 091 21 018 21 309 17 541 18 643 20 682 21 065
Personal travel : 63 249 67 925 68 534 74 937 62 065 66 150 67 028 73 166
Other services 153 796 160 965 177 149 193 415 215 630 160 426 176 529 192 662 214 352
Communication services 6 742 7 241 8 144 9 878 10 709 7 093 7 922 9 613 10 440
Postal and courier services 1 497 1 613 1 910 2 227 2 394 1 592 1 890 2 204 2 369
Telecommunication services 5 246 5 623 6 231 7 655 8 317 5 501 6 031 7 412 8 072
Construction services 5 719 5 922 6 205 7 113 7 983 5 863 6 134 7 051 7 804
Construction abroad 4 903 4 916 5 355 6 238 6 984 4 833 5 279 6 157 6 816
Constr. in the compiling economy 815 1 007 854 875 998 1 029 856 892 989
Insurance services 6 399 8 225 8 247 7 621 7 983 8 249 8 266 7 623 7 996
Financial services 10 613 11 802 14 136 17 711 20 694 11 829 14 182 17 745 20 772
Computer and information services 7 488 8 158 8 787 10 199 11 151 8 147 8 799 10 191 11 066
Computer services 6 951 7 541 8 133 9 334 10 270 7 530 8 143 9 334 10 193
Information services 537 620 651 865 883 618 653 857 874
Royalties and licence fees 28 060 29 312 32 021 30 623 34 334 29 336 32 071 30 669 34 361
Other business services 76 602 78 460 87 132 96 166 109 603 78 091 86 716 95 720 108 857
Merc. & other trade-related serv. 13 047 12 588 12 225 13 963 17 755 12 499 12 165 13 893 17 621
Merchanting 0 0 0 0 0 0 -10 0 0
Other trade-related services 13 047 12 588 12 225 13 963 17 755 12 499 12 175 13 893 17 621
Operational leasing 3 157 3 587 5 228 6 149 6 580 3 597 5 239 6 164 6 586
Misc. business, prof. & tech. serv. 60 396 62 294 69 682 76 054 85 274 61 998 69 312 75 661 84 654
Legal, acc., man., cons. & pub. rel. 11 783 12 170 11 859 13 742 15 619 12 156 11 847 13 716 15 573
Adv., market research & polling 5 504 7 410 9 164 9 801 11 328 7 369 9 131 9 742 11 218
Research and development 9 908 11 146 13 399 13 642 14 872 11 117 13 346 13 590 14 830
Architectural, engin. & other tech. 6 102 6 696 6 907 7 614 8 415 6 692 6 860 7 568 8 353
Agric., mining & on-site processing 661 649 903 954 1 123 650 935 989 1 146
Other 14 444 12 691 13 942 16 394 18 984 12 701 13 836 16 271 18 799
Serv. between affiliated enter., nie 11 992 11 529 13 514 13 919 14 938 11 315 13 356 13 793 14 735
Personal, cultural & recreational serv. 5 741 6 265 6 314 7 261 6 001 6 275 6 294 7 241 5 988
Audio-visual and related services 4 870 5 232 5 316 6 191 4 688 5 229 5 313 6 188 4 685
Other pers., cult. & recreational serv. 872 1 035 997 1 073 1 323 1 042 983 1 053 1 304
Government services, n i e 6 431 5 580 6 164 6 843 7 172 5 544 6 146 6 809 7 068
Services not allocated 2 948 29 65 0 2 159 15 73 14 2 157

III
94 European Union international trade in services
Statistical tablesTable 3.4
3.4.2 EU trade in services broken down by itemsReporter: EU-25 (from 2003 to 2007) EU-27 (from 2004 to 2007)Partner: Extra EU-25 (from 2003 to 2007) Extra EU-27 (from 2004 to 2007)
(Mio EUR)
EU-25 EU-27
2003 2004 2005 2006 2007 2004 2005 2006 2007
NETSERVICES 38 506 43 919 52 973 68 253 84 376 44 617 54 114 68 525 84 124
Transportation 6 981 11 589 15 075 11 015 15 643 12 002 15 288 11 101 15 533
Sea transport 4 736 9 499 11 870 6 316 10 264 9 510 11 801 6 229 10 094
Passenger transport on sea 731 600 642 492 431 598 641 494 429
Freight transport on sea 14 365 20 500 25 430 21 905 25 955 20 382 25 208 21 659 25 511
Supp., aux. and other services -10 359 -11 599 -14 208 -16 085 -16 123 -11 476 -14 045 -15 926 -15 845
Air transport 2 815 3 579 4 996 7 422 8 449 3 647 5 096 7 383 8 355
Passenger transport by air 4 229 5 152 6 084 8 027 7 103 5 144 6 107 7 943 6 993
Freight transport by air 1 947 1 295 1 726 832 1 275 1 286 1 735 827 1 271
Supp., aux. and other services -3 363 -2 866 -2 809 -1 439 77 -2 782 -2 741 -1 387 91
Other transportation -570 -1 490 -1 788 -2 723 -3 074 -1 152 -1 616 -2 511 -2 918
Passenger on other transport : 378 394 330 307 428 449 403 378
Freight on other transport : -321 -466 -2 045 -1 843 -68 -370 -1 936 -1 785
Other on other transport : -1 550 -1 714 -1 006 -1 545 -1 524 -1 693 -973 -1 514
Space transport 222 191 99 192 558 191 99 192 558
Rail transport 546 496 467 180 199 524 490 173 194
Road transport -121 -683 -750 -1 030 -1 027 -492 -748 -1 010 -1 022
Inland waterway transport -51 -70 -104 -94 -107 -78 -104 -69 -103
Pipeline transport 533 509 605 423 529 607 732 562 632
Other sup., and aux. transport serv. -1 698 -1 929 -2 106 -2 397 -3 220 -1 910 -2 081 -2 359 -3 173
Travel -13 413 -17 899 -20 348 -16 197 -18 977 -17 299 -19 059 -15 406 -18 587
Business travel : -4 915 -4 784 -5 187 -4 630 -4 874 -4 554 -5 022 -4 789
Personal travel : -12 984 -15 571 -11 009 -14 345 -12 427 -14 506 -10 384 -13 800
Other services 45 382 50 231 58 228 73 417 87 593 49 901 57 867 72 826 87 053
Communication services -855 -744 -837 -1 437 -623 -665 -583 -1 076 -424
Postal and courier services -295 -284 13 -156 -140 -256 98 39 -50
Telecommunication services -559 -456 -850 -1 285 -484 -405 -682 -1 118 -376
Construction services 4 366 3 767 6 133 6 686 8 246 3 803 6 032 6 615 8 076
Construction abroad 4 680 4 412 6 512 6 903 8 517 4 445 6 369 6 748 8 261
Constr. in the compiling economy -312 -647 -385 -216 -268 -642 -339 -132 -187
Insurance services 8 573 2 428 -2 049 4 025 6 932 2 368 -2 118 3 962 6 863
Financial services 14 493 17 705 20 951 24 256 30 848 17 618 20 865 24 182 30 775
Computer and information services 9 068 8 315 8 573 12 081 14 556 8 217 8 487 12 006 14 532
Computer services 6 535 5 959 6 185 8 859 10 557 5 865 6 107 8 783 10 534
Information services 2 531 2 355 2 392 3 222 3 998 2 354 2 384 3 225 3 998
Royalties and licence fees -10 670 -8 809 -8 424 -6 851 -8 162 -8 883 -8 551 -6 974 -8 290
Other business services 18 759 25 147 33 836 35 786 35 822 25 014 33 692 35 229 35 471
Merc. & other trade-related serv. 7 492 10 223 15 330 15 636 16 734 10 095 15 135 15 263 16 404
Merchanting 11 181 16 318 20 284 22 389 26 682 16 131 20 033 21 981 26 300
Other trade-related services -3 689 -6 093 -4 956 -6 752 -9 944 -6 028 -4 894 -6 721 -9 893
Operational leasing -522 -293 -361 212 -173 -326 -409 138 -244
Misc. business, prof. & tech. serv. 11 792 15 210 18 866 19 941 19 251 15 248 18 963 19 828 19 309
Legal, acc., man., cons. & pub. rel. 1 889 1 558 2 446 4 002 4 375 1 525 2 426 3 862 4 340
Adv., market research & polling -212 -1 687 -2 146 -2 868 -3 778 -1 643 -2 112 -2 810 -3 667
Research and development 1 009 1 308 898 1 055 919 1 328 933 1 102 952
Architectural, engin. & other tech. 6 972 7 932 10 200 11 124 11 048 7 831 10 122 10 932 10 789
Agric., mining & on-site processing 929 1 967 2 778 3 160 3 501 1 966 2 770 3 183 3 554
Other 1 699 3 702 3 161 2 690 1 066 3 668 3 094 2 650 1 039
Serv. between affiliated enter., nie -492 432 1 520 765 2 121 577 1 734 899 2 304
Personal, cultural & recreational serv. -1 258 -912 -1 429 -2 577 -1 171 -922 -1 426 -2 572 -1 188
Audio-visual and related services -1 507 -1 027 -1 853 -3 077 -1 686 -1 055 -1 856 -3 093 -1 705
Other pers., cult. & recreational serv. 249 117 428 499 503 138 428 522 517
Government services, n i e 2 907 3 335 1 474 1 448 1 144 3 351 1 468 1 454 1 237
Services not allocated -444 -5 18 13 117 10 18 0 122

Statistical tablesTable 3.4 III
95 European Union international trade in services
3.4.3 EU trade in services broken down by itemsReporter: EU-25 (from 2003 to 2007) EU-27 (from 2004 to 2007)Partner: Canada
(Mio EUR)
EU-25 EU-27
2003 2004 2005 2006 2007 2004 2005 2006 2007
CREDITSERVICES 7 219 8 224 8 984 10 340 11 573 8 251 9 018 10 397 11 695
Transportation 2 128 2 400 2 352 2 931 3 201 2 409 2 358 2 948 3 267
Sea transport 841 881 771 1 021 1 341 882 772 1 022 1 341
Passenger transport on sea 52 0 3 5 1 0 3 5 1
Freight transport on sea 704 819 703 944 1 253 819 704 944 1 254
Supp., aux. and other services 85 60 65 74 86 60 65 74 86
Air transport 1 128 1 353 1 396 1 664 1 654 1 355 1 399 1 678 1 713
Passenger transport by air 801 926 1 145 1 203 1 116 927 1 148 1 214 1 162
Freight transport by air 98 116 128 128 145 116 129 129 156
Supp., aux. and other services 225 310 121 332 393 311 122 333 395
Other transportation 156 165 185 246 206 171 186 248 213
Passenger on other transport : 24 29 30 30 25 30 31 36
Freight on other transport : 96 115 160 140 101 116 161 141
Other on other transport : 44 42 54 34 44 42 54 34
Space transport 0 0 0 0 0 0 0 0 0
Rail transport 29 39 40 49 41 39 40 49 47
Road transport 85 88 111 159 141 94 112 161 142
Inland waterway transport 0 1 0 0 0 1 0 0 0
Pipeline transport 4 2 0 0 1 2 0 0 1
Other sup., and aux. transport serv. 36 36 34 34 22 36 34 34 22
Travel 1 917 2 198 2 516 2 888 3 234 2 204 2 529 2 904 3 254
Business travel : 417 433 470 506 418 439 478 516
Personal travel : 1 781 2 081 2 417 2 728 1 786 2 089 2 425 2 738
Other services 3 128 3 622 4 114 4 514 5 133 3 634 4 128 4 538 5 168
Communication services 149 155 152 175 203 156 154 177 204
Postal and courier services 23 29 27 32 30 30 27 32 30
Telecommunication services 126 126 125 143 174 127 128 145 175
Construction services 51 94 128 209 202 95 128 209 204
Construction abroad 49 93 124 207 194 94 124 207 194
Constr. in the compiling economy 2 1 2 2 10 1 2 2 11
Insurance services 592 612 661 327 567 612 661 327 567
Financial services 420 451 523 780 978 451 523 780 979
Computer and information services 193 311 434 516 444 311 437 523 455
Computer services 189 195 234 259 328 196 236 266 339
Information services 5 114 200 257 117 114 200 257 117
Royalties and licence fees 331 494 407 326 399 494 407 326 399
Other business services 1 204 1 330 1 648 2 016 2 151 1 335 1 655 2 029 2 171
Merc. & other trade-related serv. 222 249 195 308 280 249 195 309 281
Merchanting 142 196 124 222 195 196 123 222 195
Other trade-related services 80 54 70 84 86 54 71 85 86
Operational leasing 29 77 145 222 202 78 146 224 205
Misc. business, prof. & tech. serv. 955 1 003 1 307 1 488 1 670 1 008 1 312 1 499 1 686
Legal, acc., man., cons. & pub. rel. 279 315 417 507 518 316 419 509 519
Adv., market research & polling 28 45 48 70 120 45 48 70 120
Research and development 72 90 146 103 128 90 146 104 128
Architectural, engin. & other tech. 158 161 216 221 215 161 218 225 216
Agric., mining & on-site processing 74 47 28 89 80 47 28 89 89
Other 168 172 230 295 375 174 230 295 376
Serv. between affiliated enter., nie 173 171 221 201 233 172 222 203 235
Personal, cultural & recreational serv. 59 60 55 64 61 61 56 65 61
Audio-visual and related services 49 46 42 45 42 46 42 46 42
Other pers., cult. & recreational serv. 8 13 14 19 20 13 14 20 20
Government services, n i e 129 116 107 101 128 118 108 102 128
Services not allocated 46 1 2 6 6 1 2 5 6

III
96 European Union international trade in services
Statistical tablesTable 3.4
3.4.3 EU trade in services broken down by itemsReporter: EU-25 (from 2003 to 2007) EU-27 (from 2004 to 2007)Partner: Canada
(Mio EUR)
EU-25 EU-27
2003 2004 2005 2006 2007 2004 2005 2006 2007
DEBITSERVICES 6 811 6 951 7 386 8 413 9 543 6 979 7 423 8 467 9 648
Transportation 1 704 1 674 1 662 1 988 2 088 1 683 1 665 1 997 2 131
Sea transport 716 604 556 826 970 606 556 827 971
Passenger transport on sea 1 0 0 0 0 0 0 0 0
Freight transport on sea 297 239 291 326 400 240 291 326 400
Supp., aux. and other services 416 365 261 497 569 365 261 498 569
Air transport 885 925 993 1 034 962 927 994 1 042 999
Passenger transport by air 510 523 519 536 535 524 520 542 571
Freight transport by air 53 71 81 95 94 71 81 95 94
Supp., aux. and other services 323 333 393 405 333 334 393 406 334
Other transportation 102 140 113 126 152 146 115 128 157
Passenger on other transport : 1 2 2 2 3 4 4 7
Freight on other transport : 86 54 56 67 90 55 56 67
Other on other transport : 53 56 68 83 53 56 68 83
Space transport 0 0 -8 0 0 0 -8 0 0
Rail transport 12 12 10 6 9 13 10 6 13
Road transport 50 75 54 54 65 79 55 55 67
Inland waterway transport 1 1 1 1 2 1 1 1 2
Pipeline transport 2 1 0 1 1 1 0 1 1
Other sup., and aux. transport serv. 37 52 56 65 75 52 56 65 75
Travel 2 233 2 427 2 354 2 770 3 168 2 436 2 369 2 784 3 193
Business travel : 473 486 602 587 475 492 609 605
Personal travel : 1 954 1 869 2 168 2 582 1 960 1 878 2 174 2 590
Other services 2 724 2 850 3 366 3 656 4 279 2 860 3 385 3 687 4 316
Communication services 106 123 156 158 164 124 156 160 165
Postal and courier services 20 20 19 22 28 20 19 22 28
Telecommunication services 87 103 136 135 136 104 137 137 138
Construction services 76 84 104 254 364 85 104 254 364
Construction abroad 68 50 88 242 357 50 88 242 357
Constr. in the compiling economy 7 33 14 12 7 34 15 12 7
Insurance services 133 199 339 246 304 200 340 247 306
Financial services 115 100 143 183 217 101 143 183 217
Computer and information services 148 152 210 267 326 153 212 268 328
Computer services 139 140 198 249 312 140 199 251 313
Information services 8 10 10 18 13 10 10 18 13
Royalties and licence fees 396 318 345 322 347 319 350 330 354
Other business services 1 473 1 638 1 772 2 028 2 328 1 643 1 782 2 045 2 352
Merc. & other trade-related serv. 127 136 113 173 182 137 114 173 183
Merchanting 0 0 0 0 0 0 0 0 0
Other trade-related services 127 136 113 173 182 137 114 173 183
Operational leasing 31 21 41 67 67 21 41 67 67
Misc. business, prof. & tech. serv. 1 314 1 482 1 617 1 789 2 081 1 486 1 626 1 805 2 103
Legal, acc., man., cons. & pub. rel. 216 345 359 361 449 346 362 368 454
Adv., market research & polling 81 112 91 112 148 112 91 116 149
Research and development 380 389 558 595 633 389 558 596 633
Architectural, engin. & other tech. 159 184 173 165 195 185 177 169 210
Agric., mining & on-site processing 13 10 21 20 26 10 21 20 27
Other 304 307 269 357 377 310 271 358 377
Serv. between affiliated enter., nie 160 134 142 175 250 134 142 175 250
Personal, cultural & recreational serv. 118 100 132 72 67 101 133 73 68
Audio-visual and related services 101 82 112 49 39 83 112 49 39
Other pers., cult. & recreational serv. 18 18 22 22 26 18 22 22 26
Government services, n i e 158 135 165 126 162 136 166 127 163
Services not allocated 150 0 2 -1 6 0 2 -1 6

Statistical tablesTable 3.4 III
97 European Union international trade in services
3.4.3 EU trade in services broken down by itemsReporter: EU-25 (from 2003 to 2007) EU-27 (from 2004 to 2007)Partner: Canada
(Mio EUR)
EU-25 EU-27
2003 2004 2005 2006 2007 2004 2005 2006 2007
NETSERVICES 408 1 273 1 598 1 927 2 030 1 272 1 595 1 930 2 047
Transportation 424 727 690 944 1 113 726 693 950 1 136
Sea transport 125 277 216 195 370 276 216 195 371
Passenger transport on sea 51 0 3 5 1 0 3 5 1
Freight transport on sea 406 580 412 618 853 579 413 619 854
Supp., aux. and other services -331 -305 -196 -423 -484 -305 -196 -424 -484
Air transport 243 428 403 630 692 428 405 636 713
Passenger transport by air 292 403 626 666 580 403 628 672 590
Freight transport by air 45 45 46 32 50 45 47 33 62
Supp., aux. and other services -98 -23 -272 -73 61 -23 -272 -72 61
Other transportation 54 25 72 119 54 25 72 120 56
Passenger on other transport : 23 27 27 29 23 26 27 30
Freight on other transport : 10 61 104 74 11 61 105 74
Other on other transport : -9 -14 -14 -49 -9 -14 -14 -49
Space transport 0 0 8 0 0 0 8 0 0
Rail transport 17 27 30 43 33 26 30 43 34
Road transport 35 13 57 106 76 14 57 106 75
Inland waterway transport 0 0 -1 -1 -2 0 -1 -1 -2
Pipeline transport 3 0 0 0 0 0 0 0 0
Other sup., and aux. transport serv. -1 -16 -22 -31 -53 -16 -22 -31 -53
Travel -316 -229 161 118 65 -231 160 120 60
Business travel : -56 -52 -132 -82 -58 -52 -131 -89
Personal travel : -172 212 249 146 -173 211 250 149
Other services 404 773 748 858 854 775 743 852 853
Communication services 43 32 -4 17 40 32 -2 17 39
Postal and courier services 4 9 7 10 2 9 7 10 2
Telecommunication services 39 24 -11 8 38 24 -9 9 37
Construction services -25 10 24 -45 -161 11 23 -45 -159
Construction abroad -19 44 37 -35 -164 44 37 -35 -164
Constr. in the compiling economy -5 -32 -12 -10 3 -33 -13 -10 5
Insurance services 459 413 322 81 262 413 322 80 260
Financial services 305 351 381 596 761 351 380 597 761
Computer and information services 45 159 224 248 118 159 225 255 127
Computer services 50 56 35 9 16 56 37 15 26
Information services -4 105 191 239 103 105 190 239 103
Royalties and licence fees -65 176 62 4 52 175 57 -3 45
Other business services -270 -309 -124 -11 -177 -308 -127 -16 -180
Merc. & other trade-related serv. 95 113 82 136 98 113 81 136 98
Merchanting 142 196 124 222 194 196 123 222 195
Other trade-related services -47 -82 -42 -89 -97 -82 -42 -88 -98
Operational leasing -2 56 104 156 135 56 105 156 139
Misc. business, prof. & tech. serv. -359 -479 -311 -301 -411 -479 -314 -306 -417
Legal, acc., man., cons. & pub. rel. 64 -30 57 145 69 -30 56 142 65
Adv., market research & polling -54 -67 -43 -42 -28 -67 -43 -45 -29
Research and development -308 -299 -412 -492 -505 -299 -412 -493 -505
Architectural, engin. & other tech. -1 -23 43 56 20 -24 41 56 7
Agric., mining & on-site processing 61 37 7 69 53 37 7 69 62
Other -137 -135 -39 -62 -2 -136 -40 -63 -1
Serv. between affiliated enter., nie 13 37 79 26 -17 37 80 28 -15
Personal, cultural & recreational serv. -59 -40 -77 -9 -6 -40 -77 -8 -6
Audio-visual and related services -52 -37 -69 -4 2 -36 -70 -4 2
Other pers., cult. & recreational serv. -9 -5 -8 -3 -6 -5 -8 -3 -6
Government services, n i e -29 -19 -58 -25 -34 -18 -58 -25 -34
Services not allocated -104 1 - 7 0 1 0 6 -
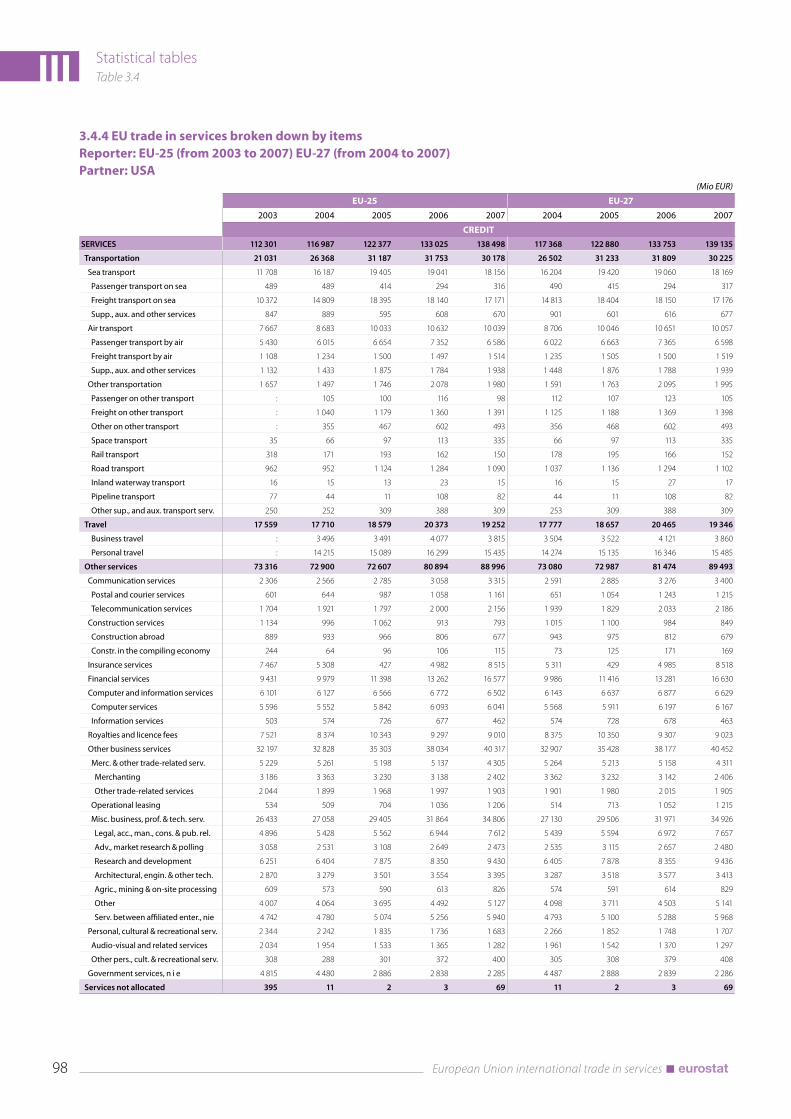
III
98 European Union international trade in services
Statistical tablesTable 3.4
3.4.4 EU trade in services broken down by itemsReporter: EU-25 (from 2003 to 2007) EU-27 (from 2004 to 2007)Partner: USA
(Mio EUR)
EU-25 EU-27
2003 2004 2005 2006 2007 2004 2005 2006 2007
CREDITSERVICES 112 301 116 987 122 377 133 025 138 498 117 368 122 880 133 753 139 135
Transportation 21 031 26 368 31 187 31 753 30 178 26 502 31 233 31 809 30 225
Sea transport 11 708 16 187 19 405 19 041 18 156 16 204 19 420 19 060 18 169
Passenger transport on sea 489 489 414 294 316 490 415 294 317
Freight transport on sea 10 372 14 809 18 395 18 140 17 171 14 813 18 404 18 150 17 176
Supp., aux. and other services 847 889 595 608 670 901 601 616 677
Air transport 7 667 8 683 10 033 10 632 10 039 8 706 10 046 10 651 10 057
Passenger transport by air 5 430 6 015 6 654 7 352 6 586 6 022 6 663 7 365 6 598
Freight transport by air 1 108 1 234 1 500 1 497 1 514 1 235 1 505 1 500 1 519
Supp., aux. and other services 1 132 1 433 1 875 1 784 1 938 1 448 1 876 1 788 1 939
Other transportation 1 657 1 497 1 746 2 078 1 980 1 591 1 763 2 095 1 995
Passenger on other transport : 105 100 116 98 112 107 123 105
Freight on other transport : 1 040 1 179 1 360 1 391 1 125 1 188 1 369 1 398
Other on other transport : 355 467 602 493 356 468 602 493
Space transport 35 66 97 113 335 66 97 113 335
Rail transport 318 171 193 162 150 178 195 166 152
Road transport 962 952 1 124 1 284 1 090 1 037 1 136 1 294 1 102
Inland waterway transport 16 15 13 23 15 16 15 27 17
Pipeline transport 77 44 11 108 82 44 11 108 82
Other sup., and aux. transport serv. 250 252 309 388 309 253 309 388 309
Travel 17 559 17 710 18 579 20 373 19 252 17 777 18 657 20 465 19 346
Business travel : 3 496 3 491 4 077 3 815 3 504 3 522 4 121 3 860
Personal travel : 14 215 15 089 16 299 15 435 14 274 15 135 16 346 15 485
Other services 73 316 72 900 72 607 80 894 88 996 73 080 72 987 81 474 89 493
Communication services 2 306 2 566 2 785 3 058 3 315 2 591 2 885 3 276 3 400
Postal and courier services 601 644 987 1 058 1 161 651 1 054 1 243 1 215
Telecommunication services 1 704 1 921 1 797 2 000 2 156 1 939 1 829 2 033 2 186
Construction services 1 134 996 1 062 913 793 1 015 1 100 984 849
Construction abroad 889 933 966 806 677 943 975 812 679
Constr. in the compiling economy 244 64 96 106 115 73 125 171 169
Insurance services 7 467 5 308 427 4 982 8 515 5 311 429 4 985 8 518
Financial services 9 431 9 979 11 398 13 262 16 577 9 986 11 416 13 281 16 630
Computer and information services 6 101 6 127 6 566 6 772 6 502 6 143 6 637 6 877 6 629
Computer services 5 596 5 552 5 842 6 093 6 041 5 568 5 911 6 197 6 167
Information services 503 574 726 677 462 574 728 678 463
Royalties and licence fees 7 521 8 374 10 343 9 297 9 010 8 375 10 350 9 307 9 023
Other business services 32 197 32 828 35 303 38 034 40 317 32 907 35 428 38 177 40 452
Merc. & other trade-related serv. 5 229 5 261 5 198 5 137 4 305 5 264 5 213 5 158 4 311
Merchanting 3 186 3 363 3 230 3 138 2 402 3 362 3 232 3 142 2 406
Other trade-related services 2 044 1 899 1 968 1 997 1 903 1 901 1 980 2 015 1 905
Operational leasing 534 509 704 1 036 1 206 514 713 1 052 1 215
Misc. business, prof. & tech. serv. 26 433 27 058 29 405 31 864 34 806 27 130 29 506 31 971 34 926
Legal, acc., man., cons. & pub. rel. 4 896 5 428 5 562 6 944 7 612 5 439 5 594 6 972 7 657
Adv., market research & polling 3 058 2 531 3 108 2 649 2 473 2 535 3 115 2 657 2 480
Research and development 6 251 6 404 7 875 8 350 9 430 6 405 7 878 8 355 9 436
Architectural, engin. & other tech. 2 870 3 279 3 501 3 554 3 395 3 287 3 518 3 577 3 413
Agric., mining & on-site processing 609 573 590 613 826 574 591 614 829
Other 4 007 4 064 3 695 4 492 5 127 4 098 3 711 4 503 5 141
Serv. between affiliated enter., nie 4 742 4 780 5 074 5 256 5 940 4 793 5 100 5 288 5 968
Personal, cultural & recreational serv. 2 344 2 242 1 835 1 736 1 683 2 266 1 852 1 748 1 707
Audio-visual and related services 2 034 1 954 1 533 1 365 1 282 1 961 1 542 1 370 1 297
Other pers., cult. & recreational serv. 308 288 301 372 400 305 308 379 408
Government services, n i e 4 815 4 480 2 886 2 838 2 285 4 487 2 888 2 839 2 286
Services not allocated 395 11 2 3 69 11 2 3 69

Statistical tablesTable 3.4 III
99 European Union international trade in services
3.4.4 EU trade in services broken down by itemsReporter: EU-25 (from 2003 to 2007) EU-27 (from 2004 to 2007)Partner: USA
(Mio EUR)
EU-25 EU-27
2003 2004 2005 2006 2007 2004 2005 2006 2007
DEBITSERVICES 104 618 108 120 116 662 121 701 127 348 108 355 116 980 122 029 127 717
Transportation 15 559 17 347 19 936 20 233 18 749 17 419 19 974 20 264 18 776
Sea transport 7 048 7 832 9 949 10 111 9 786 7 846 9 953 10 116 9 794
Passenger transport on sea 45 51 52 54 57 52 53 55 58
Freight transport on sea 2 786 2 970 3 026 3 299 3 859 2 981 3 027 3 300 3 862
Supp., aux. and other services 4 213 4 809 6 871 6 757 5 869 4 810 6 872 6 759 5 874
Air transport 6 784 8 000 8 338 8 214 7 526 8 013 8 360 8 230 7 535
Passenger transport by air 2 440 2 649 2 920 2 691 2 787 2 657 2 937 2 702 2 793
Freight transport by air 820 1 443 1 626 1 492 1 105 1 445 1 626 1 492 1 105
Supp., aux. and other services 3 527 3 909 3 791 4 034 3 632 3 911 3 795 4 039 3 635
Other transportation 1 727 1 514 1 648 1 907 1 436 1 560 1 660 1 918 1 446
Passenger on other transport : 11 17 33 60 18 24 41 65
Freight on other transport : 631 623 779 755 666 626 781 759
Other on other transport : 872 1 010 1 097 619 875 1 011 1 097 620
Space transport 34 50 98 69 1 50 98 69 1
Rail transport 184 115 65 69 57 123 66 70 59
Road transport 613 530 531 702 758 563 541 711 766
Inland waterway transport 17 11 13 14 16 12 14 15 16
Pipeline transport 22 25 6 20 16 25 6 20 16
Other sup., and aux. transport serv. 858 785 935 1 033 585 788 935 1 033 585
Travel 15 763 15 832 16 156 15 869 16 751 15 887 16 229 15 943 16 870
Business travel : 4 092 4 208 4 381 4 179 4 112 4 240 4 420 4 256
Personal travel : 11 740 11 949 11 487 12 573 11 775 11 990 11 523 12 614
Other services 72 084 74 933 80 559 85 597 91 721 75 040 80 767 85 820 91 944
Communication services 2 691 2 738 2 906 3 224 3 278 2 747 2 919 3 236 3 290
Postal and courier services 829 931 1 140 1 368 1 552 931 1 141 1 368 1 552
Telecommunication services 1 861 1 808 1 766 1 857 1 727 1 817 1 779 1 869 1 739
Construction services 752 743 546 573 786 746 548 586 800
Construction abroad 629 557 416 482 647 558 416 483 647
Constr. in the compiling economy 122 186 130 91 141 190 131 103 155
Insurance services 1 991 2 336 1 482 2 301 2 396 2 343 1 494 2 315 2 411
Financial services 4 620 5 230 5 976 7 302 7 845 5 239 5 997 7 330 7 887
Computer and information services 4 226 4 699 4 695 5 329 5 541 4 704 4 719 5 357 5 564
Computer services 3 833 4 329 4 331 4 887 5 103 4 333 4 353 4 914 5 123
Information services 388 370 364 441 438 370 365 442 440
Royalties and licence fees 18 514 19 664 21 025 19 433 22 921 19 672 21 053 19 457 22 946
Other business services 32 691 33 465 38 197 40 292 43 248 33 521 38 279 40 381 43 328
Merc. & other trade-related serv. 3 961 3 409 3 635 3 601 4 825 3 413 3 649 3 613 4 829
Merchanting 0 0 0 0 0 0 0 0 0
Other trade-related services 3 961 3 409 3 635 3 601 4 825 3 413 3 649 3 613 4 829
Operational leasing 1 588 1 648 2 768 2 904 3 005 1 653 2 774 2 911 3 009
Misc. business, prof. & tech. serv. 27 140 28 408 31 792 33 790 35 416 28 455 31 854 33 859 35 488
Legal, acc., man., cons. & pub. rel. 5 572 5 462 5 179 5 850 6 898 5 475 5 203 5 882 6 927
Adv., market research & polling 2 515 3 773 4 739 5 337 4 889 3 776 4 752 5 344 4 894
Research and development 6 653 7 232 9 018 8 902 9 515 7 232 9 019 8 902 9 517
Architectural, engin. & other tech. 1 791 2 002 2 041 2 084 2 289 2 010 2 051 2 098 2 309
Agric., mining & on-site processing 98 80 114 137 243 81 120 139 244
Other 4 917 4 803 4 973 5 314 5 578 4 825 4 981 5 325 5 591
Serv. between affiliated enter., nie 5 596 5 056 5 728 6 162 6 004 5 057 5 730 6 164 6 007
Personal, cultural & recreational serv. 3 984 3 976 3 881 4 862 3 545 3 983 3 890 4 869 3 553
Audio-visual and related services 3 701 3 614 3 541 4 468 3 084 3 616 3 548 4 473 3 088
Other pers., cult. & recreational serv. 281 362 340 394 460 367 342 396 464
Government services, n i e 2 616 2 082 1 850 2 279 2 161 2 085 1 868 2 290 2 166
Services not allocated 1 212 7 11 -1 127 7 11 -1 127

III
100 European Union international trade in services
Statistical tablesTable 3.4
3.4.4 EU trade in services broken down by itemsReporter: EU-25 (from 2003 to 2007) EU-27 (from 2004 to 2007)Partner: USA
(Mio EUR)
EU-25 EU-27
2003 2004 2005 2006 2007 2004 2005 2006 2007
NETSERVICES 7 683 8 866 5 715 11 324 11 151 9 014 5 900 11 724 11 417
Transportation 5 472 9 020 11 251 11 520 11 430 9 083 11 259 11 545 11 449
Sea transport 4 660 8 355 9 456 8 930 8 370 8 358 9 467 8 944 8 375
Passenger transport on sea 444 438 362 240 260 438 361 240 259
Freight transport on sea 7 586 11 839 15 369 14 841 13 312 11 832 15 376 14 850 13 314
Supp., aux. and other services -3 367 -3 920 -6 276 -6 149 -5 199 -3 909 -6 271 -6 143 -5 197
Air transport 884 683 1 694 2 418 2 513 694 1 686 2 421 2 523
Passenger transport by air 2 990 3 366 3 734 4 661 3 798 3 365 3 725 4 663 3 805
Freight transport by air 288 -208 -125 5 409 -210 -122 8 414
Supp., aux. and other services -2 395 -2 476 -1 916 -2 250 -1 695 -2 463 -1 919 -2 251 -1 697
Other transportation -70 -17 98 171 544 31 103 177 549
Passenger on other transport : 93 83 83 38 94 82 82 40
Freight on other transport : 409 556 581 636 459 562 588 640
Other on other transport : -517 -543 -495 -127 -519 -543 -494 -127
Space transport 1 16 -1 45 334 16 -1 45 334
Rail transport 134 56 128 94 93 55 128 96 93
Road transport 349 422 593 582 331 473 595 584 336
Inland waterway transport -1 3 -1 9 -1 4 2 12 0
Pipeline transport 55 19 5 88 66 19 5 88 66
Other sup., and aux. transport serv. -609 -533 -626 -645 -277 -535 -626 -645 -276
Travel 1 796 1 878 2 423 4 504 2 500 1 890 2 427 4 522 2 476
Business travel : -595 -717 -304 -363 -608 -717 -298 -397
Personal travel : 2 475 3 140 4 812 2 862 2 499 3 145 4 824 2 871
Other services 1 231 -2 033 -7 952 -4 703 -2 724 -1 960 -7 780 -4 346 -2 451
Communication services -385 -172 -122 -166 37 -156 -34 40 110
Postal and courier services -229 -287 -154 -310 -392 -281 -86 -125 -338
Telecommunication services -157 113 30 144 429 122 50 164 448
Construction services 382 254 517 340 7 269 552 398 49
Construction abroad 260 376 550 324 30 385 559 329 31
Constr. in the compiling economy 121 -123 -33 15 -26 -117 -6 68 15
Insurance services 5 476 2 972 -1 055 2 680 6 119 2 969 -1 065 2 670 6 108
Financial services 4 810 4 748 5 422 5 960 8 732 4 747 5 419 5 951 8 743
Computer and information services 1 875 1 428 1 871 1 443 961 1 439 1 918 1 520 1 065
Computer services 1 763 1 223 1 511 1 205 938 1 234 1 558 1 283 1 044
Information services 115 204 362 236 24 204 362 236 23
Royalties and licence fees -10 993 -11 290 -10 682 -10 136 -13 911 -11 297 -10 702 -10 150 -13 923
Other business services -494 -637 -2 893 -2 258 -2 931 -614 -2 851 -2 203 -2 877
Merc. & other trade-related serv. 1 267 1 852 1 563 1 537 -520 1 850 1 564 1 546 -518
Merchanting 3 186 3 363 3 230 3 138 2 402 3 362 3 232 3 142 2 405
Other trade-related services -1 918 -1 510 -1 668 -1 604 -2 922 -1 512 -1 669 -1 598 -2 924
Operational leasing -1 053 -1 139 -2 064 -1 868 -1 799 -1 139 -2 061 -1 859 -1 794
Misc. business, prof. & tech. serv. -707 -1 351 -2 386 -1 926 -610 -1 325 -2 348 -1 888 -562
Legal, acc., man., cons. & pub. rel. -676 -34 383 1 094 714 -36 392 1 090 730
Adv., market research & polling 543 -1 243 -1 631 -2 688 -2 416 -1 241 -1 637 -2 687 -2 414
Research and development -403 -828 -1 143 -551 -84 -827 -1 141 -547 -82
Architectural, engin. & other tech. 1 080 1 277 1 460 1 470 1 106 1 278 1 467 1 479 1 104
Agric., mining & on-site processing 511 493 476 477 583 494 471 475 584
Other -910 -739 -1 277 -822 -451 -727 -1 269 -822 -450
Serv. between affiliated enter., nie -854 -276 -654 -905 -64 -264 -630 -876 -39
Personal, cultural & recreational serv. -1 640 -1 734 -2 046 -3 126 -1 863 -1 717 -2 038 -3 121 -1 846
Audio-visual and related services -1 668 -1 660 -2 008 -3 103 -1 802 -1 655 -2 006 -3 104 -1 791
Other pers., cult. & recreational serv. 28 -74 -39 -22 -60 -61 -33 -16 -55
Government services, n i e 2 199 2 398 1 036 559 124 2 402 1 020 549 120
Services not allocated -816 4 -9 4 -58 4 -8 4 -58

Statistical tablesTable 3.4 III
101 European Union international trade in services
3.4.5 EU trade in services broken down by itemsReporter: EU-25 (from 2003 to 2007) EU-27 (from 2004 to 2007)Partner: Japan
(Mio EUR)
EU-25 EU-27
2003 2004 2005 2006 2007 2004 2005 2006 2007
CREDITSERVICES 16 755 18 319 19 579 18 562 19 333 18 354 19 620 18 607 19 378
Transportation 4 284 4 981 5 066 5 123 5 035 4 990 5 070 5 127 5 038
Sea transport 2 080 2 487 2 562 2 563 2 721 2 488 2 563 2 564 2 722
Passenger transport on sea 2 3 4 14 8 3 4 14 8
Freight transport on sea 1 871 2 222 2 316 2 250 2 396 2 223 2 316 2 251 2 397
Supp., aux. and other services 208 262 240 298 318 263 240 298 318
Air transport 1 962 2 294 2 281 2 298 2 102 2 295 2 283 2 299 2 102
Passenger transport by air 1 278 1 414 1 370 1 396 1 248 1 415 1 372 1 397 1 248
Freight transport by air 434 528 524 461 414 528 525 461 414
Supp., aux. and other services 252 355 388 442 439 356 388 442 439
Other transportation 240 200 225 263 211 206 226 264 212
Passenger on other transport : 12 11 9 15 13 12 10 16
Freight on other transport : 107 133 166 156 112 133 166 156
Other on other transport : 80 81 88 40 80 81 88 40
Space transport 0 1 22 43 33 1 22 43 33
Rail transport 30 16 17 13 23 17 17 13 23
Road transport 155 124 129 152 126 129 130 153 127
Inland waterway transport 2 3 1 2 3 3 1 2 3
Pipeline transport 6 2 1 1 1 2 1 1 1
Other sup., and aux. transport serv. 45 52 55 51 27 52 55 51 27
Travel 2 965 2 252 2 350 2 410 2 168 2 258 2 362 2 422 2 181
Business travel : 531 544 644 565 532 547 650 570
Personal travel : 1 721 1 806 1 763 1 602 1 727 1 813 1 771 1 610
Other services 9 419 11 088 12 162 11 031 12 119 11 107 12 187 11 059 12 149
Communication services 117 327 313 142 154 328 321 143 165
Postal and courier services 33 36 41 38 33 37 48 39 43
Telecommunication services 85 289 272 102 120 290 273 103 121
Construction services 74 94 105 148 119 102 108 157 122
Construction abroad 69 93 101 144 114 93 101 144 114
Constr. in the compiling economy 5 2 3 4 5 10 6 13 7
Insurance services 515 267 254 508 387 268 254 508 387
Financial services 1 876 2 336 3 005 3 606 4 426 2 336 3 005 3 606 4 426
Computer and information services 587 657 701 774 990 658 702 774 991
Computer services 439 630 659 704 893 631 660 705 895
Information services 147 27 42 69 97 27 42 69 97
Royalties and licence fees 1 576 1 906 2 068 1 713 1 805 1 906 2 068 1 714 1 806
Other business services 4 456 4 905 5 167 3 760 3 900 4 910 5 178 3 774 3 913
Merc. & other trade-related serv. 715 752 1 085 471 868 752 1 086 471 868
Merchanting 397 478 632 271 694 478 632 271 694
Other trade-related services 318 275 450 198 175 275 451 198 175
Operational leasing 118 104 106 94 30 104 106 94 30
Misc. business, prof. & tech. serv. 3 623 4 050 3 974 3 193 2 999 4 055 3 984 3 207 3 012
Legal, acc., man., cons. & pub. rel. 581 632 680 813 753 633 680 815 755
Adv., market research & polling 200 199 317 228 160 199 317 228 160
Research and development 1 197 1 172 1 098 899 993 1 172 1 098 899 993
Architectural, engin. & other tech. 802 727 504 341 269 728 508 347 270
Agric., mining & on-site processing 7 37 52 25 13 37 52 25 13
Other 381 506 578 536 400 508 580 536 407
Serv. between affiliated enter., nie 455 777 743 352 408 778 745 356 411
Personal, cultural & recreational serv. 162 541 499 343 308 542 500 344 308
Audio-visual and related services 132 487 453 299 272 488 453 299 272
Other pers., cult. & recreational serv. 31 54 46 43 36 55 47 44 36
Government services, n i e 55 55 50 39 30 56 51 39 30
Services not allocated 87 -2 0 -3 11 -2 1 -3 11

III
102 European Union international trade in services
Statistical tablesTable 3.4
3.4.5 EU trade in services broken down by itemsReporter: EU-25 (from 2003 to 2007) EU-27 (from 2004 to 2007)Partner: Japan
(Mio EUR)
EU-25 EU-27
2003 2004 2005 2006 2007 2004 2005 2006 2007
DEBITSERVICES 10 185 10 644 11 990 13 182 13 795 10 652 12 001 13 193 13 805
Transportation 3 658 4 230 4 473 4 717 4 852 4 232 4 473 4 718 4 854
Sea transport 2 324 2 831 2 978 3 295 3 466 2 831 2 978 3 295 3 468
Passenger transport on sea 1 3 3 4 2 3 3 4 2
Freight transport on sea 1 462 1 950 2 389 2 676 2 882 1 951 2 389 2 677 2 882
Supp., aux. and other services 860 877 584 613 585 878 584 613 586
Air transport 1 009 987 1 056 935 860 987 1 056 935 860
Passenger transport by air 240 211 286 284 259 211 287 284 259
Freight transport by air 206 336 300 290 284 336 300 290 284
Supp., aux. and other services 561 441 469 360 319 441 469 360 319
Other transportation 325 414 443 487 526 415 443 488 526
Passenger on other transport : 1 1 2 2 1 1 2 2
Freight on other transport : 225 274 294 279 226 274 295 280
Other on other transport : 188 167 191 245 188 167 191 245
Space transport 0 0 0 0 0 0 0 0 0
Rail transport 18 20 26 24 30 20 26 24 30
Road transport 144 198 222 236 227 199 223 236 227
Inland waterway transport 4 21 33 30 30 21 33 30 30
Pipeline transport 2 2 0 1 1 2 0 1 1
Other sup., and aux. transport serv. 157 175 161 198 239 175 161 198 239
Travel 754 673 865 920 898 675 867 921 900
Business travel : 240 310 333 264 241 311 334 265
Personal travel : 435 555 588 634 436 556 588 635
Other services 5 396 5 739 6 650 7 546 8 034 5 744 6 658 7 556 8 039
Communication services 99 81 95 101 117 82 96 102 117
Postal and courier services 36 30 41 31 34 30 41 31 34
Telecommunication services 64 52 53 69 82 52 54 70 82
Construction services 105 105 84 125 77 105 82 125 77
Construction abroad 67 96 73 89 66 96 73 89 66
Constr. in the compiling economy 37 9 11 35 10 9 9 35 10
Insurance services 119 122 143 144 157 122 144 145 157
Financial services 1 010 1 068 1 211 1 671 1 501 1 068 1 211 1 671 1 502
Computer and information services 196 245 206 175 132 246 208 178 134
Computer services 193 238 200 164 125 239 201 166 127
Information services 3 7 5 11 9 7 6 11 9
Royalties and licence fees 1 138 1 160 1 496 1 485 1 592 1 160 1 496 1 486 1 592
Other business services 2 594 2 808 3 281 3 682 4 305 2 811 3 286 3 686 4 307
Merc. & other trade-related serv. 372 337 369 379 496 337 369 379 496
Merchanting 0 0 0 0 0 0 0 0 0
Other trade-related services 372 337 369 379 496 337 369 379 496
Operational leasing 167 121 169 158 174 121 169 158 174
Misc. business, prof. & tech. serv. 2 054 2 351 2 741 3 146 3 638 2 354 2 746 3 150 3 640
Legal, acc., man., cons. & pub. rel. 334 374 328 461 395 376 331 464 395
Adv., market research & polling 156 160 169 201 242 160 170 201 242
Research and development 414 525 595 600 678 525 595 600 678
Architectural, engin. & other tech. 260 496 353 379 440 497 354 380 442
Agric., mining & on-site processing 5 9 49 33 32 9 49 33 32
Other 508 452 907 1 093 1 478 453 907 1 093 1 478
Serv. between affiliated enter., nie 373 331 339 379 369 332 339 380 369
Personal, cultural & recreational serv. 42 54 53 65 45 55 53 65 45
Audio-visual and related services 22 37 35 46 26 37 35 46 26
Other pers., cult. & recreational serv. 20 17 18 19 21 17 18 19 21
Government services, n i e 92 96 82 98 109 96 82 99 109
Services not allocated 377 2 0 -1 11 2 0 -1 11

Statistical tablesTable 3.4 III
103 European Union international trade in services
3.4.5 EU trade in services broken down by itemsReporter: EU-25 (from 2003 to 2007) EU-27 (from 2004 to 2007)Partner: Japan
(Mio EUR)
EU-25 EU-27
2003 2004 2005 2006 2007 2004 2005 2006 2007
NETSERVICES 6 570 7 675 7 589 5 380 5 537 7 701 7 619 5 413 5 573
Transportation 626 751 594 407 183 758 597 409 184
Sea transport -244 -344 -416 -731 -746 -344 -415 -731 -746
Passenger transport on sea 1 0 1 10 6 0 1 10 6
Freight transport on sea 409 272 -73 -426 -485 272 -72 -426 -485
Supp., aux. and other services -653 -616 -344 -315 -267 -615 -344 -315 -268
Air transport 953 1 307 1 225 1 363 1 242 1 309 1 227 1 365 1 243
Passenger transport by air 1 037 1 204 1 084 1 111 989 1 204 1 085 1 112 989
Freight transport by air 228 192 224 171 130 192 225 171 130
Supp., aux. and other services -309 -86 -81 82 120 -86 -81 82 120
Other transportation -85 -214 -218 -225 -315 -209 -217 -224 -315
Passenger on other transport : 11 10 7 13 11 11 8 14
Freight on other transport : -118 -141 -128 -123 -114 -141 -128 -123
Other on other transport : -108 -86 -103 -206 -108 -86 -103 -206
Space transport 0 1 22 43 33 1 22 43 33
Rail transport 12 -4 -9 -11 -7 -4 -9 -11 -7
Road transport 11 -74 -93 -83 -102 -69 -93 -83 -101
Inland waterway transport -1 -18 -32 -29 -27 -18 -32 -29 -27
Pipeline transport 5 1 0 0 0 1 0 0 0
Other sup., and aux. transport serv. -112 -123 -106 -147 -212 -123 -106 -147 -212
Travel 2 211 1 578 1 485 1 490 1 269 1 583 1 494 1 501 1 280
Business travel : 291 234 311 301 291 236 316 305
Personal travel : 1 287 1 250 1 175 968 1 292 1 257 1 182 975
Other services 4 023 5 349 5 512 3 485 4 085 5 363 5 528 3 504 4 109
Communication services 18 245 218 41 37 246 225 42 48
Postal and courier services -3 6 0 7 -2 6 7 8 8
Telecommunication services 20 237 220 33 38 238 220 34 39
Construction services -30 -11 21 22 42 -2 26 32 45
Construction abroad 2 -3 28 54 48 -3 28 54 49
Constr. in the compiling economy -32 -7 -8 -31 -5 1 -3 -21 -3
Insurance services 397 146 111 364 231 145 111 363 231
Financial services 866 1 268 1 794 1 935 2 925 1 268 1 793 1 935 2 924
Computer and information services 391 412 495 598 857 413 494 596 857
Computer services 246 392 459 540 769 392 458 539 768
Information services 144 20 37 58 88 20 37 58 88
Royalties and licence fees 438 746 572 227 213 746 572 228 214
Other business services 1 862 2 097 1 886 78 -406 2 100 1 892 88 -394
Merc. & other trade-related serv. 344 415 716 92 372 415 717 92 372
Merchanting 397 478 632 271 694 478 632 271 694
Other trade-related services -53 -62 82 -181 -321 -62 82 -181 -321
Operational leasing -49 -17 -63 -65 -144 -17 -63 -65 -144
Misc. business, prof. & tech. serv. 1 569 1 699 1 233 46 -639 1 701 1 238 56 -628
Legal, acc., man., cons. & pub. rel. 248 258 351 352 359 258 349 351 360
Adv., market research & polling 44 38 148 27 -82 38 147 27 -82
Research and development 783 648 503 299 315 648 503 299 315
Architectural, engin. & other tech. 542 231 151 -38 -171 232 155 -33 -172
Agric., mining & on-site processing 2 29 4 -8 -19 29 4 -8 -19
Other -126 54 -330 -558 -1 077 55 -327 -557 -1 071
Serv. between affiliated enter., nie 83 445 404 -27 39 446 406 -23 42
Personal, cultural & recreational serv. 120 487 446 278 263 488 447 279 263
Audio-visual and related services 111 450 418 253 246 450 419 253 246
Other pers., cult. & recreational serv. 11 38 28 24 16 38 28 25 16
Government services, n i e -37 -41 -32 -59 -78 -40 -32 -60 -79
Services not allocated -289 -3 0 -1 0 -3 0 -1 -

III
104 European Union international trade in services
Statistical tablesTable 3.4
3.4.6 EU trade in services broken down by itemsReporter: EU-25 (from 2003 to 2007) EU-27 (from 2004 to 2007)Partner: Brazil
(Mio EUR)
EU-25 EU-27
2003 2004 2005 2006 2007 2004 2005 2006 2007
CREDITSERVICES 3 371 3 712 4 622 5 257 6 402 3 715 4 625 5 259 6 417
Transportation 1 050 1 301 2 007 2 118 2 320 1 302 2 008 2 119 2 320
Sea transport 498 645 1 122 1 014 1 160 646 1 123 1 014 1 160
Passenger transport on sea 0 0 0 0 0 0 0 0 0
Freight transport on sea 469 630 1 097 991 1 121 630 1 097 991 1 122
Supp., aux. and other services 30 15 27 23 38 15 27 23 38
Air transport 491 618 813 997 1 046 618 813 997 1 046
Passenger transport by air 344 421 582 765 861 421 582 765 861
Freight transport by air 64 88 98 100 106 88 98 100 106
Supp., aux. and other services 81 108 133 133 79 109 133 133 79
Other transportation 59 38 71 106 115 38 71 106 116
Passenger on other transport : 0 2 4 5 0 2 4 5
Freight on other transport : 31 53 65 81 31 53 65 81
Other on other transport : 6 16 36 28 6 16 36 28
Space transport 0 0 0 0 0 0 0 0 0
Rail transport 7 1 2 4 2 1 2 4 2
Road transport 39 31 56 73 93 31 56 73 93
Inland waterway transport 0 0 0 1 2 0 0 1 2
Pipeline transport 2 0 0 1 1 0 0 1 1
Other sup., and aux. transport serv. 9 5 12 28 17 5 12 28 17
Travel 723 681 916 1 219 1 401 682 917 1 221 1 403
Business travel : 162 187 267 284 163 187 268 285
Personal travel : 521 726 952 1 118 521 727 953 1 119
Other services 1 547 1 728 1 699 1 921 2 681 1 729 1 701 1 921 2 694
Communication services 93 73 71 97 122 73 71 97 123
Postal and courier services 9 8 7 9 9 8 7 9 9
Telecommunication services 83 64 63 87 112 65 63 87 113
Construction services 169 91 248 317 407 91 248 317 407
Construction abroad 166 82 236 299 389 82 237 299 389
Constr. in the compiling economy 3 8 11 17 19 8 11 17 19
Insurance services 100 53 30 92 95 53 30 92 95
Financial services 77 106 101 145 206 106 101 145 206
Computer and information services 119 140 177 239 242 140 177 239 242
Computer services 97 136 169 234 232 136 169 234 232
Information services 22 6 8 6 9 6 8 6 9
Royalties and licence fees 130 267 190 294 414 267 190 294 414
Other business services 783 900 780 618 1 074 900 781 618 1 086
Merc. & other trade-related serv. 67 171 -184 -624 -207 171 -183 -624 -207
Merchanting 35 118 -233 -692 -261 118 -233 -692 -261
Other trade-related services 33 51 51 69 56 51 51 69 56
Operational leasing 43 74 89 137 100 74 89 137 112
Misc. business, prof. & tech. serv. 672 653 874 1 105 1 182 653 874 1 105 1 182
Legal, acc., man., cons. & pub. rel. 55 94 119 120 100 94 119 120 100
Adv., market research & polling 26 13 13 20 17 13 13 20 17
Research and development 81 34 61 70 76 34 61 70 76
Architectural, engin. & other tech. 120 162 157 175 158 162 157 175 158
Agric., mining & on-site processing 30 47 189 242 254 47 189 242 254
Other 201 192 223 305 143 192 223 305 143
Serv. between affiliated enter., nie 158 110 113 176 432 110 113 176 432
Personal, cultural & recreational serv. 51 75 75 77 82 75 75 77 82
Audio-visual and related services 29 55 69 71 76 55 69 71 76
Other pers., cult. & recreational serv. 21 20 5 6 7 20 5 6 7
Government services, n i e 24 24 27 42 40 24 27 42 40
Services not allocated 51 2 - -2 - 2 - -2 -

Statistical tablesTable 3.4 III
105 European Union international trade in services
3.4.6 EU trade in services broken down by itemsReporter: EU-25 (from 2003 to 2007) EU-27 (from 2004 to 2007)Partner: Brazil
(Mio EUR)
EU-25 EU-27
2003 2004 2005 2006 2007 2004 2005 2006 2007
DEBITSERVICES 3 487 3 442 4 016 4 644 4 784 3 446 4 022 4 650 4 791
Transportation 1 094 1 142 1 328 1 493 1 573 1 143 1 331 1 497 1 577
Sea transport 550 556 682 756 797 556 682 756 799
Passenger transport on sea 0 0 1 0 0 0 1 0 0
Freight transport on sea 337 349 355 375 455 349 356 375 456
Supp., aux. and other services 212 208 324 382 342 208 324 382 342
Air transport 495 533 565 516 502 534 565 518 503
Passenger transport by air 289 315 297 251 178 316 297 251 178
Freight transport by air 28 44 44 53 65 44 44 53 65
Supp., aux. and other services 178 174 225 210 258 174 225 212 258
Other transportation 52 51 80 222 273 51 83 223 275
Passenger on other transport : 0 0 0 0 0 0 0 0
Freight on other transport : 44 73 210 256 45 75 210 259
Other on other transport : 7 6 12 17 7 6 12 17
Space transport 0 0 0 0 0 0 0 0 0
Rail transport 3 4 4 11 4 4 4 12 4
Road transport 42 39 72 200 256 40 74 201 257
Inland waterway transport 0 0 1 2 1 0 1 2 1
Pipeline transport 0 0 0 1 1 0 1 1 1
Other sup., and aux. transport serv. 5 7 3 9 13 7 3 9 13
Travel 1 156 1 218 1 366 1 440 1 408 1 219 1 367 1 441 1 408
Business travel : 251 369 306 313 251 370 307 313
Personal travel : 967 997 1 132 1 095 967 998 1 132 1 095
Other services 1 210 1 082 1 324 1 710 1 801 1 084 1 325 1 712 1 804
Communication services 43 58 85 71 77 58 85 71 77
Postal and courier services 5 7 6 10 6 7 6 10 6
Telecommunication services 37 52 78 64 70 52 78 64 71
Construction services 87 85 84 86 112 85 84 86 112
Construction abroad 80 76 81 84 105 76 81 84 105
Constr. in the compiling economy 5 8 3 3 7 8 3 3 7
Insurance services 80 14 35 51 48 14 35 51 48
Financial services 27 68 87 109 129 68 87 109 129
Computer and information services 31 47 53 76 61 47 53 76 61
Computer services 28 46 51 75 59 46 51 75 59
Information services 2 0 0 1 2 0 0 1 2
Royalties and licence fees 16 18 21 11 21 18 21 11 21
Other business services 829 685 839 1 165 1 211 686 839 1 165 1 211
Merc. & other trade-related serv. 105 135 164 197 243 135 164 197 243
Merchanting 0 0 0 0 0 0 0 0 0
Other trade-related services 105 135 164 197 243 135 164 197 243
Operational leasing 9 9 8 7 7 9 8 7 7
Misc. business, prof. & tech. serv. 715 539 668 963 962 539 668 963 962
Legal, acc., man., cons. & pub. rel. 103 81 95 100 105 81 95 100 105
Adv., market research & polling 32 41 36 44 51 41 36 44 51
Research and development 57 44 79 97 91 44 79 97 91
Architectural, engin. & other tech. 162 95 103 78 65 95 103 78 65
Agric., mining & on-site processing 3 2 3 2 29 2 3 2 29
Other 88 81 93 133 137 82 93 133 137
Serv. between affiliated enter., nie 273 191 259 510 483 191 259 510 483
Personal, cultural & recreational serv. 41 39 36 54 60 39 37 55 61
Audio-visual and related services 13 7 10 23 11 7 10 23 11
Other pers., cult. & recreational serv. 29 30 25 31 49 30 25 31 50
Government services, n i e 56 69 85 86 84 69 86 86 84
Services not allocated 28 0 -2 1 2 0 -2 1 2

III
106 European Union international trade in services
Statistical tablesTable 3.4
3.4.6 EU trade in services broken down by itemsReporter: EU-25 (from 2003 to 2007) EU-27 (from 2004 to 2007)Partner: Brazil
(Mio EUR)
EU-25 EU-27
2003 2004 2005 2006 2007 2004 2005 2006 2007
NETSERVICES -117 270 606 613 1 618 269 603 609 1 626
Transportation -44 159 679 625 747 159 677 622 743
Sea transport -51 89 441 258 362 89 440 258 361
Passenger transport on sea 0 0 -1 0 0 0 -1 0 0
Freight transport on sea 132 282 742 616 666 281 741 616 665
Supp., aux. and other services -182 -193 -298 -359 -304 -193 -298 -359 -304
Air transport -4 84 248 481 544 84 248 479 543
Passenger transport by air 54 106 285 514 683 106 285 514 683
Freight transport by air 36 44 53 47 41 44 53 47 41
Supp., aux. and other services -97 -65 -92 -77 -179 -65 -92 -79 -179
Other transportation 8 -13 -9 -116 -158 -13 -11 -117 -160
Passenger on other transport : 0 2 4 4 0 2 4 4
Freight on other transport : -14 -20 -144 -175 -14 -22 -145 -177
Other on other transport : -1 9 24 12 -1 9 24 12
Space transport 0 0 0 0 0 0 0 0 0
Rail transport 4 -2 -2 -8 -2 -2 -3 -8 -2
Road transport -3 -8 -16 -127 -162 -8 -17 -127 -164
Inland waterway transport 0 0 -1 0 0 0 -1 0 0
Pipeline transport 2 0 0 0 0 0 0 0 0
Other sup., and aux. transport serv. 4 -2 9 19 4 -2 9 19 4
Travel -433 -537 -451 -220 -6 -537 -451 -220 -5
Business travel : -88 -182 -39 -29 -88 -182 -38 -28
Personal travel : -446 -271 -180 24 -446 -271 -180 24
Other services 338 646 375 211 880 645 375 209 890
Communication services 51 15 -14 25 45 15 -13 25 45
Postal and courier services 3 1 1 -1 3 1 1 -1 3
Telecommunication services 47 13 -16 23 42 13 -15 23 42
Construction services 82 6 164 230 295 6 165 230 295
Construction abroad 86 6 156 216 283 6 156 216 283
Constr. in the compiling economy -3 0 9 15 12 0 9 15 12
Insurance services 20 39 -4 41 48 39 -4 41 48
Financial services 50 38 15 35 77 38 15 35 77
Computer and information services 89 93 124 163 181 93 124 163 181
Computer services 69 90 117 159 172 90 117 159 172
Information services 20 5 8 5 8 5 8 5 8
Royalties and licence fees 114 249 168 283 393 249 168 283 393
Other business services -46 215 -59 -547 -137 214 -59 -547 -125
Merc. & other trade-related serv. -38 36 -348 -820 -449 36 -347 -820 -449
Merchanting 35 118 -233 -692 -261 118 -233 -692 -261
Other trade-related services -72 -84 -113 -127 -187 -84 -113 -127 -187
Operational leasing 34 65 81 130 93 65 81 130 105
Misc. business, prof. & tech. serv. -43 114 206 142 220 114 206 142 220
Legal, acc., man., cons. & pub. rel. -48 13 24 20 -6 13 24 20 -6
Adv., market research & polling -5 -28 -23 -24 -33 -28 -23 -24 -33
Research and development 24 -10 -18 -27 -16 -10 -18 -27 -16
Architectural, engin. & other tech. -41 67 54 98 93 67 54 98 93
Agric., mining & on-site processing 27 44 186 240 225 44 186 240 225
Other 113 110 130 172 5 110 130 172 5
Serv. between affiliated enter., nie -115 -81 -147 -335 -51 -81 -147 -335 -51
Personal, cultural & recreational serv. 10 36 39 23 22 35 39 22 20
Audio-visual and related services 16 48 60 49 65 48 60 49 65
Other pers., cult. & recreational serv. -8 -10 -20 -24 -42 -10 -20 -25 -43
Government services, n i e -32 -45 -58 -44 -44 -45 -59 -44 -44
Services not allocated 23 1 2 -3 -2 1 2 -3 -2

Statistical tablesTable 3.4 III
107 European Union international trade in services
3.4.7 EU trade in services broken down by itemsReporter: EU-25 (from 2003 to 2007) EU-27 (from 2004 to 2007)Partner: Russian Federation
(Mio EUR)
EU-25 EU-27
2003 2004 2005 2006 2007 2004 2005 2006 2007
CREDITSERVICES 7 764 8 968 12 119 14 350 18 869 9 219 12 408 14 699 19 238
Transportation 1 928 2 316 3 126 3 245 3 790 2 456 3 306 3 459 3 998
Sea transport 373 361 503 518 709 365 505 521 713
Passenger transport on sea 3 7 6 1 0 8 7 2 2
Freight transport on sea 238 215 364 405 547 216 364 405 548
Supp., aux. and other services 132 138 134 112 162 140 134 114 163
Air transport 312 352 572 668 805 360 578 677 814
Passenger transport by air 151 158 294 427 482 163 300 433 488
Freight transport by air 45 36 40 42 42 36 40 42 43
Supp., aux. and other services 115 159 240 199 281 162 240 202 283
Other transportation 1 243 1 605 2 050 2 059 2 278 1 734 2 223 2 260 2 473
Passenger on other transport : 11 12 16 20 27 30 38 45
Freight on other transport : 1 486 1 893 1 314 1 522 1 599 2 046 1 492 1 692
Other on other transport : 110 144 732 733 110 146 732 733
Space transport 0 0 1 0 0 0 1 0 0
Rail transport 168 192 202 169 197 195 208 174 204
Road transport 369 419 599 796 1 047 446 618 825 1 094
Inland waterway transport 1 3 3 3 5 4 4 5 7
Pipeline transport 674 920 1 149 999 912 1 017 1 295 1 164 1 051
Other sup., and aux. transport serv. 29 71 98 93 117 71 98 93 117
Travel 2 243 2 245 2 707 3 274 3 842 2 327 2 801 3 392 3 975
Business travel : 610 795 787 858 618 805 801 874
Personal travel : 1 635 1 911 2 488 2 984 1 709 1 995 2 592 3 100
Other services 3 472 4 399 6 276 7 830 11 233 4 427 6 290 7 848 11 260
Communication services 122 132 162 249 294 136 164 252 296
Postal and courier services 8 8 12 15 14 9 12 15 14
Telecommunication services 115 123 149 235 278 126 151 238 281
Construction services 431 622 849 743 892 627 851 748 899
Construction abroad 412 608 831 713 869 611 832 714 870
Constr. in the compiling economy 20 13 15 29 23 15 16 33 29
Insurance services 77 96 80 140 132 97 82 142 136
Financial services 425 539 697 1 115 1 615 540 697 1 115 1 616
Computer and information services 348 311 662 715 1 273 314 663 716 1 274
Computer services 333 295 640 694 1 247 297 640 695 1 247
Information services 15 16 21 20 28 16 21 20 28
Royalties and licence fees 114 127 223 252 501 127 223 252 502
Other business services 1 801 2 415 3 376 4 330 6 211 2 426 3 384 4 335 6 221
Merc. & other trade-related serv. 801 1 051 1 014 1 603 3 353 1 051 1 014 1 603 3 353
Merchanting 386 963 929 1 493 3 237 962 928 1 494 3 237
Other trade-related services 414 87 84 110 116 88 86 110 116
Operational leasing 36 45 71 135 208 45 71 135 208
Misc. business, prof. & tech. serv. 964 1 319 2 292 2 591 2 650 1 330 2 299 2 596 2 658
Legal, acc., man., cons. & pub. rel. 173 153 200 326 479 154 201 327 482
Adv., market research & polling 41 23 28 43 78 24 28 43 78
Research and development 46 27 22 29 49 27 22 29 49
Architectural, engin. & other tech. 150 480 869 918 981 481 873 919 982
Agric., mining & on-site processing 26 85 329 356 394 85 329 356 394
Other 445 402 659 646 461 408 660 648 462
Serv. between affiliated enter., nie 83 149 182 275 210 150 182 275 212
Personal, cultural & recreational serv. 47 42 97 82 99 44 97 82 101
Audio-visual and related services 31 25 25 40 48 25 25 40 48
Other pers., cult. & recreational serv. 15 16 71 42 51 18 72 42 53
Government services, n i e 105 115 130 205 216 116 130 205 217
Services not allocated 120 7 13 - 5 7 13 0 5

III
108 European Union international trade in services
Statistical tablesTable 3.4
3.4.7 EU item breakdown from 2003 to 2006Reporter: EU-25 (from 2003 to 2007) EU-27 (from 2004 to 2007)Partner: Russian Federation
(Mio EUR)
EU-25 EU-27
2003 2004 2005 2006 2007 2004 2005 2006 2007
DEBITSERVICES 5 762 7 871 9 800 10 752 11 778 8 008 10 006 10 986 12 030
Transportation 2 265 3 534 4 418 5 241 5 439 3 583 4 554 5 395 5 624
Sea transport 1 198 2 025 2 490 2 977 3 124 2 037 2 528 3 019 3 175
Passenger transport on sea 2 5 6 1 1 5 6 2 2
Freight transport on sea 1 036 1 764 2 154 2 572 2 743 1 775 2 192 2 614 2 793
Supp., aux. and other services 159 255 330 402 379 255 330 402 379
Air transport 454 555 669 619 645 562 676 631 655
Passenger transport by air 163 173 184 187 189 178 185 189 191
Freight transport by air 39 57 85 86 111 59 91 96 120
Supp., aux. and other services 249 323 400 344 343 324 400 344 343
Other transportation 616 956 1 258 1 643 1 669 985 1 348 1 743 1 792
Passenger on other transport : 37 43 35 33 40 46 40 36
Freight on other transport : 803 1 016 1 317 1 346 827 1 102 1 413 1 467
Other on other transport : 115 199 289 289 117 199 289 289
Space transport 0 7 42 0 0 7 42 0 0
Rail transport 134 208 245 333 355 213 259 349 376
Road transport 221 371 356 674 761 393 415 747 852
Inland waterway transport 6 11 8 8 9 11 19 9 11
Pipeline transport 151 256 422 405 315 256 428 414 326
Other sup., and aux. transport serv. 105 104 185 225 229 106 185 225 229
Travel 1 467 1 857 1 970 1 949 1 749 1 882 1 987 1 967 1 762
Business travel : 502 545 599 528 519 556 612 537
Personal travel : 1 355 1 427 1 348 1 220 1 364 1 432 1 353 1 225
Other services 2 019 2 477 3 404 3 560 4 581 2 540 3 457 3 621 4 636
Communication services 115 131 193 231 244 136 194 233 245
Postal and courier services 12 12 13 15 15 12 13 15 15
Telecommunication services 103 120 179 216 230 125 180 217 231
Construction services 280 412 440 411 503 419 445 414 503
Construction abroad 244 392 415 385 476 395 419 388 476
Constr. in the compiling economy 35 19 26 25 27 24 27 26 27
Insurance services 82 69 114 175 177 74 117 179 179
Financial services 76 85 144 275 266 88 144 275 266
Computer and information services 40 32 39 75 113 34 39 75 113
Computer services 37 27 34 62 98 29 35 62 98
Information services 2 5 3 11 16 5 3 11 16
Royalties and licence fees 69 23 19 26 83 25 19 27 84
Other business services 1 240 1 598 2 319 2 214 3 009 1 630 2 360 2 264 3 058
Merc. & other trade-related serv. 228 339 278 344 440 340 279 347 442
Merchanting 2 0 1 0 0 0 1 0 0
Other trade-related services 226 339 277 344 440 340 278 347 442
Operational leasing 99 64 91 117 142 65 91 117 142
Misc. business, prof. & tech. serv. 914 1 195 1 949 1 756 2 424 1 225 1 989 1 803 2 471
Legal, acc., man., cons. & pub. rel. 147 136 220 256 296 142 221 258 307
Adv., market research & polling 168 239 324 334 717 240 335 343 719
Research and development 83 54 74 74 88 55 74 74 88
Architectural, engin. & other tech. 104 169 262 242 324 175 266 246 334
Agric., mining & on-site processing 6 8 10 5 5 9 28 28 21
Other 197 210 403 469 567 221 405 472 572
Serv. between affiliated enter., nie 207 376 654 378 424 379 657 384 426
Personal, cultural & recreational serv. 29 31 37 50 64 34 37 50 64
Audio-visual and related services 12 13 16 18 26 14 16 18 26
Other pers., cult. & recreational serv. 15 17 22 32 38 19 22 32 38
Government services, n i e 88 98 100 104 122 99 101 105 123
Services not allocated 10 3 8 3 9 3 9 3 9

Statistical tablesTable 3.4 III
109 European Union international trade in services
3.4.7 EU item breakdown from 2003 to 2006Reporter: EU-25 (from 2003 to 2007) EU-27 (from 2004 to 2007)Partner: Russian Federation
(Mio EUR)
EU-25 EU-27
2003 2004 2005 2006 2007 2004 2005 2006 2007
NETSERVICES 2 002 1 096 2 319 3 598 7 091 1 211 2 402 3 713 7 208
Transportation -337 -1 219 -1 293 -1 995 -1 649 -1 127 -1 248 -1 936 -1 626
Sea transport -825 -1 664 -1 986 -2 459 -2 415 -1 672 -2 023 -2 498 -2 462
Passenger transport on sea 1 2 1 -1 -1 3 1 0 0
Freight transport on sea -798 -1 549 -1 790 -2 168 -2 196 -1 559 -1 828 -2 209 -2 246
Supp., aux. and other services -27 -116 -197 -290 -217 -115 -196 -288 -216
Air transport -142 -203 -97 50 160 -202 -98 47 159
Passenger transport by air -12 -15 111 240 293 -15 114 244 298
Freight transport by air 6 -21 -46 -44 -69 -23 -51 -53 -77
Supp., aux. and other services -134 -164 -160 -145 -62 -163 -160 -142 -60
Other transportation 628 650 792 415 609 749 875 517 681
Passenger on other transport : -26 -31 -20 -13 -14 -16 -1 9
Freight on other transport : 683 877 -3 176 772 944 79 225
Other on other transport : -5 -55 443 444 -7 -54 443 444
Space transport 0 -7 -42 0 0 -7 -42 0 0
Rail transport 35 -16 -43 -164 -158 -18 -52 -175 -172
Road transport 148 48 242 122 285 53 203 77 242
Inland waterway transport -4 -8 -5 -5 -4 -7 -15 -4 -3
Pipeline transport 524 664 726 594 597 760 867 750 726
Other sup., and aux. transport serv. -76 -32 -88 -132 -113 -34 -88 -132 -113
Travel 776 388 737 1 326 2 093 445 814 1 425 2 213
Business travel : 107 250 188 329 98 248 189 338
Personal travel : 280 484 1 140 1 763 345 562 1 239 1 876
Other services 1 453 1 921 2 872 4 270 6 651 1 888 2 833 4 227 6 624
Communication services 7 1 -30 18 50 0 -30 19 51
Postal and courier services -5 -4 -1 0 0 -3 -1 0 0
Telecommunication services 13 3 -30 19 49 1 -29 20 50
Construction services 151 210 408 332 388 208 405 334 396
Construction abroad 169 216 417 327 393 216 413 326 394
Constr. in the compiling economy -15 -7 -11 5 -4 -9 -10 7 2
Insurance services -5 27 -33 -35 -45 23 -35 -36 -43
Financial services 350 454 553 840 1 350 452 553 840 1 350
Computer and information services 308 280 624 641 1 160 280 624 641 1 160
Computer services 296 268 606 632 1 149 268 606 633 1 150
Information services 13 12 18 9 12 11 18 9 12
Royalties and licence fees 45 104 205 226 418 101 204 225 417
Other business services 561 817 1 058 2 116 3 202 796 1 024 2 072 3 163
Merc. & other trade-related serv. 573 712 736 1 258 2 913 711 736 1 256 2 911
Merchanting 384 963 928 1 493 3 237 962 927 1 493 3 237
Other trade-related services 188 -252 -193 -234 -325 -253 -193 -236 -327
Operational leasing -63 -20 -19 18 66 -20 -19 18 65
Misc. business, prof. & tech. serv. 50 124 343 835 225 105 310 793 187
Legal, acc., man., cons. & pub. rel. 25 17 -20 70 183 13 -20 69 175
Adv., market research & polling -127 -216 -296 -291 -639 -217 -307 -299 -641
Research and development -37 -28 -52 -45 -39 -28 -52 -45 -39
Architectural, engin. & other tech. 47 311 607 676 656 306 607 673 648
Agric., mining & on-site processing 20 77 319 351 389 75 301 328 373
Other 249 192 256 177 -107 187 255 176 -110
Serv. between affiliated enter., nie -124 -226 -472 -104 -214 -229 -476 -108 -214
Personal, cultural & recreational serv. 18 11 59 32 35 10 59 32 37
Audio-visual and related services 20 12 9 22 21 11 9 22 21
Other pers., cult. & recreational serv. 0 -1 49 10 14 -1 49 10 16
Government services, n i e 17 17 29 101 94 17 29 101 94
Services not allocated 110 4 4 -3 -4 4 4 -3 -4

III
110 European Union international trade in services
Statistical tablesTable 3.4
3.4.8 EU trade in services broken down by itemsReporter: EU-25 (from 2003 to 2007) EU-27 (from 2004 to 2007)Partner: India
(Mio EUR)
EU-25 EU-27
2003 2004 2005 2006 2007 2004 2005 2006 2007
CREDITSERVICES 2 863 3 781 5 356 7 245 9 540 3 789 5 367 7 259 9 555
Transportation 1 250 1 467 2 154 2 252 2 736 1 470 2 156 2 254 2 743
Sea transport 436 614 987 936 1 202 614 988 936 1 202
Passenger transport on sea 0 0 0 0 0 0 0 0 0
Freight transport on sea 420 569 936 883 1 156 569 936 883 1 156
Supp., aux. and other services 16 45 53 53 45 45 54 53 46
Air transport 675 806 1 101 1 225 1 365 806 1 102 1 225 1 365
Passenger transport by air 430 494 660 656 714 494 660 656 714
Freight transport by air 182 212 289 303 286 212 289 303 286
Supp., aux. and other services 65 100 152 266 364 100 152 266 364
Other transportation 138 44 65 91 170 47 65 92 175
Passenger on other transport : 7 3 3 6 7 3 3 6
Freight on other transport : 22 34 49 109 24 34 50 114
Other on other transport : 17 28 38 58 17 28 38 58
Space transport 90 2 0 0 47 2 0 0 47
Rail transport 10 5 4 4 8 5 4 5 9
Road transport 18 24 45 68 77 26 45 68 82
Inland waterway transport 0 0 0 1 2 0 0 1 2
Pipeline transport 4 0 0 0 1 0 0 0 1
Other sup., and aux. transport serv. 16 15 15 19 37 15 15 19 37
Travel 509 793 720 957 920 794 724 960 924
Business travel : 246 217 327 332 246 219 329 335
Personal travel : 547 504 628 589 548 505 629 590
Other services 1 056 1 524 2 476 4 035 5 878 1 527 2 481 4 043 5 884
Communication services 70 69 83 131 151 70 84 132 152
Postal and courier services 15 15 21 30 30 15 21 30 30
Telecommunication services 55 53 61 100 121 53 62 100 122
Construction services 163 192 252 206 353 192 252 207 353
Construction abroad 162 188 244 201 342 189 244 202 343
Constr. in the compiling economy 1 4 8 5 11 4 8 5 11
Insurance services 57 43 28 87 56 43 28 87 56
Financial services 120 148 195 283 349 148 195 283 349
Computer and information services 82 157 185 369 544 158 185 369 544
Computer services 77 149 178 345 512 149 178 345 512
Information services 5 8 8 24 32 8 8 24 32
Royalties and licence fees 102 68 93 210 355 68 93 210 355
Other business services 308 660 1 451 2 493 3 773 662 1 454 2 501 3 778
Merc. & other trade-related serv. -2 120 620 1 128 2 606 120 620 1 128 2 607
Merchanting -11 86 539 1 083 2 552 86 539 1 083 2 552
Other trade-related services 8 31 80 44 53 31 80 44 54
Operational leasing 44 146 152 272 194 146 152 272 194
Misc. business, prof. & tech. serv. 263 399 678 1 094 974 400 681 1 101 978
Legal, acc., man., cons. & pub. rel. 54 77 109 218 158 77 110 221 158
Adv., market research & polling 15 41 114 49 34 42 114 49 34
Research and development 21 17 29 66 47 17 29 66 47
Architectural, engin. & other tech. 63 138 199 294 257 138 199 294 258
Agric., mining & on-site processing 1 3 19 66 74 3 19 66 74
Other 64 65 114 239 271 65 114 239 271
Serv. between affiliated enter., nie 45 55 93 164 133 55 95 167 135
Personal, cultural & recreational serv. 6 8 11 41 97 8 11 41 97
Audio-visual and related services 4 3 2 28 76 3 2 28 76
Other pers., cult. & recreational serv. 1 4 9 14 21 5 9 14 21
Government services, n i e 150 178 177 214 199 178 178 214 199
Services not allocated 49 -3 6 0 5 -3 6 0 5

Statistical tablesTable 3.4 III
111 European Union international trade in services
3.4.8 EU trade in services broken down by itemsReporter: EU-25 (from 2003 to 2007) EU-27 (from 2004 to 2007)Partner: India
(Mio EUR)
EU-25 EU-27
2003 2004 2005 2006 2007 2004 2005 2006 2007
DEBITSERVICES 3 048 4 127 5 070 5 761 7 011 4 131 5 076 5 769 7 020
Transportation 839 1 061 1 269 1 422 1 541 1 062 1 271 1 426 1 544
Sea transport 359 487 592 675 753 488 592 676 754
Passenger transport on sea 0 0 0 0 0 0 0 0 0
Freight transport on sea 183 226 293 349 349 227 293 350 350
Supp., aux. and other services 175 260 295 324 404 260 295 324 404
Air transport 424 510 600 668 683 510 600 668 683
Passenger transport by air 231 293 348 406 388 293 348 406 388
Freight transport by air 75 75 89 110 121 75 89 110 121
Supp., aux. and other services 120 141 165 149 175 141 165 149 175
Other transportation 57 63 78 79 105 64 79 81 107
Passenger on other transport : 0 1 0 0 0 1 0 0
Freight on other transport : 33 51 49 66 34 51 52 69
Other on other transport : 29 26 28 41 29 26 28 41
Space transport 0 0 0 0 0 0 0 0 0
Rail transport 4 1 2 2 3 1 2 2 3
Road transport 35 42 56 53 66 42 57 54 67
Inland waterway transport 0 0 1 1 1 0 1 1 1
Pipeline transport 0 0 0 1 1 0 0 1 1
Other sup., and aux. transport serv. 18 19 18 23 37 19 18 23 37
Travel 1 107 1 488 1 654 1 791 2 026 1 489 1 655 1 792 2 026
Business travel : 311 298 370 409 312 298 371 410
Personal travel : 1 177 1 357 1 419 1 614 1 177 1 357 1 420 1 614
Other services 1 101 1 577 2 145 2 545 3 444 1 579 2 148 2 548 3 448
Communication services 87 124 164 176 214 124 164 177 215
Postal and courier services 3 3 6 10 11 3 6 10 11
Telecommunication services 84 120 158 165 204 120 158 165 205
Construction services 54 63 100 90 149 63 100 90 149
Construction abroad 49 54 89 75 135 54 89 75 135
Constr. in the compiling economy 4 8 10 16 14 9 10 16 14
Insurance services 21 37 48 38 47 37 48 38 47
Financial services 39 30 53 93 97 30 54 93 97
Computer and information services 236 367 536 729 1 064 367 537 730 1 064
Computer services 213 359 529 710 1 039 359 529 710 1 039
Information services 22 8 8 19 25 8 8 19 25
Royalties and licence fees 17 27 23 29 46 27 23 30 46
Other business services 602 878 1 167 1 320 1 729 879 1 168 1 322 1 731
Merc. & other trade-related serv. 146 120 154 217 273 120 154 217 273
Merchanting 0 0 0 0 0 0 0 0 0
Other trade-related services 146 120 154 217 273 120 154 217 273
Operational leasing 7 1 4 10 12 1 4 10 12
Misc. business, prof. & tech. serv. 449 759 1 008 1 095 1 445 760 1 009 1 096 1 447
Legal, acc., man., cons. & pub. rel. 64 101 120 215 286 101 120 216 288
Adv., market research & polling 24 21 34 46 62 21 34 46 62
Research and development 111 341 503 268 432 341 503 268 432
Architectural, engin. & other tech. 82 112 104 222 221 112 104 223 221
Agric., mining & on-site processing 2 1 2 7 9 1 2 7 9
Other 100 87 136 206 222 87 136 206 222
Serv. between affiliated enter., nie 65 92 111 131 212 92 111 131 212
Personal, cultural & recreational serv. 4 9 7 13 17 9 7 13 17
Audio-visual and related services 2 4 3 7 6 4 3 7 6
Other pers., cult. & recreational serv. 2 5 4 7 11 5 4 7 11
Government services, n i e 40 43 46 56 82 43 47 56 83
Services not allocated 2 0 2 3 0 0 2 3 1

III
112 European Union international trade in services
Statistical tablesTable 3.4
3.4.8 EU item breakdown from 2003 to 2006Reporter: EU-25 (from 2003 to 2007) EU-27 (from 2004 to 2007)Partner: India
(Mio EUR)
EU-25 EU-27
2003 2004 2005 2006 2007 2004 2005 2006 2007
NETSERVICES -185 -346 286 1 484 2 529 -342 292 1 490 2 535
Transportation 412 406 885 830 1 195 408 885 828 1 198
Sea transport 77 127 395 261 449 127 396 260 449
Passenger transport on sea 0 0 0 0 0 0 0 0 0
Freight transport on sea 237 343 643 533 807 343 643 533 807
Supp., aux. and other services -159 -215 -242 -271 -359 -215 -241 -270 -358
Air transport 251 296 501 557 681 296 501 557 682
Passenger transport by air 199 201 312 249 326 201 312 249 326
Freight transport by air 107 137 200 193 164 137 200 193 164
Supp., aux. and other services -55 -41 -13 117 189 -41 -13 117 189
Other transportation 81 -18 -13 12 65 -17 -14 11 68
Passenger on other transport : 7 2 3 6 7 2 3 6
Freight on other transport : -11 -17 0 42 -10 -17 -2 45
Other on other transport : -12 2 10 17 -12 2 10 17
Space transport 90 2 0 0 47 2 0 0 47
Rail transport 6 3 2 3 5 3 3 3 6
Road transport -17 -18 -11 15 11 -16 -12 14 15
Inland waterway transport 0 0 -1 1 1 0 -1 1 1
Pipeline transport 4 0 0 0 0 0 0 0 0
Other sup., and aux. transport serv. -1 -4 -3 -4 0 -5 -3 -4 0
Travel -598 -696 -934 -833 -1 105 -695 -932 -832 -1 102
Business travel : -66 -81 -44 -77 -66 -80 -42 -75
Personal travel : -630 -853 -791 -1 025 -629 -852 -790 -1 024
Other services -45 -53 331 1 490 2 434 -52 333 1 495 2 435
Communication services -17 -55 -81 -45 -63 -55 -81 -45 -63
Postal and courier services 12 12 15 20 19 12 15 20 19
Telecommunication services -28 -67 -97 -65 -82 -67 -96 -65 -83
Construction services 109 129 152 116 203 129 153 116 204
Construction abroad 113 135 154 126 207 135 155 127 208
Constr. in the compiling economy -3 -5 -2 -10 -4 -5 -2 -10 -4
Insurance services 36 6 -20 50 10 6 -20 50 10
Financial services 81 118 142 190 252 118 141 190 252
Computer and information services -155 -210 -351 -361 -520 -209 -351 -361 -520
Computer services -136 -210 -351 -365 -528 -210 -351 -365 -528
Information services -18 1 0 5 8 1 0 5 8
Royalties and licence fees 84 41 70 181 310 41 70 181 310
Other business services -294 -218 284 1 173 2 044 -217 286 1 179 2 046
Merc. & other trade-related serv. -148 0 466 911 2 333 0 466 911 2 333
Merchanting -11 86 539 1 083 2 552 86 539 1 083 2 552
Other trade-related services -137 -89 -73 -173 -220 -89 -74 -173 -220
Operational leasing 37 145 149 262 182 145 149 261 182
Misc. business, prof. & tech. serv. -185 -360 -330 -1 -471 -360 -328 5 -470
Legal, acc., man., cons. & pub. rel. -10 -24 -10 2 -128 -24 -10 5 -129
Adv., market research & polling -8 20 80 4 -27 20 80 4 -27
Research and development -90 -324 -474 -203 -385 -324 -474 -203 -385
Architectural, engin. & other tech. -20 26 96 72 36 26 95 71 37
Agric., mining & on-site processing -1 2 17 59 65 2 17 59 65
Other -36 -22 -22 33 48 -22 -22 33 48
Serv. between affiliated enter., nie -20 -37 -17 32 -80 -37 -16 36 -77
Personal, cultural & recreational serv. 2 -1 4 27 81 -1 4 27 81
Audio-visual and related services 3 -1 -1 22 70 0 -1 22 70
Other pers., cult. & recreational serv. 0 -1 5 7 10 -1 5 7 10
Government services, n i e 109 135 131 158 117 135 131 158 117
Services not allocated 47 -3 4 -3 5 -3 4 -3 5

Statistical tablesTable 3.4 III
113 European Union international trade in services
3.4.9 EU trade in services broken down by itemsReporter: EU-25 (from 2003 to 2007) EU-27 (from 2004 to 2007)Partner: China
(Mio EUR)
EU-25 EU-27
2003 2004 2005 2006 2007 2004 2005 2006 2007
CREDITSERVICES 6 919 9 105 12 419 13 329 17 742 9 116 12 434 13 346 17 766
Transportation 2 485 3 316 4 233 4 324 5 501 3 320 4 238 4 330 5 513
Sea transport 1 666 2 267 2 777 2 767 3 797 2 268 2 781 2 771 3 809
Passenger transport on sea 0 1 0 0 0 1 0 0 0
Freight transport on sea 1 533 2 147 2 638 2 621 3 595 2 147 2 641 2 622 3 596
Supp., aux. and other services 134 119 139 144 203 119 140 146 213
Air transport 601 917 1 261 1 274 1 426 918 1 262 1 274 1 427
Passenger transport by air 270 352 393 414 507 352 393 415 507
Freight transport by air 231 393 660 596 711 393 660 596 711
Supp., aux. and other services 101 173 207 264 207 174 207 264 207
Other transportation 217 133 195 283 280 136 195 284 281
Passenger on other transport : 6 7 10 9 7 8 10 10
Freight on other transport : 95 131 217 217 97 131 218 218
Other on other transport : 31 57 59 53 31 57 59 53
Space transport 0 0 0 0 0 0 0 0 0
Rail transport 97 7 7 10 14 7 7 10 14
Road transport 92 93 133 223 219 95 134 224 220
Inland waterway transport 2 2 2 4 4 2 2 4 4
Pipeline transport 2 1 1 2 2 1 1 2 2
Other sup., and aux. transport serv. 24 30 52 45 42 30 52 45 42
Travel 825 1 176 1 508 1 819 1 877 1 179 1 516 1 827 1 882
Business travel : 340 430 546 530 341 434 553 533
Personal travel : 837 1 080 1 273 1 344 838 1 084 1 275 1 347
Other services 3 517 4 615 6 674 7 187 10 364 4 619 6 677 7 190 10 369
Communication services 66 108 123 199 233 109 124 200 233
Postal and courier services 33 44 66 105 147 44 66 105 147
Telecommunication services 34 63 57 95 85 63 58 95 86
Construction services 311 448 701 633 543 448 701 633 543
Construction abroad 306 445 695 622 539 445 696 622 539
Constr. in the compiling economy 5 3 5 11 4 3 5 11 4
Insurance services 52 56 44 115 109 56 44 115 109
Financial services 143 224 267 374 453 224 267 375 453
Computer and information services 162 240 192 345 541 240 192 345 541
Computer services 159 237 186 338 536 237 186 339 536
Information services 4 4 6 6 6 4 6 6 6
Royalties and licence fees 449 724 932 1 474 1 179 724 932 1 474 1 179
Other business services 2 133 2 653 4 238 3 887 7 124 2 654 4 239 3 888 7 127
Merc. & other trade-related serv. 875 1 135 2 098 1 491 4 183 1 135 2 098 1 491 4 183
Merchanting 487 1 045 1 947 1 396 4 062 1 045 1 947 1 396 4 062
Other trade-related services 388 89 151 97 121 90 151 97 121
Operational leasing 51 71 456 552 657 71 456 552 657
Misc. business, prof. & tech. serv. 1 207 1 447 1 682 1 844 2 281 1 448 1 683 1 845 2 285
Legal, acc., man., cons. & pub. rel. 137 141 145 203 227 141 145 203 228
Adv., market research & polling 47 30 49 69 109 30 50 69 109
Research and development 188 261 217 230 277 261 217 230 277
Architectural, engin. & other tech. 438 577 724 673 883 577 724 673 883
Agric., mining & on-site processing 10 13 38 55 54 13 38 55 54
Other 234 302 297 348 373 303 297 348 374
Serv. between affiliated enter., nie 151 123 210 262 358 123 210 262 361
Personal, cultural & recreational serv. 11 15 24 16 24 16 24 16 24
Audio-visual and related services 4 8 5 4 9 8 5 4 9
Other pers., cult. & recreational serv. 7 7 18 12 15 7 19 12 15
Government services, n i e 187 148 153 144 159 148 154 145 160
Services not allocated 92 -2 3 - 1 -2 3 0 1

III
114 European Union international trade in services
Statistical tablesTable 3.4
3.4.9 EU trade in services broken down by itemsReporter: EU-25 (from 2003 to 2007) EU-27 (from 2004 to 2007)Partner: China
(Mio EUR)
EU-25 EU-27
2003 2004 2005 2006 2007 2004 2005 2006 2007
DEBITSERVICES 4 952 7 369 9 392 11 860 13 722 7 379 9 405 11 890 13 769
Transportation 2 277 3 487 4 304 5 487 6 560 3 489 4 307 5 492 6 567
Sea transport 1 662 2 305 2 774 3 425 4 009 2 306 2 774 3 427 4 013
Passenger transport on sea 0 1 0 0 0 1 0 0 0
Freight transport on sea 856 1 446 1 815 2 373 2 960 1 446 1 815 2 375 2 964
Supp., aux. and other services 805 858 957 1 051 1 049 858 957 1 051 1 049
Air transport 393 851 1 049 1 431 1 623 852 1 049 1 432 1 624
Passenger transport by air 131 295 345 426 519 296 345 427 520
Freight transport by air 129 302 419 758 900 303 419 758 900
Supp., aux. and other services 132 251 285 246 206 251 285 246 206
Other transportation 223 329 481 630 927 330 482 633 930
Passenger on other transport : 1 0 1 2 2 1 2 2
Freight on other transport : 222 350 466 637 224 351 468 639
Other on other transport : 105 131 163 289 105 131 163 289
Space transport 0 0 0 0 0 0 0 0 0
Rail transport 8 16 18 25 48 16 19 25 49
Road transport 133 209 340 454 583 210 341 457 585
Inland waterway transport 1 6 6 4 10 6 6 4 10
Pipeline transport 0 0 1 2 1 0 1 2 1
Other sup., and aux. transport serv. 81 99 116 143 286 99 116 143 286
Travel 1 017 1 672 2 363 2 457 2 893 1 675 2 368 2 473 2 913
Business travel : 613 846 835 887 615 850 848 902
Personal travel : 1 059 1 517 1 621 2 007 1 060 1 518 1 625 2 012
Other services 1 565 2 209 2 718 3 912 4 245 2 212 2 723 3 919 4 265
Communication services 63 101 101 152 177 101 101 154 187
Postal and courier services 18 16 25 35 48 16 25 35 48
Telecommunication services 44 85 77 117 129 85 78 119 139
Construction services 200 269 246 352 400 269 246 352 400
Construction abroad 189 262 228 305 319 262 228 305 319
Constr. in the compiling economy 8 7 17 45 82 7 17 45 82
Insurance services 60 78 125 219 281 78 125 219 281
Financial services 34 36 89 146 181 36 90 146 181
Computer and information services 42 39 89 113 171 40 90 113 171
Computer services 39 39 88 112 168 39 88 112 168
Information services 3 1 2 2 1 1 2 2 1
Royalties and licence fees 32 155 23 32 120 155 23 32 120
Other business services 1 075 1 463 1 950 2 771 2 788 1 465 1 953 2 775 2 796
Merc. & other trade-related serv. 249 316 391 438 515 316 392 438 518
Merchanting 0 0 0 0 0 0 0 0 0
Other trade-related services 248 316 391 438 515 316 391 438 518
Operational leasing 11 8 39 61 58 8 40 61 58
Misc. business, prof. & tech. serv. 813 1 139 1 520 2 274 2 213 1 141 1 523 2 278 2 218
Legal, acc., man., cons. & pub. rel. 171 229 318 470 441 230 318 471 442
Adv., market research & polling 61 91 122 146 219 92 123 148 223
Research and development 88 150 201 350 402 150 201 350 402
Architectural, engin. & other tech. 111 158 206 236 201 158 206 236 201
Agric., mining & on-site processing 5 7 8 62 28 7 8 62 28
Other 122 219 340 569 504 220 340 569 505
Serv. between affiliated enter., nie 254 288 325 443 415 288 325 443 415
Personal, cultural & recreational serv. 10 11 19 26 25 11 19 27 26
Audio-visual and related services 4 3 3 11 10 3 3 11 10
Other pers., cult. & recreational serv. 6 9 16 16 16 9 16 16 17
Government services, n i e 48 58 74 101 103 58 75 101 104
Services not allocated 93 2 6 4 24 2 6 4 24
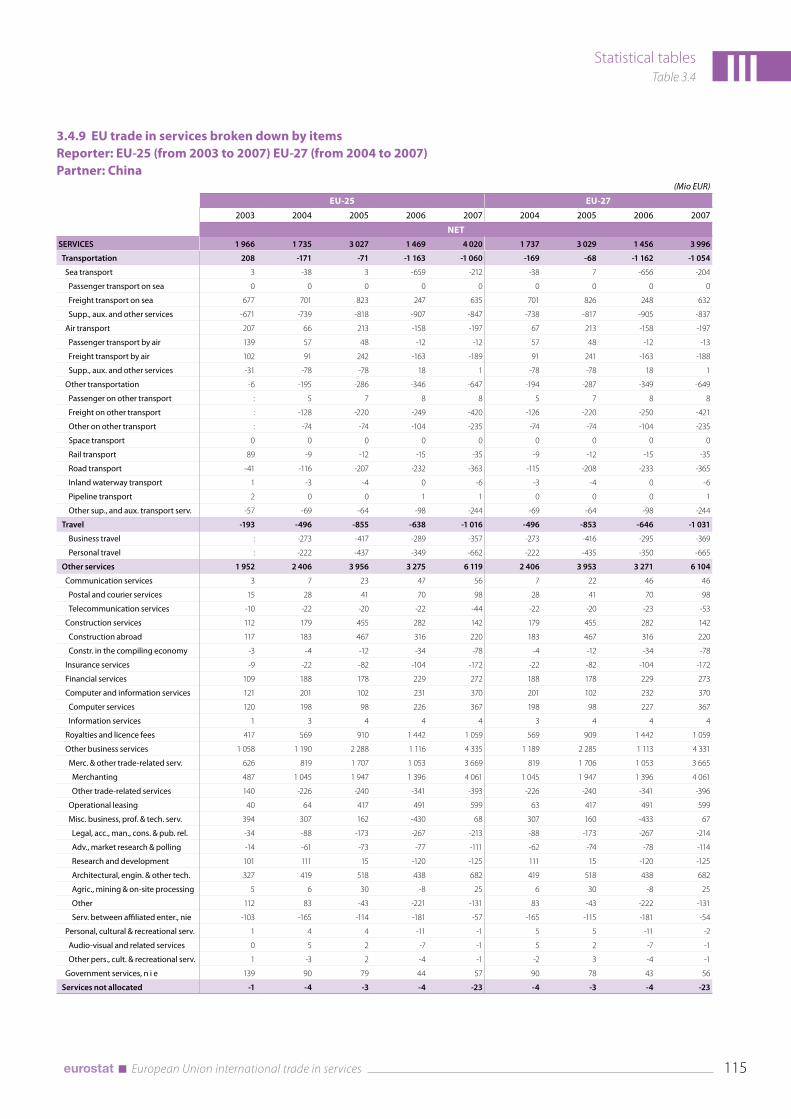
Statistical tablesTable 3.4 III
115 European Union international trade in services
3.4.9 EU trade in services broken down by itemsReporter: EU-25 (from 2003 to 2007) EU-27 (from 2004 to 2007)Partner: China
(Mio EUR)
EU-25 EU-27
2003 2004 2005 2006 2007 2004 2005 2006 2007
NETSERVICES 1 966 1 735 3 027 1 469 4 020 1 737 3 029 1 456 3 996
Transportation 208 -171 -71 -1 163 -1 060 -169 -68 -1 162 -1 054
Sea transport 3 -38 3 -659 -212 -38 7 -656 -204
Passenger transport on sea 0 0 0 0 0 0 0 0 0
Freight transport on sea 677 701 823 247 635 701 826 248 632
Supp., aux. and other services -671 -739 -818 -907 -847 -738 -817 -905 -837
Air transport 207 66 213 -158 -197 67 213 -158 -197
Passenger transport by air 139 57 48 -12 -12 57 48 -12 -13
Freight transport by air 102 91 242 -163 -189 91 241 -163 -188
Supp., aux. and other services -31 -78 -78 18 1 -78 -78 18 1
Other transportation -6 -195 -286 -346 -647 -194 -287 -349 -649
Passenger on other transport : 5 7 8 8 5 7 8 8
Freight on other transport : -128 -220 -249 -420 -126 -220 -250 -421
Other on other transport : -74 -74 -104 -235 -74 -74 -104 -235
Space transport 0 0 0 0 0 0 0 0 0
Rail transport 89 -9 -12 -15 -35 -9 -12 -15 -35
Road transport -41 -116 -207 -232 -363 -115 -208 -233 -365
Inland waterway transport 1 -3 -4 0 -6 -3 -4 0 -6
Pipeline transport 2 0 0 1 1 0 0 0 1
Other sup., and aux. transport serv. -57 -69 -64 -98 -244 -69 -64 -98 -244
Travel -193 -496 -855 -638 -1 016 -496 -853 -646 -1 031
Business travel : -273 -417 -289 -357 -273 -416 -295 -369
Personal travel : -222 -437 -349 -662 -222 -435 -350 -665
Other services 1 952 2 406 3 956 3 275 6 119 2 406 3 953 3 271 6 104
Communication services 3 7 23 47 56 7 22 46 46
Postal and courier services 15 28 41 70 98 28 41 70 98
Telecommunication services -10 -22 -20 -22 -44 -22 -20 -23 -53
Construction services 112 179 455 282 142 179 455 282 142
Construction abroad 117 183 467 316 220 183 467 316 220
Constr. in the compiling economy -3 -4 -12 -34 -78 -4 -12 -34 -78
Insurance services -9 -22 -82 -104 -172 -22 -82 -104 -172
Financial services 109 188 178 229 272 188 178 229 273
Computer and information services 121 201 102 231 370 201 102 232 370
Computer services 120 198 98 226 367 198 98 227 367
Information services 1 3 4 4 4 3 4 4 4
Royalties and licence fees 417 569 910 1 442 1 059 569 909 1 442 1 059
Other business services 1 058 1 190 2 288 1 116 4 335 1 189 2 285 1 113 4 331
Merc. & other trade-related serv. 626 819 1 707 1 053 3 669 819 1 706 1 053 3 665
Merchanting 487 1 045 1 947 1 396 4 061 1 045 1 947 1 396 4 061
Other trade-related services 140 -226 -240 -341 -393 -226 -240 -341 -396
Operational leasing 40 64 417 491 599 63 417 491 599
Misc. business, prof. & tech. serv. 394 307 162 -430 68 307 160 -433 67
Legal, acc., man., cons. & pub. rel. -34 -88 -173 -267 -213 -88 -173 -267 -214
Adv., market research & polling -14 -61 -73 -77 -111 -62 -74 -78 -114
Research and development 101 111 15 -120 -125 111 15 -120 -125
Architectural, engin. & other tech. 327 419 518 438 682 419 518 438 682
Agric., mining & on-site processing 5 6 30 -8 25 6 30 -8 25
Other 112 83 -43 -221 -131 83 -43 -222 -131
Serv. between affiliated enter., nie -103 -165 -114 -181 -57 -165 -115 -181 -54
Personal, cultural & recreational serv. 1 4 4 -11 -1 5 5 -11 -2
Audio-visual and related services 0 5 2 -7 -1 5 2 -7 -1
Other pers., cult. & recreational serv. 1 -3 2 -4 -1 -2 3 -4 -1
Government services, n i e 139 90 79 44 57 90 78 43 56
Services not allocated -1 -4 -3 -4 -23 -4 -3 -4 -23

III
116 European Union international trade in services
Statistical tablesTable 3.4
3.4.10 EU trade in services broken down by itemsReporter: EU-25 (from 2003 to 2007) EU-27 (from 2004 to 2007)Partner: Hong Kong
(Mio EUR)
EU-25 EU-27
2003 2004 2005 2006 2007 2004 2005 2006 2007
CREDITSERVICES 6 523 7 124 8 402 6 998 8 225 7 128 8 408 7 008 8 234
Transportation 2 108 3 000 3 218 2 906 3 703 3 001 3 220 2 910 3 707
Sea transport 1 253 1 836 1 882 1 584 2 330 1 837 1 884 1 585 2 333
Passenger transport on sea 0 0 0 0 8 0 0 0 8
Freight transport on sea 1 129 1 705 1 751 1 484 1 893 1 705 1 751 1 484 1 893
Supp., aux. and other services 125 132 131 98 430 132 132 99 432
Air transport 784 1 091 1 239 1 209 1 284 1 091 1 239 1 209 1 285
Passenger transport by air 229 226 227 255 258 226 227 255 258
Freight transport by air 432 650 747 753 830 650 747 753 830
Supp., aux. and other services 121 215 263 201 195 215 263 201 196
Other transportation 71 72 96 113 89 73 96 115 89
Passenger on other transport : 6 7 7 9 6 7 7 9
Freight on other transport : 51 68 77 50 53 68 77 51
Other on other transport : 16 22 29 30 16 22 31 30
Space transport 0 0 0 0 0 0 0 0 0
Rail transport 13 10 12 11 14 10 12 11 14
Road transport 51 47 67 77 51 48 67 77 51
Inland waterway transport 0 0 0 0 0 0 0 3 0
Pipeline transport 3 0 1 1 0 0 1 1 0
Other sup., and aux. transport serv. 5 14 15 22 25 14 15 22 25
Travel 562 493 522 468 502 493 523 468 502
Business travel : 127 118 114 126 127 118 114 126
Personal travel : 367 404 354 376 367 404 354 376
Other services 3 807 3 628 4 659 3 621 4 020 3 630 4 663 3 627 4 026
Communication services 101 88 133 122 149 89 133 122 150
Postal and courier services 27 28 55 34 34 28 55 34 34
Telecommunication services 75 60 78 88 115 61 78 88 116
Construction services 63 50 88 56 31 50 89 56 31
Construction abroad 61 48 79 53 25 48 80 53 25
Constr. in the compiling economy 1 2 8 3 7 2 8 3 7
Insurance services 178 166 72 154 95 166 72 154 95
Financial services 680 569 709 889 1 253 569 710 889 1 254
Computer and information services 93 84 111 149 164 85 111 149 166
Computer services 81 73 97 134 146 73 97 134 148
Information services 12 12 14 16 17 12 14 16 17
Royalties and licence fees 159 175 146 156 165 175 146 156 165
Other business services 2 485 2 447 3 330 2 033 2 106 2 448 3 333 2 037 2 109
Merc. & other trade-related serv. 317 399 855 578 666 399 855 579 666
Merchanting 169 326 544 449 518 326 544 449 518
Other trade-related services 148 72 312 130 147 72 312 130 147
Operational leasing 48 26 19 18 12 26 19 18 12
Misc. business, prof. & tech. serv. 2 116 2 022 2 457 1 437 1 426 2 023 2 459 1 442 1 429
Legal, acc., man., cons. & pub. rel. 153 192 188 230 253 192 189 230 253
Adv., market research & polling 80 64 75 97 108 64 75 97 108
Research and development 1 000 1 006 1 311 429 374 1 006 1 311 429 374
Architectural, engin. & other tech. 174 128 190 166 170 128 190 166 170
Agric., mining & on-site processing 7 7 10 10 5 7 10 10 5
Other 214 187 146 145 166 187 146 146 166
Serv. between affiliated enter., nie 489 438 536 357 350 438 538 361 353
Personal, cultural & recreational serv. 39 42 64 58 52 42 64 58 52
Audio-visual and related services 29 16 32 33 32 16 32 33 32
Other pers., cult. & recreational serv. 10 25 32 25 19 25 32 25 19
Government services, n i e 7 7 5 6 6 7 5 6 6
Services not allocated 46 3 3 3 -1 3 3 3 -1

Statistical tablesTable 3.4 III
117 European Union international trade in services
3.4.10 EU trade in services broken down by itemsReporter: EU-25 (from 2003 to 2007) EU-27 (from 2004 to 2007)Partner: Hong Kong
(Mio EUR)
EU-25 EU-27
2003 2004 2005 2006 2007 2004 2005 2006 2007
DEBITSERVICES 4 516 5 211 5 648 6 602 8 122 5 218 5 665 6 617 8 135
Transportation 1 838 2 487 2 731 2 972 3 565 2 490 2 744 2 981 3 573
Sea transport 1 339 1 728 1 765 1 880 2 238 1 729 1 775 1 886 2 242
Passenger transport on sea 0 0 3 0 2 0 3 0 2
Freight transport on sea 830 1 084 1 146 1 245 1 677 1 084 1 156 1 252 1 680
Supp., aux. and other services 510 646 617 634 562 646 617 634 562
Air transport 358 564 760 821 904 564 760 821 904
Passenger transport by air 152 237 270 297 344 237 270 297 344
Freight transport by air 82 196 329 385 408 196 329 385 408
Supp., aux. and other services 124 130 160 137 153 130 160 137 153
Other transportation 139 195 204 272 422 196 206 274 425
Passenger on other transport : 0 0 0 0 0 0 0 0
Freight on other transport : 84 104 134 111 85 106 137 115
Other on other transport : 110 100 137 310 111 100 137 310
Space transport 0 0 0 0 0 0 0 0 0
Rail transport 13 6 7 8 10 6 8 8 10
Road transport 71 71 97 122 92 73 99 123 94
Inland waterway transport 4 7 8 9 12 7 8 9 12
Pipeline transport 3 1 1 1 1 1 2 2 1
Other sup., and aux. transport serv. 49 109 91 132 308 109 91 132 308
Travel 275 344 411 432 459 344 411 432 459
Business travel : 105 112 128 132 105 112 128 132
Personal travel : 240 299 306 327 240 299 306 327
Other services 2 383 2 377 2 508 3 191 4 095 2 381 2 512 3 196 4 100
Communication services 114 88 100 179 168 88 100 180 169
Postal and courier services 19 24 32 46 53 24 32 46 53
Telecommunication services 95 65 68 134 115 65 69 135 116
Construction services 76 57 41 54 87 57 41 54 87
Construction abroad 70 42 37 46 56 42 37 46 56
Constr. in the compiling economy 6 15 4 8 31 15 4 8 31
Insurance services 57 59 69 71 79 59 69 71 79
Financial services 400 477 407 630 1 196 477 407 630 1 196
Computer and information services 33 35 28 40 40 35 28 40 40
Computer services 28 32 26 39 37 32 26 39 37
Information services 4 3 2 2 2 3 2 2 2
Royalties and licence fees 128 106 144 177 119 106 144 177 119
Other business services 1 529 1 491 1 640 1 940 2 328 1 493 1 643 1 943 2 332
Merc. & other trade-related serv. 471 498 516 640 753 498 517 640 754
Merchanting 0 0 0 0 0 0 0 0 0
Other trade-related services 471 498 516 640 753 498 517 640 754
Operational leasing 56 38 87 65 51 39 87 66 51
Misc. business, prof. & tech. serv. 1 002 956 1 035 1 236 1 525 958 1 037 1 238 1 527
Legal, acc., man., cons. & pub. rel. 189 193 228 321 371 193 229 322 371
Adv., market research & polling 84 84 104 135 122 84 104 136 123
Research and development 107 94 87 110 114 94 87 110 114
Architectural, engin. & other tech. 89 70 79 99 140 70 79 99 140
Agric., mining & on-site processing 6 22 2 4 6 22 2 4 6
Other 230 208 213 262 487 209 213 263 487
Serv. between affiliated enter., nie 293 282 324 306 283 282 324 306 283
Personal, cultural & recreational serv. 16 33 49 79 58 33 49 79 58
Audio-visual and related services 9 21 39 70 46 21 39 70 46
Other pers., cult. & recreational serv. 6 10 9 10 12 10 9 10 13
Government services, n i e 27 32 30 22 20 32 30 22 20
Services not allocated 20 1 -2 7 1 1 -1 7 2

III
118 European Union international trade in services
Statistical tablesTable 3.4
3.4.10 EU trade in services broken down by itemsReporter: EU-25 (from 2003 to 2007) EU-27 (from 2004 to 2007)Partner: Hong Kong
(Mio EUR)
EU-25 EU-27
2003 2004 2005 2006 2007 2004 2005 2006 2007
NETSERVICES 2 007 1 913 2 754 396 103 1 910 2 743 391 99
Transportation 270 513 487 -66 138 512 475 -71 134
Sea transport -86 108 117 -296 92 107 108 -301 91
Passenger transport on sea 0 0 -3 0 6 0 -3 0 6
Freight transport on sea 299 621 605 239 216 620 595 232 213
Supp., aux. and other services -385 -514 -487 -536 -132 -514 -486 -535 -130
Air transport 426 526 479 388 381 526 479 388 381
Passenger transport by air 78 -10 -42 -42 -86 -10 -42 -42 -86
Freight transport by air 350 454 419 368 422 454 418 367 422
Supp., aux. and other services -4 85 103 64 42 85 103 64 43
Other transportation -68 -123 -108 -159 -333 -123 -111 -159 -336
Passenger on other transport : 5 7 7 8 5 7 7 8
Freight on other transport : -32 -36 -58 -61 -33 -38 -60 -64
Other on other transport : -95 -78 -108 -281 -95 -78 -105 -281
Space transport 0 0 0 0 0 0 0 0 0
Rail transport -1 4 5 3 4 4 4 3 4
Road transport -20 -25 -29 -44 -41 -25 -31 -46 -43
Inland waterway transport -4 -7 -8 -9 -12 -7 -8 -6 -12
Pipeline transport 1 -1 -1 -1 -1 -1 -1 -1 -1
Other sup., and aux. transport serv. -44 -95 -76 -110 -283 -95 -76 -110 -283
Travel 287 149 112 36 43 149 112 36 43
Business travel : 22 6 -13 -6 22 6 -14 -6
Personal travel : 127 105 48 50 127 105 48 49
Other services 1 424 1 251 2 151 430 -75 1 249 2 151 431 -74
Communication services -13 1 33 -57 -19 1 33 -58 -20
Postal and courier services 8 4 22 -12 -20 4 22 -12 -20
Telecommunication services -20 -4 9 -46 1 -5 9 -47 0
Construction services -13 -7 48 2 -55 -7 48 2 -55
Construction abroad -9 6 42 7 -31 6 43 7 -31
Constr. in the compiling economy -4 -13 4 -5 -24 -13 4 -5 -24
Insurance services 121 107 3 83 15 107 3 83 15
Financial services 280 92 302 258 57 92 303 258 57
Computer and information services 60 49 83 110 124 50 83 110 126
Computer services 53 41 71 95 109 41 71 95 111
Information services 7 9 13 14 15 9 13 14 15
Royalties and licence fees 31 68 2 -21 46 68 2 -21 46
Other business services 955 956 1 690 92 -222 954 1 690 94 -222
Merc. & other trade-related serv. -154 -99 339 -61 -86 -99 338 -62 -87
Merchanting 169 326 544 449 518 326 544 449 518
Other trade-related services -323 -426 -205 -510 -605 -426 -205 -510 -606
Operational leasing -8 -13 -68 -48 -39 -13 -69 -49 -39
Misc. business, prof. & tech. serv. 1 115 1 066 1 422 201 -99 1 066 1 422 203 -98
Legal, acc., man., cons. & pub. rel. -36 -1 -39 -92 -118 -1 -40 -93 -118
Adv., market research & polling -4 -20 -29 -38 -14 -20 -30 -38 -14
Research and development 893 912 1 224 320 260 912 1 224 320 260
Architectural, engin. & other tech. 85 58 111 67 30 58 111 67 29
Agric., mining & on-site processing 1 -14 9 6 -2 -14 9 6 -2
Other -16 -22 -67 -117 -321 -22 -67 -117 -321
Serv. between affiliated enter., nie 196 156 212 52 67 156 214 55 69
Personal, cultural & recreational serv. 23 9 15 -21 -6 9 15 -21 -7
Audio-visual and related services 21 -5 -7 -36 -14 -5 -7 -36 -14
Other pers., cult. & recreational serv. 3 15 23 15 6 15 23 15 6
Government services, n i e -20 -25 -25 -16 -14 -25 -25 -16 -14
Services not allocated 26 2 5 -4 -2 2 4 -4 -3

EU trade in services: complete geographical breakdown


Statistical tablesTable 3.5 III
121 European Union international trade in services
3.5. EU-27 trade in services: complete geographical breakdown(Mio EUR)
2004 2005 2006 2007
Credit Debit Net Credit Debit Net Credit Debit Net Credit Debit Net
WORLD 880 510 805 154 75 356 964 511 876 240 88 271 1 067 559 952 537 115 022 1 178 112 1 036 986 141 126
EUROPE 598 371 556 398 41 973 655 668 608 193 47 475 726 715 659 410 67 304 803 618 718 288 85 329
Iceland 563 642 -80 850 630 220 986 656 330 778 703 75
Liechtenstein 340 454 -115 345 483 -139 426 512 -86 606 588 18
Norway 13 360 9 537 3 823 14 652 9 727 4 926 16 275 10 677 5 599 19 008 11 912 7 096
Switzerland 46 488 33 411 13 077 49 881 37 271 12 611 53 252 38 146 15 107 61 503 43 987 17 516
Other European countries 26 330 32 278 -5 948 33 292 38 491 -5 199 41 061 40 751 310 42 153 38 534 3 619
Albania : : : : : : 280 258 21 321 335 -14
Andorra : : : : : : 370 929 -559 537 892 -355
Belarus : : : : : : 906 623 283 1 059 597 462
Bosnia and Herzegovina : : : : : : 452 511 -58 469 533 -63
Croatia 1 697 3 497 -1 801 1 839 4 432 -2 593 2 253 4 799 -2 546 2 333 4 931 -2 598
Faroe Islands : : : : : : 71 44 28 87 49 38
Gibraltar : : : : : : 653 308 345 848 459 389
Guernsey : : : : : : 902 467 435 997 410 586
Holy see (Vatican City State) : : : : : : 16 13 2 13 13 0
Isle of Man : : : : : : 741 376 367 525 -63 588
Jersey : : : : : : 3 685 1 678 2 008 3 729 1 702 2 028
Macedonia, the Former Yugoslav Rep. of : : : : : : 379 359 20 353 429 -76
Moldova, Republic of : : : : : : 187 143 44 250 156 94
Russian Federation 9 219 8 008 1 211 12 408 10 006 2 402 14 699 10 986 3 713 19 238 12 030 7 208
San Marino : : : : : : 40 25 15 44 46 -2
Turkey 3 953 10 046 -6 093 4 789 11 393 -6 605 5 945 10 805 -4 860 6 617 11 900 -5 282
Ukraine : : : : : : 2 520 2 073 447 3 232 2 584 649
Serbia and Montenegro : : : : : : : : : : : :
AFRICA 21 718 24 775 -3 057 24 298 27 399 -3 101 26 328 29 340 -3 012 28 706 31 946 -3 240
North Africa 7 298 12 010 -4 713 8 133 13 875 -5 743 8 075 14 401 -6 327 8 833 15 785 -6 951
Algeria : : : : : : 1 869 1 529 341 1 805 1 571 234
Egypt 1 802 4 303 -2 501 2 293 5 170 -2 877 2 405 5 093 -2 688 2 610 5 700 -3 091
Libyan Arab Jamahiriya : : : : : : 933 807 126 1 069 872 196
Morocco 1 657 2 972 -1 315 1 582 3 083 -1 502 1 819 3 613 -1 794 2 104 4 407 -2 303
Tunisia : : : : : : 1 051 3 357 -2 306 1 244 3 232 -1 988
Other African countries 14 414 12 762 1 653 16 166 13 526 2 640 18 254 14 938 3 315 19 869 16 160 3 709
Angola : : : : : : 1 591 706 884 2 342 988 1 352
Benin : : : : : : 96 121 -24 126 120 6
Botswana : : : : : : 77 70 8 99 77 22
British Indian Ocean Territory : : : : : : 4 5 -1 12 11 1
Burkina Faso : : : : : : 126 119 7 127 134 -6
Burundi : : : : : : 17 19 -2 35 25 9
Cameroon : : : : : : 310 324 -16 329 304 26
Cape Verde : : : : : : 105 128 -22 120 140 -20
Central African Republic : : : : : : 41 31 11 69 86 -16
Chad : : : : : : 119 74 44 145 69 77
Comoros : : : : : : 10 62 -53 3 21 -18
Congo : : : : : : 265 117 147 385 139 248
Côte d’Ivoire : : : : : : 351 334 17 575 281 294
Congo, the Democratic Republic of the : : : : : : 79 100 -20 154 166 -11
Djibouti : : : : : : -6 160 -166 -7 82 -89
Equatorial Guinea : : : : : : 139 89 50 204 107 97
Eritrea : : : : : : 23 50 -26 23 39 -16
Ethiopia : : : : : : 201 203 -2 202 247 -45
Gabon : : : : : : 486 158 326 508 217 292
Gambia : : : : : : 53 59 -6 54 65 -11
Ghana : : : : : : 304 413 -109 456 404 52
Guinea : : : : : : 188 73 115 160 93 67
Guinea-Bissau : : : : : : 8 21 -13 15 15 0
Kenya : : : : : : 574 876 -302 584 985 -401
Lesotho : : : : : : 75 10 65 75 12 63

III
122 European Union international trade in services
Statistical tablesTable 3.5
3.5. EU-27 trade in services: complete geographical breakdown(Mio EUR)
2004 2005 2006 2007
Credit Debit Net Credit Debit Net Credit Debit Net Credit Debit Net
Liberia : : : : : : 263 628 -365 374 784 -411
Madagascar : : : : : : 39 296 -257 150 300 -151
Malawi : : : : : : 49 57 -7 83 37 46
Mali : : : : : : 171 130 40 220 214 7
Mauritania : : : : : : 105 198 -93 167 193 -27
Mauritius : : : : : : 378 861 -483 496 853 -357
Mozambique : : : : : : 156 174 -18 211 236 -24
Namibia : : : : : : 113 245 -131 135 239 -105
Niger : : : : : : 201 98 103 236 61 175
Nigeria 2 985 1 091 1 894 3 466 1 101 2 365 4 912 1 560 3 352 3 874 1 708 2 166
South Africa 4 311 3 986 325 5 110 4 079 1 031 5 558 4 386 1 173 5 704 4 380 1 324
Rwanda : : : : : : 36 37 -1 33 37 -3
St Helena : : : : : : 15 33 -19 7 78 -71
Sao Tome & Principe : : : : : : 12 10 2 14 49 -36
Senegal : : : : : : 363 519 -156 280 551 -271
Seychelles : : : : : : -56 196 -254 123 282 -160
Sierra Leone : : : : : : 35 34 1 37 46 -10
Somalia : : : : : : 7 15 -8 23 31 -7
Sudan : : : : : : 232 181 51 285 220 64
Swaziland : : : : : : 28 31 -4 32 21 11
Tanzania, United Republic of : : : : : : 180 390 -211 212 417 -205
Togo : : : : : : 32 68 -38 54 76 -22
Uganda : : : : : : 110 201 -91 135 240 -107
Zambia : : : : : : -25 149 -175 50 146 -97
Zimbabwe : : : : : : 87 103 -16 135 133 1
AMERICA 148 766 140 432 8 335 160 615 151 172 9 444 175 389 159 799 15 589 186 872 168 150 18 722
North American countries 125 754 115 550 10 204 131 964 124 560 7 404 144 229 130 656 13 573 150 931 137 495 13 436
Canada 8 251 6 979 1 272 9 018 7 423 1 595 10 397 8 467 1 930 11 695 9 648 2 047
Greenland : : : : : : 75 163 -88 103 140 -37
United States 117 368 108 355 9 014 122 880 116 980 5 900 133 753 122 029 11 724 139 135 127 717 11 417
Central American countries 13 519 17 126 -3 607 16 240 17 551 -1 311 17 283 18 777 -1 494 19 044 19 618 -574
Anguilla : : : : : : 6 8 -3 10 24 -13
Antigua and Barbuda : : : : : : 164 333 -168 149 352 -203
Aruba : : : : : : 49 62 -13 41 102 -62
Bahamas : : : : : : 638 542 95 516 503 12
Barbados : : : : : : 267 535 -266 205 804 -600
Belize : : : : : : 102 84 18 87 82 3
Bermuda : : : : : : 3 532 7 279 -3 747 4 897 6 314 -1 417
Virgin Islands, British : : : : : : 1 852 829 1 023 1 925 1 211 715
Cayman Islands : : : : : : 2 627 462 2 165 2 963 657 2 306
Costa Rica : : : : : : 193 367 -174 250 440 -190
Cuba : : : : : : 341 1 151 -809 248 971 -723
Dominica : : : : : : 24 18 6 19 22 -3
Dominican Republic : : : : : : 608 1 196 -589 479 1 475 -996
El Salvador : : : : : : 229 71 159 124 87 38
Grenada : : : : : : 27 29 -2 21 62 -41
Guatemala : : : : : : 156 187 -32 148 169 -22
Haiti : : : : : : -44 61 -105 -24 59 -83
Honduras : : : : : : 75 72 3 84 88 -4
Jamaica : : : : : : 166 412 -247 148 479 -331
Mexico 3 796 2 756 1 040 3 687 2 796 891 4 190 2 622 1 568 4 535 3 303 1 232
Montserrat : : : : : : 11 3 8 6 1 5
Netherlands Antilles : : : : : : 494 730 -237 500 520 -20
Nicaragua : : : : : : 63 97 -35 90 98 -10
Panama : : : : : : 1 029 1 171 -143 1 125 1 308 -183
St Kitts and Nevis : : : : : : 21 17 3 31 21 10
Saint Lucia : : : : : : 8 84 -75 8 113 -105
St Vincent and the Grenadines : : : : : : 74 42 32 95 43 52

Statistical tablesTable 3.5 III
123 European Union international trade in services
3.5. EU-27 trade in services: complete geographical breakdown(Mio EUR)
2004 2005 2006 2007
Credit Debit Net Credit Debit Net Credit Debit Net Credit Debit Net
Trinidad and Tobago : : : : : : 250 198 52 267 199 68
Turks & Caicos Islands : : : : : : 34 23 10 39 32 7
Virgin Islands, U.S. : : : : : : 89 75 14 49 68 -19
South American countries 9 494 7 755 1 739 12 412 9 063 3 349 13 878 10 366 3 512 16 895 11 040 5 855
Argentina 1 265 1 196 69 1 609 1 457 153 1 813 1 710 103 2 038 1 751 287
Bolivia : : : : : : 170 104 66 126 140 -15
Brazil 3 715 3 446 269 4 625 4 022 603 5 259 4 650 609 6 417 4 791 1 626
Chile 1 327 825 502 2 138 1 006 1 132 2 331 1 169 1 162 2 712 1 373 1 339
Colombia : : : : : : 974 555 419 1 088 609 477
Ecuador : : : : : : 500 347 152 583 407 176
Falkland Islands (Malvinas) : : : : : : 28 16 12 14 9 5
Guyana : : : : : : 75 49 27 76 33 43
Paraguay : : : : : : 66 50 17 71 62 9
Peru : : : : : : 640 639 0 1 030 719 312
Suriname : : : : : : 161 78 82 154 106 49
Uruguay 251 209 42 299 199 100 320 235 85 478 308 171
Venezuela 974 484 490 1 239 609 630 1 541 762 779 2 102 719 1 383
ASIA 81 667 62 261 19 406 94 362 69 737 24 625 102 962 80 444 22 518 120 501 89 552 30 950
Near and Middle East countries 17 287 11 785 5 501 19 886 12 795 7 091 24 147 14 804 9 343 29 794 16 779 13 014
Iran, Islamic Republic of 1 470 811 659 1 564 1 053 511 1 496 925 571 1 369 902 467
Israel 3 105 2 024 1 081 3 189 2 287 902 3 241 2 430 812 3 518 2 853 665
Gulf Arabian countries 10 841 7 381 3 460 12 906 7 552 5 354 17 114 9 297 7 817 22 646 10 716 11 929
Bahrain : : : : : : 785 285 499 682 375 306
Iraq : : : : : : 381 331 51 593 395 199
Kuwait : : : : : : 1 258 645 613 1 555 653 902
Oman : : : : : : 618 267 350 601 202 399
Qatar : : : : : : 1 462 646 815 2 480 910 1 569
Saudi Arabia : : : : : : 7 122 2 419 4 702 9 503 2 896 6 608
United Arab Emirates : : : : : : 5 312 4 544 767 7 004 5 174 1 830
Yemen : : : : : : 179 155 23 232 114 120
Other Near & Middle East countries 1 872 1 564 308 2 227 1 902 325 2 297 2 153 144 2 262 2 309 -47
Armenia : : : : : : 92 59 33 98 59 41
Azerbaijan : : : : : : 603 509 95 580 552 29
Georgia : : : : : : 216 160 56 227 190 36
Jordan : : : : : : 438 430 8 469 427 42
Lebanon : : : : : : 521 619 -98 435 723 -289
Palestinian Territory Occupied : : : : : : 31 16 16 27 31 -4
Syrian Arab Republic : : : : : : 391 355 35 431 330 100
Other Asian countries 14 414 12 762 1 653 16 166 13 526 2 640 18 254 14 938 3 315 19 869 16 160 3 709
Afghanistan : : : : : : 138 127 12 206 185 20
Bangladesh : : : : : : 343 416 -73 536 390 145
Bhutan : : : : : : 8 2 6 4 11 -7
Brunei Darussalam : : : : : : 156 50 105 225 17 208
Cambodia (Kampuchea) : : : : : : 57 83 -25 55 135 -80
China 9 116 7 379 1 737 12 434 9 405 3 029 13 346 11 890 1 456 17 766 13 769 3 996
Hong Kong 7 128 5 218 1 910 8 408 5 665 2 743 7 008 6 617 391 8 234 8 135 99
India 3 789 4 131 -342 5 367 5 076 292 7 259 5 769 1 490 9 555 7 020 2 535
Indonesia 1 167 1 080 87 1 223 1 072 151 1 543 1 196 348 1 811 1 146 666
Japan 18 354 10 652 7 701 19 620 12 001 7 619 18 607 13 193 5 413 19 378 13 805 5 573
Kazakhstan : : : : : : 1 994 1 598 397 2 113 1 473 640
Korea, Dem. People’s Rep. of (North Korea) : : : : : : 89 93 -4 103 203 -98
Korea, Republic of (South Korea) 5 554 3 234 2 320 5 912 3 484 2 428 6 759 3 973 2 786 7 212 3 961 3 251
Kyrgyzstan : : : : : : 58 194 -137 38 212 -175
Lao People’s Democratic Republic : : : : : : 42 90 -46 49 100 -51
Macao : : : : : : 36 53 -18 70 73 -3
Malaysia 1 884 1 538 347 2 124 1 600 524 2 117 1 896 221 2 342 1 865 477
Maldives : : : : : : 56 557 -501 37 452 -415
Mongolia : : : : : : 31 60 -29 39 30 8

III
124 European Union international trade in services
Statistical tablesTable 3.5
3.5. EU-27 trade in services: complete geographical breakdown(Mio EUR)
2004 2005 2006 2007
Credit Debit Net Credit Debit Net Credit Debit Net Credit Debit Net
Myanmar : : : : : : 62 73 -10 30 54 -24
Nepal : : : : : : 67 113 -46 80 168 -89
Pakistan : : : : : : 1 166 1 059 107 1 032 936 96
Philippines 781 681 100 886 824 62 943 1 110 -167 1 016 1 079 -63
Singapore 7 549 5 077 2 472 8 559 5 554 3 005 10 426 6 034 4 392 11 397 7 133 4 264
Sri Lanka : : : : : : 347 494 -147 358 355 3
Taiwan, Province of China 3 126 1 980 1 146 3 157 2 063 1 094 3 390 2 021 1 369 3 722 2 550 1 172
Tajikistan : : : : : : 59 156 -98 71 201 -131
Thailand 1 752 3 400 -1 648 1 877 3 771 -1 894 2 029 4 623 -2 594 2 151 4 926 -2 776
Timor-Leste : : : : : : 0 11 -10 5 17 -12
Turkmenistan : : : : : : 75 866 -793 53 938 -885
Uzbekistan : : : : : : 76 355 -278 70 389 -319
Viet Nam : : : : : : 510 858 -347 923 989 -66
OCEANIA & POLAR REGIONS 9 355 6 768 2 588 10 500 7 578 2 922 11 424 7 938 3 485 13 219 8 265 4 954
American Oceania : : : : : : 29 48 -19 20 62 -43
American Samoa 60 752 44 037 16 715 65 728 48 109 17 620 70 940 49 992 20 948 81 901 57 189 24 711
Guam : : : : : : - - - - - -
US Minor Outlying Islands : : : : : : - - - - - -
Australia 7 154 5 160 1 994 8 495 5 851 2 644 9 180 6 028 3 151 10 747 6 284 4 463
Australian Oceania : : : : : : 13 0 13 6 11 -5
Cocos (Keeling Islands) : : : : : : - - - - - -
Christmas Islands : : : : : : - - - - - -
Heard Island and McDonald Islands : : : : : : - - - - - -
Norfolk Island : : : : : : : : : : : :
Fiji : : : : : : : : : : : :
French Polynesia : : : : : : : : : : : :
Kiribati : : : : : : : : : : : :
Marshall Islands : : : : : : : : : : : :
Micronesia, Federated States of : : : : : : : : : : : :
Nauru : : : : : : : : : : : :
New Caledonia : : : : : : : : : : : :
New Zealand 1 550 1 146 403 1 730 1 291 439 1 865 1 248 617 1 920 1 293 627
New Zealand Oceania : : : : : : 42 14 27 45 15 29
Cook Islands : : : : : : - - - - - -
Niue : : : : : : - - - - - -
Tokelau : : : : : : - - - - - -
Northern Mariana Islands : : : : : : : : : : : :
Palau : : : : : : : : : : : :
Papua New Guinea : : : : : : : : : : : :
Pitcairn : : : : : : : : : : : :
Polar region : : : : : : 17 19 -3 20 28 -8
Antartica : : : : : : - - - - - -
Bouvet Island : : : : : : - - - - - -
South Georgia & the South Sandwich Islands : : : : : : - - - - - -
French Southern Territories : : : : : : - - - - - -
Solomon Islands : : : : : : : : : : : :
Tonga : : : : : : : : : : : :
Tuvalu : : : : : : : : : : : :
Vanuatu : : : : : : : : : : : :
Samoa : : : : : : : : : : : :
Wallis and Futuna : : : : : : : : : : : :

Methodological frameworkIV


Methodological framework IV
127 European Union international trade in services
FOR THE ATTENTION OF THE READERThe purpose of this chapter is to provide the reader with some simplified explanations in order to under-stand the practical meaning of current international transactions. It does not pretend to give an exhaus-tive description of such transactions. For more detailed information, the reader should refer to the fifth edition of the IMF Balance of Payments Manual.
What are current international transactions?
From a country’s point of view, a current international transaction, designated an export, takes place when a resident sells a real resource (goods, services and income) beyond the border and receives foreign currency as a counterpart. The opposite situation - an import - in which an input of real resource and an output of national currency occur in the country, reflects a current international transaction too.
Actually, current international transactions cover different kinds of economic flows. They comprise international exchanges and current transfers:
– International exchanges are the international economic flows implying a financial counterpart. All exports and imports of goods (involving changes in ownership), and of services, are interna-tional exchanges. Moreover, these also consist of international provision of labour, as it is the case of seasonal or other short-term workers (less than one year) and border workers who have centres of economic interest in their own economies; and of international remuneration on financial as-sets and liabilities, such as the payment of interests on money borrowed abroad and of dividends to non-resident shareholders for example.
– Transfers are unilateral economic flows that involve changes in ownership of goods and/or finan-cial assets. They often refer to items that are given away rather than exchanged. There are capital transfers and current transfers; the latter only are regarded as current transactions. As an illustra-tion, an international current transfer occurs when the government or a humanitarian organisa-tion gives money, food or medical supplies to another country. The contributions of Member States to the budget of the European Union Institutions are considered as current transfers as well.
What is the conceptual framework of international transactions?
A country’s current international transactions comprise all the transactions between its residents and non-residents. They are recorded in the balance of payments’ current account.
The balance of payments consists of two major accounts: the current account refers to real resources whereas the capital and financial account involves financial items.
The processing of these transactions follows the rules put forward in the fifth edition of the Interna-tional Monetary Fund Balance of Payments Manual (BPM5).
This publication covers only current international transactions, i.e., the current account part of the balance of payments.
How do countries deal with current international transactions?
International transactions implicate a big variety of real resources. In order to describe all kinds of transactions, the current account is subdivided into a number of accounts. The broadest categorisation differentiates goods, services, income and current transfers. These four accounts are broken down into very detailed sub-items such as communications services which are in turn subdivided into tel-ecommunications services and postal and courier services.
Current transactions are, in principle, recorded in gross flows. Each item should display a credit and a debit value in order to show exports and imports for this item. Due to problems of identifying gross flows for certain items some transactions are recorded net, that is as the difference between a credit and a debit. These offsetting mechanisms have the effect of underestimating credit and debit flows. Whenever they occur, these problems will be mentioned in the definitions below.

IV
128 European Union international trade in services
Methodological framework
WHY ARE THE BALANCE OF PAYMENTS OF ALL THE COUNTRIES IN THE WORLD NOT FULLY COMPATIBLE OR COMPARABLE?
Problems of consistency, asymmetries
Although in theory, all balance of payments accounts are drawn up in accordance with an internation-ally accepted methodology, the balance of payments of all the countries in the World are not fully compatible or comparable. There are many reasons for this lack of comparability. The following are some examples:
– Not all countries have the same resources for recording and analysing information and because of the special features of data collection they are sometimes obliged to depart from the recom-mended standards (in the case of insurance, for example).
– Not all countries agree on the treatment of certain long term activities (e.g. construction services).
– The increasing speed of world-wide economic integration and proliferation of transactions between related companies makes it difficult to allocate flows between services and direct investment.
The statistical problems mentioned above generate statistical discrepancies between countries’ cur-rent account balances. These discrepancies are called asymmetries. More specifically:
Bilateral Asymmetry: The balance declared by one compiling economy in relation to another does not correspond to the balance declared by its partner. The sum of these balances, called bilateral asymmetry should in theory be nil. However, misallocation of transactions creates an asymmetry at detailed item level that can be offset at an aggregated level. In the same way, a poor geographical breakdown creates a bilateral asymmetry which may be offset at an aggregated level of geographical breakdown.
Asymmetry in terms of geographical aggregation: the world total of current account credits does not tally with the world total of debits, whereas in theory they should be equal. The difference between current account credits and debits is termed world-wide asymmetry (or discordance) of current ac-count payments.
The current account and its subdivisions
Goods
This is generally the biggest category of the current account. Goods cover general merchandise, non monetary gold and since the implementation of the BPM5, goods for processing, repairs on goods and goods procured in ports by carriers. The most important component, general merchandise, includes all movable goods whose ownership is transferred from a resident to a non-resident and vice-versa.
Services
Trade in services is the second major category of the current account. If the main part of these transac-tions is made in a commercial purpose, the services account also allows non-commercial transactions under the item government services n.i.e.
Considering its intangible nature, international trade in services is much more difficult to record than trade in merchandise. In certain cases for example, practical difficulties for identifying gross flows may occur as many services can be paid for by means of an international offsetting mechanism. Fur-thermore, certain transactions between related companies are also settled by an offsetting mechanism. In both cases the identified payment corresponds to the net result of a number of transactions that are difficult to pinpoint. Such problems could involve underestimation of the flows of services.
Transactions in services are many and varied. They include amongst others: the shipping of Italian shoes by a Greek vessel; the construction of a shelter in Switzerland by a German company; the sub-

Methodological framework IV
129 European Union international trade in services
scription to a British newspaper by a Spanish student; the purchases of souvenirs by a Japanese tourist in France; the profit on the sale of Dutch cheese in Portugal by a Belgian merchant; the payments of annual fees by a German franchisee to its American franchisor.
The item services is subdivided in three components: transportation, travel and other services.
Transportation
This item covers all transportation (sea, air and other - including land, international waterway, space and pipelines) services that are performed by residents of one economy for those of another and that involve the carriage of passengers - registered in balance of payments under passenger services; the movement of goods - under freight services; and rentals (charters) of carriers with crew, and related supporting and auxiliary services - under supporting, auxiliary and other transport services.
Travel
Item travel covers primarily the goods and services acquired from an economy by travellers during visits of less than one year in that economy. The goods and services are purchased by, or on behalf of, the traveller or provided, without a quid pro quo, for the traveller to use or give away. Excluded is the international carriage of travellers, which is covered in passenger services under transportation.
Other services
Since services have become increasingly important in international transactions, a greater detail in the breakdown is now required. The item other services, which is largely broken down, can not be regarded as a mere residual item as it embraces a wide range of various transactions.
Other services reports transactions in communications services, construction services, insurance services, financial services, computer and information services, royalties and licence fees, other business services, personal, cultural and recreational services and government services.
Communications services• cover two main categories of international communications transac-tions between residents and non-residents: telecommunications services and postal and courier services. Telecommunications encompass the transmission of sound, images, or other information by telephone, telex, telegram, cable, broadcasting, satellite, electronic mail, facsimile services etc. and include business network services, teleconferencing, and support services. Postal and courier services encompass the pick-up, transport and delivery of letters, newspapers, periodicals, bro-chures, other printed matter, parcels, and packages by national postal administrations and other operators. Also included are post office counter and mailbox rental services.
Construction services• cover work performed on construction projects and installations by em-ployees of an enterprise in locations outside the economic territory of the enterprise. The work is generally performed for a short time period (less than one year but this rule is to be applied flex-ibly). Goods imported by the enterprise for use in the projects, and expenditures for local supplies, etc. are included in the value of these services rather than under goods.
Insurance services• cover the provision of various types of insurance to non-residents by resident insurance enterprises, and vice versa. Such services cover freight insurance, other types of direct insurance (i.e. life - including pension and annuity services, other casualty or accident, health, general liability, fire, marine, aviation, etc. insurance); also included in insurance services are agent commissions related to insurance transactions. International insurance services are estimated or valued by service charges included in total premiums earned rather than by total premiums. Gross premiums and gross claims are recorded as memorandum items.
Financial services• cover financial intermediary and auxiliary services (except those of insurance enterprises and pension funds) conducted between residents and non-residents. Included are in-termediary service fees, such as those associated with letters of credit, bankers’ acceptances, lines of credit, financial leasing, and foreign exchange transactions. Also included are commissions and other fees related to transactions in securities - brokerage, placement of issues, underwritings, redemptions, and arrangements of swaps, and options, and other hedging instruments; commis-sions of commodity futures traders; and services related to asset management, financial market

IV
130 European Union international trade in services
Methodological framework
131
operational and regulatory services, security custody services, etc. Service charges on purchases of International Monetary Fund resources are also included. Financial intermediation services indirectly measured are excluded.
Computer and information services • cover computer data and news-related service transactions between residents and non-residents. Computer services cover hardware and software consultancy and implementation: provision of advice and assistance on matters related to the management of computer resources; analysis, design and programming of systems ready to use, and technical con-sultancy related to software; development, production, supply and documentation of customised software including operating systems made on order for specific users; maintenance and other support services such as training. Excluded are packaged (non-customised) software and non-specific computer training courses which are treated in the same way as other educational serv-ices. Information services include database services: database conception, data storage, and data dissemination on-line and on magnetic media; news agency services including provision of news, photographs, and feature articles to the media; and direct, non-bulk subscriptions to newspapers and periodicals.
Royalties and licence fees• cover the exchange of payments and receipts between residents and non-residents for the authorised use of intangible, non-produced, non-financial assets and pro-prietary rights (such as patents, copyrights, trademarks, industrial processes, franchises, etc.) and with the use, through licensing agreements, of produced originals or prototypes (such as manuscripts and films).
Other business services• cover various categories, other than those previously defined. The group-ing of these services is not indicative of their relative importance. The three following categories are identified:
– Merchanting and other trade-related services cover commissions on goods and services trans-actions between (i) resident merchants, commodity brokers, dealers, and commission agents and (ii) non-residents.
Merchanting is defined as the purchase of a good by a resident from a non-resident and the sub-sequent resale of the good to another non-resident; during the process, the good does not enter or leave the compiling economy. The difference between the value of goods when acquired and the value when sold is recorded as the value of merchanting services provided.
Other trade-related services include transactions in ships, aircraft, and auction sales. Franchis-ing fees, brokerage in financial services and transport-related fees are excluded.
– Operational leasing services (rental) without operators cover resident/non-resident leasing and charters of ships, aircraft, and transportation equipment such as railway cars containers, rigs, etc. without crew. Financial leasing, leasing of telecommunications lines and leasing of land, buildings and other real estate, and car rentals to foreign travellers are excluded.
– Miscellaneous business professional and technical services are subdivided into:
Legal, accounting, management consulting, and public relations services which cover the provi-sion (by/for residents for/by non-residents) of legal advice, representation, and documentation; auditing, bookkeeping, and tax consultant services; and management consulting related to the provision of advice, guidance, or operational assistance to business.
Advertising, market research and public opinion polling services transacted between residents and non-residents cover the design, creation, and marketing of advertisements by advertising agencies; media placement, including the purchase and sale of advertising space; exhibition services provided by trade fairs; the promotion of products abroad; market research; and public opinion polling abroad on various issues.
Research and development services cover those services that are transacted between residents and non-residents and associated with basic research, applied research, and experimental develop-ment of new products and processes. In principle, such activities in the sciences, social sciences, and humanities are covered; included is the development of operating systems that represent technological advances. Market research, technical studies, and consultancy work are excluded.

Methodological framework IV
131 European Union international trade in services131 Eurostat Regional yearbook 2007
Architectural, engineering and other technical services cover resident/non-resident transactions related to architectural design of urban and other development projects; planning and project design and supervision of dams, bridges, airports, turnkey projects, etc.; surveying, cartogra-phy, product testing and certification, and technical inspection services.
Agricultural, mining and on-site processing services cover services incidental to agriculture, hunting, trapping, forestry and logging, and fishing; services rendered at oil and gas fields; waste treatment and depollution services; sanitation and other on-site processing.
Other miscellaneous business, professional and technical services cover placement of person-nel, security and investigation services, translation and interpretation, photographic services, building cleaning, etc.
Services between affiliated enterprises, n.i.e. is a residual category. It covers payments by affiliates to their parent companies for general management costs (for planning, organising and control-ling) and reimbursements of expenses settled directly by parent companies, funds transferred by parent companies to affiliates for covering overhead expenses, and any other services be-tween affiliated enterprises that cannot be broken into individual service categories.
Personal, cultural and recreational services• involving transactions between residents and non-residents are subdivided into two categories:
– Audiovisual and related services comprise services and associated fees related to the produc-tion of motion pictures, radio and television programs, and musical recordings.
– Other personal, cultural and recreational services comprise services such as those associated with museums, libraries, archives, and other cultural, sporting, and recreational activities. Also included are fees for services, including provision of correspondence courses, rendered abroad by teachers or doctors. All expenditures by travellers on education and health are excluded.
Government services, n.i.e• . is a residual category covering government service transactions (including those of international organisations) not contained in previous classifications. In-cluded are all transactions by embassies, consulates, military units, and defence agencies with residents of economies in which the embassies, etc. are located and all transactions with other economies.
Transactions in this category comprise those for goods and services (such as office supplies, fur-nishings, utilities, official vehicles and operation and maintenance, and official entertainment) and personal expenditures incurred by diplomats and consular staff and their dependants in the econo-mies in which they are located. Also included in this category are transactions, by other official entities (such as aid missions and government tourist, information, and promotion offices) located in economies abroad. Included, as well, are transactions that are associated with general admin-istrative expenditures, etc. and not classified elsewhere. In addition, transactions associated with aid services that are provided by non-military agencies, do not give rise to any payments, and have offsets in transfers are included in this category. Last, transactions associated with the provision of joint military arrangements and peacekeeping forces, such as those of the United Nations, are included in government services, n.i.e..
Income
Income contains two main items:
Compensation of employees records wages, salaries and other benefits, in cash or in kind, earned by individuals for work performed for economic units whose place of residence is different from their own (border workers, seasonal workers, employees of international organisations, etc.).
Investment income covers income which a resident entity derives from the ownership of external financial assets (credit) and income non-residents derive from their financial assets invested in the compiling economy (debit). This includes interest and dividends on direct, portfolio and other in-vestments.

IV
132 European Union international trade in services
Methodological framework
Current transfers
Current transfers form a group separate from goods, services and income because they are generally conceived as showing distinctive characteristics. However, the distinction between real resources and transfers is sometimes rather arbitrary. For example, receipts by an economy from certain individuals working abroad are classified either as current transfers or as compensation of employees, depending on how long the individuals have stayed in the countries where they are working. The BPM5 sets a number of criteria that enable to establish whether a flow is a current transfer or not.
Current transfers are all transfers that are not transfers of capital. Therefore, they consist of all trans-fers that do not involve:
– transfers of ownership of fixed assets,
– transfers of funds linked to, or conditioned upon, acquisition or disposal of fixed assets,
– forgiveness of liabilities by creditors when no counterpart is received in return.
Current and capital transfers may also be distinguished from their effects: current transfers directly affect the level of disposable income and should affect the consumption of goods and services whereas capital transfers should result in changes in the stocks of assets of one or both parties to the transaction.

AnnexesV


Annexes V
135 European Union international trade in services
EXCHANGE RATES
Annual average exchange rate:
2003 2004 2005 2006 2007Euro Area EUR 1 1 1 1 1Bulgaria BGN 1.949 1.953 1.956 1.956 1.956Czech Republic CZK 31.846 31.891 29.782 28.342 27.766Denmark DKK 7.431 7.440 7.452 7.459 7.451Estonia EEK 15.647 15.647 15.647 15.647 15.647Cyprus CYP 0.584 0.582 0.577 0.576 0.583Latvia LVL 0.641 0.665 0.696 0.696 0.700Lithuania LTL 3.453 3.453 3.453 3.453 3.453Hungary HUF 253.620 251.660 248.050 264.260 251.350Malta MTL 0.426 0.428 0.430 0.429 0.429Poland PLN 4.400 4.527 4.023 3.896 3.784Romania RON 3.755 4.051 3.621 3.526 3.333Slovakia SKK 41.489 40.022 38.599 37.234 33.775United Kingdom GBP 0.692 0.679 0.684 0.682 0.684Norway NOK 8.003 8.370 8.009 8.047 8.017Switzerland CHF 1.521 1.544 1.548 1.573 1.643Croatia HRK 7.569 7.497 7.401 7.325 7.338Turkey TRY 1.695 1.777 1.677 1.809 1.789United States USD 1.131 1.244 1.244 1.256 1.371Canada CAD 1.582 1.617 1.509 1.424 1.468Japan JPY 130.970 134.440 136.850 146.020 161.250

V
136 European Union international trade in services
Annexes
BOP Geographical Zones
EUROPE
European Union - see economic zonesEFTA - see economic zonesOther European countries
Andorra Guernsey Montenegro (from 2007) Turkey Albania Gibraltar Macedonia, F.Y.R Ukraine Bosnia and Herzegoviina Croatia Romania (till 2006) Holy See (Vatican City)Bulgaria (till 2006) Isle of Man Serbia (from 2007) Serbia & Montenegro
(till 2006)Belarus Jersey Russian FederationFaroe Islands Moldova, Rep of San Marino
AFRICA
North Africa
Algeria Libyan Arab Jamahiriya TunisiaEgypt Morocco
Other African countries
Angola Ethiopia Mali Senegal Burkina Faso Gabon Mauritania Somalia Burundi Ghana Mauritius Sao Tome and Principe Benin Gambia Malawi Swaziland Botswana Guinea Mozambique Chad Congo, the Dem. Rep. of the
Equatorial Guinea Namibia Togo
Central African Republic
Guinea-Bissau Niger Tanzania, United Republic of
Congo British Indian Ocean Territory
Nigeria Uganda
Côte d’Ivoire Kenya Rwanda South Africa Cameroon Comoros Seychelles Zambia Cape Verde Liberia Sudan Zimbabwe Djibouti Lesotho St Helena Eritrea Madagascar Sierra Leone
AMERICA
North American countries
Canada Greenland United States

Annexes V
137 European Union international trade in services
Central American countries
Antigua and Barbuda Costa Rica Jamaica El SalvadorAnguilla Cuba St Kitts and Nevis Turks and Caicos Isl.Netherlands Antilles Dominica Cayman Islands Trinidad &TobagoAruba Dominican Republic Saint Lucia St Vincent & the
GrenadinesBarbados Grenada Montserrat Virgin Isl. BritishBermuda Guatemala Mexico Virgin Isl, U.S.Bahamas Honduras NicaraguaBelize Haiti Panama
South American countries
Argentina Colombia Peru VenezuelaBolivia Ecuador ParaguayBrazil Falkland Islands SurinameChile Guyana Uruguay
ASIA
Near and Middle East countries
Israel Iran, Islamic Republic of
Gulf Arabian countries
United Arab Emirates Iraq Oman Saudi Arabia Bahrain Kuwait Qatar Yemen
Other Near and Middle East countries
Armenia Georgia Lebanon Syrian Arab Rep.Azerbaijan Jordan Palestinian Territory,
Occup
Other Asian countries
Afghanistan Japan Myanmar Singapore Bangladesh Kyrgyzstan Mongolia Thailand Brunei Darussalam Cambodia Macao Tajikistan Bhutan North Korea Maldives Timor-Leste China Rep. of Korea (South) Malaysia Turkmenistan Hong Kong Kazakhstan Nepal Taiwan, Prov. of ChinaIndonesia Lao People’s Dem. Rep. Philippines UzbekistanIndia Sri Lanka Pakistan Viet Nam

V
138 European Union international trade in services
Annexes
OCEANIA AND POLAR REGIONS
Australia Northern Mariana Islands
Papua New Guinea Tuvalu
Fiji New Caledonia Pitcairn Vanuatu Micronesia, Fed. States of Nauru Palau Wallis and FutunaKiribati New Zealand Solomon Islands Samoa Marshall Islands French Polynesia Tonga
Australian Oceania
Cocos Islands (Keeling) Christmas Island Heard & McDonald Island
Norfolk Island
American Oceania
American Samoa Guam US Minor Outlying Islands
New Zealand Oceania
Cook Islands Niue Tokelau
Polar regions
Antarctica Bouvet Island South Georgia & Sandwich Is.
French South. Territories

Annexes V
139 European Union international trade in services
BOP Economic Zones
European Union
Belgium Spain Malta FinlandBulgaria (from 2007) France Netherlands SwedenCzech Republic Italy Austria United KingdomDenmark Cyprus Poland EU Institutions
(excl. ECB)Germany Latvia Portugal European Central Bank
(ECB)Estonia Lithuania Romania (from 2007)Ireland Luxembourg SloveniaGreece Hungary Slovak Republic
Euro-area
Belgium Spain Netherlands Slovenia (from 2007)Germany France Austria European Central Bank
(ECB)Ireland Italy PortugalGreece Luxembourg Finland
EFTA (European Free Trade Association)
Switzerland Iceland Liechtenstein Norway
OECD (Organisation for Economic Cooperation & Development)
Austria Spain Italy Poland Australia Finland Japan Portugal Belgium France Korea, Republic of
(South)Sweden
Canada United Kingdom Luxembourg Slovakia Switzerland Greece Mexico TurkeyCzech Republic Hungary Netherlands United StatesGermany Ireland Norway EU Institutions
(excl ECB)Denmark Iceland New Zealand European Central Bank
(ECB)
Countries from Central and Eastern Europe
Albania Croatia Romania (till 2006)Bosnia & Herzegovina Montenegro (from 2007) Serbia (from 2007)Bulgaria (till 2006) Macedonia, FY
Republic ofSerbia & Montenegro (till 2006)

V
140 European Union international trade in services
Annexes
NAFTA (North American Free Trade Association)
Canada Mexico United States
Latin America
Argentina Costa Rica Mexico El SalvadorBolivia Cuba Nicaragua UruguayBrazil Ecuador Panama VenezuelaChile Guatemala PeruColombia Honduras Paraguay
ASEAN (Association of South-East Asian Nations)
Brunei Darussalam Lao People’s Democratic Rep
Philippines Viet Nam
Indonesia Myanmar SingaporeCambodia (Kampuchea) Malaysia Thailand
OPEC (Organisation of Petroleum Exporting countries)
United Arab Emirates Iran, Islamic Republic of Qatar Angola (from 2007)Algeria Kuwait Saudi ArabiaIndonesia Libyan Arab Jamahiriya VenezuelaIraq Nigeria Ecuador
ACP (African, Caribbean and Pacific countries signatories to the Partnership agreement (Cotonou Agreement))
African ACP countries
Angola Eritrea Madagascar Sierra LeoneBurkina Faso Ethiopia Mali SenegalBurundi Gabon Mauritania SomaliaBenin Ghana Mauritius Sâo Tome & PrincipeBotswana Gambia Malawi Swaziland Congo, Democratic Rep.of
Guinea Mozambique Chad
Central African Republic
Equatorial Guinea Namibia Togo
Congo Guinea-Bissau Niger Tanzania, United Rep. ofCôte d’Ivoire Kenya Nigeria Uganda Cameroon Comoros Rwanda South Africa, Rep. ofCape Verde Liberia Seychelles Zambia Djibouti Lesotho Sudan Zimbabwe

Annexes V
141 European Union international trade in services
Caribbean ACP countries
Antigua and Barbuda Dominica Haiti Suriname Barbados Dominican Republic Jamaica Trinidad & TobagoBahamas Grenada St Kitts and Nevis St Vincent & GrenadinesBelize Guyana Saint Lucia
Pacific ACP countries
Cook Islands Marshall Islands Palau VanuatuFiji Nauru Solomon Islands SamoaMicronesia, Fed. States of Niue TongaKiribati Papua New Guinea Tuvalu
Offshore financial centers
Andorra Dominica Lebanon Philippines Antigua and Barbuda Grenada Saint Lucia Singapore Anguilla Guernsey Liechtenstein Turks and Caicos IslandsNetherlands Antilles Gibraltar Liberia Saint Vincent & the
GrenadinesBarbados Hong Kong Marshall Islands Virgin Islands, British Bahrain Isle of Man Montserrat Virgin Islands, U.S.Bermuda Jersey Maldives VanuatuBahamas Jamaica Nauru SamoaBelize St Kitts and Nevis NiueCook Islands Cayman Islands Panama French Franc zone
Burkina Faso Côte d’Ivoire Guinea-Bissau SenegalBenin Cameroon Comoros ChadCentral African Republic Gabon Mali TogoCongo Equatorial Guinea Niger
Commonwealth of Independent States (CIS)
Armenia Georgia Moldova, Republic of Turkmenistan Azerbaijan Kyrgyzstan Russian Federation Ukraine Belarus Kazakhstan Tajikistan Uzbekistan
Countries from Maghreb
Algeria Morocco Tunisia

V
142 European Union international trade in services
Annexes
Countries from Mashrek
Egypt Lebanon Palestinian Territ., Occupied
Syrian Arab Rep.
Jordan
MERCOSUR (Countries of the South Cone Common Market)
Argentina Brazil Paraguay Uruguay
Mediterranean countries in the Euro-Mediterranean Partnership
Cyprus (till 2003) Israel Morocco Syrian Arab RepublicAlgeria Jordan Malta (till 2003) Tunisia Egypt Lebanon Palestinian Territ.,
OccupiedTurkey
APEC (Asia-Pacific Economic Cooperation)
Australia Indonesia Peru Taiwan, Province of China
Brunei Darussalam Japan Papua New Guinea United States Canada Korea, Rep.of (South) Philippines Viet Nam Chile Mexico Russian FederationChina Malaysia Singapore Hong Kong New Zealand Thailand

Annexes V
143 European Union international trade in services
Eurostat would like to thank the following national banks and statistical offices for their co-operation:
Banque Nationale de Belgique (BE)
Bulgarian National Bank (BG)
Ceska Narodni Banka (CZ)
Danmarks Statistik (DK)
Deutsche Bundesbank (DE)
Eesti Pank (EE)
Central Statistical Office, Ireland (IE)
Bank of Greece (EL)
Banco de España (ES)
Banque de France (FR)
Ufficio Italiano dei Cambi (IT)
Central Bank of Cyprus (CY)
Latvijas Banka (LV)
Lietuvos Bankas (LT)
Statec Luxembourg (LU)
Magyar Nemzeti Bank (HU)
National Statistics Office – Malta (MT)
De Nederlansche Bank (NL)
Die Oesterreichische Nationalbank (AT)
Narodowy Bank Polski (PL)
Banco de Portugal (PT)
National Bank of Romania (RO)
Banka Slovenije (SI)
Národná Banka Slovenska (SK)
Suomen Pankki (FI)
Sveriges Riksbank (SE)
Office for National Statistics (UK)
Schweizerische Nationalbank (CH)
Hrvatska Narodna Banka (HR)
Seðlabanki Íslands (IS)
Statistics Norway (NO)
Türkiye Cumhuriyet Merkez Bankası (TR)
United States Department of Commerce (US)
Bank of Japan (JP)
The data processing, statistical analysis, writing of chapters and desktop publishing were carried out by the following team:
Mrs Franca Faes-Cannito
Mrs Sylvie Gori
Mr Mushtaq Hussain
Mr Bernd Schweinberger
For more information, please contact:
Mr Mushtaq Hussain
Eurostat, Balance of Payments Unit
European Commission
Bech E4/818
L – 2721 – Luxembourg
Tel: (+352) 4301 35811
Fax: (+352) 4301 33859 email: [email protected]


European Commission
European Union international trade in services – Analytical aspects
Luxembourg: Office for Official Publications of the European Communities
2009 — 143 pp. — 21 x 29.7 cm
ISBN 978-92-79-11305-5ISSN 1725-4477
