european leveraged debt fights back
TRANSCRIPT
Despite a tough year, leveraged debt is facing up to challenges with renewed resilience
European leveraged debt fights back
Contents
2016 in reviewPage 3
The leveraged debt boom post-Brexit Page 5
Infographic: European leveraged debt in focusPage 8
The future of European leveraged debtPage 10

European leveraged debt fights back
What to expect for the international financial markets in 2017? If 2016 is any guide, perhaps the mantra should be “expect the unexpected.”
For every dire prediction we read about 2017, we can find a corresponding optimistic forecast based on the same facts. Brexit, US politics, upcoming European elections, rising interest rates, impending ECB regulations, international relations, you name it, numerous factors will
determine the landscape for the year.Perhaps the main lesson to be learned from 2016 is that, while financial markets remain cautionary,
they now respond to volatility much more quickly than in the past, as evidenced by the severe downturn in activity in the early part of the year followed by a post-Brexit rebound (even though the actual result was unexpected) and now guarded optimism about the impact of the US election results as we enter the new year.
So, for the optimists, 2017 is looking good. Expected increases in M&A activity, looming maturities and market growth in certain sectors and regions bode well for an active market. For the pessimists, flip it around, uncertain market valuations, rising interest rates and economic uncertainty garner the opposite expectation.
One safe bet: our original predictions on the convergence of international markets are proving accurate, and this trend will continue. We expect 2017 to be a year where high yield bonds and covenant light “term loan B” loans battle for market prominence. As the market continues to expand horizontally, we expect the momentum for financial restructurings, demand for alternative capital and direct lending solutions, and emerging market capital requirements, to continue to provide opportunities for new and innovative approaches to capital-raising in the European markets. Market participants showing versatility and the ability to innovate quickly across a broad range of products, markets and platforms should be well positioned for an active year, come what may.
A new era for leveraged debt in 2017
Rob MathewsPartner, White & Case
Lee CullinanePartner, White & Case

3European leveraged debt fights back
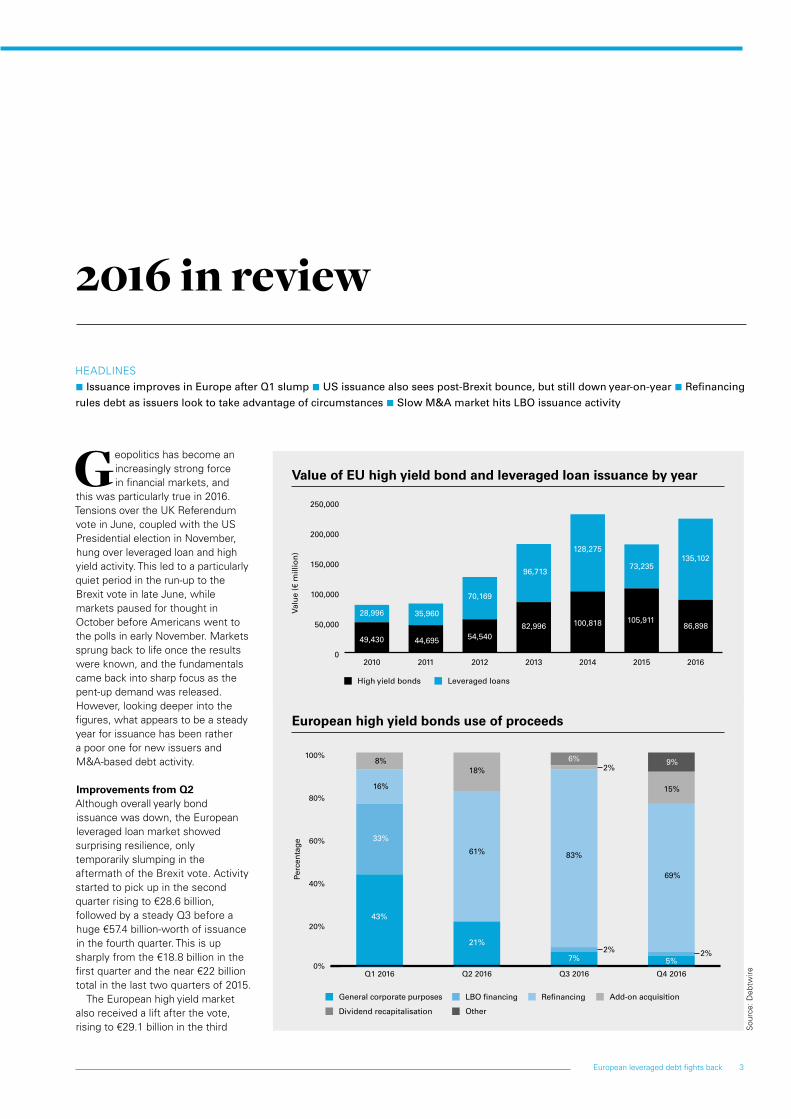
Geopolitics has become an increasingly strong force in financial markets, and
this was particularly true in 2016. Tensions over the UK Referendum vote in June, coupled with the US Presidential election in November, hung over leveraged loan and high yield activity. This led to a particularly quiet period in the run-up to the Brexit vote in late June, while markets paused for thought in October before Americans went to the polls in early November. Markets sprung back to life once the results were known, and the fundamentals came back into sharp focus as the pent-up demand was released. However, looking deeper into the figures, what appears to be a steady year for issuance has been rather a poor one for new issuers and M&A-based debt activity.
Improvements from Q2Although overall yearly bond issuance was down, the European leveraged loan market showed surprising resilience, only temporarily slumping in the aftermath of the Brexit vote. Activity started to pick up in the second quarter rising to €28.6 billion, followed by a steady Q3 before a huge €57.4 billion-worth of issuance in the fourth quarter. This is up sharply from the €18.8 billion in the first quarter and the near €22 billion total in the last two quarters of 2015.
The European high yield market also received a lift after the vote, rising to €29.1 billion in the third
HEADLINES
n Issuance improves in Europe after Q1 slump n US issuance also sees post-Brexit bounce, but still down year-on-year n Refinancing rules debt as issuers look to take advantage of circumstances n Slow M&A market hits LBO issuance activity
2016 in review
European high yield bonds use of proceeds
Sou
rce:
Deb
twire
0%
20%
40%
60%
80%
100%
Q4 2016Q3 2016Q2 2016Q1 2016
43%
21%
61%
18% 2%
2%
83%
6%
15%
69%
5%
9%
7%
33%
8%
16%
Perc
enta
ge
2%
LBO financingGeneral corporate purposes Refinancing Add-on acquisition
Other Dividend recapitalisation
Value of EU high yield bond and leveraged loan issuance by year
0
50,000
100,000
150,000
200,000
250,000
2016201520142013201220112010
Leveraged loansHigh yield bonds
73,235135,102
86,898105,911
28,996
49,430
35,960
44,695
70,169
54,540
96,713
82,996
128,275
100,818
4 White & Case
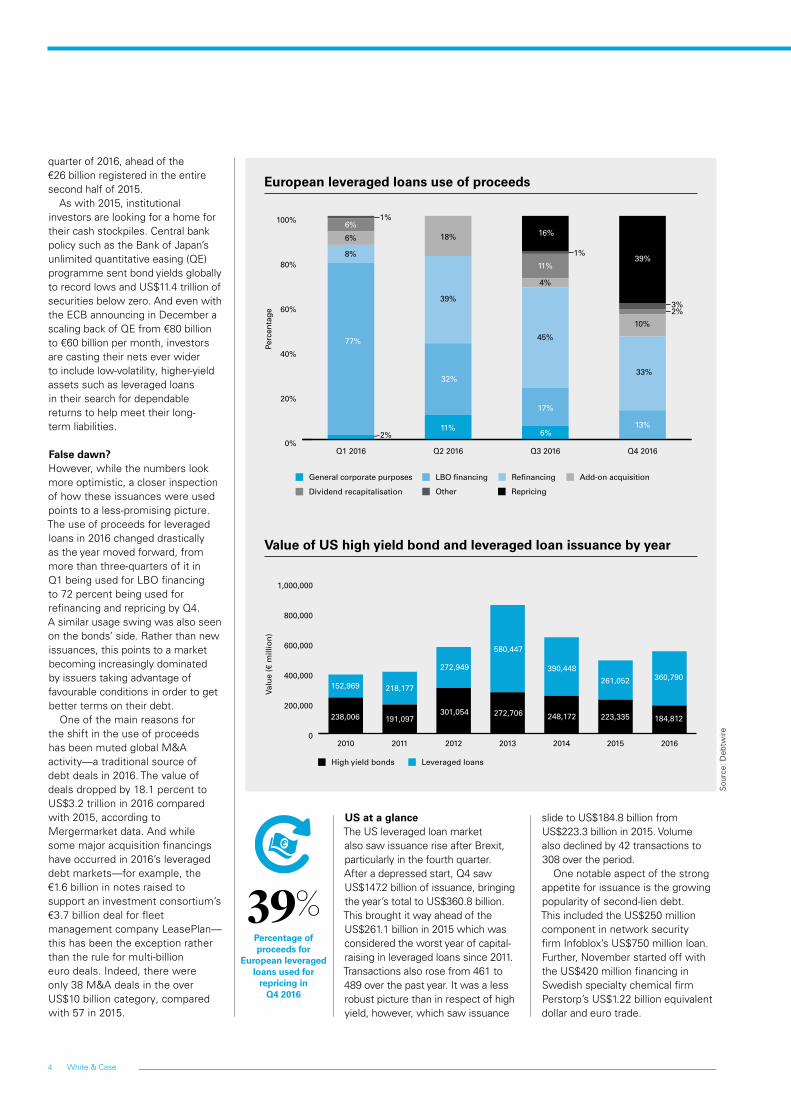
Value of US high yield bond and leveraged loan issuance by year
quarter of 2016, ahead of the €26 billion registered in the entire second half of 2015.
As with 2015, institutional investors are looking for a home for their cash stockpiles. Central bank policy such as the Bank of Japan’s unlimited quantitative easing (QE) programme sent bond yields globally to record lows and US$11.4 trillion of securities below zero. And even with the ECB announcing in December a scaling back of QE from €80 billion to €60 billion per month, investors are casting their nets ever wider to include low-volatility, higher-yield assets such as leveraged loans in their search for dependable returns to help meet their long- term liabilities.
False dawn? However, while the numbers look more optimistic, a closer inspection of how these issuances were used points to a less-promising picture. The use of proceeds for leveraged loans in 2016 changed drastically as the year moved forward, from more than three-quarters of it in Q1 being used for LBO financing to 72 percent being used for refinancing and repricing by Q4. A similar usage swing was also seen on the bonds’ side. Rather than new issuances, this points to a market becoming increasingly dominated by issuers taking advantage of favourable conditions in order to get better terms on their debt.
One of the main reasons for the shift in the use of proceeds has been muted global M&A activity—a traditional source of debt deals in 2016. The value of deals dropped by 18.1 percent to US$3.2 trillion in 2016 compared with 2015, according to Mergermarket data. And while some major acquisition financings have occurred in 2016’s leveraged debt markets—for example, the €1.6 billion in notes raised to support an investment consortium’s €3.7 billion deal for fleet management company LeasePlan—this has been the exception rather than the rule for multi-billion euro deals. Indeed, there were only 38 M&A deals in the over US$10 billion category, compared with 57 in 2015.
European leveraged loans use of proceeds
Sou
rce:
Deb
twire
US at a glanceThe US leveraged loan market also saw issuance rise after Brexit, particularly in the fourth quarter. After a depressed start, Q4 saw US$147.2 billion of issuance, bringing the year’s total to US$360.8 billion. This brought it way ahead of the US$261.1 billion in 2015 which was considered the worst year of capital-raising in leveraged loans since 2011. Transactions also rose from 461 to 489 over the past year. It was a less robust picture than in respect of high yield, however, which saw issuance
1%
2%
LBO financingGeneral corporate purposes Refinancing Add-on acquisition
Other Repricing
Perc
enta
ge
1%
3%2%
Dividend recapitalisation
0%
20%
40%
60%
80%
100%
Q4 2016Q3 2016Q2 2016Q1 2016
77%
8%
6%
6%
18% 16%
11%
4%
45%
17%
13%
33%
10%
39%
39%
32%
11%6%
0
200,000
400,000
600,000
800,000
1,000,000
2016201520142013201220112010
Leveraged loansHigh yield bonds
238,006
152,969 218,177
272,949
580,447
390,448
248,172
261,052 360,790
184,812 223,335 272,706 301,054 191,097
39%Percentage of proceeds for
European leveraged loans used for
repricing in Q4 2016
slide to US$184.8 billion from US$223.3 billion in 2015. Volume also declined by 42 transactions to 308 over the period.
One notable aspect of the strong appetite for issuance is the growing popularity of second-lien debt. This included the US$250 million component in network security firm Infoblox’s US$750 million loan. Further, November started off with the US$420 million financing in Swedish specialty chemical firm Perstorp’s US$1.22 billion equivalent dollar and euro trade.
€
5European leveraged debt fights back
HEADLINES
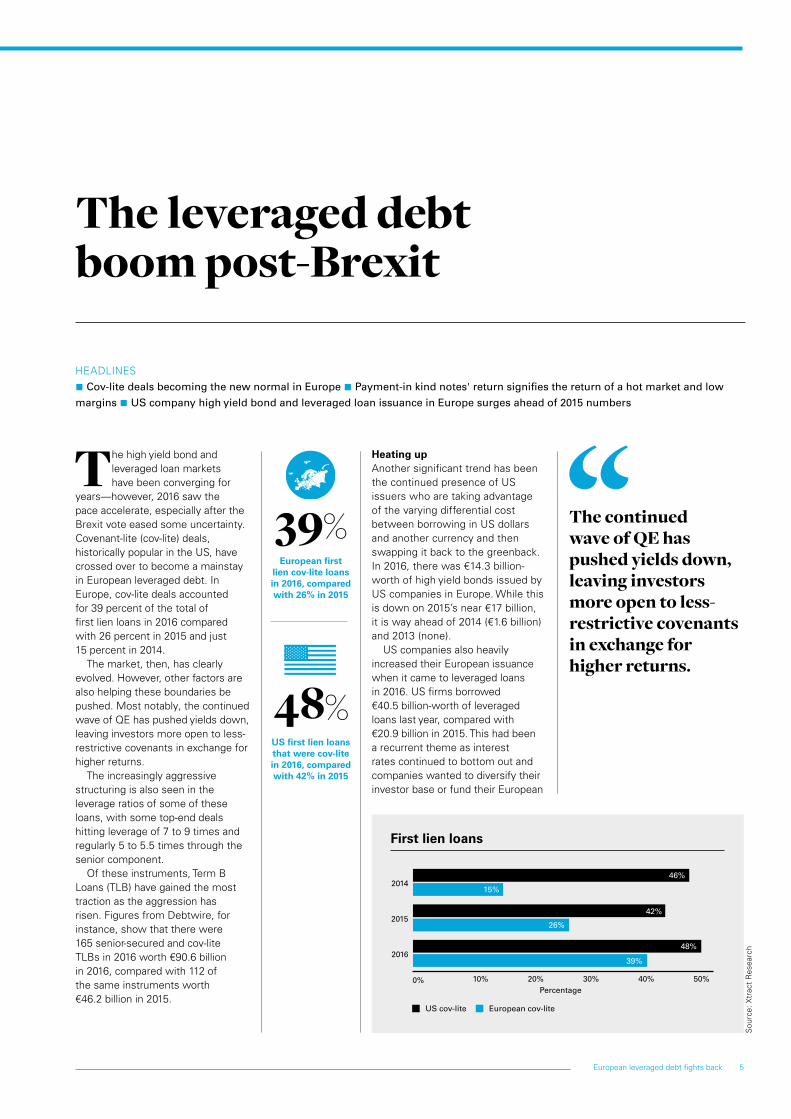
n Cov-lite deals becoming the new normal in Europe n Payment-in kind notes' return signifies the return of a hot market and low margins n US company high yield bond and leveraged loan issuance in Europe surges ahead of 2015 numbers
The leveraged debt boom post-Brexit
The high yield bond and leveraged loan markets have been converging for
years—however, 2016 saw the pace accelerate, especially after the Brexit vote eased some uncertainty. Covenant-lite (cov-lite) deals, historically popular in the US, have crossed over to become a mainstay in European leveraged debt. In Europe, cov-lite deals accounted for 39 percent of the total of first lien loans in 2016 compared with 26 percent in 2015 and just 15 percent in 2014.
The market, then, has clearly evolved. However, other factors are also helping these boundaries be pushed. Most notably, the continued wave of QE has pushed yields down, leaving investors more open to less-restrictive covenants in exchange for higher returns.
The increasingly aggressive structuring is also seen in the leverage ratios of some of these loans, with some top-end deals hitting leverage of 7 to 9 times and regularly 5 to 5.5 times through the senior component.
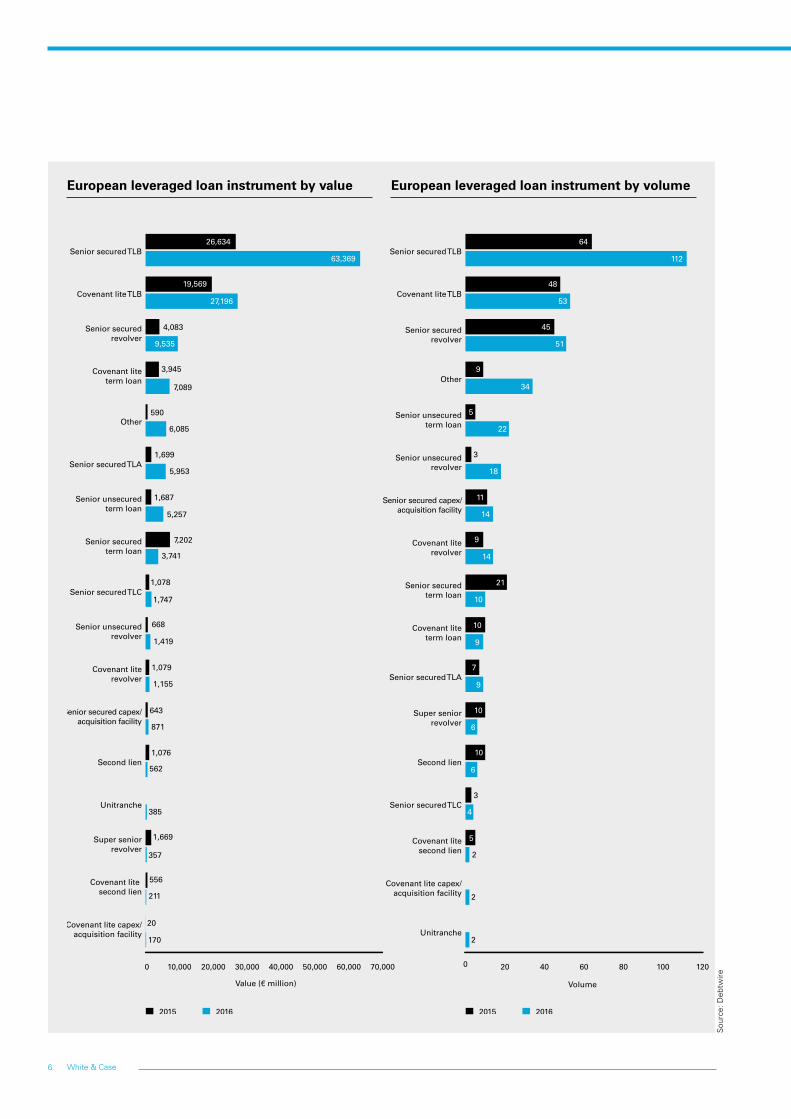
Of these instruments, Term B Loans (TLB) have gained the most traction as the aggression has risen. Figures from Debtwire, for instance, show that there were 165 senior-secured and cov-lite TLBs in 2016 worth €90.6 billion in 2016, compared with 112 of the same instruments worth €46.2 billion in 2015.
Heating upAnother significant trend has been the continued presence of US issuers who are taking advantage of the varying differential cost between borrowing in US dollars and another currency and then swapping it back to the greenback. In 2016, there was €14.3 billion-worth of high yield bonds issued by US companies in Europe. While this is down on 2015’s near €17 billion, it is way ahead of 2014 (€1.6 billion) and 2013 (none).
US companies also heavily increased their European issuance when it came to leveraged loans in 2016. US firms borrowed €40.5 billion-worth of leveraged loans last year, compared with €20.9 billion in 2015. This had been a recurrent theme as interest rates continued to bottom out and companies wanted to diversify their investor base or fund their European
First lien loans
Sou
rce:
Xtr
act
Res
earc
h
The continued wave of QE has pushed yields down, leaving investors more open to less-restrictive covenants in exchange for higher returns.
0% 10% 20% 30% 40% 50%
2016
2015
2014
European cov-liteUS cov-lite
Percentage
46%
42%
26%
48%
39%
15%
48% US first lien loans that were cov-lite in 2016, compared with 42% in 2015
39%European first
lien cov-lite loans in 2016, compared with 26% in 2015
6 White & Case
European leveraged loan instrument by value European leveraged loan instrument by volume
20162015
0 10,000 20,000 30,000 40,000 50,000 60,000 70,000
Covenant lite capex/acquisition facility
Covenant lite second lien
Super seniorrevolver
Unitranche
Second lien
Senior secured capex/acquisition facility
Covenant literevolver
Senior unsecuredrevolver
Senior secured TLC
Senior securedterm loan
Senior unsecuredterm loan
Senior secured TLA
Other
Covenant liteterm loan
Senior securedrevolver
Covenant lite TLB
Senior secured TLB
3,945
590
1,687
5,257
3,741
1,078
1,079
1,747
668
1,419
1,155
643
871
1,076
562
385
1,669
357
1,699
5,953
7,202
20
170
556
211
26,634
63,369
19,569
27,196
4,083
9,535
7,089
6,085
20162015
0 20 40 60 80 100 120
Unitranche
Covenant lite capex/acquisition facility
Covenant litesecond lien
Senior secured TLC
Second lien
Super seniorrevolver
Senior secured TLA
Covenant liteterm loan
Senior securedterm loan
Covenant literevolver
Senior secured capex/acquisition facility
Senior unsecuredrevolver
Senior unsecuredterm loan
Other
Senior securedrevolver
Covenant lite TLB
Senior secured TLB
14
14
7
2
5
2
2
18
22
34
48
112
64
53
45
51
9
5
3
11
9
21
10
10
9
9
10
6
6
10
3
4
Sou
rce:
Deb
twire
7European leveraged debt fights back
Moody’s Investors Service gave the Schaeffler’s deal a Ba1 rating for refinancing the existing holding company debt, while the upsize allowed it to repay a legacy intercompany loan. However, not all deals pass the investor test, and companies need to have a strong investment case. For example, French glass bottle manufacturer Verallia, which is owned by private equity firm Apollo, pulled its €500 million PIK in October because the buy-side baulked at the deal’s use of proceeds and weak structure.
Looking ahead, there are also concerns that the rise in PIK notes is a symptom of an overheating credit market, particularly as they are often used to pay dividends
11Number of PIK notes issued in 2016, compared with 4 in 2015
PIK
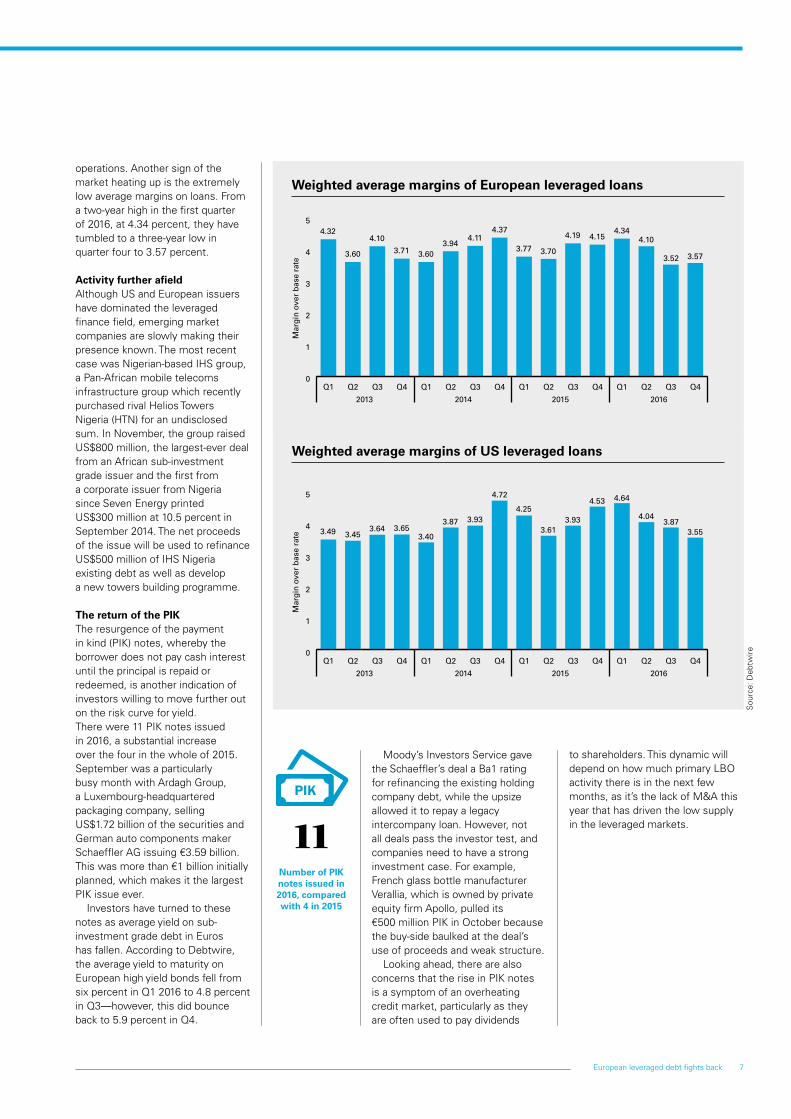
operations. Another sign of the market heating up is the extremely low average margins on loans. From a two-year high in the first quarter of 2016, at 4.34 percent, they have tumbled to a three-year low in quarter four to 3.57 percent.
Activity further afieldAlthough US and European issuers have dominated the leveraged finance field, emerging market companies are slowly making their presence known. The most recent case was Nigerian-based IHS group, a Pan-African mobile telecoms infrastructure group which recently purchased rival Helios Towers Nigeria (HTN) for an undisclosed sum. In November, the group raised US$800 million, the largest-ever deal from an African sub-investment grade issuer and the first from a corporate issuer from Nigeria since Seven Energy printed US$300 million at 10.5 percent in September 2014. The net proceeds of the issue will be used to refinance US$500 million of IHS Nigeria existing debt as well as develop a new towers building programme.
The return of the PIKThe resurgence of the payment in kind (PIK) notes, whereby the borrower does not pay cash interest until the principal is repaid or redeemed, is another indication of investors willing to move further out on the risk curve for yield. There were 11 PIK notes issued in 2016, a substantial increase over the four in the whole of 2015. September was a particularly busy month with Ardagh Group, a Luxembourg-headquartered packaging company, selling US$1.72 billion of the securities and German auto components maker Schaeffler AG issuing €3.59 billion. This was more than €1 billion initially planned, which makes it the largest PIK issue ever.
Investors have turned to these notes as average yield on sub-investment grade debt in Euros has fallen. According to Debtwire, the average yield to maturity on European high yield bonds fell from six percent in Q1 2016 to 4.8 percent in Q3—however, this did bounce back to 5.9 percent in Q4.
to shareholders. This dynamic will depend on how much primary LBO activity there is in the next few months, as it’s the lack of M&A this year that has driven the low supply in the leveraged markets.
Weighted average margins of European leveraged loans
Weighted average margins of US leveraged loans
Sou
rce:
Deb
twire
Mar
gin
over
bas
e ra
te
0
1
2
3
4
5
Q4Q3Q2Q1Q4Q3Q2Q1Q4Q3Q2Q1Q4Q3Q2Q1
2013 2014 2015 2016
4.32
3.60
4.10
3.71 3.603.94
4.114.37
3.77 3.70
4.19 4.154.34
4.10
3.52 3.57
Mar
gin
over
bas
e ra
te
0
1
2
3
4
5
Q4Q3Q2Q1Q4Q3Q2Q1Q4Q3Q2Q1Q4Q3Q2Q1
2013 2014 2015 2016
3.49 3.453.64 3.65
3.40
3.87 3.93
4.72
4.25
3.613.93
4.53 4.64
4.043.87
3.55
8 White & CaseWhite & Case
8
Iceland Scale: 50%
Map legend (overall activity ranking)
Lowest Highest
Volume 2016
Volume 2015
Value (€m) 2016
Value (€m) 2015
All graph legend
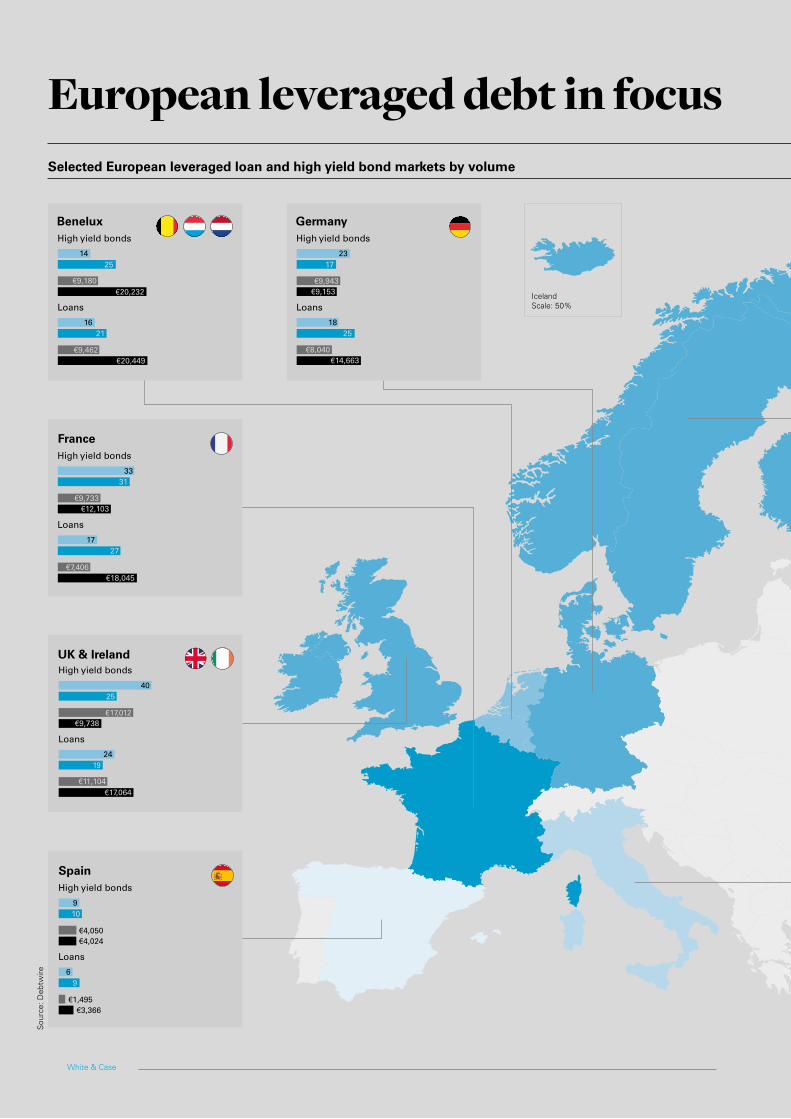
UK & Ireland High yield bonds
4025
€9,738€17,012
Loans
2419
€17,064€11,104
Benelux High yield bonds
1425
€9,180€20,232
Loans
1621
€9,462€20,449
Germany High yield bonds
2317
€9,153€9,943
Loans
1825
€14,663€8,040
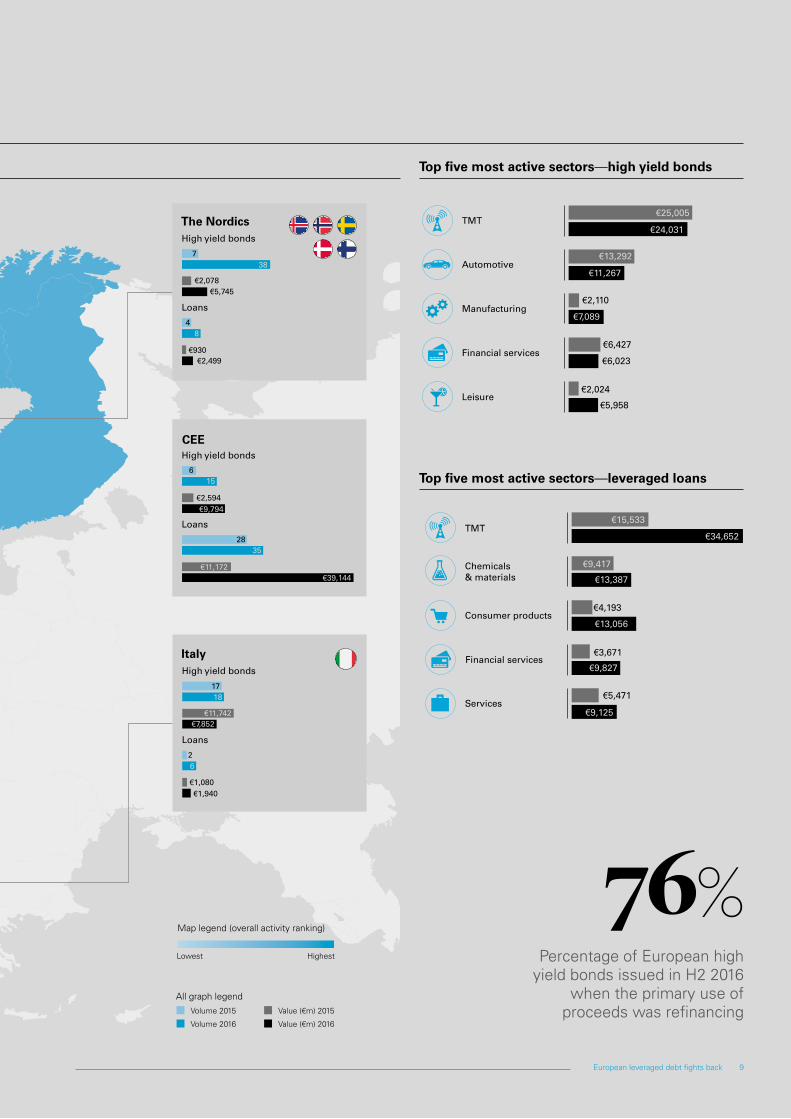
The NordicsHigh yield bonds
738
€5,745€2,078
Loans
48
€2,499€930
31
FranceHigh yield bonds
33
€12,103€9,733
Loans
1727
€18,045€7,406
SpainHigh yield bonds
910
€4,050€4,024
Loans
69
€1,495€3,366
ItalyHigh yield bonds
1718
€7,852€11,742
Loans
26
€1,940€1,080
6
CEEHigh yield bonds
15
€2,594€9,794
Loans
2835
€11,172€39,144
Sou
rce:
Deb
twire
European leveraged debt in focusSelected European leveraged loan and high yield bond markets by volume
9European leveraged debt fights back
Iceland Scale: 50%
Map legend (overall activity ranking)
Lowest Highest
Volume 2016
Volume 2015
Value (€m) 2016
Value (€m) 2015
All graph legend
UK & Ireland High yield bonds
4025
€9,738€17,012
Loans
2419
€17,064€11,104
Benelux High yield bonds
1425
€9,180€20,232
Loans
1621
€9,462€20,449
Germany High yield bonds
2317
€9,153€9,943
Loans
1825
€14,663€8,040
The NordicsHigh yield bonds
738
€5,745€2,078
Loans
48
€2,499€930
31
FranceHigh yield bonds
33
€12,103€9,733
Loans
1727
€18,045€7,406
SpainHigh yield bonds
910
€4,050€4,024
Loans
69
€1,495€3,366
ItalyHigh yield bonds
1718
€7,852€11,742
Loans
26
€1,940€1,080
6
CEEHigh yield bonds
15
€2,594€9,794
Loans
2835
€11,172€39,144
European leveraged debt in focusSelected European leveraged loan and high yield bond markets by volume Top five most active sectors—high yield bonds
TMT
Financial services
Manufacturing
Leisure
Automotive
€6,427
€6,023
€2,024
€5,958
€13,292
€11,267
€2,110
€7,089
€25,005
€24,031
Top five most active sectors—leveraged loans
Chemicals & materials
€15,533
€34,652
Consumer products
€9,417
€13,056
€5,471
€9,125
TMT
€4,193
€13,387
Services
€3,671
€9,827Financial services
Percentage of European high yield bonds issued in H2 2016
when the primary use of proceeds was refinancing
76%
9European leveraged debt fights back
10 White & Case
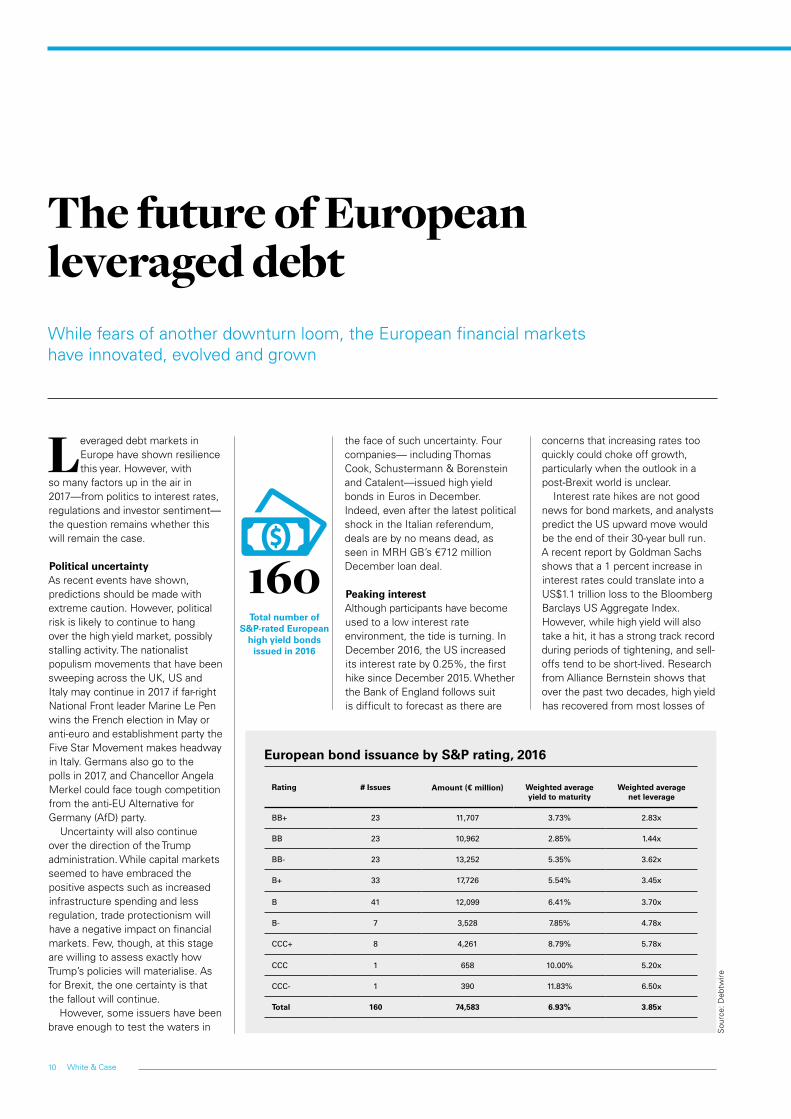
European bond issuance by S&P rating, 2016
Leveraged debt markets in Europe have shown resilience this year. However, with
so many factors up in the air in 2017—from politics to interest rates, regulations and investor sentiment—the question remains whether this will remain the case.
Political uncertaintyAs recent events have shown, predictions should be made with extreme caution. However, political risk is likely to continue to hang over the high yield market, possibly stalling activity. The nationalist populism movements that have been sweeping across the UK, US and Italy may continue in 2017 if far-right National Front leader Marine Le Pen wins the French election in May or anti-euro and establishment party the Five Star Movement makes headway in Italy. Germans also go to the polls in 2017, and Chancellor Angela Merkel could face tough competition from the anti-EU Alternative for Germany (AfD) party.
Uncertainty will also continue over the direction of the Trump administration. While capital markets seemed to have embraced the positive aspects such as increased infrastructure spending and less regulation, trade protectionism will have a negative impact on financial markets. Few, though, at this stage are willing to assess exactly how Trump’s policies will materialise. As for Brexit, the one certainty is that the fallout will continue.
However, some issuers have been brave enough to test the waters in
The future of European leveraged debt
the face of such uncertainty. Four companies— including Thomas Cook, Schustermann & Borenstein and Catalent—issued high yield bonds in Euros in December. Indeed, even after the latest political shock in the Italian referendum, deals are by no means dead, as seen in MRH GB’s €712 million December loan deal.
Peaking interestAlthough participants have become used to a low interest rate environment, the tide is turning. In December 2016, the US increased its interest rate by 0.25%, the first hike since December 2015. Whether the Bank of England follows suit is difficult to forecast as there are
concerns that increasing rates too quickly could choke off growth, particularly when the outlook in a post-Brexit world is unclear.
Interest rate hikes are not good news for bond markets, and analysts predict the US upward move would be the end of their 30-year bull run. A recent report by Goldman Sachs shows that a 1 percent increase in interest rates could translate into a US$1.1 trillion loss to the Bloomberg Barclays US Aggregate Index. However, while high yield will also take a hit, it has a strong track record during periods of tightening, and sell-offs tend to be short-lived. Research from Alliance Bernstein shows that over the past two decades, high yield has recovered from most losses of
160Total number of
S&P-rated European high yield bonds
issued in 2016
While fears of another downturn loom, the European financial markets have innovated, evolved and grown
Rating # Issues Amount (€ million) Weighted average yield to maturity
Weighted average net leverage
BB+ 23 11,707 3.73% 2.83x
BB 23 10,962 2.85% 1.44x
BB- 23 13,252 5.35% 3.62x
B+ 33 17,726 5.54% 3.45x
B 41 12,099 6.41% 3.70x
B- 7 3,528 7.85% 4.78x
CCC+ 8 4,261 8.79% 5.78x
CCC 1 658 10.00% 5.20x
CCC- 1 390 11.83% 6.50x
Total 160 74,583 6.93% 3.85x
Sou
rce:
Deb
twire
11European leveraged debt fights back
3.7%Weighted average yield to maturity on a BB+ bond
in 2016
10European bonds in 2016 issued
with a CCC+ rating or below
more than 5 percent in less than a year. This is partly because high yield is more closely related to business performance, rather than rates.
As for Europe, the ECB is expected to continue its monthly bond buying programme, although it will fall to €60 billion from April. Analysts believe it could change direction in late 2017 if inflation accelerates and the recovery is modest but steady.
In the meantime, yields will remain depressed on investment-grade corporate bonds, forcing investors to look further down the ratings spectrum. However, few will want to expose themselves to too much risk and drop too far down into C-rated debt. Indeed, just ten of this year’s European bond issuances had a “C” rating by S&P metrics.
Supply and demandElsewhere, there are signs that in spite of the demand for new paper, the supply of it may come up short. Figures from Moody’s show that total debt for potential fallen angels—companies on the cusp of a downgrade to junk—fell by nearly US$20 billion in the third quarter of 2016, while only one company during that period transitioned from investment to high yield. These dynamics are being exacerbated by investor unwillingness to sink below the B level.
Indeed, while demand is robust, investors are still not willing to accept terms that are too loose. French glass bottle maker Verallia is a case in point, with its attempted
PIK issuance abandoned in October after investor pushback on the aggressive deal structure and use of proceeds. Moreover, sterling volatility has forced some issuers to curb proposed issuances over pricing concerns. However, activity is still palpable, as highlighted by Ladbrokes Coral’s £400 million deal to refinance debt taken onboard to facilitate the Ladbrokes/Coral merger.
Future regulatory developmentsInvestors and issuers also need to be cognizant of impending regulatory changes. Towards the end of 2016, the ECB released its consultation on leveraged lending guidelines which mirror those introduced in the US three years ago advanced by the Federal Reserve, Federal Deposit Insurance Corporation (FDIC) and Office of the Comptroller of the Currency (OCC). The ECB classifies leveraged deals as “all types of loan or credit exposure where the borrower’s post-financing level of leverage exceeds a total debt to EBITDA ratio of 4.0 times”, and suggests transactions with a leverage level exceeding 6x total debt to EBITDA “should remain exceptional...and trigger referral to the highest credit committee”.
While the ECB did not establish a hard cap on leverage, it has insisted on using unadjusted EBITDA in calculating the leverage ratio of a loan. Even rating agencies use adjusted calculation so this would mark a significant change. The implications could be greatest for the technology sector, which is
the largest issuer. This is because the role of pro forma and potential synergies are largely ignored while there are no adjustments in the draft made for non-recurring expenses, exceptional items and other one-offs. Despite this, the expected effects of these rules will be neutral, as many financial services firms are already compliant with the similar regulations in the US.
The increased CLO activity is also set to provide a boost to leveraged loan issuance, as CLOs look to invest further down the ratings spectrum as returns evaporate on top-tier credits. European CLO primary issuance has gone from under €0.5 billion in January 2016 to amounts well over €1 billion in the following months, including almost €3 billion in October alone. Yet whether this is a new sign of life for CLOs or, again, opportunistic pricing plays remains to be seen.
While demand is robust, investors are still not willing to accept terms that are too loose.

12 White & Case
Notes


In this publication, White & Case means the international legal practice comprising White & Case LLP, a New York State registered limited liability partnership, White & Case LLP, a limited liability partnership incorporated under English law and all other affiliated partnerships, companies and entities.
This publication is prepared for the general information of our clients and other interested persons. It is not, and does not attempt to be, comprehensive in nature. Due to the general nature of its content, it should not be regarded as legal advice.
ATTORNEY ADVERTISING. Prior results do not guarantee a similar outcome.
Lee Cullinane Partner T +44 20 7532 1409 E [email protected]
Rob Mathews Partner T +44 20 7532 1429 E [email protected]
whitecase.com
© 2017 White & Case LLP