eu* - cows' milk collected cows' milk collected · s cows' milk collected - fr 2020...
TRANSCRIPT
Milk Market Observatory PRO.EU.Milk
Last update : 20.05.2020
*: EU without UK
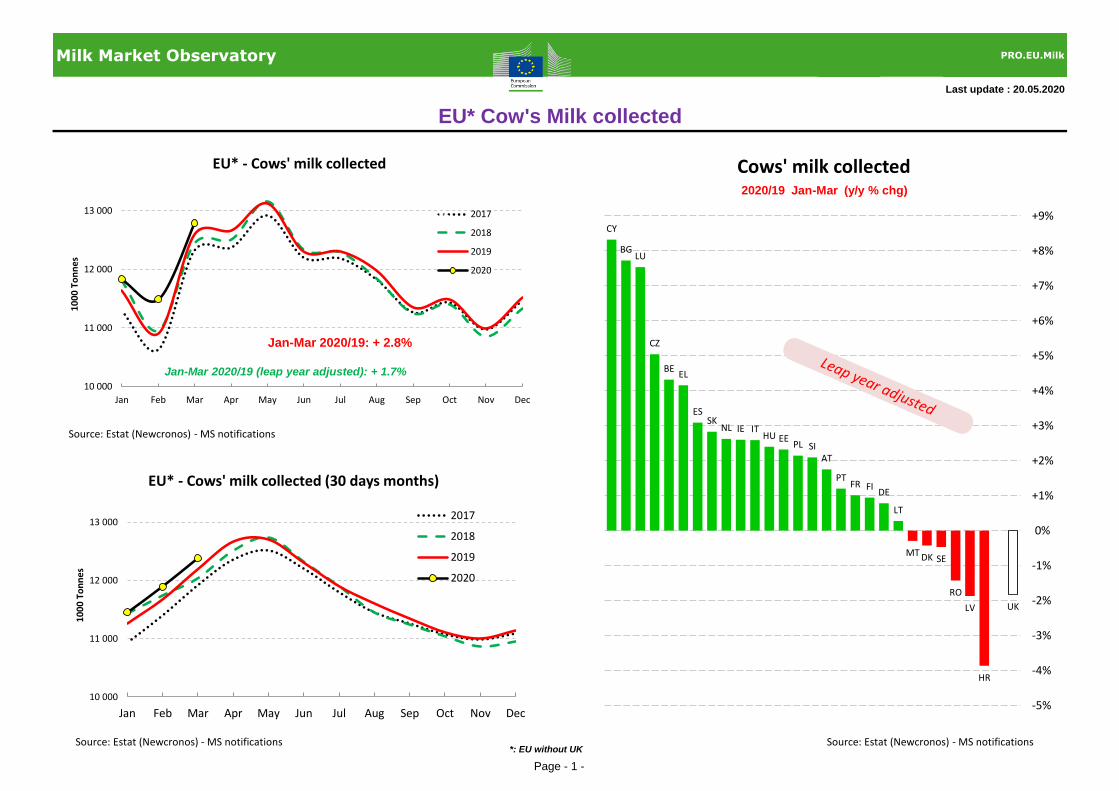
EU* Cow's Milk collected
10 000
11 000
12 000
13 000
Jan Feb Mar Apr May Jun Jul Aug Sep Oct Nov Dec
10
00
To
nn
es
EU* - Cows' milk collected
2017
2018
2019
2020
Jan-Dec 2019/18 : +0.6%
Jan-Mar 2020/19: + 2.8%
Jan-Mar 2020/19 (leap year adjusted): + 1.7%
Source: Estat (Newcronos) - MS notifications
10 000
11 000
12 000
13 000
Jan Feb Mar Apr May Jun Jul Aug Sep Oct Nov Dec
10
00
To
nn
es
EU* - Cows' milk collected (30 days months)
2017
2018
2019
2020
Jan-Dec 2019/18 : +0.6%Estimations for IT, CY and AT
Source: Estat (Newcronos) - MS notifications
CY
BGLU
CZ
BEEL
ESSK
NL IE ITHU EE
PL SIAT
PTFR FI
DE
LT
MT DK SE
RO
LV
HR
UK
-5%
-4%
-3%
-2%
-1%
0%
+1%
+2%
+3%
+4%
+5%
+6%
+7%
+8%
+9%
Cows' milk collected2020/19 Jan-Mar (y/y % chg)
Source: Estat (Newcronos) - MS notifications
Page - 1 -
Eurostat notifications missing for: EL, FR, CY, AT and SE
*: EU without UK
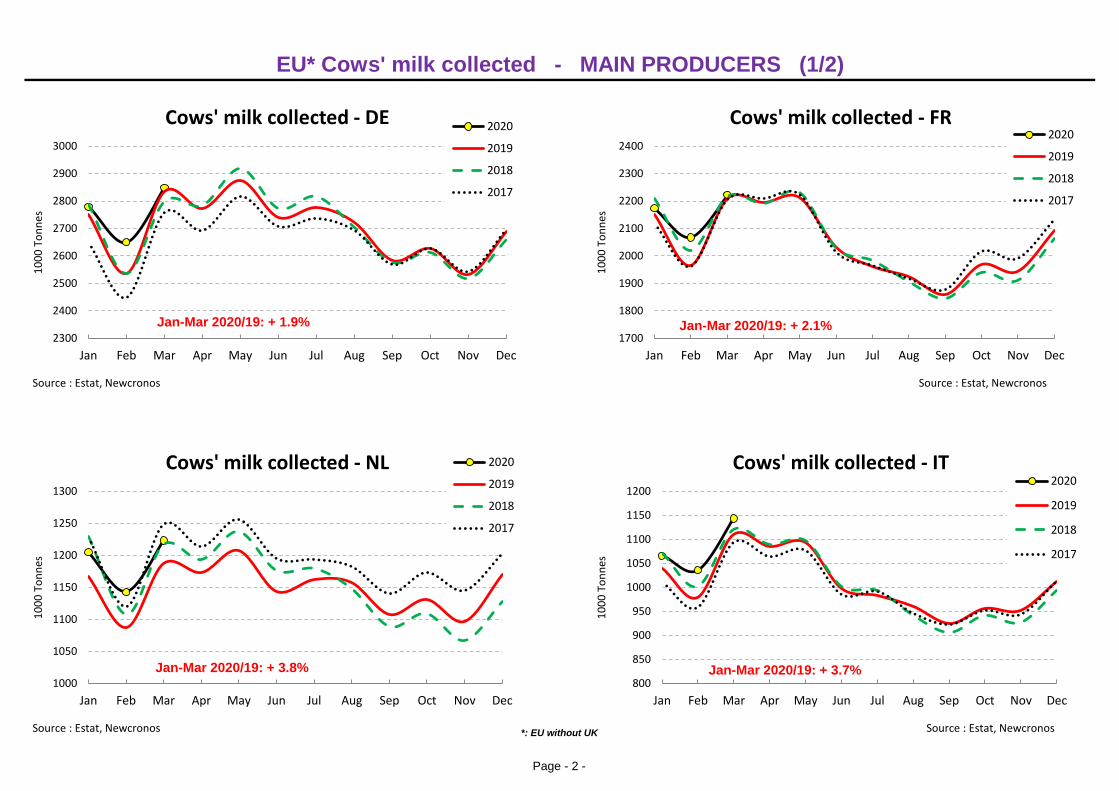
EU* Cows' milk collected - MAIN PRODUCERS (1/2)
2300
2400
2500
2600
2700
2800
2900
3000
Jan Feb Mar Apr May Jun Jul Aug Sep Oct Nov Dec
10
00
To
nn
es
Cows' milk collected - DE 2020
2019
2018
2017
Jan-Mar 2020/19: + 1.9%
Source : Estat, Newcronos
1000
1050
1100
1150
1200
1250
1300
Jan Feb Mar Apr May Jun Jul Aug Sep Oct Nov Dec
10
00
To
nn
es
Cows' milk collected - NL 2020
2019
2018
2017
Jan-Mar 2020/19: + 3.8%
Source : Estat, Newcronos
1700
1800
1900
2000
2100
2200
2300
2400
Jan Feb Mar Apr May Jun Jul Aug Sep Oct Nov Dec
10
00
To
nn
es
Cows' milk collected - FR2020
2019
2018
2017
Jan-Mar 2020/19: + 2.1%
Source : Estat, Newcronos
800
850
900
950
1000
1050
1100
1150
1200
Jan Feb Mar Apr May Jun Jul Aug Sep Oct Nov Dec
10
00
To
nn
es
Cows' milk collected - IT2020
2019
2018
2017
Jan-Mar 2020/19: + 3.7%
Source : Estat, Newcronos
Page - 2 -
*: EU without UK
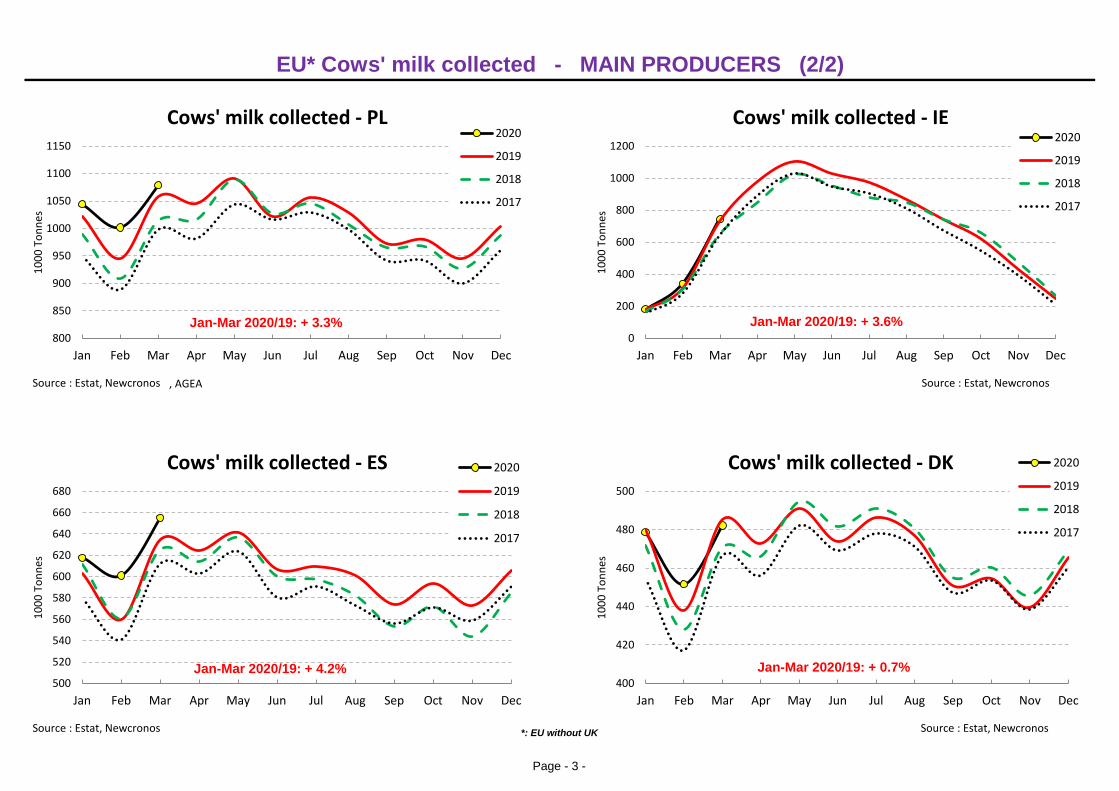
EU* Cows' milk collected - MAIN PRODUCERS (2/2)
800
850
900
950
1000
1050
1100
1150
Jan Feb Mar Apr May Jun Jul Aug Sep Oct Nov Dec
10
00
To
nn
es
Cows' milk collected - PL2020
2019
2018
2017
Jan-Mar 2020/19: + 3.3%
Source : Estat, Newcronos , AGEA
500
520
540
560
580
600
620
640
660
680
Jan Feb Mar Apr May Jun Jul Aug Sep Oct Nov Dec
10
00
To
nn
es
Cows' milk collected - ES 2020
2019
2018
2017
Jan-Mar 2020/19: + 4.2%
Source : Estat, Newcronos
0
200
400
600
800
1000
1200
Jan Feb Mar Apr May Jun Jul Aug Sep Oct Nov Dec
10
00
To
nn
es
Cows' milk collected - IE2020
2019
2018
2017
Jan-Mar 2020/19: + 3.6%
Source : Estat, Newcronos
400
420
440
460
480
500
Jan Feb Mar Apr May Jun Jul Aug Sep Oct Nov Dec
10
00
To
nn
es
Cows' milk collected - DK 2020
2019
2018
2017
Jan-Mar 2020/19: + 0.7%
Source : Estat, Newcronos
Page - 3 -
Rank MS MS Rank MS MS Rank MS MS
1. CY NL 1. IE IE 1. BG DE
2. BG IT 2. RO PL 2. CY IT
3. LU ES 3. EE DE 3. LU BE
4. CZ PL 4. BG DK 4. BE PL
5. BE BE 5. PL RO 5. RO AT
6. ES IE 6. LT ES 6. AT ES
7. IT CZ 7. DK BE 7. IT FR
8. NL DE 8. HU EE 8. CZ IE
9. SK FR 9. MT HU 9. ES CZ
10. HU BG 10. LU LT 10. EE BG
11. PT AT 11. BE BG 11. PT DK
12. IE PT 12. ES SK 12. PL RO
13. PL HU 13. SK FI 13. DE PT
14. SI LU 14. DE LU 14. EL CY
15. EE SK 15. LV LV 15. IE LU
16. AT CY 16. FI EL 16. DK EE
17. SE SE 17. EL MT 17. FR EL
18. FI FI 18. FR CY 18. MT MT
19. FR EE 19. CZ CZ 19. SI SI
20. DE SI 20. IT HR 20. FI FI
21. MT MT 21. SE SI 21. HU HU
22. EL EL 22. PT PT 22. LT SK
23. DK HR 23. NL SE 23. SK HR
24. LT LV 24. SI FR 24. NL LT
25. LV LT 25. HR IT 25. SE LV
26. RO RO 26. CY AT 26. LV SE
27. HR DK 27. AT NL 27. HR NL
EU* EU* EU* EU* EU* EU*
28. UK UK 28. UK UK 28. UK UK
EU+UK EU+UK EU+UK EU+UK EU+UK EU+UK
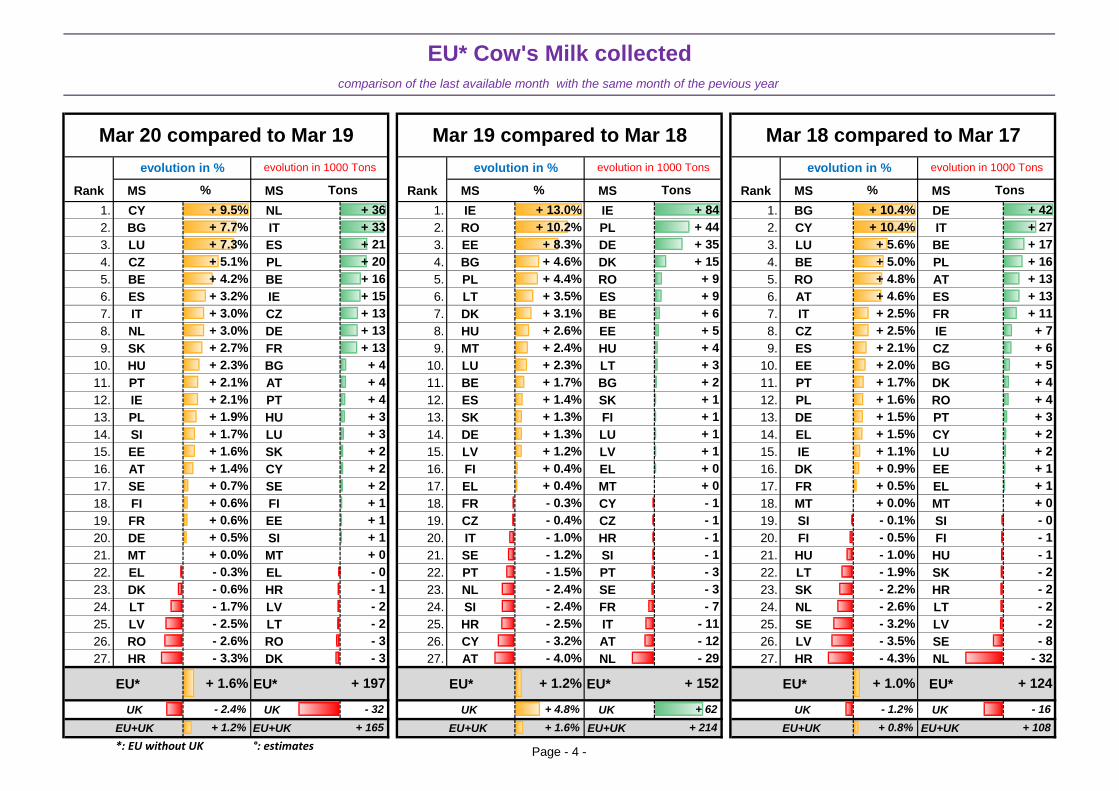
*: EU without UK °: estimates
- 16
+ 1.2% + 152 + 1.0% + 124
+ 4.8% + 62 - 1.2%
- 8
- 4.0% - 29 - 4.3% - 32
- 3.2% - 12 - 3.5%
- 2
- 2.5% - 11 - 3.2% - 2
- 2.4% - 7 - 2.6%
- 2
- 2.4% - 3 - 2.2% - 2
- 1.5% - 3 - 1.9%
- 1
- 1.2% - 1 - 1.0% - 1
- 1.0% - 1 - 0.5%
+ 0
- 0.4% - 1 - 0.1% - 0
- 0.3% - 1 + 0.0%
+ 1
+ 0.4% + 0 + 0.5% + 1
+ 0.4% + 0 + 0.9%
+ 2
+ 1.2% + 1 + 1.1% + 2
+ 1.3% + 1 + 1.5%
+ 4
+ 1.3% + 1 + 1.5% + 3
+ 1.4% + 1 + 1.6%
+ 5
+ 1.7% + 2 + 1.7% + 4
+ 2.3% + 3 + 2.0%
+ 7
+ 2.4% + 4 + 2.1% + 6
+ 2.6% + 5 + 2.5%
+ 13
+ 3.1% + 6 + 2.5% + 11
+ 3.5% + 9 + 4.6%
+ 16
+ 4.4% + 9 + 4.8% + 13
+ 4.6% + 15 + 5.0%
+ 27
+ 8.3% + 35 + 5.6% + 17
+ 10.2% + 44 + 10.4%
Tons
+ 13.0% + 84 + 10.4% + 42
% Tons %
Mar 19 compared to Mar 18 Mar 18 compared to Mar 17
evolution in % evolution in 1000 Tons evolution in % evolution in 1000 Tons
+ 0
- 0
- 1
+ 15
+ 13
+ 13
+ 13
- 2.4%
+ 0.6%
+ 0.5%
+ 0.0%
- 2
- 2
+ 2
+ 2
+ 1
+ 1
+ 1
- 3
- 3
- 32
+ 197+ 1.6%
- 3.3%
+ 4
+ 3
+ 3
+ 2
- 1.7%
- 2.5%
- 2.6%
- 0.3%
- 0.6%
+ 1.7%
+ 1.6%
+ 1.4%
+ 0.7%
+ 0.6%
comparison of the last available month with the same month of the pevious year
EU* Cow's Milk collected
+ 5.1%
+ 4.2%
+ 3.2%
+ 3.0%
+ 3.0%
Mar 20 compared to Mar 19
evolution in 1000 Tonsevolution in %
+ 7.7%
+ 7.3%
+ 9.5%
% Tons
+ 36
+ 33
+ 21
+ 20
+ 16
+ 108+ 1.2% + 165 + 1.6% + 214 + 0.8%
+ 2.7%
+ 2.3%
+ 2.1%
+ 2.1%
+ 1.9%
+ 4
+ 4
Page - 4 -
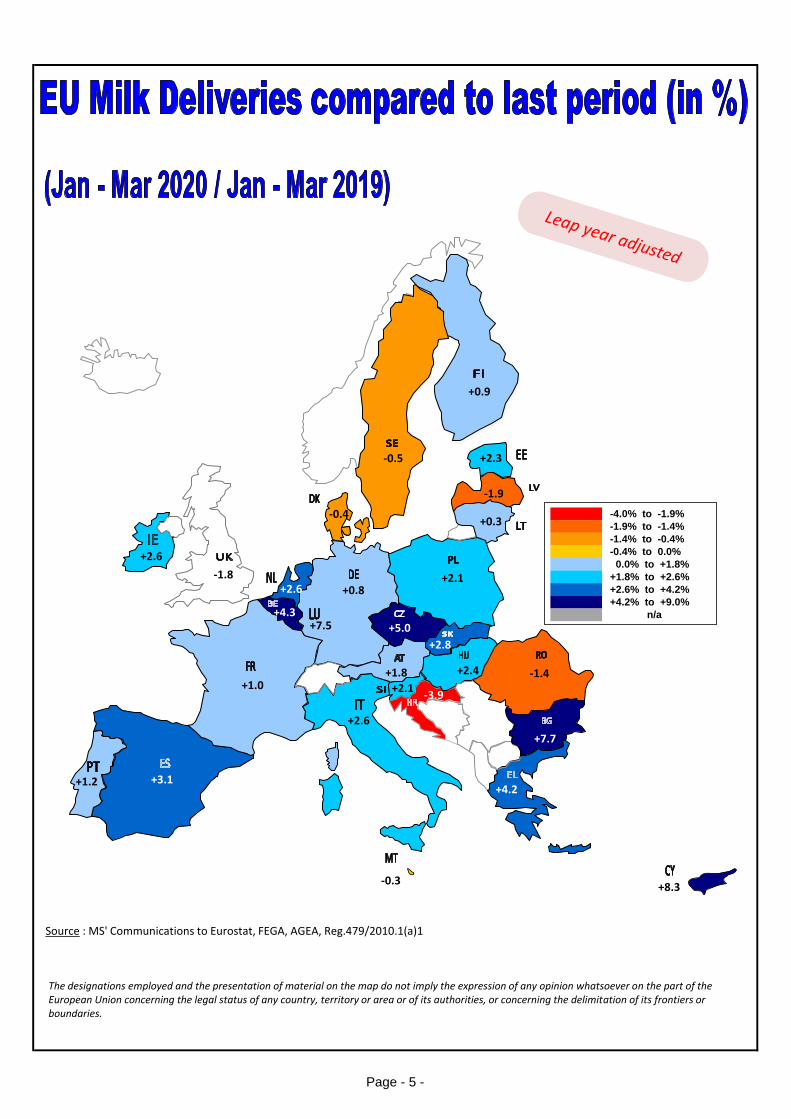
-4.0% to -1.9%
-1.9% to -1.4%
-1.4% to -0.4%
-0.4% to 0.0%
0.0% to +1.8%
+1.8% to +2.6%
+2.6% to +4.2%
+4.2% to +9.0%
n/a+4.3
+7.7
+5.0
-0.4
+0.8
+2.3
+2.6
+4.2+3.1
+1.0
+2.6
+8.3
-1.9
+0.3
+7.5
+2.4
-0.3
+2.6
+1.8
+2.1
+1.2
-1.4+2.1
+2.8
+0.9
-0.5
-1.8
Source : MS' Communications to Eurostat, FEGA, AGEA, Reg.479/2010.1(a)1
-3.9
DE, EL, HR, CY and SE figures based on MS notifications to DG AGRI - estimation for IT
The designations employed and the presentation of material on the map do not imply the expression of any opinion whatsoever on the part of the European Union concerning the legal status of any country, territory or area or of its authorities, or concerning the delimitation of its frontiers or boundaries.
Page - 5 -
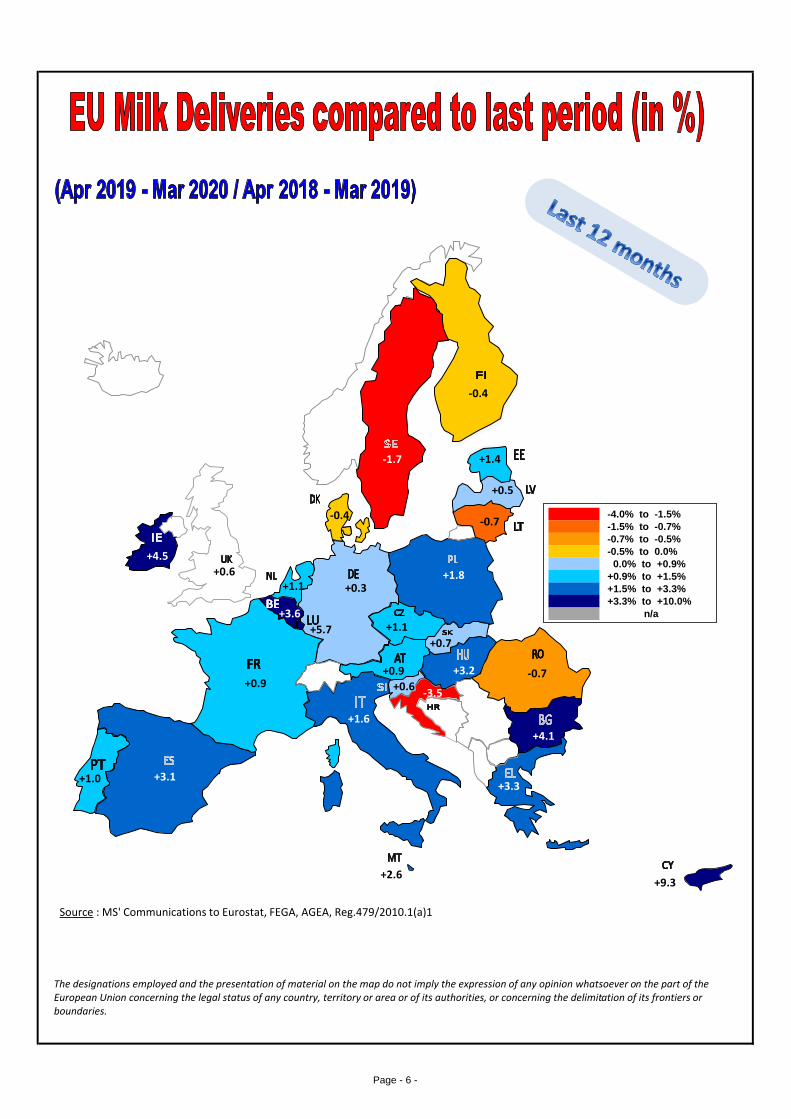
-4.0% to -1.5%
-1.5% to -0.7%
-0.7% to -0.5%
-0.5% to 0.0%
0.0% to +0.9%
+0.9% to +1.5%
+1.5% to +3.3%
+3.3% to +10.0%
n/a+3.6
+4.1
+1.1
-0.4
+0.3
+1.4
+4.5
+3.3+3.1
+0.9
+1.6
+9.3
+0.5
-0.7
+5.7
+3.2
+2.6
+1.1
+0.9
+1.8
+1.0
-0.7+0.6
+0.7
-0.4
-1.7
+0.6
Source : MS' Communications to Eurostat, FEGA, AGEA, Reg.479/2010.1(a)1
-3.5
Estimated figures for: EL, and IT
The designations employed and the presentation of material on the map do not imply the expression of any opinion whatsoever on the part of the European Union concerning the legal status of any country, territory or area or of its authorities, or concerning the delimitation of its frontiers or boundaries.
Page - 6 -