etienne cavalier*, pierre lukas, anne-catherine bekaert, agnès … and... · etienne cavalier*,...
TRANSCRIPT
Clin Chem Lab Med 2016; aop
*Corresponding author: Pr. Etienne Cavalier, Department of Clinical Chemistry, University of Liège, CHU Sart-Tilman, 4000 Liège, Belgium, Phone: +32 4 3667692, Fax: +32 4 3667691, E-mail: [email protected] Lukas, Anne-Catherine Bekaert, Agnès Carlisi and Caroline Le Goff: Department of Clinical Chemistry, University of Liège, CHU Sart-Tilman, Domaine du Sart-Tilman, Liège, BelgiumPierre Delanaye: Department of Nephrology, Dialysis and Transplantation, University of Liège, CHU Sart-Tilman, Domaine du Sart-Tilman, Liège, BelgiumJean-Claude Souberbielle: Laboratoire d’explorations fonctionnelles, Hôpital Necker-Enfants malades, Paris, France
Etienne Cavalier*, Pierre Lukas, Anne-Catherine Bekaert, Agnès Carlisi, Caroline Le Goff, Pierre Delanaye and Jean-Claude Souberbielle
Analytical and clinical validation of the new Abbot Architect 25(OH)D assay: fit for purpose?
DOI 10.1515/cclm-2016-0566Received June 27, 2016; accepted July 14, 2016
Abstract
Background: We provide a clinical and analytical evalu-ation of the reformulated version of the Abbott Architect 25-hydroxyvitamin D assay. We compared this assay with three commercial automated immunoassays and against a VDSP-traceable liquid chromatography coupled with tandem mass spectrometry (LC-MS/MS) in six different populations. We also supplemented 40 healthy volun-teers with either 600,000 IU of vitamin D2 or 100,000 of vitamin D3 to evaluate the performance of the immunoas-says vs. the LC-MS/MS.Methods: Precision and limit of quantification were assessed, 25(OH)D2 and C3-epimer recovery were calcu-lated. Two hundred and forty samples obtained in healthy Caucasians and Africans, osteoporotic, hemodialyzed and intensive care patients and 3rd trimester pregnant women were analyzed by all methods. Correlation was studied using Passing-Bablok and Bland-Altman analysis. Con-cordance correlation coefficient (CCC) was calculated to evaluate agreement between immunoassays and LC-MS/MS. We verified if patients were homogeneously classi-fied with the immunoassays when they took vitamin D2 or vitamin D3 after 1, 7 and 28 days.Results: We observed excellent analytical features and showed a very good correlation to the LC-MS/MS results in the overall population. Compared to the other
immunoassays, concordance of the new Abbott assay with the LC-MS/MS was at least similar, and often better in diseased populations. Althought the cross-reactivity with 25(OH)D2 was not of 100%, there was no significant difference in the classifications of the patients, either sup-plemented with D2 or D3 or after 7 or 28 days.Conclusions: This modified version of the Abbott Archi-tect assay is clearly improved compared to the previous one and presents a better agreement with the LC-MS/MS.
Keywords: assay performance; concordance; immunoas-say; LC-MS/MS; supplementation; vitamin D; vitamin D2; vitamin D3.
IntroductionDue to potential actions of vitamin D on different dis-eases [1], the number of 25(OH)D determinations has dra-matically increased over the last 10 years. This increasing number of requests have led most the clinical laborato-ries to move from the DiaSorin RIA, the most widely used method in the 1900s and early 2000s, to methods present-ing a larger throughput, i.e. automated immunoassays or liquid chromatographs coupled with two mass spectro-meters in tandem (LC-MS/MS). External proficiency schemes like DEQAS, increasing knowledge on the poten-tial interferences by 24,25(OH)2D or C3-epimer, need for equimolar recognition of 25(OH)D2 and 25(OH)D3 and, of course, need for standardization of the assays [2] have led manufacturers to improve the performance of their assays. In 2012, we published the very first results of the validation of the Abbott Architect 25-OH vitamin D assay on the i1000SR platform [3]. Our data showed that this kit presented excellent performance with coefficients of varia-tion < 6% (13.6 ng/mL) and 2.2% (78.1 ng/mL), a functional sensitivity of 5 ng/mL and a recovery of 25(OH)D2 of 75.8% (95% CI: 61.9–89.7%). We demonstrated that, compared to the DiaSorin RIA, the correlation was acceptable if the values were < 50 ng/mL but, above this threshold, a sys-tematic positive bias was observed, possibly contributed by variations of 24,25(OH)2D. In 2015, Abbott Diagnostics
- 10.1515/cclm-2016-0566Downloaded from PubFactory at 08/30/2016 02:10:30PM
via Université libre de Bruxelles

2 Cavalier et al.: Validation of the Abbott 25(OH)D assay
launched a reformulated version of their assay. In this redesigned version, the pretreatment step of the previous version has been eliminated and throughput increased. With the new format the calibration stability (30 days) and on-board stability (21 days) of the reagents have been improved. This new assay is now traceable to the NIST SRM 2972 (National Institute of Standards and Technol-ogy Standard Reference material 2972). In this paper, we describe the performances of this reformulated version.
Materials and methodsAnalytical validation
Assay precision was determined using serum samples according to the CLSI protocol EP05-A2 [4]. Five human serums were run five times, in the morning and in the afternoon, for 5 days (n = 50 per sam-ple). Variability was expressed in standard deviation (SD) and per-cent coefficient of variation (CV). The analyses were performed with the previous assay (ref 3L52, lot 04815I000) and the new one (refer-ence 5P02, lot 59905UI00) to compare their respective performances. Abbott reagents were provided for free and Abbott refunded the labo-ratory for the costs of the competitors’ reagents.
Clinical validation
Leftover samples: We compared the Abbott Architect assay with our VDSP traceable LC-MS/MS and three commercial immunoassays for 25(OH)D, namely DiaSorin Liaison XL (lot 132394), Beckman Access (lot 529187) and Roche Cobas (lot 186865). For this latter method, val-ues > 70 ng/mL were censored and could not thus be used for com-parison purposes.
The first comparison was achieved in 40 healthy subjects span-ning the measuring range. The second comparison was performed with samples obtained from 40 women referred to a specialized oste-oporosis clinic. We also compared the methods in populations who are known to present different vitamin D binding protein (VDBP) concentrations or polymorphism: the first one was 3rd trimester pregnant women (n = 40) and the second one was African healthy subjects from the area of Abidjan, Côte d’Ivoire (n = 40). We also compared the methods in a population of 40 stable hemodialyzed (HD) patients and in 40 patients from the general intensive care unit of our hospital. All the samples used in this study were leftover samples kept at –80 °C that underwent one cycle of freeze/thawing, which does not alter 25(OH)D values [5]. All the comparisons have been performed in parallel on all the instruments by our experi-enced R&D team, in our ISO 15189 accredited laboratory. The Ethics Committee of the CHU de Liege has been informed of the study and has accepted its modality.
Supplementation study: Forty healthy volunteers were rand-omized to receive either 1 ampoule of 100,000 IU of cholecalciferol (vitamin D3, D-Cure, SMB, Belgium) or 1 ampoule of 600,000 IU of ergocalciferol (vitamin D2, Sterogyl 15, Desma Pharma, France).
They underwent a blood sampling before supplementation and after 24 h, 7 days and 28 days. All the samples were allowed to clot for 30 min at room temperature, centrifuged, aliquoted and kept at –80 °C until determination in batch with the LCMS/MS, the Abbott Architect (versions 3L52 and 3P02) and the Roche Cobas. This part of the study has also been performed in accordance with the Ethics Committee of the CHU de Liege and the participants gave informed consent.
Cross-reactions: The 25(OH)D2 recognition was evaluated with the native samples obtained in the supplementation according to the method we previously published [6]. The C3-epimer cross-reactivity was evaluated in samples containing quantifiable amounts of these metabolites as determined with the LC-MS/MS.
Lot-to-lot study: The lot-to-lot consistency was evaluated by run-ning 172 samples of the validation study for which sufficient volume was still available with two other lots, namely lots 60324UI00 and 60016UI00.
Statistical analysis
The 25(OH)D2 recovery was obtained according to the method we previously published [7]. This method was also used to calculate the percentage of cross-reactivity with the C3-epimer.
MedCalc software (Oostende, Belgium) was used for the sta-tistical comparisons and allowed to perform the Passing-Bablok regressions and concordance correlation coefficient (CCC) between our LC-MS/MS and the three automated assays. The CCC evalu-ates the degree to which pairs of observations fall on the 45° line through the origin [8]. It contains a measurement of precision “r” and accuracy Cb and is calculated as CCC = r Cb, where r is the Pear-son correlation coefficient (which measures how far each observa-tion deviates from the best-fit line and thus the precision), and Cb is a bias correction factor that measures how far the best-fit line deviates from the 45° line through the origin, and is thus a measure of accuracy. CCC result can be interpreted as follows: poor ( ≤ 0.90), moderate (0.90–0.95), substantial ( ≤ 0.95–0.99) and almost perfect ( > 0.99) [9].
Results
Analytical validation
With the former 3L52 version, the intra-assay CV ranged from 10.9% at 5.1 ng/mL to 1.7% at 37.8 ng/mL and the inter-assay CV ranged from 13.3 to 2.1% at the same con-centrations, respectively. With the new 5P02 version, the intra-assay CV ranged from 5.2 to 1.7% and the inter-assays CV from 5.6 to 2.6% at the same concentrations, respec-tively. Since the lowest tested value (4.1 ng/mL) presented a CV at 5.6% that was far below 20%, it was impossible to establish the LOQ.
- 10.1515/cclm-2016-0566Downloaded from PubFactory at 08/30/2016 02:10:30PM
via Université libre de Bruxelles
Cavalier et al.: Validation of the Abbott 25(OH)D assay 3
Tabl
e 1:
Pas
sing
-Bab
lok
regr
essi
on s
tatis
tics
and
conc
orda
nce
corre
latio
n an
alys
is o
f im
mun
oass
ays
agai
nst t
he V
DSP
trace
able
LC-M
S/M
S m
etho
d in
diff
eren
t pop
ulat
ions
: hea
lthy
Cauc
a-si
an a
nd A
frica
n su
bjec
ts, o
steo
poro
tic, h
emod
ialy
zed
and
inte
nsiv
e ca
re p
atie
nts
and
3rd
trim
este
r pre
gnan
t wom
en.
Popu
latio
n
Met
hod
Sl
ope
95
% C
I In
terc
ept,
ng/m
L
95%
CI,
ng/m
L
CCC
r pr
ecis
ion
Cb a
ccur
acy
Agre
emen
t
Over
all n
= 240
Ab
bott
Arch
itect
5P0
2 0.
91 0
.88;
0.9
6
–0.9
–2
.1; 0
.0 0
.93
0.
95
0.98
M
oder
ate
Med
ian
(95%
CI)
(ng/
mL)
: 32.
2 (3
0.6;
34.
6)
Abbo
tt Ar
chite
ct 3
L52
0.
91 0
.82;
0.9
9
0.62
–1
.4; 2
.0 0
.77
0.
78
0.98
Po
orRa
nge
(ng/
mL)
: 1.4
; 94.
9
DiaS
orin
Lia
ison
0.
89 0
.83;
0.9
4
0.6
–1
.2; 1
.8 0
.87
0.
90
0.97
Po
or
Beck
man
Acc
ess
0.
89 0
.85;
0.9
4
–1.3
–2
.5; –
0.2
0.8
8
0.92
0.
95
Poor
Ro
che
Coba
s
1.03
0.9
5; 1
.10
–3
.3
–5.8
; –1.
0 0
.81
0.
82
0.99
Po
orHe
alth
y n =
40
Abbo
tt Ar
chite
ct 5
P02
1.16
1.0
9; 1
.25
–5
.2
–9.8
; –3.
0 0
.95
0.
97
0.98
Su
bsta
ntia
lM
edia
n (9
5% C
I) (n
g/m
L): 4
4.0
(34.
5; 5
6.0)
Ab
bott
Arch
itect
3L5
2
1.43
1.2
2; 1
.68
–1
0.4
–22
.3; –
2.6
0.7
9
0.93
0.
85
Poor
Rang
e (n
g/m
L): 1
.4; 9
4.9
Di
aSor
in L
iais
on
1.06
0.9
7; 1
.14
–2
.8
–6.9
; –0.
2 0
.97
0.
97
1.00
Su
bsta
ntia
l
Beck
man
Acc
ess
1.
00 0
.91;
1.1
4
–4.2
–10
.4; –
0.4
0.9
4
0.95
0.
99
Mod
erat
e
Roch
e Co
bas
0.
97 0
.86;
1.1
0
–0.9
–3
.1; 6
.2 0
.92
0.
93
1.00
M
oder
ate
Heal
thy
Afric
ans
n = 40
Ab
bott
Arch
itect
5P0
2 0.
86 0
.73;
1.0
5
1.67
–3
.9; 6
.1 0
.86
0.
89
0.96
Po
orM
edia
n (9
5% C
I) (n
g/m
L) 3
1.4
(29.
3; 3
4.1)
Ab
bott
Arch
itect
3L5
2
0.61
0.4
0; 1
.12
9.
4
–6.3
; 14.
8 0
.26
0.
31
0.83
Po
or
DiaS
orin
Lia
ison
0.
73 0
.51;
1.1
3
7.6
–4
.9; 1
2.9
0.5
3
0.62
0.
86
Poor
Be
ckm
an A
cces
s
0.96
0.
75; 1
.2
1.3
–8
.7; 7
.8 0
.69
0.
70
0.98
Po
or
Roch
e Co
bas
1.
21 0
.81;
1.8
9
2.2
–18
.8; 1
5.5
0.4
0
0.52
0.
78
Poor
ICU
patie
nts
n = 40
Ab
bott
Arch
itect
5P0
2 0.
96 0
.90;
1.0
2
–0.3
–1
.0; 0
.3 0
.98
0.
99
0.99
Su
bsta
ntia
lM
edia
n (9
5% C
I) (n
g/m
L) 1
3.8
(9.9
; 19.
7)
Abbo
tt Ar
chite
ct 3
L52
1.
19 1
.00;
1.3
6
–0.8
–2
.9; 1
.06
0.8
2
0.88
0.
93
Poor
Di
aSor
in L
iais
on
1.28
1.1
2; 1
.43
–0
.88
–3
.1; 1
.0 0
.87
0.
96
0.91
Po
or
Beck
man
Acc
ess
0.
91 0
.80;
1.0
1
–2.1
3
–3.4
; –0.
6 0
.87
0.
94
0.92
Po
or
Roch
e Co
bas
0.
92 0
.82;
1.0
9
–3.5
–6
.8; –
2.0
0.7
5
0.92
0.
82
Poor
Oste
opor
otic
pat
ient
s n =
40
Abbo
tt Ar
chite
ct 5
P02
1.04
0.9
7; 1
.14
–4
.8
–8.5
; –2.
3 0
.94
0.
97
0.96
M
oder
ate
Med
ian
(95%
CI)
(ng/
mL)
38.
5 (3
4.6;
41)
Ab
bott
Arch
itect
3L5
2
1.11
0.9
7; 1
.34
–5
.3 –
13.4
; –0.
6 0
.91
0.
92
0.99
M
oder
ate
Di
aSor
in L
iais
on
0.80
0.6
7; 0
.98
–0
.5
–6.0
; 3.7
0.7
0
0.89
0.
79
Poor
Be
ckm
an A
cces
s
0.84
0.7
5; 0
.92
–0
.2
–3.0
; 2.8
0.8
5
0.94
0.
90
Poor
Ro
che
Coba
s
1.00
0.8
3; 1
.19
0.
6
–5.9
; 6.7
0.8
9
0.89
0.
99
Poor
Hem
odia
lyze
d pa
tient
s n =
40
Abbo
tt Ar
chite
ct 5
P02
0.82
0.7
6; 0
.90
–1
.9
–5.8
; 1.5
0.7
4
0.97
0.
76
Poor
Med
ian
(95%
CI)
(ng/
mL)
48.
5 (4
5.0;
57.
2)
Abbo
tt Ar
chite
ct 3
L52
0.
70 0
.57;
0.7
9
–1.5
–8
.4; 3
.9 0
.38
0.
84
0.45
Po
or
DiaS
orin
Lia
ison
0.
73 0
.64;
0.8
2
3.0
–2
.5; 8
.2 0
.59
0.
87
0.68
Po
or
Beck
man
Acc
ess
0.
89 0
.77;
1.0
3
–7.6
–14
.9; –
2.6
0.6
2
0.87
0.
71
Poor
Ro
che
Coba
s
0.84
0.7
4; 1
.01
–8
.0 –
16.3
; –3.
4 0
.56
0.
88
0.64
Po
or3r
d tri
mes
ter p
regn
ant w
omen
n = 4
0
Abbo
tt Ar
chite
ct 5
P02
0.91
0.8
4; 0
.98
–2
.1
–4.0
; –0.
6 0
.79
0.
97
0.81
Po
orM
edia
n (9
5% C
I) (n
g/m
L) 2
5.8
(23.
6; 2
7.9)
Ab
bott
Arch
itect
3L5
2
0.93
0.7
8; 1
.19
–1
.9
–8.2
; 1.9
0.7
4
0.87
0.
86
Poor
Di
aSor
in L
iais
on
0.87
0.7
1; 1
.06
–2
.5
–6.8
; 1.6
0.6
0
0.88
0.
69
Poor
Be
ckm
an A
cces
s
0.74
0.6
1; 0
.96
1.
41
–3.4
; 4.7
0.6
4
0.80
0.
80
Poor
Ro
che
Coba
s
1.10
0.9
0; 1
.35
–6
.9 –
12.7
; –1.
5 0
.73
0.
85
0.86
Po
or
- 10.1515/cclm-2016-0566Downloaded from PubFactory at 08/30/2016 02:10:30PM
via Université libre de Bruxelles
4 Cavalier et al.: Validation of the Abbott 25(OH)D assay
Lot to lot variation
Compared to the lot used in this study, the Bland-Alt-man plot showed mean difference (SD) of 1.2±2.5 and 2.0±3.0 ng/mL with the A60324UI00 and A60016UI lots, respectively and the interval of confidence of the slope of the Passing-Bablok regression was comprised between 0.95 and 1.05, which corresponds to the specifications of the manufacturer.
Clinical validation
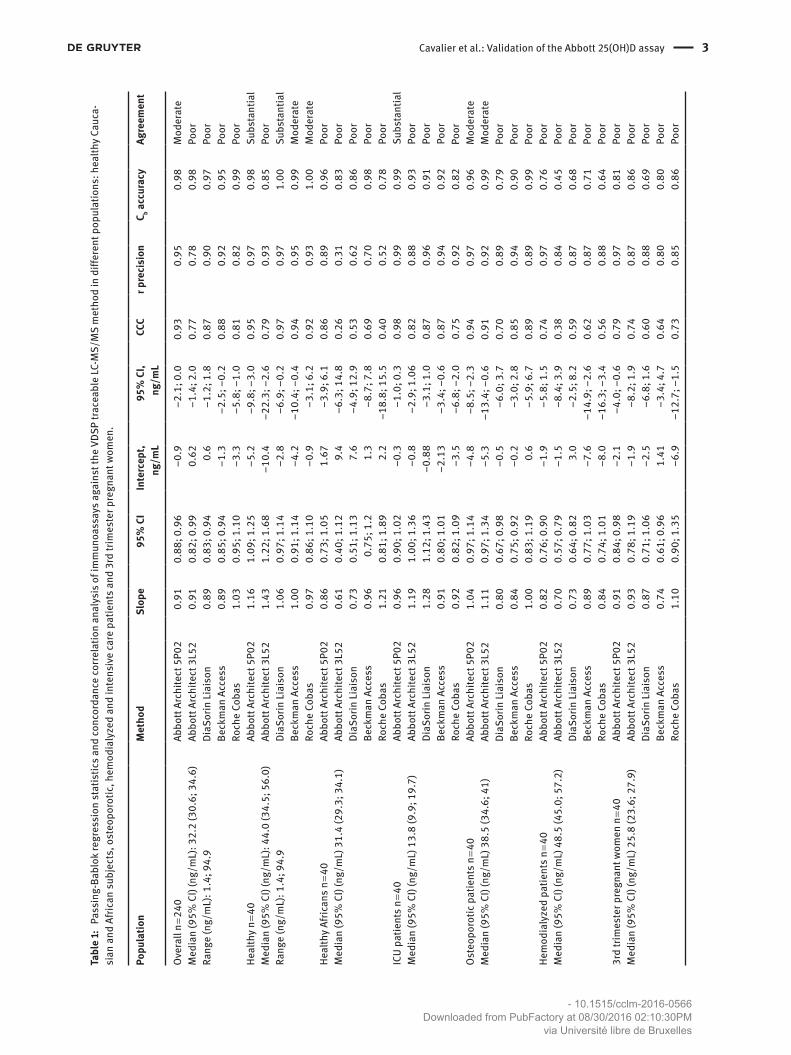
The Passing-Bablok slopes and intercepts, as well as the CCC and quality of the agreement between immunoassays and LC-MS/MS, for the global population, but also for all the sub-populations are presented in Table 1. To summa-rize, the agreement was moderate with the new 5P02 kit and poor with the former 3L52 version, the Liaison, Cobas and Access assays on the overall population (n = 240). This
agreement was much better in the healthy population: substantial for the 5P02 and the Liaison assays, moderate for both Cobas and Access and poor for the 3P02. However, in the subpopulations, the performances were globally poor for all assays, excepted in intensive care patients for the 5P02 (substantial) and in osteoporotic patients for both Abbott assays (moderate).
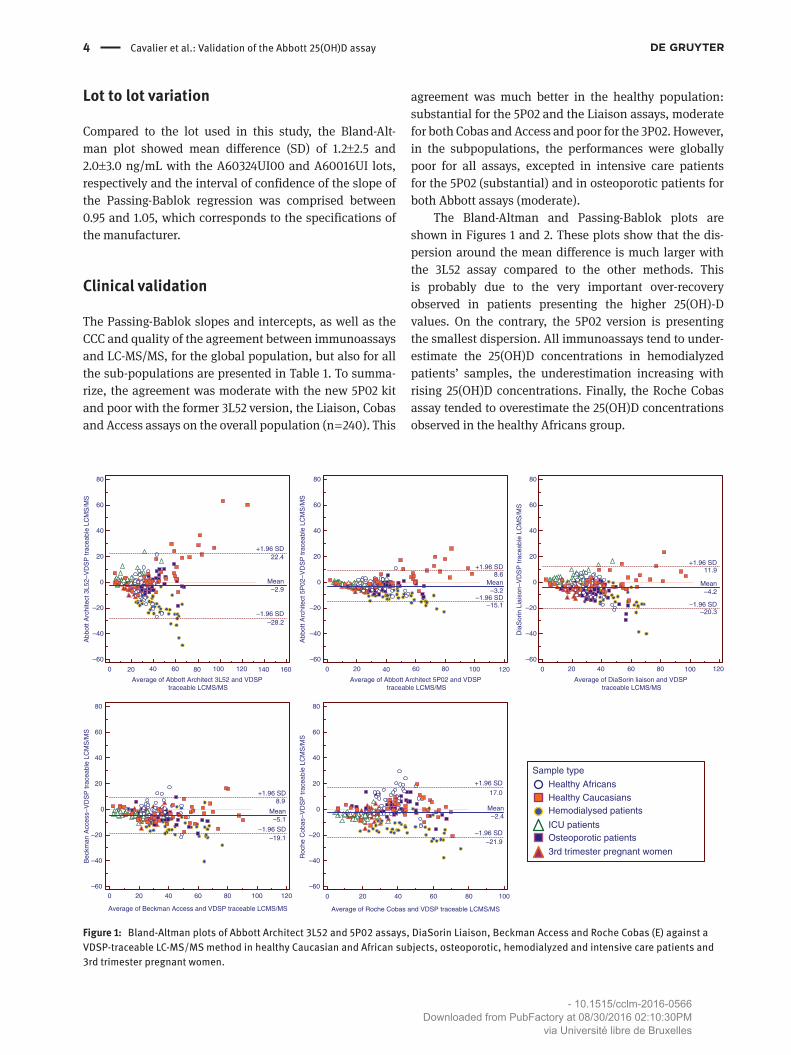
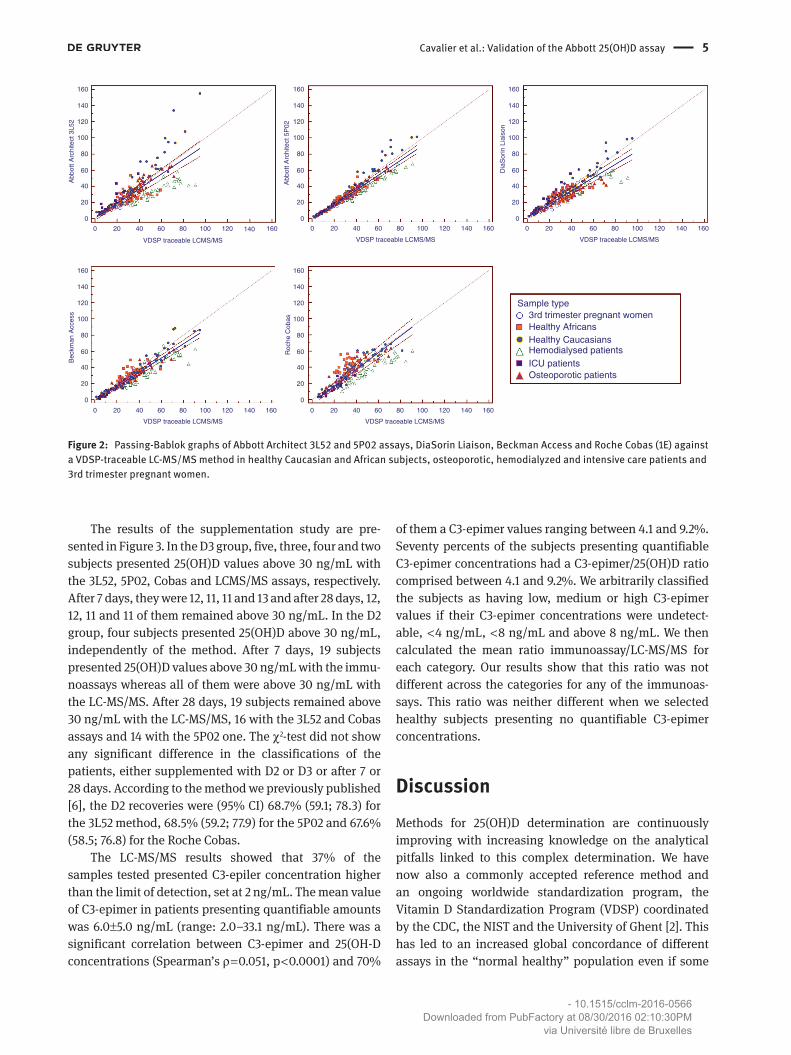
The Bland-Altman and Passing-Bablok plots are shown in Figures 1 and 2. These plots show that the dis-persion around the mean difference is much larger with the 3L52 assay compared to the other methods. This is probably due to the very important over-recovery observed in patients presenting the higher 25(OH)-D values. On the contrary, the 5P02 version is presenting the smallest dispersion. All immunoassays tend to under-estimate the 25(OH)D concentrations in hemodialyzed patients’ samples, the underestimation increasing with rising 25(OH)D concentrations. Finally, the Roche Cobas assay tended to overestimate the 25(OH)D concentrations observed in the healthy Africans group.
0 20 40 60 80 100 120 140 160
–60
–40
–20
0
20
40
60
80
Average of Abbott Architect 3L52 and VDSP traceable LCMS/MS
Abb
ott A
rchi
tect
3L5
2–V
DS
P tr
acea
ble
LCM
S/M
S
Mean–2.9
–1.96 SD–28.2
+1.96 SD22.4
0 20 40 60 80 100 120
–60
–40
–20
0
20
40
60
80
Average of Abbott Architect 5P02 and VDSP traceable LCMS/MS
Abb
ott A
rchi
tect
5P
02–V
DS
P tr
acea
ble
LCM
S/M
S
Mean–3.2
–1.96 SD–15.1
+1.96 SD8.6
0 20 40 60 80 100 120
–60
–40
–20
0
20
40
60
80
Average of DiaSorin liaison and VDSP traceable LCMS/MS
Dia
Sor
in L
iais
on–V
DS
P tr
acea
ble
LCM
S/M
S
Mean–4.2
–1.96 SD–20.3
+1.96 SD11.9
0 20 40 60 80 100 120–60
–40
–20
0
20
40
60
80
Average of Beckman Access and VDSP traceable LCMS/MS
Bec
kman
Acc
ess–
VD
SP
trac
eabl
e LC
MS
/MS
Mean–5.1
–1.96 SD–19.1
+1.96 SD8.9
0 20 40 60 80 100
–60
–40
–20
0
20
40
60
80
Average of Roche Cobas and VDSP traceable LCMS/MS
Roc
he C
obas
–VD
SP
trac
eabl
e LC
MS
/MS
Mean–2.4
–1.96 SD–21.9
+1.96 SD
17.0
Sample type
Healthy AfricansHealthy CaucasiansHemodialysed patients
ICU patientsOsteoporotic patients
3rd trimester pregnant women
Figure 1: Bland-Altman plots of Abbott Architect 3L52 and 5P02 assays, DiaSorin Liaison, Beckman Access and Roche Cobas (E) against a VDSP-traceable LC-MS/MS method in healthy Caucasian and African subjects, osteoporotic, hemodialyzed and intensive care patients and 3rd trimester pregnant women.
- 10.1515/cclm-2016-0566Downloaded from PubFactory at 08/30/2016 02:10:30PM
via Université libre de Bruxelles
Cavalier et al.: Validation of the Abbott 25(OH)D assay 5
160
140
120
100
80
60
40
20
0
160160
140
120
100
80
60
40
20
0
140
120
100
80
60
40
20
0
160
140
120
100
80
60
40
20
0
0 20 40 60
VDSP traceable LCMS/MS
Bec
kman
Acc
ess
160
140
120
100
80
60
40
20
0
Roc
he C
obas
Abb
ott A
rchi
tect
3L5
2
Abb
ott A
rchi
tect
5P
02
Dia
Sor
in L
iais
on
VDSP traceable LCMS/MS VDSP traceable LCMS/MS
VDSP traceable LCMS/MSVDSP traceable LCMS/MS
80 100 120 140 160 0 20 40 60 80 100 120 140 160 0 20 40 60 80 100 120 140 160
0 20 40 60 80 100 120 140 1600 20 40 60 80 100 120 140 160
Sample type
Healthy AfricansHealthy CaucasiansHemodialysed patientsICU patientsOsteoporotic patients
3rd trimester pregnant women
Figure 2: Passing-Bablok graphs of Abbott Architect 3L52 and 5P02 assays, DiaSorin Liaison, Beckman Access and Roche Cobas (1E) against a VDSP-traceable LC-MS/MS method in healthy Caucasian and African subjects, osteoporotic, hemodialyzed and intensive care patients and 3rd trimester pregnant women.
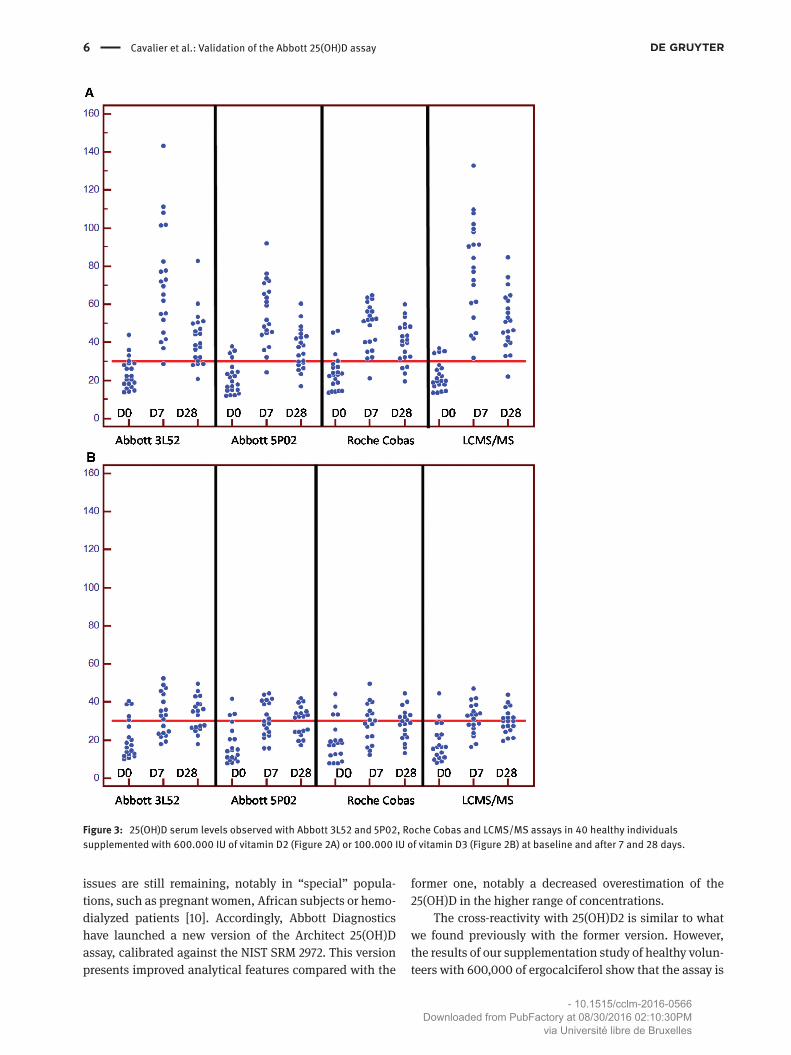
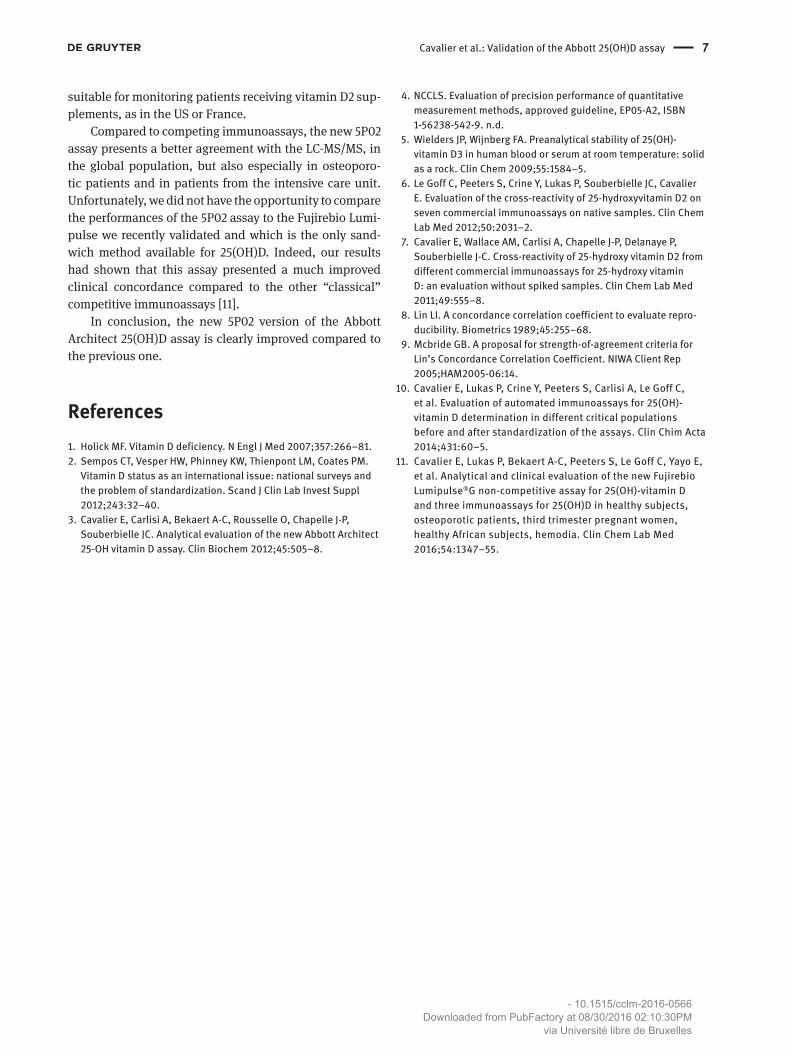
The results of the supplementation study are pre-sented in Figure 3. In the D3 group, five, three, four and two subjects presented 25(OH)D values above 30 ng/mL with the 3L52, 5P02, Cobas and LCMS/MS assays, respectively. After 7 days, they were 12, 11, 11 and 13 and after 28 days, 12, 12, 11 and 11 of them remained above 30 ng/mL. In the D2 group, four subjects presented 25(OH)D above 30 ng/mL, independently of the method. After 7 days, 19 subjects presented 25(OH)D values above 30 ng/mL with the immu-noassays whereas all of them were above 30 ng/mL with the LC-MS/MS. After 28 days, 19 subjects remained above 30 ng/mL with the LC-MS/MS, 16 with the 3L52 and Cobas assays and 14 with the 5P02 one. The χ2-test did not show any significant difference in the classifications of the patients, either supplemented with D2 or D3 or after 7 or 28 days. According to the method we previously published [6], the D2 recoveries were (95% CI) 68.7% (59.1; 78.3) for the 3L52 method, 68.5% (59.2; 77.9) for the 5P02 and 67.6% (58.5; 76.8) for the Roche Cobas.
The LC-MS/MS results showed that 37% of the samples tested presented C3-epiler concentration higher than the limit of detection, set at 2 ng/mL. The mean value of C3-epimer in patients presenting quantifiable amounts was 6.0±5.0 ng/mL (range: 2.0–33.1 ng/mL). There was a significant correlation between C3-epimer and 25(OH-D concentrations (Spearman’s ρ = 0.051, p < 0.0001) and 70%
of them a C3-epimer values ranging between 4.1 and 9.2%. Seventy percents of the subjects presenting quantifiable C3-epimer concentrations had a C3-epimer/25(OH)D ratio comprised between 4.1 and 9.2%. We arbitrarily classified the subjects as having low, medium or high C3-epimer values if their C3-epimer concentrations were undetect-able, < 4 ng/mL, < 8 ng/mL and above 8 ng/mL. We then calculated the mean ratio immunoassay/LC-MS/MS for each category. Our results show that this ratio was not different across the categories for any of the immunoas-says. This ratio was neither different when we selected healthy subjects presenting no quantifiable C3-epimer concentrations.
DiscussionMethods for 25(OH)D determination are continuously improving with increasing knowledge on the analytical pitfalls linked to this complex determination. We have now also a commonly accepted reference method and an ongoing worldwide standardization program, the Vitamin D Standardization Program (VDSP) coordinated by the CDC, the NIST and the University of Ghent [2]. This has led to an increased global concordance of different assays in the “normal healthy” population even if some
- 10.1515/cclm-2016-0566Downloaded from PubFactory at 08/30/2016 02:10:30PM
via Université libre de Bruxelles
6 Cavalier et al.: Validation of the Abbott 25(OH)D assay
Figure 3: 25(OH)D serum levels observed with Abbott 3L52 and 5P02, Roche Cobas and LCMS/MS assays in 40 healthy individuals supplemented with 600.000 IU of vitamin D2 (Figure 2A) or 100.000 IU of vitamin D3 (Figure 2B) at baseline and after 7 and 28 days.
issues are still remaining, notably in “special” popula-tions, such as pregnant women, African subjects or hemo-dialyzed patients [10]. Accordingly, Abbott Diagnostics have launched a new version of the Architect 25(OH)D assay, calibrated against the NIST SRM 2972. This version presents improved analytical features compared with the
former one, notably a decreased overestimation of the 25(OH)D in the higher range of concentrations.
The cross-reactivity with 25(OH)D2 is similar to what we found previously with the former version. However, the results of our supplementation study of healthy volun-teers with 600,000 of ergocalciferol show that the assay is
- 10.1515/cclm-2016-0566Downloaded from PubFactory at 08/30/2016 02:10:30PM
via Université libre de Bruxelles
Cavalier et al.: Validation of the Abbott 25(OH)D assay 7
suitable for monitoring patients receiving vitamin D2 sup-plements, as in the US or France.
Compared to competing immunoassays, the new 5P02 assay presents a better agreement with the LC-MS/MS, in the global population, but also especially in osteoporo-tic patients and in patients from the intensive care unit. Unfortunately, we did not have the opportunity to compare the performances of the 5P02 assay to the Fujirebio Lumi-pulse we recently validated and which is the only sand-wich method available for 25(OH)D. Indeed, our results had shown that this assay presented a much improved clinical concordance compared to the other “classical” competitive immunoassays [11].
In conclusion, the new 5P02 version of the Abbott Architect 25(OH)D assay is clearly improved compared to the previous one.
References1. Holick MF. Vitamin D deficiency. N Engl J Med 2007;357:266–81.2. Sempos CT, Vesper HW, Phinney KW, Thienpont LM, Coates PM.
Vitamin D status as an international issue: national surveys and the problem of standardization. Scand J Clin Lab Invest Suppl 2012;243:32–40.
3. Cavalier E, Carlisi A, Bekaert A-C, Rousselle O, Chapelle J-P, Souberbielle JC. Analytical evaluation of the new Abbott Architect 25-OH vitamin D assay. Clin Biochem 2012;45:505–8.
4. NCCLS. Evaluation of precision performance of quantitative measurement methods, approved guideline, EP05-A2, ISBN 1-56238-542-9. n.d.
5. Wielders JP, Wijnberg FA. Preanalytical stability of 25(OH)- vitamin D3 in human blood or serum at room temperature: solid as a rock. Clin Chem 2009;55:1584–5.
6. Le Goff C, Peeters S, Crine Y, Lukas P, Souberbielle JC, Cavalier E. Evaluation of the cross-reactivity of 25-hydroxyvitamin D2 on seven commercial immunoassays on native samples. Clin Chem Lab Med 2012;50:2031–2.
7. Cavalier E, Wallace AM, Carlisi A, Chapelle J-P, Delanaye P, Souberbielle J-C. Cross-reactivity of 25-hydroxy vitamin D2 from different commercial immunoassays for 25-hydroxy vitamin D: an evaluation without spiked samples. Clin Chem Lab Med 2011;49:555–8.
8. Lin LI. A concordance correlation coefficient to evaluate repro-ducibility. Biometrics 1989;45:255–68.
9. Mcbride GB. A proposal for strength-of-agreement criteria for Lin’s Concordance Correlation Coefficient. NIWA Client Rep 2005;HAM2005-06:14.
10. Cavalier E, Lukas P, Crine Y, Peeters S, Carlisi A, Le Goff C, et al. Evaluation of automated immunoassays for 25(OH)-vitamin D determination in different critical populations before and after standardization of the assays. Clin Chim Acta 2014;431:60–5.
11. Cavalier E, Lukas P, Bekaert A-C, Peeters S, Le Goff C, Yayo E, et al. Analytical and clinical evaluation of the new Fujirebio Lumipulse®G non-competitive assay for 25(OH)-vitamin D and three immunoassays for 25(OH)D in healthy subjects, osteoporotic patients, third trimester pregnant women, healthy African subjects, hemodia. Clin Chem Lab Med 2016;54:1347–55.
- 10.1515/cclm-2016-0566Downloaded from PubFactory at 08/30/2016 02:10:30PM
via Université libre de Bruxelles