ethnic diversity and charitable giving · ethnic diversity and charitable giving ... ethnic...
TRANSCRIPT

Ethnic Diversity and Charitable Giving
Cagla Okten1
Una Okonkwo Osili2
1 Contact Information: Department of Economics Bilkent University Bilkent Ankara, Turkey;, email: [email protected]. 2 Contact Information: Department of Economics, Indiana University – Purdue University Indianapolis, Indianapolis, IN 46202; phone: (317) 274 4755, email: [email protected]. We gratefully acknowledge funding from the Indiana University on Philanthropy.

Ethnic Diversity and Charitable Giving
Cagla Okten*
Department of Economics Bilkent University
Bilkent, Ankara, Turkey
Una Okonkwo Osili
Department of Economics Indiana University-Purdue University at Indianapolis
Indianapolis, Indiana, USA Abstract Recent studies suggest that greater community heterogeneity will lead to lower provision of local public goods and less support for governmental income distribution programs towards the needy (Luttmer 2001). Our study analyzes how private donations to charitable organizations that help the needy are affected by greater community heterogeneity. It is important to address this question since charitable organizations are often considered to provide services that are substitutes to provisions from the government. We find that greater ethnic heterogeneity decreases both the probability and the amount an individual contributes to a charitable organization using new data from Panel Study of Income Dynamics (PSID). *e-mail: [email protected]

1. INTRODUCTION
As U.S. and European societies become more racially and ethnically diverse, an important
question is how these changes will impact social and economic life. Several authors have argued
that rising heterogeneity may lead to weaker welfare states, by reducing the willingness of
citizens to redistribute their incomes.3 For example, European states have more generous welfare
and social insurance policies compared to those in the United States. (Alesina et. al., 2001) In
addition, Luttmer (2001) documents that support for public redistribution to the needy is lower
within more ethnically heterogeneous U.S. communities. To date, much of the literature has
focused on support for one type of redistribution – government-sponsored welfare. To date, much
of the literature has emphasized one type of income redistribution –government-sponsored
welfare.4 Much less is known about how ethnic heterogeneity will affect other channels of
income redistribution.
This paper takes on an important aspect of this debate by examining how ethnic heterogeneity
affects private donations to the needy. Charitable giving to needy is often a voluntary act of
income redistribution. To our knowledge, our paper represents the first attempt to examine this
question. Our approach is informed by noting that a large majority of U.S. households donate to
charitable causes. Based on recent figures, in 2003, nearly 90 percent of U.S. households gave to
charitable causes, and total contributions amounted to about 240.92 billion dollars, nearly 2.2% of
GDP. In addition, U.S. charitable organizations play a central role in in redistributing income
and providing goods and services to the needy. We also examine the relationship between private
donations to the needy and the level of public redistribution (per capita food stamps) to shed light
on the extent to which government transfers crowd-out private contributions to the needy.
The empirical analysis in this paper is based on new data on giving to the needy from the
Center on Philanthropy Panel Study (COPPS), a module in the Panel Study of Income Dynamics
(PSID). These data represents the largest one-time study of philanthropy in the United States, and
provides a unique opportunity to study the impact of ethnic diversity on charitable giving at the
household-level.5 There are few existing sets that allow us to examine private income
3 Several authors have documented that community heterogeneity may lead to lower provision of local public goods, trust towards others, and participation in social groups using U.S. data (Alesina, Baqir and Easterly, 1999; Alesina and LaFerrara, 2000). A related literature examines how ethnic diversity affects public policy choices and economic outcomes using cross-country data (Easterly and Levine, 1997). 4 There is some evidence that public attitudes towards welfare may differ from public attitudes towards other spending on the poor (Jacoby, 1994). 5 Some of the data used in this study are based on the sensitive PSID-Geocode Match files, obtained under special contractual arrangements from the Panel Study of Income Dynamics meant to protect the

redistribution to the needy for a representative sample of U.S. households. In addition, the
dataset contains high quality data on income and wealth, which are typically unavailable within
existing data sets on philanthropic behavior, allowing us to control for the household’s economic
resources.
To our knowledge, this is the first economic study to investigate how ethnic diversity affects
private redistribution to the needy. The results of this study have the potential to contribute to
important debates concerning the relationship between private and public income redistribution.
2. CONCEPTUAL FRAMEWORK
Economic theory provides a framework for understanding transfer patterns to charitable
institutions that serve the needy. With altruism, households contribute money and time to
community organizations because they care about the recipients of those organizations. Under the
exchange motive, households transfer resources because they benefit directly from their
contributions to the needy. For example, donors may derive benefits in the form of a “warm
glow” or joy from giving (Becker, 1974; Andreoni, 1989, 1990) which depends on the size of the
contribution to the needy. Our framework considers the role of both motives in the household's
transfer decision.
Within altruism and exchange-based considerations, community-level variables, including
ethnic diversity can influence the household's transfer decision. In this section, we present our
conceptual framework. The formal model is detailed in an appendix, which is available upon
request.
Ethnic Diversity and Charitable Contributions
Ethnic diversity can affect contributions to charitable organizations through the inter-household
considerations in the form of altruism towards one's own ethnic community, transaction costs of
organizing, and diversity of preferences. These mechanisms are presented below and suggest that
ethnic diversity can have a negative impact on contributions.
Inter-household Considerations: Ethnic diversity may influence charitable contributions
through altruistic preferences. The extent to which altruistic preferences lead to variations in the
level of support for community services depends on differences across households in the
correlation between the weight a household (i) places on the utility of another household, (j) and
the marginal benefit of i′s contribution to j. The marginal benefit of i′s contribution to household
anonymity of the respondents. These data are not available from the authors. For more information, please contact the PSID directly at [email protected].
j is positive if j receives community services. In particular, support for charitable institutions, and
hence the level of contributions is higher among individuals for whom this correlation is larger.6
Thus, ethnic diversity will affect contributions if the weight that household i places on the utility
of household j is higher when j belongs to i′s ethnic group. The prediction that emerges here is
that household i will increase its contributions as the number of similar households who benefit
from the services of the charitable organization rises. In this paper, we test the altruism towards
one's own ethnic group hypothesis by investigating the impact of the share of beneficiaries from a
household's ethnic group on the probability and level of contributions.
Transaction Costs: Charitable giving to the needy within a community often depends on trust
and communication among groups. Ethnically diverse communities may have low levels of trust
and may lack community-level norms of reciprocity, particularly if these attributes are cultivated
within ethnic groups (Gugerty and Miguel, 2002). With high transaction costs in a community,
the formation of community-level charitable organizations may be more difficult. Furthermore, it
may be more costly to produce services for the needy in the presence of communication barriers
arising from ethnic diversity. Thus, high transaction costs will have a negative effect on
organization existence and will decrease the probability of giving. We test the transaction costs
hypothesis by constructing an index of ethnic diversity and measuring its effect on the probability
and level of monetary transfers to the needy.
Diverse Preferences: Ethnic diversity may lead to a polarization of preferences where a larger
fraction of the community may find the type of services offered by the charitable organization
undesirable. This has a negative effect on the probability of contributions, and the level of
monetary transfers to the charitable organization when there is only one type of transfer under
consideration.7 If the type of services provided is based on majority preferences, a household
from a non-majority group may find them less desirable and will be less likely to contribute to
their production.
It is important to recognize that ethnic heterogeneity may also be positively associated with
contributions. Within ethnically diverse settings, charitable organizations serve the poor when
governments and markets fail to satisfy the heterogeneous needs of consumers leading to a larger
supply of organizations (Weisbrod, 1988). Diverse preferences may lead to a wide range of
6 This is unambiguously the case when there is only one type of transfer. When the household considers both money and time transfers, we need a restriction on the cross-utility effects as specified in the discussion of diverse preferences. 7 If households jointly choose monetary and time transfers, then the effect of diverse preferences is more complex. Specifically, if the marginal utility of money and time contributions diminishes "rapidly enough" to compensate for any possible negative cross-utility effects of money and time transfers, then we expect the probability and level of money and time contributions to decrease with greater diversity in preferences.

opinions on what type of goods and services to provide to the needy, and within democratic
systems of government, the supply of goods and services to the needy may reflect the preferences
of the median voter only Weisbrod (1988:27).
In this section, we have discussed the channels through which ethnic diversity may affect
charitable contributions. We examine the relative importance of these mechanisms using various
ethnicity measures in the empirical section of the paper.8
3. DATA
The new PSID philanthropy module used in this paper is unique because it provides high-
quality data on charitable giving, comparable to the U.S. Individual Taxpayer Return data9
(Wilhelm, 2002). Most existing data sources on U.S. charitable giving do not provide detailed
information on charitable giving by organization type and high quality information on income
and wealth is often not available.
Our data set contains over 5400 households.10 The key dependent variable in our study is
charitable giving to the needy. We examine “giving” as dichotomous variable, which is equal to 1
if individual i gave a transfer to a charitable organization that served the needy in the survey year,
and zero otherwise. We also investigate the amount transferred to the needy, a continuous
variable, which is defined as the log of the total monetary contribution to a charitable
organization that served the needy.11
In this study, we define charitable giving as contributions to qualified nonprofit organizations
that are eligible for the charitable deduction according to the definitions provided by the Internal
Revenue Service. Our key dependent variables on charitable giving are constructed using the
following questions, which were posed to PSID survey respondents: “During the year 2000, did
[you/you or anyone in your family] donate money, assets, or property with a combined value of
8 Another channel that inter-household effects may affect the time transfers is when households prefer to interact with others who belong to the same ethnic or socio-economic group, as modeled by Alesina and LaFerrara (2000). In their model, individuals derive disutility from interacting with people who belong to a different ethnic group. For this reason, time contributions may be particularly responsive to the share of participants in the community organization who belong to one's own ethnic group and the household's non-majority status in the community. 9 The PSID philanthropy module is the only data set on giving that is comparable to the IRS taxpayer data in coverage. However, we should note that the IRS taxpayer database provides a more accurate picture of charitable giving at and above the 90th percentile of charitable giving. The IRS tax data is less suitable for this study because immigrant status and experience is not recorded, and immigrants may be less likely to itemize their deductions. 10 We exclude the Survey of Economic Opportunity (SEO) sample in PSID in our investigation. 11 More formally, our continuous measure of formal and informal giving is defined as log (1+ total amount)

more than $25 to religious or charitable organizations?” Households are then asked whether they
contributed to charitable organizations that served the needy and how much was contributed.
The empirical literature on charitable giving emphasizes the effect of taxation on charitable
contributions. Given the tax-deductibility of charitable contributions, higher marginal tax rates
should lower the price of charitable giving. The price of formal charitable giving is calculated by
1 minus the marginal tax rate for itemizers, and unity for non-itemizers. We calculate the
marginal tax rate for itemizers using TAXSIM version 5 (Feenberg and Coutts, 1993).12
The PSID has a rich set of income and wealth measures, which we exploit in order to fully
capture the household’s economic position. As permanent income tends to have a larger effect on
charitable behavior than transitory income sources (Auten, Holger-Sieg, and Clotfelter, 2002), we
use a measure of the household’s permanent income. Our measure of permanent income is based
on average family income from 1997, 1999, and 2001 waves of the PSID.13 In our analysis, we
also include several household characteristics, such as age of household head, age squared,
marital status, gender, educational attainment, race and ethnic origin, family size, unemployment,
immigrant status, and household income. To account for regional variation in charitable giving,
we classify households into six geographic regions based on their state of residence.
To obtain a comprehensive picture of ethnic diversity and other community characteristics,
we rely on the 1990 and 2000 Census Data. The United States has witnessed significant changes
in the ethnic and racial composition over the past two decades. According to the 2000 U.S.
Census, approximately 30 percent of the population currently belongs to a racial or ethnic
minority group. Using the 1990 and 2000 Integrated Public Use Microdata Sample (IPUMS) and
1990 and 2000 U.S. Census Summary File 3, we construct measures of ethnic diversity, income
inequality, and birthplace fragmentation at the Metropolitan Statistical Area (MSA) and county
levels. The ethnic diversity index (ETHNIC) captures the probability that two randomly selected
households will belong to different ethnic groups. An ethnic diversity index value of 0 for a
community would mean that all households in the state belonged to the same ethnic group, while
an ethnic diversity index of 1 would represent the maximum ethnic diversity. In our study,
communities with higher scores have greater levels of ethnic diversity. We construct similar
12The 18 input variables used to calculate the price of giving include tax year (2000), marital status, number of children in the family unit, number of taxpayers (head and wife) over 65 years of age, labor income of the head, labor income of the wife, dividend income of head and wife, property income, pension income, gross social security income, transfer income, rent paid, property taxes paid, itemized deductions (charitable deduction and medical deduction), child care expense, and unemployment compensation. 13 Total family income can contain negative values. The number of households with negative numbers for those variables is relatively small and we replace these negative values with missing values.

indices for income inequality. We also construct a variable to measure the fraction of the
population that belongs to a .given ethnic group
Table 1 provides summary statistics. Nearly 30 percent of households contributed money or
materials to a charitable organization that served the needy. The PSID data also allows us to
examine the allocation of charitable contributions across other categories of giving. In addition to
charitable organizations that serve the needy, we also have detailed information on the incidence
and levels of giving for six categories of charitable institutions: religious institutions,
organizations that served a combination of purposes (such as the United Way), health care or
medical research organizations, educational, and other charitable institutions. We have
information on incidence, but not specific levels of charitable giving for youth, arts, community,
environment, and international aid.
4. EMPIRICAL SPECIFICATION AND METHODS
Contributions to Charitable Organizations
This section presents an empirical model of the household's decision to contribute money,
materials, and time to an organization that serves the needy in a given community. Let j index
households and k index communities. We specify
Yjk = B 1+ B2X jk +B3Ck+ uj +ε jk
where Yjk is, the "latent variable" in our analysis measure the net expected utility to household j,
from contributing money to charitable organizations that help the needy in community k, X jk
represents a vector of observable and unobservable household characteristics including head's
race, age, sex, marital status, years of schooling, household size, number of children in the
household, log per capita permanent income, and the share of household's ethnic group; Ck is a
vector of community characteristics including ethno-linguistic diversity (log) population and (log)
median income. ε jk is the error term with E[ε ]=0, Var[ε ]=1.
We do not observe the "latent" variable, Yjk but only the choice made by the household,
which takes value 1 if household contributes money to the charitable organization that serves the
needy (i.e. Yjk is positive), and 0 otherwise.
P jk = 1 if Y jk >0 ,0 otherwise

We then estimate a probit specification where the dependent variable is Pjk. Our specification
includes a rich set of household and community characteristics as explanatory variables.
Our data set contains information on the amount transferred to charitable organizations,
but it is important to recognize that money transfers realized do not capture Yjk.. Economic
theory suggests that the household makes a marginal benefit-marginal cost calculation when
deciding on the level of transfers and Yjk. represents the difference between marginal benefits
and marginal costs. With this caveat in mind, we estimate a Tobit model with the total amount of
money transferred to charitable organizations as the dependent variables.
It may be difficult to fully capture all the community variables that affect contributions.
Community characteristics such as civic traditions which may be unobserved, can also affect
transfer patterns. Unobserved variables may be correlated with measured community
characteristics, leading to bias in our estimated coefficients. The direction of the bias will depend
on the correlation between observed and the omitted variables, as well as the true impact of
observed variables on contributions.
5. RESULTS
Decision to Give
Table 2a displays our basic probit regression using the PSID data set and including only
individual controls. The dependent variable is equal to one if a household contributes money a
charitable organization which provides aid to the needy, and 0 otherwise. The estimates in the
first column of Table 2a are marginal probit coefficients; in the second column we report
heteroskedasticity corrected standard errors adjusted for intra-county clustering of residuals.14
[Insert Table 2a]
From our results, a picture of the household-level determinants of contributions emerges. Higher
income households (measured by log permanent income) are more likely to contribute to
charitable organizations.
Consistent with other studies on charitable giving, we find that there are significant life-
cycle effects in charitable giving. The incidence of charitable giving increase with age but
eventually declines among older households. Male-headed households are about 4 percentage
points less likely to give money to charitable institutions. Educational attainment, marital status,
and household size are positively associated with incidence of charitable giving. An additional
year of education increases the likelihood of charitable giving to the needy by about 6 percentage
14 Marginal effects are evaluated at the sample means for continuous variables, and reflect a change from 0 to 1 for discrete variables.

points. Immigrant status has a negative effect on the probability of giving though this coefficient
is significant only at 10 percent level of significance.
Interestingly, race has a negative and statistically significant impact on the probability of
giving to the needy and the total amount contributed. O’Neill and Roberts (2000) find that when
controls for income, education, and immigration status are introduced, ethnic and racial
differences in charitable giving tend to disappear. However, based on our results, nonwhites are
about 6 percentage points less likely to participate in charitable giving to needy even after we
have controlled for permanent income, immigrant status, and other demographic variables.
We next extend our analysis by incorporating variables which capture the characteristics of
the community where individuals live.15
[Insert Table 2b]
In Table 2b we include county population and median income (both in logs) together with our
measures of heterogeneity. Consistent with our theoretical predictions, the ethnic diversity index
has a negative and statistically significant effect on the probability of contributing money. We
find the results on ethnic diversity to be sizeable, when compared to other significant
determinants of contributions.
The ethnic diversity index has been criticized in the literature because it has the same
value for each individual living in the same community and hence may not accurately reflect the
effects of interpersonal preferences---preferences that depend on the ethnicity characteristics of
others. These preferences will depend on the interplay between an individual’s own ethnic
identity and ethnicity of others. To deal with this concern, we include the variable SHARE which
is the share of households from individual’s own ethnic group in total population as an alternate
measure of ethnic heterogeneity. This variable varies by ethnicity and will allow us to test
whether households are more likely to contribute when the share of their own ethnic group in
total population increases.
We find SHARE to have a positive and significant effect on contributions on
contributions suggesting that interpersonal preferences is another channel through which ethnic
diversity may affect economic outcomes.
One could argue that ethnic diversity reflects other types of heterogeneity such as income
inequality within a community. The existing literature suggests that income or wealth inequality
15 Our findings on individual controls are stable and robust to various specifications. We do not report
these coefficients in the rest of the tables, although they are included all specifications.

county and also control for share of poor people in total population. Table 4 column 1 presents
this regression.
[Insert Table 4]
We do not find any evidence for crowding out. In fact, IMBP is positive and marginally
significant. The positive coefficient may seem puzzling at first. However, we also recognize that
a higher IMBP also means the severity of needs in a community. If we cannot properly control for
the existence of such needs with our share of poor in population variable, then we might observe
a positive association with IMBP and private giving. Ethnic diversity remains negative and
significant while share of poor in population is insignificant.
Interpersonal Preferences
It is often challenging to identify the exact mechanisms through which ethnic
heterogeneity affects individual behavior. One mechanism that we will consider in more detail is
through interpersonal preferences. Here, we adopt a similar approach to Luttmer (2001) who
analyzed the effects of interpersonal preferences on support for welfare spending. More
specifically, we construct two variables: share of poor black population in total population and
share of poor non-black population in total population. We then interact each of these variables
with indicator variables for race. Black=1 if the household head is black. Non-black is
constructed in a similar fashion. Therefore we have four variables where race-specific poverty
rates are interacted with the race of the respondent to measure interpersonal effects. Table 5
presents these results.
[Insert Table 5]
The most striking result here is the negative and significant coefficient on share of poor
blacks in population with non-black dummy. This basically implies that an additional poor black
person in the community decreases both the probability and the amount of donations to the needy
by a non-black person.
Discussion: A Distaste for Redistribution
Donating to charitable organizations which help to poor and the needy is essentially a
private act of redistribution of income. Studies before us focused on the determinants of support
for public income redistribution, mainly through government-sponsored welfare programs. These
studies noted that in relatively homogeneous communities there is more support for public
income redistribution and other forms of public spending (Orr (1976); Easterly and Levine
(1997); Poterba (1997); Alesina et al. (1999)). Luttmer (2001) noted that if individuals prefer to

redistribute to their own racial, ethnic or religious group, they prefer less redistribution when
members of their own group constitute a smaller share of beneficiaries.
In this paper we have shown that that heterogeneity also reduces private acts towards
redistribution as individuals are both less likely to give and reduce their donation amount in more
ethnically heterogeneous communities.
6. CONCLUSIONS AND FUTURE WORK
Using new data on philanthropic behavior, we find that ethnic diversity has a negative
effect on giving to the needy. Our main findings are suggestive of mechanisms through which
ethnic diversity can influence private income redistribution. Specifically, we find that
interpersonal preferences towards one’s ethnic group may affect giving to needy.
While our results on ethnic diversity provide important insights, there is a need for
caution in the interpretation of these results. In general, isolating the impact of community-level
outcomes on social and economic outcomes can be challenging. Because it is unlikely that
individuals randomly chose their county of residence, estimates of the impact of ethnic diversity
on individual behavior may be biased. An important concern in our analysis is that the location
decision could be shaped by the same unobserved factors that influence the decision to give and
volunteer time. To illustrate this point, suppose an individual who is less civic minded is also
more likely to reside within an ethnically diverse community. The omission of individual
variables (taste for giving, civic attitudes) from our analysis may lead us to find a spurious
“ethnic diversity effect”. Another concern is that individuals residing within a given geographical
area often share a common economic environment, and some of these factors are unobserved in
our analysis. For example, there may be higher levels of government spending on public goods.
In future work, plan to address some of these issues. For example, we can control for the role of
time-invariant unmeasured community characteristics using MSA fixed-effects. We also
examine changes in charitable giving over time to reduce concerns about the effect of unobserved
heterogeneity at the individual level.

BIBLIOGRAPHY (incomplete)
Alesina A, Easterly W and Baqir R (1999) Public Goods and Ethnic Divisions. Quarterly Journal
of Economics 114(4): 1243-84
Alesina A, LaFerrara E (2000) Participation in Heterogeneous Communities. Quarterly Journal
of Economics 115(3): 847-904
Andreoni J (1990) Impure Altruism and Donations to Public Goods: A Theory of Warm Glow
Giving. Economic Journal 100(401): 464-77
Auten, G, Holder S, and Clotfelter. C (2002). “Charitable Giving, Income and
Taxes: An Analysis of Panel Data,” American Economic Review, 92(1): 371-382.
Becker GS (1981) Treatise on the Family. Harvard University Press, Cambridge
Biddle, JE (1992) in Clotfelter CT Who Benefits from the Non Profit Sector? University of
Chicago Press, Chicago, IL and London
Easterly W and Levine R (1997) Africa's Growth Tragedy. Quarterly Journal of Economics
112(4): 1203-50
Feenberg, Daniel and Elisabeth Coutts. (1993). “An Introduction to the TAXSIM Model,”
Journal of Policy Analysis and Management,” 12(1): 189-94.
Grimard F (1997) Household Consumption Smoothing through Ethnic Ties: Evidence from Cote
D'Ivoire. Journal of Development Economics 53: 391-422
Hungerman D. (2004) Race and Charitable Church Activity Duke University mimeo
James E (1987) The Nonprofit Sector in Comparative Perspective. In: W.W. Powell (ed) The
Nonprofit Sector: A Research Handbook. Yale University Press, New Haven 397-415
Knack S and Keefer P (1997) Does Social Capital Have an Economic Payoff? A Cross-Country
Investigation. Quarterly Journal of Economics 112(4): 1251-88
Kingma B (1989) An Accurate Measurement of the Crowd-Out Effect, Income Effect, and Price
Effect for Charitable Contributions. Journal of Political Economy 97(5): 1197-1207
LaFerrara E (2001) Inequality and Group Participation: Theory and Evidence from Rural
Tanzania. Journal of Public Economics, forthcoming
Luttmer EFP (2001) Group Loyalty and the Taste for Redistribution. Journal of Political
Economy 109(3): 500-529
Miguel E (2001) Ethnic Diversity and School Funding in Kenya. Economics Research Working
Paper No. C01-119, Center for International and Development, University of California,
Berkeley
O’Neill, M. and Roberts. W.L (2000). Giving and Volunteering in California. San Francisco: Institute for Nonprofit Organization Management, College of Professional Studies, University of San Francisco.

Putnam R (1993) Making Democracy Work: Civic Traditions in Modern Italy. Princeton
University Press, Princeton
Putnam, R. (2000) Bowling Alone: The Collapse and Revival of American Community New York: Simon and Schuster
Ribar, David and Mark Wilhelm. (2002). “Altruistic and Joy-of-Giving Motivations in Charitable Behavior,” Journal of Political Economy, 110(2): 425-457.
Simon, H. (1993). “Altruism and Economics,” American Economic Review, 83 (2): 156-61. Weisbrod BA (1988) The Nonprofit Economy. Harvard University Press, Cambridge, MA
Wilhelm, Mark, (2003). “The Distribution of Giving in Six Surveys,” Department of Economics,
Indiana University-Purdue University at Indianapolis. mimeo.

Table 1: Summary Statistics
N Mean Contributed to the Needy? 5452 0.28
(0.45)Amount contributed (full sample) 5370 116.50
(3248.82)Amount contributed (contributors sample) 1436 435.6657
(1198.99)Community CharacteristicsEthnic Diversity Index (2000) 5426 34.463
(19.553)Gini Coefficient 5426 44.408
(4.017)Household CharacteristicsShare of Population from own ethnic group 5257 69.132
(26.155)Intemized for formal charitable giving 5399 0.44
(0.50)Price of formal giving 5461 0.82
(0.11)Age 5458 45.84
(16.59)Male 5461 0.77
(0.42)Married 5461 0.63
(0.48)Education 5396 13.05
(2.74)Nonwhite 5461 0.20
(0.40)Family size 5461 2.66
(1.44)Unemployed 5456 0.04
(0.18)Permanent family income 5461 60330.57
(59267.42)
Standard deviations are shown in parentheses
Full Sample

Table 2aDecision to give: Individual DeterminantsProbit Model
Marg. Probit coefficient Std. ErrorNon-white -0.056 ** (0.021)Immigrant -0.213 * (0.21)Age 0.0122 * (0.01)Age Squared (x1000) -0.016 (0.02)Male -0.399 *** (0.40)Married 0.3187 *** (0.32)Education 0.0632 *** (0.06)Familysize 0.0034 (0.00)Price of Giving -0.564 *** (0.56)Income 0.3328 *** (0.33)Unemployed -0.04 (0.04)Regions Yes YesNumber of Observations 5248Pseudo Rsq 0.11Log Likelihood -2764Wald Chi(32) 704.91
Marginal Probit Coefficients are calculated at the means for continuous variables and from 0 to 1 for discrete variables. Standard Errors (in parenthesis) are corrected for heteroskedasticity and clustering of households at the fipcode level.
Region dummies are Northeast, Southeast, Northcentral, Southcentral, West and Mountain.

Table 2bDecision to Give and HeterogeneityProbit Model
(1) (2) (3)Ethnic Diversity -0.0014 **
(0.0006)Share (including Hispanic) 0.0011 **
(0.0005)Gini -0.001
(0.002)Size (log population) 0.023 *** 0.019 * 0.012 **
(0.006) (0.006) (0.005)Med HH Income (log) 0.058 * 0.056 ** 0.067 **
(0.032) (0.032) (0.033)Individual Controls Yes Yes YesRegions Yes Yes YesNumber of Observations 5219 5146 5219Pseudo Rsq 0.12 0.12 0.11Log Likelihood -2733 -2695 -2736Wald Chi(19) 734 705 718Marginal Probit Coefficients are calculated at the means for continuous variables and from 0 to 1 for discrete variables. Standard Errors (in parenthesis) are corrected for heteroskedasticity and clustering of households at the fipcode level.Individual Controls all those listed in Table 2a.

Table 3aDonation Amounts: Individual DeterminantsTobit Model
Coefficient Std. DeviationNon-white -1.1636 *** (0.393)Immigrant -1.4397 ** (0.575)Age 0.0957 ** (0.040)Age Squared (x1000) -0.4053 (0.387)Male -2.4753 *** (0.430)Married 2.0476 *** (0.424)Education 0.3638 *** (0.051)Familysize 0.0536 (0.102)Price of Giving -3.3117 *** (0.841)Income 2.0545 *** (0.219)Unemployed -0.0284 (0.716)Regions Yes YesNumber of Observati 5181Pseudo Rsq 0.059Log Likelihood -6089.928LR chi2(16) 758.48
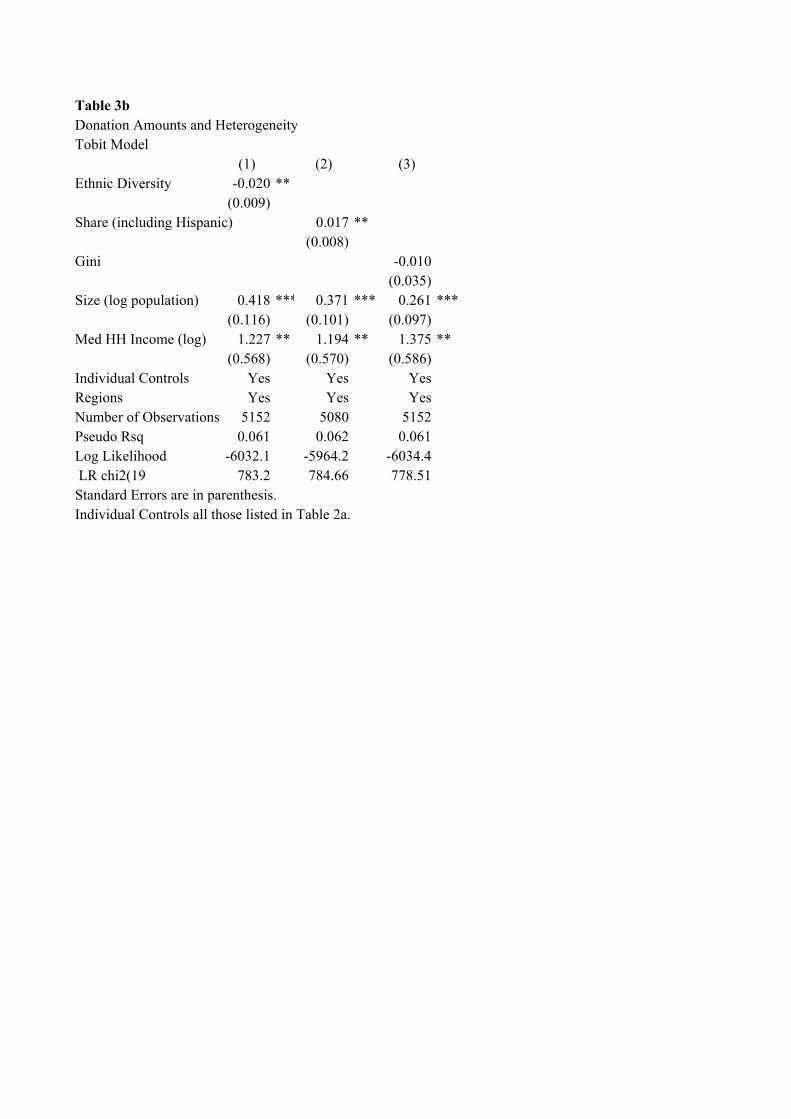
Table 3bDonation Amounts and HeterogeneityTobit Model
(1) (2) (3)Ethnic Diversity -0.020 **
(0.009)Share (including Hispanic) 0.017 **
(0.008)Gini -0.010
(0.035)Size (log population) 0.418 *** 0.371 *** 0.261 ***
(0.116) (0.101) (0.097)Med HH Income (log) 1.227 ** 1.194 ** 1.375 **
(0.568) (0.570) (0.586)Individual Controls Yes Yes YesRegions Yes Yes YesNumber of Observations 5152 5080 5152Pseudo Rsq 0.061 0.062 0.061Log Likelihood -6032.1 -5964.2 -6034.4 LR chi2(19 783.2 784.66 778.51Standard Errors are in parenthesis.Individual Controls all those listed in Table 2a.

Table 4Government Transfers
Probit Model Tobit Model-1
Ethnic Diversity -0.0017 ** -0.0253(0.001) (0.011)
Share of poor in population 0.19176 3.4119(0.289) (5.593)
Income maint. benefit payments 1.6E-05 * 0.0002(0.000) (0.000)
Size (log population) 0.02134 0.3969(0.007) (0.120)
Med HH Income (log) 0.09497 1.7546(0.066) (1.158)
Individual Controls Yes YesRegions Yes YesNumber of Observations 4895 4839Pseudo Rsq 0.1183 0.0617Log Likelihood -2567.1 -5719.7Standard Errors are in parenthesis. Individual Controls all those listed in Table 2a.

Table 5Interpersonal Preferences
Probit Tobit
Poor black/population 0.17582 4.9252interacted with black (0.483) (8.891)
Poor black/population -0.7845 ** -12.447 **interacted with non-black (0.355) (6.210)
Poor nonblack/population -0.029 5.7058interacted with black (0.269) (8.395)
Poor nonblack/population 0.20016 -0.1552interacted with non-black (0.427) (5.219)
Size (log population) 0.01825 *** 0.3526 ***(0.005) (0.104)
Med HH Income (log) 0.03323 0.7923(0.061) (1.061)
Individual Controls Yes YesRegions Yes YesNumber of Observations 5020 4961Pseudo Rsq 0.1173 0.0611Log Likelihood -2633.6 -5858.4Individual Controls all those listed in Table 2a.