estuarine sedimentation and erosion within a fjord-head...
TRANSCRIPT
ESTUARINE SEDIMENTATION AND EROSION WITHIN A FJORD-HEAD
DELTA: SQUAMISH RIVER, BRITISH COLUMBIA
Jonathan W. Gibson
B.Sc. (Hons) University of North London
THESIS SUBMITTED IN PARTIAL FULFILLMENT OF THE
REQUIREMENTS FOR THE DEGREE OF
MASTER OF SCIENCE
In the Department of
Geography
Jonathan W. Gibson
SIMON FRASER UNIVERSITY
December 1994
All rights reserved. This work may not be reproduced in whole or in part, by photocopy
or other means, without permission of the author.
APPROVAL
Name:
Degree:
Title of Tl~esis:
Jonathan William Gibson
Master of Science
Estua~ine Sedimentation And Erosion Within A Fjord-Head Delta: Squarnish River, British Columbia
Examining Committee:
Chair: I. Hutchinson, Associate Professor
L. Lcsack Assistant Profcssor
hn L. Lutcrnaucs, Adjunct Psofcssor ological Survey of Canada
External Examincs
Date Approved: Dcccmhcs 5. 1993
PARTIAL COPYRIGHT LICENSE
I hcrcby grant to Simon Frascr University the right to Icnd my thcsis, project or extended
essay (the title of which is shown bclow) to uscrs of thc Simon Fruscr University Library,
and to make partial or single copies only for such uscrs or in response to a request from
the library of any otller univcrsity, or other educational institution, on its own behalf or
for one of its uscrs. 1 further agree that permission for multiple copying of this work for
scholarly purposes may he granted by me or the Dcan of Graduate Studics. It is
understood that ~opying or puhlication of this work for financial gain shall not be allowed
without my written pcrmission.
Title of Thesis/ProjcctlExtendcd Essay
Estunrinc Scdiment;rtion And Erosion Within A Fiord-Head Delta:
Squamish River, British Columbia
Jonathan Williun Gibson (n ;~~nc)
ABSTRACT
This study has determined the nature of tidal and riverine control on deposition along the
lower 5 500 In estuarine reach of Squamish River; delta and floodplain sedi~nents
exposed along channel banks at 42 locations along Squamish estuary were examined.
This study also has determined the rate and nature of estuarine channel bank erosion from
1957 to 1990 and has detennined the nature and rate of Squamish delta accretion. Erosion
rates are calculated from aerial photographs and erosion pins, while accretion data are
calculated from deposition stakes.
Analysis of delta and floodplain sediments reveals that estuasine sequences colnprise
seven distinct facies which record varying degrees of tidal and riverine influence. While
most of these facies yield evidence of their estuarine location, only the deposits of
intertidal sands and tidal marsh are unequi\wcally tidal in origin. Sedimentation within this
fjord-head environ~nent primarily is driven by gradual channel abandonment and fill.
Estuarine sequences produced by this process display a decreasing tidal influence both up
estuary and up section, as e~idenced by a change in sediment size. structure, and the form
of facies contacts. Within this estualy the bayline is located around 3 100 m upstream
from the delta front.
Erosion data indicate that the tidal deposits are very unlikely to be fully preserved in
sequence because of their low preservation potential. Since 1957 the estuarine channel has
shifted considerably, and predicted continued meander migration poses a threat to the
future stability of the ri\.er training dyke, built in 1972 to isolate Squamish Ri\.er to the
west of the valley. Along certain reaches, rates of channel bank erosion ha\,e increased as
a result of decreased channel and effective floodplain widths associated with dyke
construction. These factors have also led to an increased riverine influence near the river
mouth which has in turn led to the formation of an anomalous coarse-grained sedimentary
sequence along the lower 800 m of Squamish west delta. Accretion data reveal that
Squamish west delta accretion has increased dramatically since dyke construction, and that
this accretion is both spatially and temporally variable. This variability reflects the riverine
source of sediment, and indicates that depositional processes differ within sunmler and
winter months.
Comparative analysis of sedimentary sequence within fluvial and tidal reaches reveals that
fine-grained deposits provide evidence of their environment of deposition. These deposits
may be used as environmental indicators based on sediment-size characteristics, facies
geometry, organic content and bedding fonn.

ACKNOWLEDGMENTS
First of all I wish to thank Ted Hickin for providing the initial impetus for this research,
and for ensuring (through one means or another) that it be successfully completed. The
content of this work has been much improved through interesting discussion with Dr.
Hickin during these last months. I also wish to thank Drs. John Lutrrnauer, Mike
Roberts, and Lance Lesack for wading through this thesis with speed and good humour,
and for providing thoughtful suggestions for its improvement. I am also indebted to Paul
DeGrace, Ray Squirrel and Gary Hayward for technical assistance and unlimited access to
conlputing facilities (Ray. you may have your room back now).
The body of data provided here owes much to the hard work and generosity of many
people who assisted in both the field and laboratory. Mark Gawehns must be praised for
his work ethic and patience throughout the summer of 1992, though perhaps not for his
taste in music. Invaluable field assistance was also provided by Jan Thompson, Dave
Johnson, Scott Babakaiff. John Martin, Steve Blackburn, and Csaba Ekes; I owe you a11 a
great deal, though most likely will ne \w pay you back. Brett Turner and Bill Hanson must
also take credit for sitting for hours in a room with only a noisy nest of vibrating sieves
for company. I trust that you both have made the realisation that I made early on: avoid
sediment-size analysis.
Not to be forgotten in this o\,erly-long list of names are Jane Nor-I-is-Hill and Jean
Turnbridge, for placing a 1-oung physical-geography-wannabe in a cold Welsh stream all
those years ago. Did you know what you had started'? I also owe much to Hazel Faulkner
and Simon Jennings for providing early inspiration and a large push in the right direction
(to Canada). Finally (for this paragraph) I wish to thank Rick Thomson at the Institute of
Ocean Sciences for providing invaluable tide data.
Perhaps more than anyone, my family and friends must share the credit (blame?) for this
thesis. To my family and friends back home (who, through no fault of their own were
unable to leave England), I thank you for your patience, love, understanding, and
occasional letter. h4ost important in this list of supporters are Jan Thompson and Scott
Babakaiff, fellow graduate students, friends, and mentors. who u-atched me complete this
thesis from scratch. I doubt that I could have finished it without your friendship, criticism,

humour, pessimism, and immoral guidance. Mr John Streicker (perhaps the biggest
Thompson groupie of all) has also played a key role in helping me establish some sort of
life outside university; thanks for your efforts John. To everyone who has listened to me
complain for the last few years, I apologise.
Funding for this work was generously provided by Ted Hickin, a graduate fellowship,
and by numerous Teaching Assistant positions provided by the Department of
Geography.

DEDICATION
This thesis is dedicated to anyone who will reference it.
vii
TABLE OF CONTENTS
approval page
ABSTRACT
Acknowledgments
Dedication
List of Tables
List of Figures
CHAPTER ONE: INTRODUCTION
Background to the Study
Literature Review
Recognition of Tidal Deposits
Bedding in Tidal Flat Sediments
Intertidal flats
Tidal Channels
Salt Marsh
Research in Modern Estuarine Environments
Tidal Bundles
Transitional Environments: Fluvial-Estuarine Reaches of Rivers
Limitations of Research in Tidal Environments
Fjord Delta Sedimentation
Aims of Research
Study Area
Squarnish Estuary Tidal Regime
Squamish River Hydrologic Regime
Page
11
... 111
v
\'I1
xiv
X V
viii
Suspended-Sediment Characteristics
Effects of Wind
Delta Sedimentation
Delta Erosion
Channel Stability
Anthropogenic Changes to the Natural System
CHAPTER TWO: METHODOLOGY
Data Collection
Collection of Stratigraphic Data
Location of Bank Sections
Logging Sections
Sediment Sampling from Logged Sections
Facies-Scale Sampling
Bed-Scale Sampling
Delta Erosion
Delta Accretion
Data Analysis
Analysis of Log Data
Sediment Analysis
Preparation of Samples for Analysis
Sieving Analysis
SediGraph Analysis
Removal of Organic Material
CHAPTER THREE: FACIES-SCALE STRATIGRAPHIC ANALYSIS
Facies Description
Facies A: Cross-Bedded Sands and Gravels
Facies B: Finely-Laminated Sands and Silts
Facies C: Silty Rhythmites
Facies D: Sandy Rhythmites
Facies E: Parallel-Laminated Sands with Peds
Facies F: Ripple-Bedded Sands
Facies G: Parallel-Laminated Silts and Clays
Facies Interpretation
Facies A: Cross-Bedded Sands and Gravels
Facies B: Finely-Laminated Sands and Silts
Facies C: Silty Rhythmites
Facies D: Sandy Rhythmites
Facies E: Parallel-Laminated Sands with Peds
Facies F: Ripple-Bedded Sands
Facies G: Parallel-La~ninated Silts and Clays
Discussion
Depositional Model of Estuarine Deposits
The Age of Tidal Marsh Deposits
Tidal Deposition in Squarnish Estuary
The Changing Nature of Deposition along the Tidal Gradient
Observations from Sedimentary Sequence
Observations from Tidal Facies B and C
Upstream Limit of Detectable Tidal Sedimentary Control
Zonation of Squarnish Estuarine Deposits
Assumptions of Methodology Employed
CHAPTER FOUR: ENVIRONMENTAL SIGNIFICANCE OF
FINE-GRAINED SEDIMENTARY DEPOSITS
Description of Fine-Grained Units Exposed Along Fluvial Reaches
Interpretation and Reconstruction of the Environment of Deposition
Comparative Analysis of Fluvial and Tidal Rhythmite Overbank Fines
Facies Geometry
Organic Content
Sediment-Size Characteristics
Tidal Marsh Rhythmites
Fluvial Rhythmites
Bedding
Discussion of the Genesis of Fluvial Rhythmite Beds
Sediment Accumulation in the Tidal Zone:
Observations from Bedding Form
CHAPTER FIVE: ESTUARINE CHANNEL EROSION
AND TIDAL MARSH ACCRETION
Analysis of Historic Rates of Bank Erosion
Error in Erosion Data
Analysis of Short-Term Rates of Bank Erosion
Observations of Channel Bank Erosion
Discussion
Preservation Potential of Squamish Estuarine Deposits
West Delta Accretion
Spatial and Seasonal Variability of Accretion
Sedimentologic Implications of Accretion Data
Model of Squamish Delta Growth
Redfield's (1972) R4odel of Salt Marsh Development
Applicability of Redfield's Model to Squamish Delta
Sedimentologic Implications of Marsh Development
Specific Deltaic Depositional Process and Product: Rafted Deposits
Description of Deposits
Interpretation
Proposed Mechanism of Deposition
Transportation of Stones onto the Delta
Removal of Stones from Root Systems
Distribution of Stones on the West Delta
Sedimentologic Importance of Rafted Clasts
Previous Findings and Observations
Discussion of Previous Research
CHAPTER SIX: CONCLUSIONS
Depositional Model of Squamish Delta and Floodplain Formation
Tidal Controls on Sedimentation Within Squamish Delta
Preservation Potential of Tidal Deposits
Comparative Analysis of Fluvial and Estuarine Fine-Grained Deposits
Sedimentologic Evidence of the Fluvial/Tida
Transition Along the Estuarine Reach
Rates of Estuarine Channel Bank Erosion
Observations of Erosion
Tidal Marsh Accretion
xii
An Assessment of the Influence of Dyke Construction
Description and Origin of Large Stones on the West Delta Surface
Appendix A
Appendix B
Appendix C
REFERENCES
... Xll l
LIST OF TABLES
Page
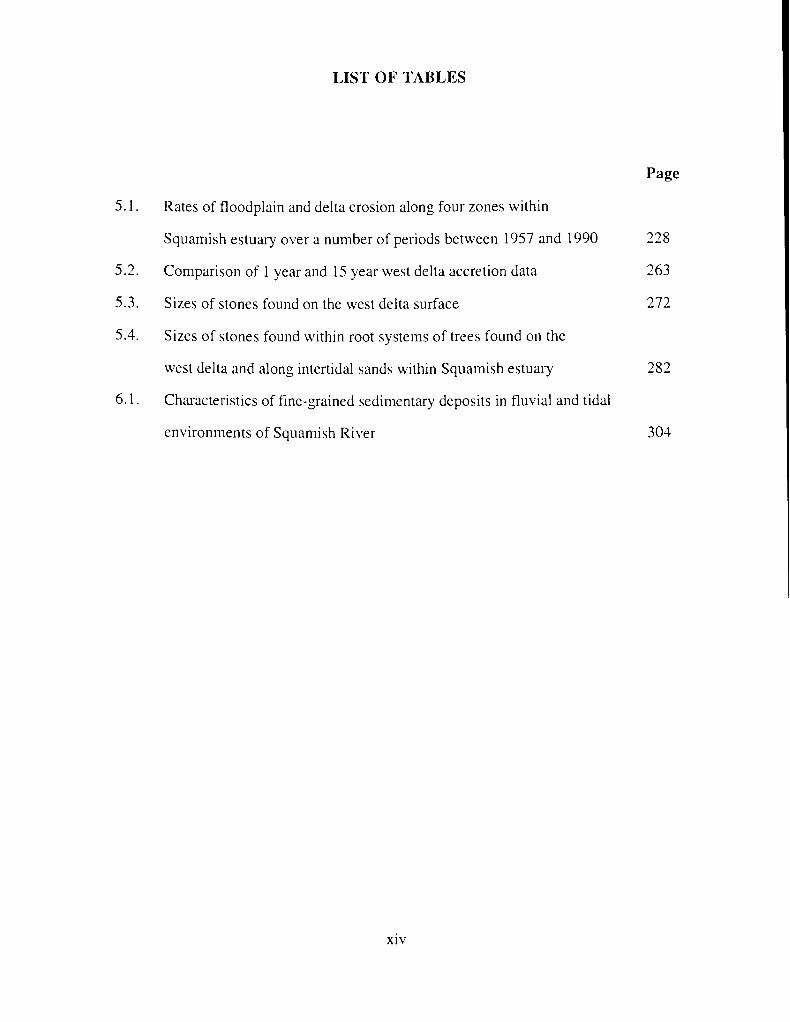
5.1. Rates of floodplain and delta erosion along four zones within
Squamish estuary over a number of periods between 1957 and 1990 228
5.2. Comparison of 1 year and 15 year west delta accretion data 263
5.3. Sizes of stones found on the west delta surface 272
5.4. Sizes of stones found within root systems of trees found on the
west delta and along intertidal sands within Squamish estuary 282
6.1. Characteristics of fine-grained sedimentary deposits in fluvial and tidal
environments of Squanlish River 304
xiv
LIST OF FIGURES
Schematic representation of climbing ripple lanlination
Idealised vertical section of intertidal deposits
Smith's (1987) threefold classification of point bar deposits
Facies associations within the Gironde Estuary (Allen, 199 1 )
Longitudinal facies transitions along the Gironde Estuary (Allen, 199 1)
Aerial photograph of study area
Squamish River sediment plume path
Oblique aerial photograph of Squamish delta in 1948
Early stages of meander cutoff and distributary channel abandonment
within Squarnish delta, 1958
Forced distributary channel abandonment within Squamish delta, 19S0
Sediment sample preparation and analysis flow-chart
Location of logged sections and bank exposures within
Squamish estuary
Facies A sands
Longitudinal section of Squamish estuary stratigraphy
Facies B sands and silts with shells
Facies B sediments showing a ripple train
Facies B - close-up of Figure 3.5
Facies B sediments showing rhythmic alternation of dark (coarse)
and light (fine) beds
Facies C rhythmite beds showing protruding organic layers
Typical upper west delta section appearance - Facies B, C, and E
Typical lower west delta section amearance - Facies C and D
Page
6
13
2 1
24
24
36
4 3
36
4 7
48
7 1
7 9
s 0
82
84
8 6
87
Abrupt contact between facies C and D
Facies F sands at site ny 1
Facies F sands at site nyl , showing parallel bedding high in organics
Sonar scan of estuarine channel bed. showing bedfonns
Erosion of Facies B deposits, producing mud clasts
Close view of Facies B deposits seen in Fig 3.7
Neap-spring tidal cycle experienced in Howe Sound
Portion of the neap-spring tidal cycle with proposed depositional
products of fluctuating tidal stage
Diagrammatic representation of ripple indices
Changing organic-C content with depth in tidal marsh sediments
Typical section appearance along the ox face
Squanlish west and central deltas during flood, showing levees
Interbed of fine sands of Facies B within coarse sands of Facies A
Contemporary colonisation of intertidal sands
Oblique aerial photograph of Squamish delta, 1947
West delta bank section showing one of three bottles found, and
deposits of Facies C and D
Facies B deposits toward the upstream limit of the wd face
Site nyl, showing the upper 150 cm of this section
Schematic diagram of estuarine definitions
Estuarine division proposed by Allen (1 99 1) for the Gironde
Estuary, France
Estuarine facies model proposed by Nichols et 01. (1 99 1)
Zonation of Squamish estuarine facies
Fluvial fine-grained rhythmite deposits exposed in section
xvi
Location map of fluvial fine-grained rhyth~nite deposits 176
Close view of fluvial rhythrnite beds 178
Close view of fluvial rhythmite beds 186
Plots of sand, silt, and clay content of tidal marsh beds with depth
below the delta surface at site irs 1 189
Conceptual model of the sand, mud, and total accumulation within
unvegetated mudflats 19 1
Percentage sand and mud fractions against depth below the tidal
marsh surface at site irs 1
Sand, silt, and clay content with depth in section, for fluvial
fine-grained deposits, site ol 1
Decreasing thickness of tidal marsh rhythmite beds with depth
below the delta surface at site irsl
West delta marsh edge, showing decreasing thickness of marsh
rhythmite beds with decreasing depth in section.
Changing thickness of fluvial rhythmite beds with depth in
section at sites 01 1 and cb2
Relationships between the thickness of tidal rhythnlite beds and their
sand, silt, and clay content at site irs 1
Cumulative number of rhythmite beds against depth from the
marsh surface. Data from Redfield (1972)
Comparison of the changing rate of sedimentation of tidal marsh
rhythrnites over time, between data provided from
this study and data provided by Redfield 209
Distribution curve of tidal flows within Howe Sound and Squainish
estuary, showing the decreasing percentage of tides which are able to

flood marsh surfaces of increasing elevations
Relationship between the decreasing relative sedimentation rate and
the percentage of tides which are able to flood marshes of different
elevations
Changing rate of Beatton River floodplain sedimentation over the
past 400 years. Data from Nanson (1977)
Comparative plot of the changing relative sedimentation rates of
tidal marsh deposits identified here and by Redfield (1972), and
riverine floodplain deposits identified by Nanson (1977)
Location of zones within which rates of estuarine channel bank
erosion have been assessed from 1957 to 1990
Aerial photographs of Squamish estuary in 1957 and 1969, showing
regions of channel shifting
Aerial photographs of Squamish estuary in 1973 and 1990, showing
regions of channel shifting
Zone of maximum channel bank erosion over the period 1957 to
1990, showing the proximity of the river to the river training dyke
at this location
Diagrammatic representation of erosion data presented in Table 5. I
Sudden collapse of west delta marsh deposits
Typical appearance of west delta bank section
The vertical, eroding bank face along the west delta
Facies A coarse sands exposed at the waterline along the eroding
reach of west delta
Bank face seen in Figure 5.8, three weeks after erosion began.
Maximum daily discharge for Squamish River, 1957 to 1990
xviii
Block of eroded marsh sediments within sandy point bar deposits
Location of deposition stakes on the west delta
West delta accretion between May 1992 and August 1992
West delta accretion between May 1992 and June 1993
West delta accretion between May 1992 and November 1993
Variability of west delta accretion with distance from Squamish River
Pannes on the west delta, seen in 1957
Cobble lying on dead grasses of the west delta
Cluster of cobbles on the west delta surface
Cobble on the surface of the west delta adjacent to a bent rebar
deposition stake
Boulder held within the roots of a tree transported by flows
associated with an eruption of Mt St. Helens
Cobble held by the roots of a tree in Squamish estuary
Several large stones found within the root system of a tree within
Squamish estuary
Close-up of root system shown in Figure 5.24
Two very large root systems (one carrying stone) found within
Squamish estuary
Stone partially buried in the intertidal sands at the seaward tip of the
west delta, also showing geese prints and geese feed-marks
Large root system of a tree found on the west delta. The roots are
holding 22 stones.
Squamish delta during flood, showing stranded trees on west and
central deltas, and showing waves breaking over the partially inundated
central delta
xix

6.2. Conceptual model of the changing relative influence of river and
tides as intertidal surfaces accrete.
CHAPTER ONE
INTRODUCTION
Background to the Study
Within the past three decades, fluvial sedimentologists have developed a number of
generalised facies models of depositional environments to provide a basis for the
identification and interpretation of similar systems in modern and ancient settings
(Miall, 1978a). In recent years, however, it has become apparent that this type of facies
modeling is of limited practical value in the field (Miall, 1984a). Environmental facies
models have been found to be highly site specific, and often are of little value when
taken out of the original context and applied to other systems. Another failing of these
models is that they are too inflexible, and cannot account for the fact that too much
overlap and gradation exists between depositional environments to warrant their simple
subdivision and grouping. These comments refer specifically to fluvial fiicies models,
though similar comments also can be made with regard to deltaic and estuarine models.
Much of our understanding of deltaic systems comes from numerous studies of both
modern and ancient Gulf Coast deltas, particularly the Mississippi. While this work has
been extremely valuable, Miall (1984b) notes that there has been a lack of recognition of
the site specificity of these facies models. This oversight has tended to bias
interpretation of other depositional systems which may not adequately be explained by
facies models based on Gulf Coast deltas. (Miall, 1984b)
In 1987, Miall observed that the previous nine years had seen a great number of newly
proposed facies models, and modifications to older models. It had become obvious that
there were many departures from the norms, and almost all facies models were based on
over-simplifications (Jackson, 1978; Bridge, 1985). Model classifications have limited
real-world value, as specific processes and deposits are common to many different
environments, and gradations between all end-member conditions exist (Miall, 1985;
Bridge, 1985). Facies models are highly site specific, and as such, virtually unique.
Despite this reservation, facies models can be of value as an interpretive tool, but only if
their limitations are fully understood.
Nevertheless, a number of inaccurate interpretations have been made because of an over-
reliance on existing facies models (Smith, 1987). More recent research is showing that
there are many more variations in facies style than have previously been realised. The
obvious conclusion to be drawn from this realisation is that there needs to be a
reappraisal of many of the commonly accepted facies models such as Allen's ( 1970)
model of meandering point bar deposits. This reappraisal can only come through more
research to find which features are common to all environments, and which are unique to
one particular depositional environment, or to a specific research site.
This research represents a case study of depositional and erosional processes operating
within a contemporary, high energy fjord-head delta. Previous studies which have
examined the nature of estuarine deposition have concentrated on environments within
which tides exert considerable control. It is not yet fully known whether the conclusions
drawn from these studies can be applied to high-energy environments which are
controlled by fluvial rather than tidal action. Fjords are excellent locations in which to
study this problem, as fjord-valley rivers commonly are high energy systems which
control both the supply of sediment to the delta and its subsequent erosion. Syvitski and
Skei (1983) state that fjords provide a detailed sedimentary record of both terrestrial and
marine processes and dynamics. Presumably, delta stratigraphic sequences will also
reflect the interaction of these two processes, and their relative dominance, though these
questions have not been fully investigated.
The remainder of this chapter is organised into a literature review, a statement of aims,
and a description of the study area. The literature review first attempts a summary of
sedimentary criteria which are considered diagnostic of tidal deposits. Discussion will
also centre on the changing focus of research over time, and the current state of
knowledge. The chapter concludes with two sections on sedimentologic research
specific to estuarine environments, and to fjord deltas.
Literature Review
Recognition of Tidal Deposits
Tidal deposits are genetically defined as sediments deposited in water influenced by
tidal flux. It is important to note that these deposits need not display any characteristic
sedimentary evidence of their tidal origin, although discussion in this section clearly will
have to be restricted to those which do. Tidal deposits may form in a variety of
environments, both inter- and subtidally, and are detectable at a variety of scales. These
scales range from millimeter thick mud drapes and small-scale reactivation surfxes, to
the scale of environmental systems represented by coastal shelf or estuary. The
following discussion summarises those features which have been recognised as
diagnostic of tidal influence, and synthesises the most important research to date. It
should be stressed at this point that there is a clear distinction to be made between
sedimentary criteria which are diagnostic of tidal influence, and sedimentary deposits
which are unequivocally tidal in origin. This point will be discussed in more detail in
later sections.
There have been a number of different approaches to the study of tidal deposits. The first
studies which examined the extent of tidal sedimentary control were small-scale
descriptive studies of specific features observed in the intertidal zone along the coast of
northwestern Europe. As few of these studies were published in English, however, their
importance was not fully realised until Hiintzschel published a synthesis of European
research in 1939 (Klein, 1976). Post-war research into the origin and character of
intertidal deposits was led by van Straaten, who published numerous papers describing
intertidal facies assemblage (van Straaten, 1950a, b, 1953, 1954, 1959), later followed
by Evans (1965) and Reineck (1967, 1972). The aim of these early studies was to
identify zones or subenvironments within the intertidal zone. These subenvironments
were differentiated on the basis of morphology, and internal structure. The range of
deposits covered by these studies included tidal channels, tidal flats, and salt marsh
deposits. While local variability was commonly observed to be great, typical lithofacies
assemblages were often produced, showing the upward transition from tidal channel to
salt marsh (eg. Yeo and Risk, 198 1).
Major advances in the understanding of tidal sedimentation were made in the 1960s
from a series of papers which discussed inshore subtidal deposits from the North Sea
Basin (Belperio and Nio, 1988). These studies were found to be of greater importance to
geologists than previous work, as most of the tidal deposits preserved in rock are of
subtidal origin, a consequence of their higher preservation potential than intertidal
deposits (Nio and Yang, 1991). Vertical sections, such as those presented by Yeo and
Risk (1981) and Reineck and Singh (1980) not only show the nature of subtidal deposits,
but also the transition from subtidal to intertidal environment (preservation permitting).
The following discussion will focus on those deposits which are considered diagnostic
of tidal deposition. The results of early descriptive studies of tidal flat sedimentation will
be presented first, followed by results of research conducted on inshore subtidal
estuarine deposits.
Bedding in Tidal Flat Sediments
The discussion of tidal flat sedimentology is organised into three sections: intertidal
flats, tidal channels, and salt marshes, following van Straaten's (1959) tripartate
subdivision of modern tidal flat environments.
Intertidal flats
Many bedding types may be preserved in the sediments of intertidal sand flats. Cross-
bedded sands produced by the migration of current ripples are the most common
deposits. Climbing ripple lamination is very rare, and restricted to areas of high current
activity and an abundance of sand, such as areas close to gully mouths. Climbing ripple
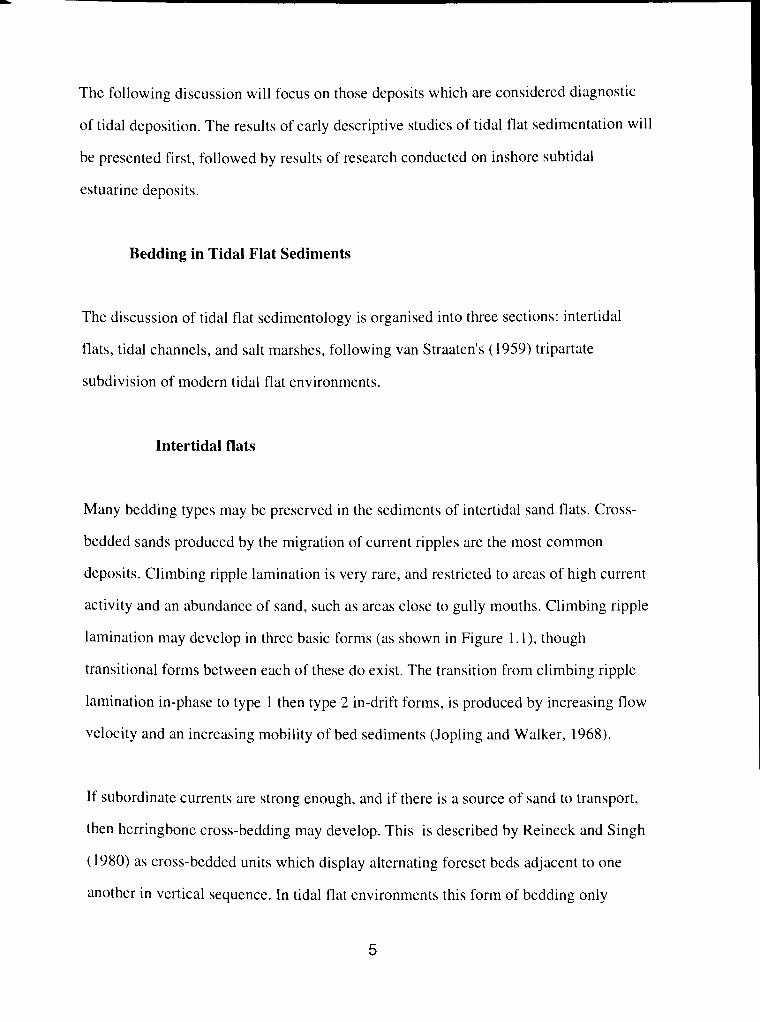
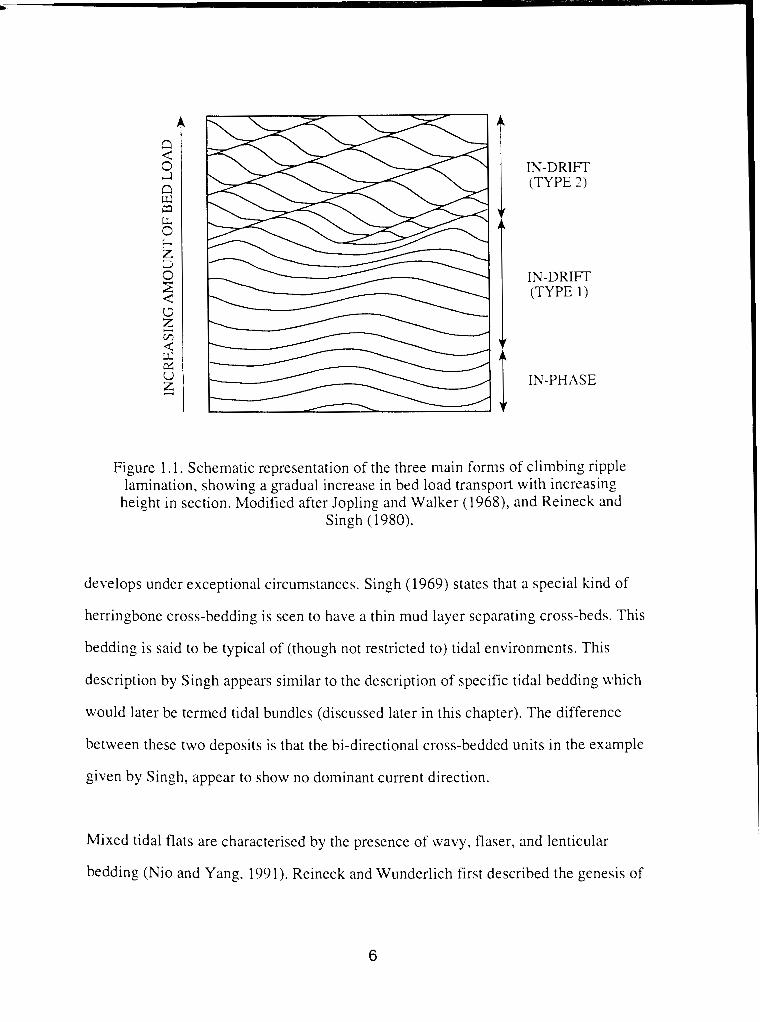
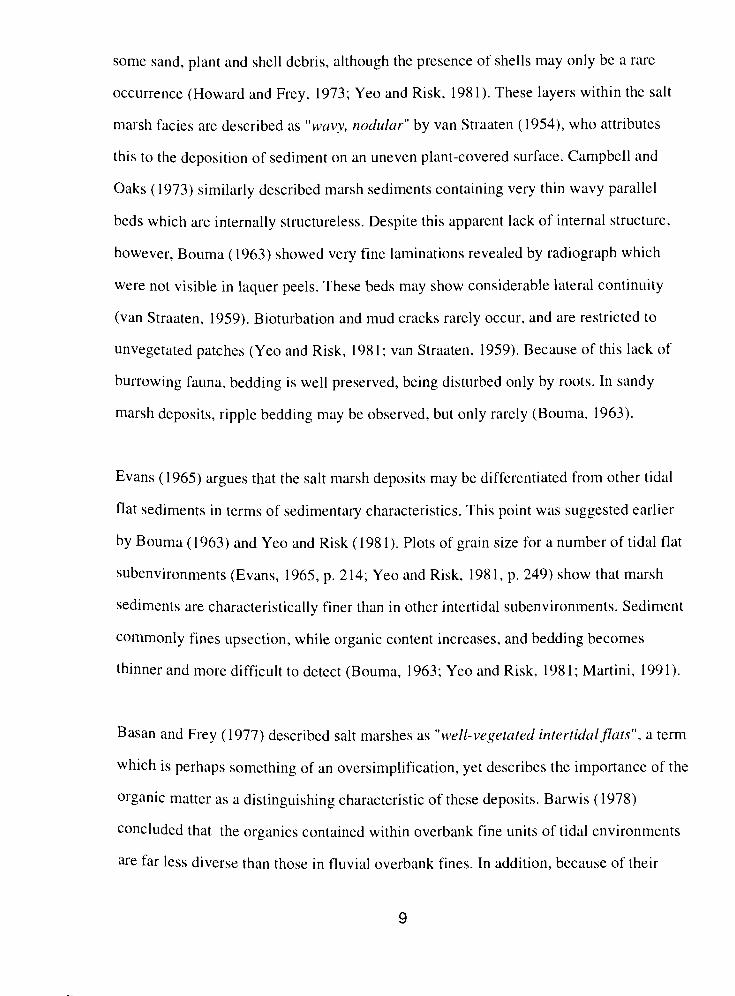
lamination may develop in three basic forms (as shown in Figure 1. l) , though
transitional forms between each of these do exist. The transition from climbing ripple
lamination in-phase to type 1 then type 2 in-drift forms, is produced by increasing flow
velocity and an increasing mobility of bed sediments (Jopling and Walker, 1968).
If subordinate currents are strong enough, and if there is a source of sand to transport,
then herringbone cross-bedding may develop. This is described by Reineck and Singh
(1980) as cross-bedded units which display alternating foreset beds adjacent to one
another in vertical sequence. In tidal flat environments this form of bedding only
i IN-DRIFT (TYPE 2 )
IN-DRIFT (TYPE 1 )
i IN-PHASE
Figure 1.1. Schematic representation of the three main forms of climbing ripple lamination, showing a gradual increase in bed load transpoll with increasing
height in section. Modified after Jopling and Walker (1968), and Reineck and Singh (1980).
develops under exceptional circumstances. Singh (1969) states that a special kind of
herringbone cross-bedding is seen to have a thin mud layer separating cross-beds. This
bedding is said to be typical of (though not restricted to) tidal environments. This
description by Singh appears similar to the description of specific tidal bedding which
would later be termed tidal bundles (discussed later in this chapter). The difference
between these two deposits is that the bi-directional cross-bedded units in the example
given by Singh, appear to show no dominant current direction.
Mixed tidal flats are characterised by the presence of wavy, flaser, and lenticular
bedding (Nio and Yang, 1991). Reineck and Wunderlich first described the genesis of
these deposits in 1968. They state that these will form in environments in which sand
and mud are available, under conditions of fluctuating current activity. As both these
conditions are met within tidal environments, wavy, flaser, and lenticular bedding are
commonly observed. The sand contained within these structures may indicate
unidirectional or bi-directional flow. Despite this, however, these deposits again are not
unique to the tidal environment, as they have been observed in modern fluvial point bar
deposits (Woodyer et nl., 1979; Calverley, 1984).
In some modern tidal flats, current ripple bedding is not distinguishable in any form. In
these cases, extremely finely laminated or thinly interlayered bedding may be observed.
These are general descriptive terms for bedding comprised of alternating thin layers of
material which differs in texture, composition, or colour. These rhythmic variations of
sediment are produced by pulsations in current activity or in sediment production. They
may be formed over a variety of time scales from short-term fluctuations in current
activity, through tidal cyclicity, to seasonal changes of flow characteristics (Reineck and
Singh, 1980). Rhythmic bedding produced by tidal fluctuations is termed tidal bedding
(Johnston, 1922). In these deposits, the mud and sand layers, which may be less than one
millimetre thick, are deposited during slackwater periods, and during flood and ebb tides
respectively. Unfortunately, without further evidence of tidal influence, tidal bedding
can be extremely difficult to distinguish from other forms of thinly interlayered rhythmic
bedding, which may form in non-tidal environments (Reineck and Singh, 1980).
Tidal Channels
In stratigraphic sequence, tidal channels are seen eroding into salt marsh and intertidal
flat deposits. Megaripple bedding commonly is found in tidal channels (van Straaten,
1950b; Klein, 1967; Reineck and Singh, 1967). Megaripple bedding is similar in form to
ripple bedding, differing only in size, and is produced in any environment which has
high enough energy conditions to form megaripples. Thus, while megaripple bedding is
common in subtidal environments, it is not restricted to them, and so can only be used as
a possible indication of tidal influence. As water flows over the ripple surface, a
backflow current is produced by the vortex shed from this obstacle. If the obstacle is
large enough, as in the case of a megaripple (greater than 60 cm in length (Simons et ul.,
1965)), these backflow currents may be great enough to transport material against mean
flow. This produces backflow ripples (Boersma et al., 1968), which may develop into
climbing ripples. As the tidal channel bed is subaqueous through all stages of the tidal
cycle, wave ripple structures generally are absent, with the exception of weakly
developed structures in shallow water (van Straaten, 1959). Because tidal channels
remain inundated throughout the tidal cycle, there is a lack of emergence features such
as animal tracks and dessication cracks. In addition, bioturbation structures are of far
less importance than those found within intertidal flat sediments.
The inaccessibility of modern tidal channel deposits prevented more detailed description
of sedimentary structure in these pioneering studies. Far more detailed descriptions from
studies in the Netherlands, which examined recent subtidal deposits exposed in a
construction trench, are reported later in this chapter.
Salt Marsh
Salt marsh deposits are described in terms of their structural and textural properties,
organic composition, and their stratigraphic position relative to other tidal flat deposits.
Evans (1965) stated that salt marsh deposits comprise well-laminated silty-clays with
some sand, plant and shell debris, although the presence of shells may only be a rare
occurrence (Howard and Frey, 1973; Yeo and Risk, 198 1). These layers within the salt
marsh facies are described as "wavy, nodular" by van Straaten (1954), who attributes
this to the deposition of sediment on an uneven plant-covered surface. Campbell and
Oaks (1973) similarly described marsh sediments containing very thin wavy parallel
beds which are internally structureless. Despite this apparent lack of internal structure,
however, Bouma (1963) showed very fine laminations revealed by radiograph which
were not visible in laquer peels. These beds may show considerable lateral continuity
(van Straaten, 1959). Bioturbation and mud cracks rarely occur, and are restricted to
unvegetated patches (Yeo and Risk, 1981; van Straaten, 1959). Because of this lack of
burrowing fauna, bedding is well preserved, being disturbed only by roots. In sandy
marsh deposits, ripple bedding may be observed, but only rarely (Bouma, 1963).
Evans (1965) argues that the salt marsh deposits may be differentiated from other tidal
flat sediments in terms of sedimentary characteristics. This point was suggested earlier
by Bouma (1963) and Yeo and Risk (1981). Plots of grain size for a number of tidal flat
subenvironments (Evans, 1965, p. 2 14; Yeo and Risk, 198 1, p. 249) show that marsh
sediments are characteristically finer than in other intertidal subenvironments. Sediment
commonly fines upsection, while organic content increases, and bedding becomes
thinner and more difficult to detect (Bouma, 1963; Yeo and Risk, 198 1; Martini, 199 1 ).
Basan and Frey (1977) described salt marshes as "well-vegetated intertidal.flats", a term
which is perhaps something of an oversimplification, yet describes the importance of the
organic matter as a distinguishing characteristic of these deposits. Barwis (1978)
concluded that the organics contained within overbank fine units of tidal environments
are far less diverse than those in fluvial overbank fines. In addition, because of their
estuarine setting, they will also be halophytes. Salt marsh deposits, which Barwis terms
"Spartinu-rooted muds" commonly contain little else other than Spartina. Occasionally,
small organic ditritus termed "coflee ground" organics may be present in the sediments,
particularly where peat is being locally eroded (Buller and Green, 1976). Evans ( 1965)
argued that the salt marsh environment may be differentiated from others on the basis of
the amount of plant debris, as well as its diversity. The overbank units within tidal
environments are said to be thicker than those in fluvial reaches of rivers (Thomas et ul.,
1987), with the exception of high suspended-sediment rivers (Woodyer et al., 1979;
Jackson, 198 1). This distinction reflects differences in flood frequency, and very
different velocity-stage relationships between the two environments (Barwis, 1978).
In rock sequences, identification of salt marsh deposits is often made from an
examination of the stratigraphic position of the facies in relation to bounding facies. For
example, Rahmani (1988) based his interpretation of salt marsh primarily on its position
between intertidal flat and swamp deposits.
Research in Modern Estuarine Environments
Estuarine deposits are characteristic in that they display the transition from fluvial to
marine environments in a transgressive sequence. This transition may be seen both
laterally and vertically. The bulk of research in estuarine environments has focused on
vertical facies associations in subtidal deposits. This line of research began with work
published by Oomkens and Terwindt in 1960, which reported an idealised section from
the lower estuarine reach of the Rhine and Maas rivers. This research created renewed
interest in subtidal deposits which had largely been neglected by previous workers. The
discussion below is an attempt to describe an idealised section of subtidal to intertidal
deposits, based on the work of Oomkens and Terwindt (1960) and others.
At the base of the idealised section, a coarse lag of shell debris and well-rounded clay
pebbles overlie an erosional base (Bosence, 1973; Barclay and Davies, 1989). The shell
and pebble debris may be imbricated in the direction of dominant flow (van Straaten,
1959). These deposits lie beneath large-scale cross-bedded deposits of coarse sand.
Internally, these sandy foreset beds may contain evidence of bi-directional flow,
separated by thin clay drapes, shell beds and peat lumps (Oomkens and Terwindt, 1960;
Land and Hoyt, 1966; Van Beek and Koster, 1972; Goldring et al., 1978). The
preservation of these clay layers is related to the scour-lag effect, whereby the ebb tides
are unable to erode material brought in by the flood tides (van Straaten and Kuenen,
1957). The fact that these clay layers can develop to such thicknesses during one tidal
cycle may point to the importance of flocculation and aggregation of suspended particles
in estuarine waters (Haven and Morales-Alamo, 1972; de Mowbray and Visser, 1984).
These cross-bedded sands may also be characterised by a high frequency of reactivation
surfaces (Terwindt, 1981), which may show evidence of bi-directional flow. These
deposits are interpreted as being laid down by migrating megaripples in a flood-
dominated tidal channel. Above this facies, both wavy and tidal bedding are reported
(Oomkens and Terwindt, 1960) with occasional flaser (Van Den Berg, 198 1) and
lenticular beds (Terwindt, 1971), which are interpreted as being subtidal in origin. This
bedding has been described in detail by Kasse (1986), who examined a one metre laquer
peel taken from the bedding unit described above. Van Beek and Koster (1972) describe
a very similar sequence which they interpret to represent a gradual change in
environment from tidally-influenced channel to sandy tidal flats. In the upper sequence,
f l a w lenticular, and wavy bedding are dominant, grading upward into tidal bedding at
the top of the sequence. Preservation permitting, this sequence is capped with salt marsh
deposits, which have been discussed earlier. With the exception of this upper-most
facies, this sequence is characterised by a general increase in bioturbation upsection.
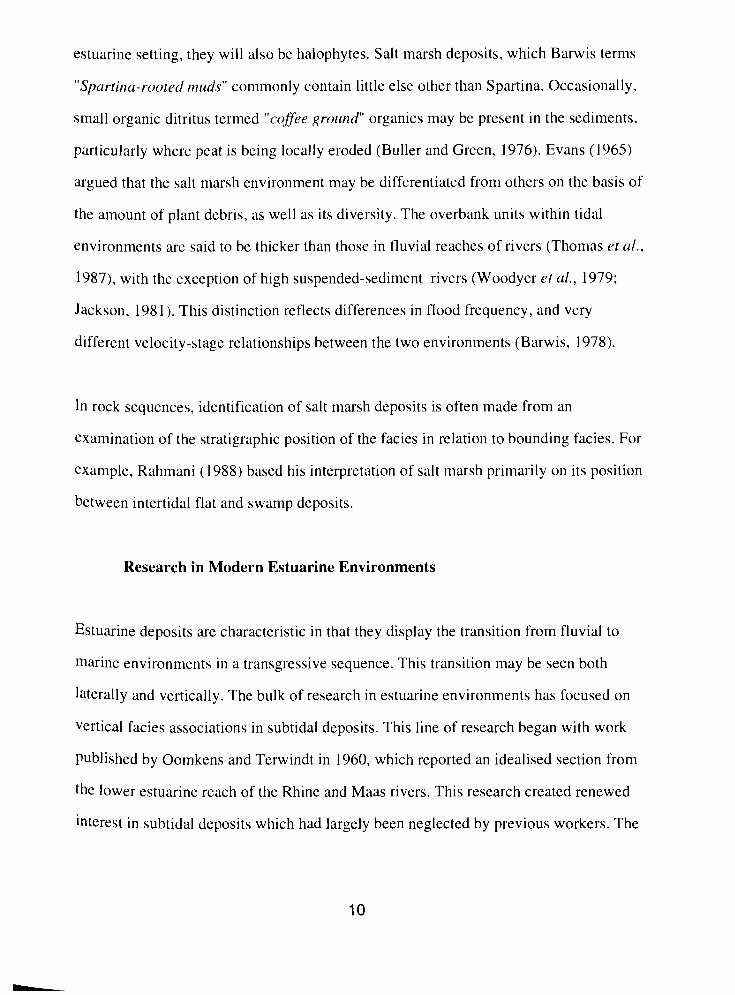
Evidence of marine biota and foraminifera is present throughout the section. Many of
the above features are shown in the idealised vertical section presented by Yeo and Risk
( 198 1 ), which is shown in Figure 1.2.
Bosence (1973) reported similar deposits from Lower Tertiary beds in southeast
England. The base of the estuarine channel was scoured and filled with large mud flakes
overlain by planar cross-bedding. This facies graded upward into cross-bedded silts and
sands with a 10 to 20 degree dip, containing flaser, lenticular, and wavy bedding. This
facies was previously described by de Raaf and Boersma (197 I ) , and was interpreted as
estuarine point bar deposits. A more complete discussion of estuarine point bar process
and product is given by Thomas ~r (11. ( 1987). Point bar deposits which develop in
environments with strong tidal influence clearly differ from their fluvial counterparts.
Intertidal point bar deposits have been modeled by Bridges and Leeder (1976), and their
morphology and structure discussed in relation to tidal flow characteristics (de
Mowbray, 1983). A comparison of the point bar deposits of these two end-member
environments is made by Barwis ( 1 978).
It must be stated at this point that the discussion above is of an idealised section, which
may rarely be preserved in the rock record. Indeed, many authors feel that this sequence
is unlikely to be preserved in its entirety. Terwindt (1971) and Jouanneau and Latouche
(198 1 ) recorded great lateral variability in lithofacies, which are often difficult to trace
more than ten metres. Similarly, Goldring cjt (11. ( 1978) reported rapid facies changes in
Tertiary estuarine sediments, both laterally and vertically. Many researchers have
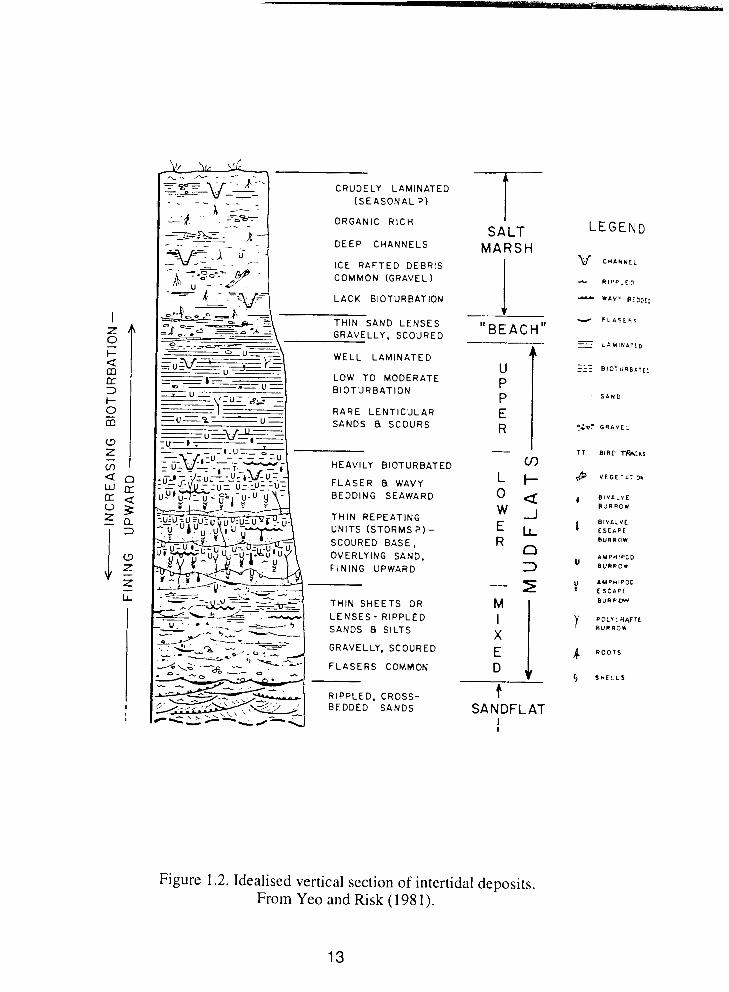
CRUDELY LAMINATED ( S E A S O N A L 7 )
ORGANIC R I C H
DEEP CHANNELS
ICE R A F T E D DEBRIS COMMON (GRAVEL)
-- h -- . LACK BIOTURBATION
T H l N SAND LENSES GRAVELLY, SCOURED
- (zur 8-7-
W E L L LAMINATED
LOW TO MODERATE ID
X U - B IOTURBATION
- 'i-- L= RARE LENTICULAR -u=2--u= SANDS 8 SCOURS
HEAVILY B lOTURBA l
F L A S E R 8 WAVY BEDDING SEAWARD
T H l N REPEATING UNITS (STORMS ?) - SCOURED BASE, OVERLYING SAND, FINING UPWARD
T H l N SHEETS OR L E N S E S - R IPPLED SANDS 8 SILTS
GRAVELLY, SCOURED
F L A S E R S COMMON
RIPPLED, CROSS- BEDDED SANDS
S A L T M A R S H
SANDFLAT 1
Figure 1.2. Idealised vertical section of intertidal deposits. From Yeo and Risk (198 1).
13
LEGE
, B I V A L V E B U R R O W
B l V A L V E E S C A P E B U R R O W
commented on the internal variability of various tidal subenvironments. Dalrymple rt N I .
( 1 99 1 ) stated that mudflat structures displayed considerable local variability, so only
general trends could be noted. Similar conclusions were made concerning structures in
the high intertidal flat zone (Syvitski and Farrow, 1983). This suggests that tidal
environments are characterised by great within-site variability (Howard and Frey, 19731,
making facies modeling a difficult task. In their attempt to distinguish between fluvial
and tidal deposits in a modern estuarine setting, for example, Land and Hoyt ( 1966)
were forced to conclude that there were more similarities in depositional product than
there were differences. Terwindt ( 198 1 ) reports that tidal deposits display an absence of
a general vertical macro-sequence, which agrees with the earlier observations of de Raaf
and Boersrna (I97 1). On a similar note, Campbell and Oaks (1973) note that the facies
cyclicity comrnonly noted in the fluvial environment generally are absent in estuarine
sediments. Fining-upward sequences cannot be said to be the norm within estuaries.
To conclude, tidal deposits seem to be characterised by a general lack of stratigraphic
order. The lack of order within estuarine sediments is not fully understood, but Goldring
et al. (1978) believe that it is because these environments are subject to many spatially
and temporally variable processes. The highly variable flow regime is caused by the
continuous alteration of flow by tidal currents, wave-induced currents, and by storm
. . events which may be either fluvial of marine in orlgln.
This flow variability can lead to the formation of reactivation surfaces. Klein ( 1970)
suggests that reactivation surfaces within sedimentary facies might be used as an
indicator of tidal influence. These features form in a number of environments (tidal and
non-tidal) which exhibit tlow unsteadiness. Klein states, however, that these surfaces in
tidal environrncnts are likely to show some degree of regularity. This regularity or
periodicity is produced by the rhythmic action of tides. This point was taken up by de
Mowbray and Visser (1984), who further opined that reactivation surface morphology
will differ depending upon the velocity of current action. In bi-directional flows where
one current is dominant, reactivation surface morphology may reflect tidal diurnal
inequality. If the dominant and subordinate currents are able to erode channel-bottom
sediments, reactivation surfaces may themselves be bi-directional (Nio and Yang, 199 1).
De Mowbray and Visser ( 1984) also argue that neap-spring cyclicity may be observable
in the cyclic variation in reactivation surface extent, which is determined by flow
velocity and water depth. Despite these statements, however, the authors conclude that
the interpretation of depositional environment must not be based on these criteria alone,
but should be considered within the general framework of the stratigraphic sequence of
deposits.
The above statement is typical of the cautionary notes given in papers which discuss
tidal deposition. For instance, Reineck and Singh ( 1980) state that none of the
sedimentary structures within tidal tlats are restricted to that environment. Similarly, de
Raaf and Boersma ( 197 1 ) discuss several sedimentary characteristics which are
diagnostic of intertidal and subtidal deposition, but none of these can be said to be
unique to tidal environments. Ginsburg ( 1975) grouped sedimentary structures which are
diagnostic of siliciclastic tidal flats into four categories. These categories comprised
sedimentary evidence of 1 ) flow reversals, 2) fluctuations in current velocity, 3)
intermittent subaerial exposure, and 4) alternating erosion and deposition. He stated that
if evidence from only two or three of these categories could be found, interpretation
should not be based on sedilnentologic evidence alone. Zaitlin and Schultz (1984)
similarly argue that interpretations of tidal deposits are based on a combination of
sedimentologic features and textures within sequences that comprise part of the regional
stratigraphic setting.
It is clear from the above discussion that there are many characteristics and attributes of
tidal deposits. Unfortunately, while a combination of many of these deposits points
almost conclusively to tidal deposition, no single deposit can be said to be unequivocally
tidal in origin. This statement accurately describes the state of research in tidal
environments prior to 1980. After this date, Visser's research on tidal bundles provided
the first unequivocal evidence of tidal deposition.
Tidal Bundles
The work of Visser ( 1980) is of critical importance to the field of tidal sedirnentology. I t
represents a reappraisal of the genesis of large-scale bedform deposits which Allen and
Narayan ( 1964) previously thought were laid down by dunes migrating during storm
events. These bedforms comprise superimposed, bi-directional cross-bedded sets, each
of which is separated by mud drapes. These mud drapes form couplets, which encase
cross-bedded sands deposited by the subordinate current. Visser states that the cross-
bedded sand units are deposited during successive flood and ebb tidal flows. The
dominant currents deposit more material on the slipface of the bedform (which Boersma
(1969) termed a bundle) than subordinate currents. These are separated (ideally) by thin
mud drapes deposited during slackwater periods (Terwindt, 197 I ) , and may be partially
or completely eroded by the following tide. The cross-bedded sands display rhythmic
variability in thickness, retlecting the fact that ebb current velocities exceed those of the
flood currents.
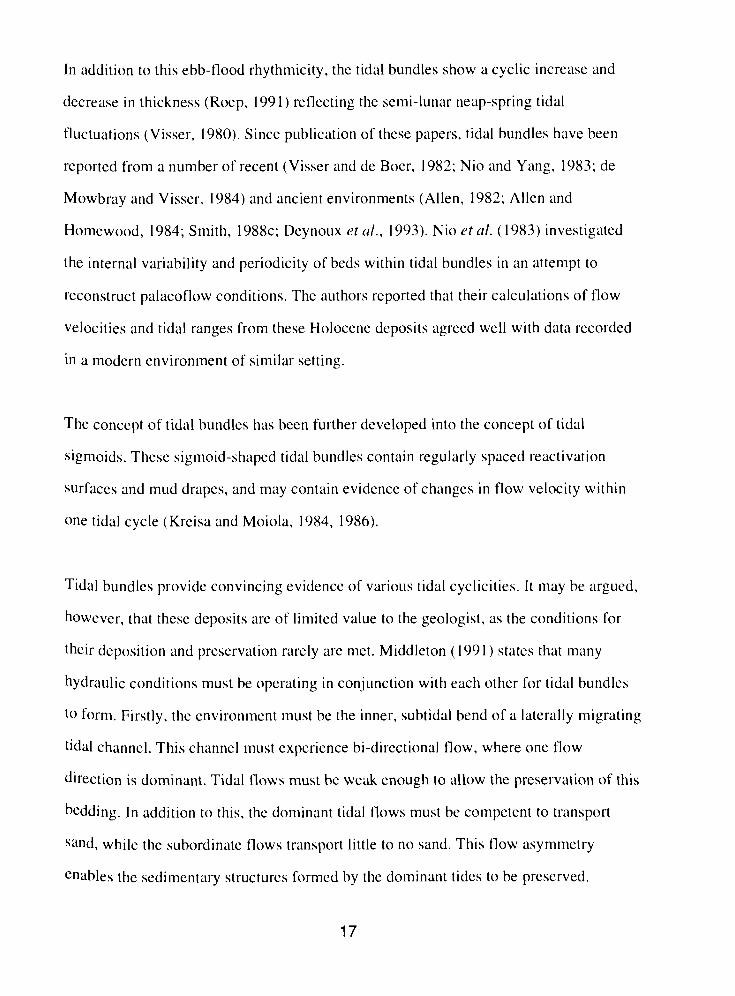
In addition to this ebb-flood rhythmicity, the tidal bundles show a cyclic increase and
decrease in thickness (Roep, 199 1) reflecting the semi-lunar neap-spring tidal
fluctuations (Visser, 1980). Since publication of these papers, tidal bundles have been
reported from a number of recent (Visser and de Boer, 1982; Nio and Yang, 1983; de
Mowbray and Visser, 1984) and ancient environments (Allen, 1982; Allen and
Homewood, 1984; Smith, 1988c; Deynoux et ul., 1993). Nio et (11. (1983) investigated
the internal variability and periodicity of beds within tidal bundles in an attempt to
reconstruct palaeoflow conditions. The authors reported that their calculations of flow
velocities and tidal ranges from these Holocene deposits agreed well with data recorded
in a modern environment of similar setting.
The concept of tidal bundles has been further developed into the concept of tidal
sigmoids. These sigmoid-shaped tidal bundles contain regularly spaced reactivation
surfaces and mud drapes, and may contain evidence of changes in flow velocity within
one tidal cycle (Kreisa and Moiola, 1984, 1986).
Tidal bundles provide convincing evidence of various tidal cyclicities. It may be argued,
however, that these deposits are of limited value to the geologist, as the conditions for
their deposition and preservation rarely are met. Middleton (199 1) states that many
hydraulic conditions must be operating in con-junction with each other for tidal bundles
to form. Firstly, the environment must be the inner, subtidal bend of a laterally migrating
tidal channel. This channel must experience bi-directional flow, where one flow
direction is dominant. Tidal flows must be weak enough to allow the preservation of this
bedding. In addition to this, the dominant tidal flows must be competent to transport
sand, while the subordinate flows transport little to no sand. This flow asymmetry
enables the sedimentary structures formed by the dominant tides to be preserved.
Finally, the environment must contain high concentrations of suspended mud which is
able to settle through processes of flocculation, agglomeration, or pelletisation.
Sedimentary structures which reflect neap-spring cycles have also been found in
different tidal environments. Tessier and Gigot ( 1989) found vertically accreted tidal
bundles in an abandoned channel. Huang and Wang (1987) reported flood-ebb
cyclicities in modern estuarine point bar deposits. In addition, neap-spring cyclicity may
be preserved in tidal laminites (Roep, 1991), which may form either inter- or subtidally.
These deposits, termed tidal rhythmites by Reineck and Singh ( 1980), are described in
an example from the Bay of Fundy (Dalrymple and Makino, 1989). They comprise
alternating sand and mud couplets, perhaps only millimetres thick, which represent
deposition during periods of tidal current activity and slackwater periods respectively.
Three orders of cyclicity are detected in these sediments, which are discussed fully by
Nio and Y ang ( 199 1 ). Similar deposits were reported from the ancient record by
Williams (1989), although they were only tentatively interpreted as being subtidal in
origin. Middleton (1991) concluded that these other forms of tidal rhythmicity are of less
value in geologic studies than tidal bundles, as well-developed cyclicities rarely are
preserved.
Transitional Environments: Fluvial-Estuarine Reaches of Rivers
Estuarine reaches of rivers are hydrodynamically complex systems affected by a variety
of processes. The interaction of fluvial and marine processes combine to produce
depositional sequences which cannot be classified as simply fluvial or marine in origin.
During periods of high discharges, estuarine reaches of rivers are dominated by fluvial
Processes which effectively dampen-out tidal intluence. During low flow conditions,
however, river flow may be markedly regulated by tidal cyclicities operating over
various time scales. Estuarine reaches of rivers then, are highly transitional
environments, and this may be expected to be reflected in stratigraphic sequences.
Within the past decade there has been a general recognition that these dynamic systems
cannot be described accurately by a generalised spatially static model. Previous attempts
to produce definitional lithofacies models for fluvial and deltaic environments are of
limited value in an estuarine environment. No single model can adequately describe an
environment which is characterised by considerable change throughout. Despite this
realisation, very few papers have attempted to identify sedimentologic evidence of
fluvial-marine transitions within estuaries. In 1980, King noted that studies of estuarine
sedimentation are limited in number and in scope, stressing the possible importance of
different estuarine environments. Because of this, sedimentary models of these
transitional environments are poorly developed (Nichols and Biggs, 1985). As these
papers are few in number, and are highly relevant to this research, each is worth
outlining in detail here.
The earliest English language papers to specifically examine the changing sedimentary
character of deposits across the fluvial-marine gradient were presented in a special issue
of Set~ckenber~iutt~l Muritirrzu in 1975. Diirges and Howard ( 1975) investigated
sedimentoIogical and biological indicators of the fluvial-marine transition in a Georgia
estuary. Examination of primary physical and biogenic sedimentary structures and
textures enabled the authors to delineate six depositional environments within the
estuary. These environments recorded the transition from tluvial-dominated, through
estuarine, to marine conditions. Each environment contained characteristic sedimentary
structures (shown more fully in Howard and Frey, 1975) and textural composition.

Boundaries between environments are described as gradational, so the facies
associations described for each environment are idealised. Primary sedimentary
structures revealed in box cores along the estuarine reach are shown in Dorges and
Howard (1 975, p. 168). The most important evidence of marine conditions are
interbedded sands and muds, increased bioturbation, and the presence of shells.
Howard et (11. (1975) studied a series of cores taken from 5 point bars along the same
estuary reach as the study above. These authors examined sedirnentological and
biological evidence of fluvial-marine transition from a fluvial-dominated environment to
marine-dominated. The estuary is subdivided into lower, middle, and upper regions on
the basis of chemical and hydrographic characteristics. Point bar sedimentary structures
and textures show a definite change along the length of the river, although no attempt is
made to define idealised sections from the established estuarine regions. Sediment
texture fines with increasing fluvial dominance, and the dominant structure changes
downstream to upstream from large-scale cross-bedded sands to ripple lamination,
wavy, flaser, and lenticular bedding, and to interlaminated mud and sand.
In 1978, Jackson noted discrepancies between reports of deposits found in modern
meandering point bar environments, and deposits reported from ancient point bar
environments. The most important discrepancy appeared to be that the epsilon cross-
stratified (ECS) deposits of modern point bars were dominated by sand, whereas most
ECS reported from ancient sequences contained regularly interbedded shales within
sandstone. These discrepancies prompted Smith ( 1987) to investigate point bar deposits
forming in several different depositional environments. Smith examined point bars
within low and high energy rivers, and within estuaries with varying degrees of tidal
influence. From this research, Smith notes that several lithostratigraphic trends exist
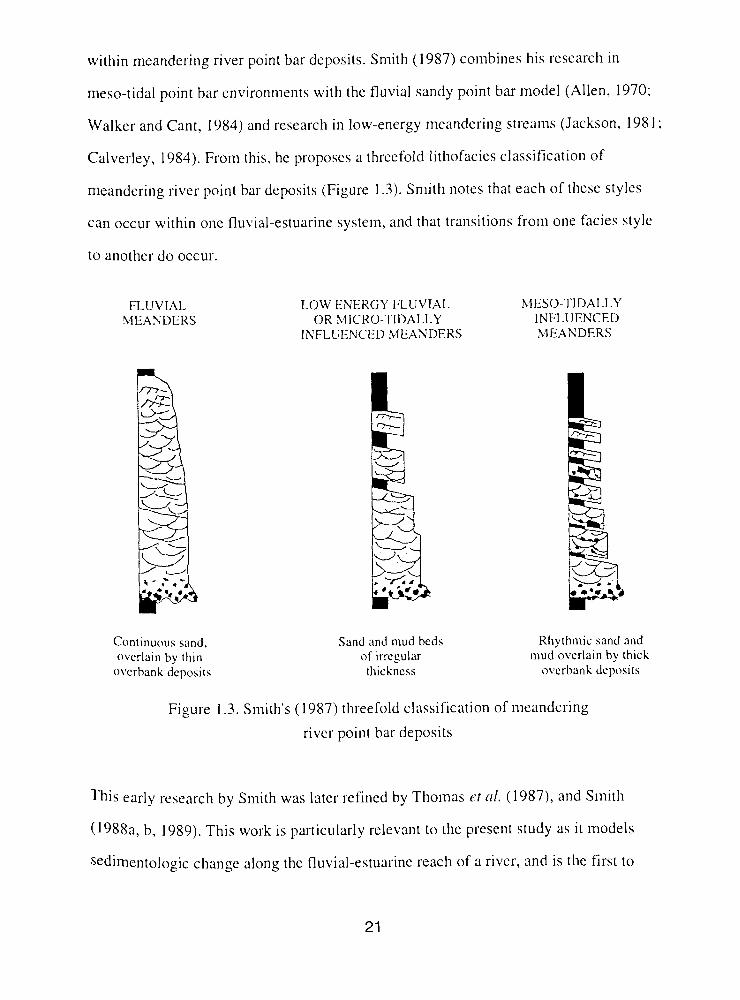
within meandering river point bar deposits. Smith (1987) combines his research in
meso-tidal point bar environments with the fluvial sandy point bar model (Allen, 1970;
Walker and Cant, 1984) and research in low-energy meandering streams (Jackson, 1981 ;
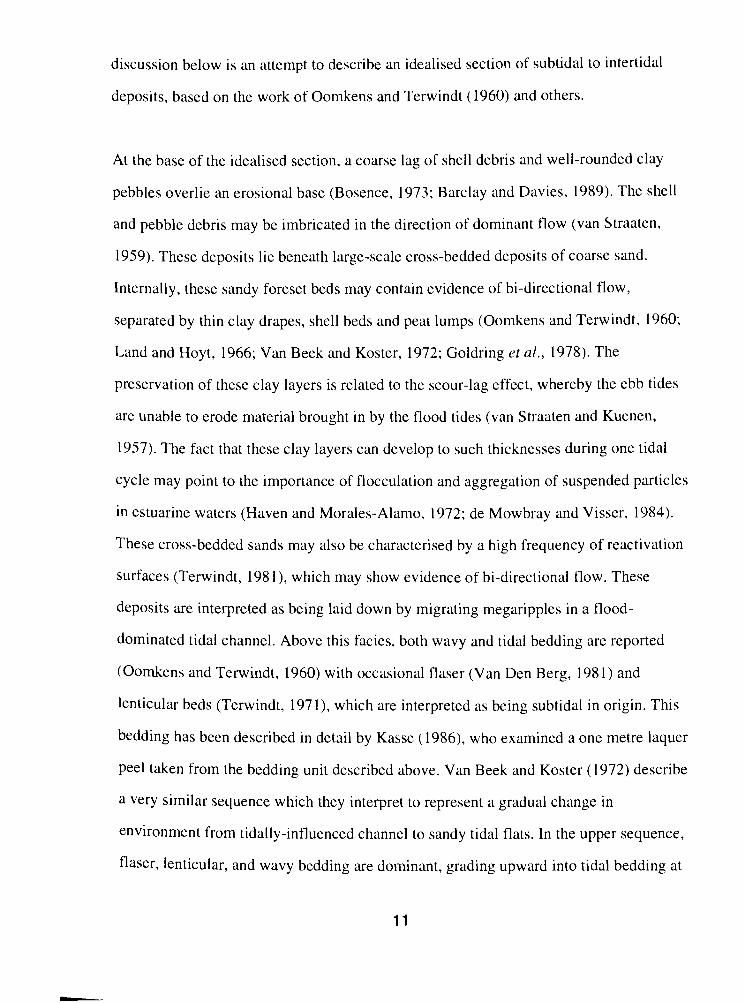
Calverley, 1984). From this, he proposes a threefold lithofacies classification of
meandering river point bar deposits (Figure 1.3). Smith notes that each of these styles
can occur within one fluvial-estuarine system, and that transitions from one facies style
to another do occur.
FLUVIAL MEANDERS
Continuous sand, overlain by thin
overbank dcposits
LOW ENERGY FLUVIAL hIESO-TIDALLY OR hIICRO-TIDALLY 1NFLUENCED
INFLUENCED MEANDERS MEANDERS
Sand and mud bcds of irregular thickness
Rhythmic sand and mud overlain by thick
o\wbank deposits
Figure 1.3. Smith's (1987) threefold classification of meandering
river point bar deposits
This early research by Smith was later refined by Thomas et 01. (1987), and Smith
(1988a, b, 1989). This work is particularly relevant to the present study as it models
sedimentologic change along the fluvial-estuarine reach of a river, and is the first to
develop a classification of fluvial influence based on sedimentary sequence. The most
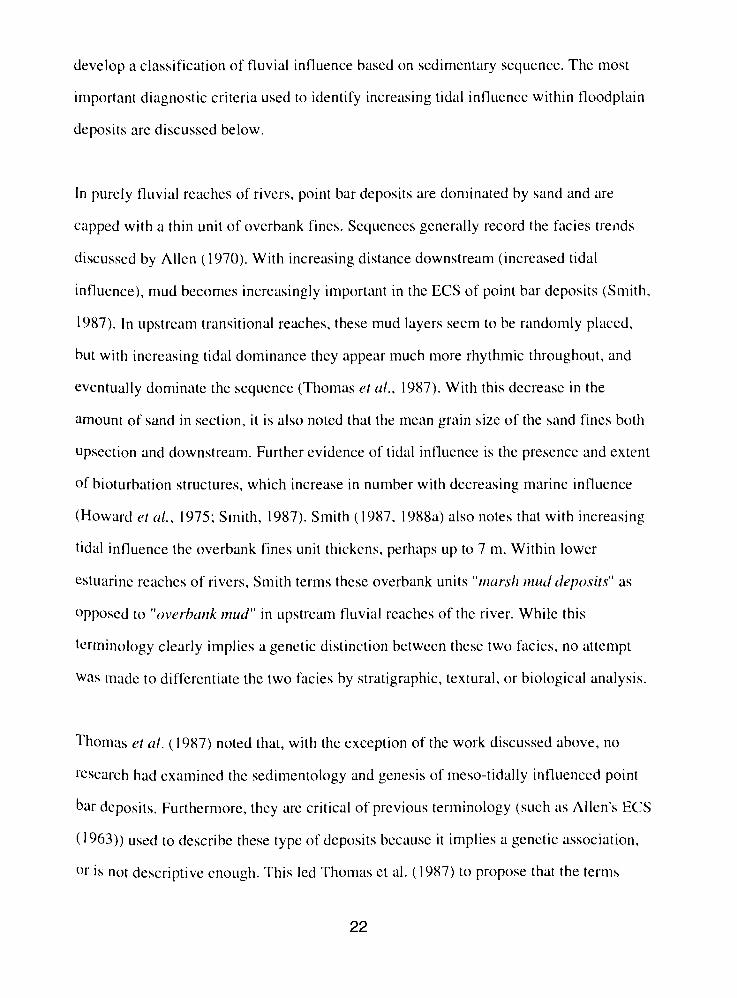
important diagnostic criteria used to identify increasing tidal influence within floodplain
deposits are discussed below.
In purely fluvial reaches of rivers, point bar deposits are dominated by sand and are
capped with a thin unit of overbank fines. Sequences generally record the facies tre~lds
discussed by Allen (1 970). With increasing distance downstream (increased tidal
influence), mud becomes increasingly important in the ECS of point bar deposits (Smith,
1987). In upstream transitional reaches, these mud layers seem to be randomly placed,
but with increasing tidal dominance they appear much more rhythmic throughout, and
eventually dominate the sequence (Thomas et al., 1987). With this decrease in the
amount of sand in section, i t is also noted that the mean grain size of the sand fines both
upsection and downstream. Further evidence of tidal influence is the presence and extent
of bioturbation structures, which increase in number with decreasing marine influence
(Howard et ul., 1975; Smith, 1987). Smith (1987, 1988a) also notes that with increasing
tidal influence the overbank fines unit thickens, perhaps up to 7 m. Within lower
estuarine reaches of rivers, Smith terms these overbank units "nlarslz mud (1tl)o~it.s" as
opposed to "overhank mud" in upstream fluvial reaches of the river. While this
terminology clearly implies a genetic distinction between these two facies, no attempt
was made to differentiate the two facies by stratigraphic, textural, or biological analysis.
Thomas et ctl. ( 1987) noted that, with the exception of the work discussed above, no
research had examined the sedimentology and genesis of meso-tidally influenced point
bar deposits. Furthermore, they are critical of previous terminology (such as Allen's ECS
( 1 963)) used to describe these type of deposits because i t implies a genetic association.
or is not descriptive enough. This led Thomas et a]. ( 1987) to propose that the terms

Inclined Heterolithic Strata (IHS) and Inclined Strata (IS) be used to describe "lurge-
scule, wuterluin, lithologicully heterogerzeous mid hornogerieou.s (respectively)
siliciclustic sedimentury sequences, whose constituerlt struta are irdirzed ut un originul
angle to the horizontul or pulueohorizoritul" (p. 125).
Since 1987, few authors have attempted to continue this line of sedimentologic
investigation in estuarine reaches of rivers. The most recent sedimentological studies of
modern fluvial-marine transitions have been undertaken by Allen (199 l), Nichols et (11.
(199 1 ), and Cooper ( 1993). Allen ( 199 1 ) reported results of new research in the Gironde
Estuary, and a summary of research previously published in French. Previous work has
suggested the division of the Gironde Estuary into three zones: upper estuary channel,
estuarine channel, and inlet. This tripartate zonation was initially based on
morphological elements, although each zone is said to contain distinct sedimentary
facies which reflect the transition from fluvial to tidal to tidal-wave energy regimes.
These facies associations are shown (Figure 1.4), and a longitudinal (down estuary)
facies section has been determined from cores (Figure 1 S). Fluvial sections are
dominated by gravel and sand point bar deposits overlain by silty-clays. With increasing
influence of tides, point bar deposits contain numerous mud interbeds and flasers. There
is also an increase in thickness of the overbank fines with increasing tidal influence. In
addition to these indications of tidal influence, which agree with those found by Smith
( 1987), Allen ( 199 1 ) found more sedimentologic evidence of tides in the sand bars of
the estuary funnel. These are listed as clay clasts, tidal bundles, reactivation surfaces,
clay drapes, and bi-directional cross-beds, all of which been discussed earlier in this
chapter. Very similar results are given by Allen and Castaing ( 1993) in their
Investigation of the fluvial-marine interface in the Garonne valley fi l l . The characteristic
tidally-influenced sand-mud IHS point bar deposits are said to be controlled by salt
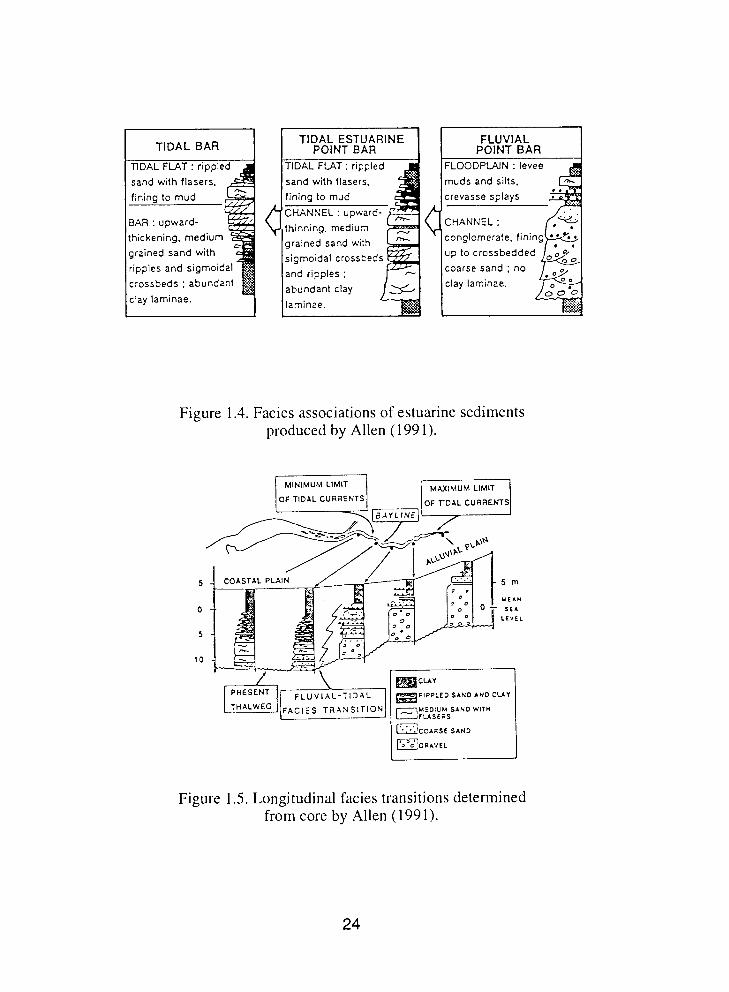
sand with flasers.
thickening, medium grained sand with up to crossbedded
Figure 1.4. Facies associations of estuarine sediments produced by Allen (199 1).
5
0
5
10
RIPPLED SAND AND CLAY
MEDIUM SAND WlTU
Figure 1.5. Longitudinal facies transitions determined from core by Allen (1991).
wedge intrusion and the consequent trapping of suspended-sediments within the
turbidity maximum. The significance of these results are discussed in relation to valley
fill lowstand, transgressive, and highstand systems tracts by Allen and Posamentier
( 1993).
Nichols et c d . ( 199 1 ) examined sedimentary facies within the microtidal James Estuary
from the bay mouth to the meandering tidal river. From this examination the authors
state that the estuary may be morphologically divided into three compartments. These
morphologic compartments are said to agree approximately with the tripartate zonation
of the estuary (sand-mud-sand) based on surficial sediment texture. Examination of
sedimentary facies led the authors to conclude that no structures are either limited to or
characteristic of any of the three zones identified. Nichols et ul. (1991) conclude that
facies appear more variable and complex within the meander zone (furthest upstream)
than at locations further seaward. They attribute this to increased energy conditions and
sediment supply within this zone of greatest fluvial influence.
The work of Smith (1987), and Thomas et al. ( 1987) has prompted a search for
analogous fluvial-marine estuarine transitions in the rock record. Rahmani ( 1988)
reported evidence of tidal intluence in a Late Cretaceous channel-fill sequence in
Drumheller, Alberta. He stated that documented evidence of estuarine channel-fill was
W r c e because they are difficult to recognise, and may easily be misinterpreted as fluvial
in origin. Rahmani's interpretation of tidal influence resulted from a detailed
Investigation of sedimentary structure and larger-scale stratigraphic analysis. Several
indicators of tidal influence are noted, the most important of which are evidence of
current bimodality (de Raaf and Boersma, 197 l) , mud couplets and tidal bundles
(Visser, 19XO), and rhythmic mud interbeds within the point bar IHS (Smith 1987:
Thomas et ul., 1987). Rahmani ( 1988) mapped the lateral and vertical facies
relationships exposed along this study reach, which records a gradual change from
fluvial, through coastal plain, to marine depositional environments. These facies
relationships have previously been recorded in modern (Jouanneau and Latouche, I98 1)
and recent (Oomkens and Terwindt, 1960) estuarine environments.
In a similar study, Herbert ( 1993) interpreted a fluvial to marine transition from
floodplain to barrier islands, tidal deltas, and tidal inlets. The main sedirnentological
evidence of increasing tidal influence is a longitudinal (parallel to palaeoflow) increase
in the number of shale interbeds within sandstone units, to the point where shale
dominates sequences. Further evidence of marine environment came from trace fossil
identification.
The most recent sedimentologic research within an estuarine environment is that of
Cooper (1993), who stresses the paucity of data regarding sedimentation within river-
dominated estuaries. Cooper worked within the Mgeni estuary, South Africa, which he
describes as a spatially static feature produced by a long-term balance between
sedimentation rates and relative sea-level rise. As this estuary is not a prograding form,
Cooper (1993) classifies it as a valley-fill sequence as opposed to a delta, as the valley
f i l l does not display the typical deltaic tripartate setlimentologic sequence typified by a
Gilbert-type delta. This static estuarine form is not accounted for by the classification of
coastal depositional environments developed by Boyd et ul. ( 1992).
Cooper ( 1993) states that river-dominated estuarine morphology is controlled spatially
and temporally by the river. In the tripartate division of estuaries by Dalrymple ' t d.
(1992), which is based on the relative importance of riverine and marine (tide and wave)
processes and associated energy levels, the central zone is that region where fluvial and
marine energy (primarily tidal current) balance in the long term. Cooper (1993) argues,
however, that within river-dominated estuaries this central zone is completely fluvially
dominated, resulting in an estuarine sequence which displays only a bipartate
longitudinal division of facies.
Limitations of Research in Tidal Environments
From the research undertaken by a number of workers in modern estuarine environments
to date, several common conclusions have been drawn. The general conclusion appears
to be that estuarine sedimentary structures do indicate their tidal origin, as sediment
texture and structure gradually change down estuary. There is also another common
theme to these studies. Some of the most important research has been conducted in the
Gironde Estuary (Allen, Jouanneau and Latouche), the Bay of Fundy (Dalrymple,
Makino, Middleton, Zaitlin), the Oosterschelde (Oomkens, Terwindt, Visser, de
Mowbray, Kasse) Ogeechee River (Howard and Frey, Dorges, Howard, Greer), and
Daule River (Smith). The common theme throughout these areas is that they all display
considerable tidal influence. These estuaries are characterised by tidal dominance over
fluvial processes throughout - at least toward their seaward edge. This is an extremely
important point because this relative dominance of tides drives the circulatory patterns
within these estuaries. As such, all of the systems mentioned above are characterised by
considerable flow reversals during tidal flood and ebb. Further to this, it can be said that
most of the sedimentary deposits which are noted as evidence of tidal influence are
Produced by these bi-directional flows.
Very similar conclusions may be drawn concerning much of the sedimentologic research
in tidal environments. It has already been shown that the only unequivocal evidence of
tidal deposition are tidal bundles. Without evidence of these, de Raaf and Boersma
(197 1 ) state that the most convincing evidence of tidal conditions are structures such as
herringbone cross-bedding. These deposits cannot form in environments where flow
reversals of some form do not occur. We can see from this that the sedimentary deposits
which are considered most indicative of tidal influence are produced under bi-directional
flow conditions. This fact has been used in the past as an aid in environmental
interpretation of ancient deposits. For example, in his description of an ancient
sandstone fluvial-dominated deltaic sequence, Pulham (1989) stated that "there is izo
evidence of reversingjjlows that might irzdicute tidal processes, ctizd therqfore the
channels are all con.sidered jluviul in origin" (p. 188). This interpretation clearly would
be invalid if these deposits formed in an environment subject to tidal flux but which did
not experience flow reversals.
The importance of the above discussion is that current research of estuarine
sedimentation and depositional product is inadequate. There is a need to expand the
range of environments under study, as we are not yet fully aware of the specificity of
estuarine models. For example, it is not known whether high energy fluvial-dominated
estuaries fit into the same model or category as that developed for Daule River by Smith
(1987). More research is required in environments where flow reversals do not occur,
such as those found in some fjord estuaries, for example. Results of a study by Smith
(1989) give an early indication that fluvial-dominated estuarine sediments bear little
resemblance to those within tidally-dominated systems.
Recent research by Dalrymple et al. (1992) highlights the need for greater understanding
of the full range of estuary types. These authors propose a conceptual framework for
estuarine classification based on a geologically-oriented definition of an estuary. The
reasoning employed in this paper, however, is somewhat flawed, resulting in an
incomplete definition and classification of estuaries. For example, Dalrymple et (11.
(1992) state that one of the primary distinguishing features of an estualy (as opposed to
a delta) is the landward movement of sediment derived from a marine source. The
authors go on to define an estuary as: "...the sectwcird portion (fa drownecr' vcilley sys te~~z
which receives sedinzent~from both Jluvictl emd ~?zctrim s o ~ r c e ~ e t ~ ~ d which co~zteii?z~$tcie~
~nfluerzced by tide, wave, and fluvial j~rocesses." (p. 1 132). Frotn this, an estuarine
classification system is proposed, which contains wave and tide-dominated categories,
but which ignores the riverine-dominated category. The authors justify this by stating
that riverine influence primarily determines sedimentation rate, but does not control the
system morphology, and presumably (though this is not explicitly stated) neither does it
control sedimentary sequence.
It is clear that there exist a number of estuarine environments which fail to be classified
as estuaries under the proposed classification system of Dalrymple et al. ( 1992). One
obvious example is that of fjord-head delta environments which develop estuaries, yet
which most commonly are progradational forms with a dominant seaward movement of
fluvially-derived sediment. Within these and other systems where riverine processes
dominate, it seems highly unlikely that riverine influence fails to control system
morphology or sedimentary sequence. Despite this statement, research in such fluvially-
dominated estuarine systems is limited.
Fjord estuaries provide similar contrast to many of the environments discussed in the
literature review on tidal deposits. This contrast is again related to the fluvial-dominance
of fjord estuarine systems, and concerns the transport of sediment into the delta
environment. Within most fjord systems, sediment input primarily is fluvial in origin. In
contrast, an important conclusion of early research in tidal flat environments is that most
of the sediment originates from a marine source, and is transported by tidal flows. This
is particularly true of studies undertaken within the North Sea Basin. It remains to be
seen how this difference in sediment source and transport affects the character of tidal
deposits.
Fjord Delta Sedimentation
Fjords are transitional regions between land and sea, regions of strong physical and
chemical gradients. These strong gradients also exist in terms of sediment distributions,
as coarse fluvial sands become finer seaward (Syvitski et al., 1987). Fjord systems are
dynamically unique environments. Because fjord-head deltas are laterally confined by
narrow valleys, littoral transport of sediment is negligible, and deltas are almost always
Progradational. Climate exerts strong control within fjords, as i t directly and indirectly
determines the nature of estuarine circulation, and sedimentation rates and patterns.
Wind is an important force in many fjords, as wind induced waves and turbulence can
create distinctly different circulation and sediment distribution patterns (Syvitski et d.,
1987).
Canadian mainland fjords are characterised by high input rates of sediment, large river
discharges which display high seasonal variability, and by strong winds. These
Processes operate within narrow (less than 3 km) valleys. Fjord-estuarine circulation is
driven by the fluvial input to the system, so is strong in summer months, but weak in the
winter when river flow is low. British Columbia mainland fjord oceanography is
discussed more fully in Pickard and Stanton (l980), and Thomson (I98 1).
The main input into ford systems is the input of freshwater and terrestrial sediment from
rivers. In most cases this input is primarily from one source, which enters the system at
the head of the fjord (Syvitski er al., 1987). As sediment enters this deep semi-enclosed
body of water, it is deposited rapidly, forming fjord-head (bayhead) Gilbert-type deltas.
The sedimentological character of the topset beds of these deltas is determined primarily
by 1) strength and periodicity of river flow 2) river thalweg slope 3) climate 4) relative
sea-level history 5) sediment supply 6) wave energy and direction and 7) tidal energy
(Syvitski et ul., 1987). Given the fact that fjords are defined, in part, by their
characteristic hydrologic and climatic regimes, deltas which form in these environments
may contain stratigraphic evidence of their fjord setting. In other words, the fjord
environment may impart a degree of control on sediment depositional form which is
detectable. and characteristic of that environment.
At present, i t is very difficult to state whether fjord deltas can be identified and classified
as fjord in origin based on sedimentologic evidence alone, as very few studies have
examined the sedimentology of fjord deltas. Fjord deltaic sedimentologic research has
focused on subaqueous prodelta and delta front depositional process and product
(Gilbert, 1982, 1983; Bogen, 1983; Kostaschuk and McCann, 1983; Bornhold and Prior,
1990). These papers discuss the genesis and morphology of the bottomset and foreset
beds, but do not mention topset beds. The most recent publication dedicated to fjords
(Syvitski et al., 1987) included 1,100 references, but only five of these discuss the
"dimentology of fjord delta topset beds. Two of these publications (Ovenshine et trl.,
1976, and Ashley, 1979) discuss rare and highly site specific conditions, and as such are
of little relevance to studies of modern, more typical fjord deltas. This lack of research is
despite the fact that fjord deltas may be ideal environments in which to study delta
topset beds (Syvitski and Farrow, 1983). This is because fjord estuaries are characterised
by low salinities and high rates of sediment accretion. This inhibits macrofaunal species
diversity and number, which increases the potential for sedimentary structures to remain
intact.
Of the few papers which have examined fjord delta topset beds from a sedimentologic
perspective, the paper by Syvitski and Farrow (1983) is the most interesting. In this
paper, the authors examine two bayhead deltas in terms of their subaerial sedimentary
structure, sediment character, and resultant lithofacies. They are able to distinguish a
number of "discrete depositionctl deltctic suherlvironrnerlts" on the basis of sedimentary
structure. These subenvironments show varying degrees of fluvial or tidal dominance.
The authors found that the two deltas were dissimilar with regard to physical structures
and facies development, despite the fact that they were similar in terms of the processes
Operating within, and building the deltas. Stratigraphic dissimilarity is believed to be
related to differences in the wave angle at the delta fronts, and differences in the two
river channel gradients (Syvitski and Farrow, 1983).
Bell (1975) divided the intertidal region of a fjord-head delta into three zones: upper
Intertidal, intermediate intertidal, and lower intertidal zones. General comments were
made regarding vegetation type, sedimentary structures, and bioturbation within each of
these zones, but no detailed sedimentologic analyses were undertaken. Similarly.
Kostaschuk and McCann ( 1983) divided the intertidal zone of the Bella Coola delta into
"umber of subenvironments, but this was based on morphologic rather than
stratigraphic evidence. Bartsch-Winkler et ul. (1983) recorded the progradation of a
fjord-head delta in core. The core was interpreted to represent a change in depositional
environment from subtidal, through intertidal, to supratidal fluvial deposition over a
period of 14 000 years.
An examination of abandoned Holocene fjord-head deltas can reveal well-preserved
stratigraphy of topset and foreset beds. Corner et al. (1990) describe the morphology and
sedimentology of an emergent fjord-head delta in Norway. At this site, topset and
foreset beds are revealed in raised delta terraces. While this is a fjord-head delta,
however, it differs markedly from most such deltas, as it is prograding into a wide fjord.
Because the delta is laterally unconfined, i t has the classic fan delta morphology.
Because of its unconfined nature, the delta plain may be divided into two zones:
fluvially-dominated, and wave and tide-dominated. Within high-energy confined fjord-
head delta systems, such zonation will be far less developed, and perhaps undetectable.
Postma and Cruickshank ( 1 958) describe the sedimentology of an abandoned Holocene
fjord delta in Norway. This delta, however, is also a fan delta which displays
considerable wave re-working of topset beds. These have been greatly eroded by wave
action during emergence, and replaced with a beach facies.
In conclusion, there are few reported investigations of the sedimentology of fjord-head
deltas, in contrast to the vast body of existing work within other delta environments.
There clearly is need for greater understanding of these depositional systems. Even one
Of the most recent classifications of coastal depositional environments (Boyd c.t (11..
1992) states that the classification system adopted does not specifically apply to fjord
"stems.
Aims of Research
The general objective of this research is to conduct a field study of the sediments in
Squamish River estuary and delta, in order to characterise the dynamics of sedimentation
within a high energy fjord-head delta environment. This study is undertaken with three
specific aims in mind:
1) to document the sedimentology of this fjord-head delta;
2) to determine the character of tidal and non-tidal deposits, and the interaction
between tidal and riverine depositional processes along the tidal gradient;
3) to determine the rate and character of Squamish delta erosion and accretion,
and the consequent preservation potential of estuarine and delta deposits.
These aims are addressed more specifically within the results chapters, and specific data
requirements are discussed within the proceeding methodology chapter. Sedimentologic
changes along the tidal gradient are determined from a number of detailed analyses of
"diments exposed in river banks at various sites along Squamish estuary. The rate and
Processes of delta erosion and accretion are determined from aerial photographs, erosion
pins and deposition stakes, and field observation.
Study Area
The study area chosen for this research is Squamish River, which enters Howe Sound
by the city of Squamish, 40 km north of Vancouver. The Squamish valley is a 150
km long glacially-cut, fault oriented valley running northeast-southwest within the Coast
Mountain Range of British Columbia. Squamish River and its main tributaries,
Cheakamus and Mamquam Rivers, drain over 3 600 km2 of the Coast Mountains. Where
Squamish River discharges into the fjord, all river flow is confined to one channel on the
western side of the delta; the valley is approximately 2 400 m wide.
The study reach of Squamish River and delta is shown in Figure 1.6. Toward the top of
this figure, Mamquam River confluence marks the approximate upstream limit of tidal
flux, and as such, the limit of the riverine estuary. Squamish delta is divided into a
number of sectors or distinct interdistributary bay environments labeled west, central,
and east deltas in Figure 1.6. Squamish central and east deltas are separated by the
central channel which once carried all Squamish and Mamquam River flow, but which is
now isolated from flow by the river training dyke (indicated).
The length of the riverine estuary is seasonally variable, and dependent on tidal height
and fluvial discharge. During winter months, when flows are low, the estuary extends
about 5 500 m upstream to the confluence of Squamish and Mamquam Rivers, and the
salt wedge intrusion may extend 1 500 m upstream (Levings, 1980). During summer
months, when river flow is higher, the estuary is shortened, and tidal influence is far less
evident. At discharges over 500 m3s-1, the salt wedge is pushed out of the river
altogether (Levings, 1980).
Squamish Estuary Tidal Regime
The tidal regime of Howc Sound and Squamish estuary is mixed semi-diurnal, typical of
the Pacific coast. The average tidal range is 3.2 m, with a maximum range of 5.1 m,
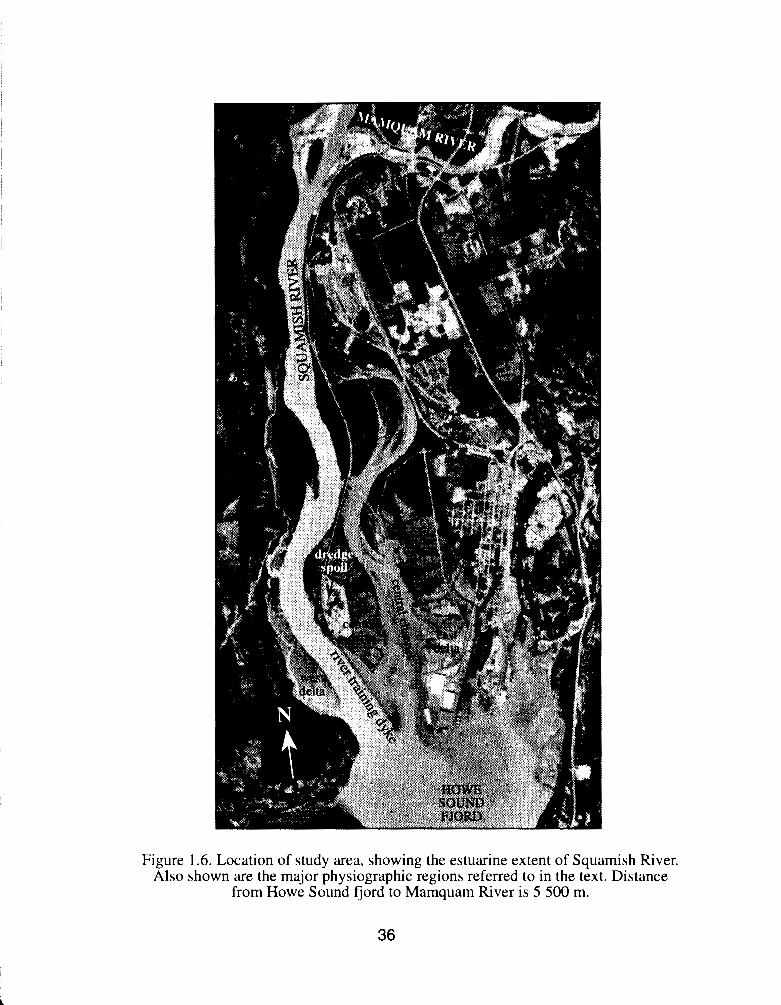
Figure 1.6. Location of study area, showing the estuarine extent of Squamish River. Also shown are the major physiographic regions referred to in the text. Distance
from Howe Sound fjord to Mamquam River is 5 500 m.
which classifies this estuary as macrotidal (Hayes, 1976). This tidal flux modifies river
flow in a number of ways; estuaries display large variability in flow velocity, water-
surface slope, and depth over a number of time scales. A number of these estuarine flow
characteristics are discussed below.
The purpose of this section is not to present an extensive review of the processes and
characteristics of tidal modification, but to determine the degree to which this particular
environment under study is influenced by tides. All results presented below are taken
from a study of Squamish estuary flow hydraulics undertaken by Babakaiff (1993).
With increasing distance down estuary, variations in discharge become of lesser
importance in explaining variations in flow velocities. This decreasing fluvial influence
is interpreted as evidence of a transition zone between fluvial and tidal environments
(Babakaiff, 1993). This effect is felt more on the tidal ebb than the tidal flood, where the
regions of tluvial and tidal dominance are less distinct. Maximum variability of surface
flow velocities occur at different times on the tidal flood and ebb, and are highly
influenced by tidal drop. As such, both flow velocity and variability vary with discharge
fluctuations, and with neap-spring variations in tidal drop. In addition, the timing of
velocity maxima during tidal flood and ebb (time-velocity asymmetry) display
variability with location within the estuary.
Water-surface slope data display similar temporal variability driven primarily by tidal
flux. During high and low tide periods, water-surface slopes are quite stable, while
considerable variability occurs during tidal rise and fall. This variability is poorly
explained by variations in discharge or surface flow velocities. Water-surface slope
variability appears greatest on the ebb tide, and slope increases are less rapid than those
during the flood tide. In addition, the rates of increase at one location in the estuary are
not the same as those rates recorded at other locations in the estuary. This highlights the
spatial variability which is induced by relative changes in the degree of fluvial and tidal
influence along this transitional reach. These slope data also reveal information
regarding tidal-wave asymmetry; flood tidal wave celerity is faster than ebb tidal-wave
celerity (Babakaiff, 1993).
Variations in depth of the estuarine water body are principally explained by tidal drop
and timing within the tidal cycle, though flood and ebb periods do not respond in exactly
the same manner. In addition, predictive models of depth for locations nearest the river
mouth differ from those developed for reaches further upstream. While flood and ebb
tide models differ, both show a decreasing importance of discharge toward the river
mouth, indicating that the estuarine reach may be broken down into a number of zones
(Babakaiff, 1993) which essentially indicate relative tidal influence.
In conclusion, the above results indicate the importance of tidal influence on flow
velocities, water-surface slope, and water depths within this estuary. These results also
highlight the fact that the estuarine reach is highly transitional, as tidal influence
increases with increasing proximity to Howe Sound. In addition to these results, one can
also expect the degree of tidal influence to vary seasonally. During summer months,
maximum tidal drop is greatest, yet tidal influence likely is less than in winter months.
Tides are less able to modify riverine flow during summer months because the high
discharges associated with freshet flows effectively dampen tidal influence. Although
tidal amplitudes are smallcr in winter, lower discharges increase the relative influence of
tidal modification. More detailed information regarding the seasonality of riverine flow
is given below.
Squamish River Hydrologic Regime
Mean annual discharge for Squamish River is about 300 m3 s-l, although discharges are
highly seasonal. Mean summer and winter flows typically vary from 600 m3 s-I to 100
m3s-I respectively (Hickin, 1989). Squamish River mean monthly discharge records a
high degree of seasonality. In summer months, discharges peak in association with the
snowmelt freshet. During winter months, discharges are, on average, lower than summer
months, as precipitation falls as snow over much of the catchment headwaters. There is,
however, a second peak in Squamish mean monthly flow which commonly occurs
between September and February. These floods, which are associated with intense
rainstorms falling on ice fields and frozen, relatively impermeable ground surfaces,
generally are larger (but of shorter duration) than summer freshet floods.
Suspended-Sediment Characteristics
Only limited conclusions can be reached concerning Squamish River suspended-
sediment concentrations, as little data have been collected. All results presented here are
taken from suspended-sediment load measurements made by the Water Survey of
Canada (WSC) in 1974 and 1975, and a limited number of surface grab samples
collected by Rood and Hickin (1989) in 1987-88. The total suspended-sediment loads
for these two years are estimated at 2.334 and 2.653 x 10⁹ kg respectively (Hickin.
1989). Analysis of the WSC data has been performed by Syvitski and Murray ( 198 l) ,
S~vitski ct al. (1987), and Hickin (1989). Hickin (1989) calculated that variations in
mean discharge explained 60% of the variance in suspended-sediment concentrations,
although the relationship does not hold for discharges below 200 i d s - I . Below this
level, suspended-sediment concentrations are independent of discharge. This explains
much of the 40% unexplained variance. Temporal analysis of the concentration-
discharge data for the years 1974-75 revealed considerable seasonal hysteresis (Syvitski
et ul., 1987), which led Hickin (1989) to determine two suspended-sediment rating
curves. The rating curve for the months April to July is associated with a period of rising
discharges with the onset of the freshet. Over this period, variations in discharge explain
90% of the variance in suspended-sediment concentrations. The rating curve for the
months August to March, however, shows an unexplained variance of 36%. Hickin
argued that this poor fit to the rating curve was related to heavily sediment-laden winter
storm events, which are superimposed on the general falling limb of the annual
hydrograph. These storm events, which commonly are larger than the maximum freshet
discharges, have been known to deliver over 20% of the total annual suspended-
sediment over a period of five days (Hickin, 1989).
An analysis of 13 suspended-sediment samples taken by the WSC (unpublished data)
showed an average composition of 58.2% sand, 37.4% silt, and 4.4% clay. More
detailed size analysis was performed by Syvitski and Murray (198 1) on samples
collected in summer and autumn of 1976 and 1977. The authors presented full grain-size
distributions of suspended particulates, and concluded that as the total suspended load
Increases, its mean grain size also increases. They also noted that very large daily
fluctuations in suspended-sediment concentrations can occur.
More recently, Rood and Hickin (1989) have shown that suspended-sediment
concentrations are greatly influenced by boil production in the estuary, and are variable
Over the tidal phase. This boil activity transports sandy sediments from the bed to the
water surface, and distributes them throughout the water column. Sediment sampling
both within and between these boils or surface disturbances, shows that boils inject
higher concentration, coarser material (than background levels) into the upper flow.
Rood and Hickin (1989) determined that the concentrations of sediment within and
between boils was dependent on flow velocity, and that the concentration of boils varied
with tidal phase. They concluded that boils are responsible for the suspension and
transport of coarse bed material in Squamish River flow, and that they play a key (if not
dominant) role in the determination of suspended-sediment concentrations and size-
distributions in Squamish estuary.
Effects of Wind
Wind plays an important role in Howe Sound fjord and estuary. During summer months,
heating of the land mass sets up strong land-sea breezes. The inflowing sea-breeze
velocities commonly reach 40 km per hour, with gusts up to 55 km per hour (Bell,
1975). These sea-breezes occur on at least half the days over the summer period (Hoos
and Vold, 1975), and can produce waves of considerable height. When combined with
incoming tide, waves approaching 2 m in height have been observed in the estuary.
These waves are surface instabilities, induced primarily by incoming tidal waters, which
then become enhanced by strong up estuary winds. These large tide- and wind-generated
waves are restricted to the estuarine channels; they do not form within the
interdistributary bay environment during periods of flood. nor do they spill over and
Onto the tidal marsh surface.
Nevertheless, these waves are of extreme importance to the circulation and sediment
distribution patterns at the river mouth. Buckley ( 1977) showed that strong up estuary
winds may produce reversing surface currents, which Syvitski and Murray (198 1)
suggest will increase the chance settling and deposition of material held within the
surface layer. They also state that even small winds can create enough turbulence to
prevent the settling of clay-sized material. Buckley and Pond (1976) investigated the
relative effects of wind, tide, and river flow on surface-water circulatory patterns within
Howe Sound. Their study shows that wind is the major factor influencing water-surface
velocities within the fjord. River flow was also noted as an important factor, but daily
variations in wind speed affected velocities an order of magnitude more than daily
variations in river flow and tides combined. It is important to note, however, that these
studies were conducted within Howe Sound fjord and so do not fully describe the
relative influence of wind, tide and discharge within the estuarine reach of Squamish
River.
Delta Sedimentation
Little data exist regarding sedimentation rates, process, or product in Squamish delta
intertidal and subtidal environments. Hickin (1 989) analysed bathymetric charts of the
delta front and prodelta environment taken in 1930, 1973, and 1984. Analysis of these
data showed that the delta is prograding at an average rate of 3.86 mlyr. Yearly advances
UP to 20 m, and retreats caused by mass movements may also occur in a given year
(Hickin, 1989). Bell (1975) states that the delta is prograding at a greater rate in the
western sector than in the east, reflecting the engineered source of sediment input. The
location of the river mouth to the western side of the delta also influences sediment-size
distributions across the delta front. Delta front grab samples show that sediment is
on the western side of the delta, and fines eastward, reflecting the sediment
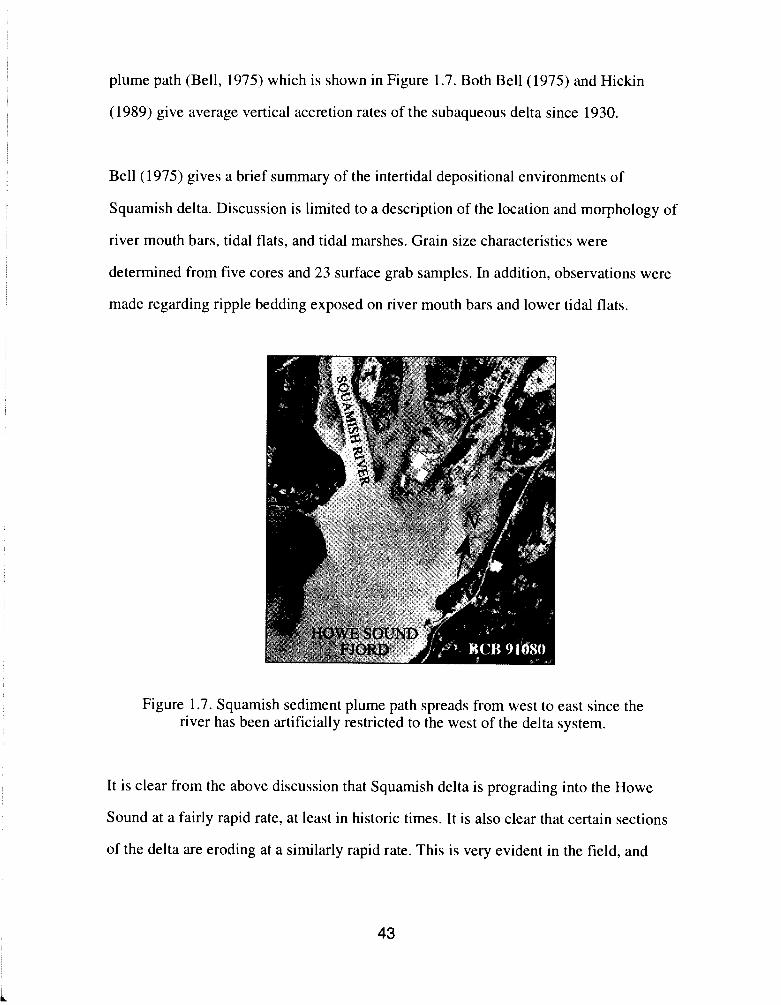
plume path (Bell, 1975) which is shown in Figure 1.7. Both Bell (1975) and Hickin
(1989) give average vertical accretion rates of the subaqueous delta since 1930.
Bell (1975) gives a brief summary of the intertidal depositional environments of
Squamish delta. Discussion is limited to a description of the location and morphology of
river mouth bars, tidal flats, and tidal marshes. Grain size characteristics were
determined from five cores and 23 surface grab samples. In addition, observations were
made regarding ripple bedding exposed on river mouth bars and lower tidal flats.
Figure 1.7. Squamish sediment plume path spreads from west to east since the river has been artificially restricted to the west of the delta system.
It is clear from the above discussion that Squarnish delta is prograding into the Howe
Sound at a fairly rapid rate, at least in historic times. It is also clear that certain sections
of the delta are eroding at a similarly rapid rate. This is very evident in the field, and
from an examination of aerial photographs. The nature of this erosion is quite complex,
as it appears to result from a combination of natural and anthropogenic processes. The
nature and rate of this erosion will be discussed in chapter five. The recent history of
delta building and erosion is discussed below, and has been divided into two sections,
reflecting the different processes operating within the delta environment. The aim of this
brief discussion is to highlight the processes operating within the delta environment with
a few cited examples. It is not intended as a complete inventory of stages of delta
building and erosion.
Delta Erosion
Channel Stability
The earliest aerial photographs of the Squamish delta date from around 1930.
Comparison of this and more recent aerial photographs documents changes to channel
planform and delta morphology. It is immediately clear from these photographs that
Squamish River and delta distributary channels are dynamic systems. They display
considerable channel shifting, as would be expected within such a high energy, steep,
laterally confined valley.
The first recorded planform changes in this region occurred during a large flood in 192 1 .
when Mamquam River avulsed westward. The river, which previously flowed to the east
of the town of Squamish, now enters Squamish River 5 500 m upstream from the river
mouth. Flow down the original Mamquam channel was greatly reduced, and had
completely stopped by 1946. This resulted in a depleted sediment supply to the east of
the delta, and enhanced the deposition of river mouth bars to the central and eastern
regions.
At this time, the main Squamish River flow passed through the central channel of the
delta, which is indicated in Figure 1.6. However, over the period from 1945 to 1972, a
combination of natural channel adjustment and human-induced change led to a total shift
of Squamish River flow to the western distributary channel. The human-induced
changes were significant, as discussed in the next section, but it seems highly likely that
they merely speeded-up the natural process of channel-shifting which would have
occurred anyway. This point can be seen clearly from an examination of the 1930, 1946,
and 1963 aerial photographs (Figures 1.8, 1.9, and 1.10). Figure 1.8 shows that a large
point bar is developing as this meander system migrates southwestward across the
valley. By 1958 (Figure 1.9) it is clear that this point bar has grown to the point where
flow cannot enter the channel during low-flow conditions, and has become stabilised by
vegetation. Despite this growth, flow at this time clearly was able to enter the central
channel during higher discharge periods, or even periods of moderate discharge and
combined high tide. Some evidence of the velocity of this flow is indicated by the
Presence of channel bedforms toward the upper limit of the partially-abandoned channel
reach. Tidal flows in this region are not considered strong enough to have produced
these bedforms. No data for this period exist regarding flow levels through the largely
abandoned channel during high tidal stages or flood periods. Any flow that did exist,
however, ceased by 1972, when construction of a river training dyke completely blocked
flow to the meander loop, as shown in Figure 1.10.
Anthropogenic Changes to the Natural System
Early development of the delta was restricted to the eastern sector, with the growth of
the town of Squamish and the Pacific Great Eastern Railway loading docks. Disturbance
of the western sector of the delta began in 1945, when the westernmost channel (now the
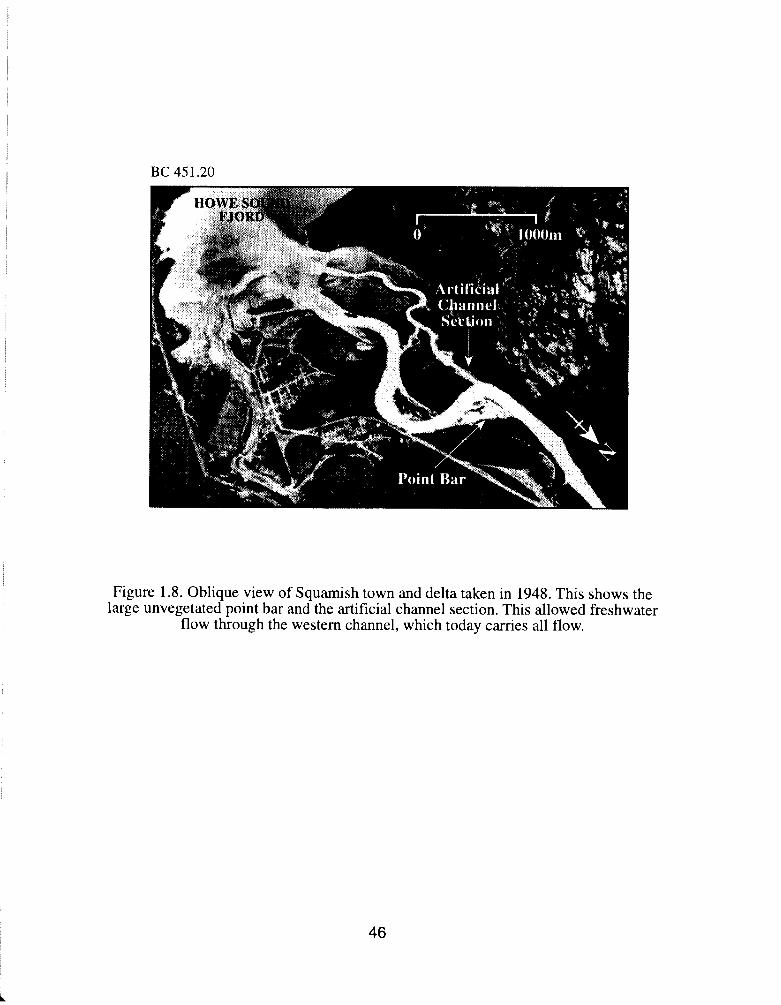
Figure 1.8. Oblique view of Squamish town and delta taken in 1948. This shows the large unvegetated point bar and the artificial channel section. This allowed freshwater
flow through the western channel, which today carries all flow.
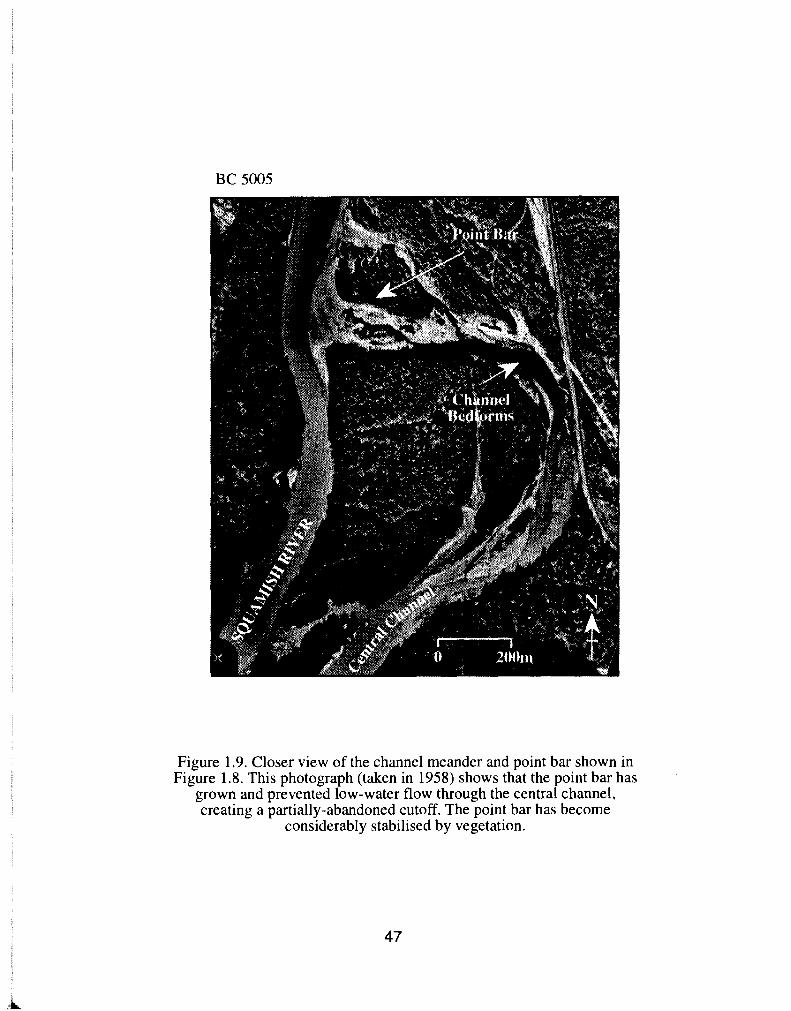
Figure 1.9. Closer view of the channel meander and point bar shown in Figure 1.8. This photograph (taken in 1958) shows that the point bar has
grown and prevented low-water flow through the central channel, creating a partially-abandoned cutoff. The point bar has become
considerably stabilised by vegetation.
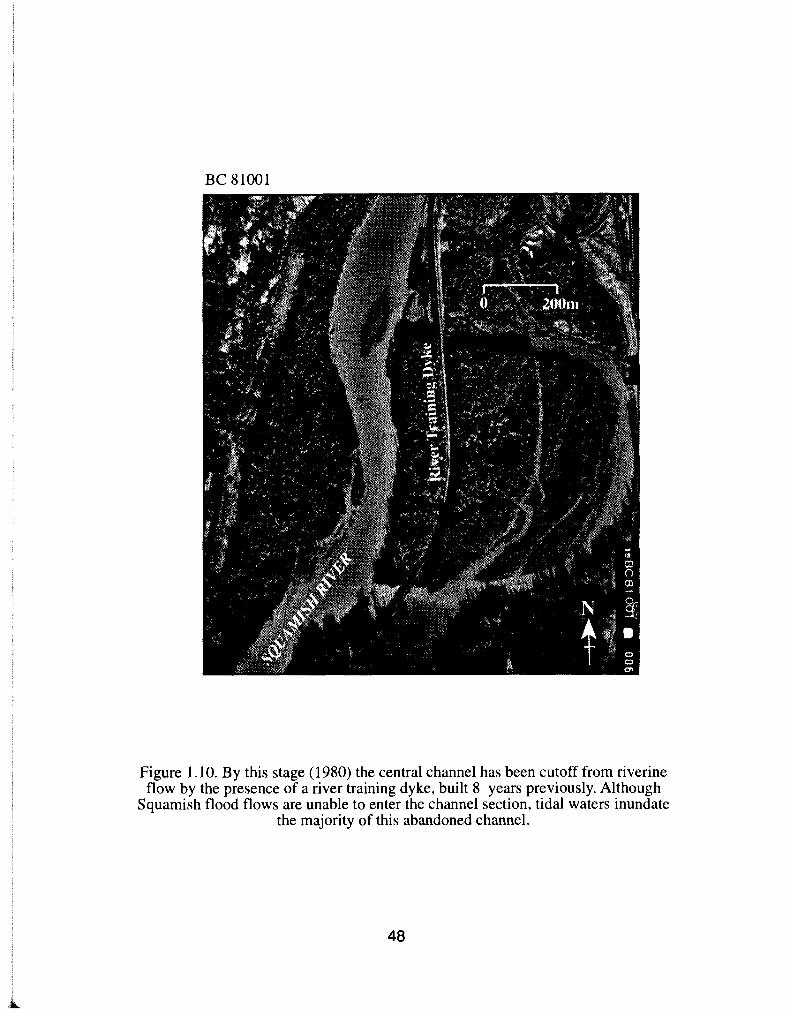
Figure 1.10. By this stage (1980) the central channel has been cutoff from riverine flow by the presence of a river training dyke, built 8 years previously. Although
Squamish flood flows are unable to enter the channel section, tidal waters inundate the majority of this abandoned channel.
main channel) was artificially connected to Squamish River. This stretch of artificial
channel can be seen in Figure 1.8. Bell (1975) states that this flow alteration would have
occurred naturally with time. He estimates that the channel meander would have
continued migrating southward under natural conditions, and opened up flow to the
Western channel by the 1960s. This artificial alteration of the flow regime was an
attempt to reduce the effect of possible flooding to the developed eastern sector of the
delta.
The main human disturbance to Squamish River and delta was caused by construction of
a river training dyke in 197 1-72. This dyke was the first phase of plans to develop a
harbour and coal loading facilities in the central delta region. The 6 000 m dike was
completed in June 1972, although construction of the harbour never went ahead. The
purpose of the training dyke was to control and restrict the extent of flooding and
Prevent siltation of Squamish Harbour. The dyke restricted river flow to the western
channel, and completely sealed off flow to the abandoned meander 3 500 m upstream
from the river mouth.
In addition to construction of the river training dyke, the lower reaches of the west
channel were dredged and artificially straightened in 1972. The Squamish Estuary
Management Plan (Government of Canada, 198 1) reported that over 250 000 cubic
metres of material was removed from a strip that extended from the river mouth to a
point 1 500 m upstream. Bell (1975) stated that this deepening of the western channel
through dredging enhanced salt-wedge intrusion. This was only a short-term response,
however, as Zrymiak and Durette ( 1979) reported that the dredged area had been
completely filled by 1978.
Bell (1975) noted that construction of the dyke resulted in changes in the modes of
sediment transport and deposition in the west and central deltas, which was reflected in
the surficial sediment-size distributions. Bell qualified this statement, however, by
noting that delta sediment-size distributions prior to construction were not known. The
training dyke has also altered salinity distributions across the delta. Because of the
isolation of flow to the west of the delta, the central and east deltas now experience more
saline conditions. Despite this change in salinity regime, however, Levings (1980)
reported that no changes to the distribution or composition of the west and central delta
communities had occurred. Bell (1975) also noted that the training dyke may act as an
effective breakwater protecting parts of the central delta from intense wave action during
%+breeze events.
Since construction and dredging in 1972, a large river-mouth bar has been building off
the western section of the delta (Government of Canada, 198 l) , although part of this
build-up may be attributed to the influx of sediment brought in by the realigned
Mamquam River.
Other alterations to the delta system were made during construction of the F.M.C.
Chemicals plant on the eastern delta, and the Squamish Forest Products ship terminal,
which occupies the central delta. In addition to this construction within the central delta
intertidal zone, the central channel was extensively dredged to permit docking of large
cargo ships. The material dredged from this site and from the west channel, was dumped
On the central delta where it may still be seen in Figure 1.6.
Squamish River estuary has responded in several ways to the forced change of regime.
The main impact of the dyke has been a reduction of channel width. The major impact of
this flow restriction appears to be increased erosion of channel banks along the lower
3 000 m of the river. Bell ( 1975) reported results of a survey in 1974 which recorded
erosion of tidal marsh along both east and west banks. Considerable bank slumping
along the edge of the tidal marsh of the west delta was noticed by Bell (1975). Levings
(1980) reported that the five year period after dyke construction saw a westward shift of
the channel, resulting in the loss of approximately 10 m (width) of the west delta
marshes, which extend around 1 700 m in length. Zrymiak and Durette (1979)
investigated morphological processes operating in the estuary, and reported that
"~orzsiderahle slurnpirlg" was taking place along the northwest bank of the estuary. This
erosion was attributed to higher flow velocity in the constricted channel, and forced
researchers to relocate survey stations which slumped into the river. Wiebe (1976 -
reported in Zrymiak and Durette, 1979) speculated that migration of the river meander
through erosion would force flows across the channel, causing erosion of the bank along
the dyke. In 1979, Zrymiak and Durette reported that this erosion was indeed occurring.
Erosion of this eastern bank is still occurring today, though no studies have examined its
rate or extent. Zrymiak and Durette ( 1979) also reported that increased flow velocities
due to channel constriction caused considerable bed scour, though this observation is
based on a very limited data set.
It is clear from the above discussion that human activity in the delta has been extensive,
and that this has led to a disturbance of the natural hydrologic regime of the delta
"stem. The channel bank erosion and bed aggradation are the early response of the river
"stem to adjust to the new regime conditions which exist in the estuary. What is not yet
clear is how long the river will take to reach some new form of equilibrium, or quasi-

equilibrium. It is also very difficult to differentiate between natural and human-induced
morphologic adjustments of the channel. It is clear from an examination of aerial
photographs prior to 1972, for example, that channel bank erosion and channel shifting
are ongoing natural processes within this system.

CHAPTER TWO
METHODOLOGY
This chapter describes the data collection and analysis techniques employed in the field
and laboratory. Where necessary, a justification of the choice of technique will be given
with reference to previous studies. The chapter is organised into two main sections
which deal with data acquisition and analysis separately. Within these two sections,
discussion focuses on the different aspects of this research: stratigraphy, contemporary
sedimentation, and erosion.
Data Collection
The majority of field data were collected over the period from early May to late August
1992. During this time, all stratigraphic work was completed, all sediment samples were
collected, and erosion and deposition stakes were monitored. The collection of sediment
erosion and accretion data continued on a number of occasions throughout 1992 and
1993.
Collection of Stratigraphic Data
Stratigraphic data were collected from detailed examination of sediments exposed in
river bank sections at a number of locations along the tidal gradient. At each location, a
number of features such as sedimentary structure, bedding form, grain-size, and colour
Were examined in detail. The aim of stratigraphic analysis is to determine the nature and
extent of tidal control on sedimentation within Squamish River floodplain and delta
environments. As it is unclear at what scale this tidal sedimentary control will be
detectable, stratigraphic analysis has to be flexible enough to detect subtle micro-scale
tidal characteristics and extensive elemental-scale characteristics.
The following sections discuss the determination of site location in the field and the
methods of stratigraphic analysis. These choices were governed by the aims of research,
the level of detail required from analyses, and opportunities and limitations provided by
field conditions. The identification of changing depositional environments throughout
Squamish estuary required that a number of sections be examined along the reach of the
river from estuary mouth, to purely fluvial reaches. The criteria used in the selection of
sites, and site locations, are discussed below.
Location of Bank Sections
Squamish River is a highly dynamic river system which is constantly shifting in both
fluvial and estuarine reaches, as discussed in chapter one. This lateral shifting of the
river produces near-vertical eroding banks which provide good, clean, extensive
sections. These bank sections provide ideal locations to log stratigraphic sections of
floodplain and delta sequences. Unfortunately, these ideal conditions do not exist along
the entire fluvial-estuarine reach of the river, so sampling could not be undertaken
Systematically throughout the study reach. Despite this, existing bank sections are
considered to provide enough coverage to detect stratigraphic and sedimentologic
changes down-river. Because of the extent of channel shifting within this environment,
bank sections reveal floodplain and delta sediments which are considered highly
'ePresentative of this system as a whole. No attempt was made to dig and log additional
sections, as this was considered too time consumptive and destructive, and produced
extremely poor sections.
Specific site location was determined by a number of factors in the field: the availability
of cut banks, accessibility, and condition of the face. Where possible, several sites were
logged along each bank exposure at regular intervals. In total, 42 sections were logged
along the lower 3 500 m of Squamish River. The locations of these sites are shown in
chapter three.
One common problem with this methodology (where site location is primarily driven by
the availability of exposures), is that there is a tacit assumption that all forms of river
deposit are represented within the available sections. Within this study, however, it
became clear that not all forms of deposit were fully represented in the study reach.
Within the upstream fluvially dominated sections, there is an absence of any major
overbank fine-grained deposits. This is because the Mamquam and Cheakamus are
extremely high energy rivers which inject very coarse sand and gravel into Squamish
River. They exert a large degree of control on the sedimentary environments of
Squamish River. For this reason, major overbank fines are not visible in bank exposures
between a point 5 500 m upstream from the Cheekye fan, and 1 500 m downstream of
the Mamquam confluence.
It was felt, however, that these units would be of great importance to this study, as they
would enable comparison of estuarine and fluvial fine-grained deposits. Early field
investigations indicated that a comparison of these facies would perhaps yield the most
conclusive results concerning the nature of tidal sedimentary control in lower estuarine
reaches. As such, a second study reach was examined, located around 13 000 m
upstream from the river mouth. Within this reach, several exposures (located in chapter
four) containing thick, fine-grained material were logged and sampled in detail. These
upstream sites will essentially act as a 'standard' for comparison with estuarine facies,
particularly for the bed-scale analysis.
Logging Sections
The methodology employed to log sections must be determined from the aims of the
research, the scale of information required, and field conditions. These factors will
determine the level of detail required from section logs, and as such, will almost
certainly be specific to the particular study.
Despite the fact that many sedimentologic studies of this nature employ the
methodology outlined by Miall (1978b), where facies coding schemes are employed to
describe deposits, this approach has not been used here. I agree with many of the
criticisms of lithofacies coding schemes and architectural analysis forwarded by Bridge
(1993), some of which are discussed below. Formal definition and codification of facies
implies that all locations display these defined characteristics. Prespecification of a
limited number of facies codes may discourage detailed examination at a variety of
locations in the field. This in turn may lead to inadequate description and subsequent
inaccurate interpretation. Also, this rigid coding scheme inadequately describes internal
variability of facies and transitional facies (Bridge, 1993). These concerns are of critical
Importance within this study, which attempts to determine changes in depositional
Product along a transitional reach of river.
A similar decision was made not to examine deposits in accordance with the
architectural element analysis approach espoused by Miall (1985). It was felt that the
available exposures did not provide great enough degree of three-dimensional control,
which is essential for the correct identification of elements. Despite this, some of the
methodologies employed in architectural analysis are used in this study. These have
been incorporated because of the importance of examining facies geometry, scale, and
bounding surfaces.
For the reasons outlined above, sections were logged in detail at each site without the
framework of a formal coding scheme. While this approach is undoubtedly more time
consuming, it is considered to provide more precise data. Once all data had been
collected, field notes, photographs and stratigraphic sections were examined in detail,
and deposits broken down into a number of distinct facies. This division was considered
necessary to reduce the vast amount of data into some simpler form.
The definition of the term facies has been a topic of much debate, as it has traditionally
been used as a simple descriptor, as a form of genetic association, and in a broader sense
to denote depositional environments (Reading, 1986). The term facies is used here to
denote a channel bedform-scale depositional unit which is defined by distinctive,
observable characteristics, following the suggestions of Miall (1977; 1978b) and Bridge
(1993). Facies identification and interpretation is based on detailed examination of
composition, sedimentary structure, bedding characteristics, sediment grain-size, and
colour (Miall, 1984a; Bridge, 1993). Interpretation must also be based on an
examination of vertical facies associations (Walker, 1984) and lateral facies variability
(Reading, 1986). This study attempts to examine sedimentary facies which are
characteristic of the depositional environments under study, and which are produced by
both normal and catastrophic processes. In addition to this, this study will examine
depositional products which are considered to be of unique character. While these
unique deposits are not characteristic or fully representative of any environment under
study, they may yield the most conclusive evidence regarding the origin (e.g. tidal) of
sedimentary deposits.
Sediment Sampling from Logged Sections
The general aim of sampling is to test whether sediment-size characteristics reflect the
increasing importance of tidal processes down estuary. Sediment samples were collected
and analysed at a number of sites to test whether estuarine deposits display sediment-
size characteristics which reflect their tidal origin. The choice of sediment sampling
technique and scale were primarily determined by the level of information that was
required from sediment analysis.
Sedimentologists must make the decision whether to collect a small number of highly
detailed samples, or to collect a greater number of samples with a lesser degree of
accuracy and detail (Brierley, 1989). This decision can only be taken in the field, and
will be based on the type of research that is being conducted and the environment under
study. In this study, it was felt that samples should be collected at a number of different
scales. Firstly, data had to be gathered over a relatively large area to be able to determine
the extent and character of a number of different facies or architectural elements. This
was required to assess the relative importance of the tidal parameter throughout the
Study reach. Secondly, a number of highly detailed samples were required within
"ecific tidal facies. This was felt to be important as initial observations suggested that
differences between fluvial and estuarine overbank units would be more easily detected
from micro-scale depositional characteristics than at a broader-scale level of analysis.
Sampling was performed on a facies-scale and a bed-scale. Facies-scale sampling
enabled the average grain-size characteristics of each facies to be determined. It also
enabled the identification of facies trends (such as fining-upwards sequences), and
facilitated more accurate presentation of section data. Bed-scale sampling enabled highly
detailed sediment-size analysis of specific deposits of interest. Samples collected at this
scale were analysed in detail for small-scale sediment-size characteristics within
particular facies. As different levels of detail were required from the facies and bed-scale
samples, different grain-size analysis techniques were chosen for each. These techniques
will be discussed in detail later in this chapter.
Facies-Scale Sampling
The aim of facies-scale sediment sampling is to determine general sediment
characteristics and trends within facies, and to enable more accurate presentation of
Section data. It was felt that highly detailed sediment-size analysis was neither necessary
nor practical for this purpose, so a simple, rapid analysis was performed in the field.
This was achieved with a particle size analysis card and hand lens, as described by Miall
(1984a). This method is commonly used by researchers (Smith, 1987; Vanderberg,
1987; Brierley, 1989) to determine mean grain size and sorting; Miall (1984a) states that
this method provides adequate and accurate results.
Bed-Scale Sampling
Before discussing techniques employed to sample sediment at this scale, it is necessary
to discuss the nature of the beds that were sampled. This is merely intended as an aid to
discussion here, as complete descriptions are given in chapter three. A bed is defined
here as a single sedimentation unit which formed under essentially constant physical
conditions (Otto, l938), and has no limiting thickness (Reineck and Singh, 1980).
Bed-scale sediment sampling was performed on two individual facies in riverine and
estuarine settings. These facies were relatively thick units of fine overbank material
comprising rhythmite beds bounded above and below by thin layers of organic material.
Many problems were encountered during this stage of the research. It proved extremely
difficult to extract samples from a relatively undisturbed site, particularly within the
estuary. At estuarine locations, water was constantly draining through the sediments at
the face, making samples exceedingly wet and difficult to separate. This water was also
causing contamination of beds as sediment ran down the face. Because of these
difficulties, it became necessary to remove small blocks of bank material, and then
sample from these blocks. As this technique is clearly destructive, all sites were logged
in detail prior to sampling. Each bed was numbered and labeled, and its thickness and
depth in the section was noted before the site was disturbed.
The best method of sampling proved to be peeling beds along the bounding organic
layers with the aid of a trowel. As detailed sediment-size analysis was to be performed
On these sediments, hands and tools were washed after every sample to avoid cross-
contamination. Also, the outer layer of sediment (at the bank face) was scraped away
before beds were sampled because it was felt that the outer layer of the bank material
was not representative of the beds as a whole. This sediment may have become partially
oxidised due to aerial exposure, and the textural properties of the sediment may have
been modified. This modification may occur by the leaching-out of fine material,
through exposure to atmospheric processes (Amos et al., 1988), and due to the increased
access to marine flora and fauna. In all locations where detailed bed-sampling was
undertaken, parts of the facies under investigation could not be sampled using the
methods outlined above. In certain locations within the facies, beds either became too
small to sample, or bedding planes became too difficult to detect. At these times
sediment sampling was continued upsection in one or two centimetre intervals, to ensure
that the entire facies was sampled. The removal of these samples from the face was
performed using a series of metal plates driven into the face at known intervals (usually
one centimetre), in accordance with the technique outlined by Allen and French (1989).
Delta Erosion
Both the rates and locations of bank erosion along the estuarine reach of Squamish River
were assessed by indirect (aerial photography) and direct (field study) means, producing
an assessment of the short-term (annual) and longer-term (up to 33 years) rates of
erosion. Historic rates of bank erosion were assessed as an aerial loss of vegetated delta
and floodplain lands recorded from aerial photographs dating from 1957 to 1990. The
difficulties involved in accurately calculating these rates include the need to standardise
photograph scale, and the need to find some relatively stable feature from which erosion
may be recorded. The aerial loss of material was determined from an overplot of 2
photographs of different age (Alexander and Nunally, 1972; H o o k 1984) from which
rates and locations of erosion may be determined (eg. Sundborg, 1956; Brice, 1974). To
enable two images to be superimposed, traces of channel bank locations were first made,
then these traces were scanned into a software package where they could be overlaid and
resized to match one another. To permit accurate resizing of scans, a number of stable
reference points were marked on each trace (Hooke and Kain, 1982). Up to 6 reference
points were used, including road intersections, buildings, and railroad tracks. In those
cases where the correlation of these reference points was poor, scans were rejected and
not used in analyses. The remaining series of superimposed scans were then printed, and
areas of bank retreat were calculated with a compensating polar planimeter.
From these data, bank erosion rates (expressed as a yearly average areal loss of material)
were calculated over a number of different time scales between 1957 and 1990. The
volume of material being eroded could not be calculated, as channel depth at the bank
was not accurately known. It is clear from sonar scans that much of the slumped bank
material is not immediately eroded and removed. The near-bank area is a shallow-water
zone characterised by a highly uneven, blocky bed. The fact that this zone is littered with
trees (which were locally eroded), highlights the fact that removal of this material is not
immediate. It is not clear what time scales are involved in removal, though several large
trees remained stationary in the flow over the freshet peak, and throughout the summer
of 1992.
Short-term rates of bank erosion were measured in the field along two sections of the
lower estuary. These areas (indicated in chapter five) were chosen for detailed
Surveying, as they were areas of maximum channel erosion which often was evident on a
daily basis. These sites include the regions of maximum post-dyke erosion reported by
Bell (1975), Zrymiak and Durette (1979), and Levings (1980). Erosion rates of the west
delta and the western section of the central delta were measured from 114 survey pins.
These reference 'pins' generally were trees along forested sections of the floodplain, or
rebar stakes along unforested delta sections. Surveys were conducted throughout the
summer of 1992 and on a number of occasions afterward. During each survey, distance
to channel bank at a known angle was surveyed. A total number of 135 recordings were
made during each survey, and these data were used to plot bank location at the time of
each survey.
No attempt was made to determine rates of deposition or delta progradation from aerial
photographs as there were too many difficulties in collecting accurate data. Without the
aid of bathymetric surveys, the visible extent of intertidal sands is determined by tidal
stage and river discharge at the time the photograph was taken. These factors, however,
do not affect determination of the extent of vegetation (as long as that vegetation
remains exposed). Despite this, indirect determination of sediment deposition and delta
progradation from vegetation encroachment is not considered useful here, as vegetation
donisat ion lags considerably behind the deposition of subtidal and intertidal sands.
Delta Accretion
There exists a difference between short-term sediment accretion rates, and longer-term
vertical building of the delta. This is primarily because marsh sediment becomes
compacted during burial (Bloom, 1964), a process which is aided by the break-down of
organic material over time. Unfortunately, a number of contradictory terms have been
used to describe short-term and long-term rates of delta accretion. This study will
employ the terminology of Ranwell ( l964), who defines accretion as the depth of
sediment deposited per unit time. True accretion is defined as the depth of sediment
deposited per unit time, minus the decrease in that thickness caused by all processes of
settlement.
Rates of delta accretion may be determined by a number of techniques, each of which
has associated benefits and drawbacks. The technique most commonly employed is the
use of marker beds (Steams and MacReary, 1957; Harrison and Bloom, 1974, 1977;
Letzsch and Frey, 1980; Stumpf, 1983; and Stevenson et al., 1985). These markers, for
example red brick dust or aluminium powder, are sprinkled onto the delta surface then
wetted to prevent their erosion during the rising tide.
Despite the fact that this is a commonly used technique, there were thought to be too
many limitations and errors involved with this technique to justify its use in this study.
Some of these limitations and sources of error are as follows: (1) marker beds cannot
record any erosion which occurs at the site if that erosion occurs immediately after
placement of the marker, or if erosion exceeds the depth of sediment deposited above the
marker bed. (2) The marker bed may be mixed and vertically displaced by the process of
bioturbation, or by the growth of marsh vegetation in summer months (Richard, 1978).
(3) If the material used as a marker has a higher density than the water-saturated mud,
the marker bed may sink through sediment layers. Richard (1978) recorded this process
in laboratory studies, and so had to apply a correction factor to his data to account for
the sinking aluminium powder. (4) Site disturbance takes place every time data is
collected, as the site has to be dug out or cored to find the depth of the marker. Several
Problems arise from this site disturbance. Firstly, inaccurate recordings may arise due to
core compaction during retrieval. Secondly, the extraction of a core at a specific site
may lead to disturbance (settling) of the remaining marker bed, thus making future
readings inaccurate. (5) Measurement cannot be continued at exactly the same location
(Ranwell, 1964) (6) The surface microflora is disturbed when the marker bed is placed
down (Ranwell, 1964), and the physical characteristics of the surface are altered. This
last point is potentially an important one. The placement of an artificial marker on the
surface is very likely to alter surface roughness, which may accelerate or reduce local
sedimentation rates. The marker also buries the surface layer of sediment, which is being
bound by mucus secretions of benthic diatoms and bacteria. This binding has been
shown to increase the stabilisation of estuarine sediments (Holland et crl., 1974;
Anderson, 1983; Grant et al., 1986; Montague, 1986; Vos et dl. , 1988), and may also
induce further deposition because of its cohesive nature (Carey and Oliver, 19 18; Coles,
1979).
As the sum of these possible sources of error is considered quite large, accretion rates
were measured with vertical stakes. The decision to use vertical stakes was also based on
the ease and rapidity of data collection, and the ability to collect data a number of times
without disturbing the site. This method is often employed in modern delta studies
(Ranwell, 1964; Hubbard and Stebbings, 1968; Carling, 1982; and Stevenson, et nl.,
1985), and has been justified for studies over a number of years (Ranwell, 1964). The
main sources of error with this technique are as follows: (1) the stakes act as an obstacle
to flow. As flow moves around this obstacle, small-scale eddies are produced, which
may erode the sediment around the base of the stake. (2) Stakes are vulnerable to
disturbance and dislocation, either through natural processes (floating debris, wave
action), or human interference. (3) Stakes may settle through the sediment, leading to
erroneously high readings of sedimentation rates (Ranwell, 1964). (4) The presence of
the stake may actually promote deposition (Armentano and Woodwell, 1975). Of these
sources of inaccuracy, none were felt large enough to prevent their use in this study or to
invalidate results. Where possible, steps were taken to lessen the effects of error which
seemed likely to arise during this study.
Initial studies attempted to determine rates of sediment accretion on the west and central
deltas. Unfortunately, the deposition stakes on the central delta became disturbed by
human interference in early summer 1992, so data collection was only continued on the
more isolated west delta.
In total, 42 deposition stakes were placed to record rates of accretion of the west delta
over a two year period. Accretion rates were determined from lengths of 3/x inch
diameter rebar, which was driven into the delta surface. The stakes, which were 155
centimetres in length, were driven 75 centimetres into the ground. This depth of burial
increased stake stability, making them less susceptible to removal and decreasing the
potential for the stakes to settle through the stratum. This settling process, though
reported from other sites (Ranwell, 1964) is not considered important here, as all stakes
had to be driven into the sediment with a mallet. The delta sediments here are considered
too compact to allow any settling. The relatively small diameter of the stakes used,
combined with low flow velocities on the delta surface greatly reduced the potential for
erosion of sediment at the base of the stake.
The stakes were laid out in a grid system (shown in chapter five) which proved essential,
as stakes (even when painted, marked with survey tape, and 80 cm high) proved
extremely difficult to find in dense Curex stands. Each was painted and marked twice:
once at the base of the stake (the buried section), and once at a fixed height above the
delta surface. The buried portion of the stake was painted to enable a rapid assessment of
whether erosion was occurring at the site. This lower marker may also be used as a
stratigraphic marker if the top of the deposition stake should become bent or corroded.
TO increase the accuracy of sediment accretion data and to minimise the effects of scour
around erosion stakes, four measurements of accretion were taken from each stake, at
each compass point. All measurements of accretion are considered accurate to within 0.1
cm for each particular stake being measured.
The location of every deposition stake was surveyed for its position and height using a
total station with electronic distance meter.
Data Analysis
Analysis of Log Data
Within this study, interpretations of the environment and process of deposition of facies
primarily are based on the detailed field analysis of sedimentary structure and size
analysis. Interpretation is also greatly influenced by examination of broader-scale
features such as facies geometry, size, continuity, bounding surfaces, and associated
facies. In this sense, interpretation is also based on an element-scale approach to facies
analysis. Interpretation is also aided by an examination of contemporary depositional
environments and products of Squamish River, and a knowledge of other published
research.
Sediment Analysis
The aim of detailed sedilnent-size analysis is to determine characteristic attributes of the
Sedimentary deposits under investigation. This information is often used to infer the
nature of the depositional process, and the conditions of *low which were operating at
the time of deposition. Much research has attempted to differentiate sedimentary
depositional environments from detailed sedimentologic evidence alone (Mason and
Folk, 1958; Schlee et a]., 1965; Visher, 1965, 1969; Friedman, 1967; Hails and Hoyt,
1969; Royse, 1970; Allen, 197 1; and Roy and Biswas, 1975), although arguably this is
of limited value (Erlich, 1983; McManus, 1988).
Unfortunately, differentiation of depositional environment is not a simple matter, as the
grain-size distributions produced by sedimentary analyses may not reflect the actual
sediment characteristics at the time of deposition. Sedimentologists cannot always
assume that the sediments under investigation were deposited as discreet grains. This is
an extremely important point, particularly for researchers working in estuarine
environments. In estuaries, the processes of flocculation, agglomeration and pelletization
exert a large degree of control on the nature of suspended sediment (Burns, 1965;
Postma, 1967; Edzwald and O'Melia, 1975; Krone, 1978; Pejrup, 1988, 1991), and
ultimately, the deposition of this sediment (Haven and Morales-Alamo, 1972; Kranck,
1973, 1975, 198 1; Syvitski and Murray, 198 1).
The fundamental question that sedimentologists must ask, therefore, is whether they
wish to examine the sediment textural characteristics at the time of deposition
(''apparent" distributions (Postma, 1967)), or whether they wish to examine the true
composition of their samples. This will determine the choice of sediment analysis
technique, and the methods of sample preparation prior to analysis (Matthews, 1991). If
the researcher has access to the appropriate equipment, this will be determined by the
primary aim of research and the results which are required from analysis. As has already
been noted, however, this choice is not so clear for workers examining the
sedimentology of recent estuarine deposits, for a number of reasons. Firstly, once
sediment has been deposited, no available technique can analyse the sediment in its
originally deposited form. All analyses require some form of agitation of the sample
either prior to or during analysis. This agitation will break-up sediment floccules and
agglomerates (Gibbs, 198 1; Gibbs and Konwar, 19821, which have been shown to be
highly unstable forms (Gibbs, 1982). A further complication is that one cannot be
certain that sediments retain their original depositional form. Post-depositional
modification of sediments may occur within hours of their being laid down. This
modification may take place through a number of processes. During burial and
compaction, floccules may begin to break down. This may be enhanced by fluctuating
water-table levels and chemical gradients in intertidal zone sediments. As sediments
accrete and become drier, soil forming processes may lead to the formation of
aggregates. In addition to these processes, flocs, aggregates, and pellets may either be
formed or broken by the action of benthic diatoms and burrowing fauna in the substrate.
It is unclear what effect organic decay and oxidisation will have on surrounding
sediments.
From this discussion it is clear that the sedimentary properties of a sample cannot
accurately be examined in its original depositional form. For this reason it is felt that
sediment analyses undertaken within this study should aim to determine the true grain-
size distributions of samples. The term 'true distribution' is meant to indicate the
distribution of the total discreet constituent particles of a sample. It is not meant to
indicate any accuracy of the distribution, as the techniques of size analysis chosen in this
study only measure some size property which is related to the actual size of the
sediment, whether that is a Stokesian diameter or the smallest dimension of a grain.
Once this decision is made, i t is vita] to ensure that all analysed samples are fully
dispersed prior to analysis. The lnethodology employed to disperse samples is discussed
In the following sections.
A number of sediment analysis techniques have been chosen in this study. The selection
of each technique was made in accordance with the level of information and precision
that was required from the analysis. Different techniques were applied to samples
obtained from facies-scale and bed-scale sampling. Samples taken during the facies-
scale analysis section of this research were analysed with a particle size analysis card.
Sediments taken during bed-scale sampling were sieved, and the subsieve fraction
analysed with a SediGraph particle size analyser.
Preparation of Samples for Analysis
Figure 2.1 shows the main steps that were taken during preparation of samples for bed-
scale analysis. The aims of this analysis were to determine the size-distribution of each
sample (for the sieve and sub-sieve ranges), the sand, silt, and clay components, and to
determine the amount and type of organic matter in each sample.
Samples were oven-dried at 45' C for one week to remove 'free' (all but interstitial)
water from the sediment. Once dry, samples were disaggregated by very lightly pressing
the sediment in a mortar. Extreme care was taken during this process, as the aim was
merely to break up aggregates prior to sieving. Samples were not ground, as this can
split larger grains, producing an incorrect shift to a finer distribution.
Sieving Analysis
Samples were weighed, then sieved for 15 minutes from 0 to 4 phi in accordance with
the technique outlined by Folk (1965). The only difference between the methodology
employed in this study and that of Folk is that samples were sieved at full phi rather than
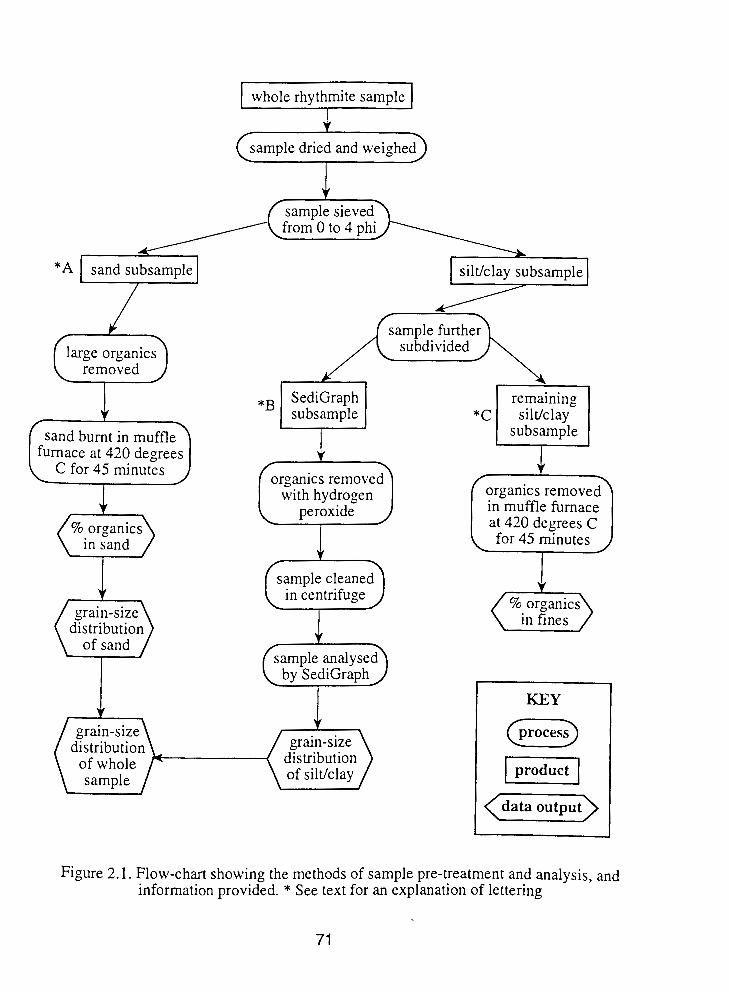
whole rhythrnite sample + sample dried and weighe
sample sieved / c r 0 m 0 t 0 4 p h i sand subsample siltlclay subsample
SediGraph remaining *B subsample *C siltlclay subsample
rganics r e m o v e 2 with hydrogen
peroxide j in muffle furnace at 420 degrees C
\ for 45 minutes j
distribution
sample cleaned in centrifuge C
grain-size distribution grain-size
of whole distribution of siltlclay
in fines
I KEY
data output I- Figure 2.1. Flow-chart showing the methods of sample pre-treatment and analysis, and
information provided. * See text for an explanation of lettering
quarter phi intervals. There were several reasons for this choice of sieving interval.
Firstly, it was felt that the breakdown of sediment distributions into phi intervals would
be adequate for the purpose of this study, and that further resolution was not needed.
Perhaps more importantly, it was felt that the increased resolution that would be gained
from quarter-phi analysis would be outweighed by the increased error associated with it.
The loss of material during sieving is potentially the most important source of error in
size analysis, and losses increase with the number of sieves used. The error associated
with the loss of material from 17 sieves required for quarter-phi analysis, was judged to
be unacceptable in this study. The error was expected to be particularly large, as the
material would have to be sieved and removed three times per sample due to the limited
number of sieves that can fit on the mechanical shaker.
This sieving process essentially produces two subsamples - the sand range held in the
sieves, and the subsieve range held in the pan (Figure 2.1). The analysis of subsieve
material is discussed in the proceeding section and the analysis of the sand is discussed
below.
Large organic material was carefully removed from the 0 and 1 phi sieves, where all
large material was retained. This organic material was set aside, and its weight
subtracted from the dry weight of the sample prior to analysis. The material retained on
the sieves was then weighed, and examined under a microscope to detect the presence of
aggregates. The number of aggregates observed were minimal, and were certainly not
present in significant numbers to invalidate results, or to require that the sample be
disaggregated and re-sieved (Folk, 1965). Almost all samples collected weighed
between 30 and 50 grams (dry weight), to minimise the error introduced by sieves
clogging up with sand (Folk, 1965).
After this sieving process, and the removal of large organics, it was felt necessary to
remove the remaining (smaller) organics from the sand subsample. This was done for
two reasons: to determine the total amount of organics in each sample, and to increase
the accuracy of the size-distribution data for the sand range. The inaccuracies in these
data arise from the fact that the weights of material retained in each sieve record the
weight of sand and small organics. To calculate accurate weights of the inorganic
component of samples, weights had to be corrected (reduced) for each sample, at each
phi size class. Organics were removed using the loss-on-ignition technique (LOI),
described by Thrower and Schmidt (1985). More detailed description of this removal
process is given later.
SediGraph Analysis
Analysis of the subsieve (silt and clay) material was performed with a model 5000D
SediGraph particle size anaiyser. This technique only requires a small sample size
(around 1 gram) for analysis, so the subsieve material had to be subdivided and reduced.
Unfortunately, subsampling errors inevitably occur whenever any sample is split for
analysis, and these may account for the greatest error of SediGraph analyses (Coates and
Hulse, 1985). Because of this, great care must be taken while splitting samples, and
sample preparation was standardised as much as possible to guarantee reproducibility of
results (Vitturi and Rabitti, 1980). The method employed to obtain this small subsample
was that of coning and quartering (Duncan and LaHaie, 1979).
Once the subsample weight had been reduced, it was necessary to test for the presence
of carbonates in the sediment. Of the 188 samples tested, however, none tested positive;
carbonates clearly are of minor importance in the samples collected here. The lack of
carbonates in these sediments may indicate that carbonate minerals entered into solution
and leached out of the sediment (Nelson and Sommers, 1982). or more likely, were
broken down into very fine particles which were removed in suspension (Chave, 1964).
Land and Hoyt (1966) similarly found little or no carbonates present in estuarine
sediments finer than 2 phi.
The remaining organic material had to be removed from the SediGraph subsample
before size-analysis could be performed. For this stage of the analysis, a decision was
made not to remove organics by the LO1 technique, but to chemically remove organics
with hydrogen peroxide. The reasoning behind this decision, and more detailed
description of the methodology employed are given in the next section.
After chemical burning with hydrogen peroxide was complete, samples were placed in a
centrifuge for 15 minutes, decanted, then cleaned with distilled water. This cleaning was
repeated three times (one hour total centrifuge time), to ensure that samples were clean.
The samples (which were then ready for size-analysis) were dispersed in 0.08% Calgon
solution (Sodium Hexametaphosphate), which Tchillingarian (1952) determined to be
one of the effective dispersing agents. This concentration (of calgon to sediment dry
weight) was chosen because it offers the most effective dispersing capability, without
significantly altering the density and viscosity of the fluid (Micromeritics, 1982). This
simplifies operational procedure, as the density and viscosity values for water may be
used to calculate the running rate of the machine. Samples were prepared to a 3 %
concentration of sediment (dry weight) to dispersing solution (calgon and distilled
water).
In this study, one of the main sources of error likely is the determination of sample
particle density. This would lead to an erroneously fast or slow running rate of the
machine, causing a shift to a finer or coarser distribution respectively. As such, the
average particle density of the samples under investigation was calculated, rather than
assuming the particle density of Quartz (2.65 gkc) . This was achieved by analysing the
specific gravity of 20 samples from the site under investigation with a pycnometer,
following the methodology outlined by Hurlbut and Klein ( 1 977). This analysis
determined that the average specific gravity of samples analysed in this study was 3.07,
which clearly shows the need to determine the density of samples under study, rather
than assuming the density of Quartz.
Removal of Organic Material
Previous sections describe how samples were divided and further subdivided (Figure
2.1). This section describes how organic material was removed from three subsamples:
the sand, the small subsample required for the SediGraph, and the remaining silt and
clay material (marked A, B, and C in Figure 2.1). It was necessary to remove the
organics from the sediment for a number of reasons. Firstly, the weight of organics
represents an error in the weight retained on each sieve, and equivalent weights
determined from SediGraph printouts. If uncorrected, this will lead to incorrect grain-
size distributions. More importantly, organic material has to be removed from the
SediGraph subsample as it introduces a potentially large error into the results. This error
arises because organics can greatly impede the full dispersal of a sample in solution
(Coakley and Syvitski, 1991), and may induce flocculation during analysis
(Micromeritics, 1982). Also, these organics will not settle through the solution, but
instead will float, causing greater attenuation of the x-ray beam. This will produce an
erroneous shift to a finer distribution.
No single standardised procedure of organic removal was employed for all three
subsamples. Instead, two different procedures were employed, the choice of which was
governed by the nature of the problem in hand and the requirements of the proceeding
analysis.
For the removal of organics from the main sand and siltlclay subsamples (labeled A and
C in Figure 2. l), the LO1 technique of Thrower and Schmidt (1985) was employed. This
method was chosen because it enabled rapid and accurate analysis of the large number
of samples which were analysed. Samples were weighed, placed in a muffle furnace set
at 420" C for 45 minutes, cooled in a dessicator then re-weighed. Mitchell (1932) and
Ball (1964) have shown that there is no loss of structural water from the inorganic
component of soils at temperatures up to 440' C, so this form of error is not a
consideration here. A number of samples were burnt at the same temperature for greater
periods of time (up to 12 hours) to determine whether all organic-carbon had been
removed after 45 minutes. In no case was any further weight loss recorded.
It is important to note that the LO1 technique does not directly measure the organic
content of a sample, or the total carbon content. When samples are placed in a furnace at
420" C, the organic carbon component is burnt off. As such, the LO1 technique provides
an indirect assessment of total organic content, as organic matter comprises around 50%
organic carbon (Donahue et al., 1983). The organic matter content may then be
determined by multiplying organic carbon values by some conversion factor, such as the
Van Bemmelen factor of 1.724, More recent studies, however, have shown this factor to
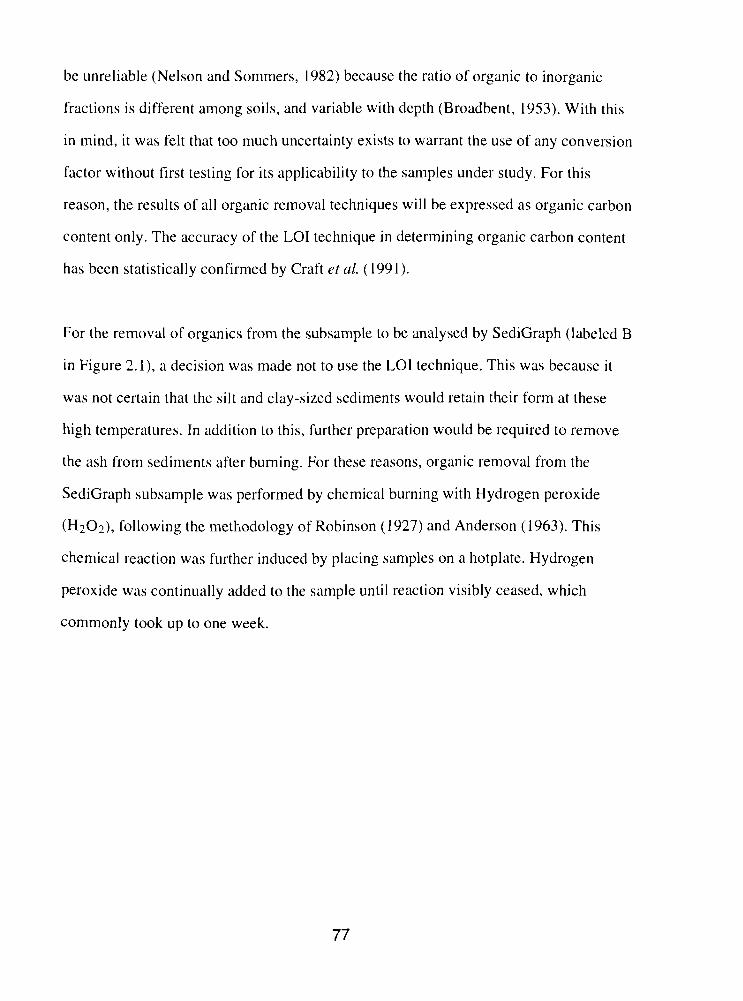
be unreliable (Nelson and Sommers, 1982) because the ratio of organic to inorganic
fractions is different among soils, and variable with depth (Broadbent, 1953). With this
in mind, it was felt that too much uncertainty exists to warrant the use of any conversion
factor without first testing for its applicability to the samples under study. For this
reason, the results of all organic removal techniques will be expressed as organic carbon
content only. The accuracy of the LO1 technique in determining organic carbon content
has been statistically confirmed by Craft et al. (199 1 ).
For the removal of organics from the subsample to be analysed by SediGraph (labeled B
in Figure 2. l), a decision was made not to use the LO1 technique. This was because it
was not certain that the silt and clay-sized sediments would retain their form at these
high temperatures. In addition to this, further preparation would be required to remove
the ash from sediments after burning. For these reasons, organic removal from the
SediGraph subsample was performed by chemical burning with Hydrogen peroxide
(H202) , following the methodology of Robinson (1927) and Anderson (1963). This
chemical reaction was further induced by placing samples on a hotplate. Hydrogen
peroxide was continually added to the sample until reaction visibly ceased, which
commonly took up to one week.
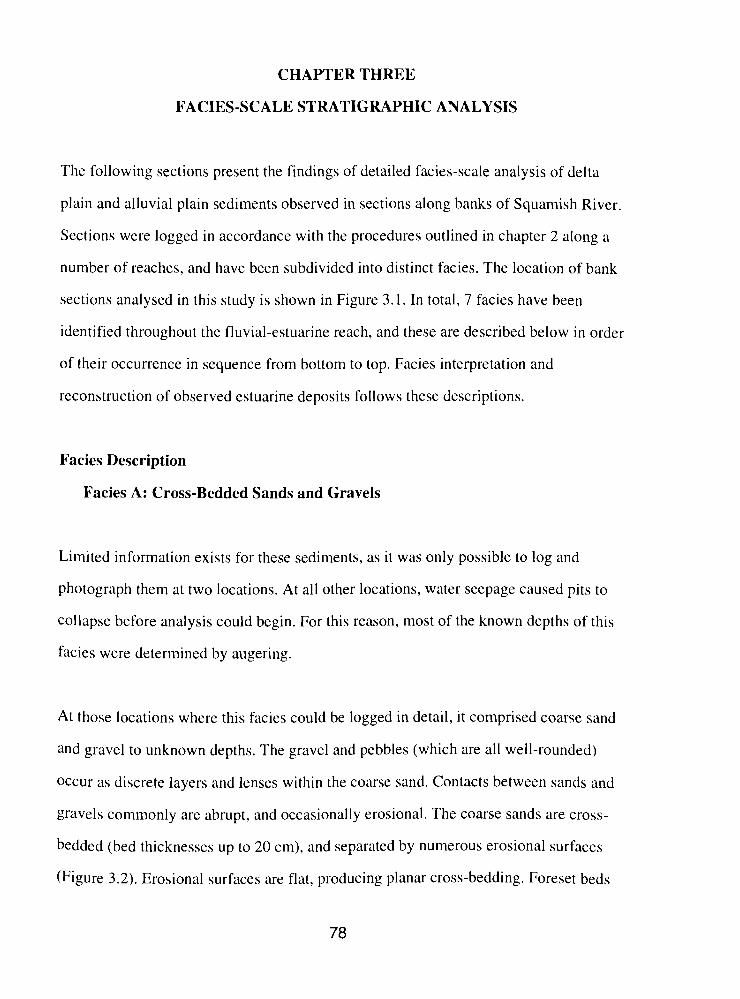
CHAPTER THREE
FACIES-SCALE STRATIGRAPHIC ANALYSIS
The following sections present the findings of detailed facies-scale analysis of delta
plain and alluvial plain sediments observed in sections along banks of Squamish River.
Sections were logged in accordance with the procedures outlined in chapter 2 along a
number of reaches, and have been subdivided into distinct facies. The location of bank
sections analysed in this study is shown in Figure 3.1. In total, 7 facies have been
identified throughout the fluvial-estuarine reach, and these are described below in order
of their occurrence in sequence from bottom to top. Facies interpretation and
reconstruction of observed estuarine deposits follows these descriptions.
Facies Description
Facies A: Cross-Bedded Sands and Gravels
Limited information exists for these sediments, as it was only possible to log and
photograph them at two locations. At all other locations, water seepage caused pits to
collapse before analysis could begin. For this reason, most of the known depths of this
facies were determined by augering.
At those locations where this ficies could be logged in detail, it comprised coarse sand
and gravel to unknown depths. The gravel and pebbles (which are all well-rounded)
occur as discrete layers and lenses within the coarse sand. Contacts between sands and
gravels commonly are abrupt, and occasionally erosional. The coarse sands are cross-
bedded (bed thicknesses up to 20 cm), and separated by numerous erosional surfaces
(Figure 3.2). Erosional surfaces are flat, producing planar cross-bedding. Foreset beds
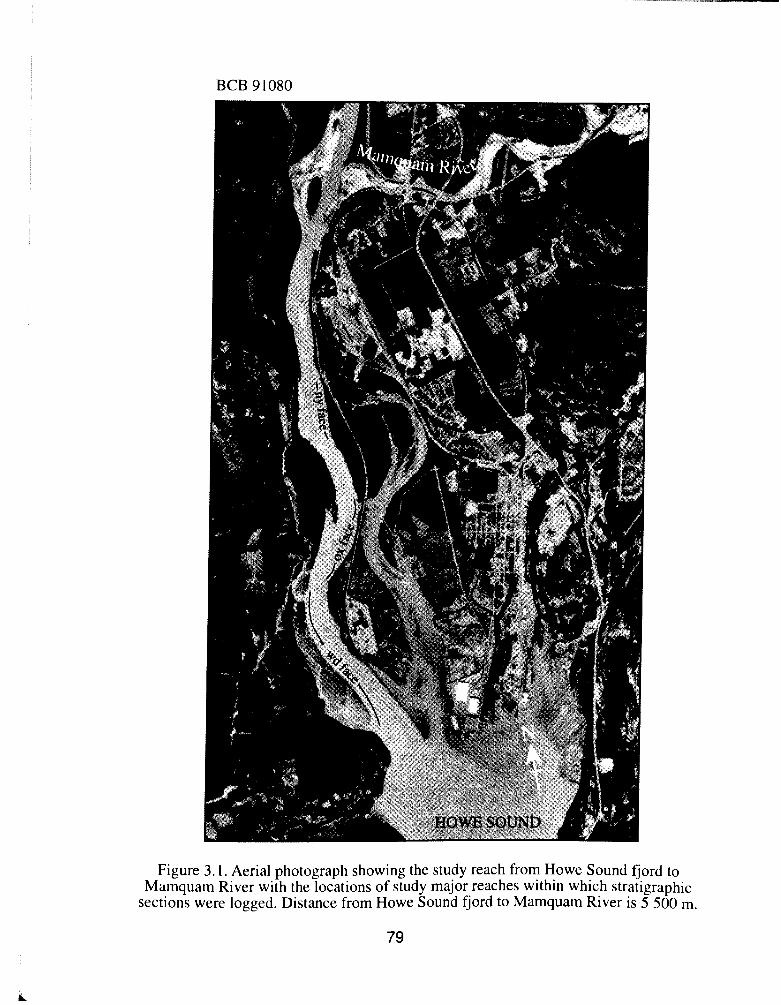
BCB 9 1080
Figure 3.1. Aerial photograph showing the study reach from Howe Sound fjord to Mamquam River with the locations of study major reaches within which stratigraphic
sections were logged. Distance from Howe Sound fjord to Mamquam River is 5 500 m.
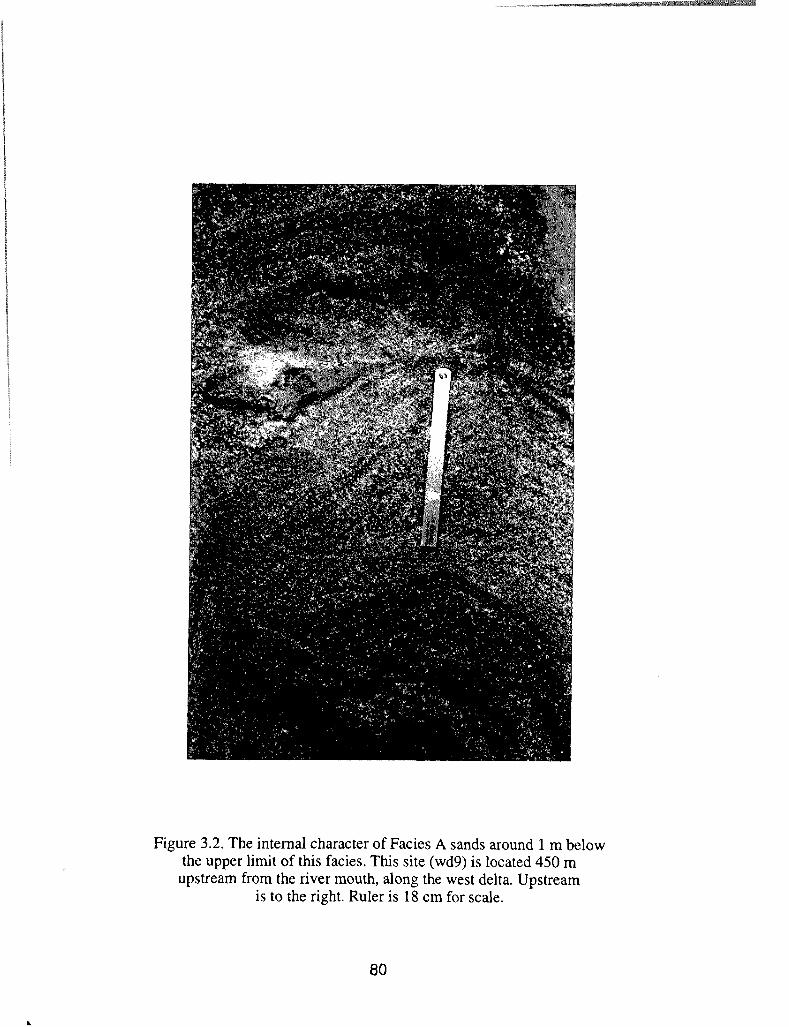
Figure 3.2. The internal character of Facies A sands around 1 m below the upper limit of this facies. This site (wd9) is located 450 m
upstream from the river mouth, along the west delta. Upstream is to the right. Ruler is 18 cm for scale.
have high angles of dip (up to 35 "), indicating bedform migration down-valley; topset
beds are preserved in some cases. Within the coarse sands are numerous medium and
fine sand beds and flasers:.~heee beds have highly irregular bounding surfaces, and may
be laterally and longitudinally discontinuous. Occasionally, the flasers contain coarser
material than the surrounding matrix. All contacts are abrupt, and non-parallel. Some
large organic debris is found within the sands, but no smaller small organics (termed
coffee-ground) were o b ~ ~ v e d in megaripple foresets (terminology of Reineck and - *;
Singh, 1980). In a nu*ber of cases, small mud clasts of clean silty fine sand were found
within this facies. The largest of these was a fist-sized mud clast, which did not appear
to contain any internal bedding, though the form collapsed before it could be examined
in detail.
Along the lower 3 300 m of Squarnish River, these sediments are overlain by the finely-
laminated sands and silts of Facies B. The contact between Facies A and B is abrupt and
wavy, but from these limited exposures, does not seem erosional. The sand immediately
below this contact is heavily oxidised and commonly cemented to a variable depth of 1
to 2 cm. At one site (0x3) the upper limit of this oxidised sand layer appears highly
irregular and jagged.
From the longitudinal section of logged sites along the west delta (Figure 3.3), it is clear
that the upper surface of Facies A is highly variable with depth. For example, between
sites wd 16 and wd 17 (209 m apart) the depth of this facies varies from -2.55 to -1.10 m
a.m.s.1.. The lower boundary of Facies A was never reached.
Figure 3.3. Lon$tudinal section of Squamish estuary stratigraphic sequences, shou.ing a representati~x number of logged sections along the tidal gradient. See text for an explanation of the letters A and B.
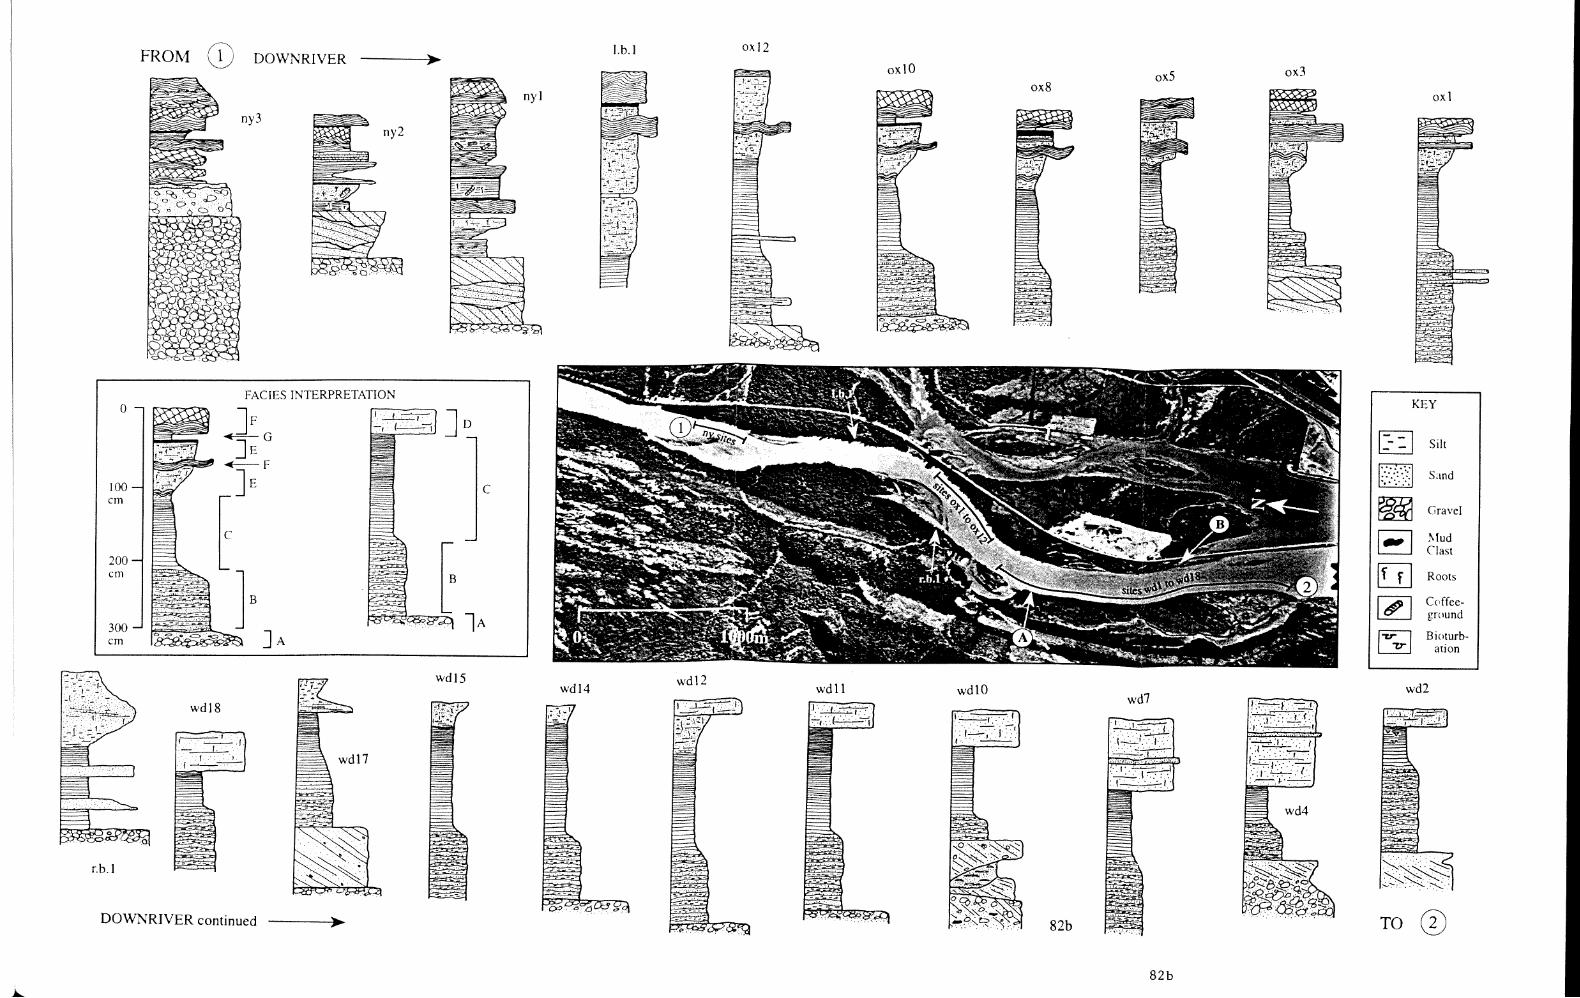
Facies B: Finely-Laminated Sands and Silts
This facies, comprised of material ranging in size from clay to medium sand, has a
banded appearance produced by alternating beds of predominantly light (silt and clay)
and dark (fine to medium sand) material. These parallel wavy beds are of variable
thickness within and between sites. This alternating bedding can be seen in Figure 3.4,
which shows the uppermost 60 cm of Facies B sediments and the transition to Facies C .
These deposits are exposed along the west delta at a site 690 m upstream from the river
mouth (between sites wdl 1 and wd12 in Figure 3.3). Contacts between alternating light
and dark beds here appear slightly gradational, and occasionally abrupt. At this location,
lighter beds commonly are thicker (up to 7 cm) than darker beds (up to 3 cm). Further
upstream (around 3 000 m from the river mouth), Facies B deposits may contain
occasional coarse sand interbeds.
When these sediments are dug out or cleaned with a trowel, as seen in Figure 3.4, these
beds appear massive. Along sections which have been exposed to subaerial erosional
processes, however, beds display very fine laminations. At three locations along the
west delta (located 690 m, 1 050 m, and 1 450 m upstream from the river mouth), it was
possible to examine this small-scale sedimentary detail, and log small sections of Facies
B at a millimetre scale. These three sites revealed considerable within-site variability of
Facies B deposits along Squamish estuary. The following discussion will concentrate on
those features which generally appear to characterise these deposits, and those features
which make each site distinctly different from others.
Small-scale sedimentologic analysis reveals that both dark and light beds contain
rhythmically alternating light and dark laminae or groups of laminae. These alternating
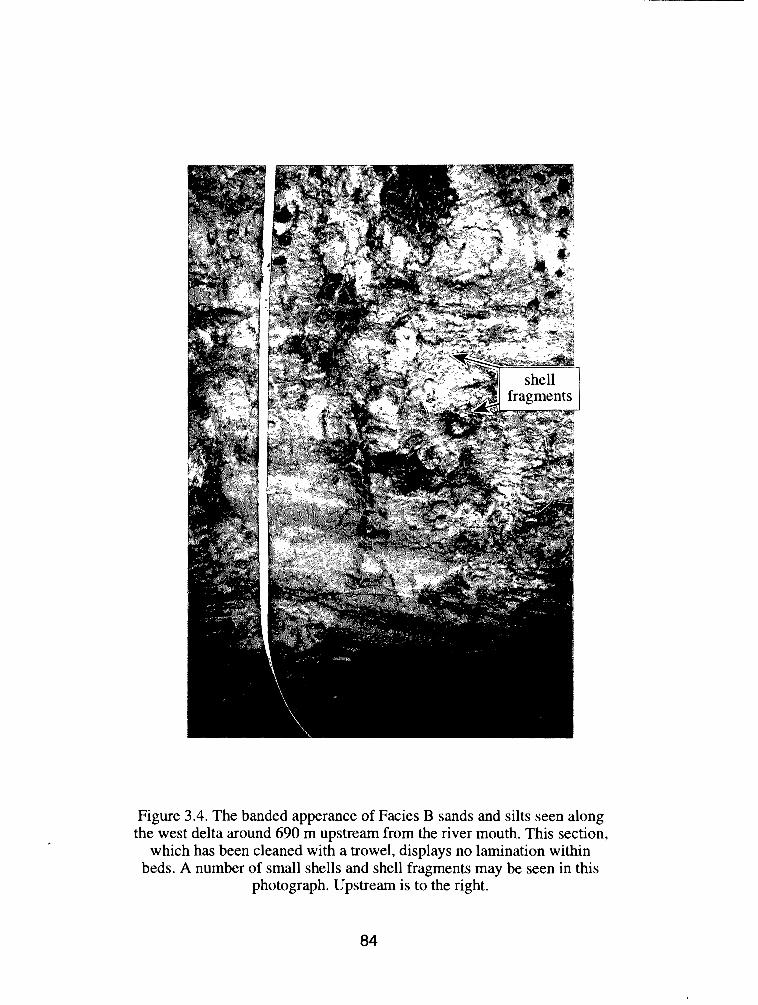
Figure 3.4. The banded apperance of Facies B sands and silts seen along the west delta around 690 m upstream from the river mouth. This section,
which has been cleaned with a trowel, displays no lamination within beds. A number of small shells and shell fragments may be seen in this
photograph. Upstream is to the right.

layers vary in thickness from 0.01 cm to 2.5 cm. Darker laminae are a fine to medium
sand, while lighter layers are silts and clays. Generally, the darker, coarser laminae are
thicker, and may comprise parallel wavy bedding, ripple foreset beds, climbing ripple
lamination (in-drift), and complete ripples preserved in trains. The light silt/clay layers
may not exceed one lamina thickness, but commonly comprise a number of parallel
laminae. These laminae take on the form of the underlying surface, and so may appear
wavy. Despite this wavy appearance, the lighter laminae never display any form of
ripple bedding.
A number of these features described above are observed in Figure 3.5, which shows a
section of Facies B sediments exposed at the upstream most end of the west delta,
around 1 450 m upstream from the present river mouth. The section seen here is around
50 cm high, and 70 cm wide. At this location there appear to be 5 or 6 units
characterised by dominantly dark, coarse beds, capped by a thinner series of dominantly
lighter, finer beds. At this location, darker beds seem thicker than the lighter beds of
material, in contrast to those observed in Figure 3.4. Both these lighter and darker beds
contain rhythmically alternating fine laminations of sand and siltJclay. In the coarser
material, groups of laminae may be produced by the migration of ripples and the
deposition of inclined foreset laminae. This thinly interlayered bedding is seen in closer
detail in Figure 3.6. From this figure, one is able to determine the nature of contacts
between light and dark laminae. The lower contact of lighter layers most often is abrupt.
but may occasionally be gradual, while the upper contact (to overlying dark laminae) is
always abrupt, and sharply defined. Figures 3.5 and 3.6 also show a ripple train
Preserved in these deposits. In all, 13 ripples are seen here, and these range in size from
0.2 cm in height by 0.5 cm in length, to 0.5 cm by 2.2 cm. These ripples are not
connected (ripple troughs are essentially the upper surface of the
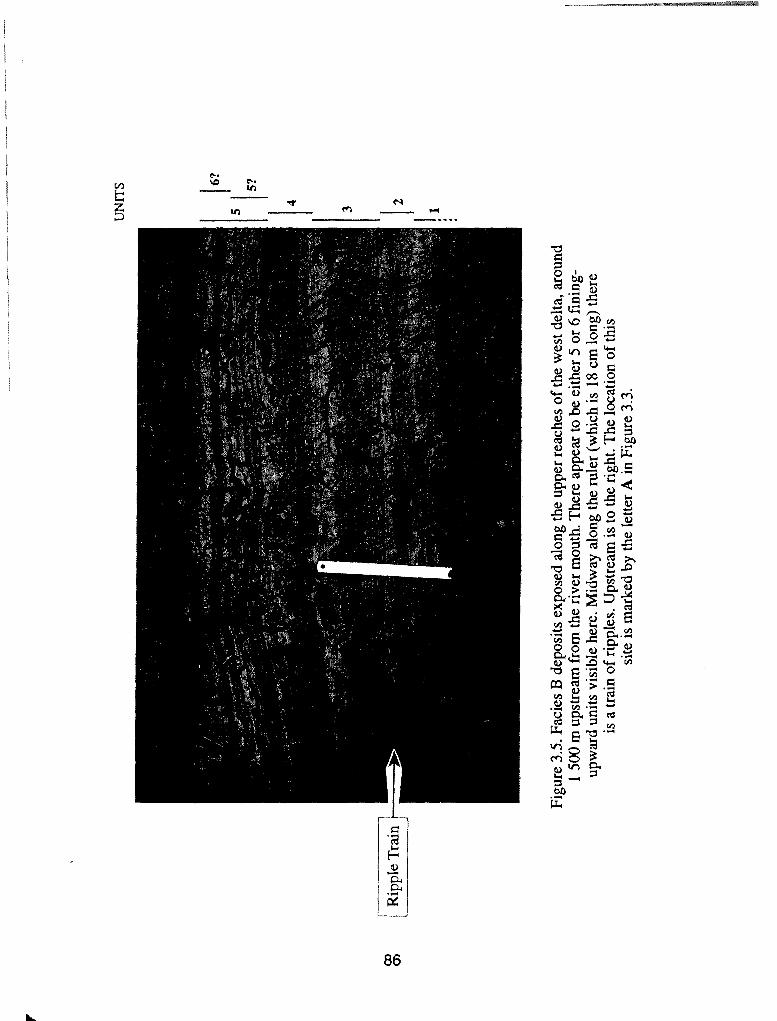
UN
ITS
Figu
re 3
.5. F
acie
s B
dep
osits
exp
osed
alo
ng th
e up
per r
each
es o
f th
e w
est d
elta
, aro
und
1 50
0 m
ups
trea
m fr
om th
e ri
ver
mou
th. T
here
app
ear t
o be
eith
er 5
or 6
fini
ng-
upw
ard
units
vis
ible
her
e. M
idw
ay a
long
the
rule
r (w
hich
is 1
8 cm
long
) the
re
is a
trai
n of
rip
ples
. Ups
trea
m is
to th
e ri
ght.
The
loca
tion
of t
his
site
is m
arke
d by
the
lette
r A i
n Fi
gure
3.3
.
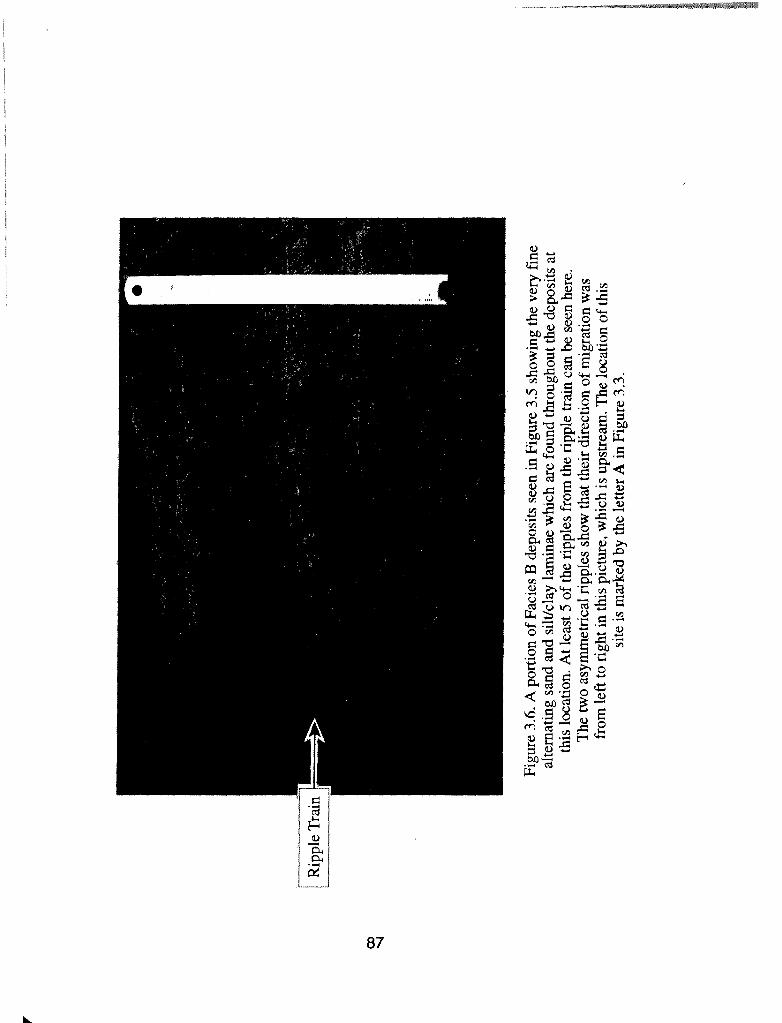
-
Tra
i
Figu
re 3
.6. A
por
tion
of F
acie
s B
dep
osits
see
n in
Fig
ure
3.5
show
ing
the
very
fin
e al
tern
atin
g sa
nd a
nd s
iltlc
lay
lam
inae
whi
ch a
re fo
und
thou
ghou
t th
e de
posi
ts a
t th
is lo
catio
n. A
t lea
st 5
of t
he ri
pple
s fr
om th
e ri
pple
trai
n ca
n be
see
n he
re.
The
two
asym
etri
cal r
ippl
es s
how
that
thei
r dir
ectio
n of
mig
ratio
n w
as
from
left
to r
ight
in th
is p
ictu
re, w
hich
is u
pstr
eam
. The
loca
tion
of th
is
site
is m
arke
d by
the
lette
r A in
Fig
ure
3.3.
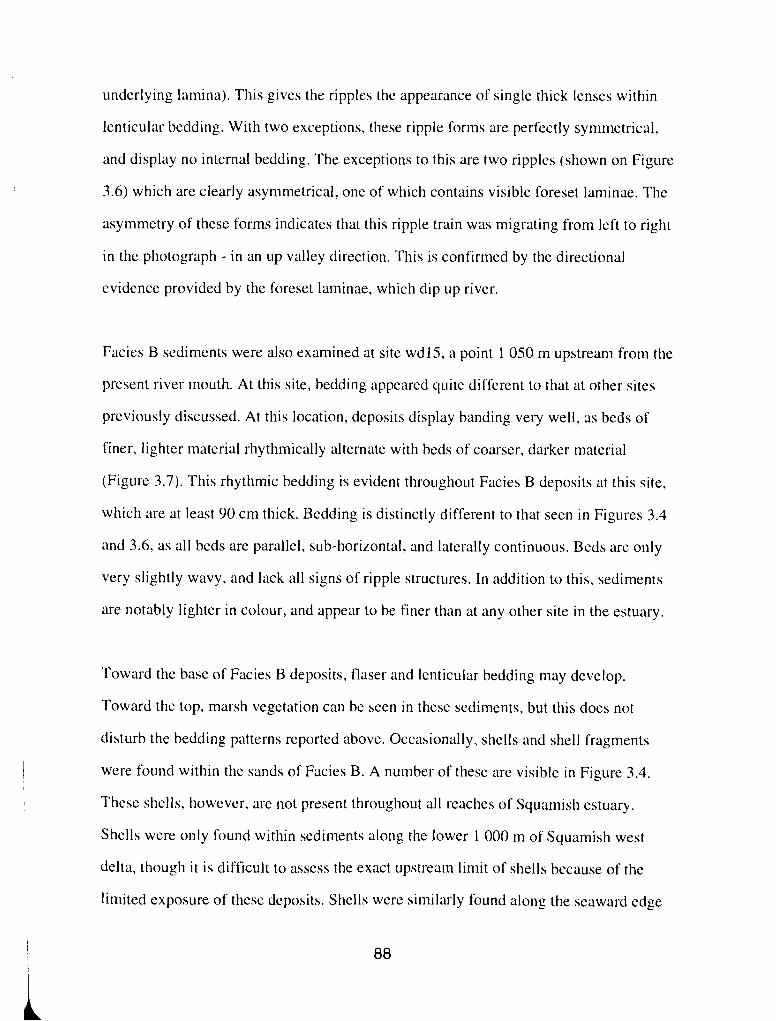
underlying lamina). This gives the ripples the appearance of single thick lenses within
lenticular bedding. With two exceptions, these ripple forms are perfectly symmetrical,
and display no internal bedding. The exceptions to this are two ripples (shown on Figure
3.6) which are clearly asymmetrical, one of which contains visible foreset laminae. The
asymmetry of these forms indicates that this ripple train was migrating from left to right
in the photograph - in an up valley direction. This is confirmed by the directional
evidence provided by the foreset laminae, which dip up river.
Facies B sediments were also examined at site wd15, a point 1 050 m upstream from the
present river mouth. At this site, bedding appeared quite different to that at other sites
previously discussed. At this location, deposits display banding very well, as beds of
finer, lighter material rhythmically alternate with beds of coarser, darker material
(Figure 3.7). This rhythmic bedding is evident throughout Facies B deposits at this site,
which are at least 90 cm thick. Bedding is distinctly different to that seen in Figures 3.4
and 3.6, as all beds are parallel, sub-horizontal, and laterally continuous. Beds are only
very slightly wavy, and lack all signs of ripple structures. In addition to this, sediments
are notably lighter in colour, and appear to be finer than at any other site in the estuary.
Toward the base of Facies B deposits, flaser and lenticular bedding may develop.
Toward the top, marsh vegetation can be seen in these sediments, but this does not
disturb the bedding patterns reported above. Occasionally, shells and shell fragments
were found within the sands of Facies B. A number of these are visible in Figure 3.4.
These shells, however, are not present throughout all reaches of Squarnish estuary.
Shells were only found within sediments along the lower 1 000 m of Squamish west
delta, though it is difficult to assess the exact upstream limit of shells because of the
limited exposure of these deposits. Shells were similarly found along the seaward edge
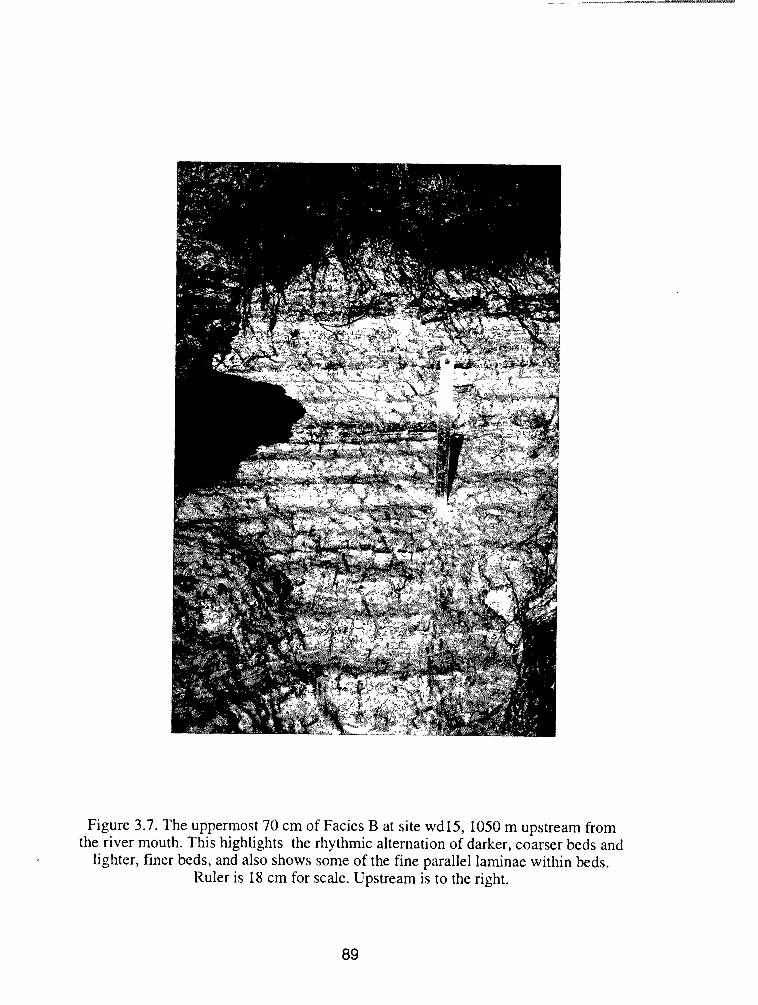
Figure 3.7. The uppermost 70 cm of Facies B at site wd15, 1050 m upstream from the river mouth. This highlights the rhythmic alternation of darker, coarser beds and
lighter, finer beds, and also shows some of the fine parallel laminae within beds. Ruler is 18 cm for scale. Upstream is to the right.

of both central and east deltas.
Facies B sediments are underlain by Facies A (an abrupt contact), and overlain by the
silty rhythmites of Facies C. In exposed sections, the contact between Facies B and C
appears abrupt, but on close examination it can be seen to be gradual. With increasing
height in Facies B, very fine (sometimes discontinuous) parallel organic layers are seen.
At this stage, the sediment does not appear to change character. Within 5 to 10 cm
(vertical distance), however, the organic layers become more distinct, and the sediment
(now in the transitional region between Facies A and B) rapidly fines upward to a silty
fine sand. All evidence indicates that, where Facies B is present, it is underlain by
sediments of Facies A. Unlike the deposits of Facies A, Facies B deposits are not
observed along the entire study reach, but instead appear to pinch-out between sites ny2
and ny3, around 3 300 m upstream from the river mouth. At their upstream most limit,
Facies B sediments are 15 cm thick.
Within the lower estuary, Facies B deposits appear to be present across the entire delta,
and are certainly visible at the base of sections along the west, central, and east deltas.
Toward the front of the west delta and along tidal channels, Facies B sediments have
been exposed and are being reworked. At these sites, sediments show numerous
bioturbation structures, and contain small shells. Bioturbators are believed to have
colonised these sediments after their re-exposure upon erosion, as bioturbation structures
were never noted in Facies B sediments at other locations.
Along west delta sections, where Facies B is most visible, deposits display great
variability in thickness over short distances. At site wd16, deposits are 182 cm thick,
while 2 10 m upstream, this same facies is only 48 cm thick.
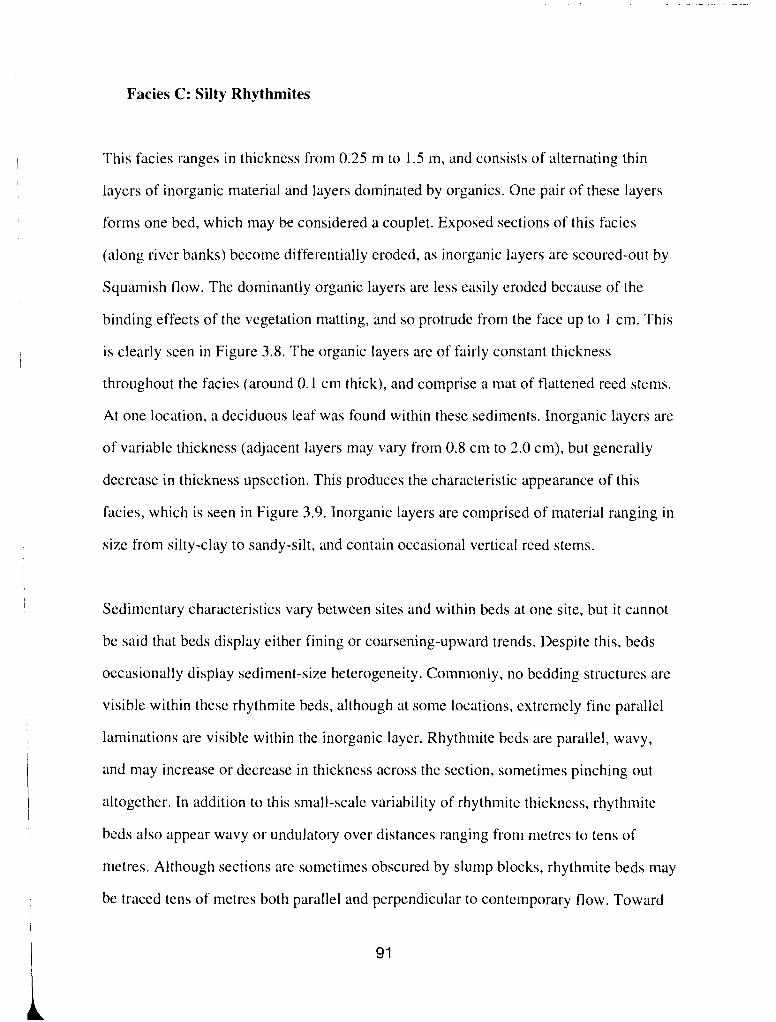
Facies C: Silty Rhythmites
This facies ranges in thickness from 0.25 m to 1.5 m, and consists of alternating thin
layers of inorganic material and layers dominated by organics. One pair of these layers
forms one bed, which may be considered a couplet. Exposed sections of this facies
(along river banks) become differentially eroded, as inorganic layers are scoured-out by
Squamish flow. The dominantly organic layers are less easily eroded because of the
binding effects of the vegetation matting, and so protrude from the face up to 1 cnl. This
is clearly seen in Figure 3.8. The organic layers are of fairly constant thickness
throughout the facies (around 0.1 cm thick), and comprise a mat of flattened reed stems.
At one location, a deciduous leaf was found within these sediments. Inorganic layers are
of variable thickness (adjacent layers may vary from 0.8 cm to 2.0 cm), but generally
decrease in thickness upsection. This produces the characteristic appearance of this
facies, which is seen in Figure 3.9. Inorganic layers are comprised of material ranging in
size from silty-clay to sandy-silt, and contain occasional vertical reed stems.
Sedimentary characteristics vary between sites and within beds at one site, but i t cannot
be said that beds display either fining or coarsening-upward trends. Despite this, beds
occasionally display sediment-size heterogeneity. Commonly, no bedding structures are
visible within these rhythmite beds, although at some locations, extremely fine parallel
laminations are visible within the inorganic layer. Rhythmite beds are parallel, wavy,
and may increase or decrease in thickness across the section, sometimes pinching out
altogether. In addition to this small-scale variability of rhythmite thickness, rhythmite
beds also appear wavy or undulatory over distances ranging from metres to tens of
metres. Although sections are sometimes obscured by slump blocks, rhythmite beds may
be traced tens of metres both parallel and perpendicular to contemporary flow. Toward
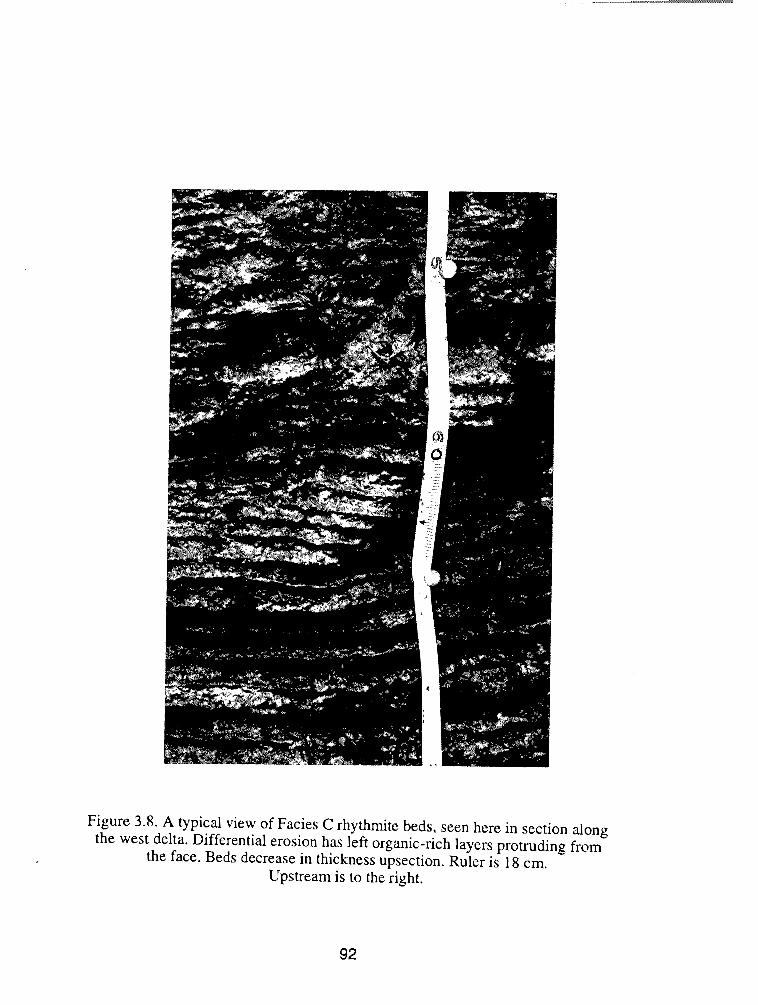
Figure 3.8. A typical view of Facies C rhythrmte beds, seen here in section dong the west delta. Differential erosion has left organic-rich layers protruding from
the face. Beds decrease in thickness upsection. Ruler is 18 cm. Upstream is to the right.
Figure 3.9. Site wd15 showing the typical section appearance along upper reaches of the west delta. Facies B, C, and E are seen here. Shovel is around 1 m high. Upstream
is to the right. Also shown is the section diagram for this site, and approximate facies boundaries.
the back of the west delta (approaching the valley wall), rhythmites appear different to
those exposed along the river bank. The inorganic component seems finer, and organic
layers are less clearly defined.
With increasing height in section, the deposits of Facies C gradually change character.
This transition occurs as beds decrease in thickness upsection to the point where distinct
alternating organic and inorganic layers can no longer be seen. At this point the
sediments appear to contain fine, parallel beds or laminae. Eventually, these laminae
become so fine that they can no longer be counted, and deposits take on the form of
massive, organic-rich fines.
This facies is observed throughout exposures along the lower 3 200 m of Squamish
River, and is visible along the tidal marsh cliffs of the west, central, and east deltas. It is
also visible in a few small sections within the Mamquam blind channel, although most
of the sections along this watercourse have been destroyed by industrial activity. Along
Squamish river sections, Facies C deposits thin with increasing distance upstream. As
deposits thin, they also become deeper in section. Toward the upstream limit of this
facies the fine sediments may contain sand interbeds, as recorded toward the upper limit
of the ox face (Shown in Figure 1 . 1 ) .
The rhythmite facies overlies Facies B, and along the lower 1 100 m reach of the west
delta, it is overlain by Facies D. The contact between Facies C and D is abrupt, as the
silty rhythmite sediment immediately changes to medium and coarse sand. This contact
is clearly seen because the coarser sands are more easily eroded by Squamish flow.
Because of this erosion, the upper surface of Facies C is often marked by a ledge
(produced by the removal of overlying sand) which may be up to 1 m wide. At all other
locations, where Facies D is absent from stratigraphic sections, Facies C is overlain by
Facies E. The contact between Facies C and E is gradational. Indeed, it is often difficult
to determine the location of this transition. It is most easily noted by a gradual increase
in grain-size to a fine sandy-silt. Along the ox face, the approximate location of this
transition is marked by a dark, wavy layer. On close examination, this dark layer
contains at least 5 dark (almost black) beds (around 0.2 cm thick) separated by the light
silts and sands observed toward the top of Facies C. Above this dark layer, material
coarsens to the sandy-silt of Facies E.
From this discussion, one can see that Facies C is characterised by a great deal of local
variability of bed thickness and composition. Despite this variability, however, the
rhythmite facies always retains the characteristic appearance shown in Figure 3.9. In
addition to these local differences, there is some indication that there exists a more
orderly, gradual change in rhythmite character with increasing distance upstream. The
nature of this change will be discussed later in this chapter.
Facies D: Sandy Rhythmites
This facies is only found within west delta sections along the lower 800 m of Squamish
River, where it overlies Facies C. Along this reach, sandy rhythmite sediments form the
uppermost deposits of the topset deltaic sequence. They comprise alternating layers of
predominantly medium to coarse sand (with some silt), and layers dominated by an
organic mass. When these deposits are dug-out or cleaned, they show little detail, but in
certain sections, differential erosion exposes organic-rich layers which become undercut
and protrude from the face. This differential erosion is clearly shown in Figure 3.10,
which shows Facies D and C exposed along the edge of the west delta, 240 m upstream
from the river mouth. The contact between these facies is shown by the lower limit of
the heavily oxidised sand, which forms the lower deposits of Facies D. The form of
these deposits after excavation is seen in Figure 3.26 (p. 144).
The organic-rich layers are dominated by a mass of small root systems and marsh Cwex
stems, which support sands. They have ill-defined boundaries and are much thicker than
organic layers previously described in Facies C, although it is almost impossible to
determine their exact thicknesses. The coarse inorganic layers of this facies vary
between 2 and 15 cm thick, and have numerous thin rootlets running vertically through
them. The inorganic material is extremely heterogeneous - material may vary from silt to
a very coarse sand, and contains parallel bedding. This bedding is seen in Figure 3.1 1,
which shows sediments of Facies C and D sediments exposed in a block which was dug
from the face. One can see from this photograph that unlike the bedding reported within
Facies B, changes in sediment size between beds show no cyclicity, or rhythmic
alteration from fine to coarse material. Bedding contacts may be either gradual or abrupt,
and the sands occasionally contain orange mottles. Figure 3.1 1 also shows the nature of
the contact between Facies C and D. The contact is marked by an immediate change in
sediment-size from silts and clays to fine to medium sands.
As organic-rich layers are poorly defined, it is almost impossible to determine the exact
number of beds within this facies. Perhaps the best exposures of this facies are seen on
the large slump blocks which lie at the base of all sections along both wd and ox faces.
Squamish flow differentially erodes the inorganic material, revealing a number of beds
which are capped by an organic mass. At one location, 16 organic layers were counted,
although this is considered to be an underestimation of the true number as there
appeared to be evidence of a number of smaller organic layers within one larger organic
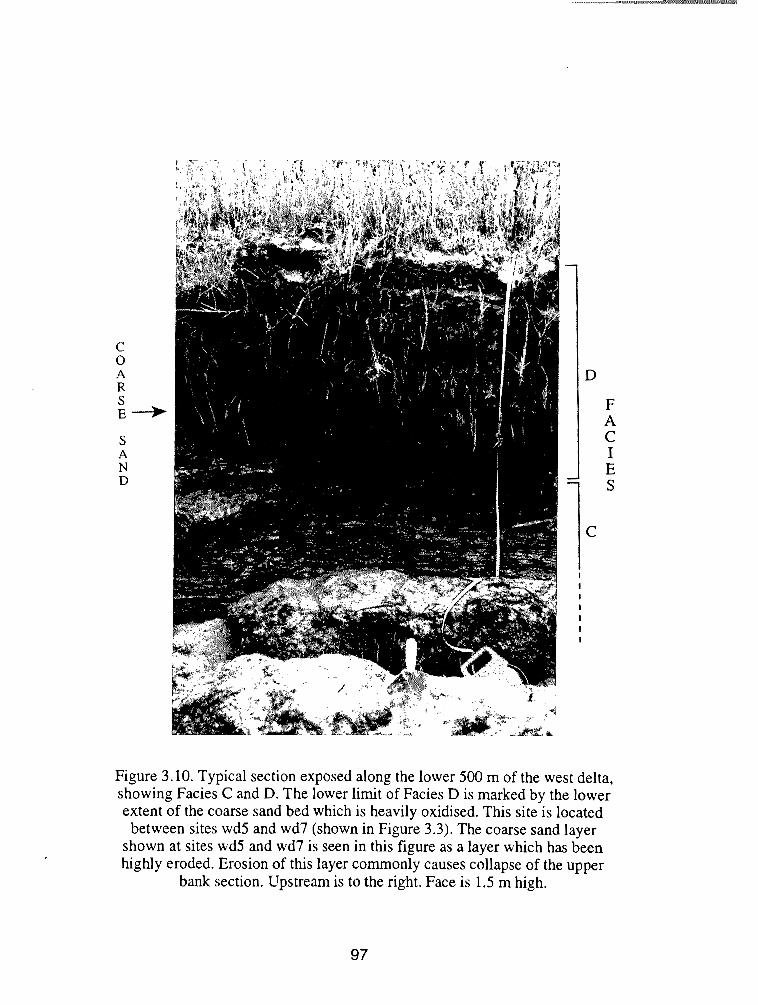
Figure 3.10. Typical section exposed along the lower 500 m of the west delta, showing Facies C and D. The lower limit of Facies D is marked by the lower extent of the coarse sand bed which is heavily oxidised. This site is located between sites wd5 and wd7 (shown in Figure 3.3). The coarse sand layer
shown at sites wd5 and wd7 is seen in this figure as a layer which has been highly eroded. Erosion of this layer commonly causes collapse of the upper
bank section. Upstream is to the right. Face is 1.5 rn high.
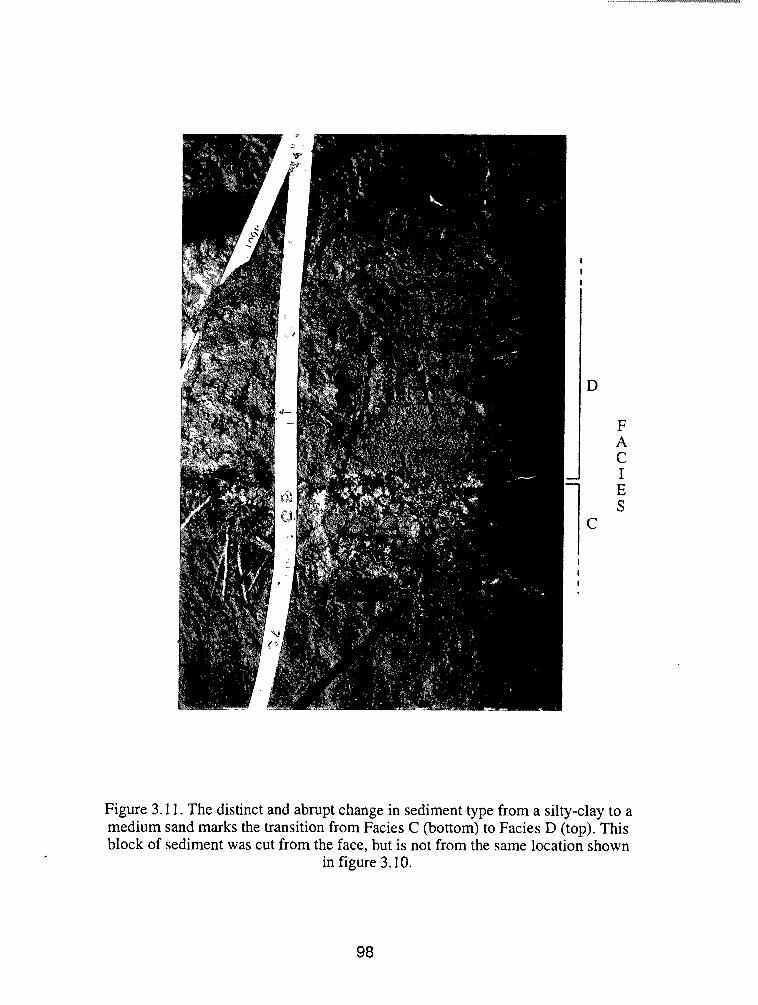
Figure 3.11. The distinct and abrupt change in sediment type from a silty-clay to a medium sand marks the transition from Facies C (bottom) to Facies D (top). This block of sediment was cut from the face, but is not from the same location shown
in figure 3.10.
mass. Despite this indication, these layers were not distinct enough to be confirmed as
individual beds.
In longitudinal section along the channel bank of the west delta, this facies is lenticular
in shape. It is thickest (134 cm) near site wd5, a point 200 m upstream from the river
mouth. This facies decreases in thickness in both upstream and downstream directions
until it is only 14 cm thick at site wd14, a point 960 m upstream. Further upstream from
this site, large rhythmites are not seen in section, but the upper few cm of sediment
remains slightly coarser than underlying sediment. Generally, however, Facies D
sediment-size tends to fine with increasing distance upstream. There is limited
information regarding the three-dimensional form of this facies (because of limited
exposure), but observations in tidal channels reveal that the large rhythmites do not
extend to the back of the west delta (toward the valley wall). In tidal channels near the
western edge of the west delta, Facies D was not detected. Instead, sections show the
characteristic rhythmic deposits of Facies C throughout.
Deposits of Facies D were noted at one other isolated location (site wd18) at the upper
limit of the west delta, as shown in Figure 3.3. These deposits were 60 cm thick, but
were neither laterally nor longitudinally extensive.
Facies E: Parallel-Laminated Sands with Peds
This facies gradationally overlies Facies C in sections along the upstream 500 m of the
west delta, and along the entire length of the ox face. The material within Facies E
generally is a fine to medium sand, though locally may contain considerable amounts of
silt. The sediments of this facies are characterised by ped development, and so have an
open framework produced by the pore spaces between peds. The formation of peds
within this material gives it the appearance of a sandy soil. It is often difficult to detect
bedding within these sediments, but from a distance, very fine, wavy parallel bedding
can be seen. At a number of locations, the sediments of this facies coarsen-upward from
a very silty sand to a pure sand. Sediments often contain orange mottles, particularly
toward the top of facies, and roots are found throughout. These roots are not those
observed in Facies C, but are larger, more extensive root systems running vertically
through the sediments.
This facies is interbedded with deposits of Facies F and G, which are coarser and finer
than Facies E sediments respectively. Contacts between Facies E, F, and G are always
abrupt. Because of this interbedding, it is difficult to assess the thickness of Facies E. If
one measures from the upper and lower limits of these deposits (which includes the
thickness of all interbedded facies), Facies E varies from 30 to 73 cm thick.
Facies F: Ripple-Bedded Sands
The deposits of Facies F are interbedded with those of Facies E and G, and form the
uppermost sediments along the upper 100 metres of the west delta, and all locations
upstream from this point. This facies is not observed in sections along the lower 1 400 m
of Squamish estuary. All contacts are abrupt, and occasionally, lower contacts are
erosional. These deposits are often underlain by a well developed root horizon (as seen
at site lb 1 in Figure 3.3), which may be up to 10 cm thick. Material ranges in size from
fine to coarse sand. Silt is entirely absent from this facies.

This facies, shown in Figure 3.12, is comprised of numerous beds separated by
reactivation, and more commonly, erosional surfaces. Facies thickness is highly
variable, and may exceed 1 15 cm. Beds contain fine parallel bedding which may be near
horizontal, wavy bedding, and climbing ripple lamination. Climbing ripples are seen to
develop from near-horizontal parallel beds, and both in-phase and in-drift (McKee,
1965) forms develop. Beds commonly contain small ground organic litter, which is
concentrated in ripple foresets, or forms fine laminae (within which sand content is low
by volume) within the parallel, wavy bedded sands. These organic beds may be traced
several metres in section. At a number of isolated locations, where these sands form the
uppermost deposits in section, sediments of this facies have been eroded from the near-
bank zone.
Along the ny face, where deposits of Facies F are thickest and dominate sections, the
number and thickness of fine, parallel beds increases. One such example is shown in
Figure 3.13, taken around one metre depth at site ny 1. As this example shows, these
parallel laminae may have a high coffee-ground organic content, or may mostly be clean
sands.
Facies G: Parallel-Laminated Silts and Clays
Deposits of this facies are only found within the middle part of the estuary along the ox
face. They are not found within sections along the west, central, or east deltas, and are
not observed in section from a point 2 700 m upstream from the river mouth to a point
well above Mamquam River confluence. The sediments of Facies G are silts and clays
which contain very fine, parallel, near-horizontal laminations. This material is often
detectable by its pink colour, and may contain fine laminae of coffee-ground organics.
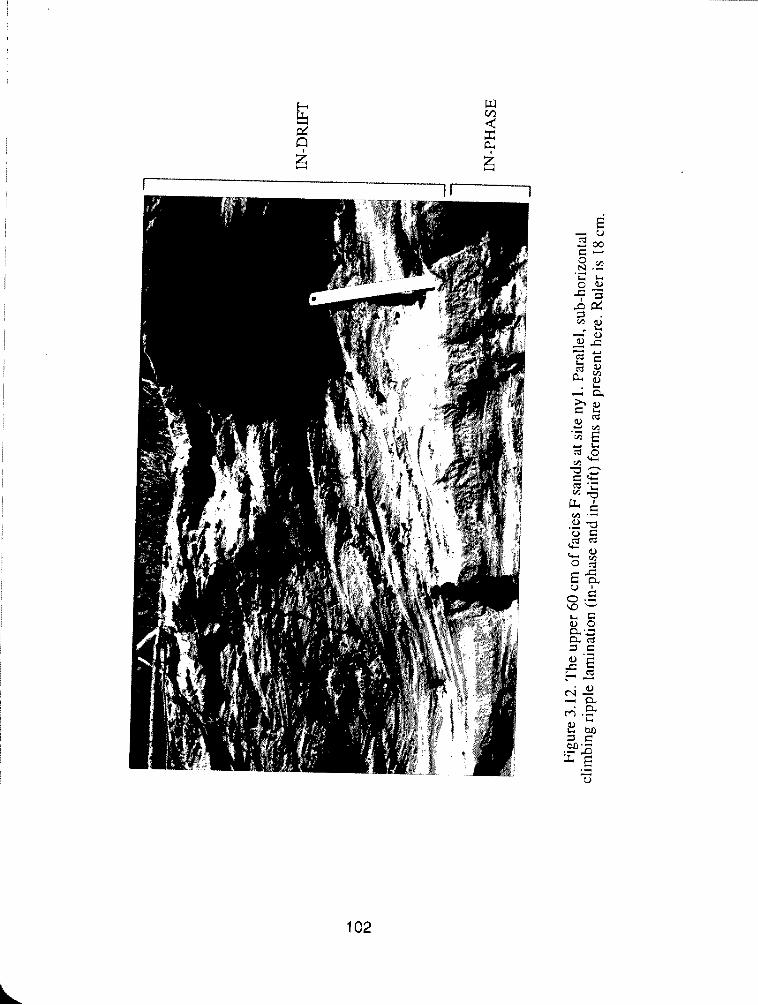
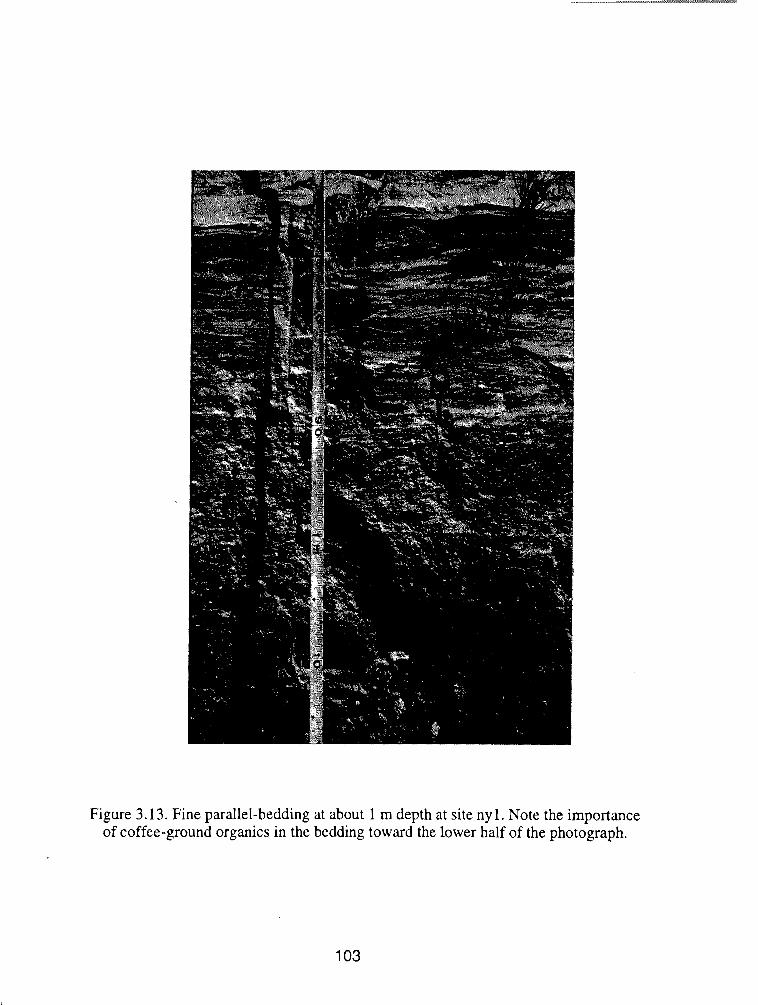
Figure 3.13. Fine parallel-bedding at about 1 m depth at site nyl. Note the importance of coffee-ground organics in the bedding toward the lower half of the photograph.
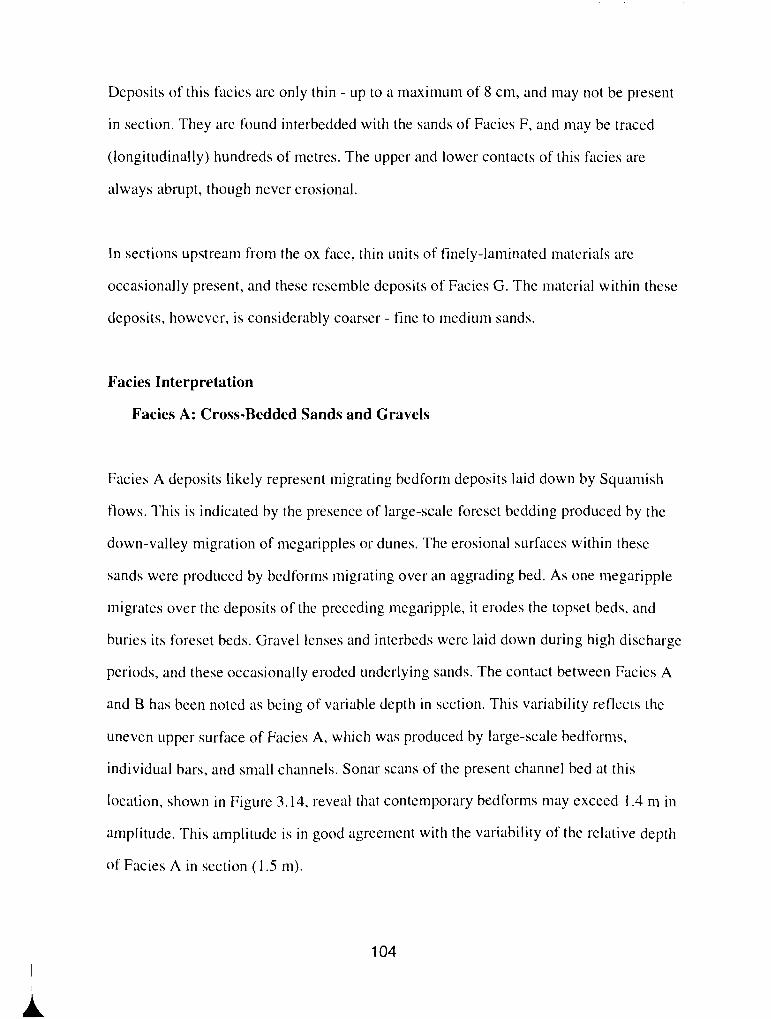
Deposits of this facies are only thin - up to a maximum of 8 cm, and may not be present
in section. They are found interbedded with the sands of Facies F, and may be traced
(longitudinally) hundreds of metres. The upper and lower contacts of this facies are
always abrupt, though never erosional.
In sections upstream from the ox face. thin units of finely-laminated materials are
occasionally present, and these resemble deposits of Facies G. The material within these
deposits, however, is considerably coarser - fine to medium sands.
Facies Interpretation
Facies A: Cross-Bedded Sands and Gravels
Facies A deposits likely represent migrating bedform deposits laid down by Squamish
flows. This is indicated by the presence of large-scale foreset bedding produced by the
down-valley migration of megaripples or dunes. The erosional surfaces within these
sands were produced by bedforrns rnigrating over an aggrading bed. As one megaripple
migrates over the deposits of the preceding megaripple, it erodes the topset beds, and
buries its foreset beds. Gravel lenses and interbeds were laid down during high discharge
periods, and these occasionally eroded underlying sands. The contact between Facies A
and B has been noted as being of variable depth in section. This variability reflects the
uneven upper surface of Facies A, which was produced by large-scale bedforms,
individual bars, and small channels. Sonar scans of the present channel bed at this
location, shown in Figure 3.14, reveal that contemporary bedforms [nay exceed 1.4 m in
amplitude. This amplitude is in good agreement with the variability of the relative depth
of Facies A in section (1.5 m).
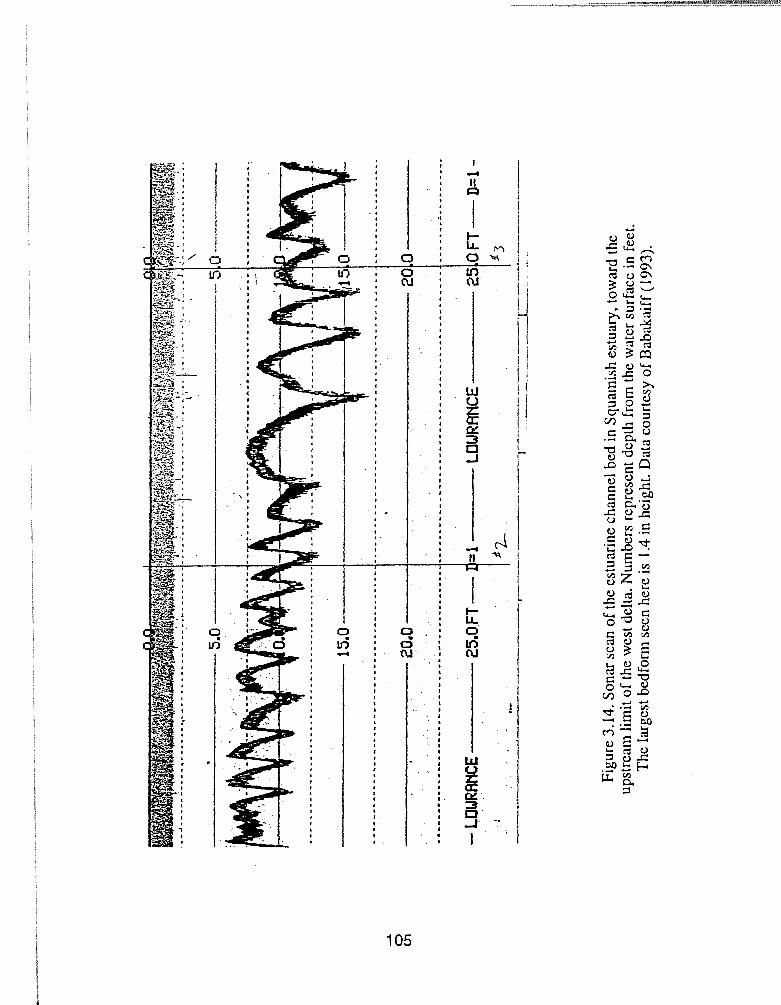
- LUW
RRNC
E LU
WRR
NCE
I .
- .-
-11-
r----
- ----
,--- ---
., I
___*
- --_
Fig
ure
3.14
. S
onar
scan
of
the
estu
arin
e ch
anne
l bed
in S
quam
ish
estu
ary,
tow
ard
the
upst
ream
lim
it of
the
wes
t del
ta. N
umbe
rs r
epre
sent
dept
h fr
om th
e w
atcr
sur
face
in f
eet.
Thc
larg
est b
edfo
rm s
cen
here
is 1
.4 i
n he
ight
. D
ata
cour
tesy
of
Bab
akai
ff (
1993
).
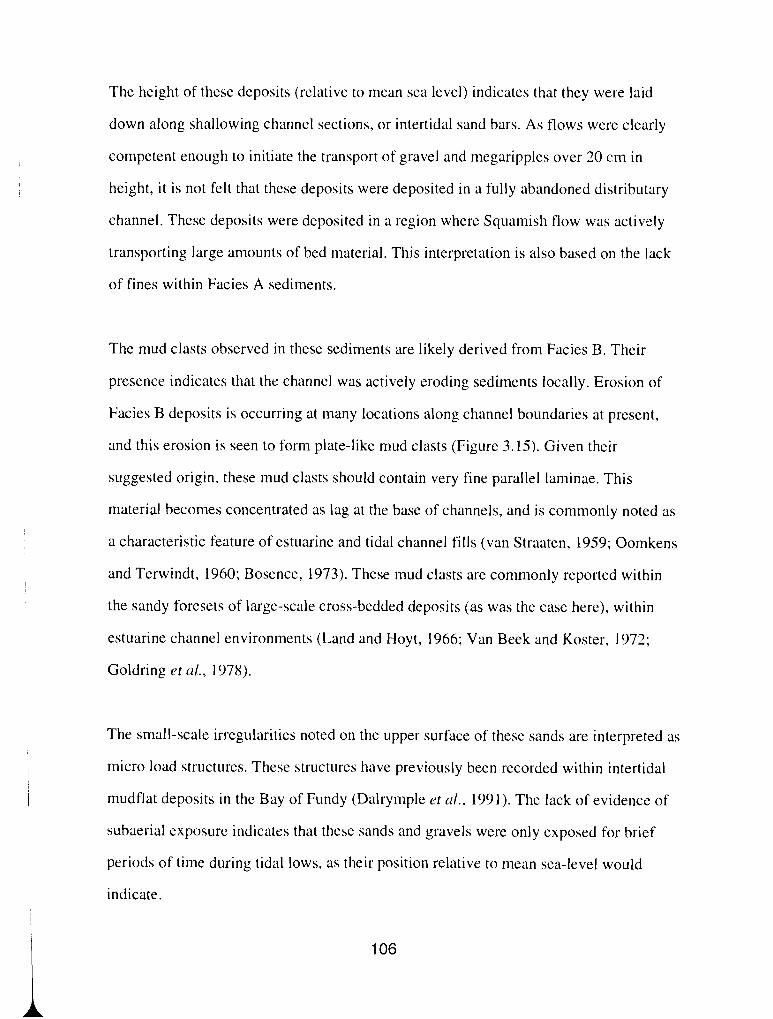
The height of these deposits (relative to mean sea level) indicates that they were laid
down along shallowing channel sections, or intertidal sand bars. As flows were clearly
competent enough to initiate the transport of gravel and megaripples over 20 cm in
height, it is not felt that these deposits were deposited in a fully abandoned distributary
channel. These deposits were deposited in a region where Squamish flow was actively
transporting large amounts of bed material. This interpretation is also based on the lack
of fines within Facies A sediments.
The mud clasts observed in these sediments are likely derived from Facies B. Their
presence indicates that the channel was actively eroding sediments locally. Erosion of
Facies B deposits is occurring at many locations along channel boundaries at present,
and this erosion is seen to form plate-like mud clasts (Figure 3.15). Given their
suggested origin, these mud clasts should contain very fine parallel laminae. This
material becomes concentrated as lag at the base of channels, and is commonly noted as
a characteristic feature of estuarine and tidal channel fills (van Straaten, 1959; Oomkens
and Terwindt, 1960; Bosence, 1973). These mud clasts are commonly reported within
the sandy foresets of large-scale cross-bedded deposits (as was the case here), within
estuarine channel environments (Land and Hoyt, 1966; Van Beek and Koster, 1972;
Goldring et d., 1978).
The small-scale irregularities noted on the upper surface of these sands are interpreted as
micro load structures. These structures have previously been recorded within intertidal
mudflat deposits in the Bay of Fundy (Dalrymple et al., 1991). The lack of evidence of
subaerial exposure indicates that these sands and gravels were only exposed for brief
periods of time during tidal lows, as their position relative to mean sea-level would
indicate.
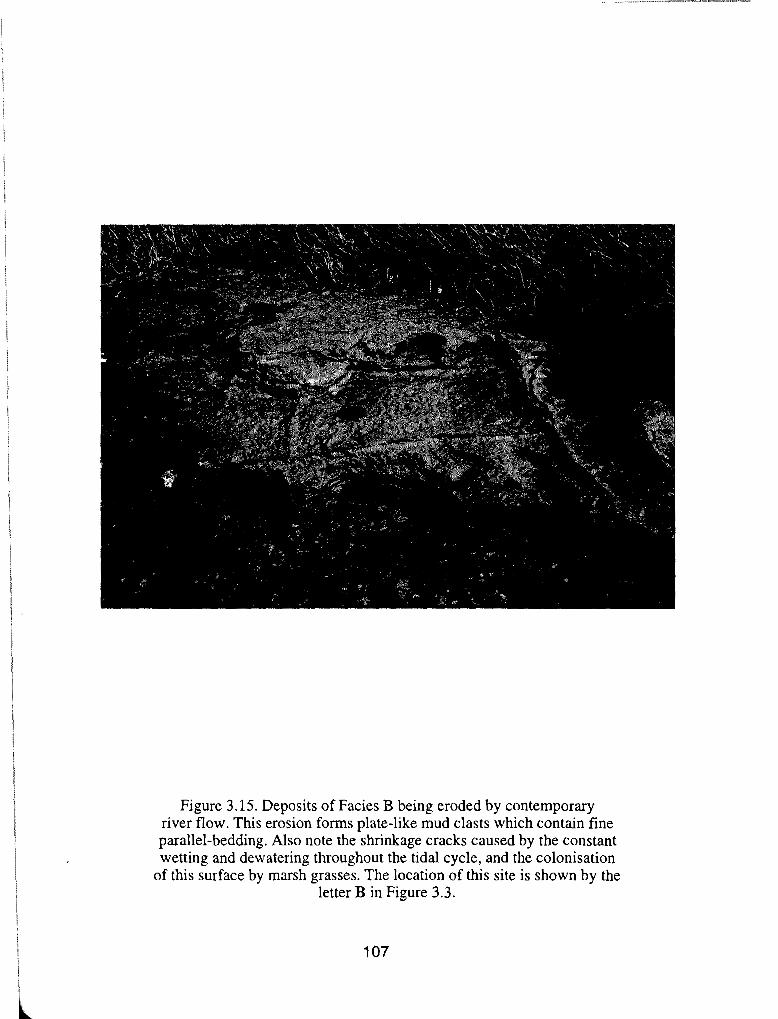
Figure 3.15. Deposits of Facies B being eroded by contemporary river flow. This erosion forms plate-like mud clasts which contain fine parallel-bedding. Also note the shrinkage cracks caused by the constant wetting and dewatering throughout the tidal cycle, and the colonisation
of this surface by marsh grasses. The location of this site is shown by the letter B in Figure 3.3.
Facies B: Finely-Laminated Sands and Silts
It is clear from the description of these deposits that interpretation of their genesis
cannot rely on a single model. The local variability of these deposits, which has been
recorded in Figures 3.4, 3.5,3.6, and 3.7, indicates dynamic changes in modes of
sedimentation. Despite this observation, this fine rhythmically laminated bedding
(Reineck, 1967) is interpreted here as tidal in origin. The bedding and sediment-size
characteristics of Facies B deposits are very similar to intertidal deposits described by
many authors, but particularly the tidal bedding of Reineck and Singh (1980). The silt
and clay laminae were deposited during high tide periods. The term tidal standstill has
been avoided here, as it is not felt that current velocities were necessarily at or near zero.
The coarser laminae were laid down during periods of limited tidal modification of flow.
These periods are thought to include the periods of tidal drop, and most of the rising
limb of the following high tide. Deposition of silt and clay need not be limited to brief
periods of high tide, but may also occur during periods of tidal current activity, as shown
by Kirkby and Parker (1983). With the exception of periods of high river stage,
deposition will not occur during low tide, as intertidal sand surfaces will be exposed
above the water line. While fluctuations in current velocity are capable of producing
finely-laminated sandhilt bedding, this is not thought to be the case here. I think that the
alternation of sand and silt is too rhythmic, and facies thickness too great (up to 182 cm)
to have been produced by current activity alone.
Unfortunately, because of the limited exposure of these sediments, one cannot determine
the exact nature of tidal rhythmicity recorded by these silt and sand laminations. It is
postulated, however, that these sediments record neap-spring tidal cyclicity. If this is
correct, then each of the darker, coarser beds seen in Figure 3.7 represent deposition
over the tidal neap, while dominantly light, finer beds represent deposition over the tidal
spring. During tidal neap periods, tidal flux is least, and as such, tides are unable to
modify Squamish flow to a great extent. This results in the deposition of thicker, coarser
beds of sand produced by Squamish River current activity. During tidal spring periods,
tidal flux is greater and exerts more control on river flow. During tidal rise and peak,
flow velocities are reduced enough to allow the settling of silt and clay from suspension.
The greater degree of tidal modification of flow is reflected in the greater concentration
of fines in sediments. Decreased energy conditions are also indicated by the reduction of
sedimentation rates over this period (lighter beds are thinner than darker beds). If this
interpretation is correct then the annual sedimentation rate at the location shown in
Figure 3.7 would be around 100 cm. This in turn would mean that these intertidal sands
were deposited over a two year period. These figures assume that sedimentation rates
remain roughly constant over the year - an assumption which is not necessarily correct,
as will be discussed later. Although this rate of sedimentation appears very large, it is
not thought to be an unreasonable rate of deposition from this high energy, sediment-
laden river. Lanier et ul. (1993) examined tidal bedding with preserved neap-spring
rhythmicity in ancient sequence which they interpret as tidal flat influenced by diurnal
tidal cyclicities and a high input of sediment from a fluvial source. At one location,
approximately 180 cm of tidal flat sands were deposited over a period of one month. In
less extreme cases calculated average sedimentation rates are around 380 crn/yr (Lanier
et al., 1993). Similarly, Dalrymple et ul. (1991) estimate that the maximum
sedimentation rates within Bay of Fundy upper tidal flats are approximately 700 crn/yr.
As has been stated, there is insufficient data to test this hypothesis, but there is limited
information to suggest that it is correct. At one location, shown in Figure 3.7, it was
possible to count the number of alternating sand and siltklay laminae within one of the
dominantly dark beds. Within this bed (shown more closely in Figure 3.16), 28 layers
were counted in total (14 sand and 14 siltklay layers). This is in excellent accordance
with the theoretical number (28.5) of rising and falling tides over a one week period
within a semi-diurnal system such as this (Visser, 1980). It is suggested that the dark bed
shown here represents deposition over one neap tidal cycle (one week). The nature of the
mixed, semi-diurnal tidal system which influences Squamish estuary is shown in Figure
3.17. Over this particular neap-spring period, 29 high tide periods were recorded. Figure
3.18 shows the nature of daily tidal fluctuations, and the proposed depositional product
of this flux. This figure shows that siltklay laminae become deposited at and around
daily high-high tide and low-high tide, and that cyclic variations in tidal stage produce
rhythmically alternating sand and siltklay layers. In this manner, the 14 fine, light
coloured laminae within the dark layer in Figure 3.16 (which is 2.5 cm thick) were
deposited over a 7 day period.
Figure 3.18 also shows the approximate location of the upper surface of Facies B in
relation to different tidal heights. One can see from this that sands become exposed over
a period of time surrounding low-low tide. This exposure produces a period of time
during which no deposition can occur, but when erosion could presumably occur.
During the tidal drop and initial stages of tidal rise immediately before and after this
period of non-deposition, sand will be transported by Squamish flow. If this supposition
is correct, then every other sand layer should comprise material which was deposited
over two distinct periods of time separated by a number of hours. Extremely detailed
analysis of this fine bedding may be able to detect a reactivation surface, or possibly an
erosional surface within alternate sand beds.

Figure 3.16. Close view of Facies B deposits previously seen in Figure 3.7. In the centre of this photograph one of the dominantly dark beds (which is 2.5 crn thick) shows very fine parallel lamination. 28 distinct groups of laminae
were counted here.
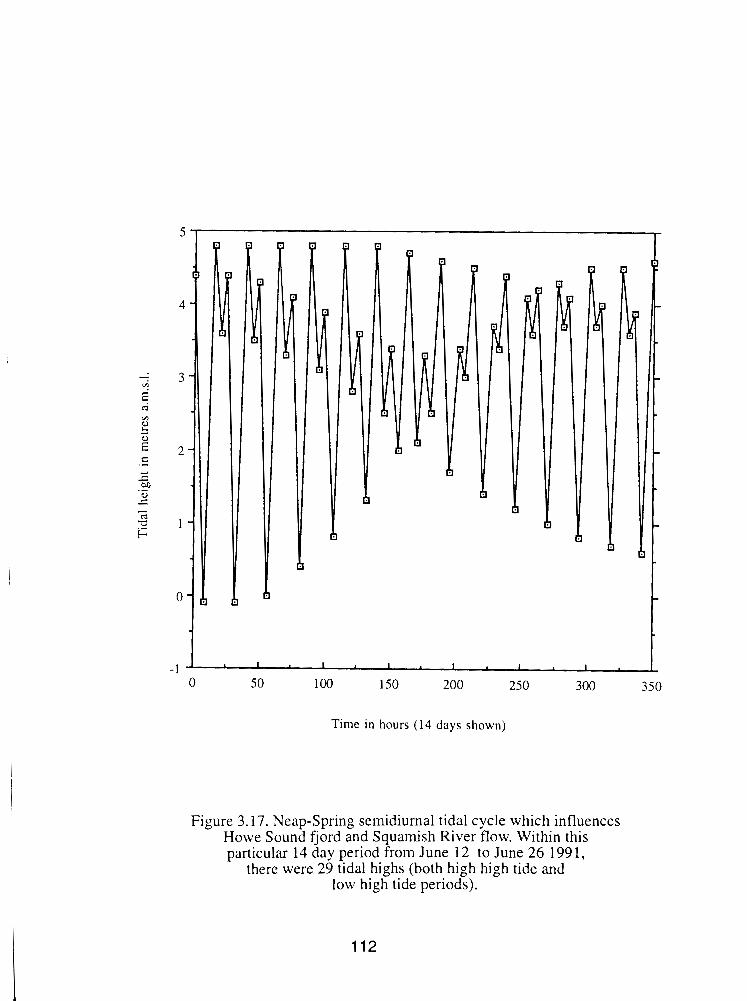
I I I I I I
0 I
5 0 100 150 200 250 300 350
Time in hours (14 days shown)
Figure 3.17. Neap-Spring semidiurnal tidal cycle which influences Howe Sound fjord and Squamish River flow. Within this particular 14 day period from June 12 to June 26 199 1,
there were 29 tidal highs (both high high tide and low high tide periods).
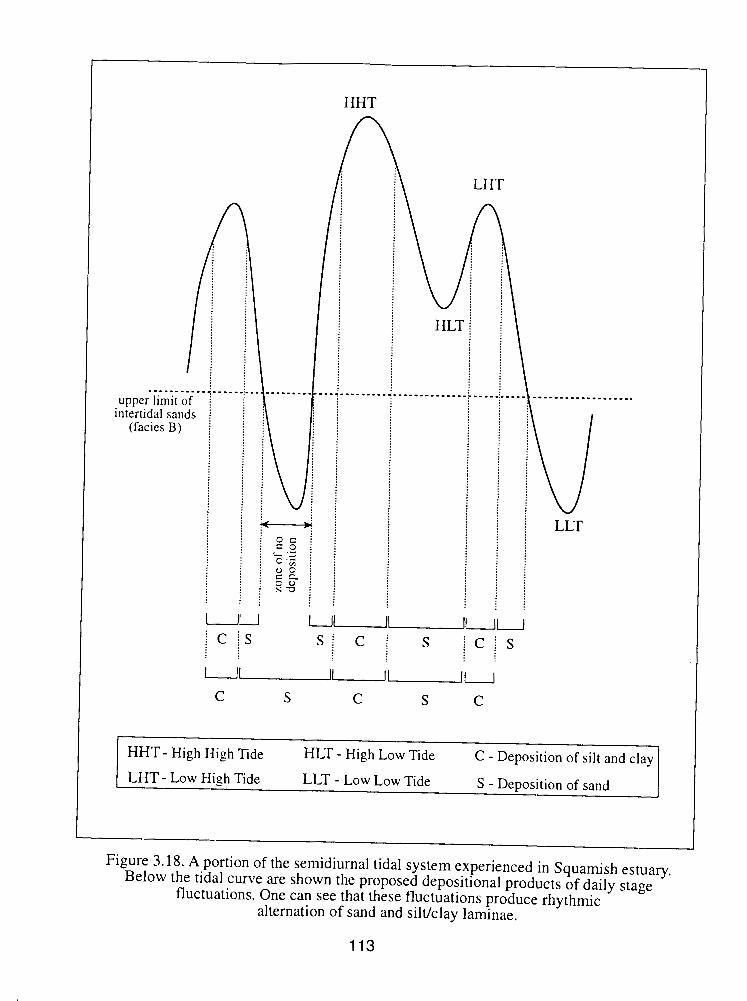
.------___ upper limit of
intertidal sands (facies B)
HHT
\ LHT
LLT
HHT - High High Tide HLT - High Low Tide C - Deposition of silt and clay LHT - Low High Tide LLT - Low Low Tide S - Deposition of sand
L
Figure 3.18. A portion of the semidiurnal tidal system experienced in Squamish estualy. Below the tidal curve are shown the proposed depositional products of daily stage
fluctuations. One can see that these fluctuations produce rhythmic alternation of sand and silt/clay laminae.
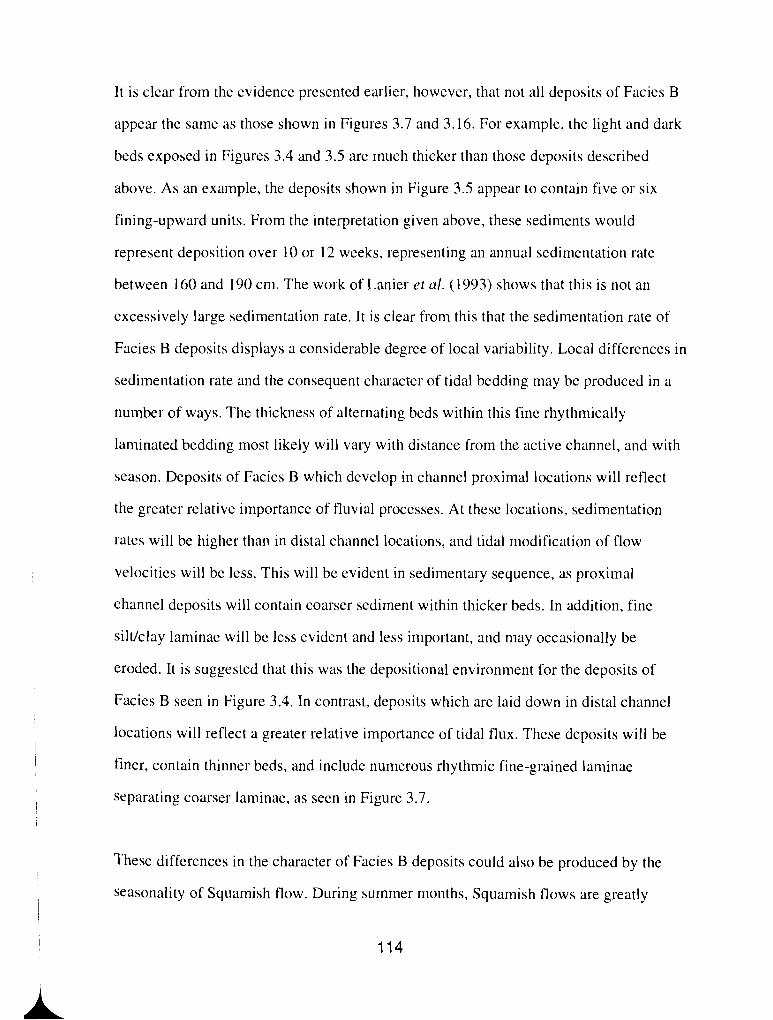
It is clear from the evidence presented earlier, however, that not all deposits of Facies B
appear the same as those shown in Figures 3.7 and 3.16. For example, the light and dark
beds exposed in Figures 3.4 and 3.5 are much thicker than those deposits described
above. As an example, the deposits shown in Figure 3.5 appear to contain five or six
fining-upward units. From the interpretation given above, these sediments would
represent deposition over 10 or 12 weeks, representing an annual sedimentation rate
between 160 and 190 cm. The work of Lanier et al. (1993) shows that this is not an
excessively large sedimentation rate. It is clear from this that the sedimentation rate of
Facies B deposits displays a considerable degree of local variability. Local differences in
sedimentation rate and the consequent character of tidal bedding may be produced in a
number of ways. The thickness of alternating beds within this fine rhythmically
laminated bedding most likely will vary with distance from the active channel, and with
season. Deposits of Facies B which develop in channel proximal locations will reflect
the greater relative importance of fluvial processes. At these locations, sedimentation
rates will be higher than in distal channel locations, and tidal modification of flow
velocities will be less. This will be evident in sedimentary sequence, as proximal
channel deposits will contain coarser sediment within thicker beds. In addition, fine
silt/clay laminae will be less evident and less important, and may occasionally be
eroded. It is suggested that this was the depositional environment for the deposits of
Facies B seen in Figure 3.4. In contrast, deposits which are laid down in distal channel
locations will reflect a greater relative importance of tidal flux. These deposits will be
finer, contain thinner beds, and include numerous rhythmic fine-grained laminae
separating coarser laminae, as seen in Figure 3.7.
These differences in the character of Facies B deposits could also be produced by the
seasonality of Squamish flow. During summer months, Squamish flows are greatly
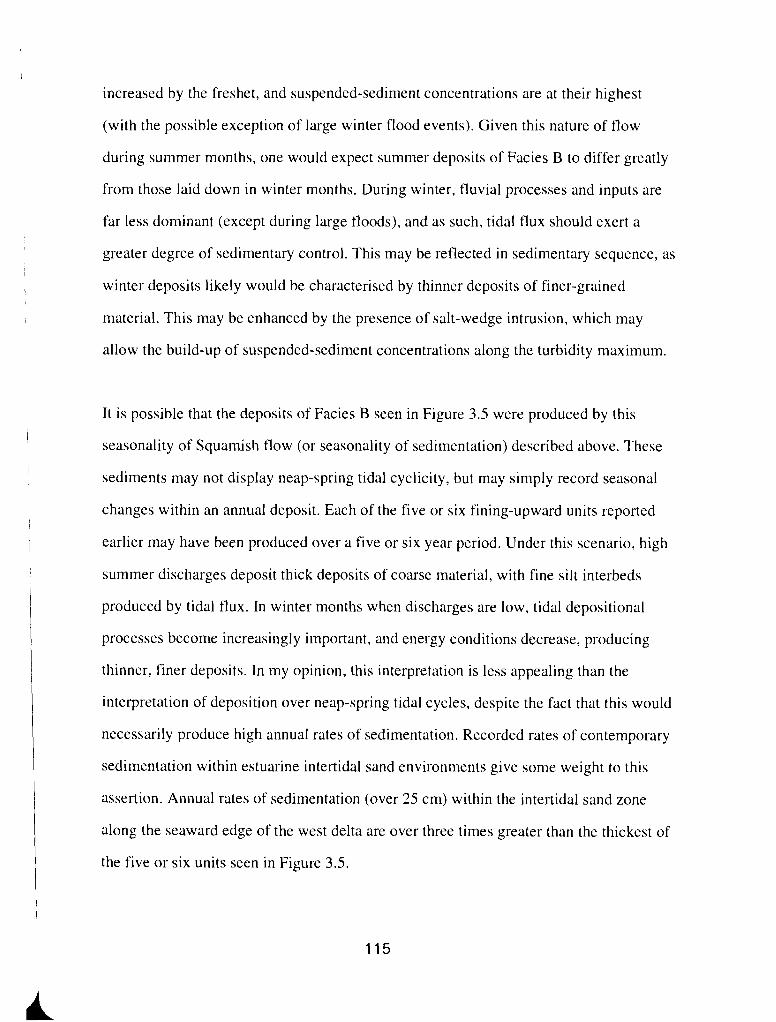
increased by the freshet, and suspended-sediment concentrations are at their highest
(with the possible exception of large winter flood events). Given this nature of flow
during summer months, one would expect summer deposits of Facies B to differ greatly
from those laid down in winter months. During winter, fluvial processes and inputs are
far less dominant (except during large floods), and as such, tidal flux should exert a
greater degree of sedimentary control. This may be reflected in sedimentary sequence, as
winter deposits likely would be characterised by thinner deposits of finer-grained
material. This may be enhanced by the presence of salt-wedge intrusion, which may
allow the build-up of suspended-sediment concentrations along the turbidity maximum.
It is possible that the deposits of Facies B seen in Figure 3.5 were produced by this
seasonality of Squamish flow (or seasonality of sedimentation) described above. These
sediments may not display neap-spring tidal cyclicity, but may simply record seasonal
changes within an annual deposit. Each of the five or six fining-upward units reported
earlier may have been produced over a five or six year period. Under this scenario, high
summer discharges deposit thick deposits of coarse material, with fine silt interbeds
produced by tidal flux. In winter months when discharges are low, tidal depositional
processes become increasingly important, and energy conditions decrease, producing
thinner, finer deposits. In my opinion, this interpretation is less appealing than the
interpretation of deposition over neap-spring tidal cycles, despite the fact that this would
necessarily produce high annual rates of sedimentation. Recorded rates of contemporary
sedimentation within estuarine intertidal sand environments give some weight to this
assertion. Annual rates of sedimentation (over 25 cm) within the intertidal sand zone
along the seaward edge of the west delta are over three times greater than the thickest of
the five or six units seen in Figure 3.5.
In conclusion, Facies B deposits display fine rhythmically laminated bedding (Reineck,
1967), which I believe may more accurately be termed tidal bedding (Johnston, 1922).
Further examination likely will show that neap-spring tidal cyclicity is preserved in the
sediments of Facies B throughout much of the lower estuary. The preceding discussion
has shown that these deposits display a great deal of variability throughout Squamish
estuary. Similar variability was reported from the intertidal sands and muds of the
Cobequid Bay-Salmon River estuary, Bay of Fundy (Dalrymple et al., 1991). These
authors logged sections of intertidal deposits on a millinletre scale, and were able to
recognise sedimentation produced by individual flood and ebb tides, diurnal inequality
of the tides, neap-spring tidal cycles, and annual deposits. It is clear that the deposits of
Facies B need to be examined at an extremely fine scale if precise and conclusive proof
of the nature of tidal influence is to be found. Such fine scale analyses have previously
been employed with good success by Kasse ( 1 986) and Dalrymple et al. (199 1).
The presence of preserved ripples within Facies B deposits may be an important
indicator of the environment of deposition of these sediments. The presence of ripple
forms which were clearly migrating against Squamish River flow may provide clear
evidence of the estuarine setting of these deposits. Evidence of reversing current activity
is one of the key indicators of tidal environment. Unfortunately, the fact that such
features are present is not unequivocal evidence of reversing currents, as these ripples
could have been formed by wave action in shallow waters. It is not unreasonable to
expect that wind-generated waves could induce sediment-transport over intertidal sands
which are inundated by shallow waters during late tidal drop or early tidal rise.
Unfortunately, ripple forms produced by wave and currents are not always simple or
even possible to differentiate. While wave ripples are commonly assumed to be typified
by symmetrical crests, they often have an asymmetrical form (Tanner, 1967). Also,
while the majority of wave ripples display bi-directional, chevron-like laminae (Reineck
and Singh, 1980), Newton (1968) showed that the majority of wave ripples in the
nearshore environment displayed unidirectional foreset laminae. These are produced
when flow velocities in one direction exceed those in the opposing direction. Where
asymmetrical wave ripples form with unidirectional foreset laminae, they will be
difficult to distinguish from current ripples with straight crests (Reineck and Singh,
1980). Tanner (1967) developed a number of indices to differentiate asymmetrical wave
and current ripples, and these are tested below.
Of the indices reported by Tanner (1967), the ripple index (RI) and the ripple symmetry
index (RSI) are probably of best interpretive value, and the simplest to compute. The RI
is calculated by dividing the ripple wave length by the ripple height. The RSI is
calculated by dividing the straight line distance from the highest point on the ripple crest
to the lowest point in the trough, along the lesser slope, by the same distance along the
steeper slope. Calculated dimensionless RI values for the two asymmetrical ripples
shown in Figure 3.6 are 10.8 and 11.3, while RSI values are 2.3 and 3.95. These values
may be compared with those regions which distinguish between wave-formed and
current-formed ripples, as highlighted in Figure 3.19.
One can see from this diagram that both the RI values lie within the overlap region
between wave and current ripples. Of the RSI values, one is classified as of wave origin,
and the other is classified as of current origin. Unfortunately, none of the ripple forms
displayed any of the features which Evans (1949) considered unique to either wave or
current formation (such as double ripple marks or secondary ridges within ripple
troughs). These data are inconclusive, particularly given the limited number of ripple
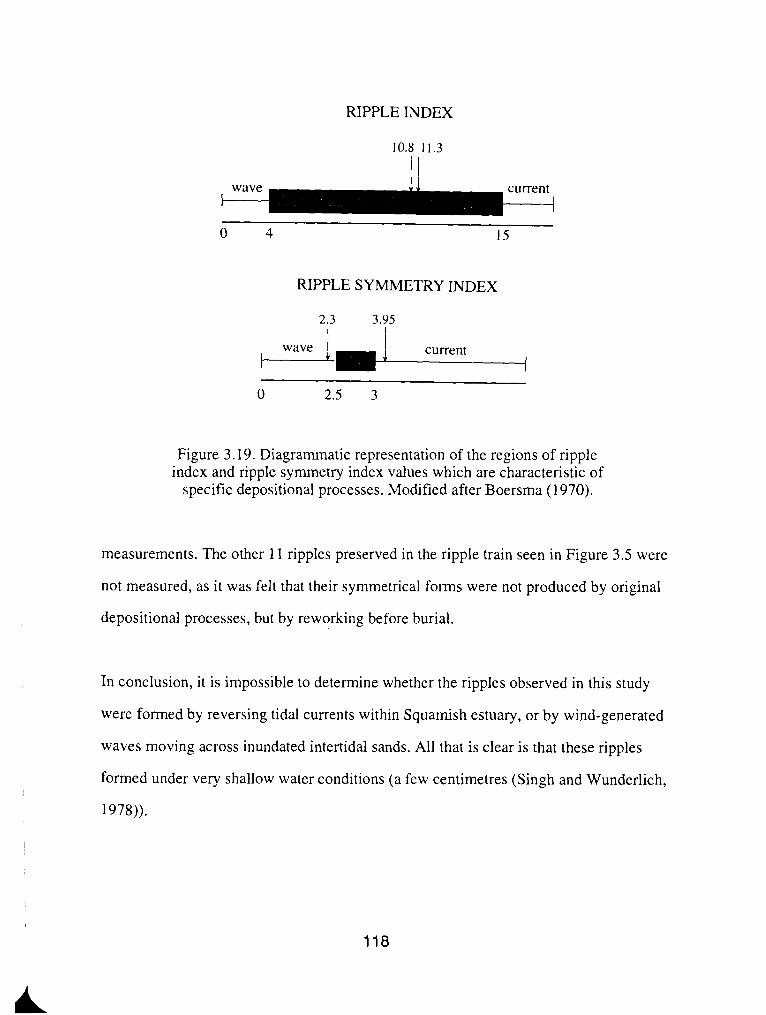
RIPPLE INDEX
10.8 11.3
RIPPLE SYMMETRY INDEX
2.3 3.95
Figure 3.19. Diagrammatic representation of the regions of ripple index and ripple symmetry index values which are characteristic of
specific depositional processes. Modified after Boersma (1970).
measurements. The other 11 ripples preserved in the ripple train seen in Figure 3.5 were
not measured, as it was felt that their symmetrical forms were not produced by original
depositional processes, but by reworking before burial.
In conclusion, it is impossible to determine whether the ripples observed in this study
were formed by reversing tidal currents within Squamish estuary, or by wind-generated
waves moving across inundated intertidal sands. All that is clear is that these ripples
formed under very shallow water conditions (a few centimetres (Singh and Wunderlich,
1978)).
Lastly, the highly variable thickness of this facies likely reflects differences in the
relative height of the upper surface of Facies A in section. The upper limit of Facies B is
determined by the elevation above mean low tide which allows vegetation colonisation.
Therefore, the thickness of this facies is determined entirely by the depth of the lower
contact with Facies A.
Facies C: Silty Rhythmites
The rhythmite deposits of Facies C clearly are tidal marsh rhythmites. Over the course of
one year, these deposits can be seen forming in the tidal marsh environments of the
west, central, and east deltas of Squamish estuary. These deposits have previously been
described in some detail by Bouma (1963), Evans ( 1965), and Redfield (1972). In this
environment, the inorganic layers are thought to be deposited primarily during combined
flood and high tide periods. The majority of this deposition occurs during summer
months, when tidal amplitudes are greatest, river flow is greatest on average, suspended-
sediment concentrations are highest, and when vegetation cover is greatest. From the
nature of bedding within these inorganic layers, deposition appears to have occurred
over many flood events. This statement is supported by sediment accretion data
collected over the summer of 1992. Sediment deposition was recorded within the west
delta using a number of marker beds (orange spray and small plates), over a number of
time scales. Marker beds placed within the lower marsh recorded thin, discontinuous
films of sediment which was deposited over one tidal cycle. These markers became
completely covered after five days.
The flat organic mats are produced by the autumn collapse of dead marsh vegetation
cover. This vegetation lies flat on the delta surface, and gradually becomes covered as

the delta accretes. In a number of locations on the central delta these organic layers
became exposed due to erosion of the overlying material. On these occasions, Carex
lyngbyei stems were pointing up estuary (with their root systems down estuary). In this
environment, these sedges are less likely to have been laid down by tidal currents than
by strong up valley sea-breeze winds, so they should not be used as palaeoflow
indicators. This marsh vegetation death and burial, which has been observed in
Squamish estuary, produces annual rhythmite beds within tidal marsh deposits. This
interpretation of stratigraphic rhythmicity produced by annual sedimentation was also
made by Redfield (1972) and Yeo and Risk (198 l), although these authors provided
different interpretations of the exact processes and seasonality of sedimentation.
The upsection decrease in bed thickness recorded here has previously been described as
an upsection increase in organics (Yeo and Risk, 1981). From an examination of the
organic-C content of the deposits of Facies C (shown in Figure 3.20), this trend can be
seen. The uppermost 16 cm of sediment, which record a decreasing organic content, are
associated with deposits of Facies E. I think that it is important to note, however, that
any increase in organics is relative, and driven by a decrease of inorganic input to the
marsh system, rather than increasing vegetation density or biomass production.
In addition to this, decreasing bed thicknesses can result in an incorrect record of
increasing organic content upsection which is induced by sampling technique. If a fixed
sampling thickness is used, more organic layers are sampled at the top of the facies than
are sampled toward the bottom, resulting in an apparent increase in organic content. The
nature of this decreasing sedimentation rate over time likely is produced primarily by the
nature of tidal flux within this estuary. In other words, tidal marsh sedimentary
sequences record decreasing durations of tidally-driven inundation, and decreasing
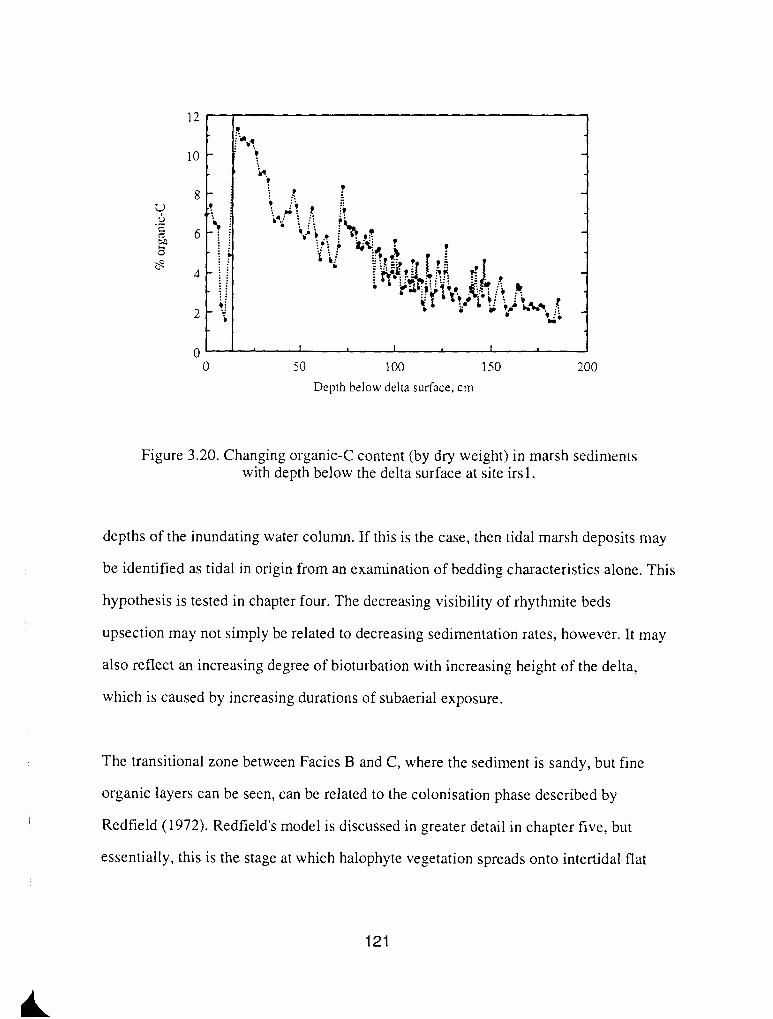
Figure 3.20. Changing organic-C content (by dry weight) in marsh sediments with depth below the delta surface at site irs 1.
depths of the inundating water column. If this is the case, then tidal marsh deposits may
be identified as tidal in origin from an examination of bedding characteristics alone. This
hypothesis is tested in chapter four. The decreasing visibility of rhythmite beds
upsection may not simply be related to decreasing sedimentation rates, however. It may
also reflect an increasing degree of bioturbation with increasing height of the delta,
which is caused by increasing durations of subaerial exposure.
The transitional zone between Facies B and C, where the sediment is sandy, but fine
organic layers can be seen, can be related to the colonisation phase described by
Redfield (1972). Redfield's model is discussed in greater detail in chapter five, but
essentially, this is the stage at which halophyte vegetation spreads onto intertidal flat
surfaces. During these early years, vegetation cover is not yet dense enough to modify
flow, so deposits remain coarse. As vegetation density increases, flow becomes
increasingly modified, which is seen in sedimentary record as an increase in fines
upsection, and an increasing thickness and continuity of organic layers.
The transitional zone toward the top of Facies C, where sediment fines and bedding
becomes too fine to count individual beds, represents the transition from low to high
marsh (Martini, 1991). This transition is produced by decreasing frequency and depths
of tidal inundation, and accordingly, less saline conditions. These changes permit a
vegetation succession to less saline-tolerant grass and shrub.
Rhythmites in areas close to tidal channels appear different from those exposed along
river banks for two reasons. Firstly, the sediment seems finer throughout the facies
because of increased supplies of fine sediment which are brought into the delta
environment by tidal channels. In addition to this, with increasing distance from
Squamish River, flows are less able to transport sands. Secondly, rhythmites appear
different because organic layers differ from those elsewhere as they have less distinct
boundaries. This difference is perhaps related to changing vegetation populations as
conditions become more saline toward tidal channel margins.
This last point highlights the fact that tidal marsh rhythmite beds display a great deal of
local variability which is seen through changes in bed thickness, and internal character
(sediment-size characteristics). These noted localised differences are primarily driven by
the location of these deposits in relation to Squamish River (at the time sediments were
laid down), and also the morphology of the river at different locations. As we have
already seen, rhythmites change in appearance with increasing distance from the
channel. Deposits should become finer away from the channel, and with the exception of
those areas close to tidal channels, deposits should also thin away from the main
channel. Palaeochannel morphology likely is also an important factor which will
determine the character of tidal marsh rhythmites. As an example, deposits of tidal
marsh which develop along the outer bend of river meanders should be both thicker and
coarser than those deposits which form along the inner bend of meander loops.
Finally, it has been noted that rhythmite beds display a wavy or undulatory character
over distances ranging from metres to tens of metres. This longitudinal variability of bed
depth in section is in part inherited from deposits of Facies B. As we have seen, Facies B
deposits are of variable thickness and height relative to mean sea-level. The variable
upper-surface form of these deposits was produced by large bedforms, bar complexes,
and small tidal channels. As the sediments of Facies C are deposited almost entirely
from suspension, these fine sediments become draped over an undulating surface, and
they will tend to retain that uneven form. In addition to this, the wavy nature of beds will
be further produced within the deposits of Facies C by the local variability of marsh
sedimentation rates. These local differences in sedimentation rates are greatly influenced
by distance from the river, small-scale topographic variability, and differences in the
density of marsh vegetation cover.
The uneven form of the upper surface of the marsh is seen particularly well in sections
along the ox face (Figure 3.21). It is highlighted by a dark band (which is either a layer
high in organic matter, or is a charcoal layer) which can be traced along the majority of
the ox face. It is important to note, however, that despite the fact that these beds are
dominantly parallel and wavy, this is not wavy bedding. Wavy bedding is produced by
the deposition of ripple-bedded sand, which is then covered by a mud drape (Reineck
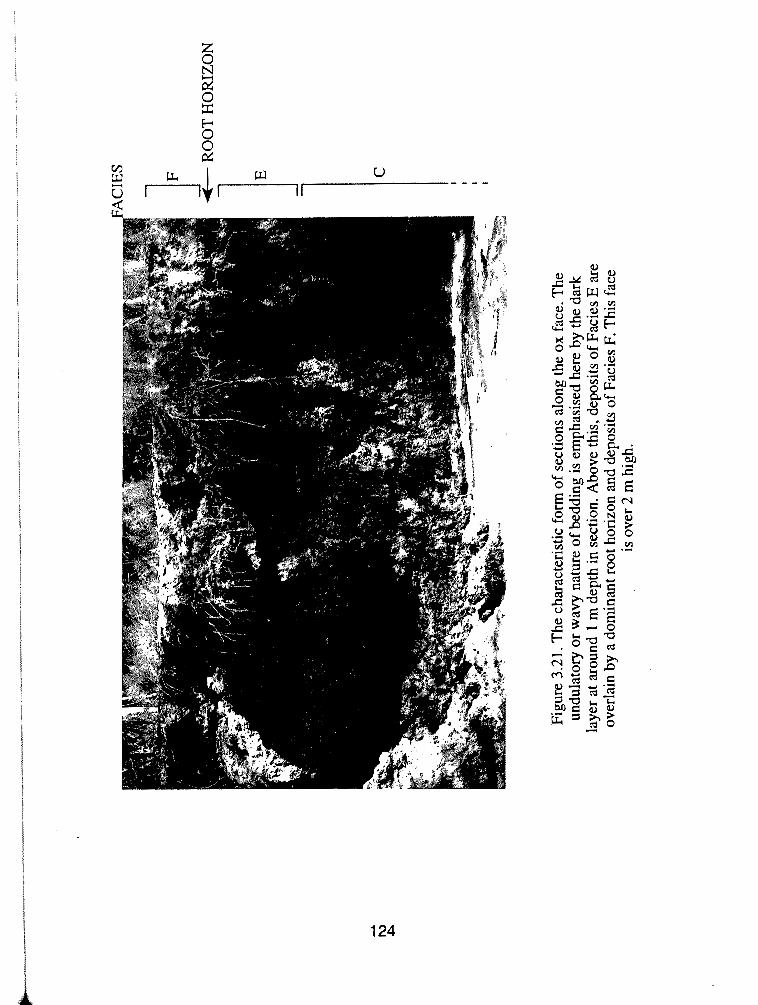
Figu
re 3
.21.
The
cha
ract
eris
tic fo
rm o
f se
ctio
ns a
long
the
ox f
ace.
The
un
dula
tory
or
wav
y na
ture
of
bedd
ing
is e
mph
asis
ed h
ere
by t
he d
ark
laye
r at
aro
und
1 m
dep
th in
sec
tion.
Abo
ve th
is, d
epos
its o
f Fa
cies
E a
re
over
lain
by
a do
min
ant r
oot h
oriz
on a
nd d
epos
its o
f Fa
cies
F. T
his
face
is
ove
r 2 m
hig
h.
and Singh, 1980). It is characteristic of tidal environments (though may be found
elsewhere), and can be considered a transitional phase between lenticular and flaser
bedding (Reineck and Wunderlich, 1968).
The bedding form of Squamish estuarine deposits is often very similar in appearance to
climbing ripple lamination in-phase (McKee, 1965). It is clear, however, that although
the mechanism of deposition is similar to that of climbing ripple lamination, the bedding
in Squamish estuary is different. Firstly, both the wavelength and amplitude of wavy
beds are considered too large to be climbing ripple laminae. More importantly, the time
scales of deposition between these two forms are quite different. Climbing ripple
laminae are formed within one flow event which is characterised by conditions of
constant flow and sediment supply. In contrast, the wavy beds in this study may develop
over periods exceeding 100 years, under conditions of highly variable flow. Given the
character of these beds, it is proposed that the term 'undulatory bedding' be used, as this
is explicit, yet does not impiy any genetic association which could lead to
misinterpretation.
While all the above statements are considered correct, these are not considered the only
factors which produce or induce this undulatory bedding. Bedding form is also thought
greatly influenced by post depositional modification of these sediments. The tidal marsh
deposits likely have settled and slumped considerably in response to the continual
wetting and dewatering of sediments throughout the tidal cycle. This settling process is
considered particularly important in areas close to river banks, where water flux likely is
greatest. Differential slumping may also be induced by gas build-up and escape within
these sediments. These gasses are produced in considerable amounts in interdistributary
bay environments as organics are continually decomposing.
Facies D: Sandy Rhythmites
Facies D deposits are genetically related to those of Facies C. Each of the beds (capped
with an organic mass) within this facies represent deposition over a period of one year.
The differences between the rhythmite beds of Facies C and D are their thickness and
sediment-size. These two characteristics clearly are related, and indicate an increase in
energy environment from Facies C to D. The abrupt contact between these facies,
highlighted in Figure 3.1 1, indicates that the change in depositional environment was
rapid. It is proposed that the inferred increased flow velocity along the lower 800 m of
Squamish estuary (the extent of this facies), was caused by river training dyke
construction. This construction has led to the formation of an anomalous coarse-grained
sedimentary sequence within the west delta tidal marsh.
The anomalous sequence (the superposition of Facies D on Facies C) primarily has been
produced by the reduction of effective channel widths along the lower 5 500 m reach of
Squamish River. Toward the southern limit of the west delta, dyke construction has not
led to a reduction in channel width since part of the west delta was dredged to maintain
the pre-dyke channel width along this section. Despite this, channel widths have
essentially been reduced along the lower 3 500 m channel reach because the river
training dyke prevents the flow of water through the central distributary channel during
flood events. This forces all flow through a single channel to the west of Squamish delta.
In addition to the direct reduction of channel widths, the river training dyke has greatly
reduced floodwater storage capacity, as floodwaters are no longer able to inundate the
central and east deltas. Along the lower 1 700 m of Squamish River (the extent of the
west delta), effective floodplain widths have been reduced by an average of over 68 %.
The combined effect of this channel and floodplain constriction has been an increase in
water depth, and duration of inundation over the west delta. Presumably, decreasing
widths have also led to increased flow velocities through this lower estuarine reach. The
combined effects of this constriction have led to an increase in flow velocities of waters
entering the marsh system, which also becomes inundated to greater depths than
previously. These increasing velocities are evidenced by the rapid coarsening of tidal
marsh deposits. This coarsening-upward trend is in contrast to the fining-upward
sequence which develops in natural marsh systems. This natural sequence, highlighted
in exposures along the ox face and upper west delta, displays a gradual thinning of
bedding, and decreasing sediment size with increasing maturity of the marsh system.
Sediment sequences only show coarsening-upward characteristics with the transition
from delta plain to alluvial plain (transition from Facies C to E - described later).
If the above interpretation is correct, then the contact between Facies C to D should date
to 1972. In the description of Facies D deposits, it was stated that at least 16 organic
layers were detectable in section and slump blocks, although this was regarded as an
underestimation of the true number. If these deposits are genetically related to those of
Facies C, then one organic-rich layer should be laid down each year. In the summer of
1992 there should have been a total of 20 organic-rich layers within the deposits of
Facies D (no layer would have existed for 1992, as plant death does not occur till late
autumn). A test of the age of Facies C and D deposits will be discussed later in this
chapter.
From an examination of the internal bedding characteristics of these deposits, shown in
Figure 3.1 1, it is felt that beds form over a considerable period of time, and that
sedimentation occurs over a number of events of differing intensity. This interpretation
agrees with that made regarding the genesis of the rhythmite beds of Facies C. As the
sediments within Facies D are very sandy, deposits are well-drained and become
partially aerated during low tide. This aeration allows partial oxidisation of sediments.
In longitudinal section, Facies D is lenticular, as deposits thin upstream and downstream
from point near site wd5. This upstream thinning is related to the height (age) of the
marsh surface. Generally, with increasing distance away from the seaward limit of the
delta, the elevation of the marsh increases. With increasing elevation, the marsh
becomes less frequently inundated by combined flood and high tide flows. This
decreasing frequency and duration of inundation is reflected in the upstream thinning
and fining of Facies D. This controlling nature of marsh height can be shown from an
examination of the small, isolated deposits of Facies D located toward the upstream
most end of the west delta. At this location, deposits of this facies are 60 cm thick, and
are shown in Figure 3.3 at site wd18. Their presence in part of the estuary where Facies
D is otherwise not found, is due to the height of the deltdfloodplain surface at this
location. These deposits are forming on an emerging bar surface which has largely
developed over the last 30 years. As this surface is much younger than surrounding
deposits, it is lower (up to one metre), thus allowing the localised formation of Facies D
deposits. The downstream thinning of Facies D deposits perhaps reflects decreased
riverine influence close to the river mouth. With time, the zone of maximum facies
thickness will shift seaward.
In lateral section, Facies D is wedge-shaped, being thickest toward the river, and
thinning toward the valley wall. This thinning likely arises from the decreasing flow
velocities of floodwaters toward the centre of the marsh. Much of the sand component of
the suspended-sediment will settle to the delta surface within a few metres of the river.
Toward the back of the delta, flows are only competent to transport small amounts of

fine sand. As such, the sandy rhythmites of Facies D should grade laterally into the silty
rhythmites of Facies C.
From the above discussion of facies geometry and sediment-size characteristics, it seems
clear that Squamish River is building a levee along the lower 800 m of the west delta.
This levee is represented in section as the sediments of Facies D. This rapid increase in
vertical marsh growth is a direct response of river training in Squamish estuary. The
effects of this river training with regard to channel stability and delta erosion will be
discussed in chapter five.
This levee can be seen on the surface of the west delta in Figure 3.22, as marsh surface
elevation differences are highlighted by the partial flooding of the marsh. It is important
to note from this photograph that there also exists a levee on the central delta, along that
portion of the channel which is now artificially removed from Squamish flow. This
shows that levee building was operating naturally prior to 1972. The important
difference between pre- and post-dyke levees, however, is their sedimentologic
character. The levee on the central delta is produced by the streamward thickening of the
rhythmite beds of Facies C. The sedimentologic character of these beds is essentially the
same throughout - no coarse, thick sedimentary units are found along the upper sequence
of the central delta.
Facies E: Parallel-Laminated Sands with Peds
The deposits of Facies E represent increasing energy conditions associated with
decreasing tidal influence as the delta plain surface accretes. The separation of this
facies from Facies C is based on the change in sediment-size characteristics and organic
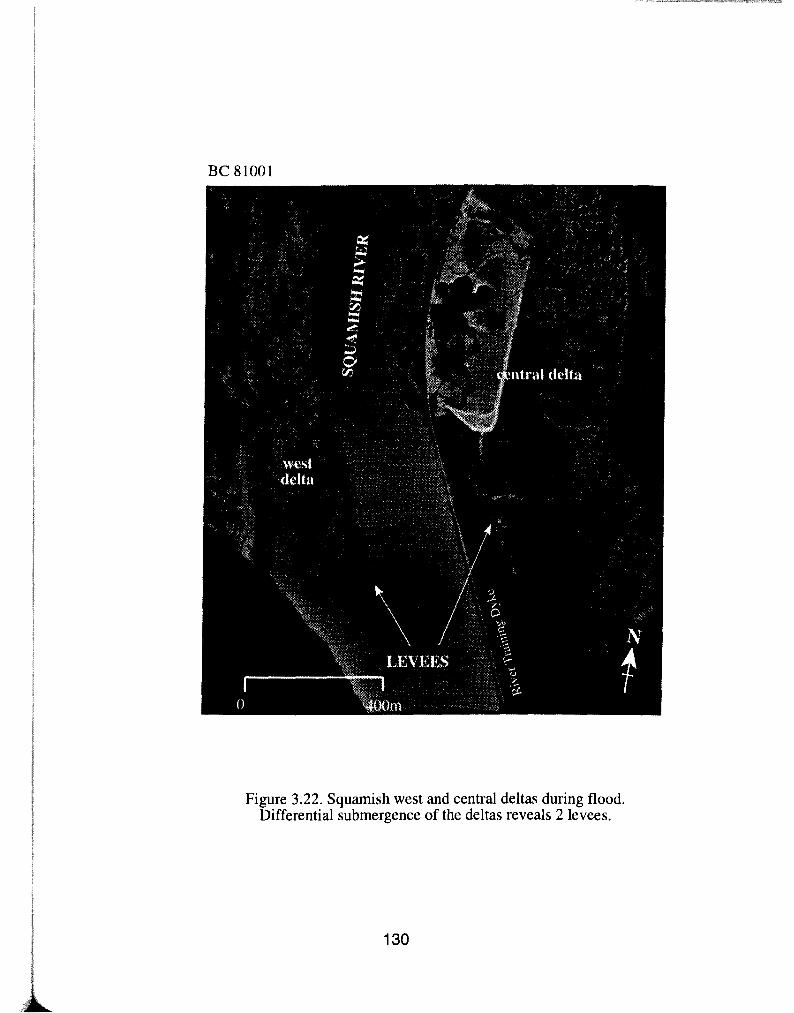
Figure 3.22. Squarnish west and central deltas during flood. Differential submergence of the deltas reveals 2 levees.
content. Facies E deposits essentially represent the initial transition from delta plain to
alluvial plain.
The bedding within this facies is the same as the bedding within the upper limits of
Facies C. These very fine parallel laminations suggest that the main mechanism of
deposition (the settling of material from suspension) remains the same through the
Facies C to E transition. This gradual accumulation of material produces bedding which
parallels the form of the marsh surface, resulting in the formation of undulatory bedding.
With increasing height of the land surface, tides less frequently inundate the marsh
surface, and are only able to influence sedimentation during periods of high river flow.
These higher discharges introduce coarser material to the marshhnterdistributary bay
environment. The increase in sand content, combined with decreasing periods of
inundation, permit the establishment of less saline-tolerant (non-halophytes) vegetation
cover. These plants (which may include shrubs and trees) do not necessarily die during
the winter, so flat organic-rich layers (as seen in Facies C) are not produced. Instead,
plants are able to spread their root systems throughout the sandy substrate. As sediments
also become more aerated, mottles begin to develop as sediments become partially
oxidised. As the land surface is raised further, pedogenic processes begin to operate,
resulting in the aggregation of material into soil peds.
Facies F: Ripple-Bedded Sands
The sands of Facies F were deposited during large riverine flood events. The presence of
climbing ripple lamination indicates that deposition took place from both bed load and
suspension from waters which inundated this floodplain surface. The changing character
of bedding within this facies is an indication of increasing and decreasing energy
conditions produced by the waxing and waning floodwaters. This is noted as changes
from lower flow parallel lamination to climbing ripple lamination of all forms. This may
have been partly controlled by tidal flux, though these sands show no conclusive
sedimentologic influence of tides. Floodwaters occasionally were powerful enough to
erode the upper deposits of Facies E.
Despite the fact that Facies F deposits dominate the upper sequence of sections upstream
from the west delta, they are believed to have been produced by a small number of low
frequency events. For example, the uppermost unit of Facies F along the ox face is
believed to have been deposited during one flood event in October 1984. This flood,
which had a recurrence interval of around 35 years, is thought to have exceeded bankfull
capacity for at least three consecutive days (Hickin and Sichingabula, 1988). This
duration of bankfull exceedance will have been even greater within Squamish estuary,
though no data are available. The upper unit of Facies F is up to 40 cm thick in places
along the ox face. Further upstream, the thickness of this sand unit (channel bedform
deposits) increases to at least 115 cm (at site nyl). Along the ny face (around 3 300 m
upstream from the river mouth), the floodplain surface is gently undulating, reflecting
the transport and deposition of large sandwaves (dunes) across the floodplain. These
sandwaves are up to 115 cm in amplitude, and have wavelengths of around 30 m.
Deposits are around 15 cm thick at the dune troughs (as at site ny2). These deposits are
underlain by a dominant root horizon which is believed to represent the pre 1984
floodplain surface.
Similar bedforms (though much smaller) are observed on the floodplain surface for
another 1 800 m downstream from this point. The decreasing thickness of Facies F
downstream partly reflects the dampening of riverine flood flows by tidal modification.
In addition to the decreasing tidal influence with increasing distance upstream, the
upstream thickening of Facies F reflects the decreasing effective floodplain width
upstream. The term 'effective floodplain width' is used here because overbank flows are
laterally confined by the river training dyke, which has effectively reduced floodplain
width by an average of 60%. This average value was calculated from 10 cross-sections
along the lower 3 500 m of estuarine reach of Squamish River. Pre-dyke widths were
measured as the width from western valley wall to the railroad track which services
Squamish Forest Products facilities on the east delta. This track, which was completed in
the 1920s, is built on a raised dyke to provide flood protection for the town of Squamish.
It should be noted that the discussion of floodplain width reduction does not apply to
flows which exceed the height of the river training dyke.
Where sand dune heights exceed one metre (3 300 m upstream from the river mouth),
effective floodplain widths average 540 m. These dune heights decrease with increasing
distance downstream, to the point where they are between five and ten cm high. At this
location, effective floodplain widths average 590 m. This increase in width is also
responsible for the decrease in sand dune amplitude.
Facies G: Parallel-Laminated Silts and Clays
These sediments were deposited from suspension from slow moving shallow waters
over the floodplain surface. The depth of the water column over the floodplain surface
may only have been a few cm. Such small depths would allow silts and clays to be
transported onto the floodplain, but little sand. Bedding form evidence suggests that
these deposits formed over a great number of events during high tide periods over
summer months (when riverine flow is higher, as an average, than in winter). On
numerous occasions throughout the period of data collection, high tide stage just
exceeded the upper limit of these facies along the ox face. If the floodplain elevation had
not been raised by deposits of Facies F along this face, the fine sediments of Facies G
likely would have continued to accrete. As the floodplain elevation increases, the
likelihood that Facies G sediments will be deposited and present in section decreases to
zero. This is because as the floodplain is raised, greater stages are required to permit
deposition of any material on the surface. Further stage increases, however, will be
driven by increased riverine discharges. These increased discharges will reduce the
effect of tidal modification of estuarine flow, making the deposition of fines less and
less likely.
Despite the fact that the interpretation above states the importance of tidal flux to the
deposition of these sediments, there is no unequivocal sedimentary evidence that these
are tidal as opposed to fluvial deposits.
Discussion
Depositional Model of Estuarine Deposits
The purpose of this section is to reconstruct the probable depositional environment of
Squamish estuarine sediments described above.
Generally, I feel that Squamish estuarine sedimentation primarily is driven by
distributary channel abandonment and fill. Continued shifting of distributary channels
results in a series of discontinuous fills which may interfinger older channel fill deposits.
With the possible exception of the lower 1 000 m of delta deposits, the majority of
estuarine sediments described above were laid down within abandoned distributaries.
This abandonment is unlikely to have been immediate, but instead was characterised by
a gradual decrease in riverine flow (and an increase in tidal influence) as the channel
aggraded. This form of abandonment occurred between the years 1945 to 1972
(documented in chapter one), before total abandonment was artificially forced by dyke
construction. The above interpretation is based on evidence provided within a number of
sedimentary deposits. This evidence is given below, along with discussion of the
sedimentary processes operating at the time of deposition.
Facies A sediments are Squamish River channel lag deposits. The height of these
sediments (relative to mean sea-level) indicates that they were laid down within
shallowing channel sections, or intertidal sand bars. These deposits can be seen forming
in the estuary at present, along channel margins along the eastern edge of Squamish
River (highlighted by the letter A in Figure 3.3). They are formed by channel migration
and shallowing of the inner bank zone. Deposition along channel margins, however, will
not produce laterally or longitudinally extensive deposits of Facies A sands and gravels.
For this reason, the formation of Facies A within shallowing channel margins is
considered to be a minor, secondary component of topset delta deposit formation.
Instead, the formation of Facies A within aggrading distributary channels is of more
sedimentologic importance. Given the dynamic nature of channel shifting within
Squamish delta environment, it seems most probable that channel aggradation is
initiated by distributary channel shifting. This channel abandonment and filling will
produce elongate fills which may be several kilometres long, and (judging from present
channel dimensions) over one tenth of the total valley width.
The upper surface of Facies A lies just above mean low tide level. It appears then, that
above low tide level, flows are incapable of transporting bed material as megripples or
dunes. This decreased competence above this level is presumably caused by tidal
modification of flow. The abrupt contact between Facies A and B suggests that an
immediate decrease in energy conditions took place, which was perhaps induced by
channel avulsion. There is evidence to suggest, however, that immediate changes in
sediment-size need not necessarily be produced by channel avulsion. Along the eastern
edge of Squamish River, intertidal sand bars are building along the lower 1 700 m of the
estuarine reach. In places, these sands have become vegetated, and when they are
exposed in trenches, one sees an abrupt contact between coarse sands and overlying
finer sands. This sequence is directly analogous to the transition from Facies A to B
noted elsewhere, and has clearly not been formed by channel avulsion. Instead, this
transition is thought to be produced as the sediment surface continues to accrete above
low tide level. Above this level, tidally modified flows are no longer competent to
transport large sandy bedforms, and instead, accretion of finer material continues mainly
from suspension. The transition from Facies A to B is not always this clear, as large
floods may be strong enough to initiate bedform movement, and introduce coarse sand
into the finer sediments of Facies B. This process is considered to have occurred at site
wd3, shown in Figure 3.23. Due to limited exposure, the extent of this sand interbed is
not known.
As has already been noted, few comments may be made regarding the bedding
characteristics of Facies A sands and gravels. Despite this, one can conclude that large-
scale cross-bedded units (Allen's ECS) will be present within these channel fill deposits,
but will not dominate sequences. This is because channel migration and point bar
development is not considered to be the dominant process of within-channel
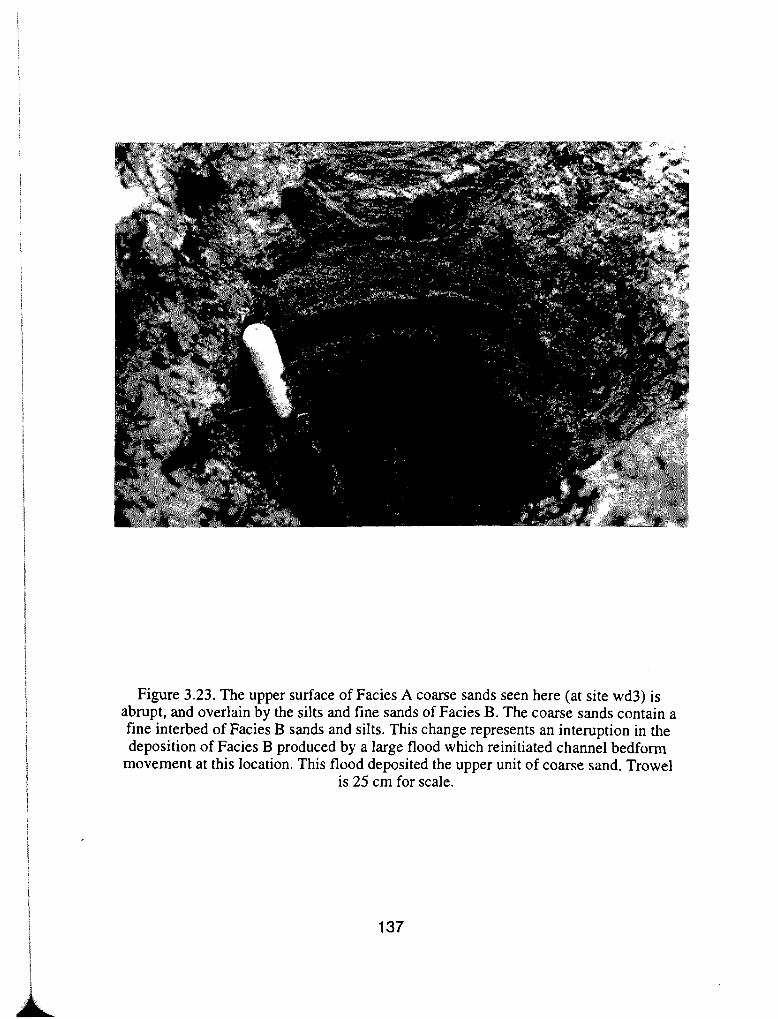
Figure 3.23. The upper surface of Facies A coarse sands seen here (at site wd3) is abrupt, and overlain by the silts and fine sands of Facies B. The coarse sands contain a fine interbed of Facies B sands and silts. This change represents an interuption in the deposition of Facies B produced by a large flood which reinitiated channel bedfonn
movement at this location. This flood deposited the upper unit of coarse sand. Trowel is 25 cm for scale.
sedimentation in this environment. Where such cross-bedded units are present, they
almost certainly comprise clean sands with occasional gravel interbeds throughout.
Given the flow regime of Squamish River, clay layers and drapes likely will not be
present in these sands. Facies A deposits are most likely to be characterised by both
trough and planar cross-bedding with numerous erosional surfaces, gravel interbeds and
clasts, and occasional mud clasts.
With continued aggradation of these channel sands, the upper surface eventually
becomes increasingly exposed to subaerial conditions. Sands eventually become
exposed long enough to allow colonisation by halophyte plant species. Once this
vegetation becomes fully established it decreases energy conditions at that site,
promoting the deposition of finer sediment. In this way the intertidal sands of Facies B
grade into the tidal marsh deposits of Facies C. At several locations within Squamish
estuary today, one can see the initial stages of vegetation colonisation of intertidal sands,
as shown in Figure 3.24. This photograph was taken along the eastern edge of Squamish
River, in the location shown by the letter A in Figure 3.3. It documents the early
colonisation process, which will eventually be preserved in section as the transitional
zone between Facies B and C, where very fine, discontinuous organic layers are present,
but where material remains sandy. There are a number of other interesting features in
this photograph. Firstly, one can see the highly irregular surface of this young tidal
marsh system, which slopes down from left to right and also toward the viewer. Also, to
the bottom right one can see evidence of the fine laminae within Facies B sediments
which have been partially eroded. It also illustrates how large organic debris may
become incorporated into Facies B deposits.
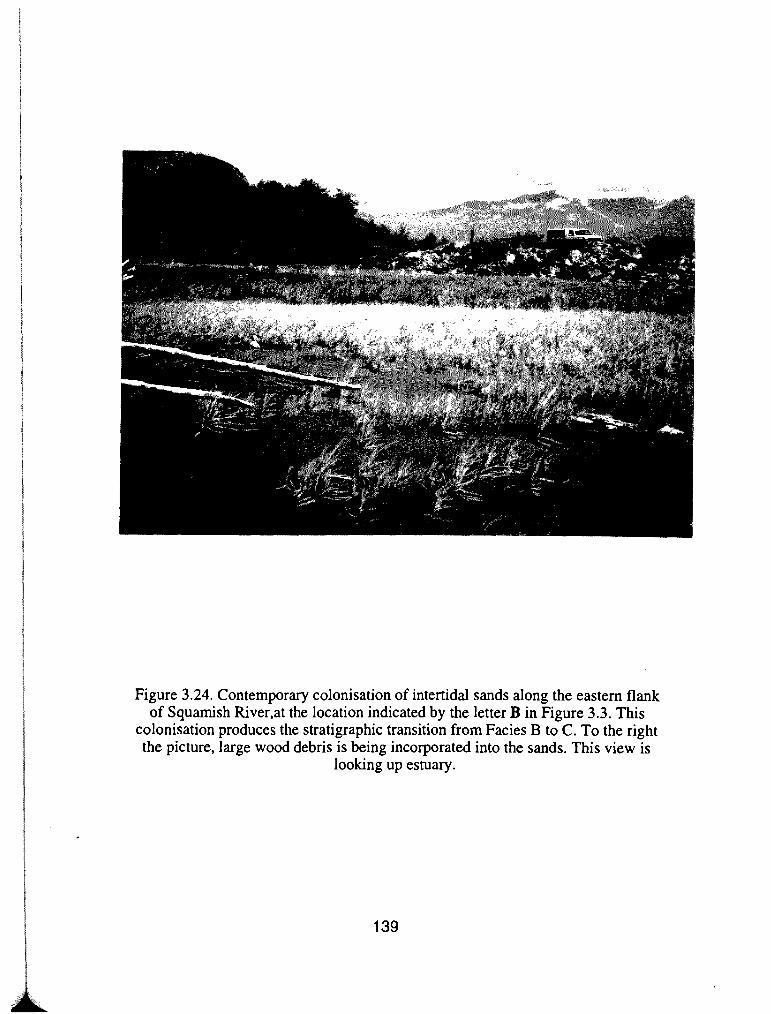
Figure 3.24. Contemporary colonisation of intertidal sands along the eastern flank of Squarnish River,at the location indicated by the letter B in Figure 3.3. This
colonisation produces the stratigraphic transition from Facies B to C. To the right the picture, large wood debris is being incorporated into the sands. This view is
looking up estuary.
During the formation of the tidal marsh, erosion of these marsh sediments by tide- and
wind-generated waves is not considered an important process or a common occurrence.
Field observation suggests that although large surface disturbances are common within
the estuary, these are restricted to estuarine channels, and do not appear to affect the
interdistributary bay environment. Also, on no occasion was any evidence of wave
reworking or erosion of marsh sediments observed in section. While it is likely that large
marine storm events will influence estuarine sedimentation and may induce delta
erosion, this study found no sedimentologic evidence of this having occurred within
Squamish delta.
This depositional model of Squamish estuarine deposits is not appropriate for the entire
estuarine reach. The deposits of the downstream-most 1 000 m may not be estuarine
channel fill sediments. Instead, the deposits of Facies A and B within this region may
have been produced as Squamish delta prograded into Howe Sound. There is some
sedimentologic evidence which indicates that these facies represent extensive intertidal
sandflat and sand bar complexes which were laid down within an interdistributary
environment at the head of the delta. The main sedimentologic evidence is the presence
of shells along the lower reaches of Squamish estuary. These shells were originally
deposited in a lower energy environment, away from the river mouth. In these
environments, the high energy freshwater input will be less dominant, and tidal
influence will be more apparent. Because of this, shells become transported, broken,
deposited, and eventually incorporated into the sands away from main channel flow. In
addition to this, some of the deposits of Facies B may be too tidal in character to have
been deposited within an active river channel. Those deposits shown in Figures 3.7 and
3.16 appear to contain very high amounts of clay, which would not ordinarily be
expected in this mostly subtidal environment of Squamish River. This evidence,
however, is by no means conclusive proof of an interdistributary bay environment. As
has already been discussed, the different appearance of deposits at this particular
location may have been controlled by distance from channel flow, or seasonality of
estuarine sedimentation.
With the exception of the abandoned central channel, there are few expanses of intertidal
sands in Squamish delta at present. There are a number of reasons for this. Firstly,
intertidal sands toward the front of both central and east deltas are regularly dredged to
prevent siltation of Squamish harbour. Secondly, artificial constriction of flow to the
west of the delta has largely cut-off the supply of sand to the rest of the delta, so sand
bars are largely restricted to the western sector (Levings, 1980). Despite this, it is clear
that large expanses of intertidal sands have existed along the seaward margin of the delta
within recent times. One can get a good idea of the possible environment of deposition
of Facies A and B sands along the lower 1 000 m of the present estuary, from Figure
3.25. This figure shows an oblique view of Squamish estuary and delta taken in August
1947. One can see an extensive unvegetated intertidal zone along the front of the east
delta, and around the Mamquam Blind channel. Comparison with recent air photographs
reveals that much of the intertidal sands toward the front of the central delta have
become vegetated in the last 40 years.
This last point highlights the fact that intertidal sandflats within an interdistributary bay
environment will eventually become vegetated. They will develop the same sedimentary
sequence as those of estuarine channel fills (which has previously been described as a
transition to tidal marsh), and with continued deltaic progradation, a transition to alluvial
plain dominated by sands (Facies B, C, E, and F).
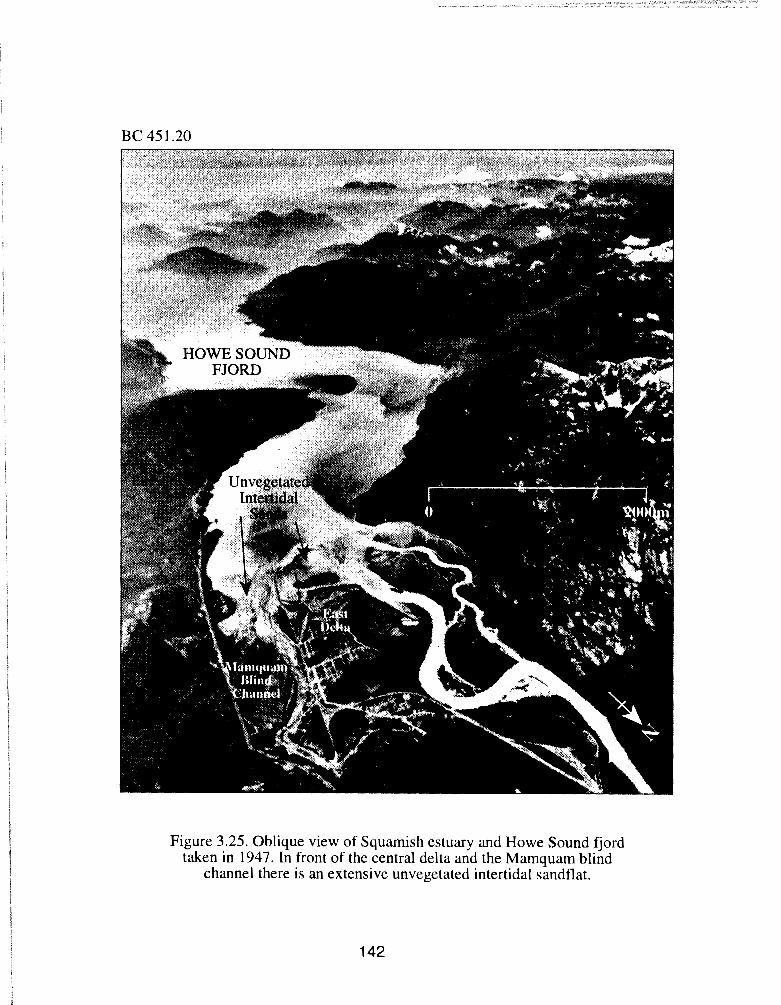
Figure 3.25. Oblique view of Squarnish estuary and Howe Sound fjord taken in 1947. In front of the central delta and the Mamquam blind
channel there is an extensive unvegetated intertidal sandflat.
The Age of Tidal Marsh Deposits
A number of assertions have been made within this chapter regarding the timing of
specific sedimentary processes. The first of these is that each rhythmite bed within the
tidal marsh Facies C is the product of one years deposition. The second assertion is that
the sandy rhythmites of Facies D are the direct depositional response of the partially
constrained river system. The purpose of this section is to test whether these assertions
are (or are most likely to be) correct. This can be done by detecting (if possible) an
easily identifiable and easily dateable marker bed or horizon within sedimentary
sequences.
During the summer of 1992, three bottles (two Orange Crush bottles, and one Kik Cola
bottle) were excavated from deposits of Squamish west delta. One of these bottles was
found within the bank face, 120 m upstream from the river mouth, and two were found
within nearby slump blocks. The bottle within the bank face, which is shown in Figure
3.26, lay 23 cm below the upper limit of Facies C, 157 cm below the marsh surface. This
depth is that to the bottom of the bottle (the surface on which it was deposited). The
origin of the bottles within slump blocks was determined from the location and
correlation of a marker bed (a distinctly coarser, thicker rhythmite) in the bank section,
and in the slump block. From this, it was determined that one of the slump block bottles
lay 25 cm below the upper limit of Facies C, or 159 cm from the delta surface. The
second slump block bottle (Kik Cola) was found 10 m downstream, 26 cm from the
upper limit of Facies C.
Within one of the slump blocks, 15 rhythmite beds were counted between the base of the
Orange Crush bottle and the upper limit of Facies C. Similarly, 15 beds were counted
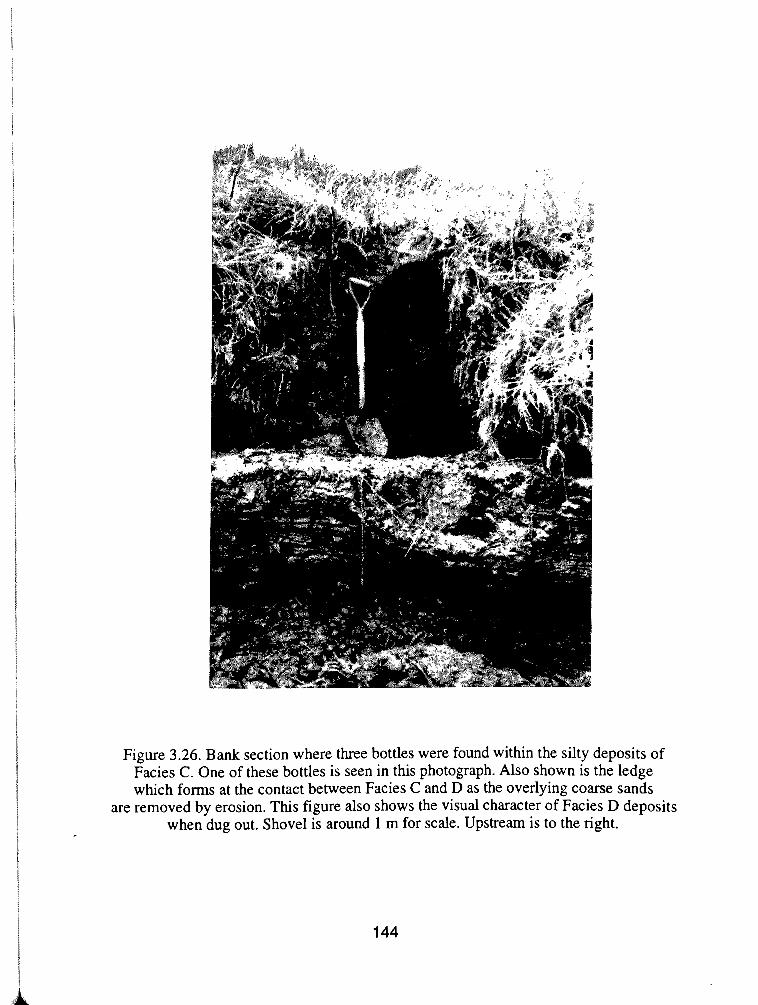
Figure 3.26. Bank section where three bottles were found within the silty deposits of Facies C. One of these bottles is seen in this photograph. Also shown is the ledge which forms at the contact between Facies C and D as the overlying coarse sands
are removed by erosion. This figure also shows the visual character of Facies D deposits when dug out. Shovel is around 1 m for scale. Upstream is to the right.
from the base of the Orange Crush bottle found within the bank face. From this, it is
clear that these two bottles became incorporated into the delta sediments at the same
time. The small difference in the depth of these two bottles is probably produced by
small-scale local variability of marsh accretion. Unfortunately, due to poor preservation,
it was impossible to count the number of rhythmite beds above the third bottle (Kik
Cola). Despite this, the bottle is known to have originally lain 160 cm below the delta
surface (before slumping occurred). Given the known annual sedimentation rate at this
location (an average of 1.6 cmlyr), this bottle is thought to have been incorporated at the
same time as the other two bottles, or at most, one year previously.
If my assertions regarding the genesis of tidal marsh rhythmites and sandy rhythmites
are correct, then the age of these bottles should not post-date 1957. This date was
calculated from the supposed age of the lower contact of Facies D (1972), minus 15
years (one year for each tidal marsh rhythmite above the base of the bottles).
Unfortunately, it is not possible to determine a specific year of production for these
bottles, only a range of years when the bottle and label design was employed.
Fortunately, one of the two Orange Crush bottles (that found in the bank face) has the
words "Design Reg'd 1956" printed on the glass. The second Crush bottle lacks this
information, but both the bottle and label design are identical. Lastly, the Kik Cola
Company was only in operation for a short duration from the 1950 s to early 1960s.
From this, it is clear that, although no specific dates can be determined, these three
bottles are from the same period of time. These bottles have been independently dated
between 1956 and 1962 (G. Jacobs, Vancouver bottle collector, personal
communication). This range is in perfect agreement with age of these bottles predicted
by sedimentologic analysis. This shows that tidal marsh rhythmite beds are indeed
annual deposits, and that Facies D sediments formed after river training dyke
construction in 1972.
Tidal Deposition in Squamish Estuary
All seven facies described here can strictly be considered tidal in origin as they were laid
down within waters subject to tidal flux. However, in many cases these deposits are only
known to be tidal from their location within the estuary. There exists a clear difference
between deposits which formed in tidal environments, and deposits which can be
classified as tidal in origin from an examination of sedimentologic character and
stratigraphic sequence. If these deposits were seen out of context (in rock section for
example), then only the deposits of Facies B and C could confidently and accurately be
interpreted as tidal in origin.
The tidal characteristics of Facies B sediments are the presence of shells and the
sedimentary record of tidal cyclicity produced by rhythmically interlayered sands and
silts/clays. As has already been discussed, however, these characteristic attributes of
Facies B deposits are not constant throughout all sections, but are variable with distance
along the tidal gradient. This point will be discussed in greater detail in the proceeding
section.
The tidal characteristics of Facies C are the presence of marine and brackish-water floral
species, which form discreet layers to produce the characteristic bedding pattern of the
tidal marsh deposits. In addition to this, it is possible that tidal control on sedimentation
is reflected in the grain-size distributions of tidal marsh sediments. This possibility will
be examined in chapter four.
This study has not found enough evidence to prove the tidal origin of Facies A, D, E, F,
and G. However, this does not mean that no such evidence exists, as the scope of this
study has necessarily been limited. Further analysis, such as the examination of
foraminifera species, may provide evidence of marine or brackish-water conditions
(Mitchell, 1976). Furthermore, this study has only been able to examine the uppermost
deposits of Facies A. These deposits, however, likely are up to 4 m thick in places (the
depth of the estuarine channel revealed by sonar plot at low tide). Although it seems
highly unlikely that clay drapes would form within this subtidal environment, the lowest
deposits of Facies A may reflect their tidal nature in some way - perhaps in the form of
shell beds, or a clay pebble conglomerate lag at the base of the channel sediments
(Oornkens and Terwindt, 1960; Bosence, 1973; Barclay and Davies, 1989). These sands
may also display changes along the tidal gradient, such as a seaward decrease of bed
thickness (Campbell and Oaks, 1973).
Despite this lack of conuete evidence of the tidal nature of a number of individual
facies, an examination of stratigraphic sequence throughout the estuarine reach may
provide a better indication of the nature of tidal deposition in Squamish estuary. This
examination should also provide better understanding of the decreasing influence of
tides up estuary. The following section presents the results of detailed investigations of
the character of estuarine sequences, and the changing nature of these sequences away
from the river mouth.
The Changing Nature of Deposition along the Tidal Gradient
Observations regarding the changing nature of tidal influence on sedimentation may be
made at a number of scales. Firstly, one can examine sedimentary sequences for broad-
scale changes in facies character, position in sequence, facies associations, bounding
surfaces etc. Secondly, one can examine up estuary variability within specific facies
which are known to be tidal deposits. Both these scales of investigation have been
employed here, the results of which are discussed in the following two sections.
Observations from Sedimentary Sequence
From an examination of Figure 3.3, a number of observations may be made regarding
the tidal depositional product in Squamish estuary, and how that depositional product
changes along the tidal gradient. Firstly, sequences along much of the estuary are
characterised by thick units of fine-grained material which often contain considerable
amounts of silt and clay. This sediment-size characteristic reflects the dominant
mechanism of sediment deposition within interdistributary estuarine reaches (Dalrymple
et al., 1991). The sediments of Facies C, E, and G may be considered as overbank fines
formed by (or primarily by) the settling of sediment from suspension. The great
thicknesses of overbank fine units has been stated as characteristic of tidal environments
(Barwis, 1978; Thomas et al., 1987). Such thicknesses of overbank fines will be far less
evident in fluvial environments because of differences in depth-velocity relationships
within fluvial and tidal zones (Barwis, 1978). The differing thicknesses of the overbank
cap has been suggested to be an environmental indicator which differentiates fluvial and
tidally influenced riverine environments (Smith, 1987).
Thomas et al. (1987) stated that the zone of maximum mud deposition within estuarine
reaches of rivers is largely controlled by the location of the turbidity maximum (Postma,
1967). This is not considered to be the case in Squamish estuary, because salt wedge
intrusion essentially is restricted to winter months, (Levings, 1980) when suspended-
sediment concentrations are lowest. During summer months, the lack of salt wedge
intrusion likely will inhibit the development of locally high suspended-sediment
concentrations within Squamish River, though these may develop in areas away from
the main channel.
With increasing distance away from the river mouth, sedimentary sequences display an
increasing importance of sand, and as such, record a gradual increase in mean grain size
with distance upstream. This trend has previously been noted by Howard and Frey
(1973). The increasing mean grain size of intertidal and supratidal delta and floodplain
sequences is caused by two mechanisms: thinning of Facies C and E, and increasing
height of the delta.floodplain surface.
Fine-grained overbank deposits of Facies C and E decrease in thickness upstream. This
decrease becomes evident along the ox face (in comparison with sections along the
upper west delta), though major thinning does not occur for another 500 m upstream
from the ox face. The thinning of these facies (and Facies B) reflects the decreasing
amplitude of tidal flux away from Howe Sound, and also the decreasing tidal
modification (slowing) of flow. As the thickness of fine, overbank deposits decreases,
the relative importance of sand increases.
In addition to this up estuary change in sediment-size, there exists a similar change
upsection. This is best seen along the ox face, where sections show a coarsening-upward
sequence superimposed on a fining-upward sequence. The fining-upward sequence is the
transition from intertidal sands to low, and then high tidal marsh, as seen at sites along
the upper west delta. As with the up estuary change in grain-size, the upsection changes
are driven by changes in the relative importance of tidal influence. The fining-upward
sequence is highlighted in the transition from Facies A to C, and represents an
increasing importance of tidal control on sedimentation. This increasing importance is
particularly evident as the environment of deposition changes from subtidal to intertidal.
This fining-upward sequence reflects changes in depositional process from bedload
(Facies A) to mixed bedload-suspended load (Facies B), to deposition from suspension
(Facies C). A similar sequence was noted by Yeo and Risk (198 1) in the intertidal zone
sediments of the Minas Basin, Bay of Fundy.
In contrast to this sequence, the transition from Facies E to F represents a coarsening-
upward sequence cap which reflects a decreasing influence of tides in depositing
sediment. As the floodplain surface accretes, tidal inundation becomes less frequent, and
water depths decrease. This represents a decreasing input of tidally-deposited sediments
to the floodplain. With continued accretion, tidally-influenced waters only inundate the
floodplain during periods of riverine flood. During riverine flood, however, higher
discharges and flow velocities reduce the degree of tidal modification. As such, even
though tidally-influenced waters are able to inundate floodplain surfaces above mean
high tide level, riverine depositional processes will dominate. This is clear from the lack
of fine deposits toward the top of sections along the ox face, and all locations further
upstream.
Discussion has not focused on the deposits of Facies D here, as these represent an
anomalous sedimentary succession (discussed earlier in this chapter, and in chapter
five).
Sedimentary sequences display a number of other important characteristics of estuarine
sedimentation. One such characteristic is that sequences along the lower reaches of
Squamish estuary display simple, predictable sequence successions. If the anomalous
deposits of Facies D are ignored, sequences show a succession from basal sands and
gravels (Facies A) to intertidal sands (B), tidal marsh (C), to an early floodplain surface
(E). Along the lower estuarine reach, sequences show a succession from Facies A, B, C,
to Facies D. These simplistic sequences, where facies succeed one another in a
predictable fashion, are not observed throughout the estuarine reach of Squamish River,
however. Around 2 000 m upstream from the river mouth, sequences record facies
successions which differ from those further downstream. Facies transitions are no longer
predictable, but become broken by what appear to be random injections of coarser
material. These coarser deposits form interbeds within facies, as seen at site ox 12 in
Figure 3.3. In general, sections in reaches which record increasing fluvial dominance
(such as the those along the ox face), show sequence successions which appear
fragmented or broken by random deposits of coarse-grained material. The increasing
complexity of sequences upstream is thought to reflect the interaction of riverine and
tidal energy fluctuations which may be either rhythmic or random (Thomas et al., 1987).
The coarse sand interbeds are the product of random fluctuations from large river floods.
As tidal influence lessens, both rhythmic (snowmelt-induced daily fluctuation in
discharge) and random (storm-induced flood) fluctuations in river flow become so large
that the depositional product of tidal rhythmic fluctuations (Facies B and C) either
become eroded or fail to form at all.
The erosional force of single riverine flood events is seen from the nature of facies
transitions along the upstream most estuarine sections. Where Facies F is present in
section, its contacts are always abrupt, and most often erosional. In locations where tides
exert a greater degree of control, however, facies transitions are gradational. Such
transitions are highlighted by those changes from Facies B to C, and C to E. While
abrupt transitions are found along the lower reaches of Squamish, these are associated
with Facies A and D, which may both be considered as largely fluvially derived. The
abrupt contact between Facies C and D has already been shown to have been artificially
produced by an increase in the relative power of Squamish flow. The deposits of Facies
A are essentially subtidal, and internal bedding shows no evidence of tidal flux. It seems
from this that the nature of contacts between sedimentary facies and beds may be used as
an indication of the degree of riverine dominance over tidal processes, or simply the
presence of tidal flux within the water column.
Another possible indicator of the presence of tidal flux is the nature of bedding within
facies. Estuarine sequences have already been noted as containing facies which display a
wavy or undulatory nature, which is produced as sediments settle from suspension onto
an uneven surface, and from consequent differential settling through slumping induced
by dewatering and gas-escape. As tides exert less influence on sedimentation (visible
both up estuary and upsection), facies display less of this characteristic bedding form.
It should be noted that while I suggest that observations of the nature of facies contacts
and bedding may be a useful indicator of the relative degree of tidal influence, these data
are by no means proof of tidal environments. The presence of gradational contacts
within simple sequences which display undulatory or wavy bedding should only be
taken as possible evidence of tidal influence. Such evidence should prompt more
detailed stratigraphic and sedimentologic investigation within specific areas of interest.
Observations from Tidal Facies B and C
As has already been noted, deposits present within the estuary display variability which
appears to reflect local variability of depositional process and product. Such variability
of estuarine depositional product has been noted elsewhere (Land and Hoyt, 1966;
Terwindt, 197 1 ; Howard and Frey, 1973; Goldring et al., 1978; Jouanneau and
Latouche, 1981; Syvitski and Farrow, 1983). In addition to these local influences, there
are more orderly changes which appear to be driven by location along the tidal gradient.
From this evidence, conclusions may be drawn regarding the nature of estuarine
sedimentation, and the changing character of estuarine depositional product with
decreasing tidal influence.
The changing character of deposits can be seen on examination of Facies B and C
sediments at various locations throughout the estuary. Deposits of Facies B display
distinct changes with increasing distance away from the river mouth - changes which are
indicative of decreasing tidal influence. One such change is that noted in the character of
bedding. In exposures along the lower 1 500 m of the estuary, Facies B deposits display
fine rhythmically alternating sand and siltklay laminae. As one progresses further up
estuary, however, deposits appear to show a lesser degree of rhythmicity and regularity
throughout the facies. Initially, this change is noted as an increase in the thickness of
sand beds, as is highlighted in Figure 3.27, which shows one 2 cm thick sand bed. This
photograph was taken around 1 700 m up estuary, and shows a relative increase in the
importance of sand in Facies B deposits. Further evidence of increasing energy
conditions is seen on examination of the internal character of sand beds. Previous
description and figures of Facies B deposits have shown that sand beds further
downstream are parallel or slightly wavy, with occasional ripple foresets. In Figure 3.27,
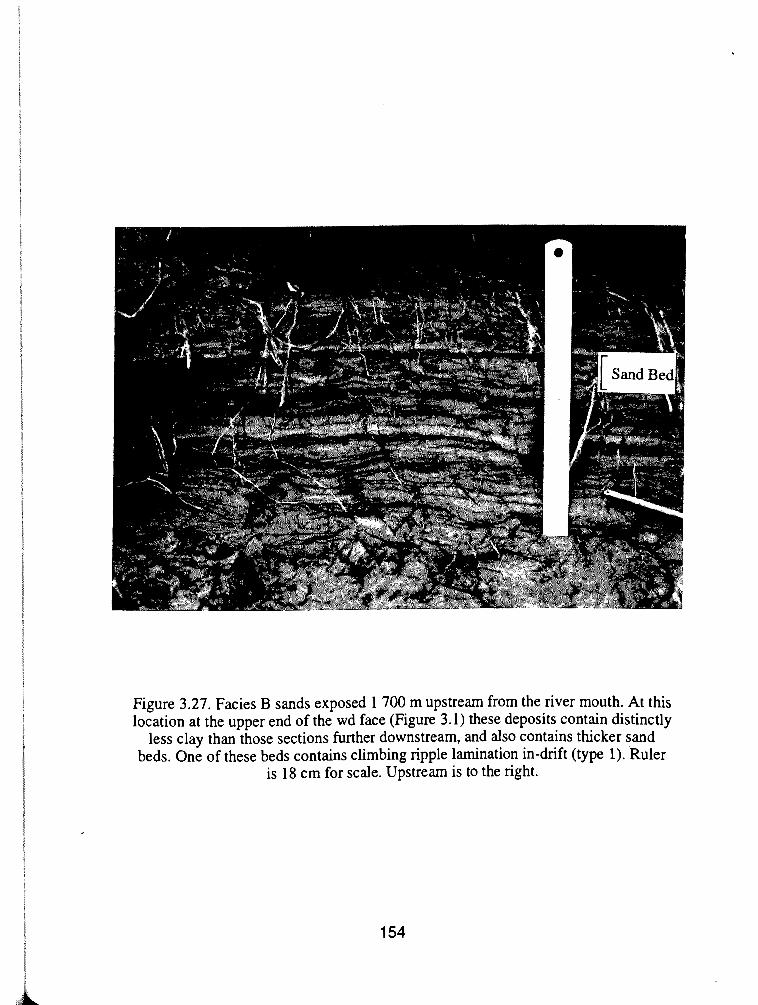
Figure 3.27. Facies B sands exposed 1 700 m upstream from the river mouth. At this location at the upper end of the wd face (Figure 3.1) these deposits contain distinctly
less clay than those sections further downstream, and also contains thicker sand beds. One of these beds contains climbing ripple lamination in-drift (type 1). Ruler
is 18 cm for scale. Upstream is to the right.
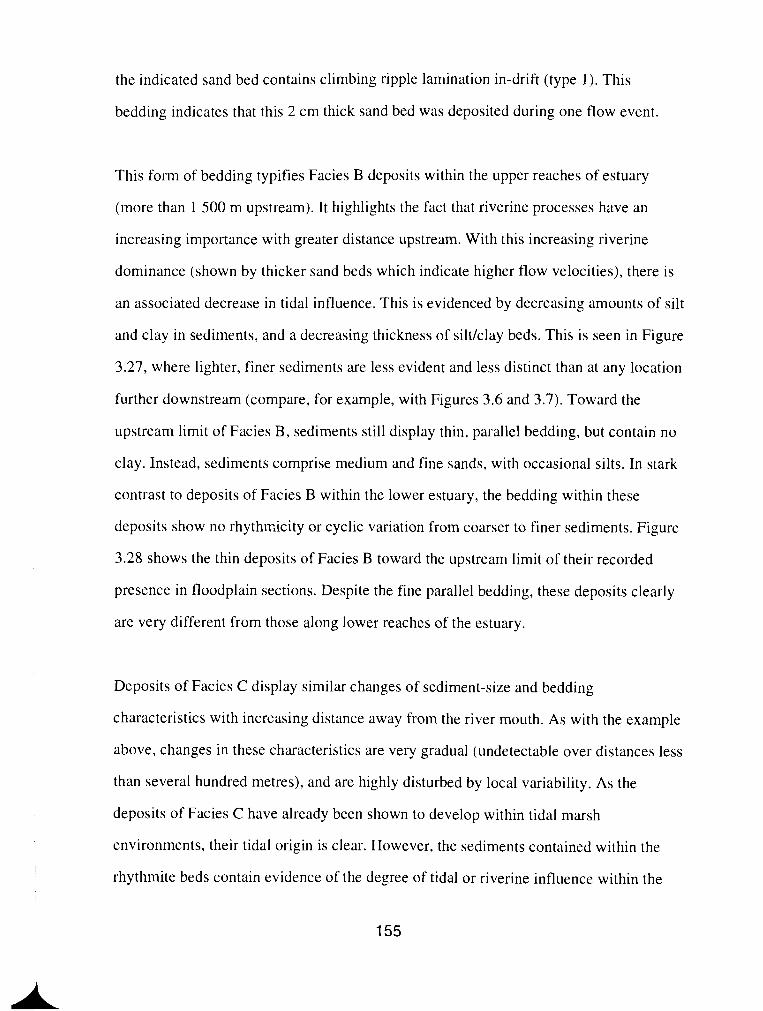
the indicated sand bed contains climbing ripple lamination in-drift (type 1). This
bedding indicates that this 2 cm thick sand bed was deposited during one flow event.
This form of bedding typifies Facies B deposits within the upper reaches of estuary
(more than 1 500 m upstream). It highlights the fact that riverine processes have an
increasing importance with greater distance upstream. With this increasing riverine
dominance (shown by thicker sand beds which indicate higher flow velocities), there is
an associated decrease in tidal influence. This is evidenced by decreasing amounts of silt
and clay in sediments, and a decreasing thickness of siltklay beds. This is seen in Figure
3.27, where lighter, finer sediments are less evident and less distinct than at any location
further downstream (compare, for example, with Figures 3.6 and 3.7). Toward the
upstream limit of Facies B, sediments still display thin, parallel bedding, but contain no
clay. Instead, sediments comprise medium and fine sands, with occasional silts. In stark
contrast to deposits of Facies B within the lower estuary, the bedding within these
deposits show no rhythnicity or cyclic variation from coarser to finer sediments. Figure
3.28 shows the thin deposits of Facies B toward the upstream limit of their recorded
presence in floodplain sections. Despite the fine parallel bedding, these deposits clearly
are very different from those along lower reaches of the estuary.
Deposits of Facies C display similar changes of sediment-size and bedding
characteristics with increasing distance away from the river mouth. As with the example
above, changes in these characteristics are very gradual (undetectable over distances less
than several hundred metres), and are highly disturbed by local variability. As the
deposits of Facies C have already been shown to develop within tidal marsh
environments, their tidal origin is clear. However, the sediments contained within the
rhythmite beds contain evidence of the degree of tidal or riverine influence within the
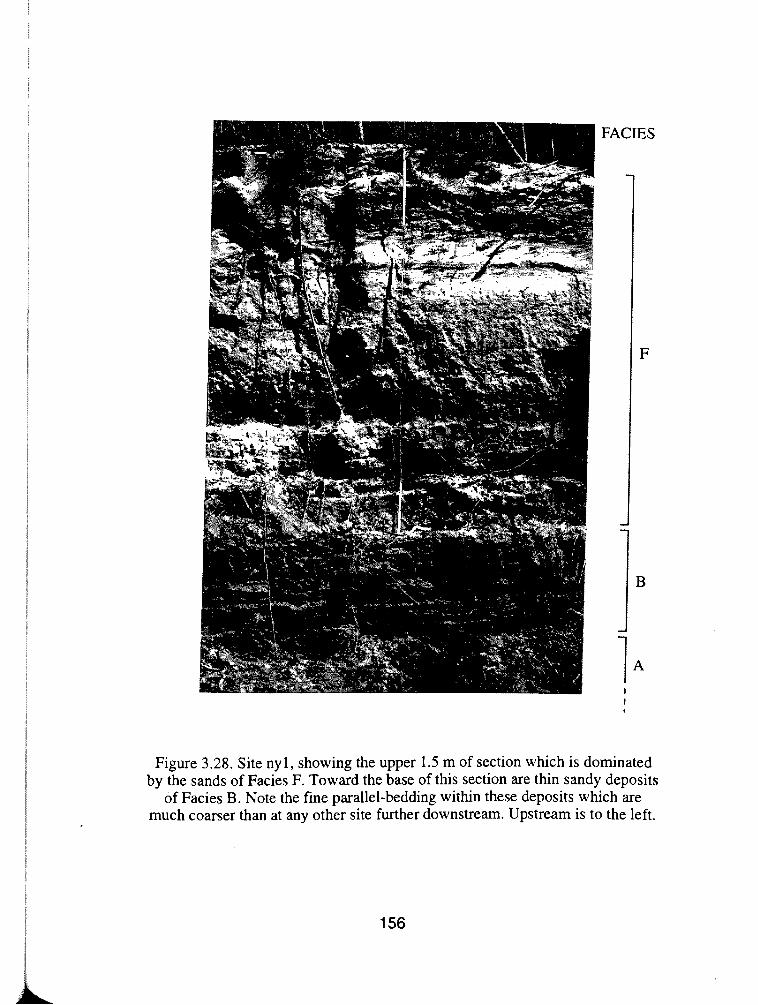
Figure 3.28. Site nyl, showing the upper 1.5 m of section which is dominated by the sands of Facies F. Toward the base of this section are thin sandy deposits
of Facies B. Note the fine parallel-bedding within these deposits which are much coarser than at any other site further downstream. Upstream is to the left,
tidal marsh. As a general rule, the sediments of Facies C increase in size with increasing
distance upstream. Within west delta sections, rhythmite beds contain fine sandy silts
with clay. In places, clay content exceeds 33 % of bed composition (by weight), and
beds rarely contain less than 10 % clay. Along the ox face, rhythmite beds contain fewer
clays, and are considerably more silty. With increasing distance upstream (toward the
upstream limit of Facies C), beds are dominated by fine, and even medium sands.
Campbell and Oaks (1973) found a similar increase in sediment-size within tidal flat
deposits (which included tidal flat proper (Facies B) and tidal marsh (Facies C)).
In addition to these changes in sediment-size composition, tidal marsh rhythmite beds
also display variable thicknesses throughout the estuary. Initially, rhythmite beds
decrease in thickness with increasing distance upstream. Beds exposed along the ox face
are distinctly thinner than those exposed along west delta sections. This decreasing
thickness reflects the decreasing tidal amplitude (induced by river slope), and more
importantly, the decreasing tidal modification of riverine flow. As tidal flux is less able
to slow Squamish flow, particularly close to and during high tide, fewer fines will be
able to be deposited from suspension. This is evident from the decreased thicknesses of
annual deposits, and the decreasing clay content of beds.
Rhythrnite beds do not show a simple thinning trend with increasing distance up estuary,
however. Toward the upstream most limit of Facies C, beds increase in thickness again.
This increase is associated with a notable increase in sediment-size, as discussed above.
The thickness and texture of these beds are indicative of riverine dominance. Although
deposits formed within a marsh system which was regularly inundated by tides,
sedimentation rates were highly influenced or dominated by riverine input. Flows
adjacent to, and over this marsh area were clearly of higher velocity (from the amount of
sand) than flows which inundated the west and central deltas. Apart from these changes
in the average thickness of rhythmite beds, these beds display the characteristic thinning
upsection at all locations throughout the estuary.
Upstream Limit of Detectable Tidal Sedimentary Control
One of the main aims of this research is to determine the extent of tidal control or
influence on sedimentation within Squamish estuary. The extent of tidal control can be
defined as both the degree of sedimentologic and stratigraphic influence, and the
upstream limit of detectable tidal deposition. The term detectable tidal deposition is used
to describe those deposits which contain sedimentary evidence of their tidal nature at the
scale of investigation employed in this study. The aim of this section is to report on the
upstream limit of detectable tidal deposition.
The landward limit of detectable tidal deposits marks an important boundary termed the
bayline, as defined by Posamentier and Vail (1988). Upstream from this limit, tides may
influence flow (particularly during low flow periods), but will not produce distinct tidal
bedding. The bayline is a dynamic feature, and may shift either away from or toward the
depositional basin in response to sea-level changes (Posamentier et al., 1988).
Within Squamish estuary, the bayline is marked by the upstream limit of Facies B, and
is therefore around 3 300 m upstream from the river mouth (channel centreline distance).
This limit is considerably less than the length of Squamish estuary (at least 5 500 m),
which is defined as that portion of the river influenced by tidal flux. Similar
observations regarding bayline location were made by Allen (1991), who examined the
fluvial-tidal transition along the Garonne River and Gironde Estuary in France. Allen
concluded that the bayline marked the landward extent of estuarine facies, and that all
locations upstream from this were fluvial channel facies. Dalrymple et al. (1992)
similarly defined estuaries as that portion of the system between the landward limit of
tidal facies and the seaward limit of coastal facies. I feel, however, that Allen's (1991)
interpretation and the definition of Dalrymple et al. (1992) are misleading, as they
assume that estuarine reaches of the rivers are characterised by some form of detectable
tidal deposits, and that estuaries end at the bayline. I think that it is more accurate to
define the estuary from hydraulic, not sedimentologic considerations. These
considerations have been employed, correctly I believe, in the definition and
interpretation of estuarine sequences by Allen and Posamentier (1993). If the estuary is
classified as that part of the river subject to tidal flux, then estuarine sequences will
display both fluvial and tidal deposits. The location of the bayline within this estuarine
reach may then be used as an indication of the relative fluvial or tidal dominance within
a particular system. Within Squamish estuary, for example, the importance and
dominance of riverine over tidal depositional processes is indicated by the large distance
(at least 2 200 m) between the upper limit of estuary and the bayline.
The importance of this distinction is highlighted in Figure 3.29, which shows a
schematic representation of estuaries based on a number of different definitions. One of
the most commonly-used definitions of an estuary is that of Pritchard (1967), who
defines an estuary in terms of salinity as that portion of the system where salinities range
from 0.1%0 to 30-35960. Dalrymple et al. (1992) argue convincingly that while this
definition is of some value, it is of limited use to the sedimentologist because estuarine
sedimentation primarily is determined by physical rather than chemical processes. The
estuarine limit associated with the definition of Pritchard is shown in Figure 3.29, along
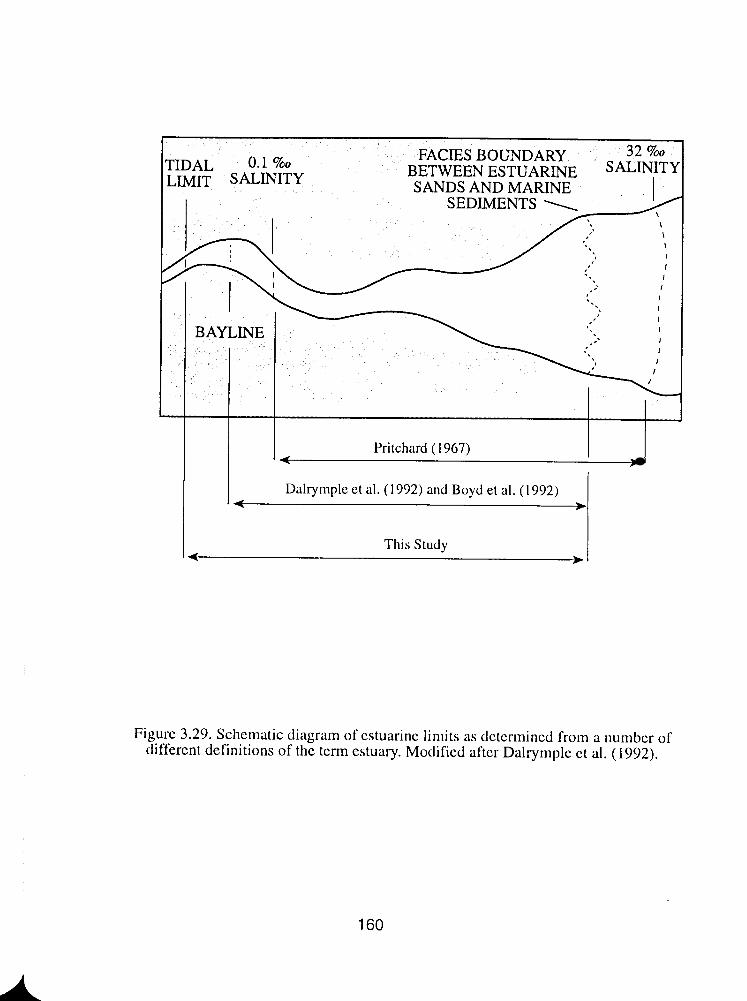
FACES BOUNDARY 32 %o TIDAL 0.1 %o LIMIT SALINITY BETWEEN ESTUARINE SALINIT'I
SANDS AND MARINE SEDIMENTS \\
BAYLINE
I 4 Pritchard ( 1967) I Dalrynplc et al. ( 1 992) and Boyd el al. ( 1 992)
< *
This Study
Figurc 3.29. Schcrnatic diagram of cstuarinc limits as dctcrmincd from a rlumbcr of different definitions of the tcrm estuary. Modified aftcr Dalrymplc et al. (1992).

with that associated with an alternative definition proposed by Dalrymple et a1 .(1992),
employed by Boyd et al. (1992), and that used in this study.
There are a number of important points to consider in regard to the location of the
bayline in Squamish estuary, or any other estuary. The first of these is the obvious point
that the upstream limit of tidal deposits identified in this study may not give a true
indication of the bayline location, as observation is limited by the location of sections
within valley-fill sediments. Also, I do not feel that it is strictly correct to state that tides
exert sedimentary control for 3 300 m along Squamish estuary, as this assumes that the
tidal deposits were laid down by an estuarine channel which had the same location and
morphology as that today. If the palaeochannel were either straighter, or more
meandering, the true upstream limit of the bayline would be either less or more than the
3 300 m reported above. Given the nature of flow of Squamish River, and the narrow
valley width, this is not a major concern in this study area. It may, however, be of much
greater importance in arcas where large, slow flowing rivers are able to migrate across
extensive floodplains. Because of this, it is perhaps best to report the location of the
bayline as a straight line distance from the delta head or shoreline. Under this system,
the bayline in Squamish is located 3 100 m upstream from the river mouth.
In addition to the above, it is also important to consider the affect that delta progradation
will have on the relative location of the bayline. Posamentier et al., (1988) discussed the
dynamic nature of the bayline with regard to sea-level changes. In addition to this, it
seems highly likely that the bayline location will be influenced by changes in
depositional environment of greater periodicity and speed of onset. For example, one
would expect to see a seaward translation of the bayline accompanying delta
progradation. As the delta-front progrades, the upper delta plain reaches become less
influenced by tidal flux, and more influenced by fluvial depositional and erosional
processes. These will tend to re-work delta topset tidal deposits, and lay down alluvial
plain deposits with no detectable tidal influence. In this way, the bayline will gradually
shift down valley at a rate which should (as a long-term average) keep pace with the rate
of delta progradation. Over shorter periods of time (perhaps decades) there will exist a
lag between shifts in the location of upstream most tidal deposition (driven by
progradation), and shifts in the location of the bayline, as the erosion of tidal deposits
will not be immediate.
This may have important consequences for sedimentologists attempting to delineate
estuarine zones based on sedimentologic and stratigraphic data, or those attempting to
determine the origin of deposits from an examination of flow processes at that particular
location. The exact lag time will be specific to a particular system, but will be
determined by the energy environment of the fluvial system, the lateral stability of the
channel(s), valley width, and possibly the sediment-size characteristics (erosional
resistance) of tidal deposits. From this, lag times in Squamish estuary are thought to be
relatively small, though no exact figure is known.
Lastly, it is important to consider the location of the bayline in relation to the seasonality
of flow in this environment. It seems likely that the upstream limit of tidal deposition
will be highly dynamic, and shift upstream or downstream over a number of time scales.
These shifts may occur as discharge fluctuates over the course of one day (particularly
during summer months when temperature changes induce variable snowmelt), or as
discharge fluctuates over seasons. It is unclear, however, how sensitive the depositional
system is to these short-term fluctuations of the location of tidal deposition. For
instance, the zone of tidal deposition should extend further upstream during winter
months than during summer months when discharges are much higher. It is impossible
to determine, however, whether the bayline will record the upstream location of winter
tidal deposition, or whether summer flows will erode these deposits before they can
become preserved in sequence. Allen (1991) reported that the location of the bayline
coincided with the upstream limit of reversing flows during periods of high river
discharge.
Zonation of Squamish Estuarine Deposits
In the past, a number of authors have attempted to delineate estuarine subenvironments
based on morphologic regions, sedimentary structure, or biologic character. The aim of
this section is to discuss some of these works and to consider the zonation exhibited
within Squamish estuary.
As has already been stated in chapter one, the first attempts to fully investigate the
transitional reaches of estuarine rivers were published in Senclienbergiana Muritima in
1975. The work of Dorges and Howard (1975), Howard et al. (1975), and Greer (1975)
determined that a number of regions exist within the estuary under study, but that these
regions need not necessarily be the same for all variables under consideration. For
example, Howard et al. (1975) divided the estuary into three regions: upper, middle, and
lower. This division was based on the distribution of chemical and hydrographic features
such as salinity, pH, water temperature, and turbidity. Animal distribution characteristics
were distinct within these three regions. In an investigation of sediment texture and
physical and biogenic sedimentary structure, Dorges and Howard (1975) determined that
four estuarine facies were distinguishable. These facies were termed inner, upper-
middle, lower-middle, and outer estuarine facies, which did not correspond with the
regions of distinct animal communities, but did correspond with regions identified from
textural analysis of point bar deposits. Transitions between regions or facies were termed
highly gradational, and no attempt was made to produce any form of model for the
subenvironments identified.
Jouanneau and Latouche (198 1) divided the Gironde Estuary into three reaches based on
morpho-sedimentological assemblages, and were the first to use the term "riverine
estuary". Dalrymple et al. (1990) developed a similar tripartate facies zonation of sandy
deposits along reaches of the Cobequid Bay-Salmon River estuary, Bay of Fundy. Allen
(199 1) followed these works by proposing a similar morphological estuarine division,
but then made an important further contribution by describing and graphically
presenting the distinct facies types within these morphological zones. This longitudinal
facies sequence, which is similar in form to that proposed meandering point bar deposits
by Smith (1987), is shown in Figure 3.30. Further significance of this longitudinal facies
pattern is given by Allen and Posamentier (1993).
Since publication of these works, a limited number of papers have attempted similar
investigation of estuarine zonation. Nichols et al. (1991) proposed an estuarine facies
model similar to that of Allen (1991), shown in Figure 3.31. This study differs from
those previously undertaken as it presents a schematic representation of facies changes
within a microtidal environment, whereas most environments under study are meso- or
macrotidal (Hayes, 1976). Dalrymple et al. (1992) propose a series of conceptual
estuarine facies models for wave- and tide-dominated environments. In a series of
conceptual schematic diagrams the authors relate sedimentary facies to estuarine
morphological components and to relative energy conditions along the length of the
estuary. As has already been noted, however, this work fails to consider the example of
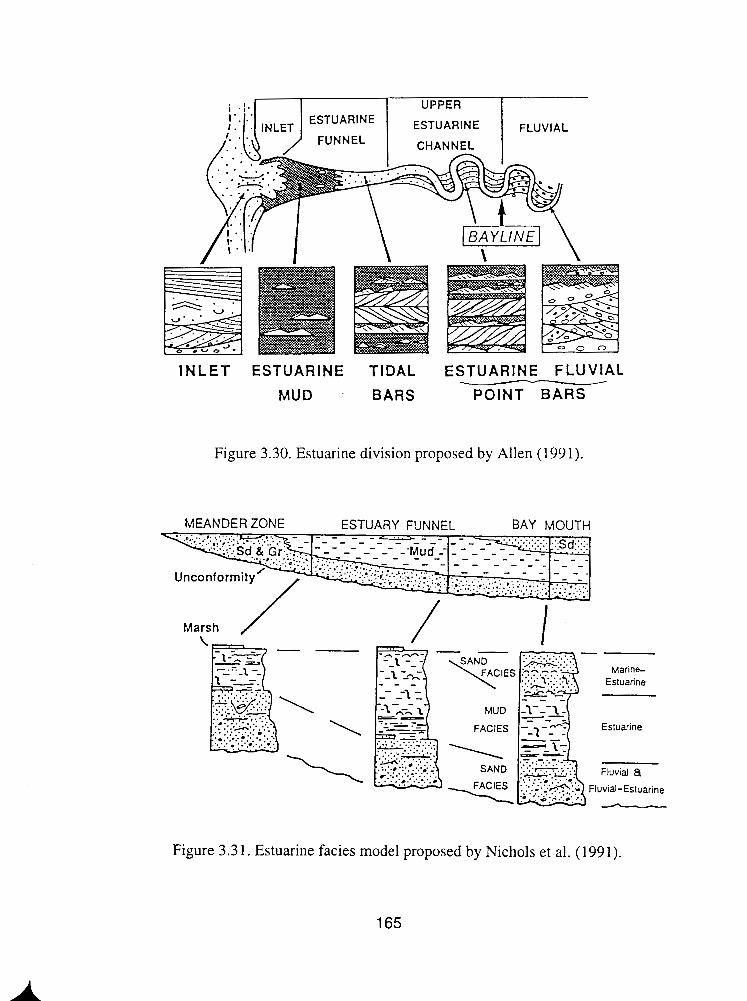
I N L E T ESTUARINE TIDAL ESTUARINE FLUVIAL - MUD . BARS POINT BARS
Figure 3.30. Estuarine division proposed by Allen (199 1).
MEANDER ZONE ESTUARY FUNNEL BAY MOUTH
Figure 3.3 1. Estuarine facies model proposed by Nichols et al. (1991).
165
fluvial-dominated estuarine systems.
One common theme of these proposed schemes is that they are based (at least initially)
on morphologic divisions of the estuary under investigation. Once these morphologic
reaches or zones have been identified, authors then look within these zones to identify
characteristic sediment texture and structures. This approach is open to the criticism that
the prespecification of zones imposes some bias on sedimentologic investigation and
interpretation. The approach employed in this study, however, has necessarily been
different. Sedimentary sequences within Squamish estuary display gradual changes
down estuary, yet these occur without an associated change in channel morphology. The
estuarine reach of Squamish estuary is always single channel meandering, and displays
only a minimal estuarine funnel. It clearly is more appropriate to consider changes in
sedimentary facies in relation to changing energy conditions associated with (in this
case) changes in the relative influence of river and tides, than to consider changes in
relation to estuarine mcrphology.
The following paragraphs outline attempts to delineate estuarine zones within Squamish
estuary based on sedimentologic and stratigraphic evidence. It is clear from the
discussion above that there exist a number of proposed terminologies for estuarine
division, which are not necessarily applicable within this system. For example, the term
riverine estuary (Jouanneau and Latouche, 198 1) cannot be used here as the entire
estuarine reach of Squamish River may be considered riverine estuary because of the
dominance of the fluvial input to this system. As I have no desire to add to the growing
list of terms or add credence to any proposed scheme, Squamish estuary has been
divided into four zones labeled I to IV. These zones, which are shown in Figure 3.32,
reflect the decreasing riverine dominance with increasing proximity to Howe Sound
fjord.
Zone I extends from the upstream limit of tidal flux to the upstream limit of tidal
deposits (the bayline). The upper limit of this zone denotes the extent of Squamish
estuary, although as has already been noted, this limit is not static but shifts seasonally
and daily. Sedimentary deposits and sequences within this zone display no detectable
tidal influence and as such are dominated by coarse sands and gravels separated by
numerous erosional surfaces. Sedimentation within this zone appears entirely driven by
fluvial processes. While tides clearly influence flow to some degree, this is not enough
to induce deposition of sediments which display their tidal nature.
Zone IT extends from the bayline to a point around 1 500 m upstream from the river
mouth. The downstream boundary of zone I1 corresponds with that location where the
sandy deposits of Facies F are first observed in section. This location is easily detectable
in section as the sands of Facies F form a coarse sequence cap which differs
considerably from those deposits below. Sedimentary sequences display considerable
variability throughout the length of zone TI. Toward the downstream end, sections
display the simplistic sequence comprised of Facies A, B, C, E, F and G. The fine-
grained deposits of Facies B and particularly Facies C are thick at this point. Toward the
upstream limit of zone I1 sections are more complex, as Facies B and C thin and
eventually pinch-out, and coarse sand interbeds disturb the simple sequence transitions
noted further downstream. Contacts between facies commonly are gradual, though
abrupt and erosional contacts increase in importance toward the upstream limit of zone
11. This zone may be considered the transitional zone where both fluvial and tidal
processes influence sediment deposition and sequence appearance. Tides exert enough
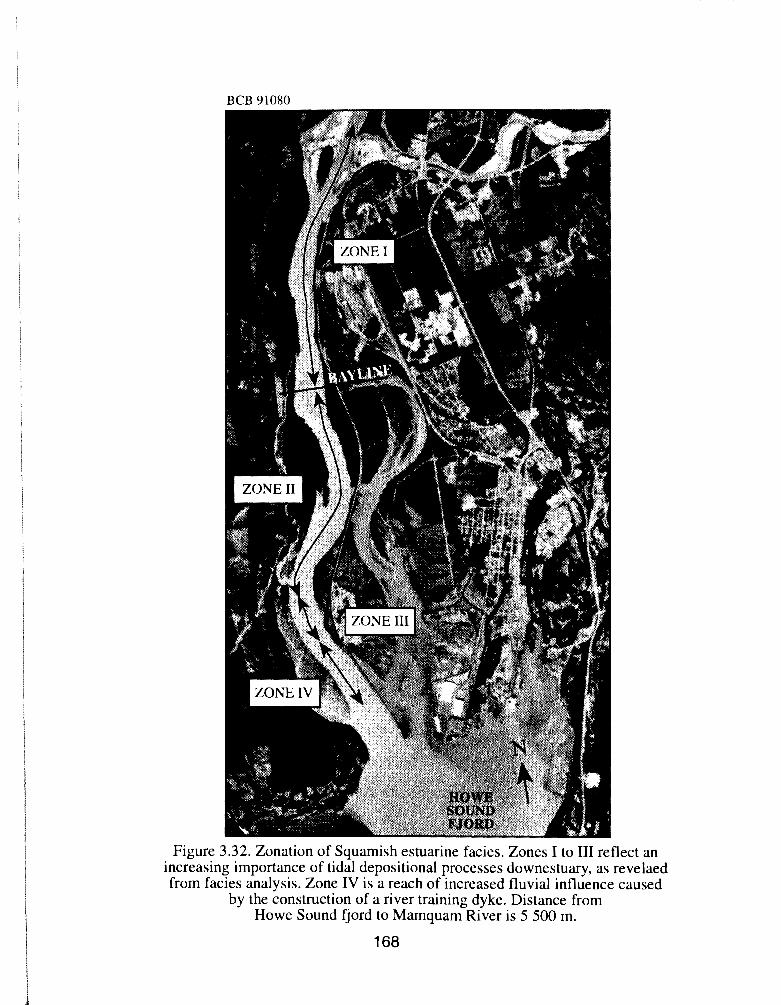
BCB 9 1080
-
Figure 3.32. Zonation of Squarnish estuarine facies. Zones 1 to I11 reflect an increasing importance of tidal depositional processes downestuary, as revelaed from facies analysis. Zone IV is a reach of increased fluvial influence caused
by the construction of a river training dyke. Distance from Howe Sound fjord to Mamquam River is 5 500 m.
influence to allow the settling of fine-grained sediments from suspension during high
tide periods, yet do not modify river flow enough to prevent large flood events
depositing sands on delta and floodplain surfaces.
Zone 111 extends from the downstream limit of deposits of Facies F to the point at which
Facies D deposits are detectable in section. This downstream boundary is not very
clearly defined, as Facies D sediments fine up estuary and become difficult to detect,
and may easily be confused with those deposits of Facies E. Sequences within this zone
are comprised almost entirely of the fine-grained deposits of Facies C. Only Facies A, B,
C, and E are present in sections, which appear similar throughout the length of this zone.
Facies transitions most commonly are gradual, and never erosional. Deposits of Facies B
display a high degree of tidal influence and record some form of tidal cyclicity, most
probably produced by diurnal tidal flux. This zone represents that region where tidal
influence is greatest and where river flow is considerably modified and slowed such that
the deposition of large sand interbeds or erosion of existing deposits does not occur.
Zone IV extends from the limit of Facies D sands to the seaward limit of intertidal
deposits. This zone perhaps is unique to this environment as it records an increasing
fluvial influence (which is in contrast to the transition from zones I to I1 to I11 which
record decreasing fluvial influence) with increasing proximity to the river mouth. This
increase in not a natural phenomena, but instead has been induced by dyke construction
and the associated reductions in floodwater storage capacity. The decreased channel and
floodplain widths have produced anomalous sedimentary sequences characterised by
transitions from Facies A to B, to C, and finally to Facies D. If Squamish River training
dyke had not been constructed, sedimentary sequences likely would display the same
characteristics as those immediately upstream. In this case, zone 111 would extend
throughout the lower reaches of the estuary to the seaward limit of intertidal deposits,
resulting in a tripartate estuarine division.
The limits of all zones identified here are non-static features in the long-term, and they
may all be expected to shift seaward as Squamish delta progrades.
Assumptions of Methodology Employed
Investigation of stratigraphic sequence from available section evidence (in this case,
channel banks) is possibly the most commonly employed methodology of
sedimentologists. This technique, however, is not without criticism, as it makes an
important assumption which must be considered when interpreting section data. This
form of sampling technique assumes that the present section setting can be considered
the same as the original depositional setting of those sediments. This assumption is of
critical importance in this study, as it could (if proved wrong) invalidate my conclusions
regarding the upstream limit of tidal sedimentary control (the bayline).
As an example, if sediments have a high residence time then deposits within the fluvial
environment may in fact be 1 000 years old and deltaic in origin, thus bearing no
relation to the depositional environment at the present location. When applied directly to
Squamish estuarine deposits, this could mean that the upstream-most tidal deposits were
deposited at a time when the delta front was 1 000 m further up valley than at present.
This would mean that tidal sedimentary control only extends 2 100 m upstream, and not
the 3 100 m that I have stated.
While this may invalidate sedimentologic interpretation in certain environments, this is
not considered important here, for a number of reasons. Firstly, it is felt that the
residence time of sediments within the confined Squamish River valley is too small to
record considerable delta progradation. Sediments can reasonably be expected to be
representative of the environment within which they are found. This is particularly true
of the degree of tidal influence (longitudinal component), though it is more difficult to
assess the lateral component - whether sediments were deposited in proximal or distal
channel locations. This latter point, however, is of far less importance in this study than
that related to tidal influence.
In addition to this question of low residence time, there are a number of pieces of
sedimentologic evidence which indicate that sediments are representative of their
present locations. The first is the fact that the tidal deposits of Facies B and C thin
upstream, and eventually pinch-out. This gradual decrease in thickness is a good
indication that the exposed deposits of these facies are contemporary with each other.
Facies C deposits were formed within an extensive tidal marsh environment, over the
same period of time. Secondly, the lower 1 000 m of Facies B sediments contain shell
debris, but these are not noted further upstream. These shells are thought to accumulate
within intertidal sandflats along the seaward limit of the delta. The fact that these shells
are not observed in upstream deposits of Facies B would seem to rule out the possibility
that Facies B deposits record progradation of deltaic intertidal sands.
The most important sedimentologic evidence is provided from the recent sediments
along the ny face. Within these sediments there is conclusive proof that the tidal bedding
furthest upstream is contemporary with the environment of deposition seen at that
location today. Examination of Figure 3.1 reveals that the ny face sections are located
toward the upper limit of the abandoned central channel. As such, the deposits seen
along this face represent IHS or IS deposits (Thomas et al., 1987) associated with point
bar growth, and sediments of the sandy plug which filled this upper meander cutoff.
These sediments can only be 60 years old at most. The fact that tidal deposits of Facies
B can be seen in this face (in Figure 3.28) indicates that tidal sedimentary control does
indeed exist over 3 000 m upstream. The fact that these tidal deposits are so thin at this
location (and cannot be traced more than 40 m upstream) indicates that this location is
very close to the upstream-limit of tidal sedimentary control.
CHAPTER FOUR
ENVIRONMENTAL SIGNIFICANCE
OF FINE-GRAINED SEDIMENTARY DEPOSITS
A number of assertions have been made in chapter three regarding the tidal character of
facies within Squamish estuary, particularly the tidal marsh deposits of Facies C. It is
important, however, to test whether overbank fines within purely fluvial reaches display
some or all of the noted characteristics of tidal deposits. The aim of this chapter is to
make comparison between fine-grained deposits in fluvial and estuarine environments to
enable clearer definition of the character of tidal deposition. Comparison is based on a
number of observations and analyses from bed-scale sedimentologic analysis to element-
scale analysis of stratigraphic sequences. Although fine-grained sedimentary deposits
may be of significant value as indicators of environments of deposition, Miall (1987)
notes that they have received little attention compared with their sandy counterparts.
The following sections describe the possible environmental significance of overbank
deposits, and present a description and interpretation of specific deposits exposed along
fluvial reaches of Squamish River. The characteristics of these fine deposits will then be
compared with those of tidal marsh Facies C. As the specific aim of this study is to
determine whether estuarine fine-grained deposits can be accurately and confidently
identified as tidal in origin, I examined those fluvial deposits which most closely
resembled the deposits of Facies C. This is because these visually similar deposits are
most likely to be misinterpreted as tidal in origin. The aim here is not to find those
fluvial deposits which are genetically analogous to their estuarine counterparts.
Description of Fine-Grained Units Exposed Along Fluvial Reaches
The fine deposits described here, and shown in section in Figure 4.1, are observed in
river bank sections over 13 000 m upstream from Howe Sound fjord. Fines are seen in
section at a number of isolated locations indicated on Figure 4.2. Between this location
and a point around 4 000 m upstream from Howe Sound fjord, no fine-grained
floodplain deposits are observed in channel bank sections of Squamish River. Where
fine deposits are present, they are recorded at the base of stratigraphic sequences which
are often over 600 cm in height, even during the high flow months of July and August.
One such sequence is shown in Figure 4.1, which shows a section diagram for the site
indicated in this figure. This particular location was selected for description as it
displays the typical Facies assemblage of these upstream sites.
The lowest deposits in section are the finest, ranging in size from a fine sand to a silty
fine sand. These deposits are at least 200 cm thick (and at least 370 cm thick in places),
though their lower boundary was never observed or reached during augering. The upper
boundary is marked by an abrupt change in sediment-size to a medium sand. This
contact occasionally appears erosional, as the height of the fine deposits is variable in
section over short distances, and bedding within these upper deposits seems
discontinuous. Deposits are finely parallel-bedded, and generally consist of alternating
thin layers of inorganic material and layers dominated by organics. This alternation
produces rhythmite bedding throughout much of the facies. Though beds are parallel,
they are not necessarily horizontal. At one location beds appear to dip down out of the
face (perpendicular to contemporary flow), and the facies is higher in section 10 m
upstream than downstream.
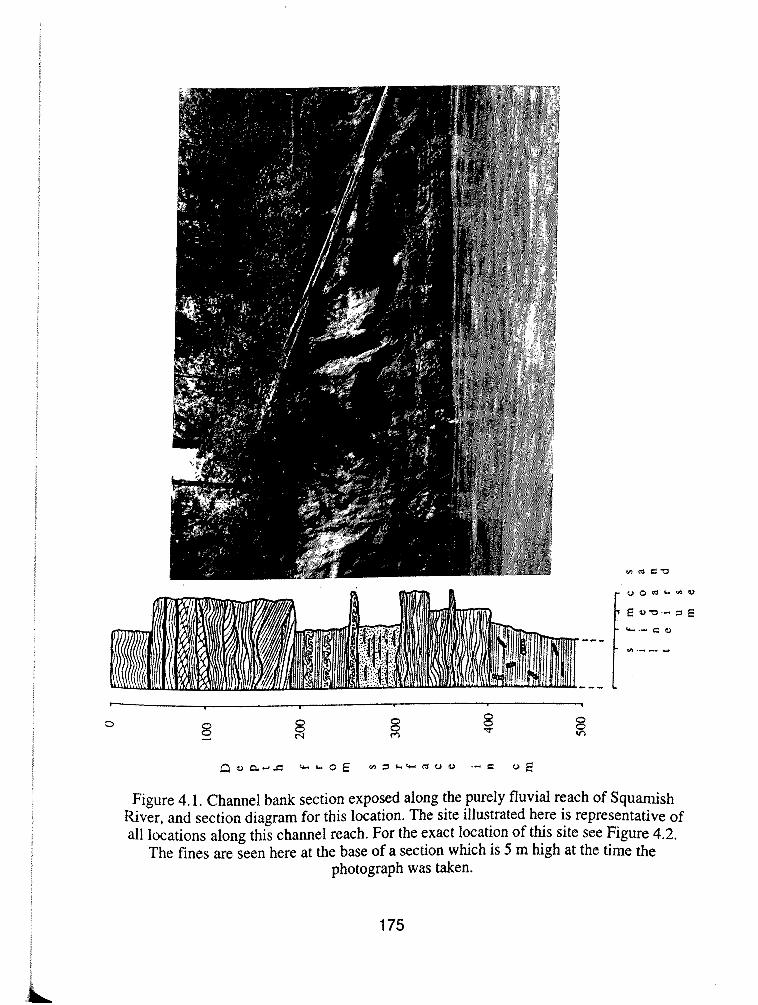
Figure 4.1. Channel bank section exposed along the purely fluvial reach of Squamish River, and section diagram for this location. The site illustrated here is representative of all locations along this channel reach. For the exact location of this site see Figure 4.2.
The fines are seen here at the base of a section which is 5 m high at the time the photograph was taken.
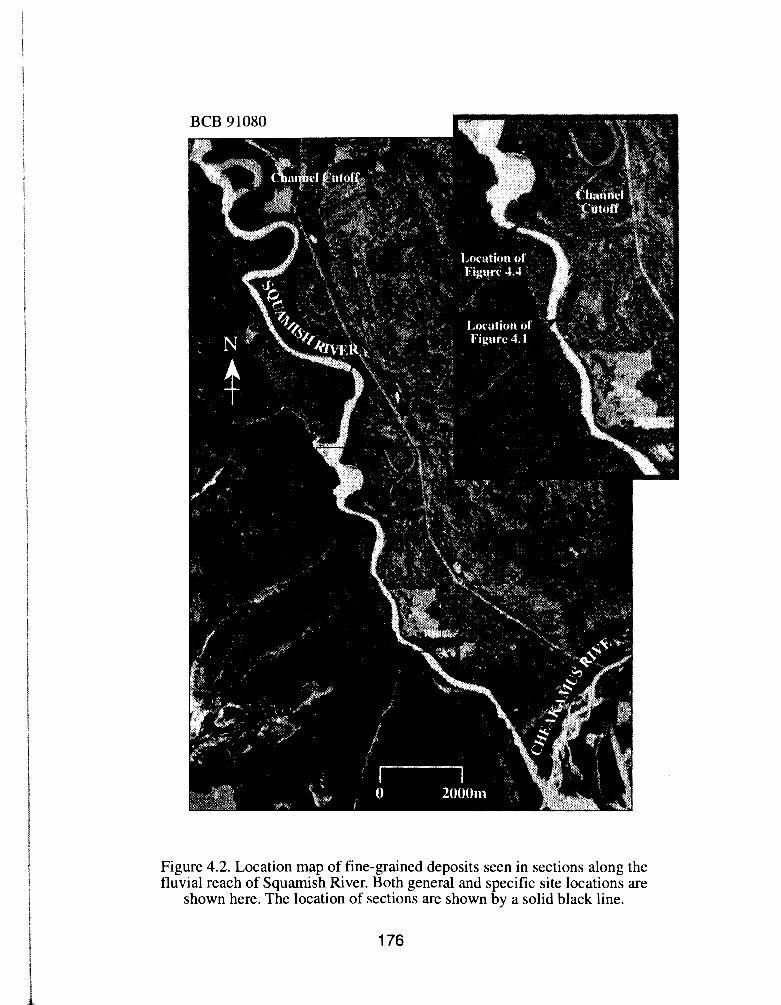
Figure 4.2. Location map of fine-grained deposits seen in sections along the fluvial reach of Squamish River. Both general and specific site locations are
shown here. The location of sections are shown by a solid black line.
1 76
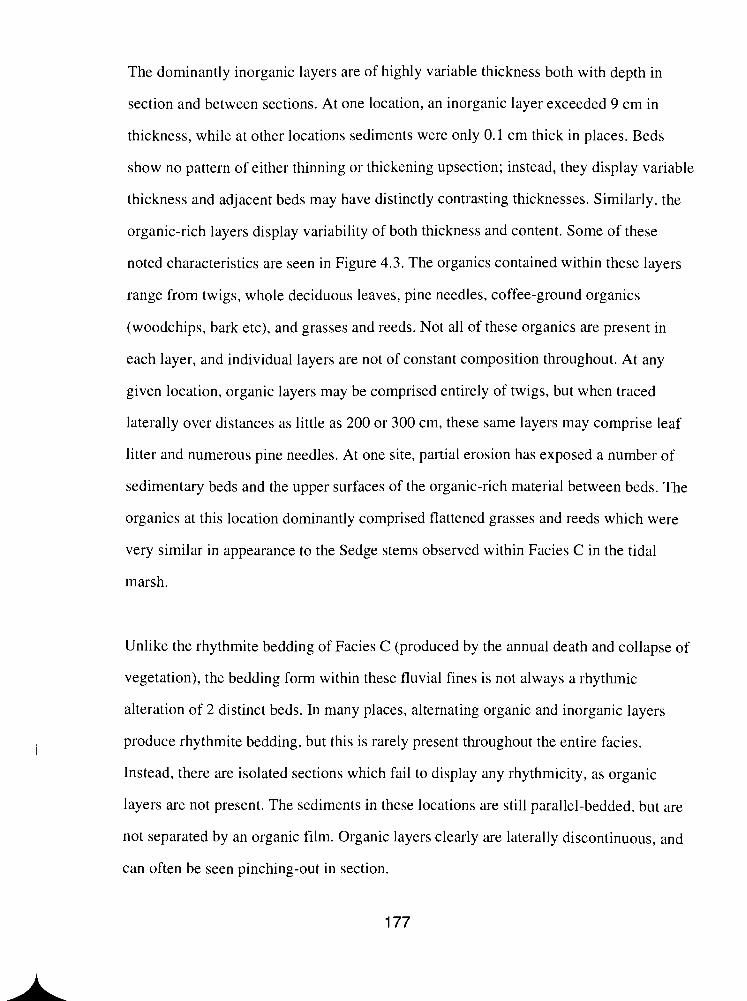
The dominantly inorganic layers are of highly variable thickness both with depth in
section and between sections. At one location, an inorganic layer exceeded 9 cm in
thickness, while at other locations sediments were only 0.1 cm thick in places. Beds
show no pattern of either thinning or thickening upsection; instead, they display variable
thickness and adjacent beds may have distinctly contrasting thicknesses. Similarly, the
organic-rich layers display variability of both thickness and content. Some of these
noted characteristics are seen in Figure 4.3. The organics contained within these layers
range from twigs, whole deciduous leaves, pine needles, coffee-ground organics
(woodchips, bark etc), and grasses and reeds. Not all of these organics are present in
each layer, and individual layers are not of constant composition throughout. At any
given location, organic layers may be comprised entirely of twigs, but when traced
laterally over distances as little as 200 or 300 cm, these same layers may comprise leaf
litter and numerous pine needles. At one site, partial erosion has exposed a number of
sedimentary beds and the upper surfaces of the organic-rich material between beds. The
organics at this location dominantly comprised flattened grasses and reeds which were
very similar in appearance to the Sedge stems observed within Facies C in the tidal
marsh.
Unlike the rhythrnite bedding of Facies C (produced by the annual death and collapse of
vegetation), the bedding form within these fluvial fines is not always a rhythmic
alteration of 2 distinct beds. In many places, alternating organic and inorganic layers
produce rhythmite bedding, but this is rarely present throughout the entire facies.
Instead, there are isolated sections which fail to display any rhythmicity, as organic
layers are not present. The sediments in these locations are still parallel-bedded, but are
not separated by an organic film. Organic layers clearly are laterally discontinuous, and
can often be seen pinching-out in section.
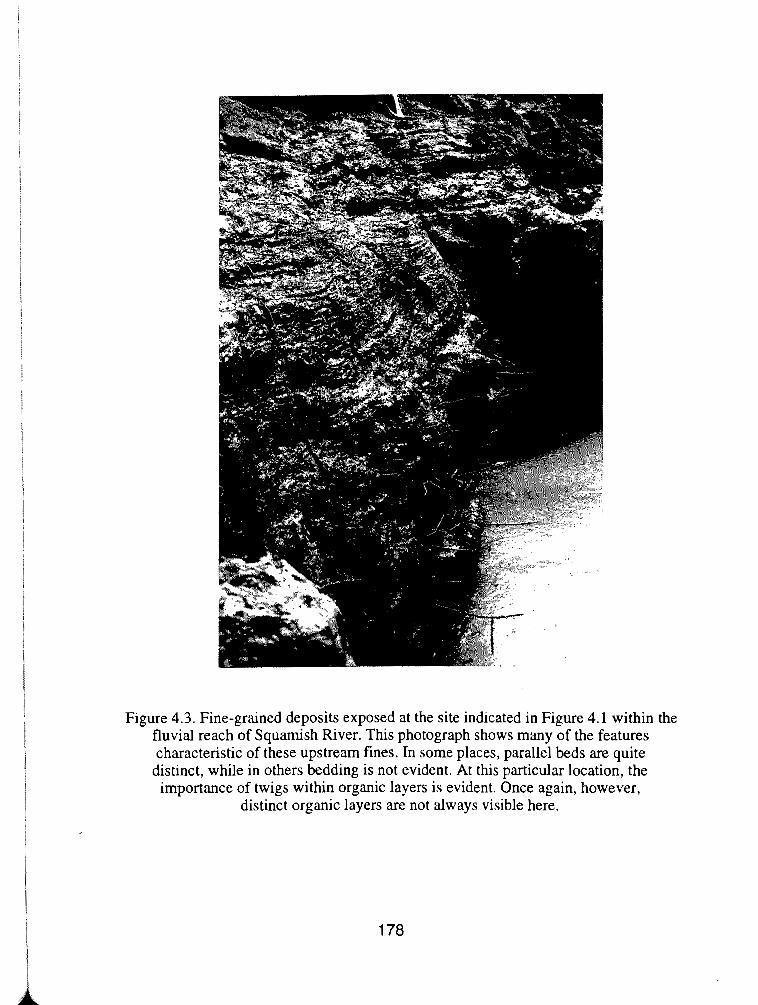
Figure 4.3, Fine-grained deposits exposed at the site indicated in Figure 4.1 within the fluvial reach of Squamish River. This photograph shows many of the features characteristic of these upstream fines. In some places, parallel beds are quite distinct, while in others bedding is not evident. At this particular location, the
importance of twigs within organic layers is evident. Once again, however, distinct organic layers are not always visible here.

These fine-grained deposits are overlain by up to 400 cm of medium to coarse sand.
These sands may be divided into a number of distinct facies which are of highly
irregular thickness across the section, and as such are found at variable depths within
section. All contacts between Facies are abrupt and occasionally erosional. Finer
deposits (medium sand) contain a number of bedding forms ranging from finely
laminated horizontal, parallel bedding, climbing ripple lamination (both in-phase and in-
drift), flaser bedding with connected lenses, and convolute bedding. Coarse sand
deposits show greater internal variability of bedding form. In places, the gradual
transition from climbing ripple lamination in-phase to in-drift (type I to type 11) is fully
preserved within these coarse sands. Elsewhere, Facies Contain numerous reactivation
and erosional surfaces. While these often produce abrupt changes in bedding form, no
associated rapid changes in sediment-size are recorded. Within one facies, numerous
trough-shaped erosional surfaces produce the characteristic bedding of trough cross-
stratification (McKee and Weir, 1953). Occasionally, fine laminae become overturned
and have a highly irregular form characteristic of convolute bedding. No coarse sand
Facies Display detectable fining or coarsening-upward sequences. Toward the top of the
section shown in Figure 4.1 there are three organic layers 1 to 2 cm thick. These layers
are formed primarily from leaf litter and twigs, and contain occasional roots.
Interpretation and Reconstruction of the Environment of Deposition
The fine deposits at the base of the section described above are considered to be
backwater deposits which developed within an abandoned channel section. These have
since become partly eroded and exposed by the contemporary Squamish River. Channel
abandonment probably occurred through meander neck cutoff forming an oxbow, as will
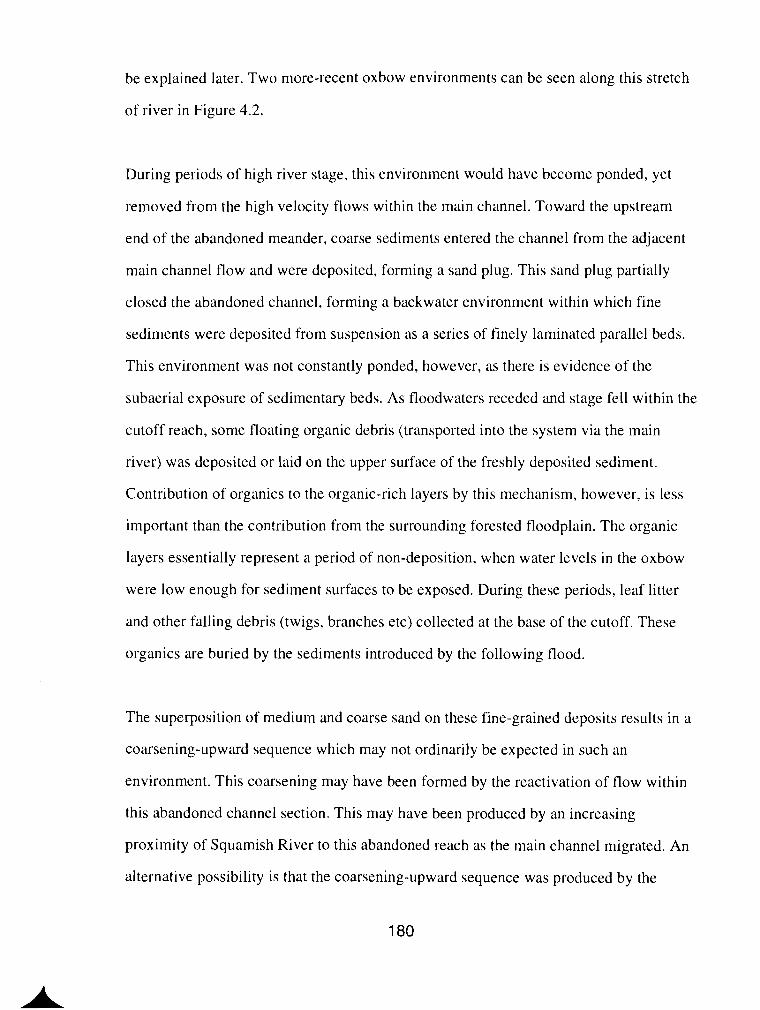
be explained later. Two more-recent oxbow environments can be seen along this stretch
of river in Figure 4.2.
During periods of high river stage, this environment would have become ponded, yet
removed from the high velocity flows within the main channel. Toward the upstream
end of the abandoned meander, coarse sediments entered the channel from the adjacent
main channel flow and were deposited, forming a sand plug. This sand plug partially
closed the abandoned channel, forming a backwater environment within which fine
sediments were deposited from suspension as a series of finely laminated parallel beds.
This environment was not constantly ponded, however, as there is evidence of the
subaerial exposure of sedimentary beds. As floodwaters receded and stage fell within the
cutoff reach, some floating organic debris (transported into the system via the main
river) was deposited or laid on the upper surface of the freshly deposited sediment.
Contribution of organics to the organic-rich layers by this mechanism, however, is less
important than the contribution from the surrounding forested floodplain. The organic
layers essentially represent a period of non-deposition, when water levels in the oxbow
were low enough for sediment surfaces to be exposed. During these periods, leaf litter
and other falling debris (twigs, branches etc) collected at the base of the cutoff. These
organics are buried by the sediments introduced by the following flood.
The superposition of medium and coarse sand on these fine-grained deposits results in a
coarsening-upward sequence which may not ordinarily be expected in such an
environment. This coarsening may have been formed by the reactivation of flow within
this abandoned channel section. This may have been produced by an increasing
proximity of Squamish River to this abandoned reach as the main channel migrated. An
alternative possibility is that the coarsening-upward sequence was produced by the
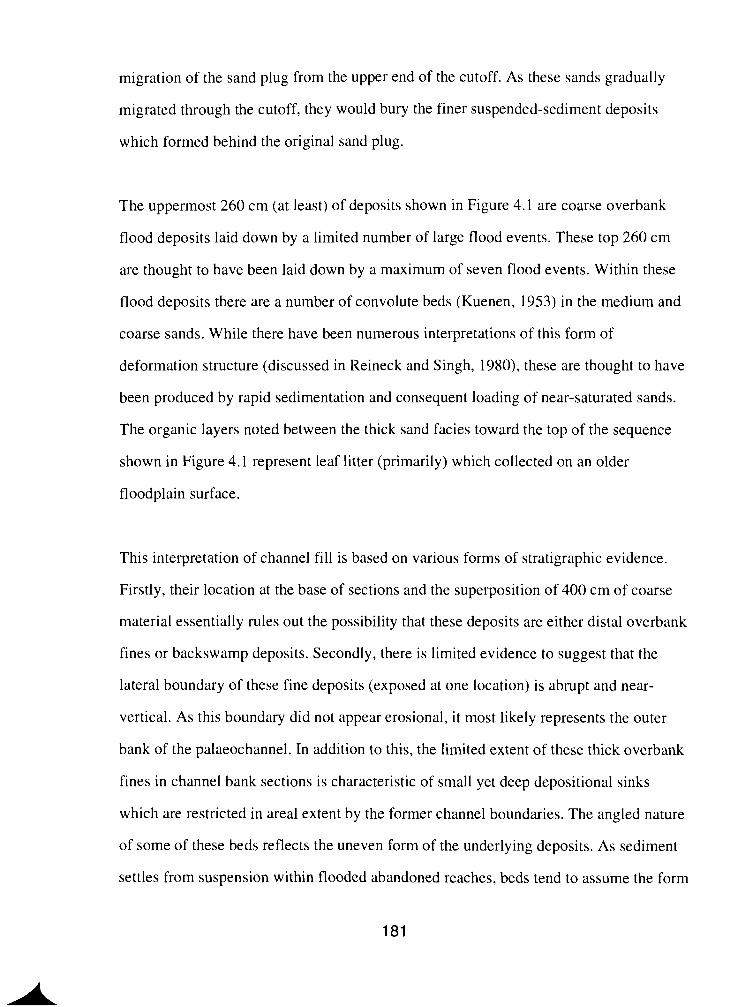
migration of the sand plug from the upper end of the cutoff. As these sands gradually
migrated through the cutoff, they would bury the finer suspended-sediment deposits
which formed behind the original sand plug.
The uppermost 260 cm (at least) of deposits shown in Figure 4.1 are coarse overbank
flood deposits laid down by a limited number of large flood events. These top 260 cm
are thought to have been laid down by a maximum of seven flood events. Within these
flood deposits there are a number of convolute beds (Kuenen, 1953) in the medium and
coarse sands. While there have been numerous interpretations of this form of
deformation structure (discussed in Reineck and Singh, 1980), these are thought to have
been produced by rapid sedimentation and consequent loading of near-saturated sands.
The organic layers noted between the thick sand facies toward the top of the sequence
shown in Figure 4.1 represent leaf litter (primarily) which collected on an older
floodplain surface.
This interpretation of channel fill is based on various forms of stratigraphic evidence.
Firstly, their location at the base of sections and the superposition of 400 cm of coarse
material essentially rules out the possibility that these deposits are either distal overbank
fines or backswamp deposits. Secondly, there is limited evidence to suggest that the
lateral boundary of these fine deposits (exposed at one location) is abrupt and near-
vertical. As this boundary did not appear erosional, it most likely represents the outer
bank of the palaeochannel. In addition to this, the limited extent of these thick overbank
fines in channel bank sections is characteristic of small yet deep depositional sinks
which are restricted in areal extent by the former channel boundaries. The angled nature
of some of these beds reflects the uneven form of the underlying deposits. As sediment
settles from suspension within flooded abandoned reaches, beds tend to assume the form
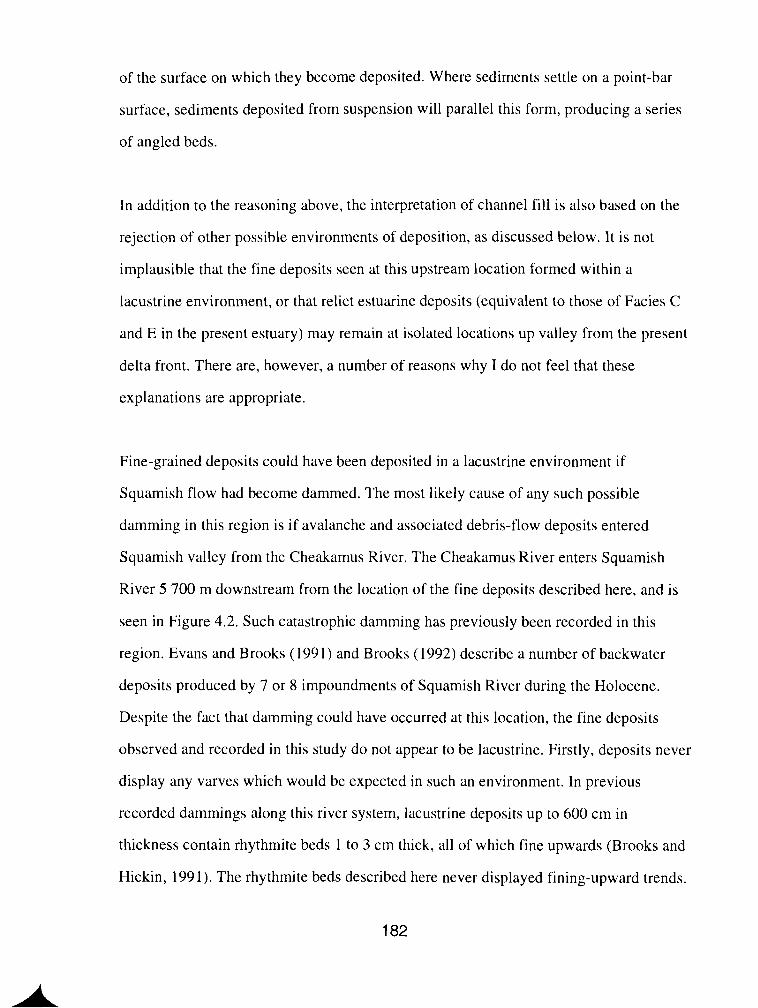
of the surface on which they become deposited. Where sediments settle on a point-bar
surface, sediments deposited from suspension will parallel this form, producing a series
of angled beds.
In addition to the reasoning above, the interpretation of channel fill is also based on the
rejection of other possible environments of deposition, as discussed below. It is not
implausible that the fine deposits seen at this upstream location formed within a
lacustrine environment, or that relict estuarine deposits (equivalent to those of Facies C
and E in the present estuary) may remain at isolated locations up valley from the present
delta front. There are, however, a number of reasons why I do not feel that these
explanations are appropriate.
Fine-grained deposits could have been deposited in a lacustrine environment if
Squamish flow had become dammed. The most likely cause of any such possible
damming in this region is if avalanche and associated debris-flow deposits entered
Squamish valley from the Cheakamus River. The Cheakamus River enters Squamish
River 5 700 m downstream from the location of the fine deposits described here, and is
seen in Figure 4.2. Such catastrophic damming has previously been recorded in this
region. Evans and Brooks (1991) and Brooks (1992) describe a number of backwater
deposits produced by 7 or 8 impoundments of Squamish River during the Holocene.
Despite the fact that damming could have occurred at this location, the fine deposits
observed and recorded in this study do not appear to be lacustrine. Firstly, deposits never
display any varves which would be expected in such an environment. In previous
recorded damming along this river system, lacustrine deposits up to 600 cm in
thickness contain rhythmite beds 1 to 3 cm thick, all of which fine upwards (Brooks and
Hickin, 1991). The rhythmite beds described here never displayed fining-upward trends.
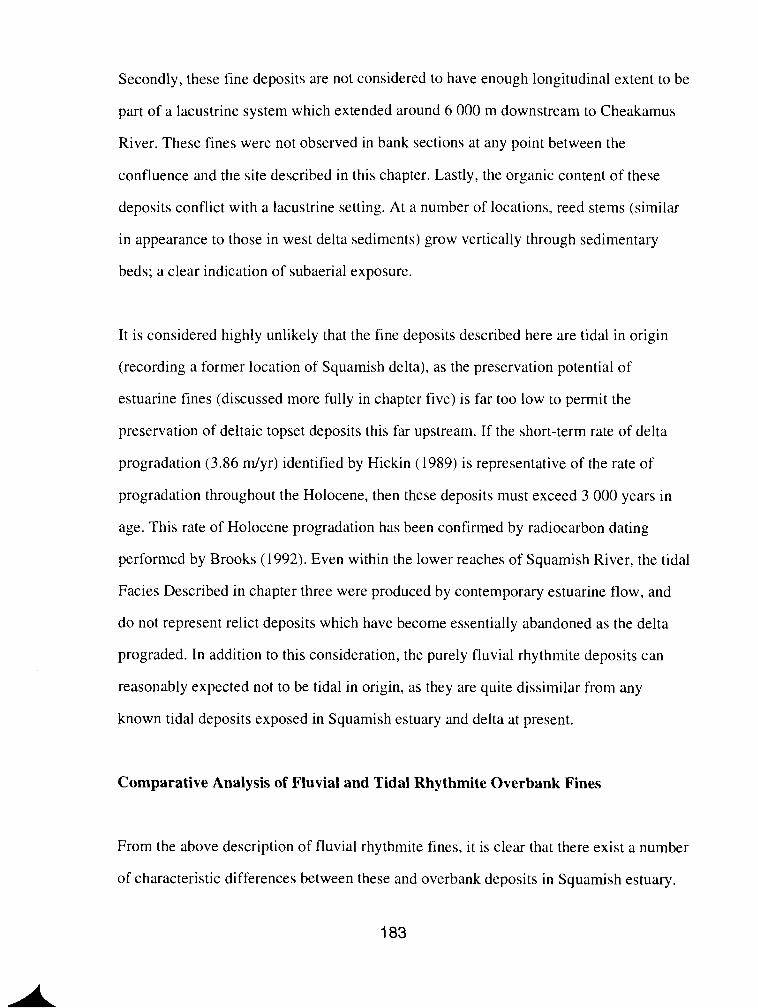
Secondly, these fine deposits are not considered to have enough longitudinal extent to be
part of a lacustrine system which extended around 6 000 m downstream to Cheakamus
River. These fines were not observed in bank sections at any point between the
confluence and the site described in this chapter. Lastly, the organic content of these
deposits conflict with a lacustrine setting. At a number of locations, reed stems (similar
in appearance to those in west delta sediments) grow vertically through sedimentary
beds; a clear indication of subaerial exposure.
It is considered highly unlikely that the fine deposits described here are tidal in origin
(recording a former location of Squarnish delta), as the preservation potential of
estuarine fines (discussed more fully in chapter five) is far too low to permit the
preservation of deltaic topset deposits this far upstream. If the short-term rate of delta
progradation (3.86 mlyr) identified by Hickin (1989) is representative of the rate of
progradation throughout the Holocene, then these deposits must exceed 3 000 years in
age. This rate of Holocene progradation has been confirmed by radiocarbon dating
performed by Brooks (1992). Even within the lower reaches of Squamish River, the tidal
Facies Described in chapter three were produced by contemporary estuarine flow, and
do not represent relict deposits which have become essentially abandoned as the delta
prograded. In addition to this consideration, the purely fluvial rhythrnite deposits can
reasonably expected not to be tidal in origin, as they are quite dissimilar from any
known tidal deposits exposed in Squamish estuary and delta at present.
Comparative Analysis of Fluvial and Tidal Rhythmite Overbank Fines
From the above description of fluvial rhythmite fines, i t is clear that there exist a number
of characteristic differences between these and overbank deposits in Squarnish estuary.
The following sections examine in greater detail the characteristic similarities and
differences between the deposits in these two environments. Discussion is divided into
sections which deal specifically with facies geometry, organic content, sediment-size
characteristics, and bedding.
Facies Geometry
Estuarine overbank Facies are characterised in part by their areal extent and geometry.
The deposits of tidal marsh Facies C are present across the entire subaerial delta
complex (over 2 000 m) and are detectable in river bank sections up to around 3 000 m
upstream from the river mouth. Such extensive deposits reflect the deposition of
material within a large shallowing open depositional system. In longitudinal section,
Facies C displays a lens-like geometry produced by the younger age of the seaward limit
of tidal marsh, and the decreasing amplitude of tidal flux with increasing distance up
estuary.
In contrast, fluvial overbank fine deposits are limited in longitudinal extent to three
isolated exposures, as shown in Figure 4.2. The lateral extent of these deposits cannot be
determined in this environment. These deposits seem to have formed in an environment
which was partially closed, as this Facies appears to terminate abruptly at a steep
contact. This contact marks the location of the outer bank of the palaeochannel.
Organic Content
Both fluvial and tidal rhythmite beds contain thin layers of organic material. In places,
the rhythmic alternation of parallel organic and inorganic layers within fluvial fines
closely resembles the tidal rhythmites in river bank sections. For example, compare the
fluvial rhythmite bedding in Figure 4.4 with the tidal rhythmites seen in Figure 4.12.
Despite this occasional visual similarity, however, the organic layers within these two
environments differ greatly in their composition. Within Squamish estuary these layers
almost exclusively comprise sedges (dominantly Carex lyngbyei, Ian Hutchinson,
personal communication) which become flattened into interwoven thin mats. With the
exception of organic layers formed during the colonisation phase of marsh development
(Redfield, 1972), marsh vegetation densities remain relatively constant. This results in
organic layers which are of very similar thickness throughout the facies. On one
occasion a deciduous leaf was found within deposits of Facies C, but small coffee-
ground organics, twigs and pine needles were never found.
Within fluvial overbank fine deposits, organic content is far more diverse; flattened
grass and reed stems, twigs, deciduous leaves, and pine needles were all present.
Organic layers are not of constant composition throughout the facies, as one or all of the
organics mentioned above may be found within any given organic layer. Also,
individual organic layers may not be of constant composition across section, as the layer
may be composed entirely of pine needles at one location, yet when traced laterally
across the face by only 200 or 300 cm, it may be composed of twigs and leaves.
In addition to this, upstream rhythmite beds differ in appearance because the organic
layers protrude from the face to a lesser extent than those within Squamish estuary. This
is partly related to the different organic content, which does not form such an interwoven
mat of material which resists erosion. It is also related to the fact that upstream deposits
are not continually submerged and exposed by tidal stage fluctuations.
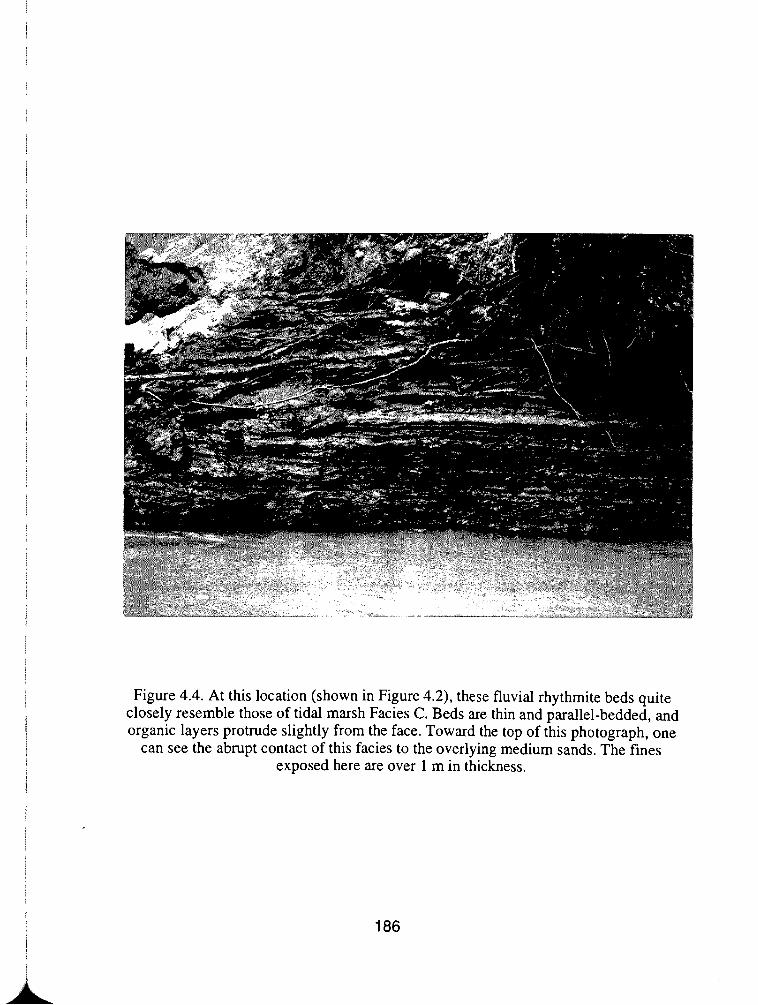
Figure 4.4. At this location (shown in Figure 4.21, these fluvial rhythrnite beds quite closely resemble those of tidal marsh Facies C. Beds are thm and parallel-bedded, and organic layers protrude slightly from the face. Toward the top of this photograph, one
can see the abrupt contact of this facies to the overlying medium sands. The fines exposed here are over 1 m in thickness.
The upstream variability of organic content accords with observations by Barwis (1978),
who notes that the organic caps of fluvial point bars contain a wider variety of plant
material than similar deposits overlying tidal point bars. Despite this observation,
however, Barwis (1978) did not discuss the specific organic forms within fluvial
overbank deposits.
The difference in organic content between these two environments is driven primarily by
the mode of organic accumulation. Within interdistributary bay environments the
organic material preserved in bedding sequences accumulated in-situ. Within abandoned
channel sections the organic material is primarily transported into the environment by
floodwaters, and delivered directly from the surrounding vegetated floodplain (Fielding,
1985). These different modes of accumulation leave organics which are termed
autochthonous and allochthonous respectively (McCabe, 1984). There are three main
reasons why allochthonous deposits are of such importance in the fluvial fine deposits
but not in estuarine seql;ences. One is the obvious point that the presence of leaves,
twigs and pine needles in the channel cutoff indicates their presence nearby. In addition
to this, it reflects the fact that the cutoff was a partially closed system which, unlike the
intertidal marsh, was not regularly flooded. Thirdly, the presence of leaves and needles
in sediments indicates high rates of sedimentation which rapidly bury the organics.
Within Squamish estuary, sedimentation is more gradual and far less rapid during a
depositional event. If drifted organics fail to be covered by sediment, they likely will
become transported out of the marsh system during the proceeding high tide period.
Despite these observations at this location, however, it should be noted that these forms
of organic debris may be found within estuarine sands and muds. For example, Syvitski
and Farrow (1983) found pine needles within intertidal mouth bar sands of Bute Inlet,
British Columbia. The presence of these forms of organics, however, likely will be
minimal in relation to the amount of autochthonous material present, and in relation to
the amounts present within fluvial channel fills.
Sediment-Size Characteristics
Detailed sediment-size analysis of overbank fine deposits was performed on samples
taken from two sites: one from the fluvial environment and one from Squamish west
delta. From these sets of samples, individual rhythmite beds were analysed by sieve and
SediGraph particle size analyser in the manner described in chapter two. These data
provide a percentage break-down of the sand-silt-clay fractions present within each
rhythmite. The percent sand, silt, and clay data are discussed below for both tidal and
fluvial rhythmites.
Tidal Marsh Rhythmites
Sediment samples of tidal marsh rhythrnite deposits were collected at site irs I , located
1 100 m upstream from the river mouth. In total, 146 samples were analysed, which
represent the whole thickness of Facies C at this site (188 cm). The beds at the top of
this Facies Could not be individually sampled because of their thinness, so the upper 98
cm of deposits were sampled at 1 and 2 cm intervals (as described in chapter two). The
results of initial sediment analyses, given in appendix A, show the percent sand-silt-clay
within each sample, sample thickness, and sample depth at site irsl. If the three
sediment components of individual samples are plotted against depth from the delta
surface, a number of interesting trends are revealed. Figures 4.5a, b, and c show the
sand, silt, and clay content of samples from site irsl against depth.
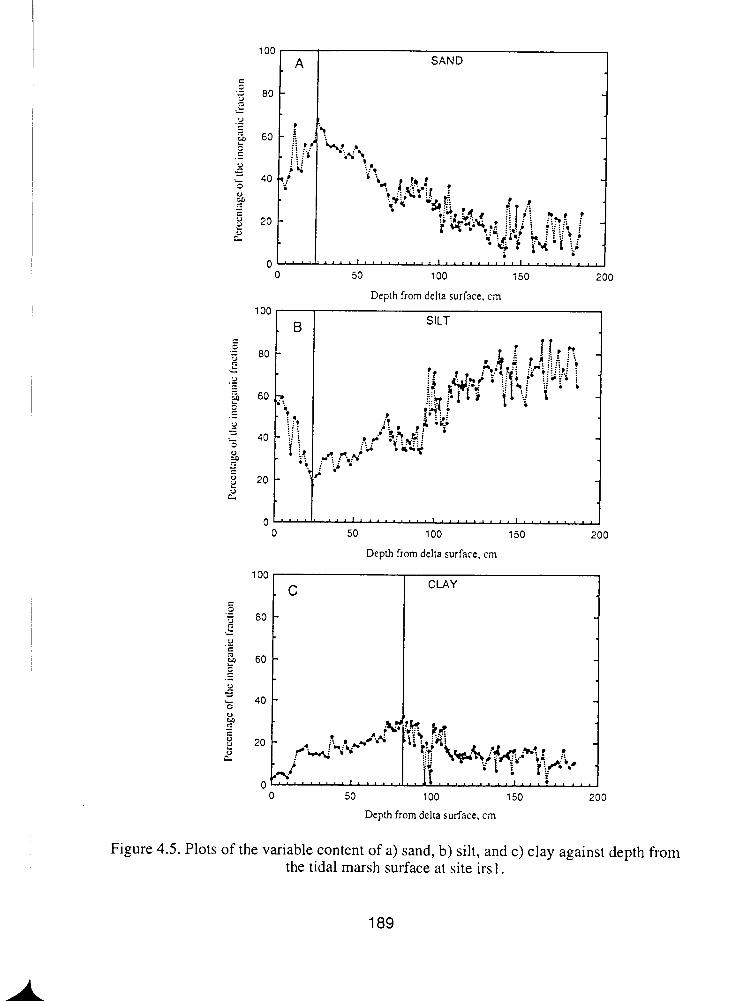
0 50 100 150 200
Depth from delta surface, cm
Depth from delta surface, cm
0 50 100 150 200
Depth from delta surface, cm
Figure 4.5. Plots of the variable content of a) sand, b) silt, and c) clay against depth from the tidal marsh surface at site irs 1.
189
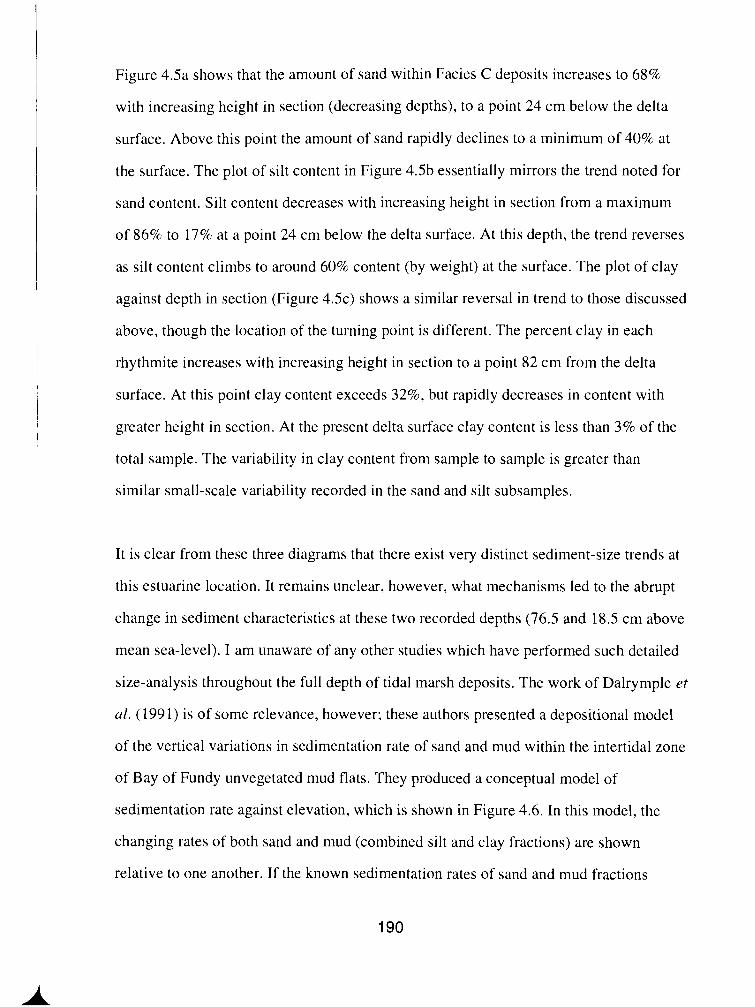
Figure 4.5a shows that the amount of sand within Facies C deposits increases to 68%
with increasing height in section (decreasing depths), to a point 24 cm below the delta
surface. Above this point the amount of sand rapidly declines to a minimum of 40% at
the surface. The plot of silt content in Figure 4.5b essentially mirrors the trend noted for
sand content. Silt content decreases with increasing height in section from a maximum
of 86% to 17% at a point 24 cm below the delta surface. At this depth, the trend reverses
as silt content climbs to around 60% content (by weight) at the surface. The plot of clay
against depth in section (Figure 4 . 5 ~ ) shows a similar reversal in trend to those discussed
above, though the location of the turning point is different. The percent clay in each
rhythmite increases with increasing height in section to a point 82 cm from the delta
surface. At this point clay content exceeds 32%, but rapidly decreases in content with
greater height in section. At the present delta surface clay content is less than 3% of the
total sample. The variability in clay content from sample to sample is greater than
similar small-scale variability recorded in the sand and silt subsamples.
It is clear from these three diagrams that there exist very distinct sediment-size trends at
this estuarine location. It remains unclear, however, what mechanisms led to the abrupt
change in sediment characteristics at these two recorded depths (76.5 and 18.5 cm above
mean sea-level). I am unaware of any other studies which have performed such detailed
size-analysis throughout the full depth of tidal marsh deposits. The work of Dalrymple et
al. (199 1) is of some relevance, however; these authors presented a depositional model
of the vertical variations in sedimentation rate of sand and mud within the intertidal zone
of Bay of Fundy unvegetated mud flats. They produced a conceptual model of
sedimentation rate against elevation, which is shown in Figure 4.6. In this model, the
changing rates of both sand and mud (combined silt and clay fractions) are shown
relative to one another. If the known sedimentation rates of sand and mud fractions
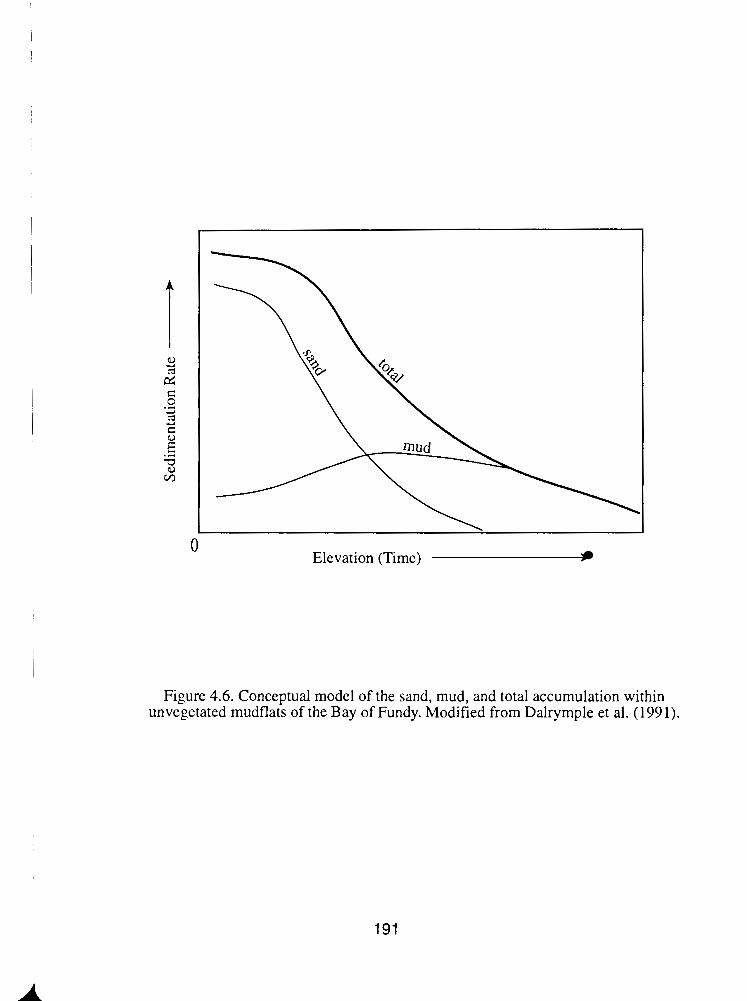
0 Elevation (Time)
Figure 4.6. Conceptual model of the sand, mud, and total accumulation within unvegetated mudflats of the Bay of Fundy. Modified from Dalrymple et al. (1991).
calculated from this study are plotted against known elevation, the pattern revealed (in
Figure 4.7) appears quite different from that in Figure 4.6. If one ignores (for now) the
reversing trend recorded at a depth of 24 cm, then data from this study oppose that of the
conceptual model of Dalrymple et al. (1991). The disagreement may indicate that the
underlying assumptions of the conceptual model are limited, and not necessarily
applicable within other tidal systems, particularly those which are fluvially dominated.
For example, Dalrymple and co-workers state that the concentration of sand decreases
upward through the flow so that higher surfaces receive less sand than lower surfaces.
The research of Rood and Hickin (1989) and Babakaiff (1993) has shown that this
assumption is not valid within Squamish estuarine environment, where macroturbulent
eddies are able to transport coarse channel bed sands to the upper surface of flow. In
addition to this, it is unclear whether one conceptual model of sedimentation can be
applied within vegetated and unvegetated environments.
Despite the dissimilarity of these two diagrams, I would agree with the observation of
Dalrymple et al. (1991) that "the contrasting behaviour of the sand and mud fractions is
a direct consequence of their different settling rates" (p. 155). As sand rapidly settles
from suspension, the deposition of this material is controlled by its availability within
the marsh system, which is in turn dependent on flow velocities. As the settling rates of
mud are so much lower, however, their deposition is not primarily controlled by its
availability (as one can assume that silt and clay are always present within estuarine
waters), but by the length of time that these materials are allowed to settle through the
water column.
The sediment-size trends recorded in this study reflect the changing relative influence of
tides over time. These relative changes are presumably driven by the increasing height
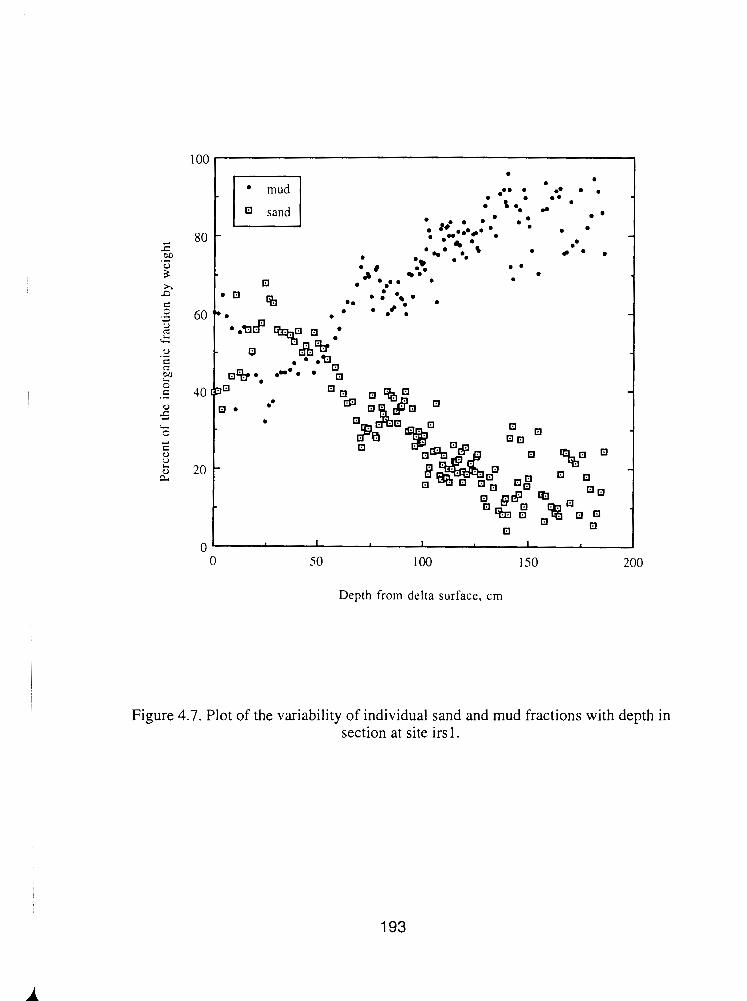
Depth from delta surface, cm
Figure 4.7. Plot of the variability of individual sand and mud fractions with depth in section at site irs 1.
of the marsh surface, and the decreasing depth and duration of tidal inundation. During
the colonisation or pioneer stage of marsh development, when vegetation is first
becoming established on intertidal sandflats, newly deposited sediment is dominantly
silt with an admixture of sand and clay. Silt dominates these early marsh deposits for a
number of reasons. Firstly, the marsh vegetation induces the sedimentation of fines by
decreasing flow velocities near the bed (marsh surface) and by directly sequestering fine
sediment from the flow. Secondly, fines become deposited on the surface through the
processes of flocculation and pelletisation which produce groups of small particles with
a greater weight and higher settling velocity. Thirdly, and perhaps most importantly, the
sedimentation of silts is directly related to the depth and duration of tidal inundation. As
tidal amplitude decreases, the sediment-laden water column overlying intertidal surfaces
becomes shallower, and surfaces become inundated for a lesser period of time. The
deposition of fines will be more highly influenced by tidal amplitude and duration than
will the deposition of sands. This is because sands will become deposited relatively
quickly from the decreasing velocity flows which enter the marsh system. Because of
this, the deposition of sand is not highly dependent on duration of inundation. Once all
sand-sized material falls from suspension, increased sedimentation of sand cannot
continue, regardless of whether the delta remains inundated or not.
This argument is of course a little simplistic, as sands may be transported continually
into the marsh environment throughout the period of inundation. If we assume, however,
that flood velocities are too low to transport sands over the majority of the rising tide (all
but the early stage), then increasing tidal depths and durations can only influence the
sedimentation of fines. As the duration of inundation increases, the effective
sedimentation depth of the water column becomes greater. The effective sedimentation
depth is defined here as that portion of the water column which is able to contribute to
deposition. Clearly, for a given water depth the effective sedimentation depth decreases
with decreasing sediment size. Thus, when the elevation of the marsh surface is low,
fines will be preferentially deposited in relation to sands. As the marsh surface is raised,
however, the deposition of fines will decrease while the deposition of sands will remain
fairly constant. This will result in a decreasing amount of fines present in beds, and a
relative increase in the amount of sand. Under this proposed scheme, the increasing
percentage of sand with increasing delta height does not necessarily reflect an absolute
increase in the amount of sand but a relative increase induced by decreasing amounts of
fines. While this proposed explanation for the increasing sand content upsection is
favoured, it is likely also that there is a real (not simply relative) increase in sand content
upsection produced by the greater flood discharges required to inundate the rising delta
surface.
The change in trends which occurs at a depth of 24 cm may also be driven by the
relative proportions of sand and fines. It is suggested that the decrease in the amount of
sand at this elevation is physically real, and caused by decreasing floodwater depths and
velocities. Eventually, the delta will build to a height above which floodwater depths
and velocities are too low to allow the transport of large amounts of sand onto and over
the delta. This decrease in the amount of sand will lead to a relative increase in the
amount of silt recorded in sediment samples. This is thought to account for the increase
in the importance of silt within samples above 24 cm depth. This increased silt content is
not considered to have been caused by dyke construction and the associated increased
water depths.
Figure 4 . 5 ~ shows that the pattern of clay content within each sample does not agree
with the pattern shown by mud content (Figure 4.7). This highlights the fact that the
hydrodynamic factors that govern the deposition of clay are not the same as those which
govern the deposition of silt. Comparison of these combined fractions (termed 'mud')
requires far less laboratory analyses, but will result in decreased precision of data, and
may lead to loss of accuracy of interpretations based on these data. When clay content is
examined in isolation, there appears to be a specific height at which clay is preferentially
deposited. This height lies between 70 and 110 cm below the delta surface (30.5 and -9.5
cm a.m.s.l.), although there is a considerable degree of variability within this region.
Both above and below this region the amount of clay in samples decreases. The decrease
with depth (lower elevations) probably reflects the higher flow velocities within these
deep waters over the delta surface. These velocities are high enough to prevent the
deposition of considerable amounts of clay. As water depths decrease (as the delta is
raised), flow velocities decrease, permitting the deposition of greater amounts of clay.
This increase in clay content may also be related to increased vegetation establishment
and density. Above a certain height, however, clay content begins to decrease. This
decrease is presumably driven by decreasing durations of flood inundation, and related
to the settling lag effect (Van Straaten and Kuenen, 1957, 1958). The settling lag is that
time between the moment at which flow is no longer able to suspend particles of a given
size, and the time these particles become deposited. If the duration of floodwater
inundation is less that this settling lag time, clay will not be deposited as individual
grains1. As clay has a far slower settling rate than silt, the critical sedimentation duration
(the period of time before which no deposition can occur during the tidal cycle) is
reached more rapidly than that of silt. The critical sedimentation duration of clay will
occur at lower marsh elevations than that of silt or sand. This process explains why the
l ~ e s ~ i t e this, some clays will become deposited in the form of flocs and faecal pellets, or may
adhere to grass stems.
maximum clay content peaks lower in section than that of silt, and why the maximum
sand content peak is highest in section.
Figures 4Sa , b, c, and 4.7 all record greater scatter of data at greater depths in section.
The decrease in scatter toward the delta surface is not a physically real decrease in
variability of these data, but is produced by the sampling technique. Toward the top of
the section, samples incorporate a number of beds (perhaps 10 or more). This causes an
averaging of data, thus decreasing bed-scale variability of sediment characteristics,
creating a smoother line.
Fluvial Rhythmites
Sediment samples of fluvial overbank rhythmite deposits were collected at site 01 1, near
the location of Figure 4.1, which is shown in Figure 4.2. In total, 42 samples have been
analysed, which does not include all the rhythmite beds observed at this site, but does
represent the majority of this facies thickness between 463 cm and 622 cm depth. Where
deposits displayed no rhythmicity, sediments within these zones were sampled every 1
cm, but these samples have not been chosen for detailed sediment-size analysis here.
The sand, silt, and clay content of these 42 rhythmite beds have been analysed, and these
data are presented in tabular form in appendix B. These data have been plotted against
depth from the floodplain surface in Figures 4.8a, b, and c. These plots differ markedly
from those of Squamish tidal marsh rhythmites which show clear, distinct trends with
depth. Figures 4.8a, b, and c show that both sand and silt content show great variability
with depth, but show no systematic changes such as those recorded within estuarine
deposits. The sand data (Figure 4.8a) do suggest a general trend of an increasing sand
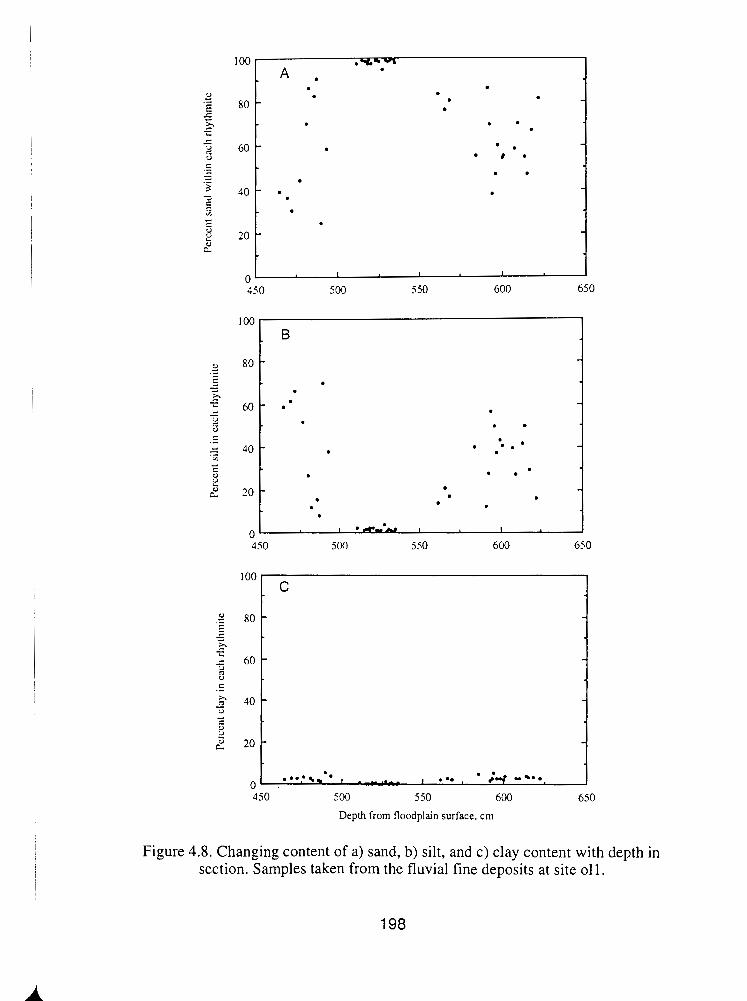
450 500 550 600 650
Depth from floodplain surface, cm
Figure 4.8. Changing content of a) sand, b) silt, and c) clay content with depth in section. Samples taken from the fluvial fine deposits at site 01 1.
198
content upsection to a depth of around 5 10 cm and decreasing sand content above this
point. This general trend appears mirrored in the plot of silt content with depth (Figure
4.8b). These trends may not necessarily be real, but may in fact be apparent trends
produced by the absence of data at three locations in section. These missing data
represent those places where rhythmite bedding was not present in the fine-grained
channel-fill deposits. Despite this, it is clear that there is a region toward the centre of
these deposits where sand content is far greater than at any other depth in section at this
site. These higher values are recorded over 18 different rhythmite beds, where sand
content averages 98%. Differences in sand content are produced by differing magnitudes
of riverine flood events, though it is unclear why so many high values are recorded at
this particular depth.
Perhaps the most interesting result of these analyses is the difference in total sand and
clay content. The sand content of fluvial overbank deposits is both higher (maximum
99%) and more variablc (range of 75%) than the deposits analysed in Squamish estuary,
where maximum sand content is 68% and the range of values is 64%. In contrast, the
clay content of fluvial fines are far lower (average 2%) than the clay content (average
16%) within tidal fines.
The difference in clay content between tidal and fluvial deposits is considered to reflect
the differences in the characteristics of flow within these two environments, primarily
differences in discharge-stage relationships. The low clay content of fluvial overbank
fines is most unlikely to reflect a lack of clay-sized sediment within Squamish flow at
this location. Given this fact, the lack of clays at this site indicates that this material
failed to be deposited or has since been eroded or winnowed-out . Given the semi-closed
nature of this depositional environment, one would expect to find a far greater
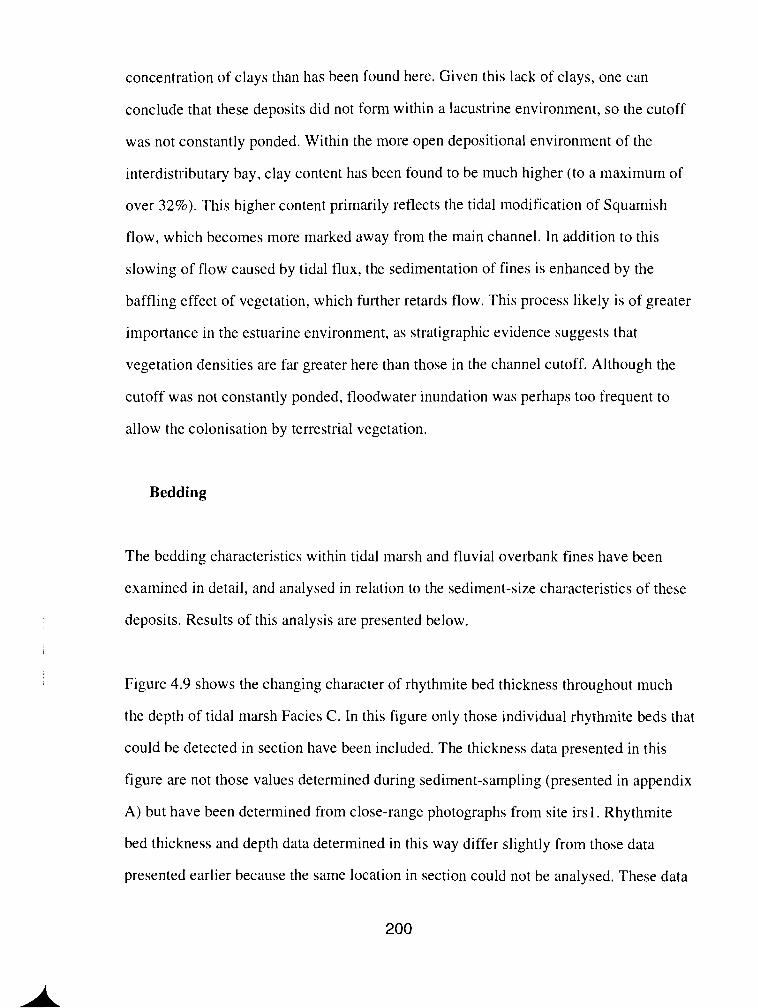
concentration of clays than has been found here. Given this lack of clays, one can
conclude that these deposits did not form within a lacustrine environment, so the cutoff
was not constantly ponded. Within the more open depositional environment of the
interdistributary bay, clay content has been found to be much higher (to a maximum of
over 32%). This higher content primarily reflects the tidal modification of Squamish
flow, which becomes more marked away from the main channel. In addition to this
slowing of flow caused by tidal flux, the sedimentation of fines is enhanced by the
baffling effect of vegetation, which further retards flow. This process likely is of greater
importance in the estuarine environment, as stratigraphic evidence suggests that
vegetation densities are far greater here than those in the channel cutoff. Although the
cutoff was not constantly ponded, floodwater inundation was perhaps too frequent to
allow the colonisation by terrestrial vegetation.
Bedding
The bedding characteristics within tidal marsh and fluvial overbank fines have been
examined in detail, and analysed in relation to the sediment-size characteristics of these
deposits. Results of this analysis are presented below.
Figure 4.9 shows the changing character of rhythmite bed thickness throughout much
the depth of tidal marsh Facies C. In this figure only those individual rhythmite beds that
could be detected in section have been included. The thickness data presented in this
figure are not those values determined during sediment-sampling (presented in appendix
A) but have been determined from close-range photographs from site irs 1. Rhythmite
bed thickness and depth data determined in this way differ slightly from those data
presented earlier because the same location in section could not be analysed. These data
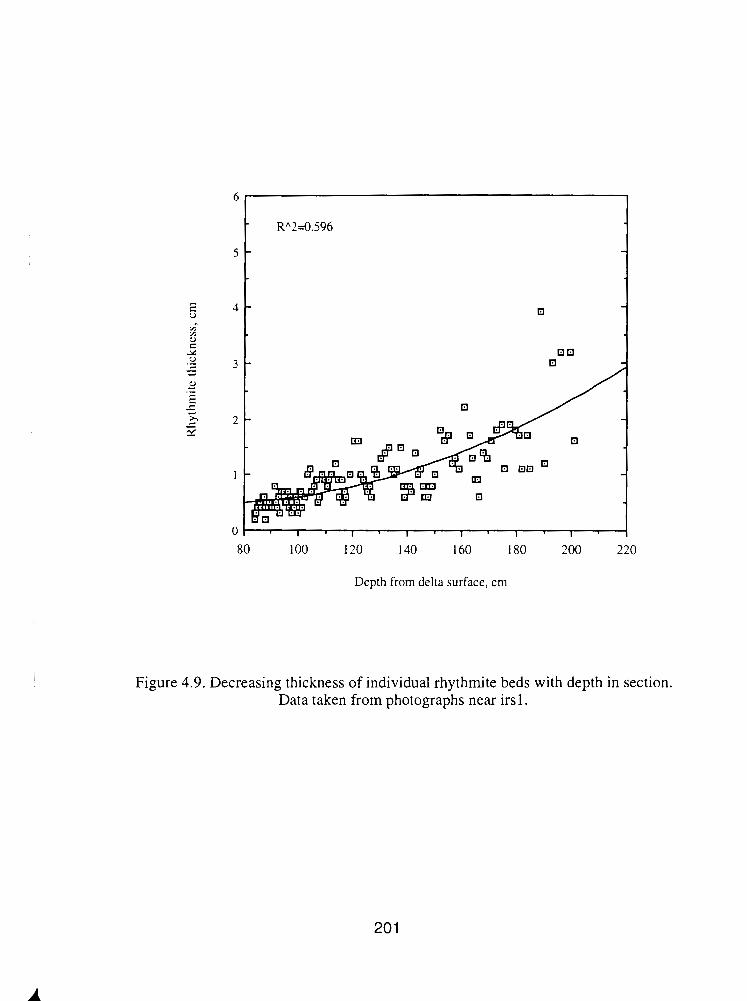
Depth from delta surface, cm
Figure 4.9. Decreasing thickness of individual rhythrnite beds with depth in section. Data taken from photographs near irs 1.
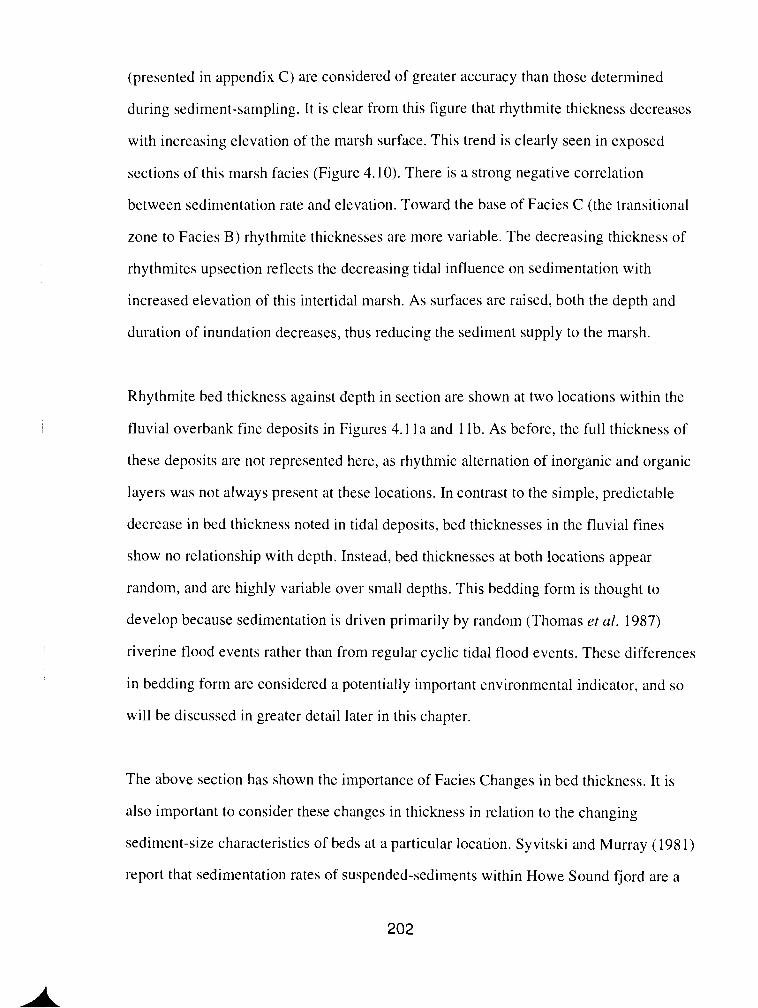
(presented in appendix C) are considered of greater accuracy than those determined
during sediment-sampling. It is clear from this figure that rhythmite thickness decreases
with increasing elevation of the marsh surface. This trend is clearly seen in exposed
sections of this marsh facies (Figure 4.10). There is a strong negative correlation
between sedimentation rate and elevation. Toward the base of Facies C (the transitional
zone to Facies B) rhythmite thicknesses are more variable. The decreasing thickness of
rhythmites upsection reflects the decreasing tidal influence on sedimentation with
increased elevation of this intertidal marsh. As surfaces are raised, both the depth and
duration of inundation decreases, thus reducing the sediment supply to the marsh.
Rhythmite bed thickness against depth in section are shown at two locations within the
fluvial overbank fine deposits in Figures 4.1 l a and 1 lb. As before, the full thickness of
these deposits are not represented here, as rhythmic alternation of inorganic and organic
layers was not always present at these locations. In contrast to the simple, predictable
decrease in bed thickness noted in tidal deposits, bed thicknesses in the fluvial fines
show no relationship with depth. Instead, bed thicknesses at both locations appear
random, and are highly variable over small depths. This bedding form is thought to
develop because sedimentation is driven primarily by random (Thomas et al. 1987)
riverine flood events rather than from regular cyclic tidal flood events. These differences
in bedding form are considered a potentially important environmental indicator, and so
will be discussed in greater detail later in this chapter.
The above section has shown the importance of Facies Changes in bed thickness. It is
also important to consider these changes in thickness in relation to the changing
sediment-size characteristics of beds at a particular location. Syvitski and Murray (198 1 )
report that sedimentation rates of suspended-sediments within Howe Sound fjord are a
Figure 4.10. Tidal marsh rhythrnite beds exposed in bank sections along the west delta between sites wd13 and wd14. With increasing elevation in section, bed thicknesses decrease to the point where individual beds are no longer visible. This is not the same
location as that sampled for sediment analysis. Shovel is 1 m in height.
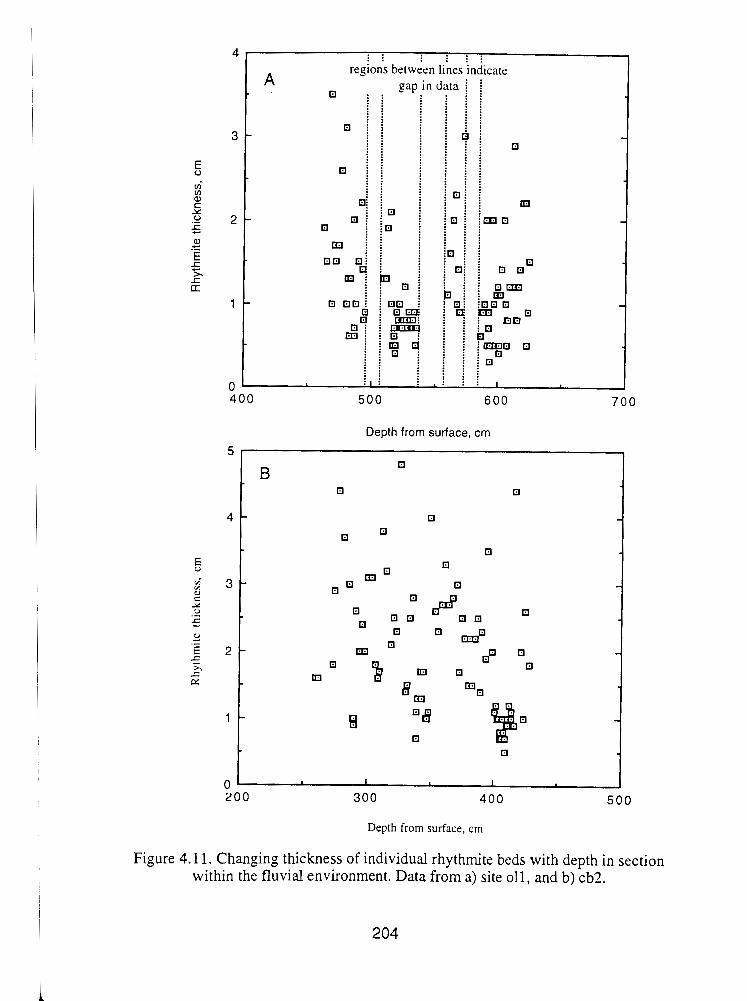
Depth from surface, cm
Depth from surface, cm
Figure 4.11. Changing thickness of individual rhythrnite beds with depth in section within the fluvial environment. Data from a) site 011, and b) cb?.
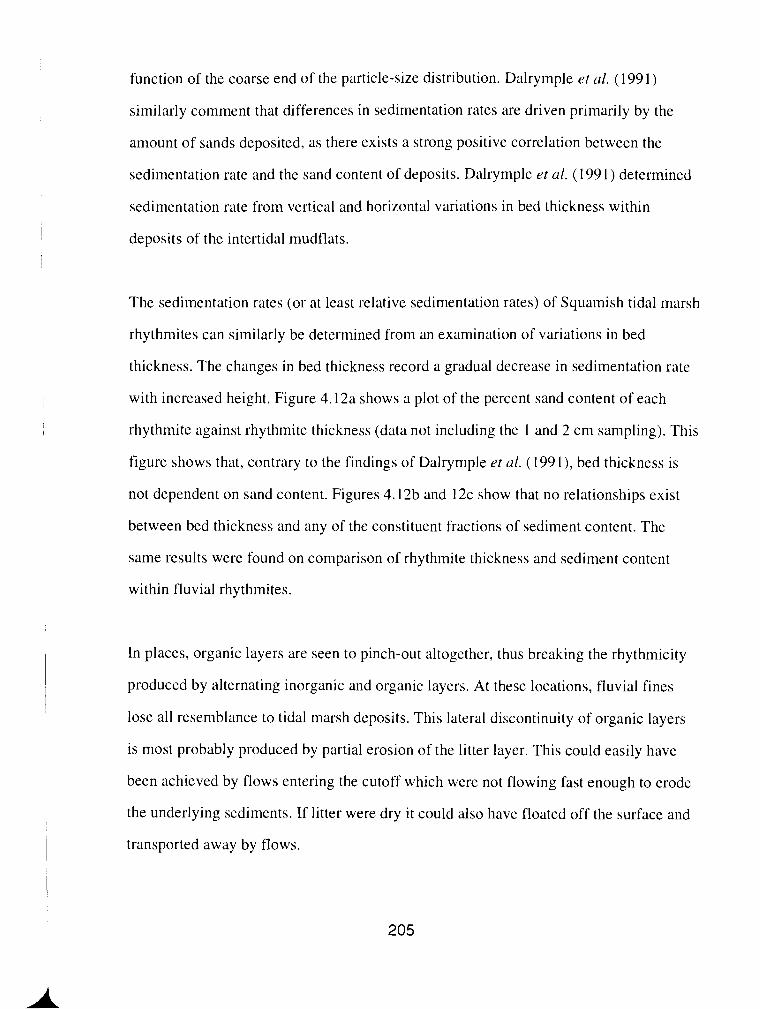
function of the coarse end of the particle-size distribution. Dalrymple et a/. (1991)
similarly comment that differences in sedimentation rates are driven primarily by the
amount of sands deposited, as there exists a strong positive correlation between the
sedimentation rate and the sand content of deposits. Dalrymple et al. (1991) determined
sedimentation rate from vertical and horizontal variations in bed thickness within
deposits of the intertidal mudflats.
The sedimentation rates (or at least relative sedimentation rates) of Squamish tidal marsh
rhythmites can similarly be determined from an examination of variations in bed
thickness. The changes in bed thickness record a gradual decrease in sedimentation rate
with increased height. Figure 4.12a shows a plot of the percent sand content of each
rhythmite against rhythmite thickness (data not including the 1 and 2 cm sampling). This
figure shows that, contrary to the findings of Dalrymple et ul. (1991), bed thickness is
not dependent on sand content. Figures 4.12b and 12c show that no relationships exist
between bed thickness and any of the constituent fractions of sediment content. The
same results were found on comparison of rhythmite thickness and sediment content
within fluvial rhythmites.
In places, organic layers are seen to pinch-out altogether, thus breaking the rhythmicity
produced by alternating inorganic and organic layers. At these locations, fluvial fines
lose all resemblance to tidal marsh deposits. This lateral discontinuity of organic layers
is most probably produced by partial erosion of the litter layer. This could easily have
been achieved by flows entering the cutoff which were not flowing fast enough to erode
the underlying sediments. If litter were dry it could also have floated off the surface and
transported away by flows.
90
80
70
60
r 50 . - V1
40
30
20
10
0
. . . . 0 0
- og B 0 -
0 s 1 '%ao 1 - Ooiol 4 g 8 0 g a. tY - q
- 0 Do 1 uon - a -
0 0 8 - - 0 - - - - - - -
I I I
-
0 1 2 3 4 90
80
70
60
50 n - U
#- 40
30
20
10
0 0
I 1 2 3 4
Rhythmite thickness, cm
Figure 4.12. Relationships between the varying thicknesses of tidal rhythmite beds and their a) sand, b) silt, and c) clay content at site irs 1.
. - c - - - - - - - - - - a
0 0 -
- - - a -
I3 0 I I
- -
Discussion of the Genesis of Fluvial Rhythmite Beds
In conclusion, the fine grained deposits seen at the base of certain sections in the fluvial
reach of Squamish River likely formed within an abandoned channel section, most
probably an oxbow cutoff. Sedimentation occurs within this environment when
floodwaters enter the channel section, carrying fine sediment in suspension. The
deposition of fines from suspension occurs as the channel reach is temporarily ponded.
As sedimentation is driven by input from the adjacent main river flow, these random
flood events control bed thickness and grain-size. As such, adjacent beds display
considerable variability in thickness and sediment-size characteristics, and appear to lack
any order (such as thinning bed thickness upsection).
During periods of low river flow, much of the abandoned channel bed will be above
water level. Sedimentation during these between-flood periods will be minimal, and,
given a long enough period of non-deposition, a litter layer of leaves, needles and twigs
will build-up on exposed surfaces. This litter layer may be removed during the
proceeding flood period, but is more likely to be incorporated into the deposit as rapid
sedimentation buries the organics. Given this proposed origin of organic beds, one
rhythmite bed may not necessarily represent deposition over one year, as is the case for
tidal rhythmite beds. Instead, a number of beds may be laid down in any given year. The
absence of organic layers could indicate that litter layers either failed to form, or were
eroded so that the inorganic layer represents a number of depositional events. Such an
occurrence could also have been produced by rapid sedimentation from one large flood
event. One can see from this discussion that fine-grained rhythmite deposits may form
within purely fluvial environments, but that they may not necessarily do so.
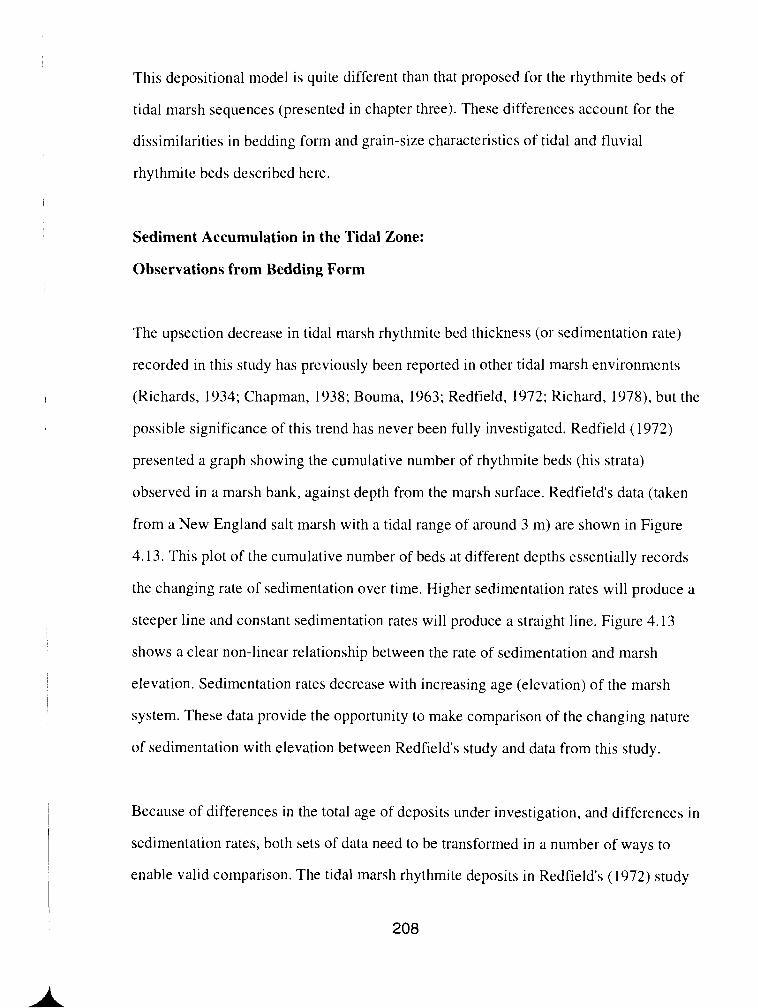
This depositional model is quite different than that proposed for the rhythmite beds of
tidal marsh sequences (presented in chapter three). These differences account for the
dissimilarities in bedding form and grain-size characteristics of tidal and fluvial
rhythmite beds described here.
Sediment Accumulation in the Tidal Zone:
Observations from Bedding Form
The upsection decrease in tidal marsh rhythmite bed thickness (or sedimentation rate)
recorded in this study has previously been reported in other tidal marsh environments
(Richards, 1934; Chapman, 1938; Bouma, 1963; Redfield, 1972; Richard, 1978), but the
possible significance of this trend has never been fully investigated. Redfield (1972)
presented a graph showing the cumulative number of rhythmite beds (his strata)
observed in a marsh bank, against depth from the marsh surface. Redfield's data (taken
from a New England salt marsh with a tidal range of around 3 m) are shown in Figure
4.13. This plot of the cumulative number of beds at different depths essentially records
the changing rate of sedimentation over time. Higher sedimentation rates will produce a
steeper line and constant sedimentation rates will produce a straight line. Figure 4.13
shows a clear non-linear relationship between the rate of sedimentation and marsh
elevation. Sedimentation rates decrease with increasing age (elevation) of the marsh
system. These data provide the opportunity to make comparison of the changing nature
of sedimentation with elevation between Redfield's study and data from this study.
Because of differences in the total age of deposits under investigation, and differences in
sedimentation rates, both sets of data need to be transformed in a number of ways to
enable valid comparison. The tidal marsh rhythmite deposits in Redfield's (1972) study
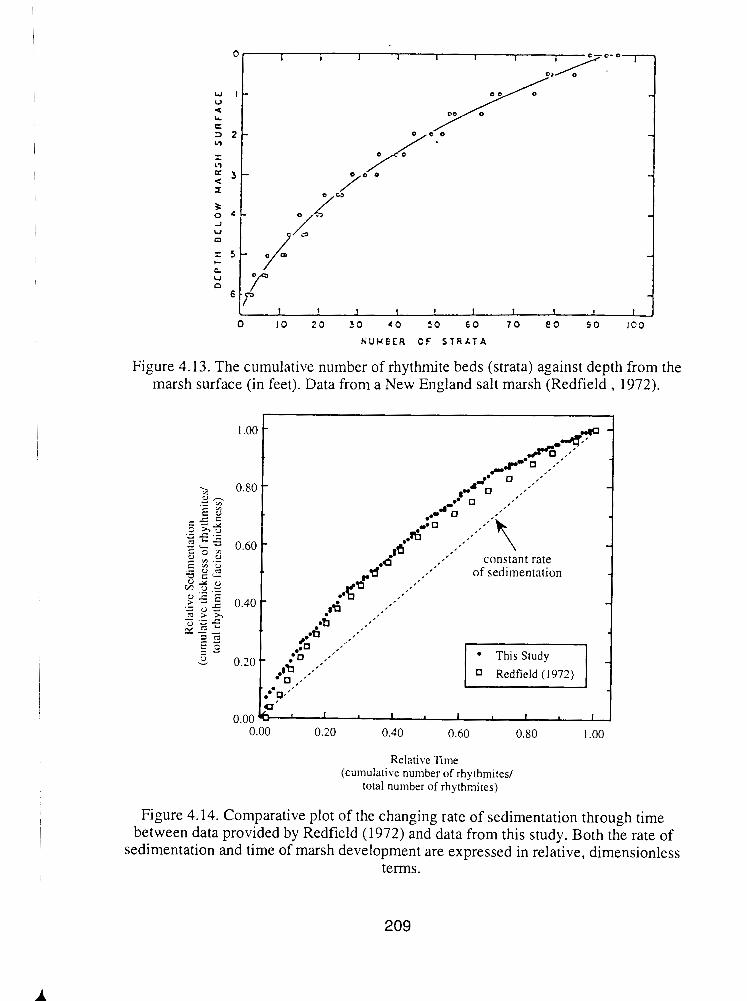
Figure 4.13. The cumulative number of rhythrnite beds (strata) against depth from the marsh surface (in feet). Data from a New England salt marsh (Redfield , 1972).
0.
w U
L C: 3 2 - V) - - b?
3 - < x t 0 4 - -I
u 0
= 5 - t-
2 0
Relative l i m e (cumulative number of rhythmitesl
total number of rhythmites)
Figure 4.14. Comparative plot of the changing rate of sedimentation through time between data provided by Redfield (1972) and data from this study. Both the rate of
sedimentation and time of marsh development are expressed in relative, dimensionless terms.
10 20 20 4 0 5 0 6 0 7 0 € 0 S O I C O
H U H E E R O F S T R A T A
I i 1 I I I 1
I -
2=•‹'" ' -
- i/l ,/"
- 7' " - FV
/ -
r .r 1 I 1 1 I I I I
- I I -
*
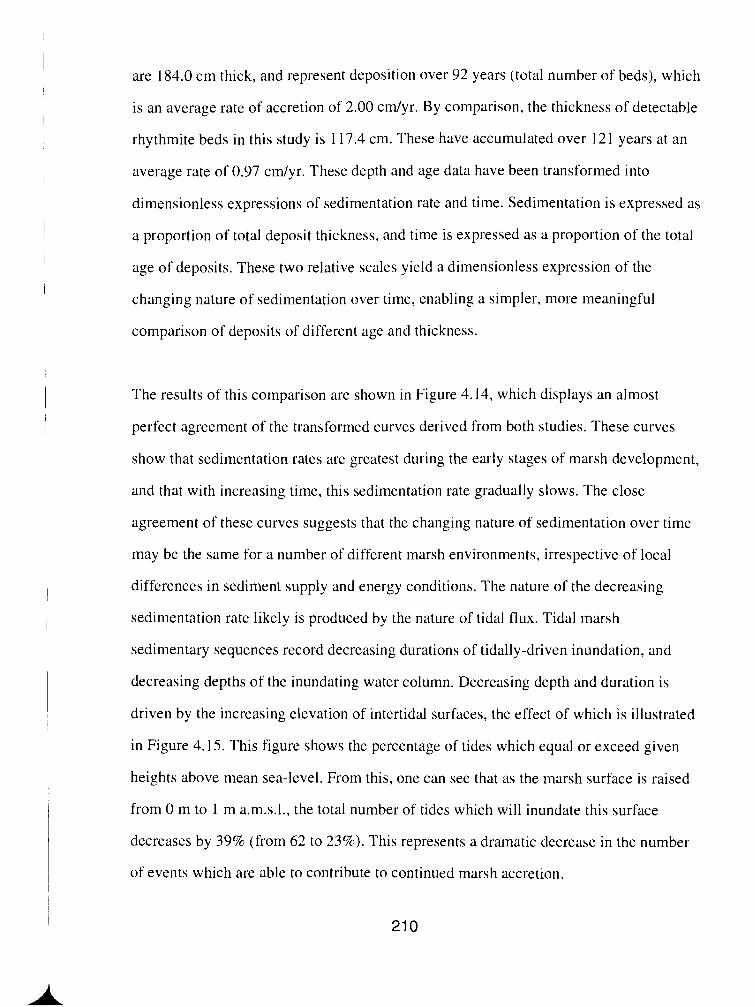
are 184.0 cm thick, and represent deposition over 92 years (total number of beds), which
is an average rate of accretion of 2.00 c d y r . By comparison, the thickness of detectable
rhythmite beds in this study is 117.4 cm. These have accumulated over 121 years at an
average rate of 0.97 c d y r . These depth and age data have been transformed into
dimensionless expressions of sedimentation rate and time. Sedimentation is expressed as
a proportion of total deposit thickness, and time is expressed as a proportion of the total
age of deposits. These two relative scales yield a dimensionless expression of the
changing nature of sedimentation over time, enabling a simpler, more meaningful
comparison of deposits of different age and thickness.
The results of this cornparison are shown in Figure 4.14, which displays an almost
perfect agreement of the transformed curves derived from both studies. These curves
show that sedimentation rates are greatest during the early stages of marsh development,
and that with increasing time, this sedimentation rate gradually slows. The close
agreement of these curves suggests that the changing nature of sedimentation over time
may be the same for a number of different marsh environments, irrespective of local
differences in sediment supply and energy conditions. The nature of the decreasing
sedimentation rate likely is produced by the nature of tidal flux. Tidal marsh
sedimentary sequences record decreasing durations of tidally-driven inundation, and
decreasing depths of the inundating water column. Decreasing depth and duration is
driven by the increasing elevation of intertidal surfaces, the effect of which is illustrated
in Figure 4.15. This figure shows the percentage of tides which equal or exceed given
heights above mean sea-level. From this, one can see that as the marsh surface is raised
from 0 m to 1 m a.m.s.l., the total number of tides which will inundate this surface
decreases by 39% (from 62 to 23%). This represents a dramatic decrease in the number
of events which are able to contribute to continued marsh accretion.
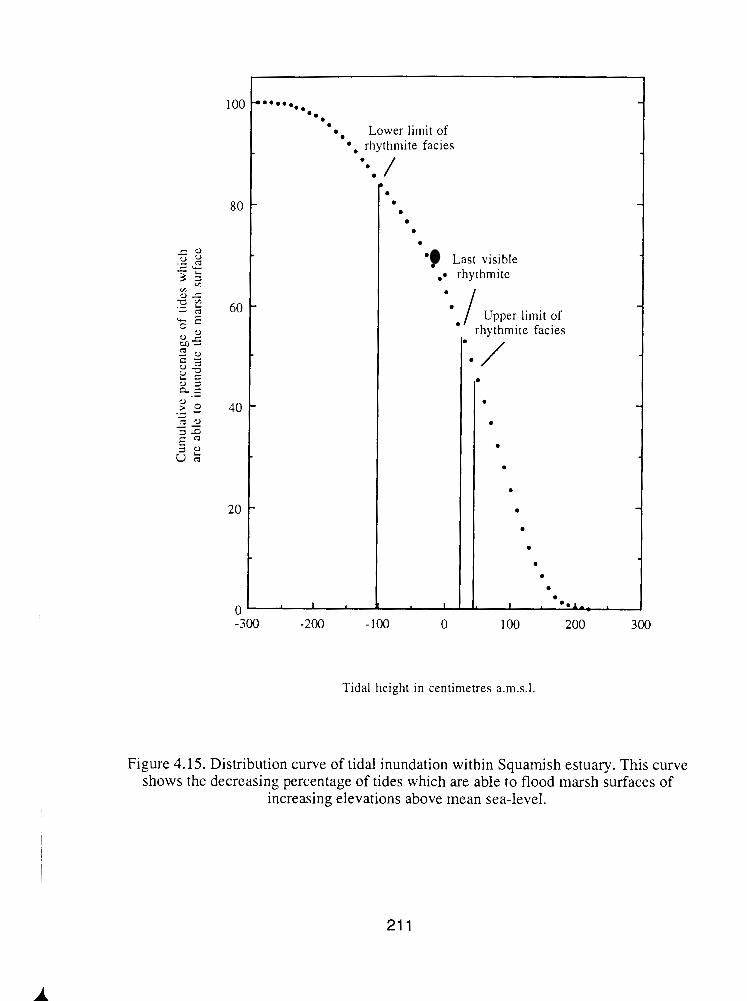
Last visible rhythmite
Tidal height in centimetres a.m.s.1.
Figure 4.15. Distribution curve of tidal inundation within Squamish estuary. This curve shows the decreasing percentage of tides which are able to flood marsh surfaces of
increasing elevations above mean sea-level.
This assertion may be tested by comparing sedimentation rates to marsh surface
inundation rates at different elevations . This comparison is shown in Figure 4.16, which
shows the relationship between the relative rate of sedimentation of Squamish tidal
marsh, and the percentage of tides which inundate the marsh surface. These percentages
have been calculated from combined hourly tide data at Point Atkinson for the years
199 1 - 1993 (data provided by Rick Thomson of the Institute of Ocean Sciences). These
data were also used to plot the tidal height distribution of Figure 4.15. The cumulative
percentages of inundating tides were calculated for the known heights (in cm above
mean sea-level) of rhythmite beds. Figure 4.16 shows that there exists a very strong
correlation between the number of tides which inundate the marsh surface, and the rate
of marsh accretion. Harrison and Bloom (1977) presented similar evidence of this
relationship. These authors observed that average rates of accretion at five sites
correlated well (r=0.90, p=0.05) with the mean tidal range at each site.
The correlation shown above, however, is not linear, as relative sedimentation rates
decrease slightly toward the top of the tidal marsh deposits (as is shown by the lack of fit
to the straight line). There are thought to be at least two explanations for the non-
linearity displayed here. Firstly, sedimentation rate is not simply a function of the
number of tidal events which flood the marsh, as suspended-sediment concentrations are
not always constant with depth. Below a certain depth, flow velocities decrease to the
point that sand is no longer transported onto and across the delta. The specific depth will
presumably be dependent on the relative roughness of the marsh surface (vegetation
density and height) and the turbidity of flows adjacent to the marsh. This is only likely
to become important toward the upper limit of the tidal marsh deposits. In addition to
this, as water depths decrease, inundation occurs closer to high tide. This results in
decreasing durations of inundation (as well as depths) with increasing height of the
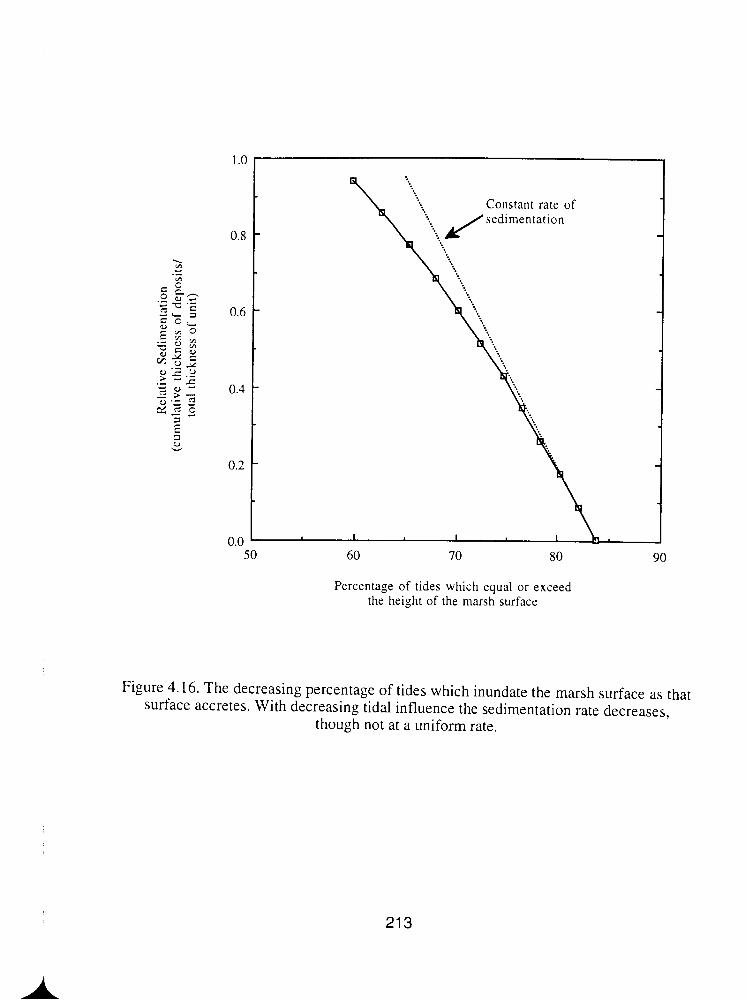
Rel
ativ
e S
edim
enta
tion
(c
umul
ativ
e th
ickn
ess
of d
epos
itst
to
tal
thic
knes
s of
uni
t)
marsh. As flood durations decrease, lesser amounts of sediment are able to fall from
suspension, resulting in decreasing sedimentation rates. The tide data used here
(cumulative number of observed tides (recorded hourly) which exceed given heights
above mean sea-level) are not flexible enough to record these changing durations of
inundation.
This last point raises an important limitation of the data presented here. One would
expect the tide data presented in Figure 4.15 to be slightly inaccurate in Squamish
estuary, as inundation of marsh surfaces is not a simple function of tidal flux. Both the
depths and durations of floodwaters over Squamish marsh surfaces are influenced by
discharge fluctuations of Squamish River and wind set-up in Howe Sound, which
operate over a number of time scales. If discharge is low then certain tides may fail to
inundate the surface, but if discharge is high enough the surface may be inundated
throughout most or all of the tidal cycle. For data to be fully comprehensive, one would
have to determine the actual duration of inundation at given tidal heights, over a large
enough period to record the effects of the majority of discharges experienced by
Squamish River.
If the above interpretation is valid then tidal marsh deposits may be identified as tidal in
origin from an examination of bedding characteristics alone. While it certainly is not
true to state that decreasing bed thickness upsection is a tidal characteristic, it may be
shown that the rate of that decrease with height is a characteristic of tidal environments.
For this reason it is important to examine the character of bedding produced by
differential sedimentation within a number of different environments. Unfortunately,
published data of the kind required for this purpose are very limited, though Nanson
(1977) provides some useful data. Nanson (1977) produced an average sedimentation
curve for sandy floodplain deposits of the Beatton River, British Columbia. This curve,
which is shown in Figure 4.17, was determined by combining sedimentation rates
determined from changes in poplar wood anatomy, with sedimentation rates determined
from changes in floodplain elevation. Changes in floodplain elevation with time were
determined from averaged data from 10 locations. These combined data provide average
rates of accumulation of sediments of known depths, over a period of 400 years. The
average annual rate of sediment-accumulation for Beatton River floodplain deposits is
1.70 cmlyr.
Nanson's (1977) average sediment-accumulation curve has been used here for
comparative analysis of the character of sedimentation rate with time, between fluvial
and tidal environments. The entire data set has not been used here: only the first 235
years (400 cm depth) of floodplain development are used, for two reasons. This point
represents an inflection point in the sediment-accumulation curve (identified by Nanson
(1977)) beyond which floodplain-building occurs at a negligible rate. This negligible
rate of sedimentation is comparable to the very slow rates of tidal marsh accumulation as
the marsh approaches mean high-water, as evidenced by the lack of visible rhythmite
beds toward the top of marsh facies. The 235 year range of data used in this analysis was
also chosen to ensure that the deposits within this fluvial environment reflect almost the
entire range of depositional events experienced by this river system. This is considered
essential if fluvial deposits are to be compared with deposits in a tidal environment,
which are known to have developed under the full range of tidal flows.
The results of this comparative analysis are shown in Figure 4.18. All data have been
transformed into dimensionless relative values. The curves produced in this way show a
distinct difference between the nature of sedimentation rates within the fluvial and tidal

Age In Years
Figure 4.17. Changing rate of sedimentation of Beatton River floodplain over a period of 400 years. Sedimentation rates (determined from changes in poplar wood anatomy and
floodplain elevation) decline rapidly after 50 and 235 years. From Nanson (1977).
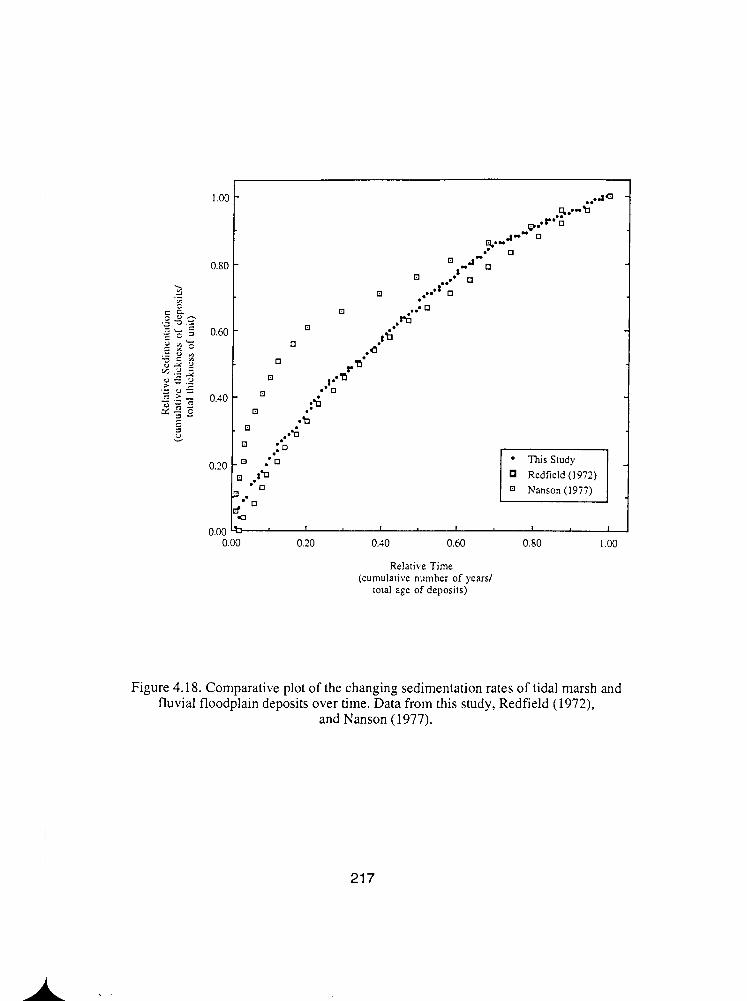
This Study Redfield (1972) 1 Nanson (1977) 1
Relative Time (cumulati\.e number o f years1
total age of deposits)
Figure 4.18. Comparative plot of the changing sedimentation rates of tidal marsh and fluvial floodplain deposits over time. Data from this study, Redfield (1972),
and Nanson (1977).
environments investigated here. Within the fluvial environment, sedimentation rates are
extremely high during the early stages of formation of the floodplain, in comparison
with a far more gradual rate of tidal sedimentation. To highlight this difference, half the
total thickness of Beatton River floodplain deposits formed in under 12% of the time
taken for the entire floodplain deposits to form. In Squarnish estuary, half the tidal marsh
rhythmites formed in 33% of the total time taken for these marsh deposits to form. After
around 20% of the total period of Beatton floodplain formation, sedimentation rates
rapidly decrease. Toward the last stages of floodplain formation, relative sedimentation
rates follow the same curve as that toward the last stages of tidal marsh formation.
From the data available, there exist clear differences between the nature of
sedimentation within fluvial and tidal environments. If the relationships highlighted here
are shown to be representative of floodplain and delta marsh deposits in a number of
environments then these results provide a further tool for environmental reconstruction.
The following paragraphs outline a number of mechanisms which may be responsible
for the different sedimentation rate patterns observed here.
I suggest that differences in the relative sedimentation between the fluvial and tidal
environments examined here are driven by characteristic differences in effective
discharge relationships, flood frequencies, and sediment transport mechanisms between
these environments. The most effective flood discharges in rivers commonly are high
frequency, low magnitude events. Whether or not the effective discharge equates with
bankfull conditions is not important here, it is merely important that effective discharges
have recurrence intervals of a small number of years (perhaps 2 or 3) . Sedimentation
rates within the fluvial environment primarily are driven by flow velocity. In contrast,
sedimentation rates within the intertidal zone primarily are determined by duration of
inundation, as flow velocities become too moderated by tides to allow the transport and
deposition of bedform sands. This could account for the lack of relationship between
sand content and bed thickness of tidal marsh rhythmites. Because tidal sedimentation is
driven by flood duration, the most effective tidal discharges are low frequency, high
magnitude events. During these periods water depths are greatest, and the durations of
marsh inundation are the longest, allowing greater sedimentation from suspension.
The differing sedimentation rates between fluvial and tidal regimes are not simply a
function of flow velocities, however, but are also a function of differences in relative
flood frequency. Although sedimentation within the intertidal environment is greatest
during flood events which occur least frequently, in relative terms these events occur
very frequently over highly predictable time scales. Because of the nature of tidal flux,
the highest tidal events occur fortnightly during the Spring tide. Within fluvial
environments, however, flood discharges of similar relative magnitude have recurrence
intervals which likely are in excess of 200 years. It is this regularity of tidal flows which
accounts for the characteristic decline in sedimentation rates with increasing age of the
tidal marshes shown in this study. During the early development of the marsh, regular
inundation by the full range of tidal flows ensures rapid rates of sedimentation. As the
marsh elevation is raised, however, fewer tides are able to inundate the surface, and the
largest tidal floods become less effective depositional events, as flood depths and
durations decrease. Because of the regularity of tides, the decreasing rate of marsh
inundation is gradual, producing a gradual decrease in sedimentation rate, as seen in
Figure 4.16. In those tjdal environments where sediment input from other sources is
minimal and relative sea-levels are stable, sedimentation will slowly continue to the
elevation of maximum tidal amplitude. Without a change in the elevation of the marsh in
relation to mean sea-level, continued marsh accretion cannot occur above this point.
Within the fluvial environment examined here, flows clearly are competent to initiate
considerable bedform transport. Because of this, flow velocities are considered to exert
greater influence on sedimentation rates than are flood durations. Because of this and the
fact that the most effective flood discharges are those of relatively high recurrence,
sedimentation rates are very high during the early stages of floodplain development
(when floodplain elevations are low). During these early stages, floodplain deposits are
produced by within-channel flows. In contrast to the tidal marsh environment, the most
important flows (for floodplain formation) in fluvial environments are not the deepest
flows experienced by the river. Although these flows deposit considerable amounts of
material, they occur too infrequently to exert major influence. Instead, the most
important flows are those of intermediate depth (high recurrence interval events). As
floodplain surfaces continue to accrete, the surface will eventually exceed the depth of
flow associated with these dominant high frequency events. Above this elevation, the
dominant mode of sedimentation will shift from bedload to suspended-sediment
deposition. This shift in sedimentation mode essentially reflects the transition from
within-channel to out-of-channel deposition. This transition is expected to occur rather
abruptly, and most likely accounts for the rapid decrease in sedimentation rate recorded
in Figures 4.17 and 4.18. As the floodplain continues to accrete beyond this point,
sedimentation rates will continue to decline (though at a more gradual rate) because of
the decreasing frequency of flooding at these higher elevations.
Nanson (1980) presents some evidence which agrees with the fluvial depositional model
outlined above. He states that the lowest sediments in floodplain sequences are not
overbank deposits, but are the vertical component of lateral accretion which occurs
within the channel during periods of high flow. This sedimentation forms the lowest
deposits in floodplain sequences, and accounts for the rapid sedimentation rates
observed for the first 50 years of floodplain formation (Figure 4.17). Above this point,
the sediments in floodplain sequences are overbank deposits, which as Nanson (1977)
shows, develop at a far slower rate (Figure 4.17). Nanson's (1980) interpretation of this
sedimentologic evidence and sedimentation rate data, however, differs from that given
here. He suggests that the rapid decline of sedimentation rate after 50 years of floodplain
formation (indicated in Figure 4.17) is attributable to a lateral shift in the location of
maximum within-channel deposition. Nanson argues that this shift is caused by the
establishment of a new scroll bar closer to channel flow. This scroll bar captures the
majority of sediment, so that continued accretion of the floodplain occurs through
suspended-sediment deposition. The formation of a new scroll bar closer to flow records
channel migration away from this region of floodplain accumulation.
I have suggested here that the mechanism responsible for the decrease in sedimentation
rate need not necessarily have been a lateral shift in the zone of maximum deposition
associated with channel migration. Such a trend could have been produced by a shift in
the dominant mechanism of sediment deposition (bedload to suspended-load) associated
with an increase in floodplain elevations above the limit of most effective flood depths.
The models presented above clearly are limited by their failure to consider changes in
suspended-sediment concentrations, and by consideration of the flood flow velocities
and durations in isolation. Despite these limitations, the models presented above provide
a theoretical framework to aid interpretation of the relationships between flow (in fluvial
and tidal regions) and bedding form (used here as a surrogate for sedimentation rate). To
test the validity and accuracy of these models, there is need for examination of bedding
form within a number of different tidal marsh systems, and other depositional
environments. For example, it would be interesting to examine the relative
sedimentation curve produced by lacustrine fill deposits, where annual beds commonly
are easily detectable. Lacustrine deposits may be quite similar to those of tidal origin, as
the decreasing depths of lake water (with continued sedimentation) may be similar in
form to the decreasing depths of tidal inundation (with higher elevation of the marsh). It
would also be interesting to determine whether the nature of sedimentation of intertidal
unvegetated sand and mud flats agrees with the findings from the vegetated tidal
marshes investigated here.
CHAPTER FIVE
ESTUARINE CHANNEL EROSION
AND TIDAL MARSH ACCRETION
This chapter discusses a number of erosional and depositional processes operating
within the estuarine reach of Squamish River. Discussion will focus on observations
made in the field, data collected during the field season, and also on data extracted from
historic photographic evidence. Squamish estuary is characterised by a history of rapid
distributary channel shifting and lateral instability of the river. The purposes of the
following sections are to determine the rate and nature of channel bank erosion within
the estuarine reach of Squamish River.
Analysis of Historic Rates of Bank Erosion
Historic rates of estcarine bank erosion have been determined from aerial photographs
dating from 1957 to 1990. In an attempt to determine the influence of dyke construction
on rates of erosion, pre- and post-dyke data are treated separately. A total of 13
photographs were traced then scanned as described in chapter 2, although only 8 of these
could be used in the analysis due to poor fit of the scans (excess error). The results of the
analysis of these scans are discussed below, and have been summarised for the periods
1957-72, and 1972- 1990.
Erosion along the lower 4 000 m of Squamish estuary is analysed within 4 zones. These
zone boundaries were determined from examination of aerial photographs over the 33
year period of study, and reflect the importance of channel morphology as a determining
factor for both the location and rate of erosion. As such, the 4 zones identified here
follow the length of individual meander arcs, which have been further subdivided into
zones along concave and convex banks. The locations of these zones may be seen in
Figure 5.1. These zone boundaries are dynamic features because they must shift as the
channel migrates. Despite this, however, little to no boundary shifting has taken place
since 1957. Examination of aerial photographs from the years 1957, 1969, 19732 and
1990 (shown in Figures 5.2 and 5.3) yields qualitative evidence of the amount of erosion
which has taken place within the 4 identified zones over this 33 year period.
The areal loss of floodplain and delta material over the periods before and after dyke
construction have been determined within each of these reaches. Although determination
of the volume of eroded material would be of greater significance than areal loss, it was
not felt that these data could accurately be determined. As no detailed channel cross-
sections could be made at the time of data collection, it was felt that the estimation of
channel depth (the equivalent depth of erosion) would introduce too much inaccuracy to
be of real use. Also, eroded bank material is not all completely removed from the near-
bank region, but may form a wide submerged ledge. Although bank erosion is known to
occur very rapidly, it is not known what time scales are required to remove slumped
material from the near-bank zone.
Table 5.1 shows the areal loss of material within each specified zone over a number of
time-spans before and after dyke completion. Yearly average losses were first calculated
as monthly averages for the periods between photographs, and these data were then
changed to yearly averages. The data presented in this table in and Figures 5.2, and 5.3
2 Although erosion rates were analysed over the 1969-72 period, the aerial photograph for 1973
is shown here because of technical difficulties involved in the presentation of the scanned image
for 1972.
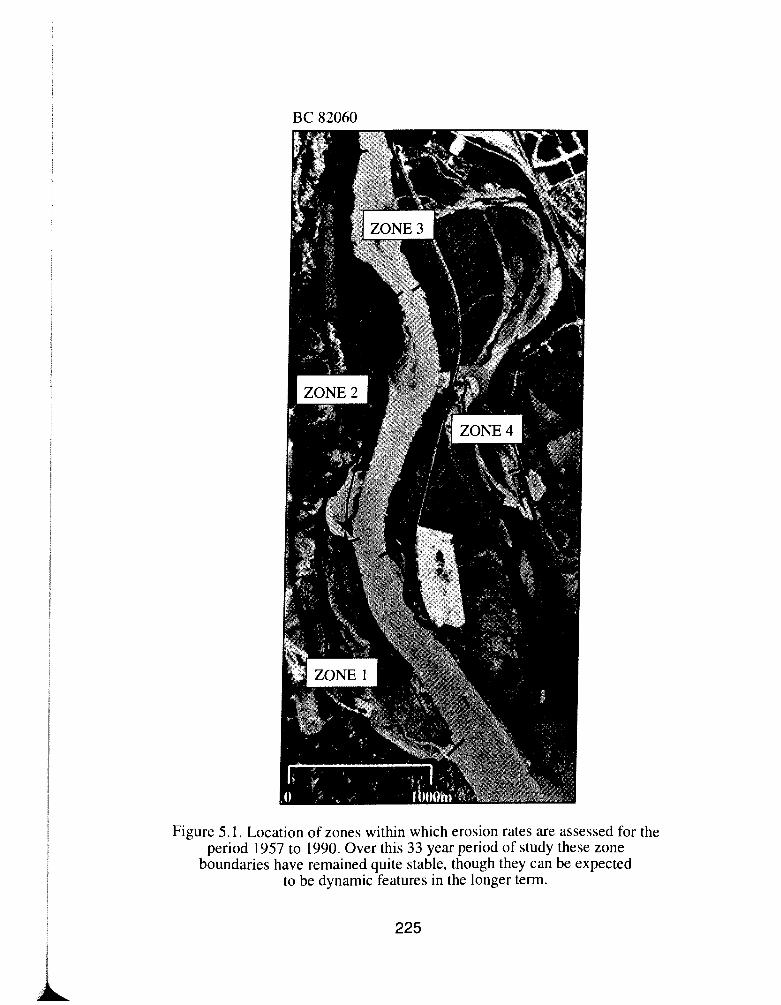
Figure 5.1. Location of zones within which erosion rates are assessed for the period 1957 to 1990. Over this 33 year period of study these zone
boundaries have remained quite stable, though they can be expected to be dynamic features in the longer term.
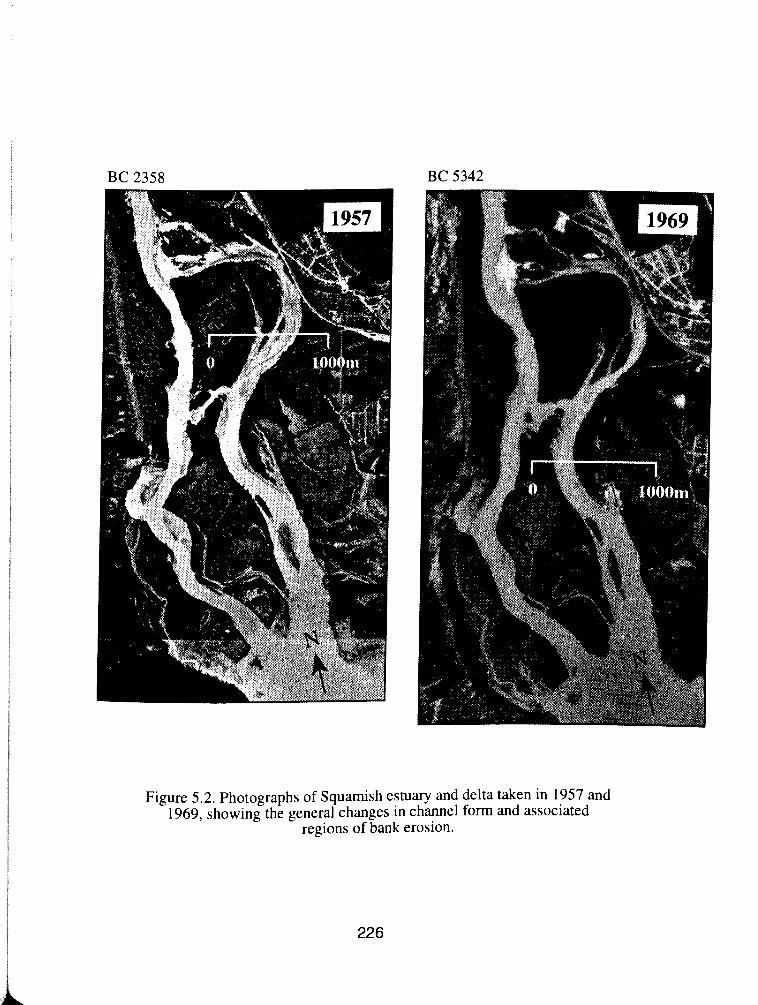
Figure 5.2. Photographs of Squarnish estuary and delta taken in 1957 and 1969, showing the general changes in channel form and associated
regions of bank erosion.
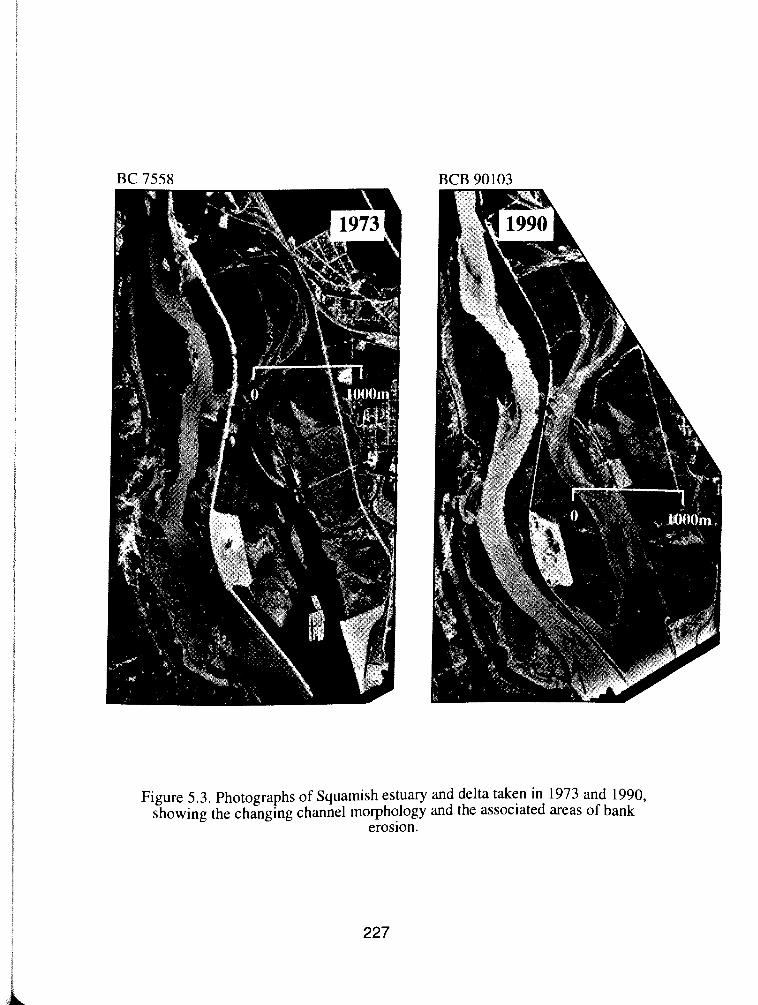
BCB 90103
Figure 5.3. Photographs of Squamish estuary and delta taken in 1973 and 1990, showing the changing channel morphology and the associated areas of bank
erosion.
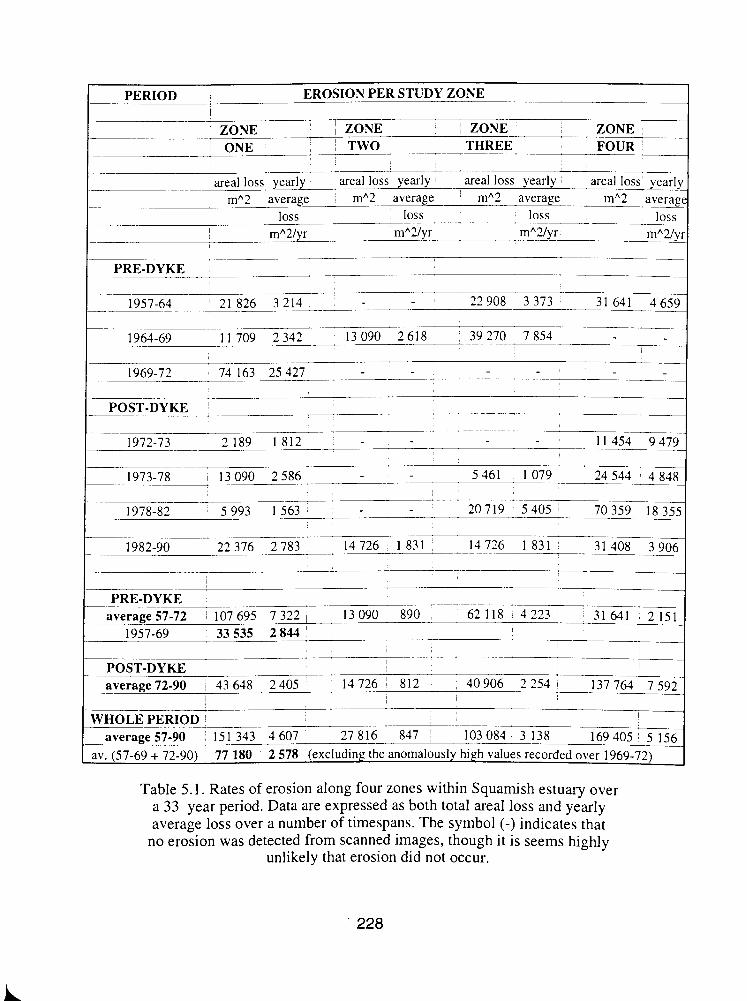
PERIOD EROSION PER STUDY ZONE I
ZONE ZONE I ZONE ZONE I ONE I TWO -- THREE FOUR
-- -
-- -. areal loss y 5 I y areal loss yearly areal loss yearly areal loss year11
-- I mA2 average mA2 average mA2 average
loss loss loss loss -- I mA2/yr mA2/yr mA21yr
-- mA2/y ---- I
PRE-DYKE average 57-72 107 695 7 322 I 13 090 890 62118 4223 31 641 2 151 --
33 535 2 834 pp
POST-DYKE 1 I
72-90 1 43 648 2 405 1 14726 ' 812 40906 2 2 5 4 137764 7592 I I I
WHOLE PERIOD 1
average 57-90 , 15 1 343 4 607 27816 847 - 103084 3138 169405 5 156 ( a". (57-69 + 72-90) 77 180 2 578 (excluding the anomalously high values recorded over 1969-72)
Table 5.1. Rates of erosion along four zones within Squamish estuary over a 33 year period. Data are expressed as both total areal loss and yearly average loss over a number of timespans. The symbol (-) indicates that
no erosion was detected from scanned images, though it is seems highly unlikely that erosion did not occur.

show that Squamish River has been laterally shifting and eroding banks at a
considerable rate over the 33 year period of record. The following is a summary of
trends observed in the data for each of the 4 zones.
1) Squamish west delta (zone 1) is decreasing in size as the lower reach of
Squamish River migrates westward. Rates of erosion within the time-spans under study
record considerable variability which primarily is caused by the very high rates of
erosion (over 25 000 m21yr) over the period from 1969 to 1972. This high value,
however, is not considered comparable to data from other periods because it not only
records possible natural erosion but also records the direct loss of delta material through
dredging. Levings (1980) reports that some loss of west delta sediments occurred
because of engineered attempts to straighten the lower channel. As no erosion was
recorded within any of the other 3 zones, the material eroded from zone 4 most likely
represents that portion of the delta which was removed during channel straightening. If
the erosion value for the 1969-72 period is not included then pre-dyke rates of erosion
average 2 844 m2Iyr.
As an average over the 33 year period of study, the west delta has been eroding at a rate
of over 2 578 m21yr. This value does not include that area of material artificially
removed in 1972. Comparison of pre- and post-dyke rates of erosion reveals that erosion
rates have remained essentially constant throughout all periods of study, indicating that
erosion of the west delta has not been exacerbated by dyke construction, though it
clearly has been greatly increased because of dredging. Erosion rates are in fact seen to
decrease somewhat from 2 844 to 2 405 m2/yr. Figures 5.2 and 5.3 reveal that erosion
has taken place along the entire 1 700 m length of the west delta.
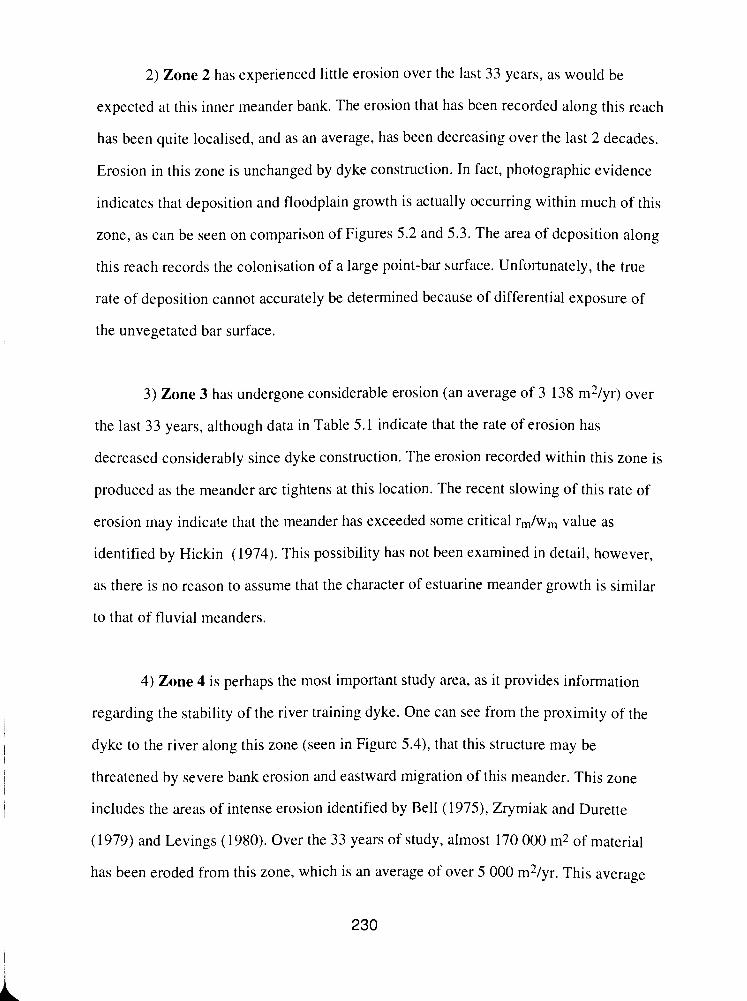
2) Zone 2 has experienced little erosion over the last 33 years, as would be
expected at this inner meander bank. The erosion that has been recorded along this reach
has been quite localised, and as an average, has been decreasing over the last 2 decades.
Erosion in this zone is unchanged by dyke construction. In fact, photographic evidence
indicates that deposition and floodplain growth is actually occurring within much of this
zone, as can be seen on comparison of Figures 5.2 and 5.3. The area of deposition along
this reach records the colonisation of a large point-bar surface. Unfortunately, the true
rate of deposition cannot accurately be determined because of differential exposure of
the unvegetated bar surface.
3) Zone 3 has undergone considerable erosion (an average of 3 138 m21yr) over
the last 33 years, although data in Table 5.1 indicate that the rate of erosion has
decreased considerably since dyke construction. The erosion recorded within this zone is
produced as the meander arc tightens at this location. The recent slowing of this rate of
erosion may indicate that the meander has exceeded some critical r,/w, value as
identified by Hickin (1974). This possibility has not been examined in detail, however,
as there is no reason to assume that the character of estuarine meander growth is similar
to that of fluvial meanders.
4) Zone 4 is perhaps the most important study area, as it provides information
regarding the stability of the river training dyke. One can see from the proximity of the
dyke to the river along this zone (seen in Figure 5.4), that this structure may be
threatened by severe bank erosion and eastward migration of this meander. This zone
includes the areas of intense erosion identified by Bell (1975), Zrymiak and Durette
(1979) and Levings (1980). Over the 33 years of study, almost 170 000 m* of material
has been eroded from this zone, which is an average of over 5 000 m2/yr. This average
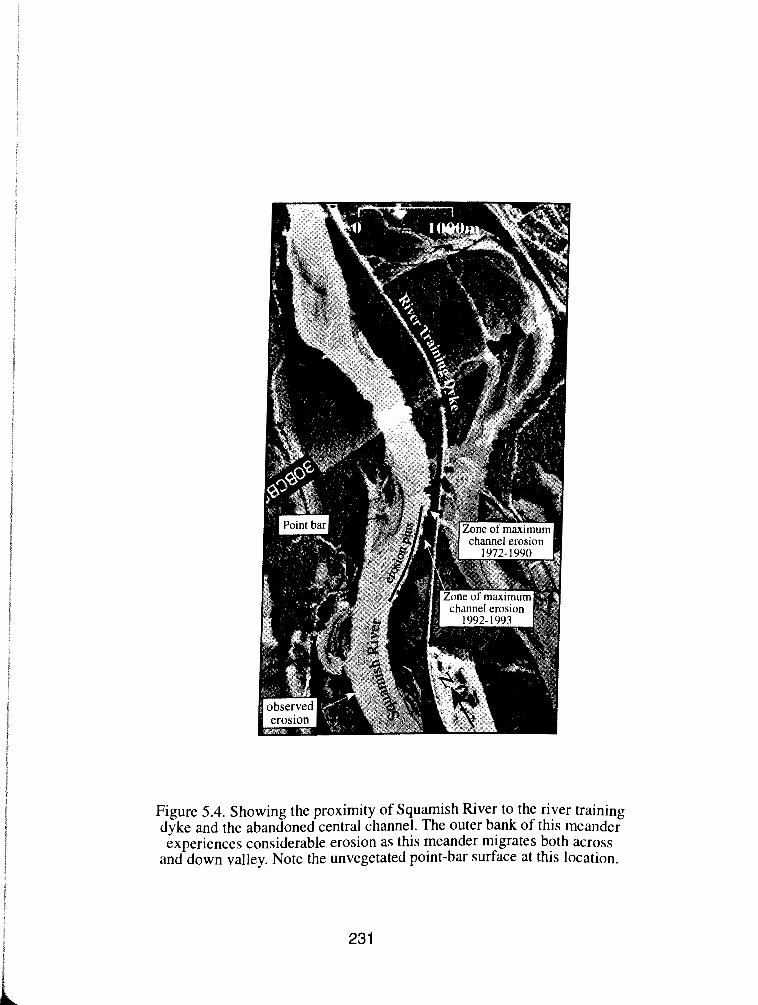
Figure 5.4. Showing the proximity of Squamish River to the river training dyke and the abandoned central channel. The outer bank of this meander experiences considerable erosion as this meander migrates both across
and down valley. Note the unvegetated point-bar surface at this location.
23 1
value masks considerable temporal variability which is particularly evident upon
comparison of pre- and post-dyke rates of erosion. This comparison reveals that rates
have more than trebled since 1972, increasing from 2 15 1 m21yr over the period 1957-72
to 7 592 m2Iyr between 1972 and 1990.
While no attempt was made to calculate rates of erosion over smaller zones than those
described here, it is evident that erosion (particularly within zone 4) is not constant
throughout the meander arc. Throughout this meander, erosion is variable with location
along the arc, as noted elsewhere by Hughes (1977), and the location of maximum
erosion has not remained fixed throughout the period of study. Instead, the point of
maximum erosion has shifted from the upstream end of the meander to a point several
hundred metres downstream. This indicates that the meander is migrating across valley
and is also shifting down valley. The zone of maximum erosion identified from aerial
photographs (up to the year 1990) is labeled in Figure 5.4. This figure also shows the
extent of the point-bar which is building along the inner bank of this meander.
When the average rates of erosion within each of the 4 zones are presented
diagrammatically (Figure 5 . 3 , a number of general trends both within and between
zones are revealed. Although this figure is necessarily simplistic because of the
averaging process, it is clear that individual meanders respond to changes in flow in
different ways, and at different times. The 3 outer meander bends within this study reach
(represented by zones 1, 3 and 4) do not necessarily all experience accelerated (or
decelerated) erosion over a given time span. For example, as an average over the period
from 1978 to 1982, zones 3 and 4 experienced greater erosion than over the preceding
years, whereas zone 2 remained unchanged and zone I experienced a slower rate of
erosion than previously. This highlights the fact that system response to fluctuating
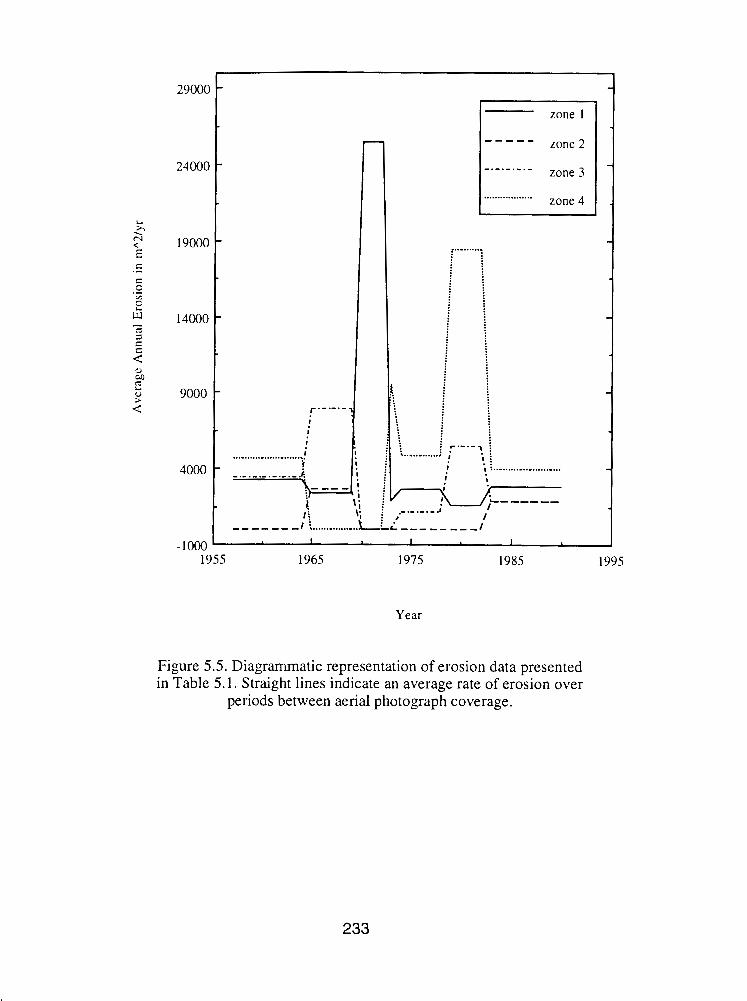
zone 1
- - - - - zone 2
-.-.-.-.- zone 3
.................. zone 4
1955 1965 1975 1985 1995
Year
Figure 5.5. Diagrammatic representation of erosion data presented in Table 5.1. Straight lines indicate an average rate of erosion over
periods between aerial photograph coverage.
discharge occurs as a series of local hydraulic and planform changes, and that erosion
rates determined for one meander need not be applicable to adjacent meanders
(Ferguson, 1977). There is some limited evidence to suggest that changes in rates of
erosion within zones 1 and 3 are negatively related, as the trends through these data sets
generally mirror each other.
Figure 5.5 also shows that meander migration does not occur linearly, but occurs as a
series of rapid shifts evidenced by peaks in the average erosion data, followed by periods
of limited or greatly reduced channel activity.
Unfortunately, the aerial photograph for September 199 1 was not usable in these
analyses because the small scale of the photograph introduced an unacceptably large
error. Despite this, detailed examination of this photograph reveals that considerable
erosion took place within zone 4 over the 13 months since the 1990 photograph. From
an examination of this channel bank reach during the field season early in May 1992, it
was also clear that considerable loss of floodplain material had occurred in the previous
8 months. At its closest point, the basal section of the river training dyke lay within 5 m
of the river bank in mid-1992. In addition to these qualitative observations, direct
measurements of bank erosion within this zone were taken over the latter half of 1992
and on a number of occasions throughout 1993. These data are presented later in this
chapter.
Error in Erosion Data
The errors intrinsic to aerial photographs primarily are those that occur as a result of the
differential scaling across the ground extent of the photograph. Because of the
decreasing angle of view away from the centre, the surfaces recorded toward the edges
of photographs become distorted or stretched relative to those surfaces in the centre.
This results in a photograph scale which is not constant across the entire image.
Unfortunately, it is extremely difficult to determine the order of error within data
derived from an overplot of two superimposed images which were originally taken at
different elevations and along different flight paths. However, those images which did
record detectable distortion were not used in analysis. In 5 of the 13 scanned images, the
reference points used to establish fit between different images could not be matched, and
so were rejected.
The error which arises when data are extracted from photographs is more easily
controlled and may be determined with ease. The main error is produced by the
differential scaling of air photograph traces; even though traces are scanned then
rescaled to some common size, trace scales are not exactly the same. Of the 8 scans
which were used in erosion analysis, 4 different scales were represented (determined by
comparison of areas on all scans with the known areas from Squamish area map). For
the calculation of areal loss of delta and floodplain material, an average of these scales
was used (mean scale = 17 535, S.D. = 404, n= 4). The maximum error which may arise
from this use of an average scale is calculated as 10.8 %. This value is the difference in
area calculated from the smallest and largest represented scales, expressed as a
percentage of the largest value (Hooke and Perry, 1976). The calculated areas of erosion
presented in Table 5.1 may then be expressed as accurate to within k 5.4 %. This value
includes the error which results from the different scales of scanned images used, and
also some of the error incorporated by the differential scaling (stretching) within each of
the photographs. Because areal measurements of scale were determined as opposed to
single length measurements, this latter error is recorded in two directions. This is

preferential because stretch may be greater in one direction than another. For example,
because of plane roll, distances perpendicular to the flight path may exceed those
parallel with the flight path.
Despite this inclusion, the error value o f f 5.4 % is considered something of an
underestimate as it fails to consider scale differences across the whole extent of all
photographs, and it also takes no account of minor errors incorporated when the original
image was traced. Because of these factors, it is considered more realistic to report the
erosion data as accurate to the order of + 10 %.
Analysis of Short-Term Rates of Bank Erosion
Erosion rates within zone 4 were determined over the period from June 1992 to August
1993. Bank retreat was recorded from a series of 64 erosion pins placed on the
floodplain surface a!ong that section of the meander marked in Figure 5.4. After their
initial placement in June 1992, these pins were resurveyed in August, November,
December 1992, and February, April, and August 1993. During this period of study,
considerable erosion was noted within this zone, which (as previously noted from
historic data) was highly discontinuous. The discontinuous nature of these data suggest a
seasonal variability which likely is driven by the seasonal nature of flow of Squamish
River.
Erosion was recorded over each of the 6 periods of study, though not all pins recorded
floodplain loss. Over the summer months of 1992 and 1993, bank retreat was measured
in decimetres when averaged along the entire length of this monitoring site. During the
autumn of 1992, however, substantial bank retreat occurred within this zone. The time of
initiation of this erosion or its duration are not known, but by 11 November, 42 of the 64
erosion pins had been eroded and lost. Estimates of the amount of bank retreat over this
3 month period were able to be made from a series of accretion stakes which had
previously been placed at 100 m intervals, 15 m back from the river bank. Two of these
stakes had been eroded, while a third was found within a partially-slumped block of
floodplain material by the river bank. From this evidence it is clear that bank retreat at
these 3 locations exceeded 15 m, and this rate of retreat is considered representative of
this 300 m section of bank. Erosion was also recorded at all pins both upstream and
downstream from this section, though these recorded a bank retreat averaging 3.5 m.
This material is considered to have eroded rapidly over a short period of time, in the
manner described in the proceeding section.
Observations of Channel Bank Erosion
Field observation and erosion pin data suggest that the majority of channel bank erosion
occurs during high discharge flood events in winter months. For this reason the process
of bank erosion was rarely observed, with one notable exception. Late in June 1992,
considerable bank erosion occurred at the upstream-most end of the west delta, as
indicated in Figure 5.4. This erosion began abruptly and continued at a considerable rate
throughout the months of July and August, along a section of river bank 100 m in length.
Because of the speed of erosion within this localised region, the erosional process
(shown dramatically in Figure 5.6) was easily observed. The following is a discussion of
these field observations.
Prior to the initiation of erosion, the bank in this location resembled all others in this
study reach, and in fact at most locations along the lower 2 500 m of Squamish estuary.
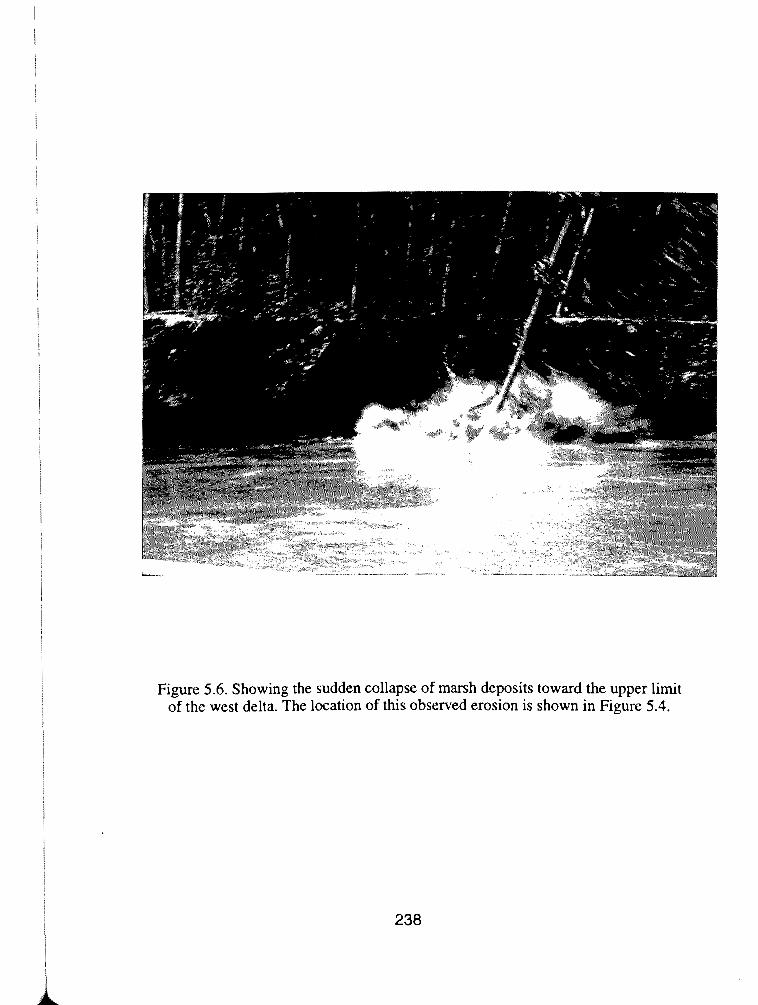
Figure 5.6. Showing the sudden collapse of marsh deposits toward the upper limit of the west delta. The location of this observed erosion is shown in Figure 5.4.
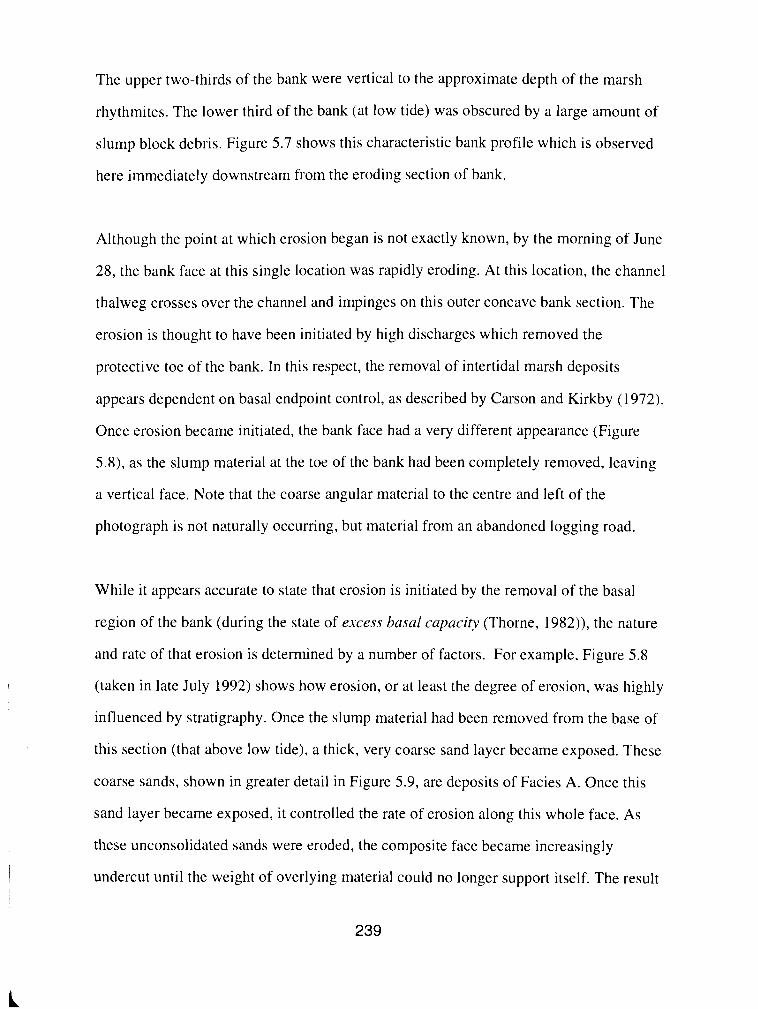
The upper two-thirds of the bank were vertical to the approximate depth of the marsh
rhythmites. The lower third of the bank (at low tide) was obscured by a large amount of
slump block debris. Figure 5.7 shows this characteristic bank profile which is observed
here immediately downstream from the eroding section of bank.
Although the point at which erosion began is not exactly known, by the morning of June
28, the bank face at this single location was rapidly eroding. At this location, the channel
thalweg crosses over the channel and impinges on this outer concave bank section. The
erosion is thought to have been initiated by high discharges which removed the
protective toe of the bank. In this respect, the removal of intertidal marsh deposits
appears dependent on basal endpoint control, as described by Carson and Kirkby (1972).
Once erosion became initiated, the bank face had a very different appearance (Figure
5.8), as the slump material at the toe of the bank had been completely removed, leaving
a vertical face. Note that the coarse angular material to the centre and left of the
photograph is not naturally occurring, but material from an abandoned logging road.
While it appears accurate to state that erosion is initiated by the removal of the basal
region of the bank (during the state of excess basnl capacity (Thorne, 1982)), the nature
and rate of that erosion is determined by a number of factors. For example, Figure 5.8
(taken in late July 1992) shows how erosion, or at least the degree of erosion, was highly
influenced by stratigraphy. Once the slump material had been removed from the base of
this section (that above low tide), a thick, very coarse sand layer became exposed. These
coarse sands, shown in greater detail in Figure 5.9, are deposits of Facies A. Once this
sand layer became exposed, it controlled the rate of erosion along this whole face. As
these unconsolidated sands were eroded, the composite face became increasingly
undercut until the weight of overlying material could no longer support itself. The result
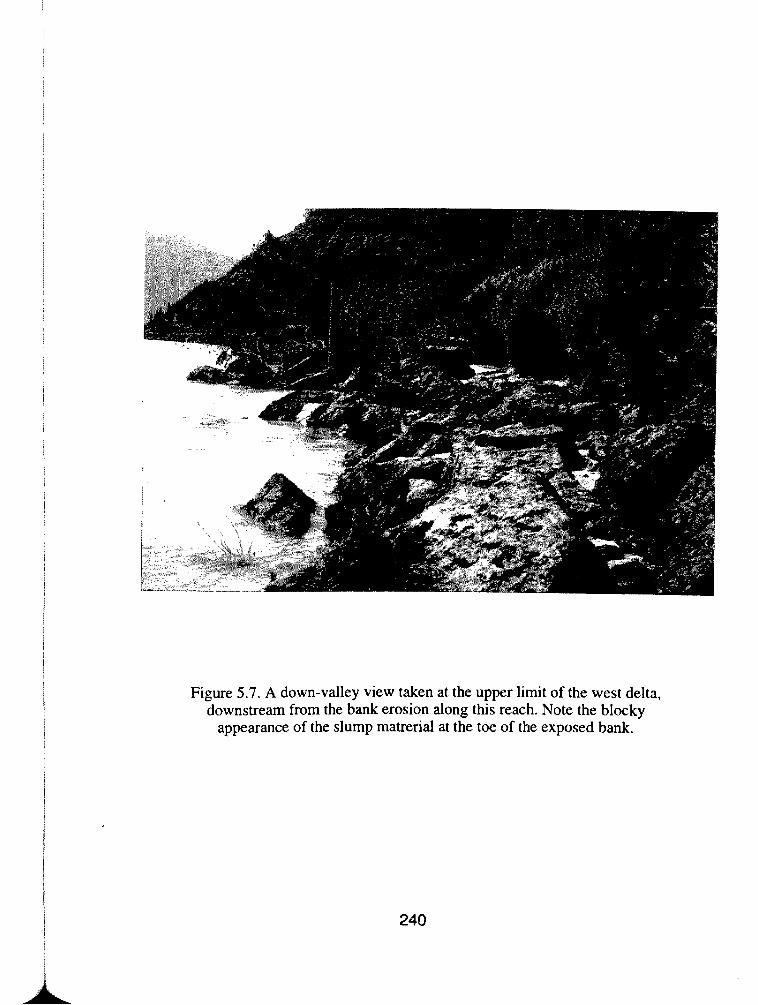
Figure 5.7. A down-valley view taken at the upper limit of the west delta, downstream from the bank erosion along this reach. Note the blwky
appearance of the slump matrerid at the toe of the exposed bank.
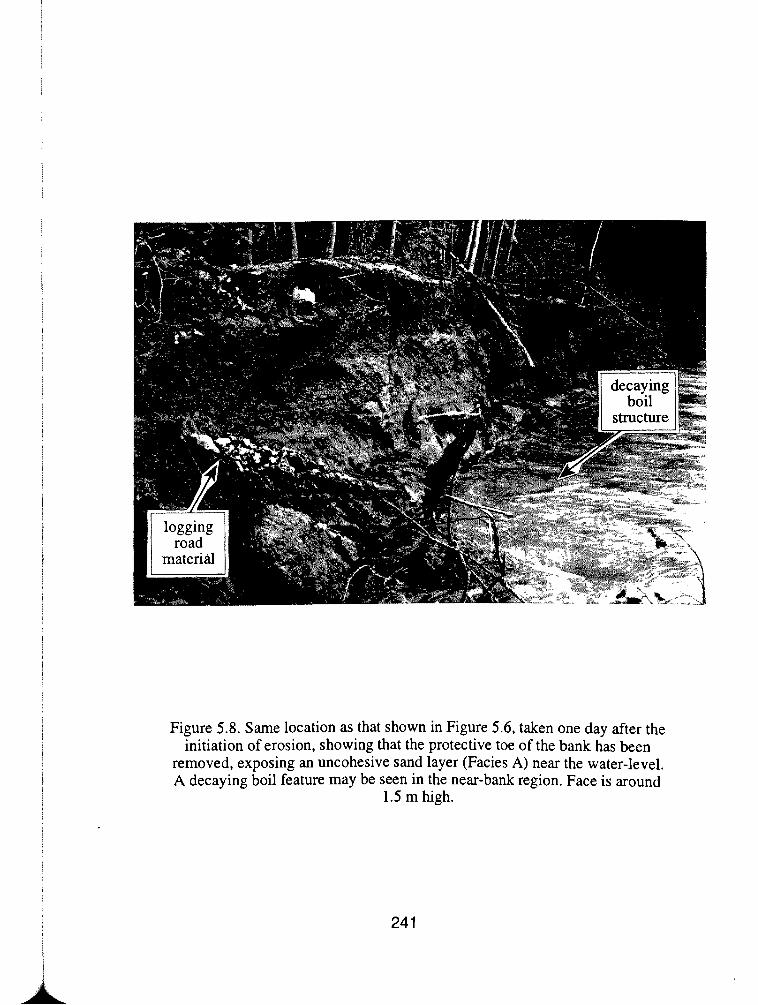
Figure 5.8. Same location as that shown in Figure 5.6, taken one day after the initiation of erosion, showing that the protective toe of the bank has been
removed, exposing an uncohesive sand layer (Facies A) near the water-level. A decaying boil feature may be seen in the near-bank region. Face is around
1.5 m high.
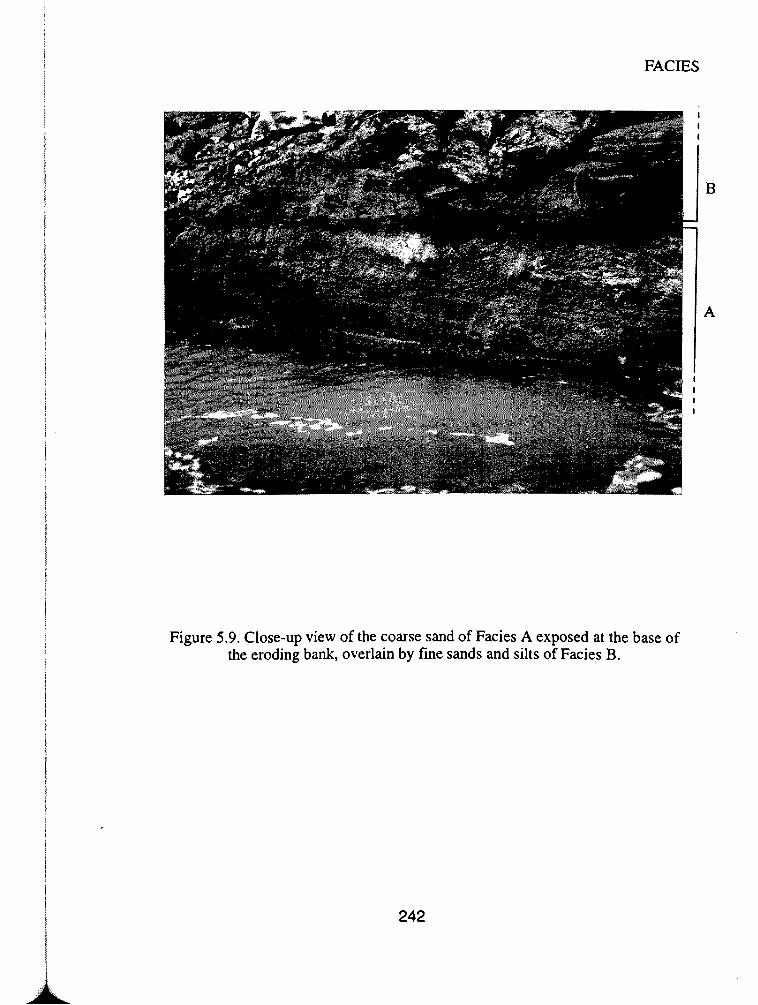
Figure 5.9. Close-up view of the coarse sand of Facies A exposed at the base of the eroding bank, overlain by fine sands and silts of Facies B.
of this lack of support was the sudden collapse (as a cantilever failure) of bank sections
up to 5 m3 in size. In this way, the cohesive nature of the overlying sediments controlled
the nature of bank collapse (as noted elsewhere by Turnbull et al., 1966, and Hughes,
1977). Thorne (1982) similarly notes that in cases where cohesive sediments overlie
uncohesive sediments, the mechanism of failure is determined by the thickness of
overlying deposits. These large coherent blocks collapsed as a single unit, thus retaining
their internal character and also often removing trees. In this way the size of these
coherent blocks also may be determined by the size and character (number, depth,
diameter etc) of the root systems of these trees.
Because of the location of this unit toward the base of the exposed face, erosion was also
controlled by tidal cycle. No erosion was observed during the majority of the tidal cycle
when stage was high, or at least higher than the upper limit of sand. All of the erosion
that was observed over a number of weeks, took place within 1 or 2 hours of low tide. At
these low stage periods the sand layer became exposed, and then became susceptible to
erosion. Tidal stage may have further influenced erosion rates because of increased pore
pressures within the bank during falling stage, and because of the exfiltration of water
from the bank face (Barwis, 1978).
Another important point to note is that the erosion did not seem to be controlled by mean
flow velocities of Squamish flow, as the river was not moving rapidly past the bank at
this point at those times when the basal sands were exposed. Instead, most erosion
appeared to be controlled by turbulent conditions within flow and by wind-generated
waves on the sur fxe of flow. Erosion was greatly increased during periods of turbulent
activity at the bank face, where small eddies (bursting boil features) caused disruption of
the water surface. One of these boil features may be seen in Figure 5.8, though at this
time the feature is in a state of decay. These periods of localised velocity fluctuations
lasted for 5 to 10 seconds. Without more detailed measurement of flow characteristics, it
is impossible to state the cause of this flow turbulence. It seems likely, however, that it
is caused by secondary circulation along this concave outer bend, rather than from the
shedding of turbulent eddies from the lee of channel bedforms or obstacles to flow.
Detailed discussion of the causative mechanisms of boil production within Squamish
estuary is given by Babakaiff (1993).
The most intense periods of undercutting and collapse took place during periods of wave
activity in Squamish flow. The greatest wave activity in Squamish estuary (with the
exception of storm events) occurs when up valley sea-breeze winds combine with an
incoming tide. These conditions produce waves up to 2 m in height, which may travel up
to 2 500 m upstream from the river mouth. During the early stages of tidal rise (within
the first hour) the sand unit is exposed and becomes intensely eroded by wave activity at
the base of the bank. Within minutes of the river level exceeding the upper limit of sand,
however, almost all erosion ceases. Bhowmik (1982) similarly noted the importance of
wind (and boat) generated waves on bank erosion.
Over the period of study from late June to late August, the bank retreated up to a
maximum of 4.9 m at one location. A number of erosion pins were washed out, and the
largest bank retreat recorded from one erosion pin in one day was over 2 m. Re-
stabilisation of the river bank took place within a number of weeks, and was essentially
achieved when the toe of the bank became protected by collapsed bank material. At this
stage the bank was in the state of impeded removal (Thorne, 1982). Figure 5.10 shows
the appearance of the re-stabilised bank taken on July 14, over two weeks after erosion
began. At the time this photograph was taken, the coarse sand unit at the base of the
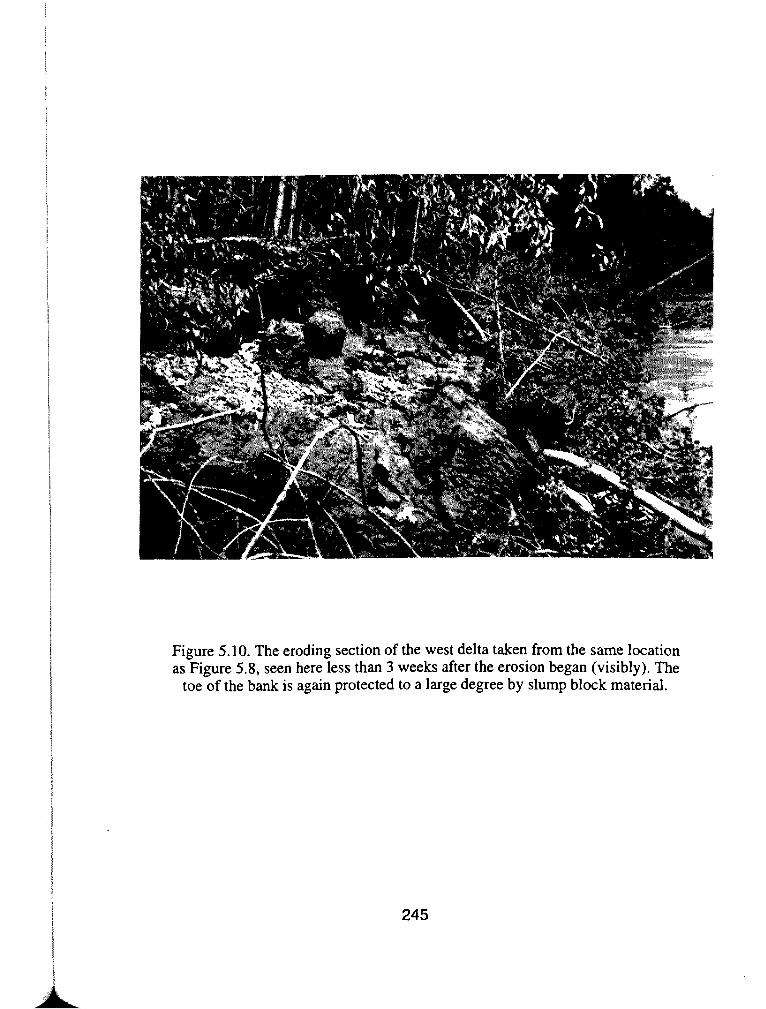
Figure 5.10. The eroding section of the west delta taken from the same location as Figure 5.8, seen here less than 3 weeks after the erosion began (visibly). The
toe of the bank is again protected to a large degree by slump block material.
bank was covered and so unable to be eroded by flow. While erosion did continue at this
site for a number of weeks, it was limited to a number of small sites along the bank, and
never equaled the rates of erosion recorded in the first week of observation.
Discussion
It is clear from the above discussion that certain reaches of Squarnish estuarine river are
laterally unstable, and are eroding floodplain and delta deposits at a fairly rapid, though
discontinuous rate. The most important conclusion from these analyses is that the
channel meander closest to the river training dyke is migrating eastward. The rapid rates
of bank erosion at this location (recorded from photographs and erosion pins) pose a
serious threat to the dyke structure. One can see from examination of Figure 5.4 that the
river is very close to the dyke structure and central channel at this location. Without
remedial engineering, Squamish River will switch distributary channels and once again
flow through the central channel. If this channel bank section continues to erode at a rate
similar to that determined in this study, dyke stability will soon be threatened. Although
the dyke structure is itself a stable feature, it will be eroded through the removal of large
blocks underlying tidal marsh deposits. For engineering attempts to be successful
therefore, the near-bank zone along the concave meander bend needs to be protected at
the low-water mark and the subtidal bank region. This may require that any protective
structure extend between 5 and 10 metres away from the channel bank. Given the
difficulties and expense of such engineering measures, and the likelihood that they will
still fail to entirely stabilise this bank section, additional or alternative protective
measures likely will be necessary. The alternative measure which is considered most
appropriate here is artificial channel widening, which can be achieved by dredging the
large point bar which is building along the inner bank of this channel meander.
If the river is successfully prevented from shifting eastward then it is clear that the west
delta will continue to decrease in size as the lower 1 700 m reach of the river migrates
westward. Substantial loss of land has already occurred over the period of study, though
there is no indication that rates of erosion have increased since dyke construction. This
may have important implications for Squamish delta landuse management.
From the analysis of erosion within zone 4, it is clear that rates of erosion have increased
dramatically in recent times. It is important to assess the possible effects that the river
training dyke may have had on Squamish flow along its lower reaches, and whether
these have exacerbated the natural process of erosion within this identified zone. Dyke
construction has modified Squamish flow by effectively reducing channel width during
flood conditions. Prior to dyke construction, floodwaters inundated all of the central
delta, and water was able to flow through the cutoff and central channel of Squamish
delta. With dyke construction, the central channel, east delta, and most of the central
delta have become isolated from flow, resulting in a reduction of floodwater storage
capacity. Although it is clear that dyke construction has modified Squamish River flow,
it is impossible to determine from existing data, the exact nature of the rivers response to
the new flow regime. One may postulate, however, that in order to maintain continuity,
the decrease in flow width during periods of flood must be accommodated by an
increase in flow depth and velocity. These increased flow depths and velocities have
formed an anomalous stratigraphic sequence along lower reaches of Squamish River, as
discussed in chapter three. These changes also likely are responsible for increased basal
scour along the near-bank region, resulting in a more rapid rate of meander migration
(Wiebe, 1976; Zrymiak and Durette, 1979; Government of Canada, 1981).
There are problems in any study of this kind, which attempts to determine the effects of
some artificial flow modification from a limited period of record. These primarily arise
from difficulties in quantitative distinction between allogenic and autogenic change
(Lewin, 1977). Despite this, the order of magnitude of change in rates of erosion
recorded around 1972 indicates that the loss of floodplain material is not through natural
processes alone. This observation, in combination with the observations and recordings
of accelerated and rapid erosion immediately after dyke construction by Bell (1975),
Wiebe (1976), Zrymiak and Durette (1979), and Levings (1980), lends strong weight to
the argument that dyke construction has exacerbated erosion, at least within this
particular reach (zone 4) of Squamish estuary. It still remains unclear why this particular
zone has experienced increased erosion yet other reaches have not.
Despite these comments, it is important to attempt some form of distinction between
allogenic and autogenic change within this environment, even if this is necessarily
limited to a qualitative assessment of the effects of discharge fluctuations. For this
reason, maximum daily discharge data from 1957 to 1990 have been examined, and
these are shown in Figure 5.11. These data are considered of greater value than mean
annual or mean monthly discharge data because the monthly or yearly averaging process
will mask discharge extremes. Figure 5.11 indicates that the largest daily discharge on
record occurred in 1957, and the second largest (calculated as a 35 year recurrence
flood) occurred in 1984. Unfortunately, it is almost impossible to detect any relationship
between these discharge data and rates of erosion presented in Table 5.1. Despite this, it
is evident that the post-dyke period has experienced a greater number of large floods
than the pre-dyke period. For example, between 1957 and 1972 there was one recorded
maximum daily discharge in excess of 2 000 cumecs, whereas three such discharge
magnitudes have been recorded over the 1972 to 1990 period.
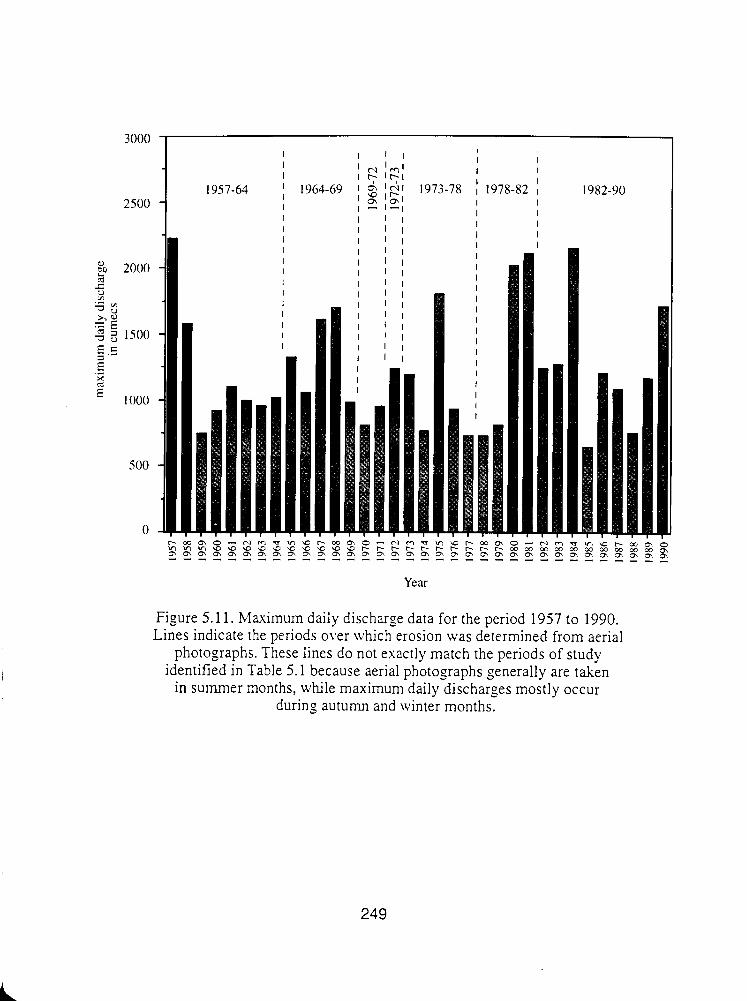
Year
Figure 5.1 1. Maximum daily discharge data for the period 1957 to 1990. Lines indicate the periods over which erosion was determined from aerial
photographs. These lines do not exactly match the periods of study identified in Table 5.1 because aerial photographs generally are taken
in summer months, while maximum daily discharges mostly occur during autumn and winter months.
From this discussion it appears likely that river training dyke construction has served to
increase rates of bank erosion along certain estuarine reaches through the decrease in
channel and effective floodplain widths. This erosion has perhaps been exacerbated by
an apparent increase in the frequency of the highest magnitude floods over the 33 year
period of discharge record.
Preservation Potential of Squamish Estuarine Deposits
In Chapter 3, I conclude that within this high energy fjord setting, the facies which most
clearly identify these deposits as tidal in origin are those of Facies B and C. We must
consider, however, the relative importance of these deposits to the sedimentologist or
geologist who wishes to determine the origin of sedimentary deposits. For a deposit to
be of any use as an environmental indicator, it must first be preserved in some
recognisable form. For this reason it is important to assess the preservation potential of
marsh rhythmites at this location.
Nio (1984) suggests that tidal sediments have a very low preservation rate, as they are
usually destroyed by waves and storms. Similar conclusions may be made regarding
tidal sediments in Squarnish estuary, although the process of erosion differs from those
mentioned by Nio (1984). The combined effects of a high-energy glacially-fed river
migrating within a steep, laterally confined valley mean that estuarine deposits have a
very low preservation potential. It is clear from the analysis of a limited record of
erosion in Squamish estuary that Squarnish River and delta distributary channels are
highly unstable, and are constantly re-working sediments. It seems unlikely that any of
the delta topset beds and floodplain deposits within the lower estuary exceed 400 years
in age.
Thomas et al. (1987) state that the preservation potential of intertidal deposits is greatly
increased if the sediment is cohesive, and particularly if these sediments were deposited
as floccules, aggregates, or as faecal pellets. While marsh sediments possess all of these
qualities, observations regarding the nature of bank erosion show that this is not
important in Squamish estuary. The internal characteristics of the marsh rhythmite facies
has little effect on its erosion because these deposits become eroded by removal of
underlying uncohesive sediments. These uncohesive sediments underlie marsh deposits
across the whole delta.
From the analyses of short-term and longer-term erosion rates, one must conclude that
marsh rhythmite deposits will not be preserved (intact) in stratigraphic sequence in this
fjord environment. From this, it also follows that these deposits will not become
preserved in ancient and recent bay-head delta sequences such as those described by
Bartsch-Winkler et al. (1983), and Postma and Cruickshank (1988). Despite this
statement, it does pot necessarily follow that marsh sediments will be completely
eroded, or will fail to be preserved in some form. It is proposed that marsh rhythmite
deposits become incorporated into the fjord deltaic sequence as cohesive blocks which
are produced during bank erosion. These blocks (shown in Figure 5.7) are of
considerable size (occasionally over 4 m in length, 2 m wide, and 1.5 m thick), and
retain their internal form because of their cohesive nature, and because of the binding
effect of the organic matting. Barwis (1978) states that slump blocks in South Carolina
marshes become incorporated into the lower bank deposits, where they often become
preserved in ancient sequences (e.g. Horne and Ferm, 1976). Howard et al. (1973) report
that blocks of these cohesive materials up to 1 m in diameter may be found along the
channel thalweg.
Once these blocks become eroded from the edge of the marsh, they collapse into
Squamish River and rest on the channel bed. These become incorporated into the delta
foreset beds if buried by an aggrading channel, or by migration and point bar growth. It
is important to note, however, that this erosional process and production of large intact
slump blocks is not unique to tidal environments. As such, it is important that these
blocks can be determined as tidal in origin. If these deposits are to be of any value in
environmental reconstruction, it must be shown that the blocks are able to retain both
their form and internal character prior to burial, and upon compaction and diagenesis. In
the case of these tidal marsh deposits, it is important that the organic bedding be seen in
rock form, and that it is possible to identify the type or size of organic matter. Thomas et
al. (1987) report that the organic criterion is of limited value to environmental
reconstruction because of the lack of preservation of organic forms into rock. However,
the processes of compaction and diagenesis are not fully understood, or constant from
one site to another (Bouma, 1963). Although it is true that preservation will not always
occur, a number of studies indicate that organic material is often well preserved. Zaitlin
and Schultz (1984) reported a Lower Cretaceous coal facies up to 5 m thick which
contains pyritised rootlets, interbedded with finely laminated carbonaceous shales. This
facies is interpreted as salt marsh or peat swamp deposits. A very similar description of
ancient deltaic coal deposits was given by Selley (1985). Okazaki and Masuda (1989)
describe two Late Pleistocene delta sequences, and base their interpretations (in part) on
differences in organic matter. The authors describe two deposits as "peaty layers with
rootlets" and "muddy layers with roots and plant debris", and use this to distinguish
between marine and fluvially dominated environments. If slump blocks remain
relatively undisturbed these deposits may be identified as tidal in origin from an
examination of bedding form. As has been shown in chapter four, the nature and pattern
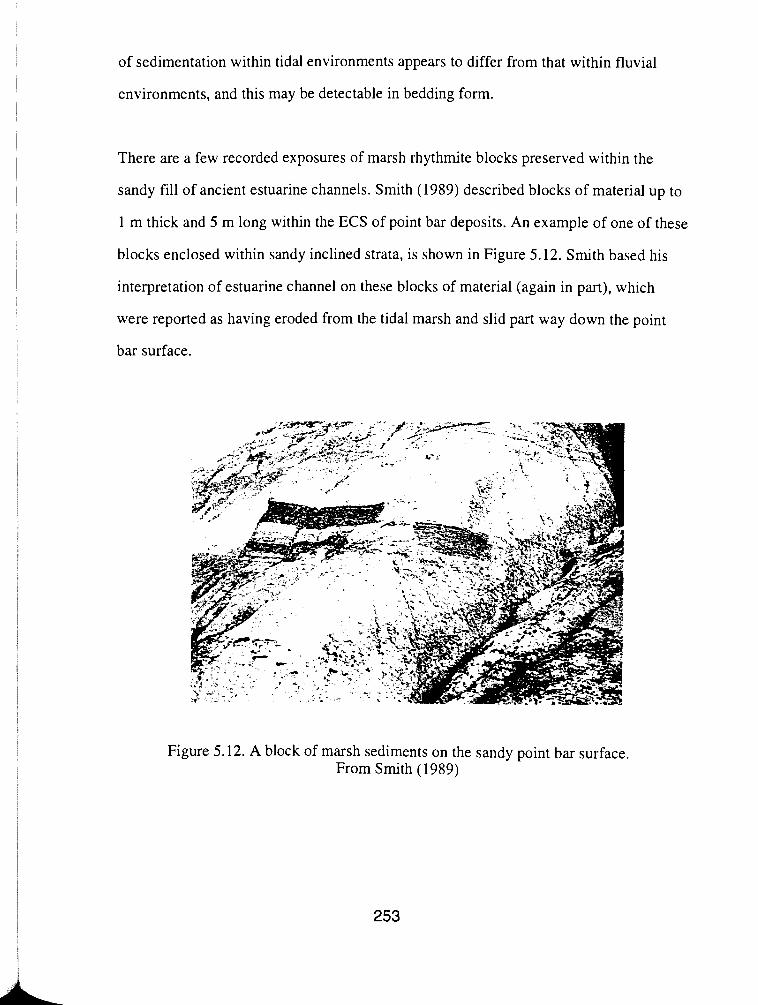
of sedimentation within tidal environments appears to differ from that within fluvial
environments, and this may be detectable in bedding form.
There are a few recorded exposures of marsh rhythmite blocks preserved within the
sandy fill of ancient estuarine channels. Smith (1989) described blocks of material up to
1 m thick and 5 m long within the ECS of point bar deposits. An example of one of these
blocks enclosed within sandy inclined strata, is shown in Figure 5.12. Smith based his
interpretation of estuarine channel on these blocks of material (again in part), which
were reported as having eroded from the tidal marsh and slid part way down the point
bar surface.
Figure 5.12. A block of marsh sediments on the sandy point bar surface. From Smith (1989)
West Delta Accretion
The purpose of this section is to investigate the rates and spatial variability of west delta
accretion. These data will be used to determine the changing rates of accretion with time
(marsh maturity), the dominant source of sediment, and any seasonality of accretion.
After this, the stratigraphic implications of these results will be discussed.
Spatial and Seasonal Variability of Accretion
The spatial variability of marsh accretion may be shown in two ways: by recording
short-term (yearly) accretion, and by examining differences in marsh surface elevations.
This latter approach gives information regarding longer-term accretion rates, and an
indication of the relative age of the marsh. Both approaches are used here, the results of
which are presented below.
Rates of marsh accretion were determined from a number of deposition stakes, the
location of which can be seen in Figure 5.13. For a number of reasons, however, the
short-term rates of marsh accretion provide limited data regarding temporal variability of
accretion rates. A large number of deposition stakes were disturbed or removed over the
winter period (as will be discussed later in this chapter), and a combination of time
constraints and poor field conditions prevented the collection of some data. Despite
these problems, accretion was measured at most stakes in August 1992, and limited data
were collected in June and November 1993.
Figures 5.14, 5.15, and 5.16 show the amount of accretion over periods of 3, 13 and 18
months respectively. Although the data for June and November 1993 are incomplete, a
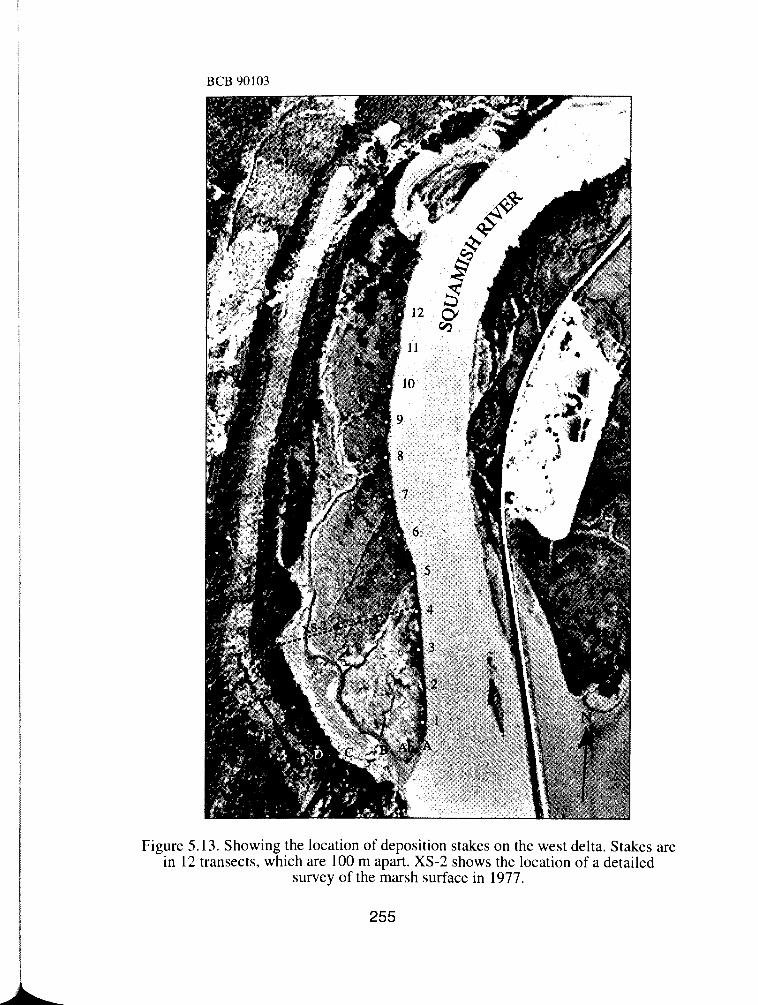
Figure 5 in 12
BCB 90103
.13. Showing the location of deposition stakes on the west delta. Stak transects, which are 100 m apart. XS-2 shows the location of a detail
survey of the marsh surface in 1977.
:es are led
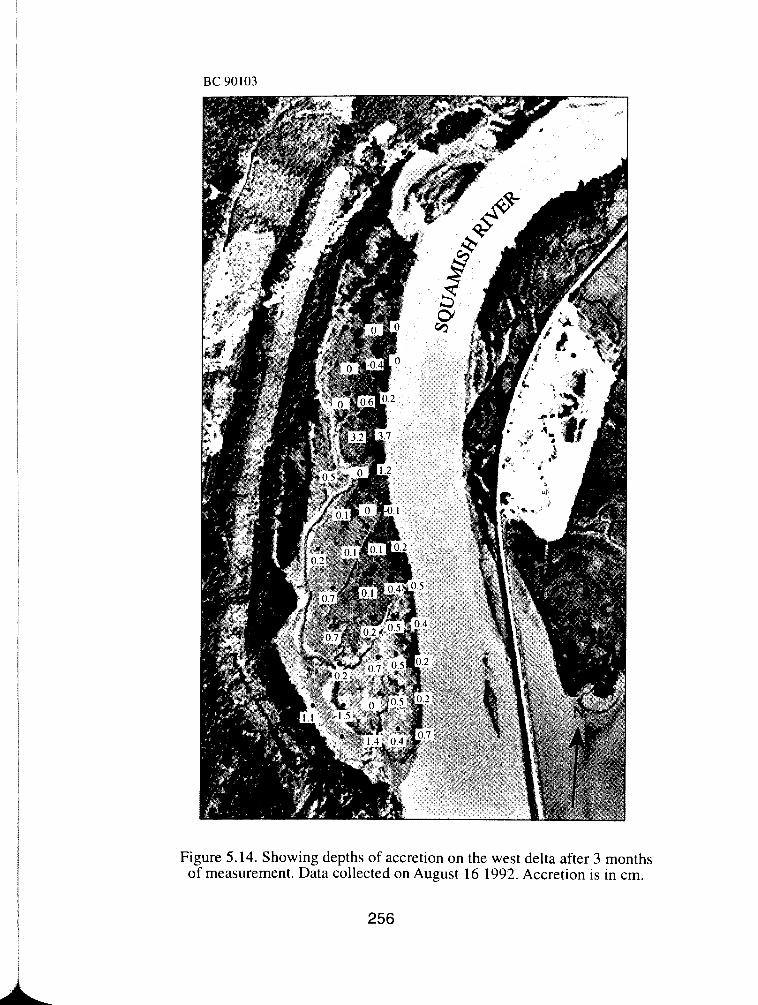
Figure 5.14. Showing depths of accretion on the west delta after 3 months of measurement. Data collected on August 16 1992. Accretion is in cm.
256

BCB 90103
Figure 5.15. Showing depths of accretion on the west delta after 13 months of measurement. Data collected on June 20 1993. Accretion is in cm.
257
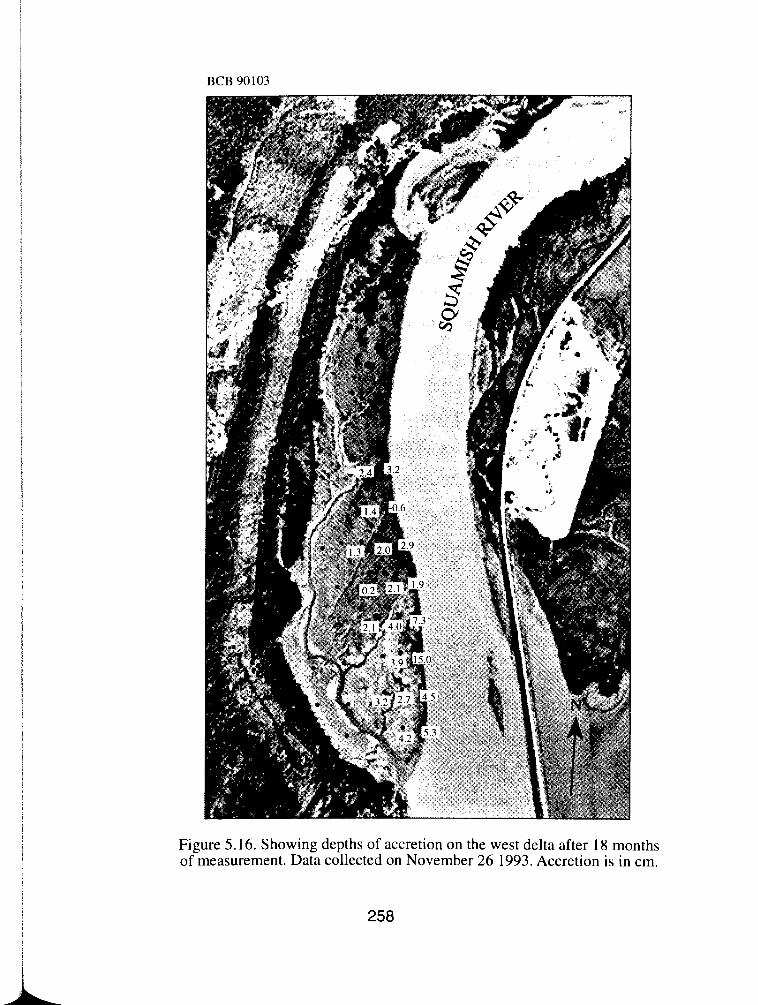
BCB 90103
Figure 5.16. Showing depths of accretion on the west delta after 18 monf of measurement. Data collected on November 26 1993. Accretion is in c.
258
number of observations may be made regarding accretion patterns. A number of trends
may be noted within each of the 3 data sets; these trends are discussed below.
August 1992 ( 3 months after placement): 1) Along 10 of the 12 transects, recorded
accretion is greater toward the centre of the marsh than at the marsh edge (at the river
bank). 2) In three cases (stakes D2, A7, and Abl 1) stakes record erosion, although in
two of these cases erosion is minimal. 3) In one specific location, stakes record
extremely high rates of accretion, but these seemingly anomalous values were very
localised. Stakes AS, A9, and Ab9 measure accretion up to 3.7 cm, yet surrounding
stakes measure little to no accretion.
June 1993 (13 months after placement): 1) From the limited data for this period it
appears that accretion rates are highest at the river bank (along 3 of the 4 transects), and
generally decrease toward the centre of the marsh. This is a reversal of the trend noted
after 3 months of accretion. 2) Over the 10 month period from August to June, the delta
has accreted rapidly, and at a much faster rate than initial results (in August 1992) would
have predicted.
November 93 (18 months after placement): 1) Along 6 of the 8 transects, accretion rates
decrease with distance away from the river bank. 2) As before, extremely high accretion
rates are recorded at a number of locations along the river bank (stakes A3 and A4), and
these rates decline rapidly with increasing distance inland. 3) Stake A7 recorded 0.7 cm
of erosion while surrounding stakes recorded considerable accretion. This pattern was
also noted at this location in August 1992, although erosion has increased since then.
From the observations above, one can say that west delta accretion is highly variable,
both spatially and temporally. Data from August 1992 and June 1993 indicate that
accretion is highly seasonal. During summer months, marsh accretion generally is
minimal, and tends to be greatest away from the channel bank. Over the winter months
of 1992 and 1993, accretion increases dramatically, and the location of maximum
accretion shifts toward Squamish River. These results indicate that Squamish west delta
accretes during the regular inundation by tides over the summer, and during the larger
winter flood events, but that winter deposition provides the dominant supply of sediment
required for the vertical accretion of the delta. In addition to this, the spatial variability
of accretion shows that different depositional processes operate within summer and
winter months. Over summer months, accretion takes place during combined high
discharge and high tide periods, when suspended sediment concentrations are greatest on
average. During winter months, sedimentation seems to be dominated by riverine
processes over marine because winter accretion data show a shift in the location of
maximum accretion toward the eastern marsh edge. This indicates that the river is the
dominant source of sediment, which is deposited from suspension as floodwaters pass
onto the smooth, largely unvegetated delta. The greater importance of winter over
summer accretion becomes more apparent with increasing proximity to the river, where
accretion rates generally are greatest over the 18 month period of study.
There is an obvious need for some caution with regard to these accretion data, because
of the inability to determine the true representativeness of the necessarily short
observation period. It is difficult to assess the importance of high magnitude events (of
either fluvial or marine origin) to tidal marsh sedimentation. However, the short-term
accretion data are in good accordance with the average annual sedimentation rate of
post-dyke (Facies D) deposits. If this short period of measurement reflects the true long-

term post-dyke pattern of west delta accretion, some important points arise regarding the
seasonality of accretion, and the changing nature of deposition from summer to winter
seasons. The depositional process in winter months is different in at least one important
respect - as most vegetation lies dead on the delta surface, it cannot promote the
deposition of fines. This process is often said to be responsible for the greater proportion
of marsh accretion. In Squamish delta, however, accretion data indicate that the majority
of marsh accretion occurs when the delta is essentially unvegetated. In addition to this
lack of vegetation, winter flood flow velocities are greater than those associated with the
freshet. Given these facts, it seems probable that depositional product will vary
seasonally. Without the presence of vegetation and marine organisms, which both
promote the deposition of fines (Hubbard and Stebbings, 1968), winter deposits should
be coarser than those deposited over summer months. Despite this likelihood,
examination of the internal character and variability of marsh rhythmite beds of Facies C
and D (chapter three) fails to record distinct seasonally induced differences.
Nevertheless, the rhythmite deposits of Facies D do display distinct and abrupt changes
in sediment character, though these clearly do not simply record seasonal changes.
These measurements of contemporary marsh accretion cannot be discussed in relation to
marsh rhythmite development prior to 1972. AS has already been discussed in chapter
three, flow constriction has resulted in an increased riverine influence on sedimentation
along lower reaches of Squamish estuary. This has increased both the size and amount of
sediment deposited on the west delta. As such, accretion data may only be discussed in
relation to the deposits of Facies D (treated in this chapter). Prior to dyke construction,
the majority of Facies C rhythmite bed accretion is believed to have occurred over
summer months.
The above discussion of spatial and temporal variability of accretion has implications for
the sampling of delta surficial sediments. Great care should be taken to ensure that
sediment sampling is both meaningful and provides accurate information required to
answer the research question. Before sampling is performed, it is essential to be aware of
any seasonality of deposition, and more importantly, aware of the average depths of
deposition at each sampling location. For example, Bell (1975) analysed surficial
sediment samples taken from a north-south transect along Squamish west delta. Samples
were collected to a depth of 2 cm at each site, and were analysed for sand, silt, and clay
content. There are a number of problems with this sampling technique. Firstly, the
results of size-analysis may vary greatly depending on the time of data collection.
Samples collected in August are likely to contain greater amounts of fines than samples
collected from the same site in March. Secondly, it is important to know the rate of
yearly accretion before sampling, to ensure that the sampling interval does not exceed
the depth of one years deposition. Stratigraphic analysis of marsh rhythrnites (chapter
three) indicates that at certain stages of marsh development, a depth of 2 cm may
represent up to 15 rhythmite marsh beds (15 years of deposition). The importance of this
fact will depend on the aim of sampling, but if the aim is to produce a sediment-size
distribution which is representative of the marsh unit, sampling must include the whole
depth of marsh deposits.
Sedimentologic Implications of Accretion Data
The contemporary short-term rates of west delta accretion may be used to test
conclusions drawn from stratigraphic analysis of the salt marsh facies. Figure 5.13
shows the location of a transect (XS-2) surveyed in detail by the Water Investigations
Branch of the Ministry of the Environment (Prank, 1977). This transect closely follows
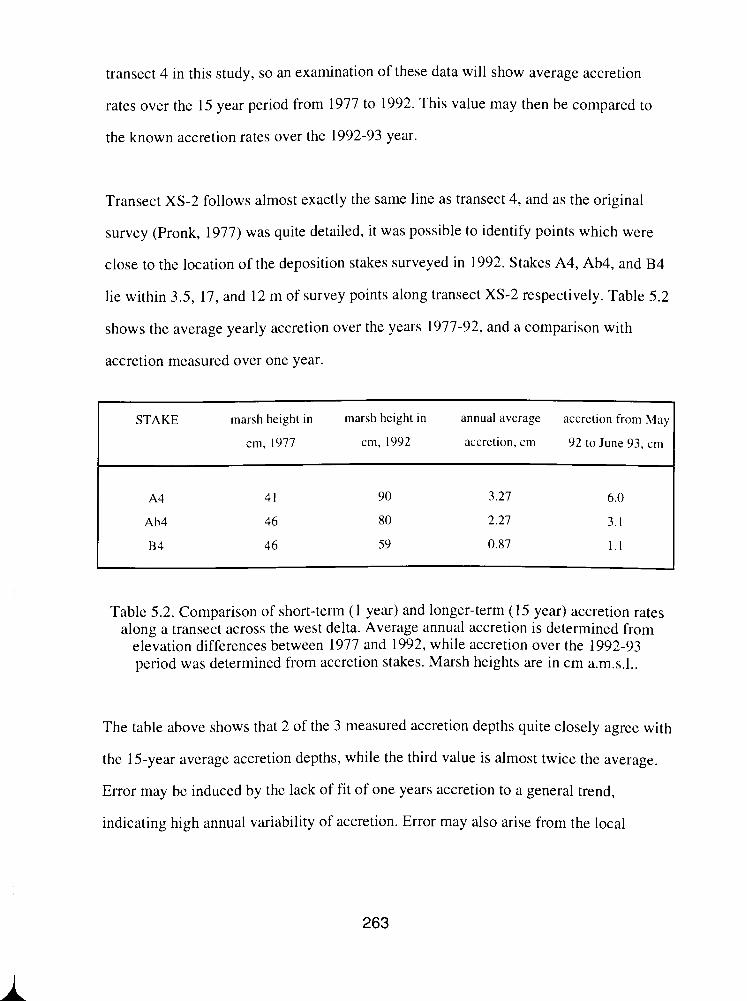
transect 4 in this study, so an examination of these data will show average accretion
rates over the 15 year period from 1977 to 1992. This value may then be compared to
the known accretion rates over the 1992-93 year.
Transect XS-2 follows almost exactly the same line as transect 4, and as the original
survey (Pro&, 1977) was quite detailed, it was possible to identify points which were
close to the location of the deposition stakes surveyed in 1992. Stakes A4, Ab4, and I34
lie within 3.5, 17, and 12 m of survey points along transect XS-2 respectively. Table 5.2
shows the average yearly accretion over the years 1977-92, and a comparison with
accretion measured over one year.
STAKE marsh height in marsh height in annual average accretion from Ma)
cm, 1977 cm, 1992 accretion, cm 92 to June 93, cnl
Table 5.2. Comparison of short-term (1 year) and longer-term (15 year) accretion rates along a transect across the west delta. Average annual accretion is determined from
elevation differences between 1977 and 1992, while accretion over the 1992-93 period was determined from accretion stakes. Marsh heights are in cm a.m.s.1..
The table above shows that 2 of the 3 measured accretion depths quite closely agree with
the 15-year average accretion depths, while the third value is almost twice the average.
Error may be induced by the lack of fit of one years accretion to a general trend,
indicating high annual variability of accretion. Error may also arise from the local
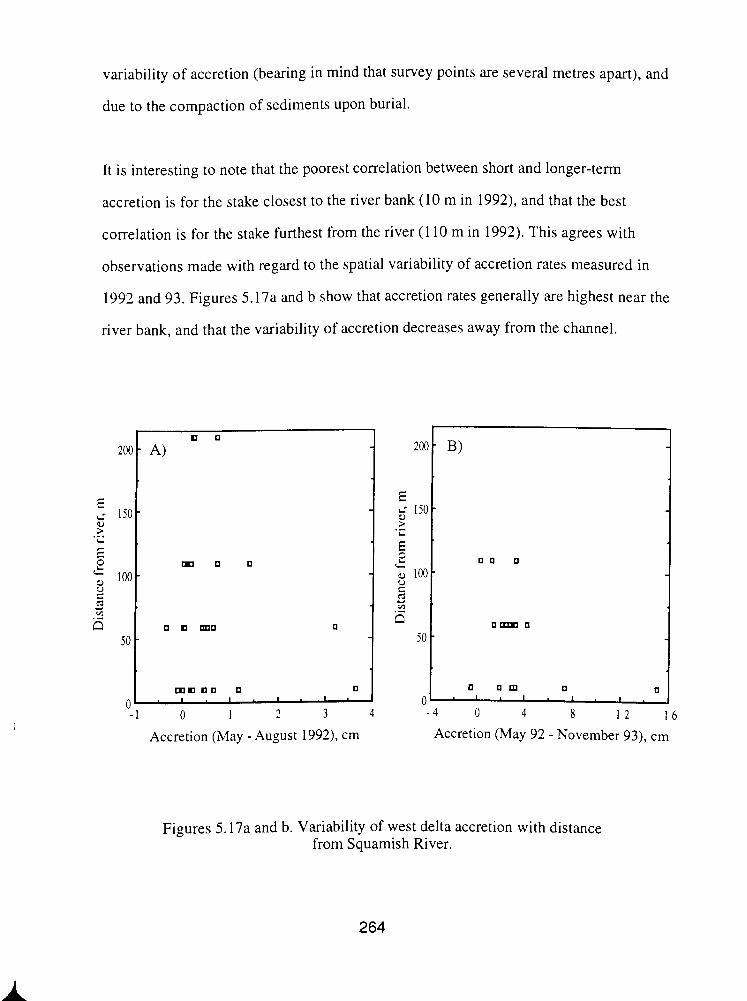
variability of accretion (bearing in mind that survey points are several metres apart), and
due to the compaction of sediments upon burial.
It is interesting to note that the poorest correlation between short and longer-term
accretion is for the stake closest to the river bank (10 m in 1992), and that the best
correlation is for the stake furthest from the river (1 10 m in 1992). This agrees with
observations made with regard to the spatial variability of accretion rates measured in
1992 and 93. Figures 5.17a and b show that accretion rates generally are highest near the
river bank, and that the variability of accretion decreases away from the channel.
Accretion (May - August 19921, cm Accretion (May 92 - November 93), cm
Figures 5.17a and b. Variability of west delta accretion with distance from Squamish River.
There is another possible explanation for the lack of fit of the 1992-93 accretion data to
the averaged values determined for accretion stakes A4 and Ab4. The 1977 survey along
transect XS-2 shows that around 86 m of bank retreat (along this transect line) have
occurred between 1977 and 1992. This means that over the past 15 years, the location of
accretion stake A4 has been getting closer to the main source of sediment supply to this
delta. Because of this, the rates of accretion at this site will have been increasing since
1977. This may explain the poor fit of the short and longer-term values of accretion.
This process is also likely to have led to some change in rates of accretion at all stakes,
although this change is expected to be less pronounced with increasing distance away
from Squamish River.
Model of Squamish Delta Growth
The purpose of this section is to draw comparisons between the lateral and vertical
growth of Squamish delta, and the stages of salt marsh development outlined by
Redfield (1972). Redfield undertook a detailed study of the development and
characteristics of a New England salt marsh. This landmark work has come to be
accepted as the blueprint model for salt marsh development for those systems which
experience rising sea-levels. The following sections describe the stages of salt marsh
development as observed by Redfield (1972), and a comparison with observations from
Squarnish delta. Discussion then focuses on the sedimentologic implications of different
stages of marsh development, with specific reference to Squamish delta stratigraphic
sequences.
Redfield's (1972) Model of Salt Marsh Development
Redfield stated that five distinct stages of salt marsh development may be distinguished,
which are related to the elevation of the marsh. These stages will fully develop where
the salt marsh is building onto a flat or nearly flat surface.
The first stage is that of colonization, which is the initial spread of marsh vegetation
onto previously unvegetated sand flats and bars. These intertidal sands will be preserved
as the "basemerzt" of inorganic deposits underlying peat. This colonization occurs by the
lateral spreading of the edge of vegetation by the spreading of rhizomes, and by seeding.
Seeding produces clumps of vegetation beyond the extent of full marsh cover, which
eventually spread and merge to form complete cover within a number of years. This
stage is followed by thejuvenile marsh stage, which is that of an even vegetation cover
which is dominated by a single species. These young marshes usually do not develop
distinctive drainage channels. This early marsh stage progresses into punne marsh,
which is prompted by local differences in marsh accretion. These differences create
localised depressions which are unable to drain fully at low tide. This poor drainage
creates small pools of saline water which soon kill off patches of vegetation. Over time,
these pannes fill with soft fine material containing little organic matter. This stage of
marsh next develops in to slough marsh, where the vegetated marsh accretes at a faster
rate than the pannes, creating raised vegetated surfaces surrounding lower ponds. The
final stage of development is the transition to high marsh. During this stage, pannes
become drier, allowing the invasion of marsh vegetation. With increased marsh
maturity, all pannes may disappear, leaving a relatively flat fully-vegetated delta surface.
The above model is applicable to marshes developing on intertidal sands with low relief.
Where marshes develop on sloping surfaces, however, sediments are better drained, and
fewer pools of water remain at low tide. This results in a marsh surface which is less
frequently broken by panne formation.
Redfield states that the vegetated marsh will develop a characteristic stratigraphy related
to the seasonality of accretion and vegetation growth. This stratigraphy is revealed in
eroding marsh banks, and is described as: "....layers offibrous material alternating wit11
layers of nearly pure sand and silt." (Redfield, 1972 p. 223). The layers of fibrous
material are thought by Redfield to originate during summer months from the algal mat
which grows on the surface of the delta, and from the concentration of roots at this level.
The dominantly inorganic layers are thought to be deposited during winter storm events,
when marsh vegetation has died-off. This interpretation differs markedly from that made
within this study. Redfield suggests that each pair of organic and inorganic layers
represents one years vertical growth of the delta, an interpretation which agrees with the
conclusions of this study.
Applicability of Redfield's Model to Squamish Delta
Comparison of the development of Squamish delta with the model described by Redfield
(1972) has been undertaken by an examination of contemporary marsh environments,
and by careful study of aerial photographs dating back to 1957. In general, the model
does appear to fit the example of Squamish marsh growth. The specific stages of
development of Squamish marshes (with reference to Redfield's observations) are
discussed below.
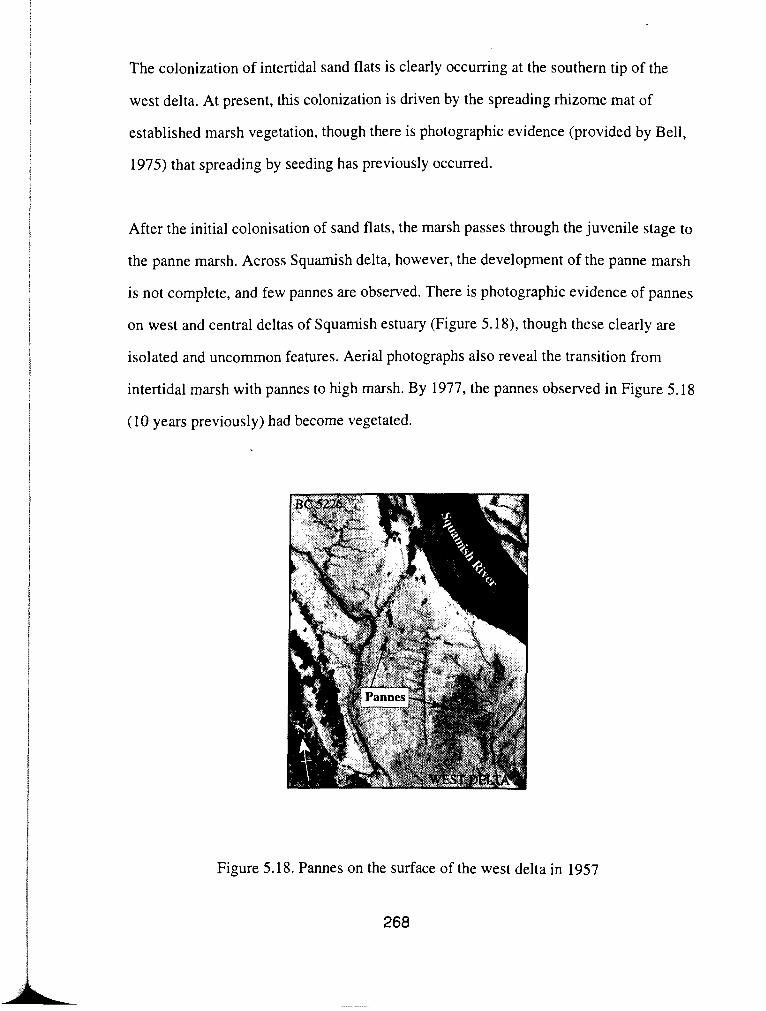
The colonization of intertidal sand flats is clearly occurring at the southern tip of the
west delta. At present, this colonization is driven by the spreading rhizome mat of
established marsh vegetation, though there is photographic evidence (provided by Bell,
1975) that spreading by seeding has previously occurred.
After the initial colonisation of sand flats, the marsh passes through the juvenile stage to
the panne marsh. Across Squamish delta, however, the development of the panne marsh
is not complete, and few pannes are observed. There is photographc evidence of pannes
on west and central deltas of Squamish estuary (Figure 5.18), though these clearly are
isolated and uncommon features. Aerial photographs also reveal the transition from
intertidal marsh with pannes to high marsh. By 1977, the pannes observed in Figure 5.18
(10 years previously) had become vegetated.
Figure 5.18. Pannes on the surface of the west delta in 1957
268
The small number of pannes observed within Squamish marshes is to be expected, and
was predicted by Redfield (1972). The marshes in this environment are spreading onto
intertidal sandflats and bars which are far from flat. The surface relief of this sandy
basement is reflected in the surface relief of the salt marsh (at least in the early stages of
development), which is easily drained at low tide. For this reason, pannes are not
dominant features on Squamish marshes, which never develop to the slough marsh
phase.
From this discussion, it can be seen that growth of marshes in Squamish estuary quite
closely agrees with the development described by Redfield (1972). The Redfield model
is limited, however, in that it does not describe the final stage of marsh development -
that from high marsh to floodplain. This is a particularly important transition within
Squamish estuary, where accretion rates exceed the rate of compaction, and short-term
(hundreds of years) sea-level rise is essentially zero. The change from delta to floodplain
is not an immediate process, but initially a gradual one which will produce a transitional
sequence. The nature of this stratigraphic sequence has been discussed in chapter three
as the transition from Facies C to E. This discussion is only applicable to those marshes
which become increasingly influenced by riverine depositional processes over time, such
as those which develop within prograding delta systems.
Sedimentologic Implications of Marsh Development
While Redfield (1972) did describe different stages of marsh development, he did not
fully discuss the stratigraphic implications of these different stages. This section is an
attempt to describe the characteristic sedimentologic attributes of each of the stages
operating in Squamish marshes. This will be related to the results of stratigraphic
analyses of delta sediments presented in chapter three.
During the early colonisation of sand flats, vegetation cover is too sparse to have any
effect upon flow processes, and as such, on sedimentation processes. After colonisation,
however, the growth of Spartina and other marsh vegetation is rapid, growing to
maturity within 5 years (Redfield, 1972). As this vegetation becomes more established
and taller, it is able to modify flow, largely through the baffling effect of stems. This
flow modification promotes the deposition of fines, which is aided by the removal of
fines from the water body as material adheres to the stems of plants. Some of this
material will inevitably reach the delta surface during low tide. The processes described
can clearly be seen in stratigraphic sequence. The colonisation of intertidal sands
produces a gradual transition from the basement sands to the overlying marsh rhythmites
(Facies B to C). Toward the bottom of this transition, no change in grain-size is
observed, but traces of organics in very fine layers can be seen. Further up-section
(increasing maturity of the marsh), the amount of organics increases within clear parallel
bands, and grain-size decreases. The gradual decrease in grain-size continues with
decreasing depth in section, until the layers become the distinctive silty marsh
rhythmites of Facies C. This whole transition takes place over a vertical distance of a
few cm.
During the colonisation process, the formation of small islands or patches of vegetation
through seeding is an important one, as it can determine the internal characteristics of
marsh rhythmite bedding. Redfield (1972) noted that the islands of vegetation appeared
on mounds of material elevated above the intertidal sandflats, produced by the
promotion of deposition by the vegetation itself. When these vegetated patches become
fully incorporated into the marsh cover, the marsh bedding will retain an uneven form
characterised by gentle undulations. As fine material is continually draped over this
undulating surface, the form of that surface will be retained (to some degree) in
overlying beds. This is partly responsible for the wavy, nodular or 'crinkly' nature of
beds reported by van Straaten (1954) and Martini (199 1).
As is noted above, the panne marsh is not well developed in Squamish estuary, but a
number of isolated pannes are visible on all delta surfaces. As pannes infill and become
vegetated, a unique sedimentary deposit will be preserved in the marsh sediments. Relict
panne deposits will be preserved as isolated lenses of material which contain little to no
organics, and which likely will be finer than surrounding sediments. Panne deposits will
display very fine bedding (much thinner than surrounding marsh rhythmites) which
commonly is undisturbed by bioturbators due to the anoxic conditions in the pools (Yea
and Risk, 1981). Panne deposits will be capped by marsh rhythmite beds as vegetation
gradually colonises the sediment surface.
While such depositional features can be expected in isolated locations throughout all
three deltas in Squamish estuary, none were found in section. This should not be
unexpected, for even though marsh rhythmite deposits are exposed along a 3 200 m
reach of the lower Squamish River, bank sections only represent a two-dimensional
view of a single line through delta sediments.
Specific Deltaic Depositional Process and Product: Rafted Deposits
During the collection of accretion data on the west delta in the winter of 1993, a number
of large stones were found on the surface of the west delta. These large deposits were
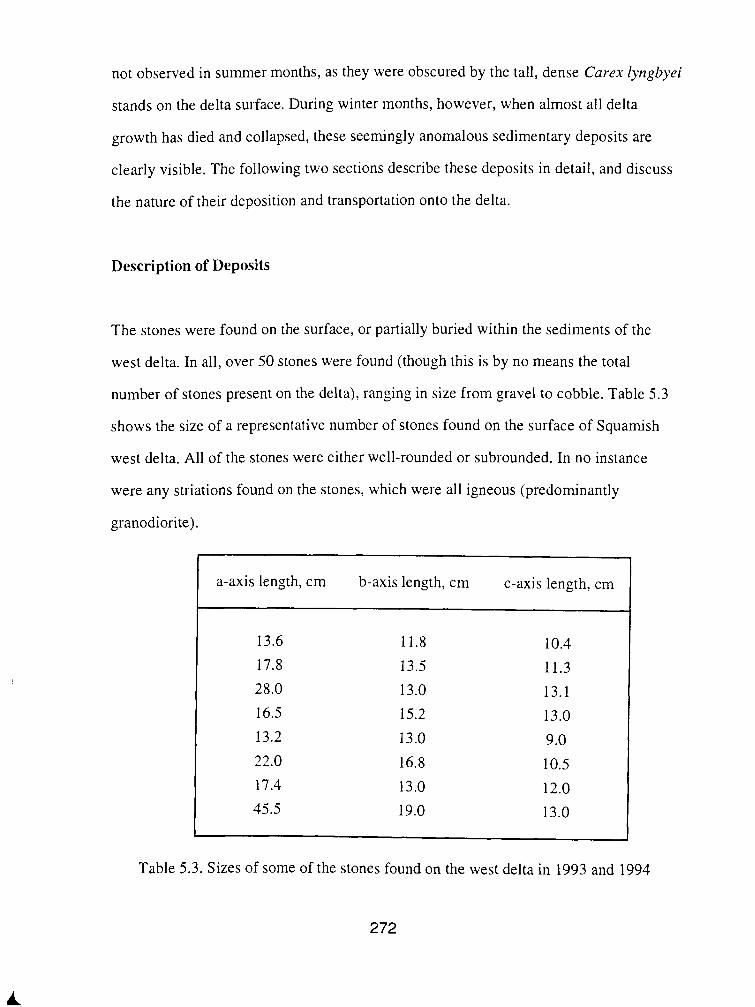
not observed in summer months, as they were obscured by the tall, dense Carex ljlzgbyei
stands on the delta surface. During winter months, however, when almost all delta
growth has died and collapsed, these seemingly anomalous sedimentary deposits are
clearly visible. The following two sections describe these deposits in detail, and discuss
the nature of their deposition and transportation onto the delta.
Description of Deposits
The stones were found on the surface, or partially buried within the sediments of the
west delta. In all, over 50 stones were found (though this is by no means the total
number of stones present on the delta), ranging in size from gravel to cobble. Table 5.3
shows the size of a representative number of stones found on the surface of Squarnish
west delta. All of the stones were either well-rounded or subrounded. In no instance
were any striations found on the stones, which were all igneous (predominantly
granodiorite).
a-axis length, cm b-axis length, cm c-axis length, cm
Table 5.3. Sizes of some of the stones found on the west delta in 1993 and 1994
272
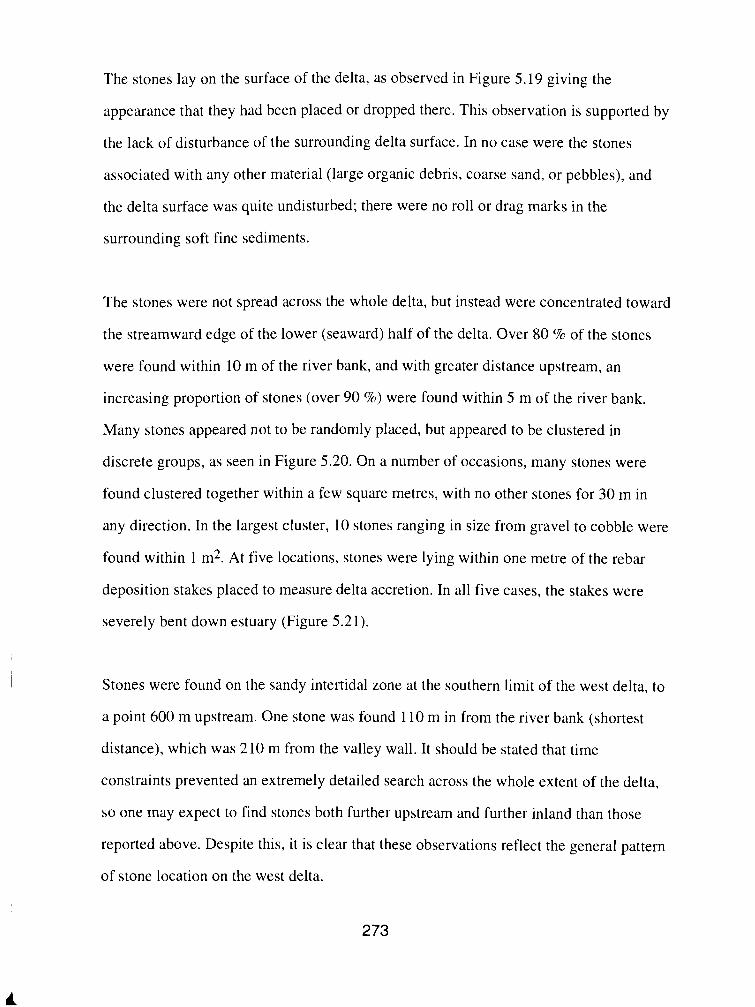
The stones lay on the surface of the delta, as observed in Figure 5.19 giving the
appearance that they had been placed or dropped there. This observation is supported by
the lack of disturbance of the surrounding delta surface. In no case were the stones
associated with any other material (large organic debris, coarse sand, or pebbles), and
the delta surface was quite undisturbed; there were no roll or drag marks in the
surrounding soft fine sediments.
The stones were not spread across the whole delta, but instead were concentrated toward
the streamward edge of the lower (seaward) half of the delta. Over 80 % of the stones
were found within 10 m of the river bank, and with greater distance upstream, an
increasing proportion of stones (over 90 %) were found within 5 m of the river bank.
Many stones appeared not to be randomly placed, but appeared to be clustered in
discrete groups, as seen in Figure 5.20. On a number of occasions, many stones were
found clustered together within a few square metres, with no other stones for 30 m in
any direction. In the largest cluster, 10 stones ranging in size from gravel to cobble were
found within 1 m2. At five locations, stones were lying within one metre of the rebar
deposition stakes placed to measure delta accretion. In all five cases, the stakes were
severely bent down estuary (Figure 5.21).
Stones were found on the sandy intertidal zone at the southern limit of the west delta, to
a point 600 m upstream. One stone was found 110 m in from the river bank (shortest
distance), which was 2 10 m from the valley wall. It should be stated that time
constraints prevented an extremely detailed search across the whole extent of the delta,
so one may expect to find stones both further upstream and further inland than those
reported above. Despite this, it is clear that these observations reflect the general pattern
of stone location on the west delta.
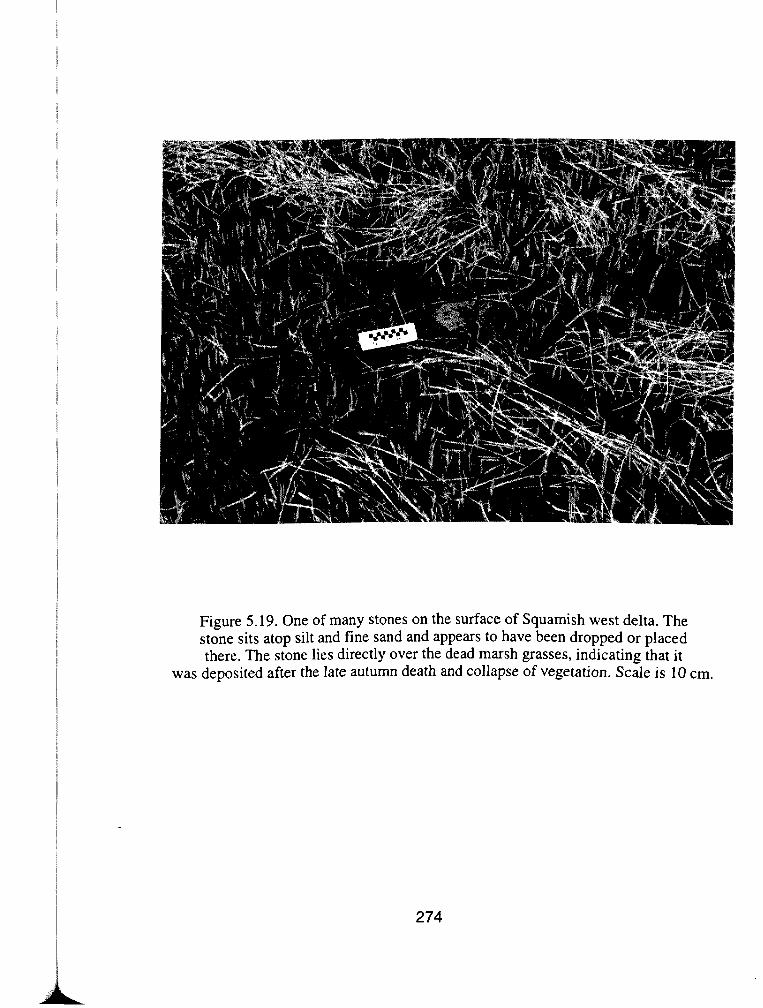
Figure 5.19. One of many stones on the surface of Squamish west delta. The stone sits atop silt and fine sand and appears to have been dropped or placed there. The stone lies directly over the dead marsh grasses, indicating that it
was deposited after the late autumn death and collapse of vegetation. Scde is 10 cm.
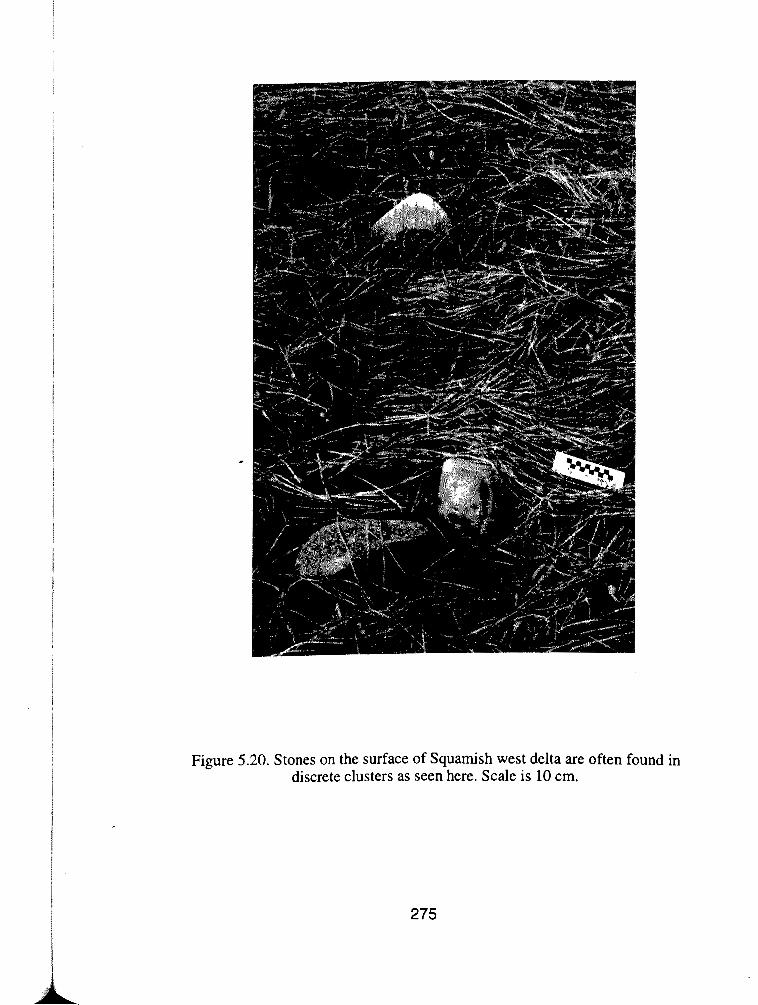
Figure 5.20. Stones on the surface of Squamish west delta are often found in discrete clusters as seen here. Scale is 10 cm.
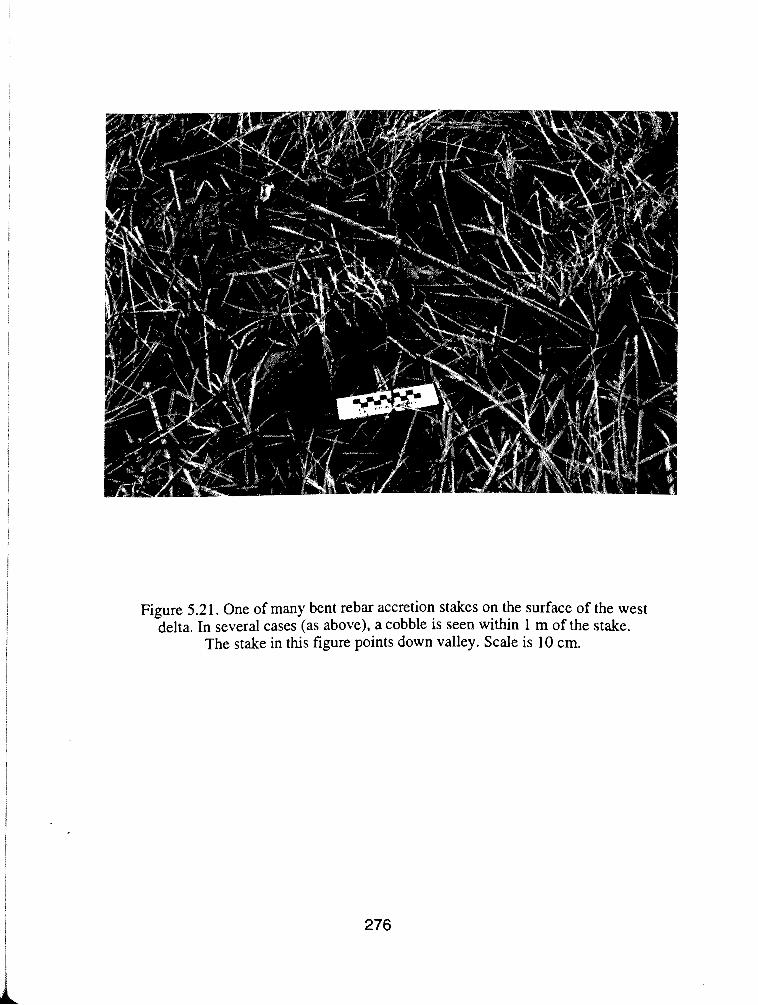
Figure 5.21. One of many bent rebar accretion stakes on the surface of the west delta. In several cases (as above), a cobble is seen within 1 m of the stake.
The stake in this figure points down valley. Scale is 10 cm.
Interpretation
There are a number of possible processes which could have deposited this large material
on the delta. Each of these will be discussed in turn.
One possible explanation is that the stones originated on the steep-sided valley wall, and
were transported to their present position by a rockfall. However, if this material were
brought to rest on the delta by this process, the number of stones would increase toward
the back of the delta (the western edge), and some form of debris cone or lobate form
may be expected to develop. In addition to this, the stones do not display the
characteristic angular and fractured appearance of rockfall debris, and there are no roll
marks visible on the delta surface. For these reasons the stones on the west delta cannot
have been transported from the valley-side during a rockfall event.
A more plausible explanation for the origin of these stones is that they were transported
onto the delta surface during a large flood. There are several pieces of evidence which
seem to substantiate this theory. Firstly, all stones display rounded or well-rounded
forms characteristic of fluvial origin. Secondly, the location and concentration of stones
toward the river bank clearly indicates that the river was the source of this coarse
sediment. Despite these points, however, there are several observations which are
extremely difficult to explain with this theory. For example, if the stones were deposited
during a large flood, why are they not present by the bank along the entire reach of the
delta? One would expect to find a number of stones along the upstream bank of the west
delta, as the channel thalweg crosses over and impinges on the delta at this location.
Perhaps the most convincing evidence against the flood mechanism is the size of the
material transported. While it is certainly possible for Squamish River to transport
material of such a size, it is not possible that the velocities required to keep the stones in
suspension could have been maintained over the delta surface. Some of the material
located within a few metres of the river bank could have been deposited there from the
fast within-channel flows. However, it is not possible that flow velocities over the delta
were great enough to transport a cobble 110 m from the river. Flow velocities of this
magnitude would have been sufficient to induce considerable erosion of delta sediments,
yet such erosion was neither observed nor recorded. Even if the delta surface sediments
were cohesive and compact enough to prevent their erosion, such flows would have
transported very coarse sand, pebbles and gravel onto the delta, along with the larger
material. This sand would have been deposited as crevasse splays or extensive sand
sheets. Not only were such large sand deposits not observed, there was a clear gap in
sediment-size distributions of delta sediments. Other than the recorded gravels and
cobbles, the coarsest material visible either on the delta surface or in section is medium
to coarse-grained sand.
For the reasons stated above, it is felt that direct fluvial action could not be responsible
for the deposition of the greater number of stones on the delta, though it is possible that
some of the smaller stones within one or two metres of the bank could have been
deposited in this fashion. Despite this statement, it seems clear from the character of the
stones, and particularly from their location, that the deposition of this material was in
some way controlled by fluvial action. This indicates that the river is the source of the
material but it is not strictly the transporting agent, or directly responsible for the
deposition of these stones.
This raises the possibility that the stones were rafted into the delta environment by river
ice. Once over the delta, coarse-grained sediment could have either rained-out, or the ice
could have become stranded on the delta, releasing any sediment held within it upon
melt. This latter process is an extremely common occurrence in more northerly fjord
deltas (Gilbert, 1978, 1983). Many of the observations made in the field seem to
substantiate this theory. This process would certainly explain how such large material
came to rest so far inland, and would explain why the stones so closely resemble
dropstones sitting atop much finer sediments.
Once again, however, it must be stated that despite these observed similarities between
the proposed mechanism of deposition and the deposits, ice has to be ruled-out as the
origin of the stones on the west delta. The simple reason for this is that Squamish
climate does not generate low enough temperatures to produce ice flows. Temperatures
certainly drop enough to prevent the measurement of stage (Water Survey of Canada),
but this is merely due to the failure of stage recorders (freezing) or the local build-up of
ice at the bank. It is not possible that this ice could reach the size necessary to support
and effectively transport cobbles.
Having established which processes are not considered responsible for the deposition of
stones on the west delta, it is now possible to describe the depositional process which is
believed to be occurring.
Proposed Mechanism of Deposition
Transportation of Stones onto the Delta
It is proposed that the coarse material is transported onto the delta by large floating
debris - trees and root wads. This material may be held within the soil mass in the root
wad, or more commonly, is held in place by the roots themselves. The stones are not
thought to be transported into the existing root system, but become incorporated as the
tree roots grow into the soil. Therefore, the existence of stones in tree roots is dependent
on tree maturity (root number and size), and more importantly, on the presence of stones
within the soil in which the tree becomes established. Presumably, this process may also
be species specific, depending on the characteristics of root development (depth and
density of roots).
When these trees fall, become eroded or washed out, the roots pull up the material held
within them. If the tree enters a river course then the finer material will become washed
out quite quickly, but larger material may be more effectively trapped. This material
then floats downstream within the root system of the transporting agent. Studies by Fritz
and Harrison (1985) have shown that stones may remain trapped within roots even
during very high energy flows. These authors observed stones held in the root systems
of trees transported by highly turbid flows produced by the March 1982 eruption of
Mount St. Helens (Figure 5.22). A number of these trees had been sheared by the force
of the volcanic blast.
Trees (and any sediment they may be carrying) are transported downstream during
floods. These trees are mobilised if bank erosion occurs, or as flow velocity and stage
become great enough to shift trees caught on channel bars. This process may occur at
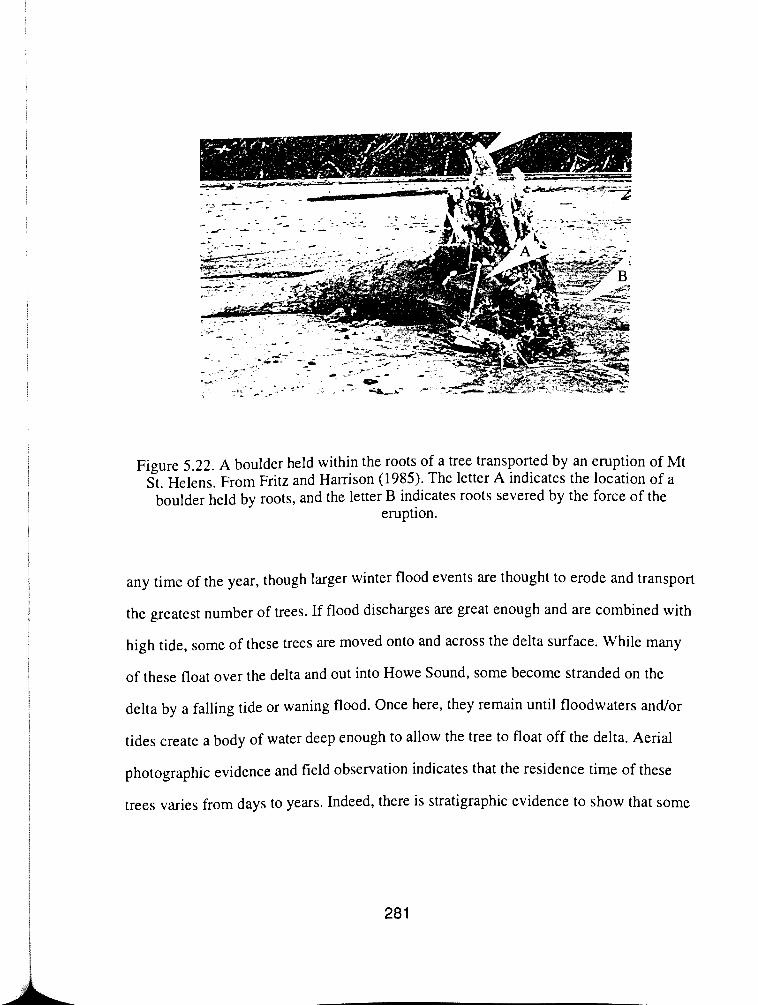
Figure 5.22. A boulder held within the roots of a tree transported by an eruption of Mt St. Helens, From Fritz and Harrison (1985). The letter A indicates the location of a
boulder held by roots, and the letter B indicates roots severed by the force of the eruption.
any time of the year, though larger winter flood events are thought to erode and transport
the greatest number of trees. If flood discharges are great enough and are combined with
high tide, some of these trees are moved onto and across the delta surface. While many
of these float over the delta and out into Howe Sound, some become stranded on the
delta by a falling tide or waning flood. Once here, they remain until floodwaters and/or
tides create a body of water deep enough to allow the tree to float off the delta. Aerial
photographic evidence and field observation indicates that the residence time of these
trees varies from days to years. Indeed, there is stratigraphic evidence to show that some
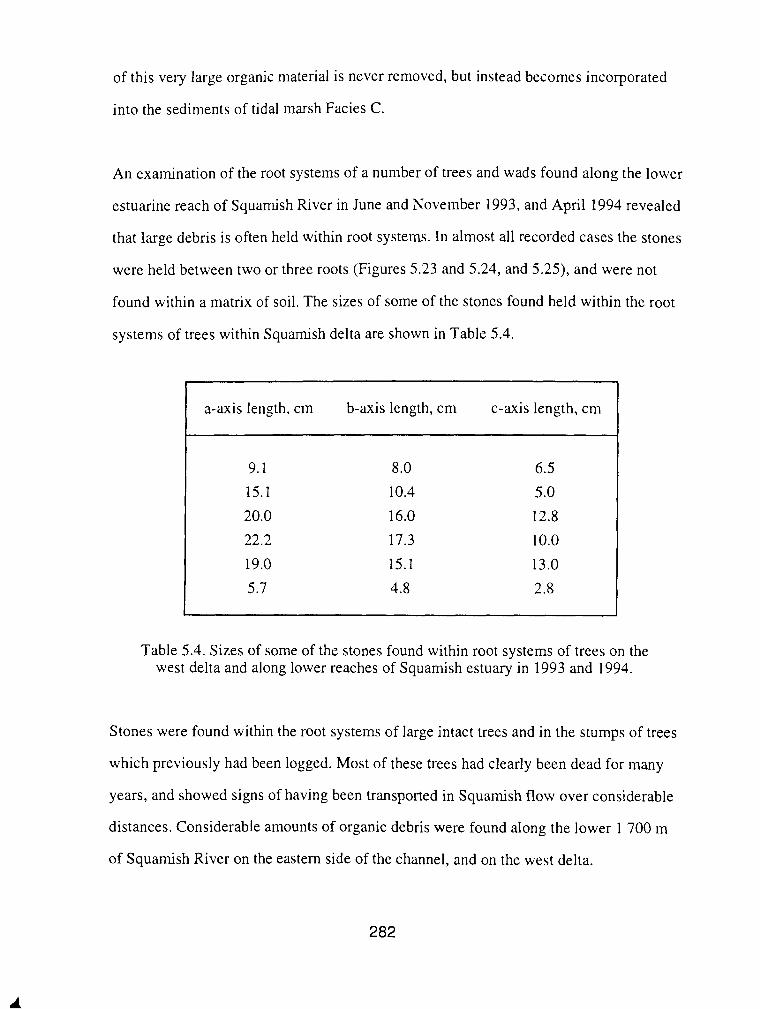
of this very large organic material is never removed, but instead becomes incorporated
into the sediments of tidal marsh Facies C.
An examination of the root systems of a number of trees and wads found along the lower
estuarine reach of Squamish River in June and November 1993, and April 1994 revealed
that large debris is often held within root systems. In almost all recorded cases the stones
were held between two or three roots (Figures 5.23 and 5.24, and 5.25), and were not
found within a matrix of soil. The sizes of some of the stones found held within the root
systems of trees within Squamish delta are shown in Table 5.4.
a-axis length, cm b-axis length, cm c-axis length, cm
Table 5.4. Sizes of some of the stones found within root systems of trees on the west delta and along lower reaches of Squamish estuary in 1993 and 1994.
Stones were found within the root systems of large intact trees and in the stumps of trees
which previously had been logged. Most of these trees had clearly been dead for many
years, and showed signs of having been transported in Squamish flow over considerable
distances. Considerable amounts of organic debris were found along the lower 1 700 m
of Squamish River on the eastern side of the channel, and on the west delta.
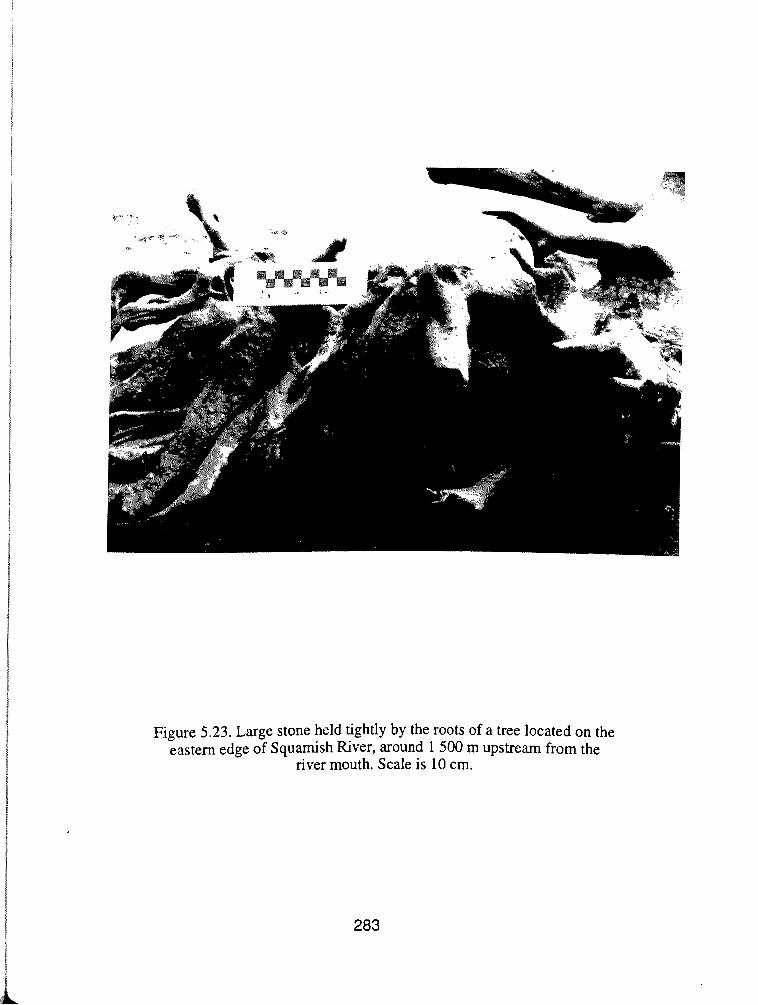
Figure 5.23. Large stone held tightly by the roots of a tree located on the eastem edge of Squamish River, around 1 500 m upstream from the
river mouth. Scale is 10 cm.
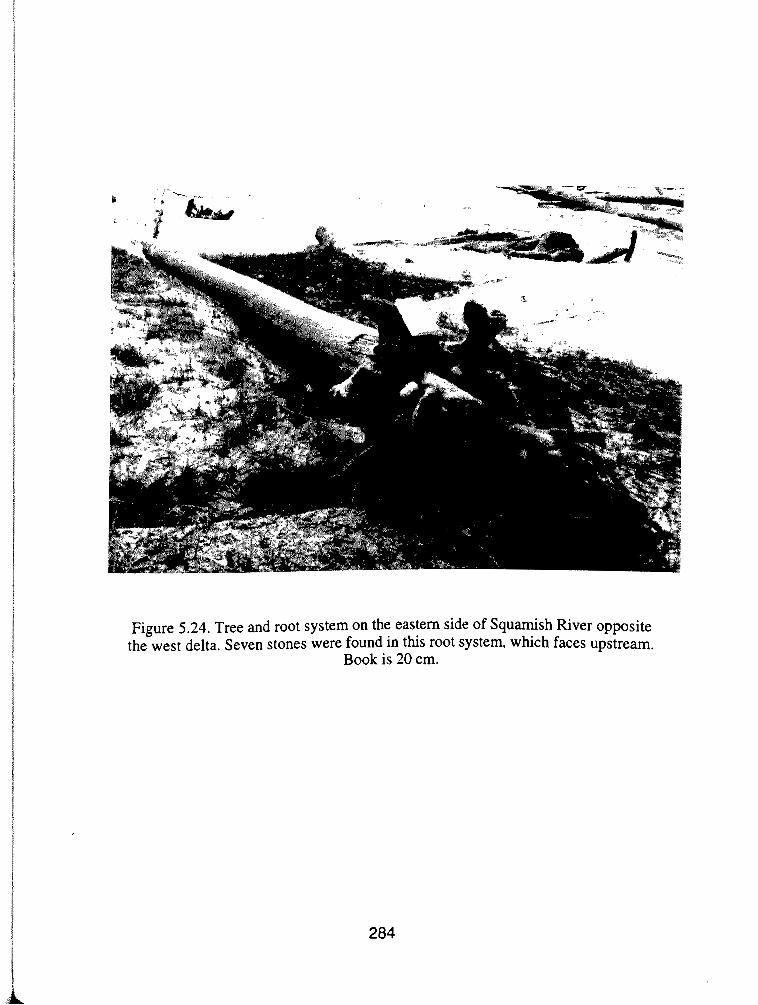
Figure 5.24. Tree and root system on the eastern side of Squamish River opposite the west delta. Seven stones were found in this root system, which faces upstream.
Book is 20 cm.
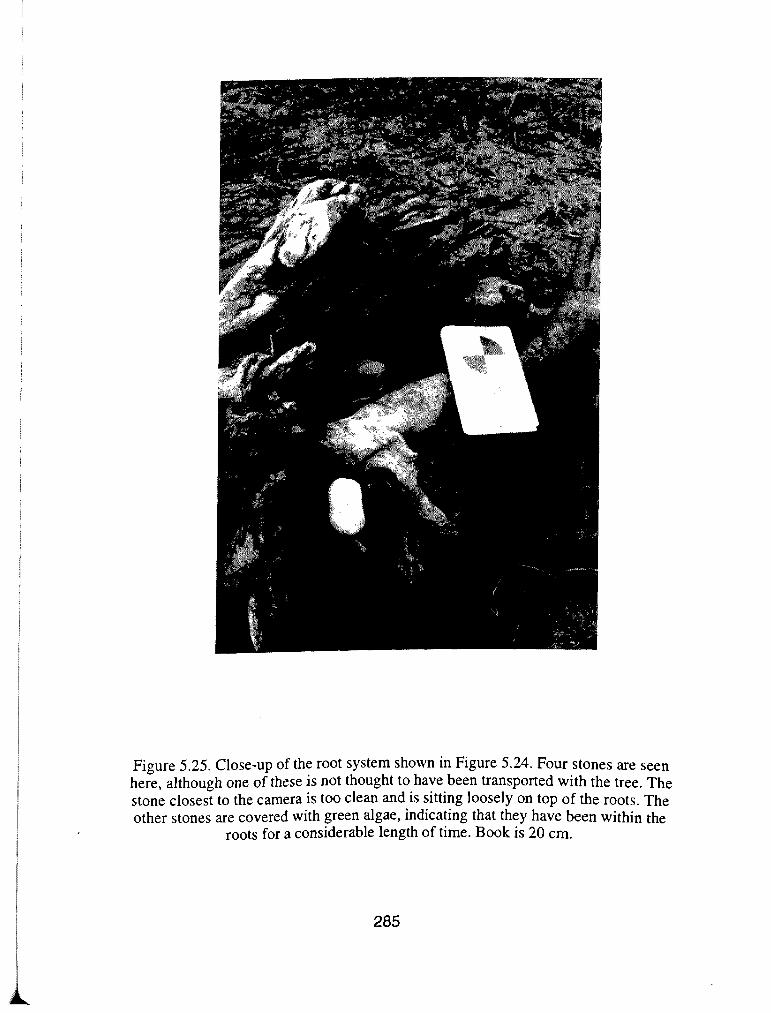
Figure 5.25. Close-up of the root system shown in Figure 5.24. Four stones are seen here, although one of these is not thought to have been transported with the tree. The stone closest to the camera is too clean and is sitting loosely on top of the roots. The other stones are covered with green algae, indicating that they have been within the
roots for a considerable length of time. Book is 20 cm.
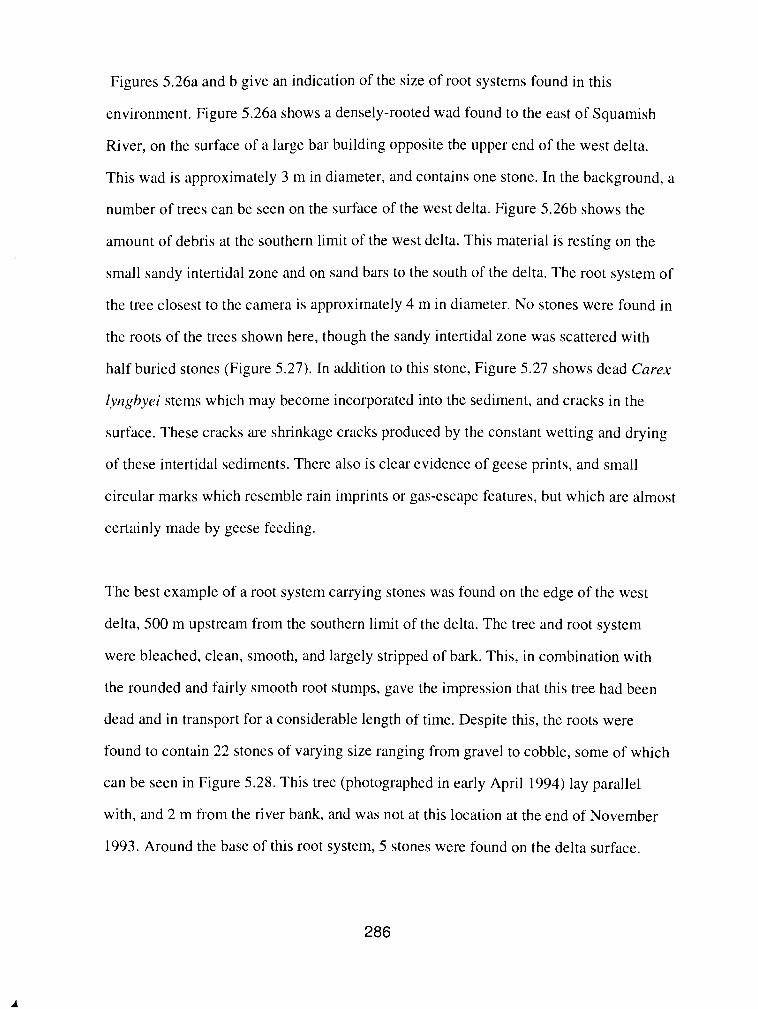
Figures 5.26a and b give an indication of the size of root systems found in this
environment. Figure 5.26a shows a densely-rooted wad found to the east of Squamish
River, on the surface of a large bar building opposite the upper end of the west delta.
This wad is approximately 3 m in diameter, and contains one stone. In the background, a
number of trees can be seen on the surface of the west delta. Figure 5.26b shows the
amount of debris at the southern limit of the west delta. This material is resting on the
small sandy intertidal zone and on sand bars to the south of the delta. The root system of
the tree closest to the camera is approximately 4 m in diameter. No stones were found in
the roots of the trees shown here, though the sandy intertidal zone was scattered with
half buried stones (Figure 5.27). In addition to this stone, Figure 5.27 shows dead Carex
lyngbyei stems which may become incorporated into the sediment, and cracks in the
surface. These cracks are shrinkage cracks produced by the constant wetting and drying
of these intertidal sediments. There also is clear evidence of geese prints, and small
circular marks which resemble rain imprints or gas-escape features, but which are almost
certainly made by geese feeding.
The best example of a root system carrying stones was found on the edge of the west
delta, 500 m upstream from the southern limit of the delta. The tree and root system
were bleached, clean, smooth, and largely stripped of bark. This, in combination with
the rounded and fairly smooth root stumps, gave the impression that this tree had been
dead and in transport for a considerable length of time. Despite this, the roots were
found to contain 22 stones of varying size ranging from gravel to cobble, some of which
can be seen in Figure 5.28. This tree (photographed in early April 1994) lay parallel
with, and 2 m from the river bank, and was not at this location at the end of November
1993. Around the base of this root system, 5 stones were found on the delta surface.
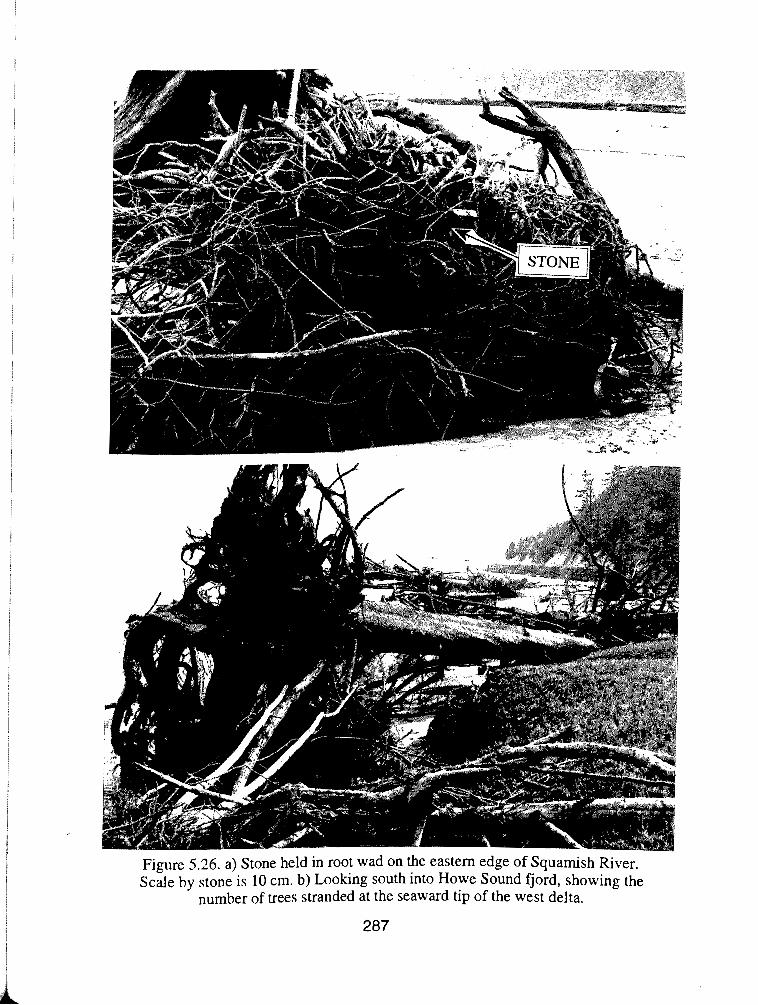
Figure 5.26. a) Stone held in root wad on the eastern edge ot Squarnish River. Scale by stone is 10 cm. b) Looking south into Howe Sound fjord, showing the
number of trees stranded at the seaward tip of the west delta.
Figure 5.27. Close-up of stone partially buried in the intertidal sands at the southem tip of the west delta. Numerous other markings are present in
the sands, and these are described in the text. Scale is 10 cm.
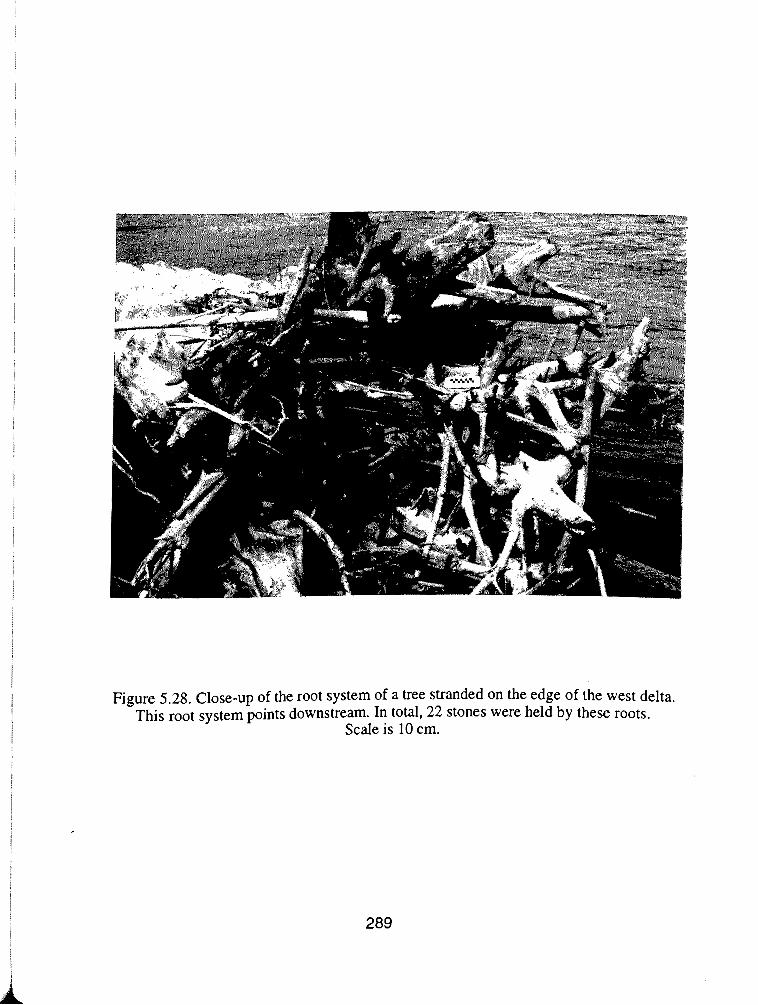
Figure 5.28. Close-up of the root system of a tree stranded on the edge of the west delta. This root system points downstream. In total, 22 stones were held by these roots.
Scale is 10 cm.
Removal of Stones from Root Systems
It has already been established that once these trees and root wads become stranded on
the delta surface, they may remain over a number of years. Over this period of time, a
process or number of processes operate to remove the stones from the roots. It is not
thought, however, that currents (either tidal or riverine) would generate the turbulence
required to remove the stones. Instead, it is felt that the stones are loosened and removed
by the action of waves.
As has already been discussed in chapter one, Howe Sound fjord and estuary is highly
influenced by wind action which can act to increase the wave height of tide-generated
surface instabilities. These waves may spill onto and over delta surfaces if the delta is
inundated by high tide or flood. Figure 5.29, taken on 3 1 December 1980, shows waves
on the surface of the central delta. In this particular example, however, the waves are
travelling in a soc,thwesterly direction (down estuary). The direction of wave travel most
likely is determined by wind conditions (whether sea-breeze or land-breeze conditions
prevail), which may vary throughout the course of one day. If the delta is partially
inundated, these waves will strike the trees and their root systems with some force. On a
number of occasions, deep (7 cm) scour marks and imprints were observed around the
base of stranded root wads. These clearly indicate that the trees had been moved (by up
to 1 m) a number of times since their original placement on the delta. While it cannot be
proven (without direct observation) that these objects were moved by wave action,
waves are the only action thought powerful enough to shift objects of such size. It
should also be noted that scour marks indicated that the trees had moved upstream from
their original locations. Presumably, this process was aided by the decrease in downward
pressure exerted on the delta by the partial floating of the trees in standing water.
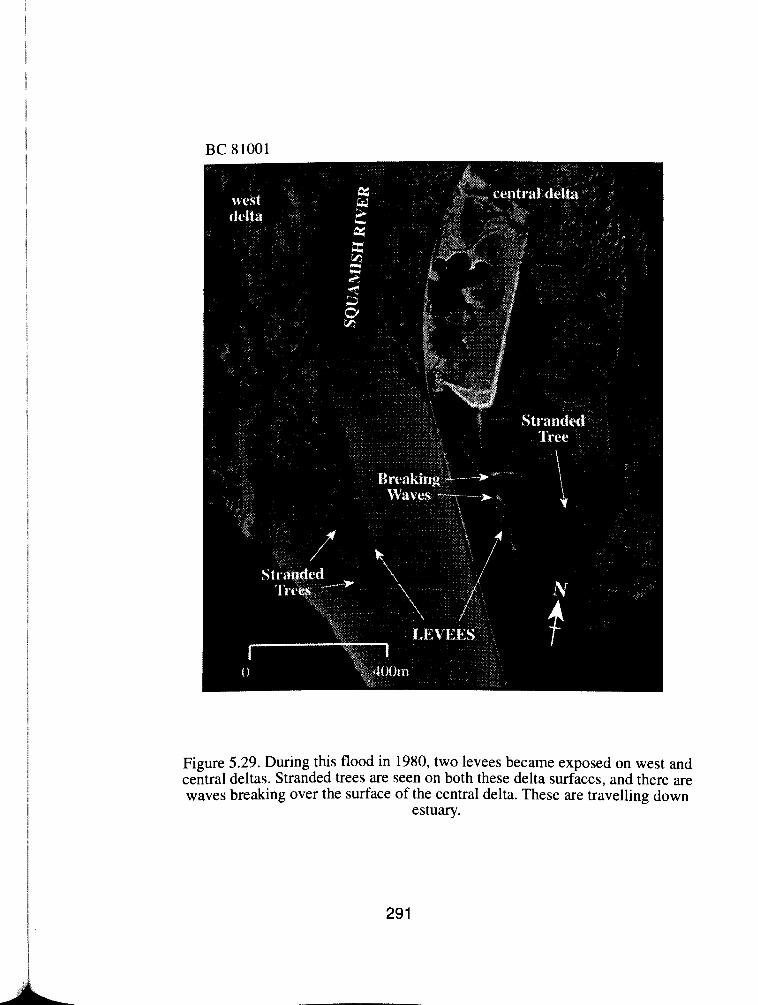
Figure 5.29. During this flood in 1980, two levees became exposed on west and central deltas. Stranded trees are seen on both these delta surfaces, and there are waves brealung over the surface of the central delta. These are travelling down
estuary.
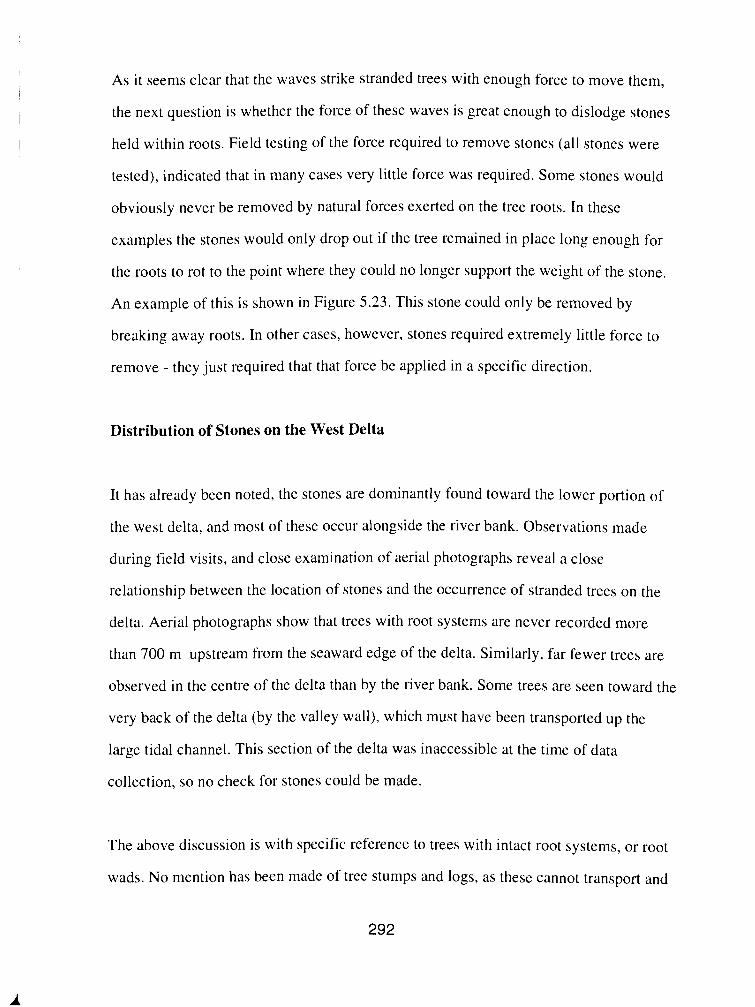
As it seems clear that the waves strike stranded trees with enough force to move them,
the next question is whether the force of these waves is great enough to dislodge stones
held within roots. Field testing of the force required to remove stones (all stones were
tested), indicated that in many cases very little force was required. Some stones would
obviously never be removed by natural forces exerted on the tree roots. In these
examples the stones would only drop out if the tree remained in place long enough for
the roots to rot to the point where they could no longer support the weight of the stone.
An example of this is shown in Figure 5.23. This stone could only be removed by
breaking away roots. In other cases, however, stones required extremely little force to
remove - they just required that that force be applied in a specific direction.
Distribution of Stones on the West Delta
It has already been noted, the stones are dominantly found toward the lower portion of
the west delta, and most of these occur alongside the river bank. Observations made
during field visits, and close examination of aerial photographs reveal a close
relationship between the location of stones and the occurrence of stranded trees on the
delta. Aerial photographs show that trees with root systems are never recorded more
than 700 m upstream from the seaward edge of the delta. Similarly, far fewer trees are
observed in the centre of the delta than by the river bank. Some trees are seen toward the
very back of the delta (by the valley wall), which must have been transported up the
large tidal channel. This section of the delta was inaccessible at the time of data
collection. so no check for stones could be made.
The above discussion is with specific reference to trees with intact root systems, or root
wads. No mention has been made of tree stumps and logs, as these cannot transport and
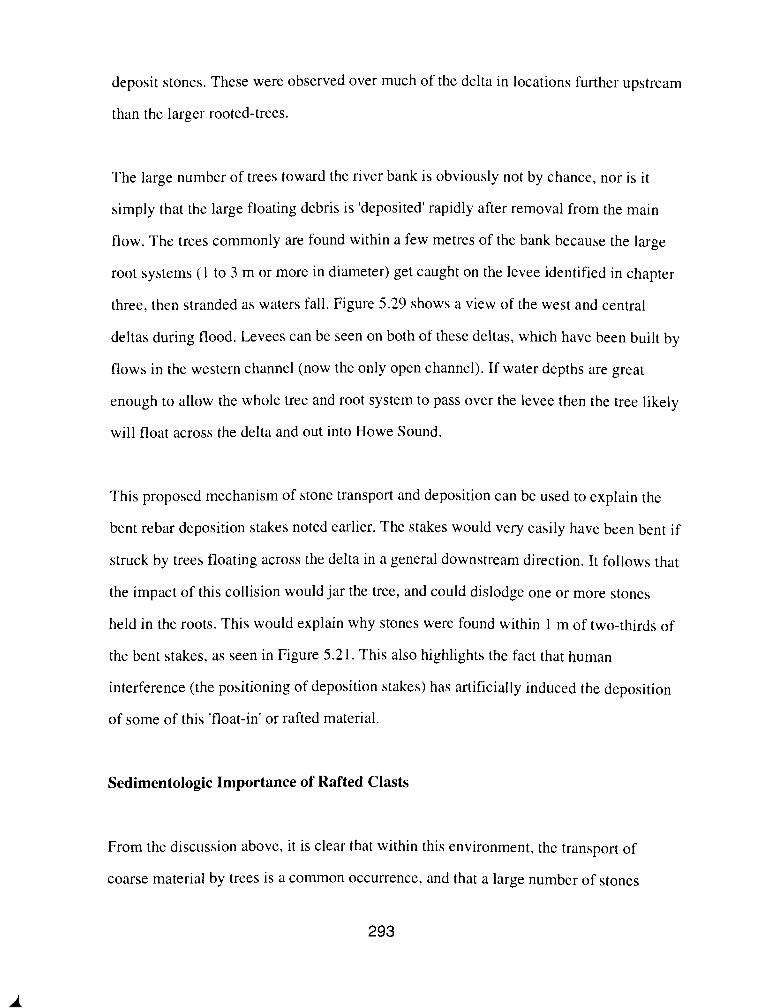
deposit stones. These were observed over much of the delta in locations further upstream
than the larger rooted-trees.
The large number of trees toward the river bank is obviously not by chance, nor is it
simply that the large floating debris is 'deposited' rapidly after removal from the main
flow. The trees commonly are found within a few metres of the bank because the large
root systems (1 to 3 m or more in diameter) get caught on the levee identified in chapter
three, then stranded as waters fall. Figure 5.29 shows a view of the west and central
deltas during flood. Levees can be seen on both of these deltas, which have been built by
flows in the western channel (now the only open channel). If water depths are great
enough to allow the whole tree and root system to pass over the levee then the tree likely
will float across the delta and out into Howe Sound.
This proposed mechanism of stone transport and deposition can be used to explain the
bent rebar deposition stakes noted earlier. The stakes would very easily have been bent if
struck by trees floating across the delta in a general downstream direction. It follows that
the impact of this collision would jar the tree, and could dislodge one or more stones
held in the roots. This would explain why stones were found within 1 m of two-thirds of
the bent stakes, as seen in Figure 5.21. This also highlights the fact that human
interference (the positioning of deposition stakes) has artificially induced the deposition
of some of this 'float-in' or rafted material.
Sedimentologic Importance of Rafted Clasts
From the discussion above, it is clear that within this environment, the transport of
coarse material by trees is a common occurrence, and that a large number of stones
become deposited on the delta. These rafted deposits are important sedimentologic
features because their origin may not readily be apparent. The coarse material is brought
into the deltaic environment by larger objects (trees) which are then removed, leaving
little or no evidence of their presence. This lack of evidence leads to the danger of
misinterpretation of the origin of rafted deposits (or clasts) seen in section. For example,
in more northerly deltas where ice transport occurs, these stones may be misinterpreted
as dropstones or ice-carried debris.
If these large deposits are to be interpreted or misinterpreted, it is clear that they must
first be observed in section, so it is important to determine the preservation potential of
these deposits. It is interesting to note that despite the fact that so many stones were
observed on the delta surface, none were ever observed in section. This is considered to
be pure chance rather than an indication that rafted clasts are a recent phenomena. The
processes of trees transporting and depositing stones in that delta environment today are
considered essentially the same as those occurring during the early stages of
development of Squamish delta. This statement is substantiated by pre-dyke
photographic evidence which shows a number of trees on all delta surfaces.
If these processes have always been in operation in this environment then rafted clasts
should be present throughout the delta topset beds from intertidal sands to marsh
rhythmites. Despite this statement, it is felt that the majority of rafted deposits have a
short residence time (poor preservation potential), at least in west delta sediments. This
is because the majority of stones appear to be deposited within a few metres of the
channel bank. As has already been shown, the entire length of this bank has been
eroding at a considerable rate over the last 33 years.

The preservation of rafted deposits is dependent on the burial and preservation of
intertidal sediments. Within this high-energy environment where the sedimentary basin
is laterally restricted, it is felt that these deposits have a poor preservation potential and a
residence period not exceeding 400 years. This statement appears substantiated by
contemporary rates of channel bank erosion, and the local history of channel avulsion
and switching.
Previous Findings and Observations
Despite the low preservation potential of gravels and cobbles within the marsh
sediments of this fjord environment, a number of similar deposits have been recorded
elsewhere. Orton (1892) described a number of boulders (one up to 400 lbs) found
within a thick coal seam in Ohio. In no case did any of these boulders disturb the
internal structure of the coal. While most of these boulders were well-rounded and
smooth, one was described as being of different composition, and "....angular, as i f
freshly broken from the parent mass." (Orton, 1892 p. 63). Orton could offer no
explanation for the mode of transport or deposition of this stone, but felt that it was
different in origin from the other, well-rounded boulders.
Twenhofel (1917) described a number of distinct clusters of boulders at the top of what
is interpreted as a deltaic sequence in Kansas. In all, around 100 boulders were found,
the largest being over 2 m in diameter. All boulders were noted on the surface of a unit
of Pennsylvanian shale, although Twenhofel speculated that these boulders originally
lay within the shale. Four possible methods of origin of these deposits are discussed by
Twenhofe] (1917), who dismisses the possibility of a fluvial source because the boulders
lay within sediments which were obviously deposited in a low energy environment.
Flows in such an environment would have been incapable of transporting boulders of
this size. Instead, Twenhofel (1917) believed the boulders to have been transported from
ice which broke-off from glaciers and was transported downstream. Melting blocks of
stranded ice in the intertidal environment deposited the boulders within what is now the
shale deposits.
In 1932, Price attempted to determine the origin of what he termed erratics in coal beds,
with reference to a number of previous recordings. All recorded erratics were well-
rounded, and a few were reported to be slightly etched or grooved. There were no signs
of site disturbance or destruction of bedding surrounding the stones. These stones, which
represented a number of different rock types, were found throughout the coal seam.
Price (1932) discussed the possible origin of these erratics with reference to
transportation by ice, water, and trees. Without offering any definite answer to this
problem, Price (1932) argued that the material was incorporated into the marsh by trees.
Price argued, however, that these trees were deposited in a stream before marsh
development, and that these trees eventually became overturned, elevating boulders
(held within tree roots) into the marsh sediments. NO explanation was given for the
driving force for this overturning, or for the lack of bed disturbance, which would surely
have occurred during such a process. Price did not believe that the material could have
been rafted-in directly by trees because he felt that a stream large enough to carry trees
would have eroded the peat bog. In addition to this, Price felt that tree-rafting could not
account for the deposition of erratics throughout the coal seam.
Discussion of Previous Research
The early work discussed above raises a number of interesting points which are worth
mentioning here. The first point relates to the shape of the stones found within a matrix
of finer sediment (or coal). Orton (1892) believed that the angular boulder was
significantly different from other examples, as it must have a different mode of origin
than well-rounded examples. It is clear from this study that the shape of stones deposited
by tree-rafting is determined largely by the type of material within which the tree grows.
It is highly possible that tree-rafting could deposit fluvially rounded stones, angular
rockfall material, or glacial till, so the shape of float-in clasts should not influence
interpretation. The only information which shape may reveal is the distance that the tree
has been transported in the river, or the length of time that the tree has been in the river
system.
Similar warnings must be made with regard to the rock type of rafted deposits. Differing
rock types need not imply different processes of deposition or formation (a point
examined by Twenhofel (1917)), but may certainly be used to give an indication of
source. In this way, Price (1932) determined that trees had transported boulders some 60
miles from their source. It should be stated, however, that the parent rock may not be the
direct source of rafted material, as trees may grow in deposits which have previously
been transported considerable distances by fluvial action, ice, or mass movement.
Finally, Price's (1932) thoughts regarding the inability of trees to deposit boulders
throughout a marsh or peat deposit is clearly incorrect. Within the specific Squamish
example, however, the number of these deposits should decrease with increased height
of the marsh surface, as trees are unable to move onto the delta. The ideal location for

this process of float-in deposition is the interdistributary bay environment, although it
should not restricted to these areas. The ideal h a t i o n is one where floodwaters rise and
fall on a fairly frequent basis, yet one in which energy conditions are low enough to
permit the accumulation of fine sediments. If Squamish estuary can be regarded as being
typical, the environment must also be open enough to allow the generation of wind
waves during high water stages.
CHAPTER SIX
CONCLUSIONS
The initial aim of this case study was to examine the contemporary depositional and
erosional processes operating within the high energy, fjord-head Squamish delta. More
specifically, the different components of this study aimed to determine the degree of
tidal control on sedimentation, the changing nature of that control along the tidal
gradient, and to determine the nature and rate of bank erosion within the estuary. The
following pages present a summary of the findings.
Depositional Model of Squamish Delta and Floodplain Formation
Floodplain and delta stratigraphic sequences were examined within bank sections along
the estuarine reach of Squamish River. Seven distinct facies have been identified within
these sequences (labeled Facies A to GI, which have been given purely descriptive terms
to avoid bias or confusion. Facies are labeled as follows: Facies A - crossbedded sands
and gravels; B - finely-laminated sands and silts; C - silty rhythmites; D - sandy
rhythmites; E - parallel-laminated sands with peds; F - ripple-bedded sands; G - parallel-
laminated silts and clays.
With the possible exception of the deposits along the lower 1 000 m of Squamish River,
these deposits were laid down along shallowing channel margins and within aggrading
channel sections, and later, within an interdistributary bay environment. Channel
aggradation is believed to have been induced by gradual channel abandonment. Within
this environment, channel lag sands and gravels (Facies A) were deposited to an
elevation just above mean low tide level. Above this point, tidal modification of flow
prevents the transport of sandy bedforms. This is reflected in sequence as a distinct
change from the coarse sands of Facies A to finer intertidal sands of Facies B. As this
intertidal surface accretes, halophyte vegetation begins to colonise the bare sands. This
vegetation rapidly spreads and becomes more dense, so that it acts to preferentially
deposit fine-grained material. This stage represents the formation of tidal marsh deposits
(Facies C). As this marsh surface accretes, both sediment and vegetation type change as
the delta plain gradually changes to an alluvial plain (Facies E). This gradual transition
is abruptly interrupted by riverine flood coarse overbank deposits of Facies F, which
generally form the uppermost deposits in section. In places, thin deposits of finely
laminated silts and clays (facies G ) deposited by tidal overbank flows are present toward
the top of estuarine sections. Deposits of Facies D are coarse-grained, crude rhythmite
beds forming a levee along the lower 800 m reach of Squamish River. At those isolated
locations where these deposits are found, they produce an anomalous co~se-grained
stratigraphic sequence which is discussed later in this chapter.
There is some sedimentologic evidence to suggest that the lower 1 000 m of estuarine
deposits are the direct response of deltaic progradation. The presence of shells and
distinct tidal bedding suggest that the sands of Facies B formed within an intertidal
sandflat environment along the front of the delta rather than within an aggrading channel
reach.
Tidal Controls on Sedimentation Within Squamish Delta
~ 1 1 facies identified above are tidal deposits by strict definition, as they formed within
an environment subject to tidal flux. There exists a distinction, however, between those
deposits which are known to be tidal from their present location, and those deposits
which display sedimentologic evidence of their tidal character. Of the 7 facies identified
in this study, only the intertidal sands (B) and tidal marsh facies (C) display distinct tidal
characteristics. These characteristics are discussed below.
The intertidal sands of Facies B comprise fine rhythmically-laminated bedding produced
by the alternation of sand and silt/clay laminae. This rhythmic alternation is thought
produced by tidal flux. Silts and clays are laid down during high tide periods, while sand
layers are laid down during periods of tidal drop and rise, and those low tide periods
when river discharges are high enough to inundate the intertidal sands. As a
consequence, the tidal sands of Facies B may be classified as tidal bedding, as described
by Rein& and Singh (1980). These deposits most likely display neap-spring tidal
cyclicity. Despite this statement, these deposits are characterised by considerable local
variability, and do not always display such distinct tidal bedding. Further evidence of the
tidal nature of these deposits is provided by the presence of shells at a number of
locations along the lower reaches of the estuary.
The tidal characteristics of Facies C are the presence of marine and brackish-water floral
species which form discrete layers to produce the characteristic bedding pattern of these
tidal marsh deposits. In turn, the bedding characteristics of these tidal marsh deposits
appear to yield evidence of their tidal character. Bed thickness have been used as a
surrogate for sedimentation rate, thus yielding evidence of the changing rate of marsh
sedimentation with age. Comparative analysis of the nature of this changing rate of
sedimentation between tidal and fluvial environments suggests that characteristic
differences exist between the two. These differences are related to differences in
effective discharge relationships, flood frequencies, and sediment transport mechanisms
within tidal and fluvial environments.
Preservation Potential of Tidal Deposits
This study has identified a number of deposits which display sedimentologic and
stratigraphic evidence of their tidal origin. It is important to determine, however,
whether these deposits are likely to be of significance to geologists investigating ancient
estuarine sequences. This prompted discussion of the preservation potential of the tidal
deposits identified here. This discussion concludes that these intertidal deposits are most
unlikely to be fully preserved in sequence within this high-energy, laterally confined
system, agreeing with the earlier comments of Nio (1984). Despite this, the tidal marsh
deposits of Facies C likely will be preserved as large intact blocks of slump debris at the
base of estuarine channel sequences. The cohesive nature of these sediments enables
these blocks (which currently litter the near-bank zone) to retain their bedding form and
resist erosion. If buried by channel sands, these likely will become preserved, as has
been noted elsewhere.
While the process of erosion and eventual preservation of large cohesive blocks of
sediment is not limited to tidal environments, these deposits may still be important
indicators of depositional environment. This is because the slump blocks retain their
original bedding form, (which appears indicative of a tidal environment) and halophyte
organic material.
Comparative Analysis of Fluvial and Estuarine
Fine-Grained Deposits
A limited number of previous studies have suggested that distinct differences exist
between fine-grained sedimentary deposits within fluvial and tidal regions. This
prompted a comparative analysis of tidal deposits of Facies C (tidal marsh) with fine-
grained sedimentary deposits along the riverine reach of Squamish River. The fine
deposits within the fluvial environment investigated here, formed within an abandoned
channel section, probably an oxbow produced by meander neck-cutoff. The results of
sedimentologic and stratigraphic analyses of these deposits are summarised in Table 6.1.
These differences highlight a number of important tidal characteristics of finegrained
deposits within Squamish estuary.
Sedimentologic Evidence of the FluviaYTidal Transition
Along the Estuarine Reach
Bank sections exposed along Squamish River record the changing nature of sedimentary
sequences along the tidal gradient. These sequence changes in turn record the decreasing
influence of tidal control on sedimentation with increasing distance upstream. An
examination of broad-scale changes in sedimentary sequence, and a more detailed
examination of changes within facies of known tidal origin (Facies B and C) has yielded
considerable information regarding the nature of the fluvialltidal transition. The main
conclusions from these analyses are given below.
I ) Estuarine sequences are characterised by thick, extensive deposits of fine grained
overbank deposits, primarily those of Facies C and E. This reflects the dominant
mechanism of deposition within tidal environments - deposition from suspension. With
increasing distance upstream these fine-grained deposits become thinner and eventually
pinch-out. This results in an increase in the mean grain-size of sequences up estuary.
This decreasing facies thickness reflects higher energy conditions (less tidal
modification of flow) and less sedimentation from suspension.
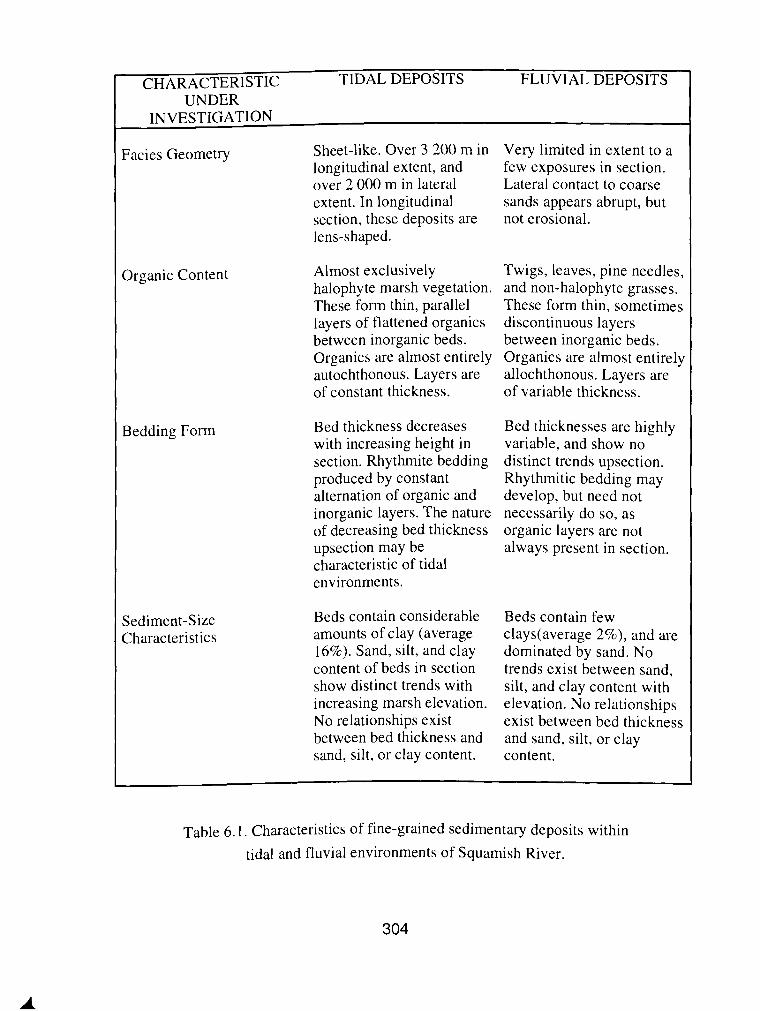
CHARACTERISTIC TIDAL DEPOSITS FLUVIAL DEPOSITS UNDER
INVESTIGATION
Facies Geometry Sheet-like. Over 3 200 m in longitudinal extent, and over 2 000 m in lateral extent. In longitudinal section, these deposits are lens-shaped.
Organic Content Almost exclusively halophyte marsh vegetation. These form thin, parallel layers of flattened organics between inorganic beds. Organics are almost entirely autochthonous. Layers are of constant thickness.
Bedding Form Bed thickness decreases with increasing height in section. Rhythmite bedding produced by constant alternation of organic and inorganic layers. The nature of decreasing bed thickness upsection may be characteristic of tidal environments.
Sediment-Size Characteristics
Beds contain considerable amounts of clay (average 16%). Sand, silt, and clay content of beds in section show distinct trends with increasing marsh elevation. No relationships exist between bed thickness and sand, silt, or clay content.
Very limited in extent to a few exposures in section. Lateral contact to coarse sands appears abrupt, but not erosional.
Twigs, leaves, pine needles, and non-halophyte grasses. These form thin, sometimes discontinuous layers between inorganic beds. Organics are almost entirely allochthonous. Layers are of variable thickness.
Bed thicknesses are highly variable, and show no distinct trends upsection. Rhythrnitic bedding may develop, but need not necessarily do so, as organic layers are not always present in section.
Beds contain few clays(average 2%), and are dominated by sand. No trends exist between sand, silt, and clay content with elevation. No relationships exist between bed thickness and sand, silt, or clay content.
Table 6.1. Characteristics of fine-grained sedimentary deposits within
tidal and fluvial environments of Squamish River.
2) Bank sections along the lower reaches of Squamish estuary reveal simplistic,
predictable sequence successions between a small number of distinct facies. With
increasing distance upstream, however, facies successions are no longer simple. Instead,
sections comprise a number of facies which may not be of constant position in sequence.
Facies often are interbedded with coarse sand deposits which may erosionally overlie
fine-grained overbank deposits. The simplistic sequences become broken by injections
of coarser material from random riverine flood events.
3) Bedding form changes up estuary from fine parallel wavy (or undulatory) bedding, to
a dominance of ripple bedding forms such as climbing ripple lamination. As before, this
change in bedding form reflects the decreasing importance of suspended-sediment
deposition as energy conditions increase up estuary.
4) Estuarine sequences display fining-upward trends produced by the transition from
Facies A through B to C. Mid-estuarine sequences show a reverse of this trend as
sequences become capped by deposits of fine to medium sand (Facies E and F). The
riverine flood deposits of Facies F are produced as tidal influence decreases with the
increasing elevation of the delta surface.
5 ) ~t those locations where tides exert considerable control on sedimentation, Facies
Contacts most commonly are gradational, as highlighted by the transitions from Facies
B to C, and C to E. When fluvial depositional processes dominate, as with the coarser
deposits of Facies D and F, contacts are always abrupt and may be erosional. This
simply reflects the higher energy conditions associated with decreasing modification
(slowing) of flow by tides.
6) The deposits of Facies B display considerable changes up estuary, as sediments
gradually lose the characteristic tidal bedding form. Initially, sand bed thickness
increases and display an increasing amount of ripple bedding forms as opposed to fine
parallel bedding. In addition to this increasing sand bed thickness, silt/clay beds decrease
in both thickness and number within section. This results in a coarsening of Facies B
deposits up estuary, and a lessening degree of rhythmicity and regularity produced by
the alternation of sand and silt/clay beds.
7 ) The tidal marsh deposits display similar changes which reflect the decreasing tidal
influence up estuary, though these gradual changes are often disturbed by local
variability. As a general rule, however, the sediments within marsh rhythmite beds
increase in size up estuary. Accompanying this increase in grain-size, rhythmite beds
appear to thin up estuary, reflecting decreasing modification of flow by tides and
decreasing tidal amplitude. Toward the upstream limit of these deposits beds appear to
thicken again, reflecting the dominance of riverine depositional processes.
These gradual changes record the decreasing tidal modification of flow, and a
consequent increasing importance of riverim depositional processes. In addition to these
up estuary changes in depositional product and character, there exist similar changes
upsection. This is seen as a coarsening-upward sequence superimposed on a fining-
upward sequence. This latter sequence is the transition from subtidal to intertidal sands,
to low and then high marsh deposits (Facies A to C). This sequence represents an
increasing importance of tidal control on sedimentation, which becomes most evident
near the mean low water mark. Along much of the estuarine reach, these deposits are
overlain by Facies E and F, which represent a coarsening-upward sequence cap. This cap
reflects the decreasing relative importance of tides as the deltahloodplain surface
accretes up to and beyond the mean high tide water mark. A conceptual model of
upsection changes of the relative influence of tidal and fluvial depositional processes is
shown in Figure 6.1. In this model, tidal influence rapidly increases as the surface is
raised above mean low tide level, then gradually decreases as the surface continues to
accrete. Toward the top of estuarine sections, fluvial processes dominate, with the
possible exception of the deposits of facies G, which show far greater tidal influence
than do the deposits of Facies F. In addition to showing the relative influence of tides
and river flow, Figure 6.1 also shows the Facies associated with these relative changes,
and the relative components of sand and fines present within deposits at different heights
in section. This figure essentially mirrors the form of section diagrams drawn for
estuarine facies (for example, those shown in Figure 3.3, p. 82).
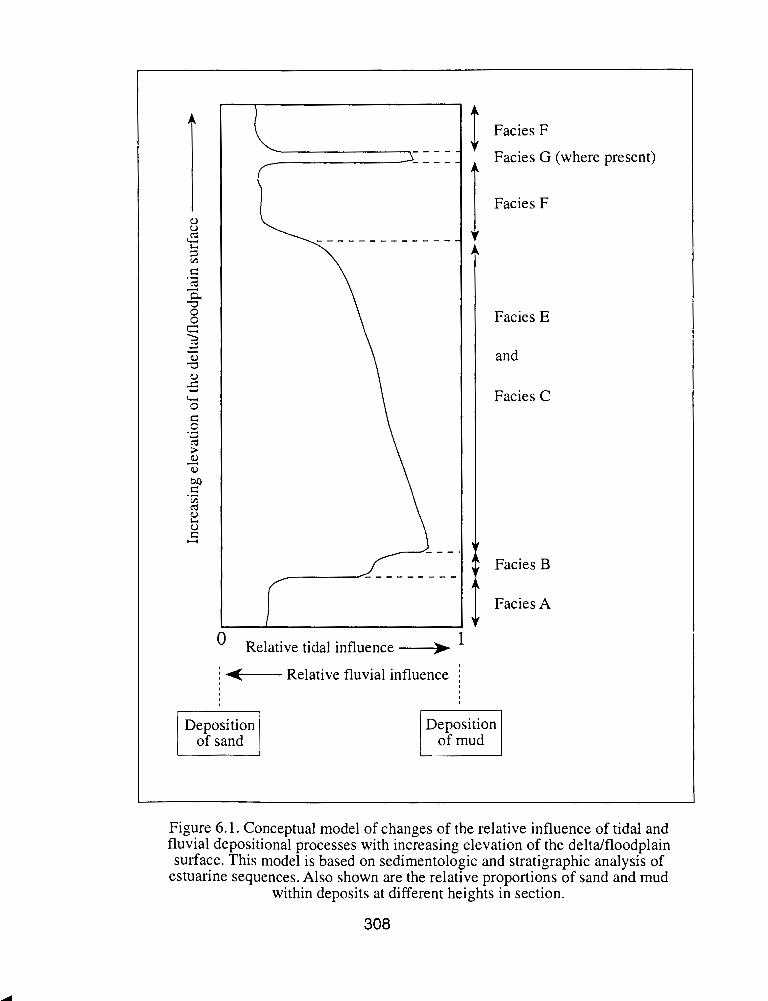
Relative tidal influence -* 1
j 4- Relative fluvial influence j
of sand
Facies F
Facies G (where present)
Facies F
Facies E
and
Facies C
Facies B
Facies A
Deposition 1 of mud 1
Figure 6.1. Conceptual model of changes of the relative influence of tidal and fluvial depositional processes with increasing elevation of the deltdfloodplain surface. This model is based on sedimentologic and stratigraphic analysis of
estuarine sequences. Also shown are the relative proportions of sand and mud within deposits at different heights in section.
Rates of Estuarine Channel Bank Erosion
Rates of estuarine channel bank erosion have been assessed from 8 aerial photographs
over a 33 year period from 1957 to 1990. This period of photographic record allows
comparison of erosion rates prior to and after construction of a river training dyke which
served to isolate flow to a single channel to the west of Squamish delta.
Within the estuary, bank erosion has been assessed within 4 zones which reflect
different morphologic zones of Squamish River. The results of this study are listed
below.
1 ) Within 3 of the 4 zones under investigation, rates of bank erosion remain fkirly
constant over the entire period of study; dyke construction does not appear to have led to
an increase in the rate of bank erosion.
2) Squamish west delta has been decreasing in size over the period of study. Between
1957 and 1990, over 150 000 m2 of west delta deposits have been lost by direct erosion
due to channel migration, and by dredging which aimed to straighten the estuarine
channel. There is no indication that this rate of erosion has increased since 1972, but
results suggest that the west delta will keep eroding and reducing in size as this reach of
Squamish River continues to migrate westward.
3) Within zone 4 (that closest to the dyke), rates of channel bank erosion have increased
dramatically since dyke construction. Average yearly losses over the 12 year period
from 1957 to 69 are 2 15 1 m21yr, whereas over the 18 year post-dyke period (1972-90)
erosion rates average 7 592 m21yr. This zone of rapid erosion includes the areas of
intense post-dyke erosion identified by Bell (1975), Zrymiak and Durette (1979), and
Levings (1980). Bank erosion within this zone is associated with the loss of material
along the outer bank of a large meander which is migrating both across and down valley.
The erosion within this zone is of great importance as the river training dyke parallels
the channel bank at this location. At one location (which recorded erosion over the 1990
to 1992 period) within this zone the channel bank lies within 5 m of the toe of the dyke.
It is felt that, without remedial engineering, Squamish River will continue to migrate
eastward at this location, and will eventually breach the dyke. If the recorded short-term
rates of erosion continue, dyke stability may soon be threatened. If the channel were
permitted to continue migrating freely, Squamish River main flow would eventually
switch to the central channel. If this distributary channel switching is prevented, the west
delta will continue decreasing in size as it has over the past 33 years.
Observations of Erosion
On one occasion, rapid erosion of a portion of west delta sediments enabled a number of
observations to be made regarding the erosional process within the estuary. This erosion
was initiated by the removal of the protective toe along the outer meander bank. As
such, erosion (or at least the initiation of that erosion) appears primarily controlled by
basal endpoint control (Thorne, 1982). Once initiated, further erosion is determined by a
number of factors including stratigraphy, tidal stage, localised velocity fluctuations
associated with boil production, and wind-generated waves.
Erosion occurs through the removal of the basal sands of Facies A, which leads to
undercutting of the finer tidal marsh deposits. As these fine deposits are cohesive, bank
retreat occurs as large blocks of sediment (up to 5 m3 in size) collapse. This erosional
process continues until these slump blocks litter the near-bank zone, reforming a
protective toe which covers the basal sands.
Tidal Marsh Accretion
Rates of west delta marsh accretion have been determined from a number of stakes on
three occasions between May 1992 and November 1993. Though many of these stakes
became disturbed or removed, a number of observations may be made regarding
accretion rates and patterns within the west delta. These are listed below.
1) Accretion rates record considerable spatial variability at this scale of investigation
(stakes were 50 and 100 m apart). Locally high rates of accretion are recorded at stakes
close to the river, reflecting the importance of the fluvial source of sediments. As well as
the highest rates of sedimentation, stakes closest to the river record the greatest
variability of accretion. This variability decreases away from the river.
2) Accretion rates are highly seasonal, with greatest rates occurring during autumn and
winter. The majority of accretion is thought to occur during a limited number of riverine
flood events over winter months. This seasonality of accretion has a number of
implications for marsh sediment sampling technique and timing.
3) There appears to be a shift in the location of maximum accretion from summer to
winter months. Between May and August 1992, 10 of 12 transects recorded greater
accretion toward the centre of the marsh (between 60 and 160 m from the river bank)
than toward the marsh edge (10 m from the bank). The following measurements from
these same stakes (1 3 and 18 months after placement), however, revealed something of a
reverse of this trend. Of the 12 transects that were able to be measured on these
combined occasions, 9 recorded greatest accretion at those stakes closest to the marsh
edge. This shift in the location of maximum accretion may reflect seasonal changes in
the dominant depositional process. During summer months, accretion occurs gradually
during each high tide period, as shown by data from marker beds. Accretion is greater
away from the river, as flow velocities decrease and allow greater sedimentation of
fines. During winter months, marsh accretion is driven primarily by high energy river
flows which transport then deposit considerable amounts of material on the delta
surface. As such, accretion rates are highest at channel-proximal locations.
It is noted that contemporary rates of accretion of the west delta cannot be considered in
relation to the tidal marsh rhythmite beds of Facies C, as these formed prior to river
training dyke construction. Current accretion rates reflect the modified flow regime, and
so can only be considered in relation to the deposits of Facies D.
An assessment of the Influence of Dyke Construction
The completion of a river training dyke in June 1972 led to a number of changes along
the lower 4 000 m of Squamish estuary. The most immediate change was the reduction
of channel width that occurred along the lower 3 500 m of the river as the dyke sealed-
off flood flow to the central channel. In addition, dyke construction has led to a
reduction of effective floodplain width along the entire estuarine reach, as floodwaters
are no longer able to inundate the central and eastern deltas. Along the lower 3 500 m of
the estuary, effective floodplain widths have been reduced by an average of 60%.
The decreasing width of the effective floodplain has resulted in an increase of
floodwater depth, and an inferred increase of flow velocity through certain reaches.
Analysis of erosion data show some evidence to suggest that the increased depth and
velocity of flood flows after 1972 have caused an increase in the rate of erosion within
certain parts of the estuary. In addition to these increased rates of erosion, dyke
construction has led to the formation of an anomalous coarse sedimentary sequence
within the west delta tidal marsh. Along the lower 800 m of the estuary, the combined
effects of channel and floodplain width reduction has been an increase in the depth,
duration, and velocity of floodwaters inundating the delta surface. These changes have
led to the deposition of thick, coarse-grained deposits of Facies D, which essentially
represent levee deposits. At their maximum, these deposits are 134 cm thick, and have
been identified as the product of post 1972 flows by comparison with contemporary
accretion rates, and dating of deposits.
Description and Origin of Large Stones on the West Delta Surface
Over 50 large stones (ranging in size up to around 60 cm in diameter) were found on the
surface of the delta in 1993. These stones were all rounded and appeared placed or
dropped on the delta surface; no disturbance (such as roll or drag marks) of the
surrounding soft fine sediments was observed. These gravels and cobbles often were
clustered in discrete groups, and were not associated with another material such as
coarse sand or gravel. They were mostly found within 10 m of the river bank, to a point
600 m upstream from the southern limit of the west delta.
These stones are not deposited by rockfall, riverine flood, or river ice, but instead are
deposited from large organic debris. They are transported into the interdistributary bay
environment within the root systems of uprooted trees and root wads which are able to
pass onto and over the delta during combined flood and high tide periods. Occasionally,
these trees and root wads become stranded on the delta (for periods of days to years) as
stage falls; this particularly occurs toward the river bank, where trees get caught then
stranded on the levee. If stones are present within the root systems of these trees, they
may become removed and fall to the delta surface, where they have the appearance of
dropstones. Stone removal is believed to occur as wind-generated waves strike the root
systems during periods of delta floodwater inundation.
These stones will become buried and preserved as large clasts within a matrix of silts,
clays, and fine sands. As trees eventually float-off the delta surface, there will be no
sedimentologic evidence of the transport and deposition mechanisms of these clasts,
leading to the danger of misinterpretation of the mode of origin of these deposits.
APPENDIX A
Sediment sample information for the rhytmite bedding
at site 01 1. Data include sample number, depth in section,
bed or sample thickness, and sand, silt, and clay content.
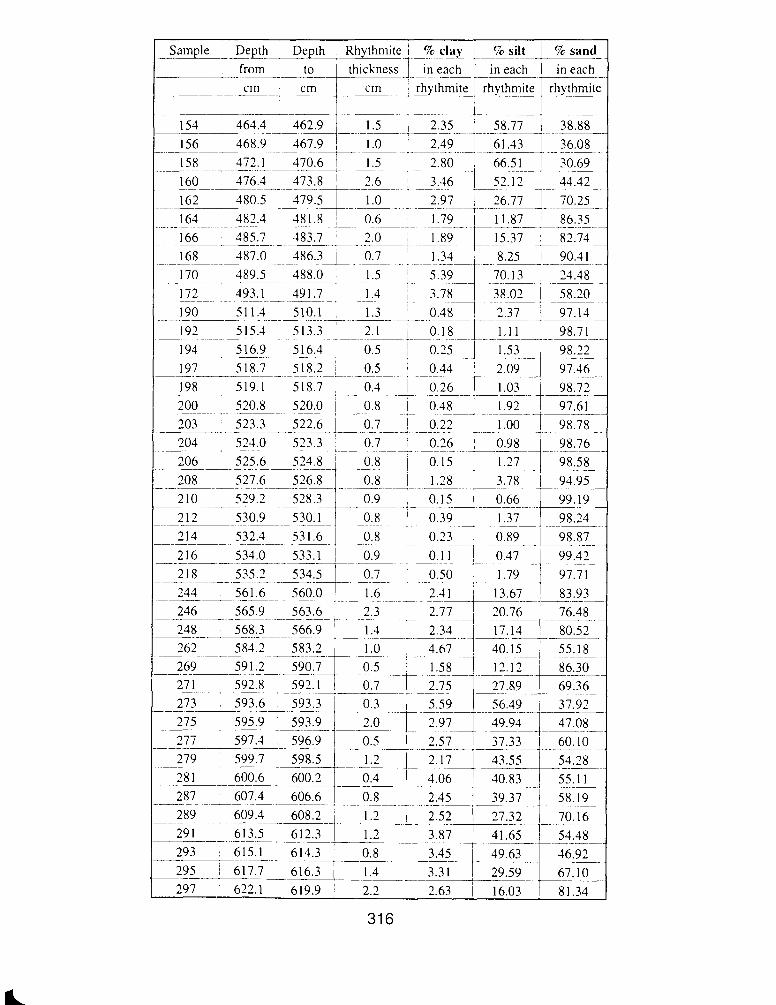
Sample - -- -- Depth . . - Depth - -- 1 --- Rhythnlite . 1 % clay % silt -% sand .+ . - - . - .- . . - - . --
from to /thickness I in each I in each ] in each- .- - -- - - - . - --
cm crn cm rhythmitel rhythmite rhythrnite - .- - - .- 1-- - - - - -
APPENDIX B
Sediment sample information for the rhytmite bedding
at site irs I . Data include sample number, depth in section,
bed or sample thickness, and sand, silt, and clay content.
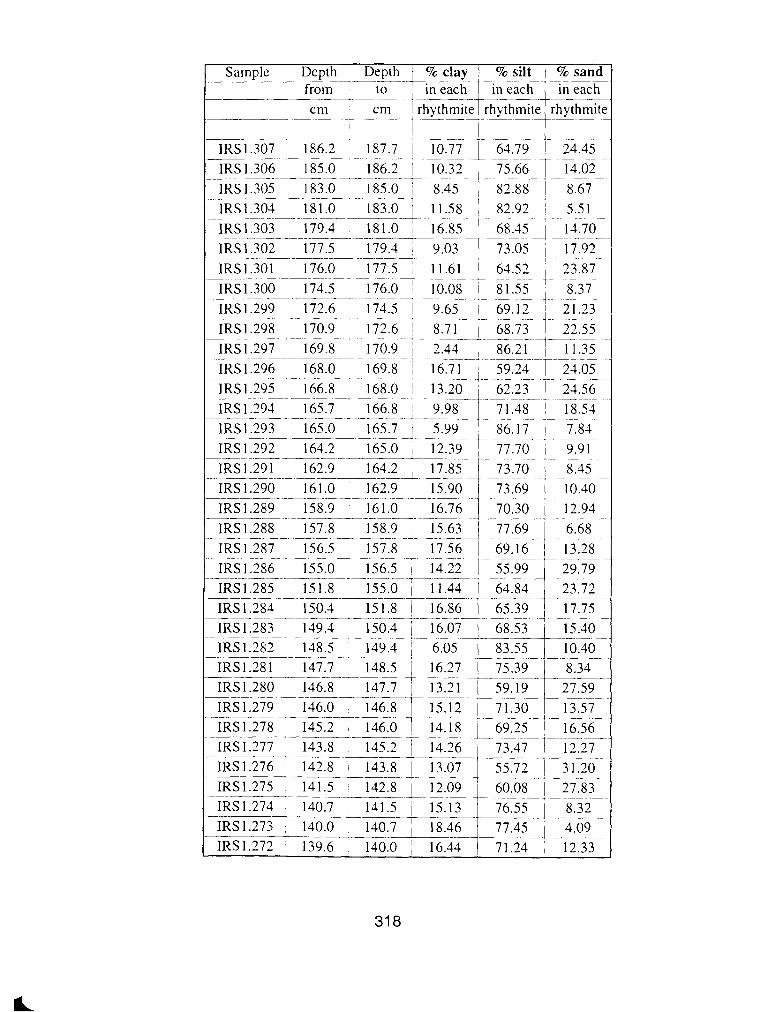
I Sample Depth Depth / % clay j % silt / 70 sand 1 from t i T i f i Z f - i l l e a c k
-- -
in each rhythmitc --- --
cm cm 1 rhythmite ( rhythmitc - . __-
I 1
IRS 1.283 149.3 150.4 16.07 - - - - --- - - - .. 68.53
IRS1.282 148.5 149.4 , -- - - - - - - I 6.05 pp 83.55
-
IRS1.281 147.7 1 4 8 . 5 7 16.27 75.39
IRS 1 276 142.8 1 4 3 ~ + 1 3 0 1 ) 5 ~ -
IRS1.274 140.7 141.5 / 15.13 76.55 IRS 1.273 140.0 140.7-8%-k7741--
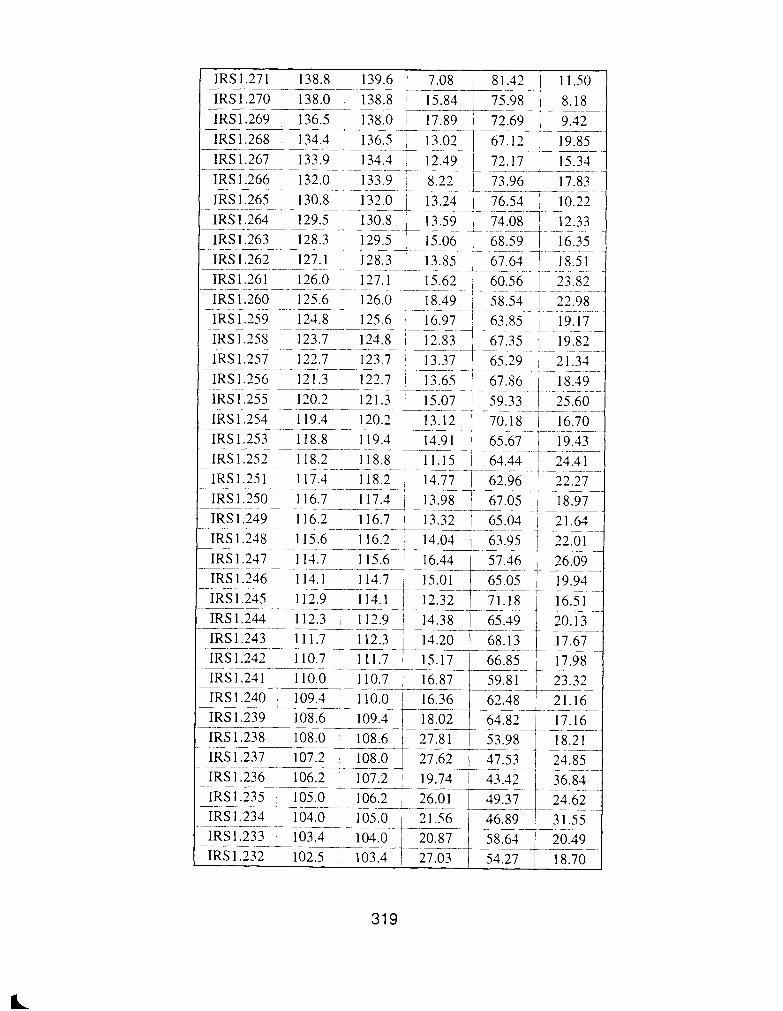
IRS 1.252 1 18.2 1 18.8 IRS 1.25 1 1 17.4 118.2
. . - - - -- --- - . - . - - - -- - - - -. - - -- - IRS1.250 116.7 117.4
-
IRS1.249 116.2 116.7 . - - - - . -- .. . - - -~~
IRS1.248 115.6 116.2 ~ -- ~
IRS 1.247 1 14.7 115.6
IRS 1.245 1 12.9 1 14.1 -- --- - . - IRS1.244 112.3 112.9
- - - -- - - -- IRS 1.242 1 10.7 11 1.7
IRS 1.238 108.0 108.6 IRS 1.237 107.2 108.0 -
IRS 1.236 106.2 107.2 IRS 1.235 105.0- 1 0 6 . 1 - IRS 1.234 104.0 105.0 IRS 1.233 103.4 104.0 IRS 1.232 102.5 103.4-
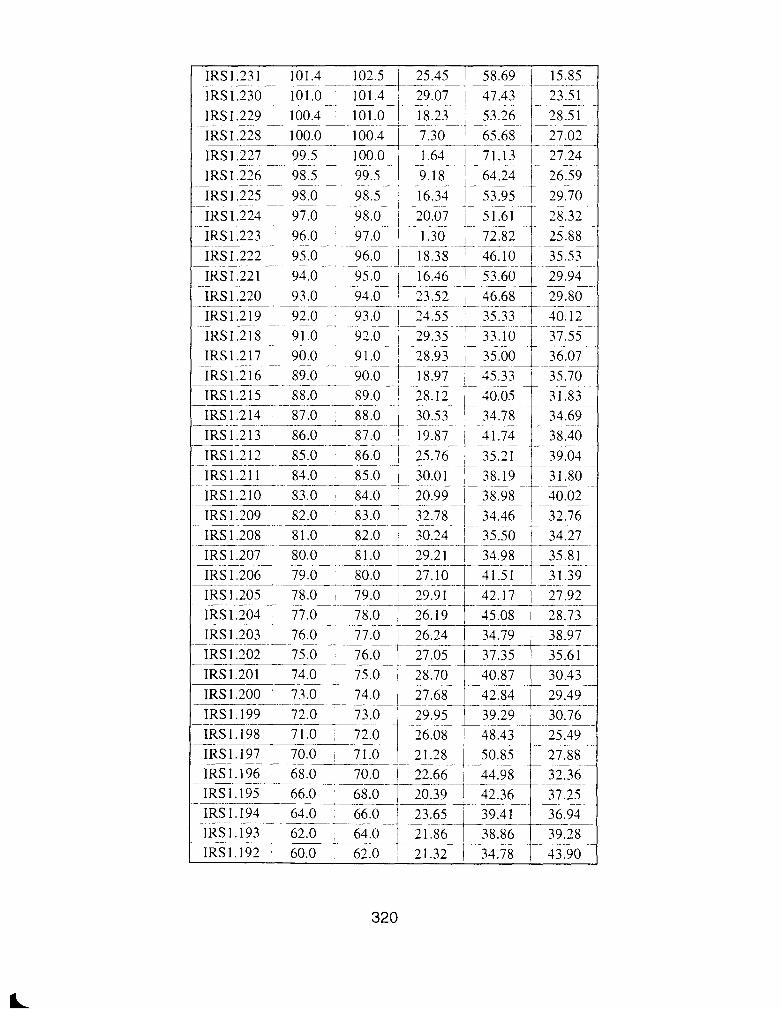
IRSI .228 100.0 100.4 1 i::~ --
65.68 I 27.02 - -. ---- -- I 1RS1.227 99.5 100.0 71.13 1 27.24
1RS1.226 98.5 99.5 ( 9.18 1 64.24 / 26.59 -- - -- -- - ----- -- - -
IRS 1.225 98.0 98.5 16.34 / 53.95 1 29.70 - -- -- - - - - - -- --- - 1 -
IRS1.224 97.0 98.0 / 20.07 I 51.61 1 28.32
IRS1.222 95.0 96.0 1 18.38 / 46.10 1 35.53 .- .- - - - - -- - -. -- - -. - - -- -. . -- . --
IRS 1.22 1 94.0 95.0 ' 16 46 53.60 29.94 4 L.. IRS 1.220 93.0 94.0 23.52 7 1 6 . 6 8 29.80
.~ ~ - -. ---
- - - - - - - . . - -. -- . --
IRS1.219 92.0 93.0 24.55 / 35.33 1 40.12 . .
. . -. . . - -- - -
IRS1.218 91.0 92.0 :--29.35 I 33.10 r 37.55
IRS1.209 82.0 83.0 1 32.78 34.46 ( 32.76 - - - -- - -- -- - - --- - .- - - -- - - -- - . - -.
IRS 1.208 8 1.0 82.0 30.24 1 35.50 1 34.27
- - - - - -- - -- - -
IRS1.206 79.0 8 0 . 0 1 -- - -- -
IRS1.205 78.0 -- --
IRS 1.204 77.0 -- IRS1.203 76.0
IRS 1.20 1 74.0 75.0 1 28.70 I 40.87 I 3023
IRS 1.199 72.0 - -. . --- - -
IRS1.198 71.0
IRS1.195 66.0 ' 68.0 1 20.39 1 42.36 37.25 -
IRS 1194 - 64.0 6 6 . 0 1 23.65 -. i 3 9 . 4 1 1 36.94 IRS1.193 62.0 64.0 21.86 38.86 39.28
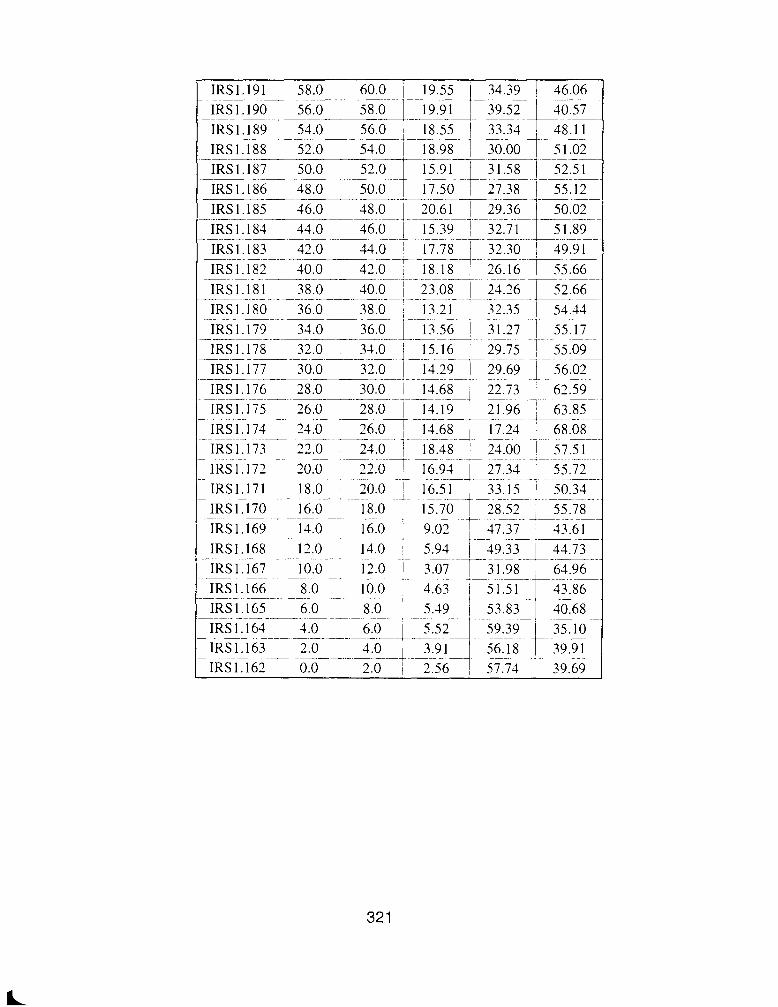
IRS 1.183 42.0 44.0 1 17.78 32.30 49.91 . ... - - - -. . . . - --
IRS 1.182 40.0 42.0 18.18 26.16 E56 -- - . . . --- - . - ---- I . . ----
IRS1.181 38.0 40.0 23.08 1 24.26 j 5 2 . 6 6 - - ~ --+- -- ----- ~-. - .
IRS1.180 36.0 38.0 ; 13.21 1 32.35 I 54.14 - -. .- - - . .. - ~- - . -
IRS1.179 34.0 36.0 1 13.56 1 31.27 1 55.17
IRS 1.176 28.0 30.0 14.68 - -- -. -- -. -- - 2Z- 1 62.59-.-
IRS1.175 26.0 - - - . -. - - - - -- - -
IRS1.171 14.0 -- - -- . ~.
IRS1.173 22.0 7-.. . ..- -~~
1 ~ ~ 1 . 1 7 2 20.0 2 2 . < 7 1 6 9 > -4 27.34 .. - - - -- ] . 55.72 A
IRS1.171 18.0 20.0 7--16151 ~ 33.15 50.34 - . . ~ -- .~ 4.
IRS1.170 16.0 18.0 1 15.70 1 28.52 1 55.78 -- -- . . + . - - . ~-
IRS1.169 14.0 16.0 i 9.02 17.37 1 13.61 I -~ . - . . -
IRS1 .I68 12.0 14.0 f 5.94 49.33 44.73 1RS1.167 10.0 12.0 -- 1 3.07 1 3 1 . 9 8 64.96
*
IRS1.166 8.0 10.0 1 4.63 / 51.51 43.86 - --- - - - .. - - .- -- - - - --- . -- -. -. - -. . -- --- pp
IRS1.165 6.0 8.0 5.49 1 53.83 1 40.68 IRS 1. 161 4.0
--
IRS1.163 2.0 IRS1.162 0.0

APPENDIX C
Rhytlin~ite depth and thickness data determined from
photographs near the logged site irs I . Depth values are
those from the marsh surface, not those from the upper
limit of facies C at thi4 location.

from to thickness -. - - - - --
cm cm cm
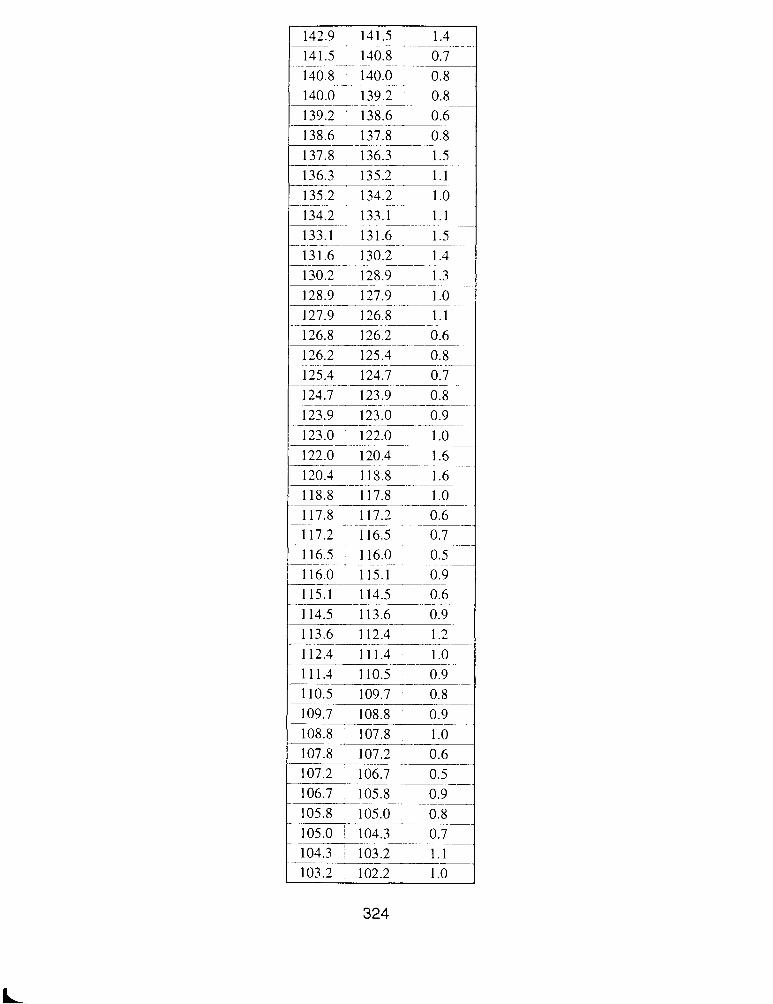
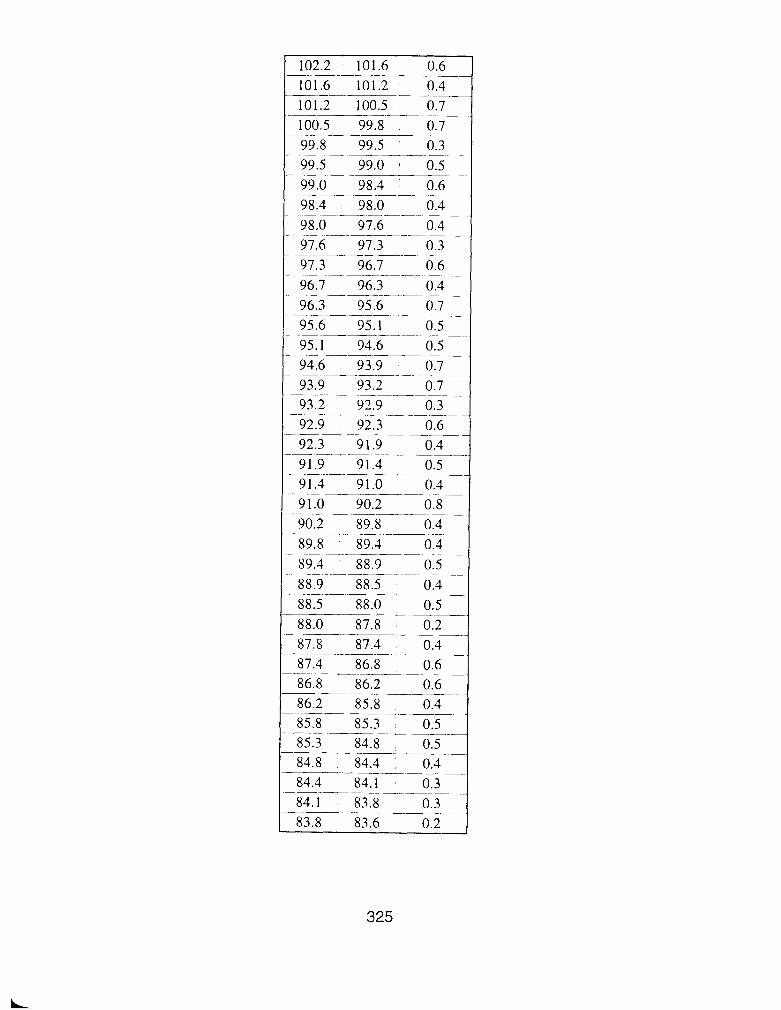
REFERENCES
Alexander, C.S. and Nunally, N.R. 1972 'Channel stability on the lower Ohio River' Annals of the Association of American Geographers, 62: 41 1-417
Allen, G.P. 197 1 'Relationship between grain-size parameter distribution and current patterns in the Gironde estuary (France)' Journal of Sedimentary Petrology, 4 1 : 74- 88
Allen, G.P. 1991 'Sedimentary processes and facies in the Gironde estuary: a recent model for macrotidal estuarine systems' In: Smith, D.G., Reinson, G.E., Zaitlin, B.A. and Rahmani, R.A. (Eds) 'Clastic tidal sedimentology' Canadian Society of Petroleum Geologists, Calgary. Memoir No. 16: 29-40
Allen, G.P. and Castaing, P. 1993 'Sedimentary processes and facies patterns at the fluvial- tidal interface: paleogeographic and stratigraphic implications' In: Yu, B. and Fielding, C.R. (Eds) '5th International conference on fluvial sedimentology - modern and ancient rivers - their importance to mankind' Conference Proceedings: 5
Allen, G.P. and Posamentier, H.W. 1993 'Sequence stratigraphy and facies model of an incised valley fill: the Gironde Estuary? France' Journal of Sedimentary Petrology, 63: 378-391
Allen, J.R.L. 1963 'The classification of cross-stratified units, with notes on their origin' Sedimentology, 2: 93- 1 13
Allen, J.R.L. 1970 'Studies in fluviatile sedimentation: A comparison of fining-upwards cyclothems with special reference to coarse-member composition and interpretation' Journal of Sedimentary Petrology, 40: 298-323
Allen, J.R.L. 1982 'Mud drapes in sand-wave deposits: a physical model with application to the Folkstone Beds (Early Cretaceous, southeast England)' Philosophical Transactions of the Royal Society, London, 306A: 29 1-345
Allen, J.R.L. and French, P.W. 1989 'An apparatus for sequentially sampling unconsolidated cohesive sediments exposed on salt marsh and river cliffs' Sedimentary Geology, 6 1 : 15 1 - 154
Allen, J.R.L. and Narayan, J. 1964 'Cross-stratified units, some with silt bands, in the Folkstone beds (Lower Greensand) of southeast England' Geologie en Mijnbouw, 43: 45 1-46 1
Allen, P.A. and Homewood, P. 1984 'Evolution and mechanics of a Miocene tidal sandwave' Sedimentology, 3 1 : 63-8 1
Amos, C.L., Van Wagoner, A. and Daborn, G.R. 1988 'The influence of subaerial exposure on the bulk properties of fine-grained intertidal sediment from Minas Basin, Bay of Fundy' Estuarine, Coastal and Shelf Science, 27: 1-13
Anderson, F.E. 1983 'The northern muddy intertidal: seasonal factors controlling erosion and depsition - a review' Canadian Journal of Fisheries and Aquatic Sciences, 40, supplement 1 : 143- 159
Anderson, J.U. 1963 'An improved pretreatment for rnineralogic analysis of samples containing organic matter' Clays and Clay Minerals, 10: 380-388
Armentano, T.V. and Woodwell, G.M. 1975 'Sedimentation rates in 3 Long Island marsh determined by 210-Pb dating' Limnology and Oceanography, 20: 452-356
Ashley, G.M. 1979 'Sedimentology of a tidal lake, Pitt Lake, British Columbia, Canada' In: Schliichter, Ch. (Ed) 'Moraines and Varves: Origin/Genesis/Classification' International Union for Quaternary Research, Proceedings A.A. Balkema Publishing, Rotterdam: 327-345
Babakaiff, C.S. 1993 'Flow hydraulics, bedforms and macroturbulence of Squamish River estuary, British Columbia' Unpublished M.Sc. Thesis, Department of Geography, Simon Fraser University
Ball, D.F. 1964 'Loss-on-ignition as an estimate of organic matter and organic carbon in non-calcareous soils' Journal of Soil Science, 15: 84-92
Barclay, J.E. and Davies, G.R. 1989 'Tidal clasticl carbonate deposits - Carboniferous Kiskatinaw Formation, Alberta, and a Holocene analogue - Shark Bay, western Australia' In: Reinson, G.E. 1989 (Ed) 'Modem and ancient examples of clastic tidai deposits - a core and peel workshop' Second International Research Symposium on Clastic Tidal Deposits. Canadian Society of Petroleum Geologists, Calgary: 1 17- 126
Bartsch-Winkler, S., Ovenshine, A.T. and Kachadoorian, R. 1983 'Holocene history of the estuarine area surrounding Portage, Alaska as recorded in a 93m core' Canadian Journal of Earth Sciences, 20: 802-820
Barwis, J.H. 1978 'Sedimentology of some South Carolina tidal-creek point bars, and a comparison with their fluvial counterparts' In: Miall, A.D. (Ed) 'Fluvial
\ ,
~ e d i k e n t o l o g ~ ~ Canadian Society of Petroleum ~eologists , Calgary. Memoir 5: 129- 160
Basan, P.B. and Frey, R.W. 1977 'Actual palaeontology and neoichnology of salt marshes near Sapelo Island, Georgia' In: Crimes, T.P. and Harper, J.C. (Eds) 'Trace fossils 2' Geological Journal Special Issue 2. See1 House Press, Liverpool: 4 1-70
Bell, L.M. 1975 'Factors influencing the sedimentary environments of the Squarnish River delta in southwestern British Columbia' Unpublished M.A.Sc. Thesis, Department of Geological Sciences, University of British Columbia
Belperio, A.P. and Nio, S.D. 1988 'Preface' Sedimentary Geology, 57: 247
Bhowmik, N.G. 1982 Discussion of: 'Processes and mechanisms of river bank erosion' In: Hey, R.D., Bathurst, J.C. and Thorne, C.R. (Eds) 'Gravel-bed rivers - fluvial process, engineering and management' John Wiley and Sons Ltd, New York: 259
Bloom, A.L. 1964 'Peat accumulation and compaction in a Connecticut coastal marsh' Journal of Sedimentary Petrology, 34: 599-603
Boersma, J.R. 1969 'Internal structures of some tidal megaripples on a shoal in the Westerschelde estuary, the Netherlands' Geologie en Mijnbouw, 48: 409-414
Boersma, J.R., Meene, E.A.van de. and Tjalsma, R.C. 1968 'Intricated cross-stratification due to interaction of a mega ripple with its lee-side system of backflow ripple (upper-pointbar deposits, lower Rhine)' Sedimentology, 1 1: 147- 162
Bogen, J. 1983 'Morphology and sedimentology of deltas in fjord and fjord valley lakes' Sedimentary Geology, 36: 245-267
Bornhold, B.D. and Prior, D.B. 1990 'Morphology and sedimentary processes on the subaqueous Noeick River delta, British Columbia, Canada' In: Colella, A. and Prior, D.B. (Eds) 'Coarse-grained deltas' Special Publication of the International Association of Sedimentologists, 10. Blackwell Scientific Publications, Oxford: 169- 184
Bosence, D.W.J. 1973 'Facies relationships in a tidally influenced environment: a study from the Eocene of the London Basin' Geologie en Mijnbouw, 52: 63-67
Bouma, A.H. 1963 'A graphic presentation of the facies model of salt marsh deposits' Sedimentology, 2: 122- 129
Boyd, R., Dalrymple, R. and Zaitlin, B.A. 1992. 'Classification of clastic coastal depositional systems' Sedimentary Geology, 80: 139- 150
Brice, J.C. 1974 'Evolution of meander loops' Geological Society of America, Bulletin, 85: 58 1-586
Bridge, J.S. 1985 'Palaeochannel patterns inferred from alluvial deposits: a critical evaluation' Journal of Sedimentary Petrology, 55: 579-589
Bridge, J.S. 1993 'Description and interpretation of fluvial deposits: a critical perspective' Sedimentology, 40: 801-8 10
Bridges, P.H. and Leeder, M.R. 1976 'Sedimentary model for intertidal mudflat channels, with examples from the Solway Firth, Scotland' Sedimentology, 23: 533-552.
Brierley, G.J. 1989 'The character of channel planform control on the morphology and sedimentology of the gravel-bed Squamish river floodplain, British Columbia' Unpublished Ph.D. Thesis, Department of Geography, Simon Fraser University.
Broadbent, F.E. 1953 'The soil organic fraction' Advances in Agronomy, 5: 153-183
Brooks, G.R. 1992 'Aspects of post-glacial sediment supply and its control upon the morphology of Squamish River, southwestern British Columbia' Unpublished Ph.D. Thesis, Department of Geography, Simon Fraser University
Brooks, G.R. and Hickin, E.J. 1991 'Debris avalanche impoundments of Squamish River, Mount Cayley area , sothwestern British Columbia' Canadian Journal of Earth Sciences, 28: 1375-1385
Buckley, J.R. 1977 'The currents, winds and tides of northern Howe Sound' Unpublished Ph.D. Thesis, University of British Columbia
Buckley, J.R. and Pond, S. 1976 'Wind and surface circulation of a fjord' Journal of the Fisheries Research Board of Canada, 33: 2265-227 1
Buller, A.T. and Green, C.D. 1976 'The role of organic ditrius in the formation of distinctive sandy tidal flat sedimentary structures, Tay Estuary, Scotland' Estuarine and Coastal Marine Science, 4: 1 15- 1 18
Bums, R.E. 1965 'Importance of marine influences in estuarine sedimentation' In: 'Symposium 3 - Sedimentation in estuaries, harbors, and coastal areas - Proceedings of the Federal inter-agency sedimentation conference - 1963' U.S. Government printing office, Washington, D.C.: 593-598
Calverley, A. 1984 'Sedimentology and geomorphology of of the modern epsillon cross- stratified point bar deposits in the Athabasca upper delta plain' Unpublished M.Sc. Thesis, University of Calgary
Campbell, C.V. and Oaks, R.Q.Jr. 1973 'Estuarine sandstone filling tidal scours, Lower - Cretaceous Fall River Formation, Wyoming' Journal of ~ e z m e n t a r y Petrology, 43: 765-778
Carey, A.E. and Oliver, F.W. 1918 'Tidal lands, a study of shore problems' Blackie and Son, Glasgow
Carling, P.A. 1982 'Temporal and spatial variation in intertidal sedimentation rates' Sedimentology, 29: 17-23
Carson, M.A. and Kirkby, M.J. 1972 'Hillslope fonn and process' Cambridge University Press, Cambridge
Chapman, V.J. 1938 ' Coastal movement and the development of some new England marshes' Proceedings of the Geological Association, 49: 373-384
Chave, K.E. 1964 'Skeletal durability and preservation' In: Newell, N.D. and Imbrie, J. (Eds) 'Approaches to Paleoecology' Wiley, New York: 377-387
Coakley, J.P. and Syvitski, J.P.M. 1991 'SediGraph technique' In: Syvitski, J.P.M. (Ed) 'Principles, methods, and application of particle size analysis' Cambridge University Press: 129- 142
Coates, G.F. and Hulse, C.A. 1985 'A comparison of four methods of size analysis of fine-grained sediments' New Zealand Journal of Geology and Geophysics, 28: 369-380
Coles, S.M. 1979 'Benthic microalgal populations on intertidal sediments and their role as precursors to salt marsh development' In: Jefferies, R.L. and Davy, A.J. (Eds) 'Ecological proceses in coastal environments' Blackwell Scientific Publications, Oxford: 25-42
Cooper, J.A.G. 1993 'Sedimentation in a river dominated estuary' Sedimentology, 40: 979- 1017
Comer, G.D., Nordahl, E., Munch-Ellingsen, K. and Robertsen, K.R. 1990 'Morphology and sedimentology of an emergent fjord-head Gilbert-type delta: Alta delta, Norway' In: Colella, A. and Prior, D.B. (Eds) 'Coarse-grained deltas' Special Pubiication of the International Association of Sedimentologists, 10. Blackwell Scientific Publications, Oxford: 155- 168
Craft, C.B., Seneca, E.D. and Broome, S.W. 1991 'Loss on ignition and kjeldahl digestion for estimating organic carbon and total nitrogen in estuarine marsh soils: calibration with dry combustion' Estuaries, 14: 175-179
Dalrymple, R.W., Knight, R.J., Zaitlin, B.A. and Middleton, G.V. 1990 'Dynamics and facies model of a macrotidal sand-bar con~plex, Cobequid Bay-Salmon River estuary (Bay of Fundy)' Sedimentology, 37: 577-612
Dalrymple, R,W. and Makino, Y. 1989 'Description and genesis of tidal bedding in the Cobequid Bay-Salmon River estuary, Bay of Fundy, Canada' In: Taira, A. and Masuda, F. (Eds) 'Sedimentary facies in the active plate margin' Terra Scientific Publishing Company, Tokyo: 15 1 - 177
Dalrymple, R,W., Makino, Y. and Zaitlin, B.A. 1991 'Temporal and spatial patterns of rhythrnite deposition in the macrotidal Cobequid Bay-Salmon River estuary, Bay of Fundy, Canada' In: Smith, D.G., Reinson, G.E., Zaitlin, B.A. and Rahmani, R.A. (Eds) 'Clastic tidal sedimentology' Canadian Society of Petroleum Geologists, Calgary. Memoir No. 16: 137- 160
Dalrymple, R,W., Zaitlin, B.A. and Boyd, R. 1992 'Estuarine facies models: conceptual basis and stratigraphic implications' Journal of Sedimentary Petrology, 62: 1130- 1146
de Mowbray, T. 1983 'The genesis of lateral accretion deposits in recent intertidal mudflat channels, Solway Firth, Scotland' Sedimentology, 30: 425-435
de Mowbray, T., and Visser, M.J. 1984 'Reactivation surfaces in subtidal channel deposits, ~osierschelde, southwest Netherlands' Journal of Sedimentary Petrology, 54: 8 11- 824.
Deynoux, M., Duringer, P., Khatib, R. and Villeneuve, M. 1993 'Laterally and vertically accreted tidal deposits in the Upper Proterozoic Madina - Kouta Basin, southwestern Senegal, West Africa' Sedimentary Geology, 84: 179-1 88
Donahue, R.L., Miller, R.W. and Shickluna, J.C. 1983 'An introduction to soils and plant growth' (Fifth edition) Prentice-Hall, New Jersey
Dorges, J. and Howard, J.D. 1975 'Estuaries of the Georgia Coast, U.S.A.: Sedimentology and biology. IV. Fluvial-marine transition indicators in an estuarine environment, Ogeechee River - Ossabaw Sound' Senckenbergiana Maritima, 7: 137-179
Duncan, G.A. and La Haie, G.G. 1979 'Size analysis procedures used in the sedimentology laboratory, NWRI manual' National Water Research Institute, Canada Centre for Inland Waters
Edzwald, J.K. and O'Melia, C.R. 1975 'Clay distribution in recent estuarine sediments' Clays and Clay Minerals, 23: 39-44
Erlich, R. 1983 'Size analysis wears no clothes, or have moments come and gone?' Journal of Sedimentary Petrology, 53: 1
Evans, G. 1965 'Intertidal flat sediments and their environments of deposition in the Wash' Quarterly Journal of the Geological Society of London, 12 1 : 209-24 1
Evans, O.F. 1949 'Ripple marks as an aid in determining depositional environment and rock sequence' Journal of Sedimentary Petrology, 19: 82-86
Evans, S.G. and Brooks, G.R. 1991 'Prehistoric debris avalanches from Mount Cayley volcano, British Columbia' Canadian Journal of Earth Sciences, 28: 1365- 1374
Ferguson, R.I. 1977 'Meander migration: Equilibrium and change' In: Gregory, K.J. (Ed) 'River channel changes' John Wiley and Sons, Chichester: 235-248
Fielding, C.R. 1985 'Coal depositional models and the distinction between alluvial and delta plain environments' Sedimentary Geology, 42: 41-48
Folk, R.L. 1965 'Petrology of sedimentary rocks' Hemphill's, Austin, Texas.
Folk, R.L. 1966 'A review of grain-size parameters' Sedimentology, 6: 73-93
Folk, R.L. and Ward, W.C. 1957 'Brazos River: a study in the significance of grain size parameters' Journal of Sedimentary Petrology, 27: 3-26
Friedman, G.M. 1967 'Dynamic processes and statistical parameters compared for size frequency distribution of beach and river sands' Journal of Sedimentary Petrology, 37: 327-354
Fritz, W.J. and Harrison, S. 1985 'Transported trees from the 1982 Mount St. Helens sediment flows: their use as paleocurrent indicators' Sedimentary Geology, 42: 49-64
Gibbs, R.J. 198 1 'Floc breakage by pumps' Journal of Sedimentary Petrology, 52: 30- 3 1
Gibbs, R.J. 1982 'Floc stability during Coulter Counter size analysis' Journal of Sedimentary Petrology, 52: 657-660
Gibbs, R.J. and Konwar, L. 1982 'Effect of pipetting on mineral flocs' Environmental Science and Technology, 16: 1 19- 12 1
Gilbert, R. 1978 'Observations on oceanography and sedimentation at Pangnirtung Fiord, Baffin Island' Maritime Sediments, 14: 1-9
Gilbert, R. 1982 'Contemporary sedimentary environments on Baffin Island, N.W.T., Canada: Glaciomarine processes in fiords of eastern Cumberland Peninsula' Arctic and Alpine Research, 14: 1 - 12
Gilbert, R. 1983 'Sedimentary processes of Canadian arctic fjords' Sedimentary Geology, 36: 147-175
Ginsburg, R.G. 1975 'Tidal deposits - a case book of recent examples and fossil counterparts' Springer-Verlag, New York.
Goldring, R., Bosence, D.W.J. and Blake, T. 1978 'Estuarine sedimentation in the Eocene of southern England' Sedimentology, 25: 86 1-876
Government of Canada, Habitat Work Group, 198 1 'Squamish Estuary Management Plan'
Grant, J., Mills, E.L. and Hopper, C.M. 1986 'A chlorophyll budget of the sediment- water interface and the effect of stabilising biofilms on particle fluxes' Ophelia, 26: 207-2 19
Greer, S.A. 1975 'Estuaries of the Georgia coast, U.S.A.: Sedimentology and biology. 111. Sandbody geometry and sedimentary facies at the estuary-marine transition zone, Ossabaw Sound, Georgia: A stratigraphic model' Senckenbergiana Maritima, 7: 105-135
Hails, J.R. and Hoyt, J.H. 1969 'The significance of statistical parameters for distinguishing ancient and modern sedimentary environments of the lower Georgia coastal plain' Journal of Sedimentary Petrology, 39: 559-580
Hantzschel, W. 1939 'Tidal flat deposits (Wattenschlick)' In: Parker, D.T. (Ed) 'Recent marine sediments: a symposium' Society of Economic Paleontologists and Mineralogists. Special Publication No. 1 .Tulsa, Oklahoma: 195-206
Harrison, E.Z. and Bloom, A.L. 1974 'The response of Connecticut salt marshes to the recent rise in sea level' Geological Society of America Abstracts, 6: 35-36
Harrison, E.Z. and Bloom, A.L. 1977 'Sedimentation rates on tidal salt marshes in Connecticut' Journal of Sedimentary Petrology, 47: 1484-1490
Haven, D.S. and Morales-Alamo, R. 1972 'Biodeposition as a factor in sedimentation of fine suspended solids in estuaries' In: Nelson, B.W. (Ed) 'Environn~ental framework of coastal plain estuaries' Geological Society of America, Memoir 133: 121-130
Hayes, M.O. 1976 'Morphology of sand accumulations in estuaries' In: Cronin, L.E. (Ed) 'Estuarine Research' Academic Press. London: 3-22
Herbert, C. 1993 'Early to Middle Triassic fluvial to marine transition in the Sydney Basin' In: Yu, B. and Fielding, C.R. (Eds) '5th International conference on fluvial sedimentology - modern and ancient rivers - their importance to mankind' Conference Proceedings: 5
Hickin, E.J. 1974 'The development of meanders in natural river-channels' American Journal of Science, 274: 414-442
Hickin, E.J. 1989 'Contemporary Squamish Ri\~er sediment flux to Howe Sound, British Columbia' Canadian Journal of Earth Sciences, 26: 1953-1963
Hickin, E.J. and Sichingabula, H.M. 1988 'The geomorphic impact of the catastrophic October 1984 flood on the planform of Squamish River, southwestern British Columbia' Canadian Journal of Earth Sciences, 25: 1078- 1087
Holland, A.F., Zingmark, R.G. and Dean, J.M. 1974 'Quantitative evidence concerning the stabilization of sediments by marine benthic diatoms' Marine Biology, 27: 191- 196
Hooke, J.M. 1984 'Changes in river meanders: a review of techniques and results of analyses' Progress in Physical Geography, 8: 473-508
Hooke, J.M. and Kain, R.J.P. 1982 'Historical change in the physical environment: a guide to sources and techniques' Butterworth Scientific, London
Hooke, J.M. and Perry, R.A. 1976 'The planimetric accuracy of Tithe maps' Cartographic Journal, 13: 177-183
Horne, J.C. and Ferm, J.C. 1976 'Carboniferous depositional environments in the Pocahontas Basin, eastern Kentucky and southern West Virginia - a field guide' Department of Geology, University of South Carolina, Columbia, South Carolina
Hoos, L.M., and Vold, C.L. 1975 'The Squamish River Estuary. Status of environmental knowledge to 1974' Special Estuary Series No. 2. Environment Canada
Howard, J.D., Elders, C.A. and Heinbokel, J.F. 1975 'Estuaries of the Georgia Coast, U.S.A.: Sedimentology and biology. V. Animal-sediment relationships in estuarine point bar deposits, Ogeechee River - Ossabaw Sound, Georgia' Senckenbergiana Maritima, 7: 18 1-203
Howard, J.D. and Frey, R.W. 1973 'Characteristic physical and biogenic sedimentary structures in Georgia estuaries' American Association of Petroleum Geologists Bulletin, 57: 1 169- 1 184
Howard, J.D. and Frey, R.W. 1975 'Estuaries of the Georgia Coast, U.S.A.: Sedi~nentology and biology. I1 Regional animal-sediment relationships' Senckenbergiana Maritima, 7: 33- 103
Huang, N. and Wang, G. 1987 'The new criteria of ancient tidal sediments - tidal cycle sequences' Acta Sedimentologica Sinica, 5: 39-44
Hubbard, J.C.E. and Stebbings, R.E. 1968 'Spartina marshes in southern England VII Stratigraphy of the Keysworth Marsh, Poole Harbour' Journal of Ecology, 56: 707-722
Hughes, D.J. 1977 'Rates of erosion on meander arcs' In: Gregory, K.J. (Ed) 'River channel changes' John Wiley and Sons, Chichester: 193-205
Hurlbut, C.S.Jr. and Klein, C. 1977 'Manual of Mineralogy' 19th Edition. John Wiley and Sons, New York.
Jackson 11, R.G. 1978 'Preliminary evaluation of lithofacies models for meandering alluvial streams' In: Miall, A.D. (Ed) Fluvial Sedimentology. Canadian Society of Petroleum Geologists, Calgary. Memoir 5: 543-576
Jackson 11, R.G. 198 1 'Sedimentology of muddy fine-grained channel deposits in meandering streams of the American Middle West' Journal of Sedimentary Petrology, 5 1 : 1 169- 1 192
Johnston, W.A. 1922 'The character of the stratification of the sediments in the recent delta of Fraser River, British Columbia' Canadian Journal of Geology, 30: 115-129
Jouanneau, J.M. and Latouche, C. 1981 'The Gironde Estuary' In: Fiichtbauer, H, Lisitzyn, A.P., Milliman, J.D. and Seibold, E. 'Contributions to sedimentology, 10' E. Schweizerbart'sche Verlagsbuchhandlung (Nagele u. Obermiller), Stuttgart.
Kalra, Y.P. and Maynard, D.G. 1991 'Methods manual for forest soil and plant analysis' Information report NOR-X-3 19. Forestry Canada, Northwest Region, Northern Forestry Centre.
Kasse, C. 1986 'The tidal character of the formation of Tegelen in northern Belgium' Geologie en Mijnbouw, 65: 41-46
King, C.J.H. 1980 'A sn~all cliff-bound estuarine environment: Sandyhaven Pill in south Wales' Sedimentology, 27: 93-105
Kirby, R. and Parker, W.R. 1983 'Distribution and behavior of fine sediment in the Severn Estuary and Inner Bristol Channel, U.K.' Canadian Journal of Fisheries and Aquatic Sciences, 40, supplement 1: 83-95
Klein, G. de Vries. 1967 'Paleocurrent analysis in relation to modern marine sediment dispersal patterns' Bulletin of the American Association of Petroleum Geologists, 51: 366-382
Klein, G. de Vries. 1970 'Depositional and dispersal dynamics of intertidal sand bars' Journal of Sedimentary Petrology, 40: 1095- 1 127
Klein, G. de Vries. (Ed) 1976 'Holocene tidal sedimentaion' Benchmark papers in Geology, 30. Dowden, Hutchinson and Ross, Stroudsburg, Pennsylvania.
Kostaschuk, R.A. and McCann, S.B. 1983 'Observations on delta-forming processes in a fjord-head delta, British Columbia, Canada' Sedimentary Geology, 36: 269-288
Kranck, K. 1973 'Flocculation of suspended sediment in the sea' Nature, 246: 348-350
Kranck, K. 1975 'Sediment deposition from flocculated suspensions' Sedimentology, 22: 11 1-123

Kranck, K. 198 1 'Particulate matter grain-size characteristics and flocculation in a partially mixed estuary' Sedimentology, 28: 107-1 14
Kreisa, R.D. and Moiola, R.J. 1984 'Sigmoidal bundles and other tidal features' American Association of Petroleum Geologists Bulletin, 68: 497
Kreisa, R.D. and Moiola, R.J. 1986 'Sigmoidal tidal bundles and other tide-generated sedimentary structures of the Curtis Formation, Utah' Geological Society of America Bulletin, 97: 381-387
Krone, R.B. 1978 'Aggregation of suspended particles in estuaries' In: Kjerfve, B. (Ed) 'Estuarine transport processes' University of South Carolina Press, Columbia. p 177-190
Kuenen, Ph. H. 1953 'Significant features of graded bedding' Bulletin of the American Association of Petroleum Geologists, 37: 1044-1066
Land, L.S. and Hoyt, J.H. 1966 'Sedimentation in a meandering estuary' Sedimentology, 6: 19 1-207
Lanier, W.P., Feldman, H.R. and Archer, A.W. 1993 'Tidal sedimentation from a fluvial to estuarine transition, Douglas Group, Missourian-Virgilian, Kansas' Journal of Sedimentary Petrology, 63: 860-873
Letzsch, W.S. and Frey, R.W. 1980 'Deposition and erosion in a Holocene salt marsh, Sapelo Island, Georgia' Journal of Sedimentary Petrology, 50: 529-542
Levings, C.D. 1980 'Consequences of training walls and jetties for aquatic habitats at two British Columbia estuaries' Coastal Engineering, 4: 1 1 1- 136
Lewin, J. 1977 'Channel pattern changes' In: Gregory, K.J. (Ed) 'River channel changes' John Wiley and Sons, Chichester: 167-184
Martini, I.P. 1991 'Sedimentology of subarctic tidal flats of western James Bay and Hudson Bay, Ontario, Canada' In: Smith, D.G., Reinson, G.E., Zaitlin, B.A. and Rahmani, R.A. (Eds) 'Clastic tidal sedimentology' Canadian Society of Petroleum Geologists, Calgary. Memoir No. 16: 301-3 12
Mason, C.C. and Folk, R.L. 1958 'Differentiation of beach, dune and aeolian flat environment by size analysis, Mustang Island, Texas' Journal of Sedimentary Petrology, 28: 2 1 1-226
Matthews, M.D. 1991 'The effect of pretreatment on size analysis' In: Syvitski, J.P.M. (Ed) 'Principles, methods, and application of particle size analysis' Cambridge University Press: 34-42
McCabe, P.J. 1984 'Depositional environments of coal and coal-bearing strata' In: Rahmani, R.A. and Flores, R.M. (Eds) 'Sedimentology of coal and coal-bearing sequences' International Association of Sedimentologists. Specal publication No. 7. Blackwell Scientific Publications, Oxford: 13-42
McKee, E.D. 1965 'Experiments on ripple lamination' In: Middleton, G.V. (Ed) 'Primary sedimentary structures and their hydrodynamic interpretation' Society of Economic Paleontologists and Mineralogists. Special Publication No. 12: 66-83
McKee, E.D. and Weir, G.W. 1953 'Terminology for stratification and cross-stratification in sedimentary rocks' Bulletin of the Geological Society of America, 64: 381-390
McManus, J. 1988 'Grain size determination and interpretation' In: Tucker, M. (Ed) 'Techniques in sedimentology' Blackwell Scientific Publications, Oxford: 63-85
Miall, A.D. 1977 'A review of the braided-river depositional environment' Earth Science Reviews, 13: 1-62
Miall, A.D. 1978a 'Fluvial sedimentology: an historical review' In: Miall, A.D. (Ed.) 'Fluvial sedimentology' Canadian Society of Petroleum Geologists, Memoir No. 5: 1-47
Miall, A.D. 1978b 'Lithofacies types and vertical profile models in braided river deposits: a summary' In: Miall, A.D. (Ed) 'Fluvial Sedimentology' Canadian Society of Petroleum Geologists, Memoir No. 5: 597-604
Miall, A.D. 1984a 'Principles of Sedimentary Basin Analysis' Springer-Verlag, New York.
Miall, A.D. 1984b 'Deltas' In: Walker, R.G. (Ed) 'Facies Models' 2nd edition. Geological Association of Canada Publications. Geoscience Canada, Reprint Series 1: 105- 1 18
Miall, A.D. 1985 'Architectural-Element analysis: A new method of facies analysis applied to fluvial deposits' Earth-Science Reviews, 22: 261-308.
Miall A.D. 1987 'Recent developments in the study of fluvial facies models' In: Ethridge, F.G., Flores, R.M., and Harvey, M.D. (Eds) 'Recent developments in fluvial sedimentology - contributions from the third international fluvial sedimentology conference' Society of Economic Paleontologists and Mineralogists, Special Publication No. 39: 1-9
Micromeritics, 1982 'Instruction manual - SediGraph 5000D particle size analyser (with x- ray shutter)'
Middleton, G.V. 1991 'A short historical review of clastic tidal sedimentology' In: Smith, D.G., Reinson, G.E., Zaitlin, B.A. and Rahmani, R.A. (Eds) 1991 'Clastic tidal sedimentology' Canadian Society of Petroleum Geologists, Calgary, Memoir No. 16: ix-xv
Mitchell, G.C. 1976 'Gr ie~e oil field, Wyoming: a Lower Cretaceous estuarine deposit' Mountain Geologist, 13: 71-87
Mitchell, J. 1932 'The origin, nature, and importance of soil organic constituents having base exchange properties' Journal of the American Society of Agronomy, 24: 256- 275
Montague, C.L. 1986 'Influence of biota on erodibility of sediments' In: Mehta, A.J. (Ed) 'Estuarine cohesive sediment dynamics' Lecture notes on coastal and estuarine studies, 14. Springer-Verlag, Berlin: 25 1-269
Nanson, G.C. 1977 'Channel migration, floodplain formation, and vegetation succession on a meandering-river floodplain in N.E. British Columbia, Canada' Unpublished Ph.D. Thesis, Department of Geography, Simon Fraser University
Nanson, G.C. 1980 'Point bar and floodplain formation of the meandering Beatton River, northwestern British Columbia, Canada' Sedimentology, 27: 3-29
Nelson, D.W. and Sommers, L.E. 1982 'Total carbon, organic carbon, and organic matter' In: (Eds) 'Methods of soil analysis, part 2 - chemical and nicrobiological properties' (Second edition) Agronomy R4onograph No. 9: 539-579
Newton, R.S. 1968 'Internal structure of wave-formed ripple marks in the nearshore zone' Sedimentology, 1 1 : 275-292
Nichols, M.M. and Biggs, R.B. 1985 'Estuaries' In: Davis, R.A. (Ed) 'Coastal sedimentary environments' Springer-Verlag, Berlin: 77-186
Nichols, M.M., Johnson, G.H. and Peebles, P.C. 1991 'Modern sediments and facies model for a microtidal coastal plain estuary, the James Estuary, Virginia' Journal of Sedimentary Petrology, 61: 883-899
Nio, S.D. 1984 'Geometry and sequential development of ancient tide-dominated shelf sand-bodies' Research Symposium on Sedimentology of Shelf Sands and Sandstones. Calgary, Canada. Abstracts: 57
Nio, S.D., Siegenthaler, C. and Yang, C.S. 1983 'Megaripple cross-bedding as a tool for the reconstruction of the palaeo-hydraulics in a Holocene subtidal environment, S.W. Netherlands' In: 'Special issue in the honour of J.D. de Jong' Geologie en Mijnbouw, 62: 499-5 10

Nio, S.D. and Yang, C.S. 1983 'Dynamics, geometry and sequential up-building of large subtidal bedforms' In: Acta Oceanologica Sinica (Ed) 'Sedimentation on the continental shelf, with special reference to the East China Sea' Proceedings of the International Symposium. China Ocean Press, Beijing: 18-33
Nio, S.D. and Yang, C.S. 1991 'Diagnostic attributes of clastic tidal deposits: a review' In: Smith, D.G., Reinson, G.E., Zaitlin, B.A. and Rahmani, R.A. (Eds) 'Clastic tidal sedirnentology' Canadian Society of Petroleum Geologists, Calgary. Memoir 16: 3- 29
Okazaki, H. and Masuda, F. 1989 'Arcuate and bird's foot deltas in thz late Pleistocene Palaeo-Tokyo Bay' In: Whateley, M.K.G. and Pickering, K.T. 1989 (Eds) 'Deltas - sites and traps for fossil fuels' Geological Society Special Publication No. 41. Blackwell Scientific Publications, London: 129- 138
Oornkens, E. and Terwindt, J.H.J. 1960 'Inshore estuarine sediments in the Haringvliet (Netherlands)' Geologie en Mijnbouw, 39: 701-710
Orton, E. 1892 'Occurrence of a Quartz bowlder' American Journal of Science, XLIV: 62- 63
Otto, G.H. 1938 'The sedimentation unit and its use in field sampling' Journal of Geology, 46: 569-582
Ovenshine, A.T., Bartsch-Winkler, S., O'Brein, N.R. and Lawson, D.E. 1976 'Sediment of the high tidal range environment of upper Turnagain Arm, Alaska' In: Miller, T.P. (Ed) 'Recent and ancient sedimentary environments in Alaska' Alaska Geological Society Symposium Proceedings: M 1-M26
Pejrup, M. 1988 'Flocculated suspended sediment in a micro-tidal environment' Sedimentary Geology, 57: 249-256
Pejrup, M. 199 1 'The influence of flocculation on cohesive sediment transport in a rnicrotidal estuary' In: Smith, D.G., Reinson, G.E., Zaitlin, B.A. and Rahmani, R.A. (Eds) 'Clastic tidal sedimentology' Canadian Society of Petroleum Geologists, Calgary. Memoir No. 16: 283-290
Pickard, G.L. and Stanton, B.R. 1980 'Pacific fjords - A review of their water characteristics' In: Freeland, H.J., Farmer, D.M. and Levings, C.D. (Eds) 'Fjord oceanography' Plenum Press, New York: 1-5 1
Posamentier, H.W., Jervey, M.T. and Vail, P.R. 1988 'Eustatic controls on clastic deposition I - Conceptual framework' In: Wilgus, C.K., Hastings, B.S., Kendall, C.G.St.C., Posamentier, H.W., Ross, C.A. and Van Wagoner, J.C. (Eds) 'Sea- level changes: an integrated approach' Society of Economic Paleontologists and Mineralogists. Special Publication No. 42: 109-124
Posamentier, H.W. and Vail, P.R. 1988 'Eustatic controls on clastic deposition I1 - Sequence and systems tract models' In: Wilgus, C.K., Hastings, B.S., Kendall, C.G.St.C., Posamentier, H.W., Ross, C.A. and Van Wagoner, J.C. (Eds) 'Sea- level changes: an integrated approach' Society of Economic Paleontologists and Mineralogists. Special Publication No. 42: 125- 154
Postma, H. 1967 'Sediment transport and sedimentation in the estuarine environment' In: Lauff, G.H. (Ed) 'Estuaries' American Association for the Advancement of Science. Special Publication No. 83: 158- 179
Postma, G. and Cruickshank, C. 1985 'Sedimentology of a late Weicbselian to Holocene terraced fan delta, Varangerfjord, northern Norway' In: Nemec, W. and Steel, R.J. (Eds) 'Fan deltas: sedimentology and tectonic settings' Blackie and Sons Ltd., Glasgow: 144- 157
Price, P.H. 1932 'Erratic boulders in Sewell Coal of West Virginia' Journal of Geology, 40: 61-73
Pritchard, D.W. 1967 'What is an estuary? Physical viewpoint' In: Lauff, G.H. (Ed) 'Estuaries' American Association for the Advancement of Science, Washington. Special Publication No. 83: 3-5
Pronk, M. 1977 'Squamish River cross-sections 1-7 & 1 1- 18 (1977) cross-sections 8, 8A, 8B, 9, and 10 (1976) 76 FDC 10 Section I' Water Investigations Branch, Ministry of the Environment
Pulham, A.J. 1989 'Controls on internal structure and architecture of sandstone bodies within Upper Carboniferous fluvial-dominated deltas, County Clare, western Ireland' In: Whateley, M.K.G. and Pickering, K.T. 1989 (Eds) 'Deltas - sites and traps for fossil fuels' Geological Society Special Publication No. 41. Blackwell Scientific Publications, London: 179-203
Raaf, J.F.M. de and Boersma, J.R. 1971 'Tidal deposits and their sedimentary structures' Geologie en Mijnbouw, 50: 479-504
Rahmani, R.A. 1988 'Estuarine tidal channel and nearshore sedimentation of a late Cretaceous epicontinental sea, Drumheller, Alberta, Canada' In: Boer, P.L., 'Tide- influenced sedimentary environments and facies' In: de Boer, P.L., van Gelder, A and Nio, S.D. (Eds) 'Tide-influenced sedimentary environments and facies' Reidel Publishing Company: 433-47 1
Ranwell, D.S. 1964 'Spartina marshes in southern England - I1 Rate and seasonal pattern of sediment accretion' Journal of Ecology, 52: 79-94
Reading, H.G. 1986 'Facies' In: Reading H.G. (Ed) 'Sedimentary environments and facies' 2nd edition. Blackwell Scientific Publications, Oxford: 4-19
Redfield, A.C. 1972 'Development of a New England salt marsh' Ecological Monographs, 42: 201-237
Reineck, H.E. 1967 'Layered sediments of tidal flats, beaches, and shelf bottoms of the North Sea' In: Lauff, G.H. (Ed) 'Estuaries' American Association for the Advancement of Science, Washington. Special Publication No. 83: 191-206
Reineck, H.E. 1972 'Tidal flats' In: Rigby, J.K. and Hamblin, W.K. (Eds) 'Recognition of ancient sedimentary environments' Society of Economic Paleontologists and Mineralogists. Special Publication, 16: 146- 159
Reineck, H.E., and Singh, I.B. 1967 'Primary sedimentary structures in the recent sediments of the Jade, North Sea' Marine Geology, 5: 227-235
Reineck, H.E., and Singh, I.B. 1980 'Depositional sedimentary environments - with reference to terrigenous elastics' 2nd edition. Springer-Verlag, Berlin
Reineck, H.E., and Wunderlich, F. 1968 'Classification and origin of faser and lenticular bedding' Sedimentology, 1 1 : 99- 104
Richard, G.A. 1978 'Seasonal and environmental variations in sediment accretion in a Long Island salt marsh' Estuaries, 1 : 29-35
Richards, F.J. 1934 'The salt marshes of the Dovey estuary' Annals of Botany, 48: 225-259
Robinson, W.O. 1927 'The determination of organic matter in soils by means of hydrogen peroxide' Journal of Agricultural Research, 34: 339-356
Roep, Th. B. 1991 'Neap-spring cycles in a subrecent tidal channel fill (3665 BP) at Schoorldam, NW Netherlands' Sedimentary Geology, 7 1 : 2 13-230
Rood, K.M. and Hickin, E.J. 1989 'Suspended-sediment concentration and calibre in relation to surface-flow structure in Squamish River estuary, southwestern British Columbia' Canadian Journal of Earth Sciences, 26: 2 172-2 176
Roy, R.N. and Biswas, A.B. 1975 'Use of grain-size parameters for identification of depositional processes and environments of sediments' Indian Journal of Earth Sciences, 2: 154- 162
Royse, C.F. 1970 'A sedimentologic analysis of the Tongue River-Sentinel Butte Interval (Paleocene) of the Williston Basin, western North Dakota' Sedimentary Geology, 4: 19-80
Schlee, J., Uchupi, E. and Trumbull, J.V.A. 1965 'Statistical parameters of Cape Cod beach and eolian sands' United States Geological survey Proffesional paper 501-D: 118-122
Selley, R.C. 1985 'Ancient sedimentary environ~nents and their sub-surface diagnosis' Third Edition. Chapman and Hall, London.
Simons, D.B., Richardson, E.V. and Nordin, C.F. 1965 'Sedimentary structures generated by flow in alluvial channels' In: Middleton, G.V. (Ed) 'Primary sedimentary structures and their hydrodynamic interpretation' Society of Economic Paleontologists and Mineralogists, Special Publication 12: 34-52
Singh, I.B. 1969 'Primary sedimentary structures in Precambrian quartzites of Telemark, southern Norway, and their environmental significance' Norsk Geologisk Tidsskrift, 49: 1-3 1
Singh, I.B. and Wunderlich, F. 1978 'On the terms wrinkle narks (Runzelmarken), millimetre ripples, and mini ripples' Senckenbergiana Maritima, 10: 75-83
Smith, D.G. 1987 'Meandering river point bar lithofacies models: modern and ancient examples compared' In: Ethridge, F.D., Flores, R.M. and Harvey, M.D. (Eds) 'Recent developments in fluvial sedimentology' Society of Economic Paleontologists and Mineralogists, Special Publication 39: 83-9 1.
Smith, D.G. 1988a 'Modern point bar deposits analogous to the Athabasca oil sands, Alberta, Canada' In: de Boer, P.L., van Gelder, A and Nio, S.D. (Eds) 'Tide- influenced sedimentary environments and facies' Reidel Publishing Company: 41 7- 432
Smith, D.G. 1988b 'Mesotidal estuary point bar deposits: a comparative sedimentology of modern and ancient examples in peels and core' In: James, D.P. and Leckie, D.A. (Eds) 'Sequences, stratigraphy, sedimentology: surface and subsurface' Proceedings of the Canadian Society of Petroleum Geologists Technical Meeting, Calgary. Memoir No. 15: 584
Smith, D.G. 1988c 'Tidal bundles and mud couplets in the Mchllurray Formation, northeastern Alberta, Canada' Bulletin of Canadian Petroleum Geology, 36: 2 16- 2 19
Smith, D.G. 1989 'Comparative sedimentology of mesotidal (2 to 4m) estuarine channel point bar deposits from modern examples and ancient Athabasca Oil Sands (Lower Cretaceous), McMurray Formation' In: Reinson, G.E. (Ed) 'Modern and ancient examples of clastic tidal deposits - a core and peel workshop' Second International research symposium on clastic tidal deposits, Canadian Society of Petroleum Geologists: 60-65
Stearns, L.A. and MacReary, D. 1957 'The case of the vanishing brick dust' Mosquito News. 17: 303-304
Stevenson, J.C., Kearney, M.S. and Pendleton, E.C. 1985 'Sedimentation and erosion in a Chesapeake Bay brackish marsh system' Marine Geology, 67: 213-235
Stumpf, R.P. 1983 'The process of sedimentation on the surface of a salt marsh' Estuarine Coastal and Shelf Science, 17: 495-508
Sundborg, A. 1956 'The River Klaralven, a study of fluvial processes' Geographiska Annaler, 38: 127-3 16
Syvitski, J.P.M., Burrell, D.C. and Skei, J.M. 1987 'Fjords - Processes and Products' Springer-Verlag, New York.
Syvitski, J.P.M. and Farrow, G.E. 1983 'Structures and processes in bayhead deltas: Knight and Bute Inlet, British Columbia' Sedimentary Geology, 36: 217-244
Syvitski, J.P.M. and Murray, J.W. 198 1 'Particle interaction in fjord suspended sediment' Marine Geology, 39: 2 15-242
Syvitski, J.P.M. and Skei, J.M. 1983 'Preface - sedimentology of fjords' Sedimentary Geology, 36: 75-80
Tanner, W.F. 1967 'Ripple mark indeces and their uses' Sedimentology, 9: 89-104
Tchillingarian, G. 1952 'Study of the dispersing agents' Journal of Sedimentary Petrology, 22: 229-233
Terwindt, J.H.J. 197 1 'Litho-facies of inshore estuarine and tidal-inlet deposits' Geologie en Mijnbouw, 50: 515-526
Terwindt, J.H.J. 1981 'Origins and sequences of sedimentary structures in inshore mesotidal deposits of the North Sea' In: Nio, S.D., Shuttenhelm, R.T.E. and van Weering, Tj.C.E. (Eds) 'Holocene marine sedimentation in the North Sea Basin' International Asociation of Sedi~nentologists Special Publication No. 5: 4-26
Tessier, B. and Gigot, P. 1989 'A vertical record of different tidal cyclicities: an example from the Miocene marine molasse of Digne (Haute Provence, France)' Sedimentology, 36: 767-776
Thomas, R.G., Smith, D.G., Wood, J.M., Visser, J., Calverley-Range, E.A., and Koster, E.H. 1987 'Inclined heterolithic stratification - terminology, description, interpretation and significance' Sedimentary Geology, 53: 123-179
Thornson, R.E. 198 1 'Oceanography of the British Columbia coast' In: 'Fisheries and Aquatic sciences' Canadian Special Publication, 56: 1-291
Thorne, C.R. 1982 'Processes and mechanisms of river bank erosion' In: Hey, R.D., Bathurst, J.C. and Thorne, C.R. (Eds) 'Gravel-bed rivers - fluvial process, engineering and management' John Wiley and Sons Ltd, New York: 227-27 1
Thrower, J.S. and Schmidt, M.G. 1985 'Forest soils laboratory manual' Lakehead forestry manual no. 8, 3rd edition. School of Forestry, Lakehead University, Thunder Bay, Ontario.
Turnbull, W.J., Krinitzsky, M. and Weaver, F.J. 1966 'Bank erosion in soils of the Lower Mississippi Valley' Journal of the Soil Mechanics and Engineering Division, American Society of Civil Engineers, 92: 12 1- 136
Twenhofel, W.H. 1917 'ART. XXXIII - Granite bowlders in (?) the Pennsylvanian strata of Kansas' American Journal of Science, XLIII: 363-380
Van Beek, J.L. and Koster, E.A. 1972 'Fluvial and estuarine sediments exposed along the Oude Maas (the Netherlands)' Sedimentology, 19: 237-256
Van Den Berg, J.H. 1981 'Rhythmic seasonal layering in a mesotidal channel fill sequence, Oosterschelde Mouth, the Netherlands' In: Nio, S.D., Shuttenhelm, R.T.E. and van Weering, Tj.C.E. (Eds) 'Holocene marine sedimentation in the North Sea Basin' International Asociation of Sedimentologists Special Publication No. 5: 147-159.
van Straaten, L.M.J.U. 1950a 'Environment of formation and facies of the Wadden Sea sediments' Koninkl Aardricjk Genootsch, 67: 94-108
van Straaten, L.M.J.U. 1950b 'Giant ripples in tidal channels' Koninkl Aardricjk Genootsch, 67: 336-341
van Straaten, L.M.J.U. 1953 'Megaripples in the Dutch Wadden Sea and in the Basin of Arcachon (France)' Geologie en Mijnbouw, 15: 1-1 1
van Straaten, L.M.J.U. 1954 'Sedimentology of recent tidal flat deposits and the Psammites du Condroz (Devonian)' Geologie en Mijnbouw, 16: 25-47
van Straaten, L.M.J.U. 1959 'Minor structures of some recent littoral and neritic sediments' Geologie en Mijnbouw, 2 1 : 197-2 16
van Straaten, L.M.J.U. and Kuenen, Ph.H. 1957 'Accumulation of fine grained sediments in the Dutch Wadden Sea' Geologie en Mijnbouw, 19: 329-354
van Straaten, L.M.J.U. and Kuenen, Ph.H. 1958 'Tidal action as a cause of clay accumulation' Journal of Sedimentary Petrology, 28: 406-4 13
Vanderburgh, S. 1987 'Geomorphology and sedimentology of the Holocene Slave River delta, Northwest Territories' Unpublished M.Sc. Thesis, Department of Geography, University of Calgary
Visher, G.S. 1965 'Fluvial processes as interpreted from ancient and recent fluvial deposits' In: Middleton, G.V. (Ed) 'Primary sedimentary structures and their hydrodynamic interpretation' Society of Economic Paleontologists and Mineralogists, Special Publication No. 12: 116- 132
Visher, G.S. 1969 'Grain size distributions and depositional processes' Journal of Sedimentary Petrology, 39: 1077- 1 106
Visser, M.J. 1980 'Neap-spring cycles reflected in Holocene subtidal large-scale bedform deposits: a preliminary note' Journal of Geology, 8: 543-546.
Visser, M.J. and de Boer, P.L. 1982 'The effect of the diurnal inequality on tidal sediments: a tool for the recognition of tidal influences' International Association of Sedimentologists. Abstracts of papers, 1 lth Congress on Sedimentology. McMaster University: 165
Vitturi, L.M. and Rabitti, S. 1980 'Automatic particle-size analysis of sediment fine fraction by SediGraph 5000D' Geologia Applicata i Idrogeologia, 15: 10 1 - 108
Vos, P.C., de Boer, P.L. and Misdorp, R. 1988 'Sediment stabilization by benthic diatoms in intertidal sandy shoals; qualitative and quantitative observations' In: de Boer, P.L., van Gelder, A and Nio, S.D. (Eds) 'Tide-influenced sedimentary environments and facies' Reidel Publishing Company: 5 11-526
Walker, R.G. (Ed) 1984 'Facies Models' 2nd edition. Geological Association of Canada Publications. Geoscience Canada, Reprint Series 1
Walker, R.G. and Cant, D.T. 1984 'Sandy fluvial systems' In: Walker, R.G. (Ed) 'Facies Models' 2nd edition. Geological Association of Canada Publications. Geoscience Canada, Reprint Series 1 : 7 1-89
Water Survey of Canada 'Surface water data - British Columbia' Inland Waters Directorate, Water Resources Branch, Ottawa
Wiebe, K. 1976 Progress report Squamish River estuary morphological survey, internal report of the Sediment Survey Section, Applied Hydrology Division, Water Resources Branch, Fisheries and Environment, Ottawa, Canada
Williams, G.E. 1989 'Late Precambrian tidal rhythmites in south Australia and the history of the Earth's rotation' Journal of the Geological Society of London, 146: 97- 11 1
Woodyer, K.D., Taylor, G. and Crook, K.A.W. 1979 'Depositional processes along a very low gradient, suspended-load stream: the Barwon River, New South Wales' Sedimentary Geology, 22: 97- 120
Yeo, R.K. and Risk, M.J. 1981 'The sedimentology, stratigraphy, and preservation of intertidal deposits in the Minas Basin system, Bay of Fundy' Journal of Sedimentary Petrology, 5 1 : 245-260
Zaitlin, B.A. and Shultz, B.C. 1984 'An estuarine-embayment fill model from the Lower Cretaceous Mannville Group west-central Saskatchewan' In: Stott, D.F. and Glass, D.J. (Eds) 'The Mesozoic of middle North America' Canadian Society of Petroleum Geologists. Memoir No. 9: 455-469
Zrymiak, P. and Durette, Y.J. 1979 'An investigation of the morphological processes occurring in the Squamish River estuary' Proceedings of the 4th National Hydrotechnical Conference, Environment Canada