estimation of radioactive leakages into the pacific ocean due to fukushima nuclear accident
TRANSCRIPT
ORIGINAL ARTICLE
Estimation of radioactive leakages into the Pacific Oceandue to Fukushima nuclear accident
R. N. Nair • Faby Sunny • Manish Chopra •
L. K. Sharma • V. D. Puranik • A. K. Ghosh
Received: 22 October 2012 / Accepted: 15 April 2013
� Springer-Verlag Berlin Heidelberg 2013
Abstract High concentrations of several radionuclides
were reported in the sea near the Fukushima Daiichi
Nuclear Power Station (FDNPS) in Japan due to the
nuclear accident that occurred on 11 March 2011. The
main source of these concentrations was leakage of highly
radioactive liquid effluent from a pit in the turbine building
near the intake canal of Unit-2 of FDNPS through a crack
in the concrete wall. In the immediate vicinity of the plant,
seawater concentrations reached 68 MBq m-3 for 134Cs
and 137Cs, and exceeded 100 MBq m-3 for 131I in early
April 2011. These concentrations began to fall as of 11
April 2011 and, at the end of April, had reached a value
close to 0.1 MBq m-3 for 137Cs. Following the nuclear
accident, the Tokyo Electric Power Company (TEPCO)
had initiated intense monitoring of the environment
including the Pacific Ocean. Seawater samples were col-
lected and the concentrations of few radionuclides were
measured on a wide spatial and temporal scale. In this
study, the measured concentrations of different radionuc-
lides near the south discharge canal of the FDNPS were
used to estimate their leakages into the Pacific Ocean. The
method is based on estimating the release rates that
reproduce the concentration of radionuclides in seawater at
a chosen location using a two-dimensional advection–dis-
persion model in an iterative manner. The radioactive
leakages were estimated as 5.68 PBq for 131I, 2.24 PBq for134Cs and 2.25 PBq for 137Cs. Leakages were also esti-
mated for 99mTc, 136Cs, 140Ba and 140La and they range
between 0.02 PBq (99mTc) and 0.53 PBq (140Ba). It was
estimated that about 11.28 PBq of radioactivity in total was
leaked into the Pacific Ocean from the damaged FDNPS.
Out of this, 131I constitutes 50.3 %; 134Cs 20 %; 137Cs
20 %; 140Ba 4.6 %; 136Cs 2.6 %; 140La 2.3 % and 99mTc
0.2 % of the total radioactive leakage. Such quantitative
estimates of radioactive leakages are essential prerequisites
for short-term and local-scale as well as long-term and
large-scale radiological impact assessment of the nuclear
accident.
Keywords Fukushima � Daiichi Nuclear Power Station �Nuclear accident � Pacific Ocean � Advection–dispersion
model � Radionuclide concentration � Radioactive leakage �Radioactive release � Source reconstruction
Introduction
The Tohoku earthquake and tsunami of 11 March 2011
caused extensive damage to the Fukushima Daiichi nuclear
Electronic supplementary material The online version of thisarticle (doi:10.1007/s12665-013-2501-1) contains supplementarymaterial, which is available to authorized users.
R. N. Nair (&) � F. Sunny � M. Chopra �L. K. Sharma � V. D. Puranik
Environmental Assessment Division, Bhabha Atomic Research
Centre, Mumbai 400 085, India
e-mail: [email protected]
F. Sunny
e-mail: [email protected]
M. Chopra
e-mail: [email protected]
L. K. Sharma
e-mail: [email protected]
V. D. Puranik
e-mail: [email protected]
A. K. Ghosh
Health, Safety and Environment Group, Bhabha Atomic
Research Centre, Mumbai 400 085, India
e-mail: [email protected]
123
Environ Earth Sci
DOI 10.1007/s12665-013-2501-1
power station (FDNPS) in Japan. This severe nuclear
accident had resulted in large amounts of radioactive fall-
out over land and the sea that peaked in the middle of
March 2011 (Chino et al. 2011; Morino et al. 2011;
Yasunari et al. 2011; NISA 2011; TEPCO 2011). In addi-
tion to radioactive fallout over the sea, water used to cool
the nuclear reactor cores leaked from the reactor buildings
to the Pacific Ocean with large amounts of radioactivity of
a spectrum of radionuclides (IAEA 2011; IRSN 2011;
MEXT 2011; Tsumune et al. 2012). Other sources of
marine radioactive contamination were the voluntary dis-
charge of low contaminated water from the reactor build-
ings to increase the on-site storage capacity for highly
contaminated water and transport of radioactive material
by rainwater runoffs of contaminated soils (Bailly du Bois
et al. 2012). A leak of highly contaminated water to sea
from a pit adjacent to Unit-2 of FDNPS through a crack on
the wall was confirmed on 2 April 2011, which was sealed
off on 6 April 2011 (TEPCO 2011). On 4 April 2011, a
planned discharge to sea commenced from FDNPS of
11,500 tonnes of low-level radioactive water that had been
stored on site awaiting treatment to create storage capacity
for the highly radioactive water that had collected in var-
ious parts of the site. Nearly 70,000 tonnes of heavily
contaminated water need to be moved from turbine build-
ings and trenches so that workers could gain access
(Wakeford 2011).
The concentrations of 137Cs in seawater off the eastern
Japan coast prior to the nuclear accident were between 1
and 4 Bq m-3 (Nakanishi et al. 2011). Measurements of
radionuclides in seawater revealed significantly high levels
of concentrations towards the end of March 2011. Seawater
concentrations reached 68 MBq m-3 for 134Cs and 137Cs
and exceeded 100 MBq m-3 for 131I in early April 2011
(Bailly du Bois et al. 2012). These concentrations began to
fall as of 11 April 2011 and, at the end of April, had
reached a value close to 0.1 MBq m-3 for 137Cs (IRSN
2011). The concentrations measured in seawater before 30
March 2011 were primarily due to radioactive fallout from
the atmosphere and they varied from 2 to 27 kBq m-3 for137Cs and 3 to 57 kBq m-3 for 131I (IRSN 2011). The
radionuclide with short half-lives like 131I ceased to be
detectable after a few months and should not have any
large-scale and long-term impact. Others, like 137Cs will
persist in the marine environment for several years. Their
persistence in the water column is dependent on the
respective affinity of the radionuclides for the particles in
suspension in surface waters which are likely to settle and
carry the radionuclides to the sea bed. During the first
month of leakage, the ratio of 134Cs/137Cs uniformly
showed a value of unity. This makes the tracking of
Fukushima-derived radionuclides in the ocean quite
straightforward, since the only source of 134Cs, considering
its short half-life, in the North Pacific Ocean at this time
would be the FDNPS accident (Buesseler et al. 2012).
A 134Cs/137Cs activity ratio of unity is considerably
higher than what it was 25 years ago when a ratio of 0.54
was reported in Chernobyl fallout (Aarkrog 1988). In the
oceans, the behaviour of cesium is conservative and
about one per cent of it is attached to marine particles.
However, this small fraction at such a high concentration
levels as observed near the FDNPS will result in high
concentrations in sediments and biota in seawater and
will continue to remain so for at least 30–100 years due
to the long half-life of 137Cs (Bowen et al. 1980;
Buesseler et al. 1991). Considerable attention was given
to 131I leakages due to its relatively high activities and
tendency to accumulate in the human thyroid if ingested
via land-based food supply or if bio-concentrated by
seaweeds and consumed as part of the Japanese diet.
Coastal water concentrations of different radionuclides
were decreased by a factor of 1,000 in the month fol-
lowing the peak release. This is a consequence of ocean
mixing and reduction in the radioactive leakages into the
sea. According to Buesseler et al. (2012) direct radioac-
tive releases into the Pacific Ocean were dominated by
leakages from the FDNPS Unit 2 during April 1–6, 2011.
The radioactive leakages from the turbine building of the
FDNPS are considered as direct releases and radioactive
fallout from atmospheric emissions as indirect releases
into the Pacific Ocean in the present study.
The releases of different radionuclides into the Pacific
Ocean due to leakage of highly radioactive effluent from
the FDNPS are estimated in this study using a simple and
quick methodology (source reconstruction). The method-
ology utilizes the concentrations at a chosen location
measured at different times. Such quantitative estimates
of radionuclide releases into the environment are neces-
sary for assessing the short-term and local-scale as well as
long-term and large-scale radiological impact of the
nuclear accident. Few studies on the estimation of
radioactive leakages into the Pacific Ocean following the
nuclear accident at the FDNPS are reported in the liter-
ature. IRSN (2011), based on the concentrations measured
in the water pooled in the turbine hall of Unit-2, esti-
mated that about 2.3 PBq of 137Cs could have been leaked
into the sea. They also estimated that about 3.3 PBq of131I could have been leaked into the sea. According to
Bailly du Bois et al. (2012) about 22 PBq of 137Cs was
leaked into the Pacific Ocean in total at the end of the
major leakage on 8 April 2011. Tsumune et al. (2012)
used a regional ocean model to simulate 137Cs concen-
trations due to leakages into the sea off Fukushima and
found that a total amount of (3.5 ± 0.5) PBq of 137Cs was
leaked into the sea from 26 March 2011 to the end of
May 2011. The simulated temporal change in 137Cs
Environ Earth Sci
123
concentrations near Fukushima agreed well with obser-
vations in this case. Buesseler et al. (2012) based on a
simple trapezoidal integration of the nuclide vs. depth
profiles of concentrations estimated the inventory of 137Cs
in the sea as 2 PBq following the nuclear accident at the
FDNPS. TEPCO (2011) analyzed the accumulated waters
in the turbine buildings of Unit-2; which leaked into the
sea; and evaluated the concentrations of 131I (5.4 TBq
m-3), 134Cs (1.8 TBq m-3) and 137Cs (1.8 TBq m-3).
The diameter of the crack on the wall was reported as
3 cm; height of the outflow as 75 cm and the flying
distance of the outflow jet as 65 cm (TEPCO 2011).
Using jet flow dynamics, TEPCO (2011) had calculated
the total outflow volume for 5 days as 520 m3. The
product of this volume and the concentrations of the ra-
dionuclides in the pit yielded their leakages on an
empirical basis. The estimated leakages were 2.81 PBq
for 131I, 0.94 PBq for 134Cs and 0.94 PBq for 137Cs.
Later, TEPCO (2012) revised the radioactive leakage
estimates using an oceanic circulation and dispersion
model. The model was used to estimate the radioactive
leakages that reproduced the measured concentrations of
radionuclides in the sea. The estimated leakages were
11 PBq for 131I, 3.5 PBq for 134Cs and 3.6 PBq for 137Cs
(TEPCO 2012).
Most of these studies reported the leakage of 137Cs into
the Pacific Ocean from FDNPS following the accident.
Few studies reported the leakages of 131I and 137Cs. The
present study estimates the radioactive leakages of 7 ra-
dionuclides such as 131I, 134Cs, 136Cs, 137Cs, 99mTc, 140Ba
and 140La based on their measured concentrations using
an iteration technique of a two-dimensional advection–
dispersion model. Out of these radionuclides, 136Cs,99mTc, 140Ba and 140La are very short-lived ones. Their
radiological impact on the environment is trivial. How-
ever, knowledge on the estimates of their leakages during
a nuclear accident is useful for accounting for all the
radioactive releases from the damaged nuclear power
plants as well as for understanding the features of such
accidents.
Methodology
Advection–dispersion model
Realistic and credible environmental models that simu-
late the transfer and accumulation of radionuclides in
specific media are essential for predicting doses and risks
to human health and environmental quality from past,
present and future contamination (Whicker et al. 1999).
Many studies are available on modelling of both natural
and anthropogenic radioactivity transport in the
environment, dose and risk assessment (Yadigaroglu and
Munera 1987; Thiessen et al. 1999; Bobba et al. 2000;
IAEA 2001; Monte et al. 2009; Aksoy and Guney 2010;
Gonzalez-Fernandez et al. 2012; Yadav et al. 2012).
Environmental models can be classified into forward
models and inverse models depending on their purpose.
Forward modelling is used to estimate the concentrations
of pollutants in the environment based on flow and
dispersion parameters when the source parameters are
specified. Inverse modelling is used for parameter esti-
mation including the source strength, location and time
of origin from known concentrations observed at various
locations and instants of time. However, forward mod-
elling can also be used for parameter estimation provided
the modelling scheme includes the possible uncertainties
in the known parameters including those in the measured
concentrations. Such a study has been carried for the
source reconstruction in this work using a two-dimen-
sional advection–dispersion model as shown below
(IAEA 1985):
oC
ot¼ o
oxDx
oC
ox
� �þ o
oyDy
oC
oy
� �� �� Ux
oC
oxþ Uy
oC
oy
� �
� kC þ Q
ð1Þ
where C is the concentration of the radionuclide (Bq m-3),
x is the axis along the flow direction (m), y is the lateral
axis (m), Ux is the water flow velocity along the x-axis
(m s-1), Uy is the water flow velocity along the y-axis
(m s-1), Dx is the longitudinal hydrodynamic dispersion
coefficient (m2 s-1), Dy is the lateral hydrodynamic dis-
persion coefficient (m2 s-1), k is the radioactive decay
constant (s-1), Q is any source term (Bq m-3 s-1) and t is
the time elapsed after release (s).
Assuming a straight coastline, constant water flow
velocity along the coast (Uy = 0), constant water depth and
constant hydrodynamic dispersion coefficients, the solution
of the two-dimensional advection–dispersion model for an
instantaneous release of unit radioactivity (1 Bq) from a
vertical line source at x = 0 and y = ys for a semi-infinite
medium is given by (Schreiber 1978):
Ci x; y; tð Þ ¼ X x; tð Þ Y y; tð Þ=h ð2Þ
where x varies from -? to ?, y varies from 0 to ?, Ci is
the concentration of the radionuclide due to instantaneous
release (Bq m-3) and h is the average mixing depth in the
coastal sea (m). The definitions of X and Y are given below
(Schreiber 1978):
Xðx; tÞ ¼ 1ffiffiffiffiffiffiffiffiffiffiffiffi4pDxtp exp � ðx� UxtÞ2
4Dxt
!� kt
" #ð3Þ
Environ Earth Sci
123
Yðy; tÞ ¼ 1ffiffiffiffiffiffiffiffiffiffiffiffi4pDyt
p exp � ðy� ysÞ2
4Dyt
!" #þ exp � ðyþ ysÞ2
4Dyt
!" #( )
ð4Þ
where ys is the distance between discharge outfall and coast
(m).
The concentration of a radionuclide in seawater during
the release period due to continuous release, Cd (Bq m-3),
can be evaluated by integrating Eq. 2 with respect to time
as given below:
Cdðx; y; tÞ ¼ q
ZT
0
Ciðx; y; sÞds ð5Þ
where q is the constant release (leakage) rate of the
radionuclide for a specified release period (Bq s-1), T is the
release period (s) and Ci is the concentration due to
instantaneous release of unit radioactivity. Equation 5 can
be used to estimate the concentrations of radionuclides due
to continuous release during the release period.
The concentration of a radionuclide in seawater during
the post release period (after termination of the release)
can be evaluated by the convolution integral given
bedlow:
Cpðx; y; tÞ ¼ q
ZT
0
Ciðx; y; t þ sÞds ð6Þ
where Cp is the concentration during the post release period
(Bq m-3) and t is the post release period (s) whose origin is
at the end of the release period, T. The total time involved
is (T ? t).
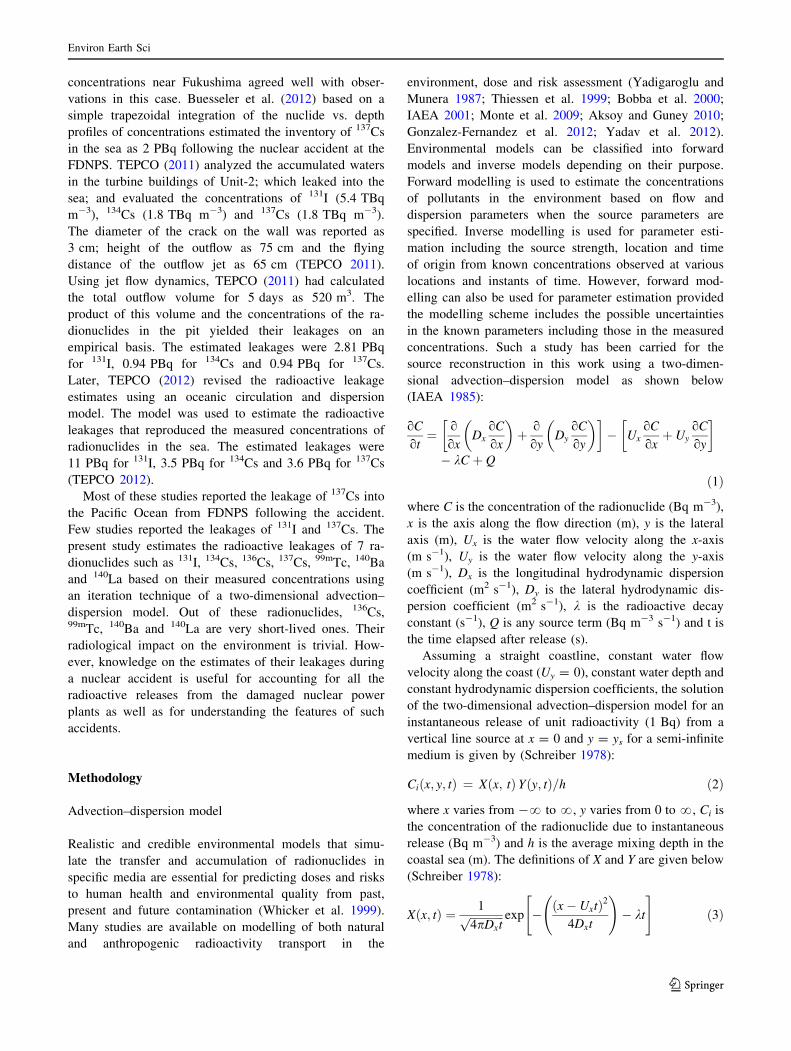
The measured concentrations of radionuclides in sea-
water on a spatial and temporal scale are the basic data to
be used in the source reconstruction exercise. Equation 5
was used to calculate the concentrations of different ra-
dionuclides for a specified time within the release (leakage)
period at a chosen location, where measured concentrations
were available, assuming 1 Bq s-1 release of each radio-
nuclide due to leakage. The resulting concentrations of
each radionuclide at this distance were compared with the
measured concentrations at the same distance and the ratio
between them was used to scale up or scale down the
release (leakage) rates of the radionuclides. These calcu-
lations were repeated for many combinations of hydro-
logical parameters within the range of their reported values
pertaining to the study region for a radionuclide and the
average release rate of the radionuclide due to leakage was
derived. The total released quantity of a radionuclide due to
leakage is equal to the product of the release rate and the
period of release. The schematic of the methodology is
given in the flow chart.
Set release rate (q), Period of release (T), Number of parameter combinations (N)
Select the advection-dispersion model (ADM)
Select one set of hydrological parameters
Collect the data on measured concentration for a specified time within the release period at a chosen location
Simulate the ADM to calculate the concentration at the chosen location
Estimate the ratio, R, between measured concentration and estimated concentration
Scale up/down the assumed release rate, q, using the ratio, R (=qR)
Are all the N sets of input data used?
Yes
No
Estimate the average release rate and standard deviation. Find out the total release by multiplying the average release rate by the period of release
Input data
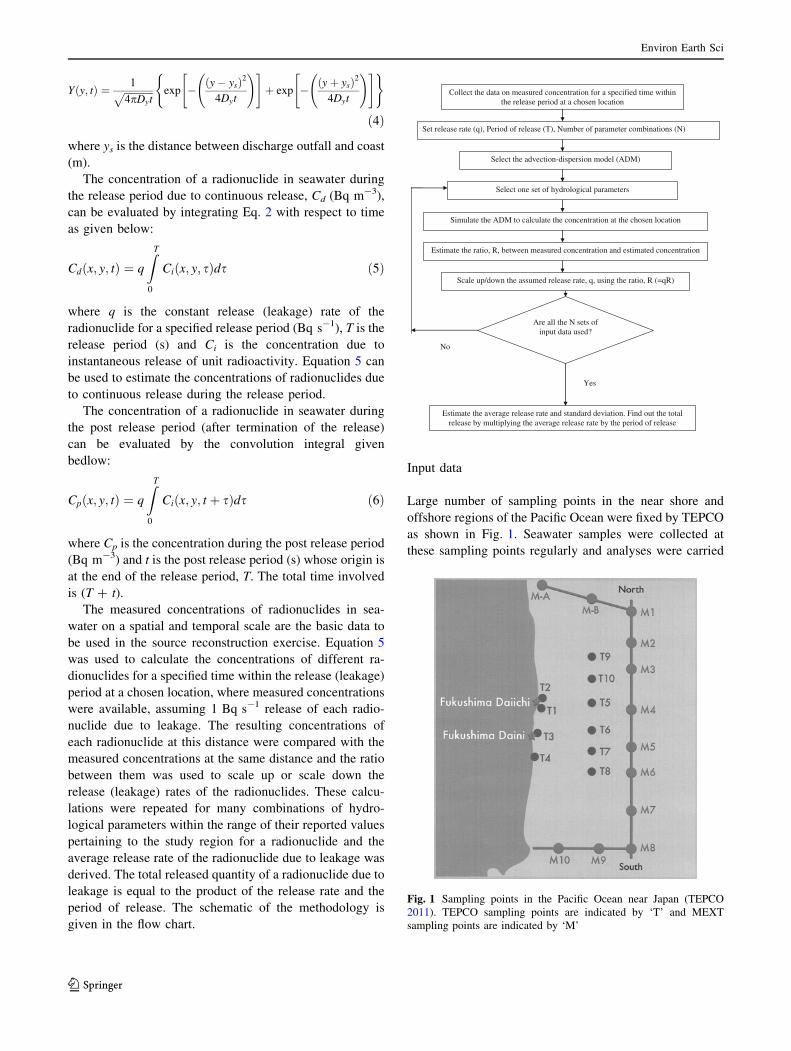
Large number of sampling points in the near shore and
offshore regions of the Pacific Ocean were fixed by TEPCO
as shown in Fig. 1. Seawater samples were collected at
these sampling points regularly and analyses were carried
Fig. 1 Sampling points in the Pacific Ocean near Japan (TEPCO
2011). TEPCO sampling points are indicated by ‘T’ and MEXT
sampling points are indicated by ‘M’
Environ Earth Sci
123
out to evaluate the concentrations of several radionuclides
(TEPCO 2011). Figure 1 shows that Sampling Point T1 is
around the south discharge canal of FDNPS which is
approximately 330 m from the Unit-4 canal. Sampling
Point T2 is around the north discharge canal of FDNPS
which is approximately 30 m from the discharge canal of
Units-5 and 6. Sampling Point T3 is at the north discharge
canal of Fukushima Daini Nuclear Power Station, which is
approximately 10 km from the FDNPS in the downstream
direction. Sampling Point T4 is along the Iwasawa Sea-
coast in the downstream direction, which is about 16 km
from the FDNPS or about 7 km from the Daini Nuclear
Power Station at Fukushima. Sampling Point T5 is about
15 km offshore from the FDNPS. Sampling Point T6 is
about 15 km offshore from the Daini Nuclear Power Sta-
tion at Fukushima. Sampling Point T7 is about 15 km
offshore from the Iwasawa Beach. Sampling Point T8 is
about 15 km offshore from Hirono Town; Sampling Point
T9 is about 15 km offshore from Minami-Soma City and
Sampling Point T10 is about 15 km offshore from Uke-
dogawa River. The MEXT (Ministry of Education, Culture,
Sports, Science and Technology) samplings points are
indicated with M in this figure.
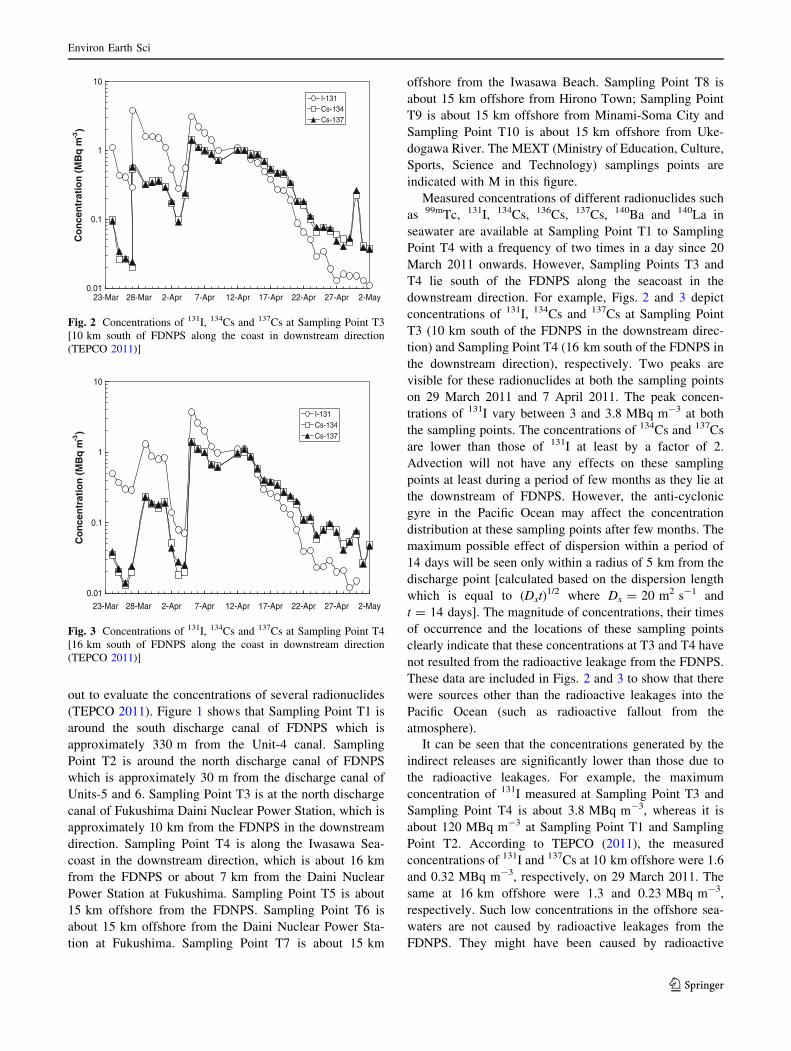
Measured concentrations of different radionuclides such
as 99mTc, 131I, 134Cs, 136Cs, 137Cs, 140Ba and 140La in
seawater are available at Sampling Point T1 to Sampling
Point T4 with a frequency of two times in a day since 20
March 2011 onwards. However, Sampling Points T3 and
T4 lie south of the FDNPS along the seacoast in the
downstream direction. For example, Figs. 2 and 3 depict
concentrations of 131I, 134Cs and 137Cs at Sampling Point
T3 (10 km south of the FDNPS in the downstream direc-
tion) and Sampling Point T4 (16 km south of the FDNPS in
the downstream direction), respectively. Two peaks are
visible for these radionuclides at both the sampling points
on 29 March 2011 and 7 April 2011. The peak concen-
trations of 131I vary between 3 and 3.8 MBq m-3 at both
the sampling points. The concentrations of 134Cs and 137Cs
are lower than those of 131I at least by a factor of 2.
Advection will not have any effects on these sampling
points at least during a period of few months as they lie at
the downstream of FDNPS. However, the anti-cyclonic
gyre in the Pacific Ocean may affect the concentration
distribution at these sampling points after few months. The
maximum possible effect of dispersion within a period of
14 days will be seen only within a radius of 5 km from the
discharge point [calculated based on the dispersion length
which is equal to (Dxt)1/2 where Dx = 20 m2 s-1 and
t = 14 days]. The magnitude of concentrations, their times
of occurrence and the locations of these sampling points
clearly indicate that these concentrations at T3 and T4 have
not resulted from the radioactive leakage from the FDNPS.
These data are included in Figs. 2 and 3 to show that there
were sources other than the radioactive leakages into the
Pacific Ocean (such as radioactive fallout from the
atmosphere).
It can be seen that the concentrations generated by the
indirect releases are significantly lower than those due to
the radioactive leakages. For example, the maximum
concentration of 131I measured at Sampling Point T3 and
Sampling Point T4 is about 3.8 MBq m-3, whereas it is
about 120 MBq m-3 at Sampling Point T1 and Sampling
Point T2. According to TEPCO (2011), the measured
concentrations of 131I and 137Cs at 10 km offshore were 1.6
and 0.32 MBq m-3, respectively, on 29 March 2011. The
same at 16 km offshore were 1.3 and 0.23 MBq m-3,
respectively. Such low concentrations in the offshore sea-
waters are not caused by radioactive leakages from the
FDNPS. They might have been caused by radioactive
0.01
0.1
1
10
23-Mar 28-Mar 2-Apr 7-Apr 12-Apr 17-Apr 22-Apr 27-Apr 2-May
Co
nce
ntr
atio
n (
MB
q m
-3)
I-131Cs-134Cs-137
Fig. 2 Concentrations of 131I, 134Cs and 137Cs at Sampling Point T3
[10 km south of FDNPS along the coast in downstream direction
(TEPCO 2011)]
0.01
0.1
1
10
23-Mar 28-Mar 2-Apr 7-Apr 12-Apr 17-Apr 22-Apr 27-Apr 2-May
Co
nce
ntr
atio
n (
MB
q m
-3)
I-131Cs-134Cs-137
Fig. 3 Concentrations of 131I, 134Cs and 137Cs at Sampling Point T4
[16 km south of FDNPS along the coast in downstream direction
(TEPCO 2011)]
Environ Earth Sci
123
fallout from the atmosphere. Stohl et al. (2012) and Morino
et al. (2011) estimated that the accumulated atmospheric137Cs deposition to the ocean peaks at 50 to 200 kBq m-2.
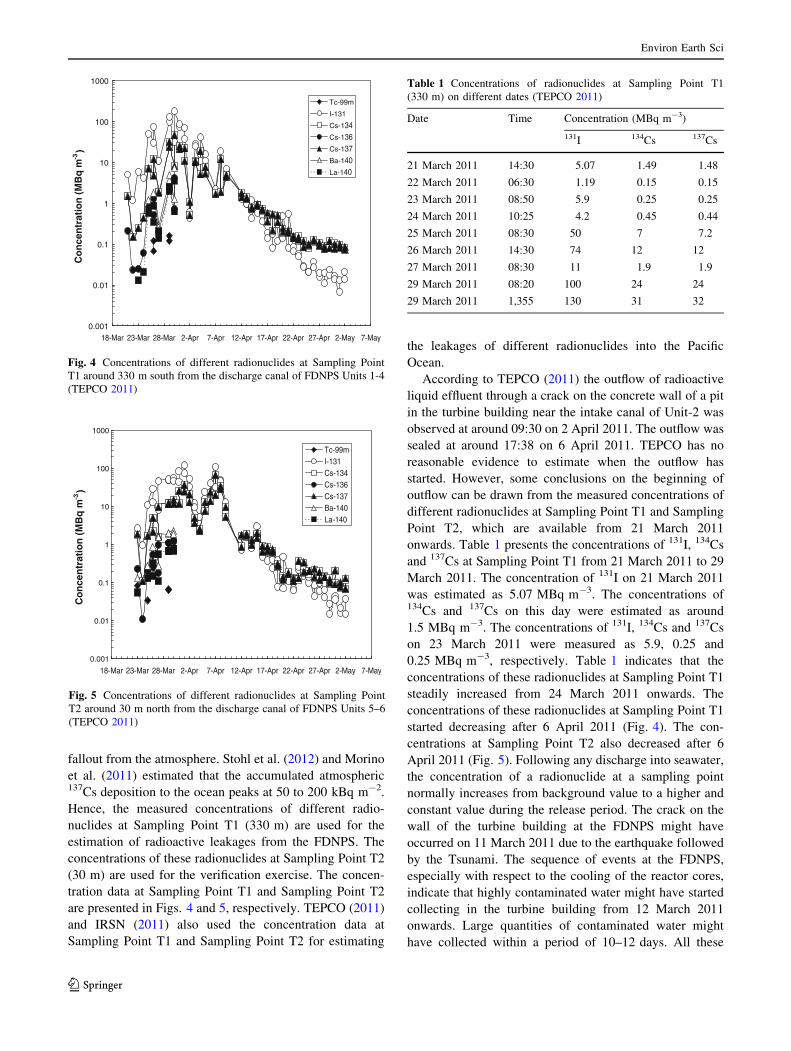
Hence, the measured concentrations of different radio-
nuclides at Sampling Point T1 (330 m) are used for the
estimation of radioactive leakages from the FDNPS. The
concentrations of these radionuclides at Sampling Point T2
(30 m) are used for the verification exercise. The concen-
tration data at Sampling Point T1 and Sampling Point T2
are presented in Figs. 4 and 5, respectively. TEPCO (2011)
and IRSN (2011) also used the concentration data at
Sampling Point T1 and Sampling Point T2 for estimating
the leakages of different radionuclides into the Pacific
Ocean.
According to TEPCO (2011) the outflow of radioactive
liquid effluent through a crack on the concrete wall of a pit
in the turbine building near the intake canal of Unit-2 was
observed at around 09:30 on 2 April 2011. The outflow was
sealed at around 17:38 on 6 April 2011. TEPCO has no
reasonable evidence to estimate when the outflow has
started. However, some conclusions on the beginning of
outflow can be drawn from the measured concentrations of
different radionuclides at Sampling Point T1 and Sampling
Point T2, which are available from 21 March 2011
onwards. Table 1 presents the concentrations of 131I, 134Cs
and 137Cs at Sampling Point T1 from 21 March 2011 to 29
March 2011. The concentration of 131I on 21 March 2011
was estimated as 5.07 MBq m-3. The concentrations of134Cs and 137Cs on this day were estimated as around
1.5 MBq m-3. The concentrations of 131I, 134Cs and 137Cs
on 23 March 2011 were measured as 5.9, 0.25 and
0.25 MBq m-3, respectively. Table 1 indicates that the
concentrations of these radionuclides at Sampling Point T1
steadily increased from 24 March 2011 onwards. The
concentrations of these radionuclides at Sampling Point T1
started decreasing after 6 April 2011 (Fig. 4). The con-
centrations at Sampling Point T2 also decreased after 6
April 2011 (Fig. 5). Following any discharge into seawater,
the concentration of a radionuclide at a sampling point
normally increases from background value to a higher and
constant value during the release period. The crack on the
wall of the turbine building at the FDNPS might have
occurred on 11 March 2011 due to the earthquake followed
by the Tsunami. The sequence of events at the FDNPS,
especially with respect to the cooling of the reactor cores,
indicate that highly contaminated water might have started
collecting in the turbine building from 12 March 2011
onwards. Large quantities of contaminated water might
have collected within a period of 10–12 days. All these
0.001
0.01
0.1
1
10
100
1000
18-Mar 23-Mar 28-Mar 2-Apr 7-Apr 12-Apr 17-Apr 22-Apr 27-Apr 2-May 7-May
Co
nce
ntr
atio
n (
MB
q m
-3)
Tc-99m
I-131
Cs-134Cs-136Cs-137Ba-140La-140
Fig. 4 Concentrations of different radionuclides at Sampling Point
T1 around 330 m south from the discharge canal of FDNPS Units 1-4
(TEPCO 2011)
0.001
0.01
0.1
1
10
100
1000
18-Mar 23-Mar 28-Mar 2-Apr 7-Apr 12-Apr 17-Apr 22-Apr 27-Apr 2-May 7-May
Co
nce
ntr
atio
n (
MB
q m
-3)
Tc-99mI-131Cs-134Cs-136Cs-137Ba-140La-140
Fig. 5 Concentrations of different radionuclides at Sampling Point
T2 around 30 m north from the discharge canal of FDNPS Units 5–6
(TEPCO 2011)
Table 1 Concentrations of radionuclides at Sampling Point T1
(330 m) on different dates (TEPCO 2011)
Date Time Concentration (MBq m-3)
131I 134Cs 137Cs
21 March 2011 14:30 5.07 1.49 1.48
22 March 2011 06:30 1.19 0.15 0.15
23 March 2011 08:50 5.9 0.25 0.25
24 March 2011 10:25 4.2 0.45 0.44
25 March 2011 08:30 50 7 7.2
26 March 2011 14:30 74 12 12
27 March 2011 08:30 11 1.9 1.9
29 March 2011 08:20 100 24 24
29 March 2011 1,355 130 31 32
Environ Earth Sci
123
observations point towards the inference that leakage of
highly contaminated water from the turbine building might
have started around 24 March 2011 and stopped around 6
April 2011 leading to 14 days of release. The concentration
levels at the discharge point were exceedingly high, with a
peak 137Cs concentration of 68 MBq m-3 on 6 April 2011
and the timing of peak release occured approximately one
month after the earthquake (Buesseler et al. 2012). Tsu-
mune et al. (2012) implied that the direct release was
during 26 March to 6 April 2011 leading to a total release
period of 12 days. Peaks of different radionuclides
observed on 6 April 2011 followed by lower concentrations
on further days indicate the possibility of stoppage of the
direct release on 6 April. According to Bailly du Bois et al.
(2012) the influence of leakages was particularly signifi-
cant from 26 March 2011 to 8 April 2011 in the vicinity of
the nuclear facilities and the drop in the concentrations
measured after 10 April 2011 showed that there were far
smaller leakages after this date.
The FDNPS is located on the coast of the island of
Honshu, more than 200 km north-east of Tokyo. The coast
runs north–south, facing the Pacific Ocean. The seabed
shelves off gently to a depth of 200 m, 50 km from the
coast and then drops suddenly to more than 5,000 m about
100 km offshore (IRSN 2011). In the coastal zone, the
currents are generated by the tides, wind and the general
Pacific Ocean circulation. In the short-term, the tidal effect
is predominant and it moves the masses of water with a
rapid alternating motion along the coast towards the north
and towards the south. The wind influences the circulation
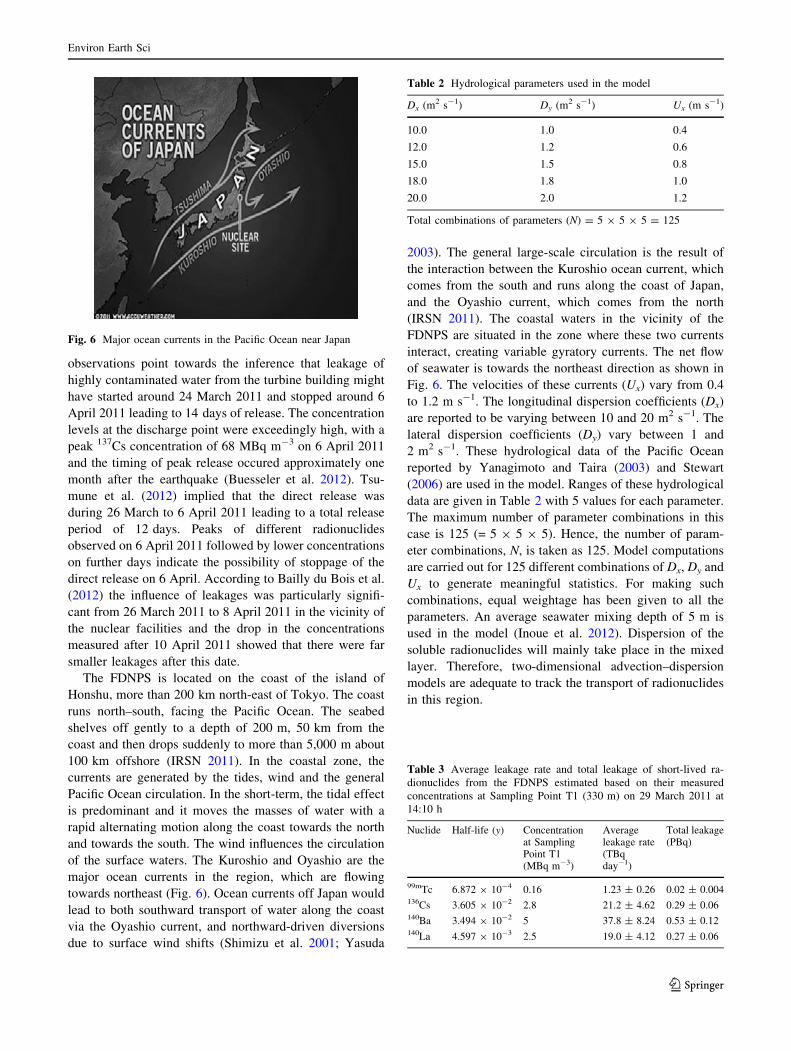
of the surface waters. The Kuroshio and Oyashio are the
major ocean currents in the region, which are flowing
towards northeast (Fig. 6). Ocean currents off Japan would
lead to both southward transport of water along the coast
via the Oyashio current, and northward-driven diversions
due to surface wind shifts (Shimizu et al. 2001; Yasuda
2003). The general large-scale circulation is the result of
the interaction between the Kuroshio ocean current, which
comes from the south and runs along the coast of Japan,
and the Oyashio current, which comes from the north
(IRSN 2011). The coastal waters in the vicinity of the
FDNPS are situated in the zone where these two currents
interact, creating variable gyratory currents. The net flow
of seawater is towards the northeast direction as shown in
Fig. 6. The velocities of these currents (Ux) vary from 0.4
to 1.2 m s-1. The longitudinal dispersion coefficients (Dx)
are reported to be varying between 10 and 20 m2 s-1. The
lateral dispersion coefficients (Dy) vary between 1 and
2 m2 s-1. These hydrological data of the Pacific Ocean
reported by Yanagimoto and Taira (2003) and Stewart
(2006) are used in the model. Ranges of these hydrological
data are given in Table 2 with 5 values for each parameter.
The maximum number of parameter combinations in this
case is 125 (= 5 9 5 9 5). Hence, the number of param-
eter combinations, N, is taken as 125. Model computations
are carried out for 125 different combinations of Dx, Dy and
Ux to generate meaningful statistics. For making such
combinations, equal weightage has been given to all the
parameters. An average seawater mixing depth of 5 m is
used in the model (Inoue et al. 2012). Dispersion of the
soluble radionuclides will mainly take place in the mixed
layer. Therefore, two-dimensional advection–dispersion
models are adequate to track the transport of radionuclides
in this region.
Fig. 6 Major ocean currents in the Pacific Ocean near Japan
Table 2 Hydrological parameters used in the model
Dx (m2 s-1) Dy (m2 s-1) Ux (m s-1)
10.0 1.0 0.4
12.0 1.2 0.6
15.0 1.5 0.8
18.0 1.8 1.0
20.0 2.0 1.2
Total combinations of parameters (N) = 5 9 5 9 5 = 125
Table 3 Average leakage rate and total leakage of short-lived ra-
dionuclides from the FDNPS estimated based on their measured
concentrations at Sampling Point T1 (330 m) on 29 March 2011 at
14:10 h
Nuclide Half-life (y) Concentrationat SamplingPoint T1(MBq m-3)
Averageleakage rate(TBqday-1)
Total leakage(PBq)
99mTc 6.872 9 10-4 0.16 1.23 ± 0.26 0.02 ± 0.004136Cs 3.605 9 10-2 2.8 21.2 ± 4.62 0.29 ± 0.06140Ba 3.494 9 10-2 5 37.8 ± 8.24 0.53 ± 0.12140La 4.597 9 10-3 2.5 19.0 ± 4.12 0.27 ± 0.06
Environ Earth Sci
123
Results and discussion
Equation 5 is used to estimate the leakages of different
radionuclides into the Pacific Ocean from the damaged
FDNPS. The leakages of short-lived radionuclides such as99mTc, 136Cs, 140Ba and 140La are estimated using their
measured concentrations on 29 March 2011 at 14:10 h at
Sampling Point T1 (Table 3). Continuous and consistent
measurements are not available for these radionuclides on
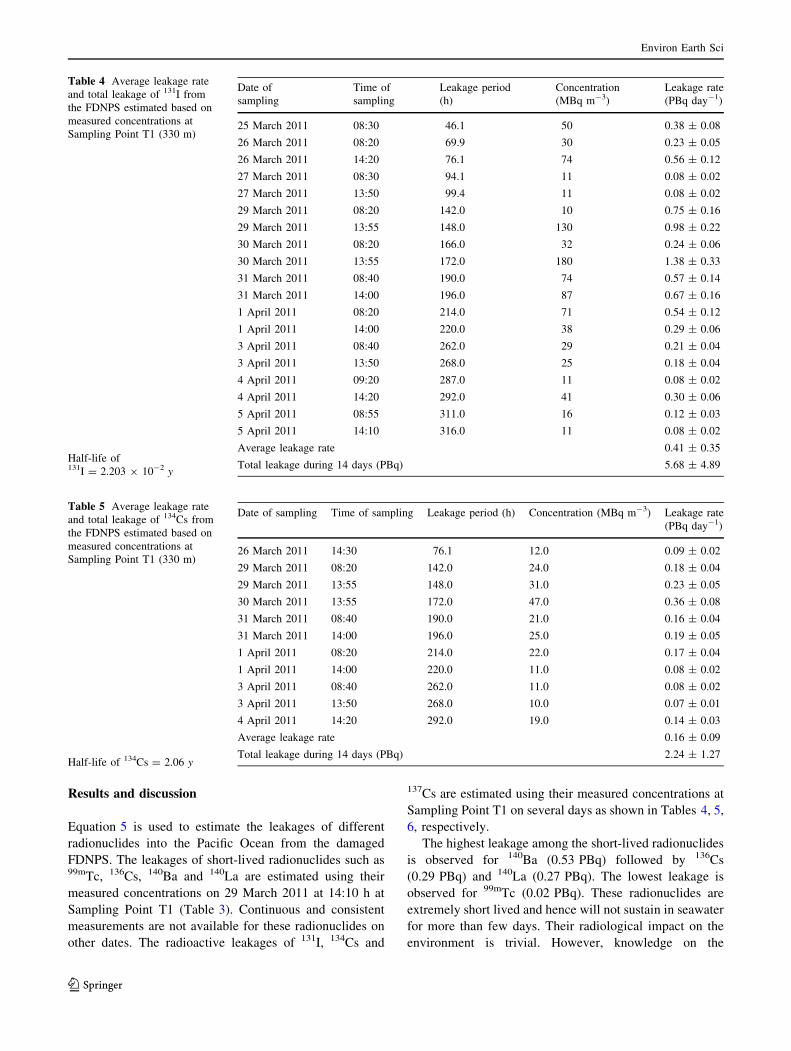
other dates. The radioactive leakages of 131I, 134Cs and
137Cs are estimated using their measured concentrations at
Sampling Point T1 on several days as shown in Tables 4, 5,
6, respectively.
The highest leakage among the short-lived radionuclides
is observed for 140Ba (0.53 PBq) followed by 136Cs
(0.29 PBq) and 140La (0.27 PBq). The lowest leakage is
observed for 99mTc (0.02 PBq). These radionuclides are
extremely short lived and hence will not sustain in seawater
for more than few days. Their radiological impact on the
environment is trivial. However, knowledge on the
Table 4 Average leakage rate
and total leakage of 131I from
the FDNPS estimated based on
measured concentrations at
Sampling Point T1 (330 m)
Half-life of131I = 2.203 9 10-2 y
Date of
sampling
Time of
sampling
Leakage period
(h)
Concentration
(MBq m-3)
Leakage rate
(PBq day-1)
25 March 2011 08:30 46.1 50 0.38 ± 0.08
26 March 2011 08:20 69.9 30 0.23 ± 0.05
26 March 2011 14:20 76.1 74 0.56 ± 0.12
27 March 2011 08:30 94.1 11 0.08 ± 0.02
27 March 2011 13:50 99.4 11 0.08 ± 0.02
29 March 2011 08:20 142.0 10 0.75 ± 0.16
29 March 2011 13:55 148.0 130 0.98 ± 0.22
30 March 2011 08:20 166.0 32 0.24 ± 0.06
30 March 2011 13:55 172.0 180 1.38 ± 0.33
31 March 2011 08:40 190.0 74 0.57 ± 0.14
31 March 2011 14:00 196.0 87 0.67 ± 0.16
1 April 2011 08:20 214.0 71 0.54 ± 0.12
1 April 2011 14:00 220.0 38 0.29 ± 0.06
3 April 2011 08:40 262.0 29 0.21 ± 0.04
3 April 2011 13:50 268.0 25 0.18 ± 0.04
4 April 2011 09:20 287.0 11 0.08 ± 0.02
4 April 2011 14:20 292.0 41 0.30 ± 0.06
5 April 2011 08:55 311.0 16 0.12 ± 0.03
5 April 2011 14:10 316.0 11 0.08 ± 0.02
Average leakage rate 0.41 ± 0.35
Total leakage during 14 days (PBq) 5.68 ± 4.89
Table 5 Average leakage rate
and total leakage of 134Cs from
the FDNPS estimated based on
measured concentrations at
Sampling Point T1 (330 m)
Half-life of 134Cs = 2.06 y
Date of sampling Time of sampling Leakage period (h) Concentration (MBq m-3) Leakage rate
(PBq day-1)
26 March 2011 14:30 76.1 12.0 0.09 ± 0.02
29 March 2011 08:20 142.0 24.0 0.18 ± 0.04
29 March 2011 13:55 148.0 31.0 0.23 ± 0.05
30 March 2011 13:55 172.0 47.0 0.36 ± 0.08
31 March 2011 08:40 190.0 21.0 0.16 ± 0.04
31 March 2011 14:00 196.0 25.0 0.19 ± 0.05
1 April 2011 08:20 214.0 22.0 0.17 ± 0.04
1 April 2011 14:00 220.0 11.0 0.08 ± 0.02
3 April 2011 08:40 262.0 11.0 0.08 ± 0.02
3 April 2011 13:50 268.0 10.0 0.07 ± 0.01
4 April 2011 14:20 292.0 19.0 0.14 ± 0.03
Average leakage rate 0.16 ± 0.09
Total leakage during 14 days (PBq) 2.24 ± 1.27
Environ Earth Sci
123
estimates of their leakages during a nuclear accident is
useful for accounting for all the radioactive releases from
the damaged plants. The highest leakage among 131I, 134Cs
and 137Cs is observed for 131I (5.68 PBq) followed by 137Cs
(2.25 PBq) and 134Cs (2.24 PBq). Among these radionuc-
lides, concern of large-scale and long-term impacts exists
mainly for 137Cs and to a certain extent for 134Cs.
The concentrations of all the radionuclides at Sampling
Point T2 (30 m) are found to be lower than those at
Sampling Point T1 (330 m) for most of the sampling times.
The highest concentration of 131I at 330 m is
180 MBq m-3 (on 30 March 2011). The highest concen-
tration of 131I at 30 m is 120 MBq m-3 (1 April 2011). On
29 March 2011, the concentrations of 131I at 330 and 30 m
are 130 and 51 MBq m-3, respectively. The concentrations
of 134Cs and 137Cs are measured as 31 and 32 MBq m-3,
respectively, at 330 m on this day. The concentrations of
these radionuclides at 30 m are 12 MBq m-3 on this day.
This indicates that Sampling Point T1 (330 m) lies most
possibly in the plume centreline along the flow direction
(y = 0) and Sampling Point T2 (30 m) probably lies away
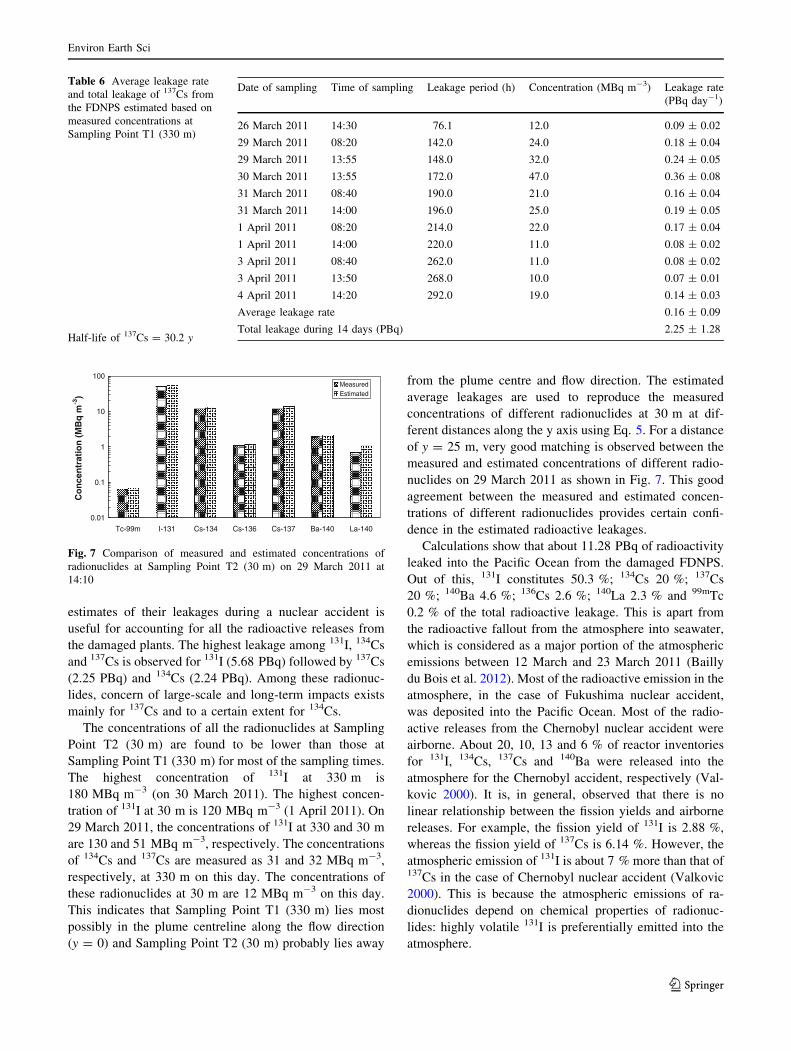
from the plume centre and flow direction. The estimated
average leakages are used to reproduce the measured
concentrations of different radionuclides at 30 m at dif-
ferent distances along the y axis using Eq. 5. For a distance
of y = 25 m, very good matching is observed between the
measured and estimated concentrations of different radio-
nuclides on 29 March 2011 as shown in Fig. 7. This good
agreement between the measured and estimated concen-
trations of different radionuclides provides certain confi-
dence in the estimated radioactive leakages.
Calculations show that about 11.28 PBq of radioactivity
leaked into the Pacific Ocean from the damaged FDNPS.
Out of this, 131I constitutes 50.3 %; 134Cs 20 %; 137Cs
20 %; 140Ba 4.6 %; 136Cs 2.6 %; 140La 2.3 % and 99mTc
0.2 % of the total radioactive leakage. This is apart from
the radioactive fallout from the atmosphere into seawater,
which is considered as a major portion of the atmospheric
emissions between 12 March and 23 March 2011 (Bailly
du Bois et al. 2012). Most of the radioactive emission in the
atmosphere, in the case of Fukushima nuclear accident,
was deposited into the Pacific Ocean. Most of the radio-
active releases from the Chernobyl nuclear accident were
airborne. About 20, 10, 13 and 6 % of reactor inventories
for 131I, 134Cs, 137Cs and 140Ba were released into the
atmosphere for the Chernobyl accident, respectively (Val-
kovic 2000). It is, in general, observed that there is no
linear relationship between the fission yields and airborne
releases. For example, the fission yield of 131I is 2.88 %,
whereas the fission yield of 137Cs is 6.14 %. However, the
atmospheric emission of 131I is about 7 % more than that of137Cs in the case of Chernobyl nuclear accident (Valkovic
2000). This is because the atmospheric emissions of ra-
dionuclides depend on chemical properties of radionuc-
lides: highly volatile 131I is preferentially emitted into the
atmosphere.
Table 6 Average leakage rate
and total leakage of 137Cs from
the FDNPS estimated based on
measured concentrations at
Sampling Point T1 (330 m)
Half-life of 137Cs = 30.2 y
Date of sampling Time of sampling Leakage period (h) Concentration (MBq m-3) Leakage rate
(PBq day-1)
26 March 2011 14:30 76.1 12.0 0.09 ± 0.02
29 March 2011 08:20 142.0 24.0 0.18 ± 0.04
29 March 2011 13:55 148.0 32.0 0.24 ± 0.05
30 March 2011 13:55 172.0 47.0 0.36 ± 0.08
31 March 2011 08:40 190.0 21.0 0.16 ± 0.04
31 March 2011 14:00 196.0 25.0 0.19 ± 0.05
1 April 2011 08:20 214.0 22.0 0.17 ± 0.04
1 April 2011 14:00 220.0 11.0 0.08 ± 0.02
3 April 2011 08:40 262.0 11.0 0.08 ± 0.02
3 April 2011 13:50 268.0 10.0 0.07 ± 0.01
4 April 2011 14:20 292.0 19.0 0.14 ± 0.03
Average leakage rate 0.16 ± 0.09
Total leakage during 14 days (PBq) 2.25 ± 1.28
0.01
0.1
1
10
100
Tc-99m I-131 Cs-134 Cs-136 Cs-137 Ba-140 La-140
Co
nce
ntr
atio
n (
MB
q m
-3)
MeasuredEstimated
Fig. 7 Comparison of measured and estimated concentrations of
radionuclides at Sampling Point T2 (30 m) on 29 March 2011 at
14:10
Environ Earth Sci
123
Many times 137Cs fluxes give a good estimate of other
radionuclides released due to nuclear accidents. Tables 5
and 6 show that the 134Cs/137Cs activity ratio in the leakage
is about 1. Such a ratio indicates recent nuclear accidents as
this ratio decreases with time due to the short half-life of134Cs (Aarkrog 1988). The 134Cs/137Cs activity ratio in the
measured concentrations at 30 m and 330 m was about 1 as
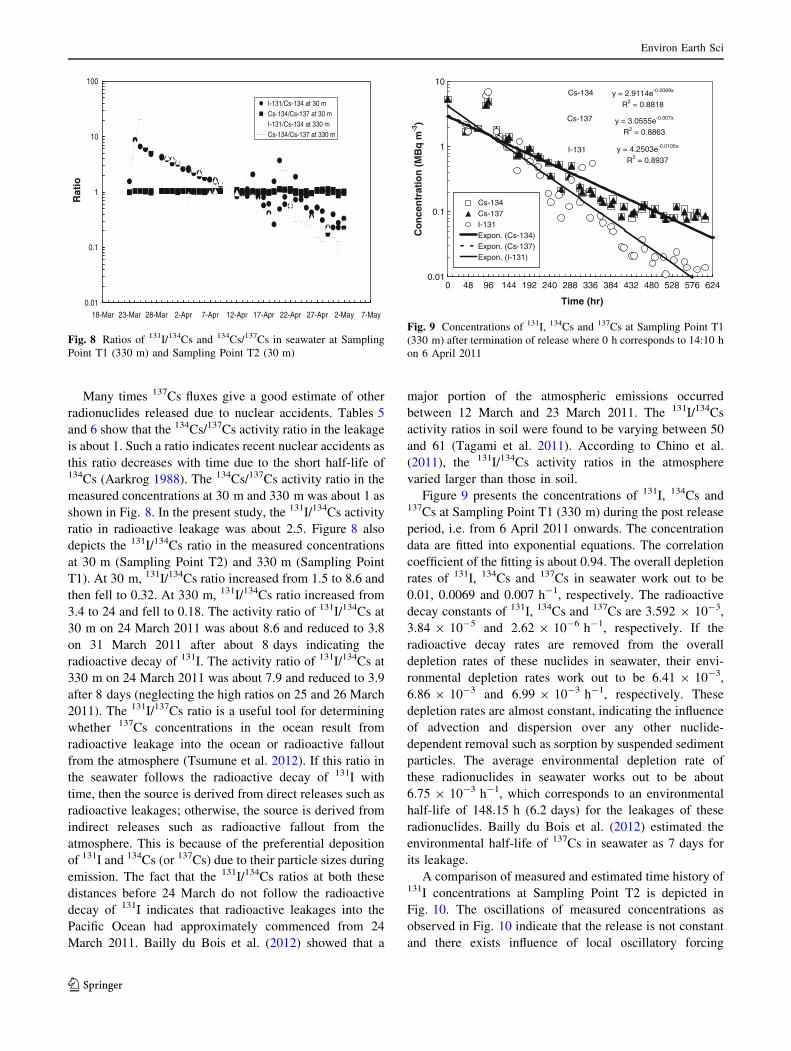
shown in Fig. 8. In the present study, the 131I/134Cs activity
ratio in radioactive leakage was about 2.5. Figure 8 also
depicts the 131I/134Cs ratio in the measured concentrations
at 30 m (Sampling Point T2) and 330 m (Sampling Point
T1). At 30 m, 131I/134Cs ratio increased from 1.5 to 8.6 and
then fell to 0.32. At 330 m, 131I/134Cs ratio increased from
3.4 to 24 and fell to 0.18. The activity ratio of 131I/134Cs at
30 m on 24 March 2011 was about 8.6 and reduced to 3.8
on 31 March 2011 after about 8 days indicating the
radioactive decay of 131I. The activity ratio of 131I/134Cs at
330 m on 24 March 2011 was about 7.9 and reduced to 3.9
after 8 days (neglecting the high ratios on 25 and 26 March
2011). The 131I/137Cs ratio is a useful tool for determining
whether 137Cs concentrations in the ocean result from
radioactive leakage into the ocean or radioactive fallout
from the atmosphere (Tsumune et al. 2012). If this ratio in
the seawater follows the radioactive decay of 131I with
time, then the source is derived from direct releases such as
radioactive leakages; otherwise, the source is derived from
indirect releases such as radioactive fallout from the
atmosphere. This is because of the preferential deposition
of 131I and 134Cs (or 137Cs) due to their particle sizes during
emission. The fact that the 131I/134Cs ratios at both these
distances before 24 March do not follow the radioactive
decay of 131I indicates that radioactive leakages into the
Pacific Ocean had approximately commenced from 24
March 2011. Bailly du Bois et al. (2012) showed that a
major portion of the atmospheric emissions occurred
between 12 March and 23 March 2011. The 131I/134Cs
activity ratios in soil were found to be varying between 50
and 61 (Tagami et al. 2011). According to Chino et al.
(2011), the 131I/134Cs activity ratios in the atmosphere
varied larger than those in soil.
Figure 9 presents the concentrations of 131I, 134Cs and137Cs at Sampling Point T1 (330 m) during the post release
period, i.e. from 6 April 2011 onwards. The concentration
data are fitted into exponential equations. The correlation
coefficient of the fitting is about 0.94. The overall depletion
rates of 131I, 134Cs and 137Cs in seawater work out to be
0.01, 0.0069 and 0.007 h-1, respectively. The radioactive
decay constants of 131I, 134Cs and 137Cs are 3.592 9 10-3,
3.84 9 10-5 and 2.62 9 10-6 h-1, respectively. If the
radioactive decay rates are removed from the overall
depletion rates of these nuclides in seawater, their envi-
ronmental depletion rates work out to be 6.41 9 10-3,
6.86 9 10-3 and 6.99 9 10-3 h-1, respectively. These
depletion rates are almost constant, indicating the influence
of advection and dispersion over any other nuclide-
dependent removal such as sorption by suspended sediment
particles. The average environmental depletion rate of
these radionuclides in seawater works out to be about
6.75 9 10-3 h-1, which corresponds to an environmental
half-life of 148.15 h (6.2 days) for the leakages of these
radionuclides. Bailly du Bois et al. (2012) estimated the
environmental half-life of 137Cs in seawater as 7 days for
its leakage.
A comparison of measured and estimated time history of131I concentrations at Sampling Point T2 is depicted in
Fig. 10. The oscillations of measured concentrations as
observed in Fig. 10 indicate that the release is not constant
and there exists influence of local oscillatory forcing
0.01
0.1
1
10
100
18-Mar 23-Mar 28-Mar 2-Apr 7-Apr 12-Apr 17-Apr 22-Apr 27-Apr 2-May 7-May
Rat
io
I-131/Cs-134 at 30 mCs-134/Cs-137 at 30 mI-131/Cs-134 at 330 mCs-134/Cs-137 at 330 m
Fig. 8 Ratios of 131I/134Cs and 134Cs/137Cs in seawater at Sampling
Point T1 (330 m) and Sampling Point T2 (30 m)
y = 2.9114e-0.0069x
R2 = 0.8818
y = 3.0555e-0.007x
R2 = 0.8863
y = 4.2503e-0.0105x
R2 = 0.8937
0.01
0.1
1
10
0 48 96 144 192 240 288 336 384 432 480 528 576 624
Time (hr)
Co
nce
ntr
atio
n (
MB
q m
-3)
Cs-134Cs-137I-131Expon. (Cs-134)Expon. (Cs-137)Expon. (I-131)
Cs-134
Cs-137
I-131
Fig. 9 Concentrations of 131I, 134Cs and 137Cs at Sampling Point T1
(330 m) after termination of release where 0 h corresponds to 14:10 h
on 6 April 2011
Environ Earth Sci
123
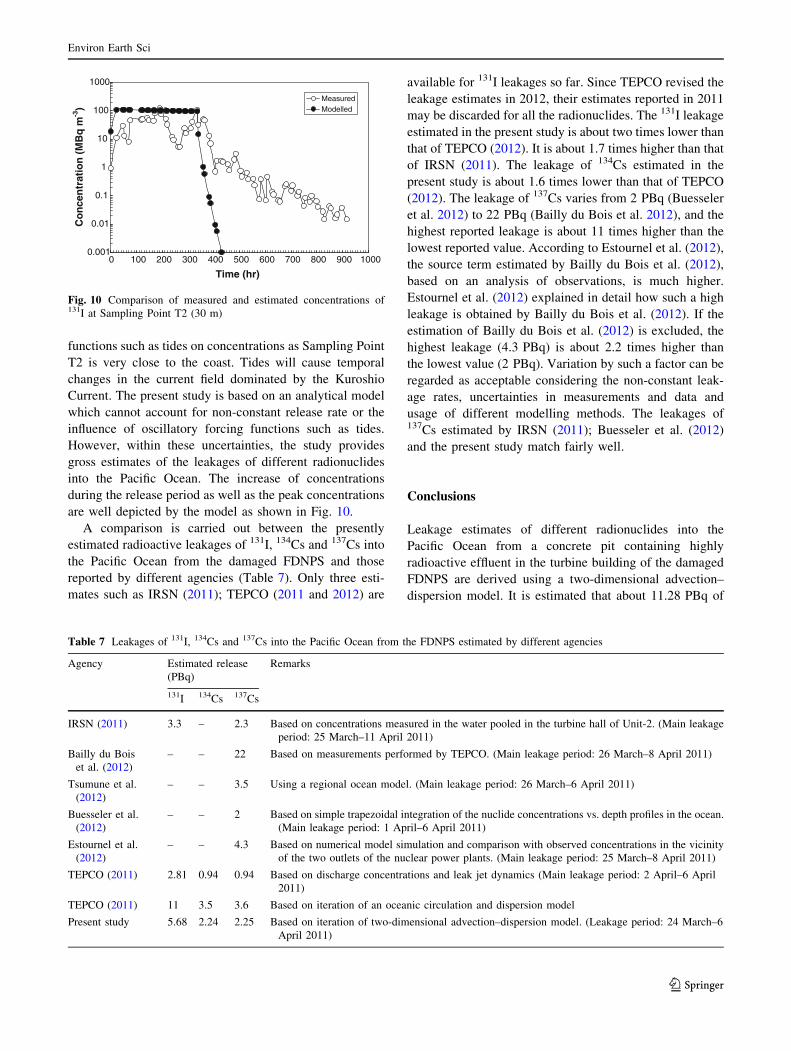
functions such as tides on concentrations as Sampling Point
T2 is very close to the coast. Tides will cause temporal
changes in the current field dominated by the Kuroshio
Current. The present study is based on an analytical model
which cannot account for non-constant release rate or the
influence of oscillatory forcing functions such as tides.
However, within these uncertainties, the study provides
gross estimates of the leakages of different radionuclides
into the Pacific Ocean. The increase of concentrations
during the release period as well as the peak concentrations
are well depicted by the model as shown in Fig. 10.
A comparison is carried out between the presently
estimated radioactive leakages of 131I, 134Cs and 137Cs into
the Pacific Ocean from the damaged FDNPS and those
reported by different agencies (Table 7). Only three esti-
mates such as IRSN (2011); TEPCO (2011 and 2012) are
available for 131I leakages so far. Since TEPCO revised the
leakage estimates in 2012, their estimates reported in 2011
may be discarded for all the radionuclides. The 131I leakage
estimated in the present study is about two times lower than
that of TEPCO (2012). It is about 1.7 times higher than that
of IRSN (2011). The leakage of 134Cs estimated in the
present study is about 1.6 times lower than that of TEPCO
(2012). The leakage of 137Cs varies from 2 PBq (Buesseler
et al. 2012) to 22 PBq (Bailly du Bois et al. 2012), and the
highest reported leakage is about 11 times higher than the
lowest reported value. According to Estournel et al. (2012),
the source term estimated by Bailly du Bois et al. (2012),
based on an analysis of observations, is much higher.
Estournel et al. (2012) explained in detail how such a high
leakage is obtained by Bailly du Bois et al. (2012). If the
estimation of Bailly du Bois et al. (2012) is excluded, the
highest leakage (4.3 PBq) is about 2.2 times higher than
the lowest value (2 PBq). Variation by such a factor can be
regarded as acceptable considering the non-constant leak-
age rates, uncertainties in measurements and data and
usage of different modelling methods. The leakages of137Cs estimated by IRSN (2011); Buesseler et al. (2012)
and the present study match fairly well.
Conclusions
Leakage estimates of different radionuclides into the
Pacific Ocean from a concrete pit containing highly
radioactive effluent in the turbine building of the damaged
FDNPS are derived using a two-dimensional advection–
dispersion model. It is estimated that about 11.28 PBq of
0.001
0.01
0.1
1
10
100
1000
0 100 200 300 400 500 600 700 800 900 1000
Time (hr)
Co
nce
ntr
atio
n (
MB
q m
-3)
MeasuredModelled
Fig. 10 Comparison of measured and estimated concentrations of131I at Sampling Point T2 (30 m)
Table 7 Leakages of 131I, 134Cs and 137Cs into the Pacific Ocean from the FDNPS estimated by different agencies
Agency Estimated release
(PBq)
Remarks
131I 134Cs 137Cs
IRSN (2011) 3.3 – 2.3 Based on concentrations measured in the water pooled in the turbine hall of Unit-2. (Main leakage
period: 25 March–11 April 2011)
Bailly du Bois
et al. (2012)
– – 22 Based on measurements performed by TEPCO. (Main leakage period: 26 March–8 April 2011)
Tsumune et al.
(2012)
– – 3.5 Using a regional ocean model. (Main leakage period: 26 March–6 April 2011)
Buesseler et al.
(2012)
– – 2 Based on simple trapezoidal integration of the nuclide concentrations vs. depth profiles in the ocean.
(Main leakage period: 1 April–6 April 2011)
Estournel et al.
(2012)
– – 4.3 Based on numerical model simulation and comparison with observed concentrations in the vicinity
of the two outlets of the nuclear power plants. (Main leakage period: 25 March–8 April 2011)
TEPCO (2011) 2.81 0.94 0.94 Based on discharge concentrations and leak jet dynamics (Main leakage period: 2 April–6 April
2011)
TEPCO (2011) 11 3.5 3.6 Based on iteration of an oceanic circulation and dispersion model
Present study 5.68 2.24 2.25 Based on iteration of two-dimensional advection–dispersion model. (Leakage period: 24 March–6
April 2011)
Environ Earth Sci
123
radioactivity was leaked into the Pacific Ocean from the
damaged FDNPS. Out of this, 131I constitutes 50.3 %;134Cs 20 %; 137Cs 20 %; 140Ba 4.6 %; 136Cs 2.6 %; 140La
2.3 % and 99mTc 0.2 % of the total leakage. The environ-
mental half-life of 131I, 134Cs and 137Cs in seawater with
respect to the leakage is estimated as 6.2 days. The esti-
mated leakages of different radionuclides vary between
0.02 PBq (99mTc) and 5.68 PBq (131I). The leakages of134Cs and 137Cs are estimated as 2.24 and 2.25 PBq,
respectively. The study shows that advection–dispersion
modelling coupled with measurements is highly useful to
extract early information on the quantity and extent of
radioactive releases into the environment during nuclear
accidents.
Acknowledgments Authors express sincere thanks to TEPCO,
MEXT and NISA for making available large amounts of data per-
taining to the FDNPS nuclear accident in the public domain ever since
the occurrence of the accident. Thanks are also due to Dr. D. N.
Sharma; Director; Health, Safety and Environment Group; Bhabha
Atomic Research Centre for his keen interest in the study.
References
Aarkrog A (1988) The radiological impact of the Chernobyl debris
compared with that from nuclear weapons fallout. J Environ
Radioact 6:151–162
Aksoy AO, Guney MS (2010) Experimental determination of three-
dimensional dispersivities in homogeneous porous medium.
Environ Earth Sci 60:383–393
Bailly du Bois P et al (2012) Estimation of marine source-term
following Fukushima Daiichi accident. J Environ Radioact
114:2–9
Bobba AG, Singh VP, Bengtsson L (2000) Application of environ-
mental models to different hydrological systems. Ecol Model
125:15–49
Bowen VT et al (1980) Fallout radionuclides in the Pacific Ocean:
Vertical and horizontal distributions, largely from GEOSECS
stations. Earth Planet Sci Lett 49:411–434
Buesseler KO, Livingston HD, Casso SA (1991) Mixing between oxic
and anoxic waters of the Black Sea as traced by Chernobyl
cesium isotopes. Deep-Sea Res 38:S725–S745
Buesseler KO et al (2012) Fukushima-derived radionuclides in the
ocean and biota off Japan. PNAS 109:5984–5988
Chino M et al (2011) Preliminary estimation of release amount of 131I
and 137Cs accidentally discharged from the Fukushima Daiichi
nuclear power plant into the atmosphere. J Nucl Sci Technol
48:1129–1134
Estournel C et al (2012) Assessment of the amount of cesium-137
released into the Pacific Ocean after the Fukushima accident and
analysis of its dispersion in Japanese coastal waters. J Geophys
Res 117:C11014. doi:10.1029/2012JC007933
Gonzalez-Fernandez D, Garrido-Perez MC, Casas-Ruiz M, Barbero
L, Nebot-Sanz E (2012) Radiological risk assessment of
naturally occurring radioactive materials in marine sediments
and its application in industrialized coastal areas: Bay of
Algeciras, Spain. Environ Earth Sci 66:1175–1181
IAEA (1985) Hydrological Dispersion of Radioactive Material in
Relation to Nuclear Power Plant Siting. Safety Guide Seires
50-SG-S6. International Atomic Energy Agency, Vienna
IAEA (2001) Generic Models for use in assessing the Impact of
Discharges of Radioactive Substances to the Environment.
Safety Reports Series No 19. International Atomic Energy
Agency, Vienna
IAEA (2011) Web Site: http://www.iaea.org/newscenter/news.
Vienna: International Atomic Energy Agency
Inoue M et al (2012) Low levels of 134Cs and 137Cs in surface
seawaters around the Japanese Archipelago after the Fukushima
Daiichi Nuclear Power Plant accident in 2011. Geochem J
46:311–320
IRSN (2011) Impact on the Marine Environment of Radioactive
Releases following the Nuclear Accident at Fukushima Daiichi.
Information Note dated 13 May 2011. France: Institute for
Radiological Protection and Nuclear Safety
MEXT (2011) Web Site: http://www.mext.go.jp/en/contents. Ministry
of Education, Culture, Sports, Science and Technology, Japan
Monte L, Perianez R, Boyer P, Smith JT, Brittain JE (2009) The
role of physical processes controlling the behaviour of radio-
nuclide contaminants in the aquatic environment: a review of
state-of-the-art modelling approaches. J Environ Radioact
100:779–784
Morino Y, Ohara T, Nishizawa M (2011) Atmospheric behavior,
deposition, and budget of radioactive materials from the
Fukushima Daiichi nuclear power plant in March 2011. Geophys
Res Lett 38:L00G11. doi:10.1029/2011GL048689
Nakanishi T et al (2011) Vertical distributions of 99Tc and 99Tc/137Cs
activity ratio in the coastal water off Aomori, Japan. J Environ
Radioact 102:774–779
NISA (2011) Web Site: http://www.nisa.meti.go.jp/english/files.
Nuclear and Industrial Safety Agency, Japan
Schreiber DL (1978) Liquid Pathway Generic Study—Impacts of
Accidental Radioactive Releases to the Hydrosphere from Float-
ing and Land-Based Nuclear Power Plants. Rep No NUREG-0440.
Washington: US Nuclear Regulatory Commission
Shimizu Y, Yasuda I, Ito S (2001) Distribution and circulation of the
coastal Oyashio intrusion. J Phys Oceanogr 31:1561–1578
Stewart RH (2006) Introduction to Physical Oceanography. Texas
A&M University
Stohl A et al (2012) Xenon-133 and caesium-137 releases into the
atmosphere from the Fukushima Daiichi nuclear power plant:
determination of the source term, atmospheric dispersion, and
deposition. Atmos Chem Phys 12:2313–2343
Tagami K et al (2011) Specific activity and activity ratios of
radionuclides in soil collected about 20 km from the Fukushima
Daiichi Nuclear Power Plant: Radionuclide release to the south
and southwest. Sci Total Environ 409:4885–4888
TEPCO (2011) Web Site: http://www.tepco.co.jp/en/press/corp-com/
release. Tokyo Electrical Power Company, Japan
TEPCO (2012) Web Site: http://www.tepco.co.jp/en/press/
corp-com/release. Tokyo Electrical Power Company, Japan
Thiessen KM, Thorne MC, Maul PR, Prohl G, Wheater HS (1999)
Modelling radionuclide distribution and transport in the envi-
ronment. Environ Pollut 100:151–177
Tsumune D et al (2012) Distribution of oceanic 137Cs from the
Fukushima Daiichi Nuclear Power Plant simulated numerically
by a regional ocean model. J Environ Radioact 111:100–108
Valkovic V (2000) Radioactivity in the environment. Elsevier,
Amsterdam
Wakeford R (2011) And now, Fukushima. Editorial. J Radiol Prot
31:167–176
Whicker FW, Shaw G, Voigt G, Holm E (1999) Radioactive
contamination: state of the science and its application to
predictive models. Environ Pollut 100:133–149
Yadav RR, Jaiswal DK, Yadav HK, Gulrana (2012) Three-dimen-
sional temporally dependent dispersion through porous media:
analytical solution. Environ Earth Sci 65:849–859
Environ Earth Sci
123
Yadigaroglu G, Munera HA (1987) Transport of pollutants: summary
review of physical and dispersion models. Nucl Technol
77:125–149
Yanagimoto D, Taira K (2003) Current measurements of the Japan
Sea proper water and the intermediate water by ALACE floats.
J Oceanogr 59:359–368
Yasuda I (2003) Hydrographic structure and variability in the
Kuroshio-Oyahio transition area. J Oceanogr 59:389–402
Yasunari TJ et al (2011) Cesium-137 deposition and contamination of
Japanese soils due to the Fukushima nuclear accident. Proc Natl
Acad Sci USA 108:19447–19448
Environ Earth Sci
123