estimation of phosphorus loss from agricultural land in the heartland region using the apex model a...
TRANSCRIPT
Estimation of phosphorus loss from agricultural
land in the Heartland region using the APEX model:
a first step to evaluating phosphorus indices.J.A. Lory, N.O. Nelson, C. Baffaut, A. Senaviratne, M. Van Liew, A. Bhandari,
A Mallarino, M. Helmers, R. Udawatta, D. Sweeney and C. WortmannWaste to Worth Conference, Seattle, WA
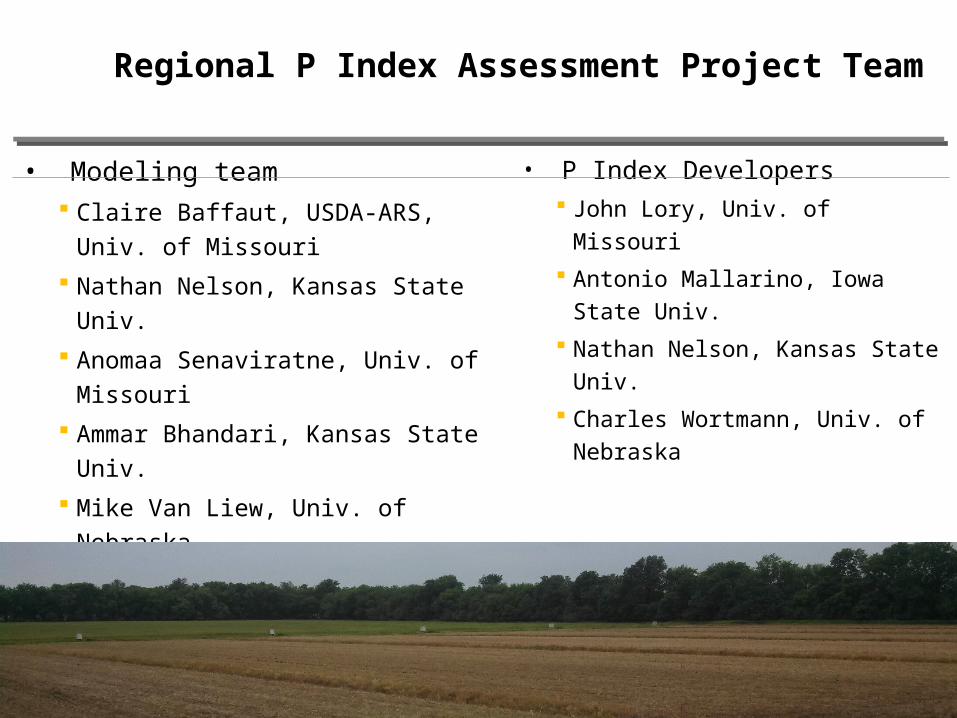
• Modeling team Claire Baffaut, USDA-ARS, Univ. of Missouri Nathan Nelson, Kansas State Univ. Anomaa Senaviratne, Univ. of Missouri Ammar Bhandari, Kansas State Univ. Mike Van Liew, Univ. of Nebraska
• Runoff study managers Matt Helmers, Iowa State Univ. Ranjith Uddawatta, Univ. of Missouri Dan Sweeney, Kansas State Univ.
• P Index Developers John Lory, Univ. of Missouri Antonio Mallarino, Iowa State Univ. Nathan Nelson, Kansas State Univ. Charles Wortmann, Univ. of Nebraska
Regional P Index Assessment Project Team
Overall Project Approach
Two-step project1. How well must we calibrate APEX to generate data to test P
Indices?
2. Use the appropriate strategy to generate data and evaluate P Indices in IA, KS, MO and NE.
Overall Project Approach
Two-step project1. How well must we calibrate APEX to generate data to test P
Indices?
2. Use the appropriate strategy to generate data and evaluate P Indices in IA, KS, MO and NE.
Why Models?
Heartland region has an impressive amount of runoff water quality data from small watersheds. 200 site-years of data. But the limits:• Only 27 soil-crop-management scenarios.• Only 3 locations have more than 5 years under constant
management.
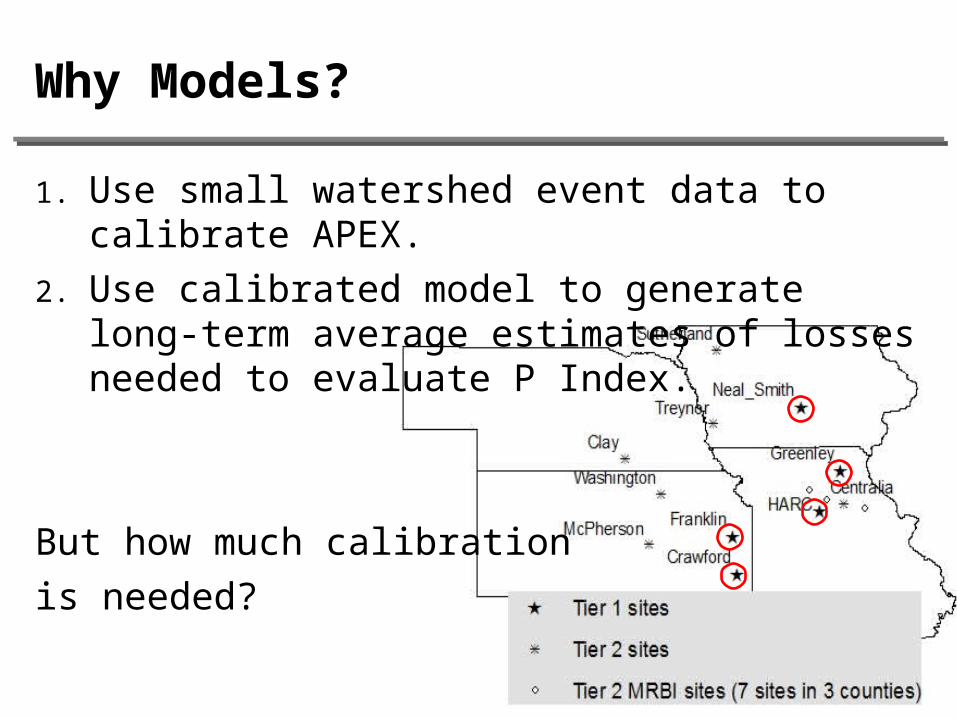
Why Models?
1. Use small watershed event data to calibrate APEX.2. Use calibrated model to generate long-term average
estimates of losses needed to evaluate P Index.
But how much calibrationis needed?
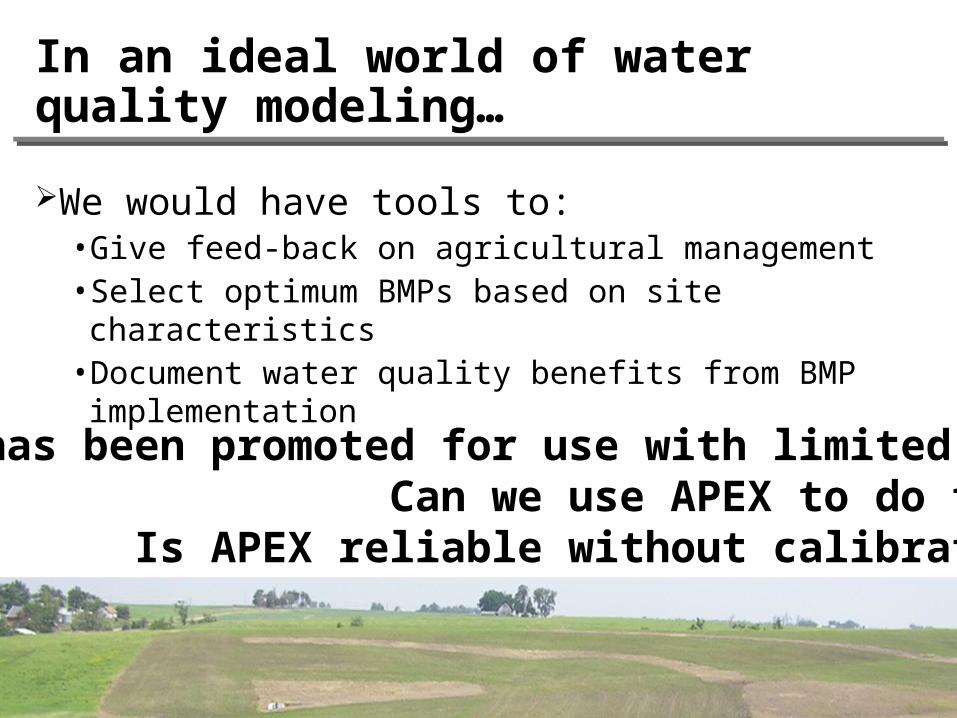
In an ideal world of water quality modeling…
We would have tools to:• Give feed-back on agricultural management• Select optimum BMPs based on site characteristics• Document water quality benefits from BMP implementation
APEX has been promoted for use with limited data Can we use APEX to do this?
Is APEX reliable without calibration?
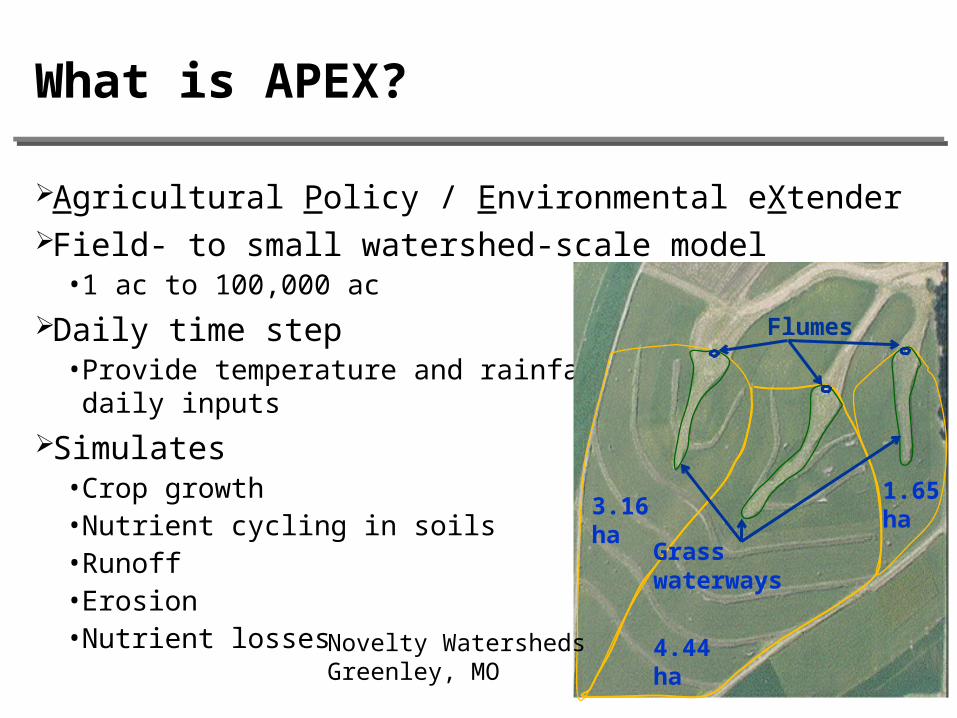
What is APEX?
Agricultural Policy / Environmental eXtenderField- to small watershed-scale model• 1 ac to 100,000 ac
Daily time step• Provide temperature and rainfall as
daily inputsSimulates• Crop growth• Nutrient cycling in soils• Runoff• Erosion• Nutrient losses
3.16 ha
4.44 ha
1.65 ha
Grass waterways
Flumes
Novelty WatershedsGreenley, MO
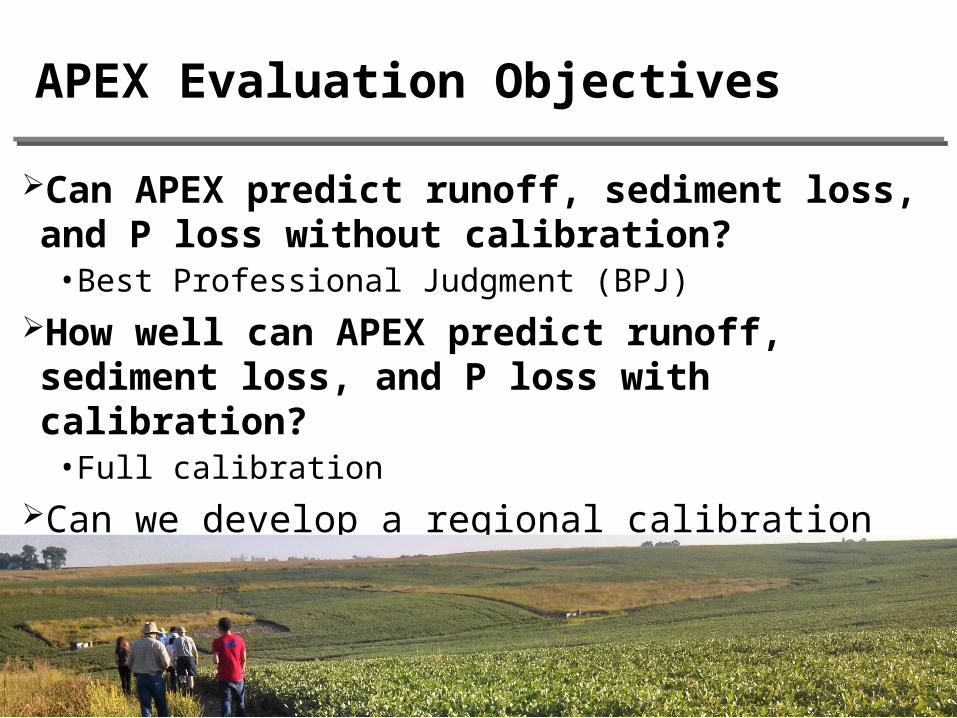
APEX Evaluation Objectives
Can APEX predict runoff, sediment loss, and P loss without calibration?• Best Professional Judgment (BPJ)
How well can APEX predict runoff, sediment loss, and P loss with calibration?• Full calibration
Can we develop a regional calibration for APEX?
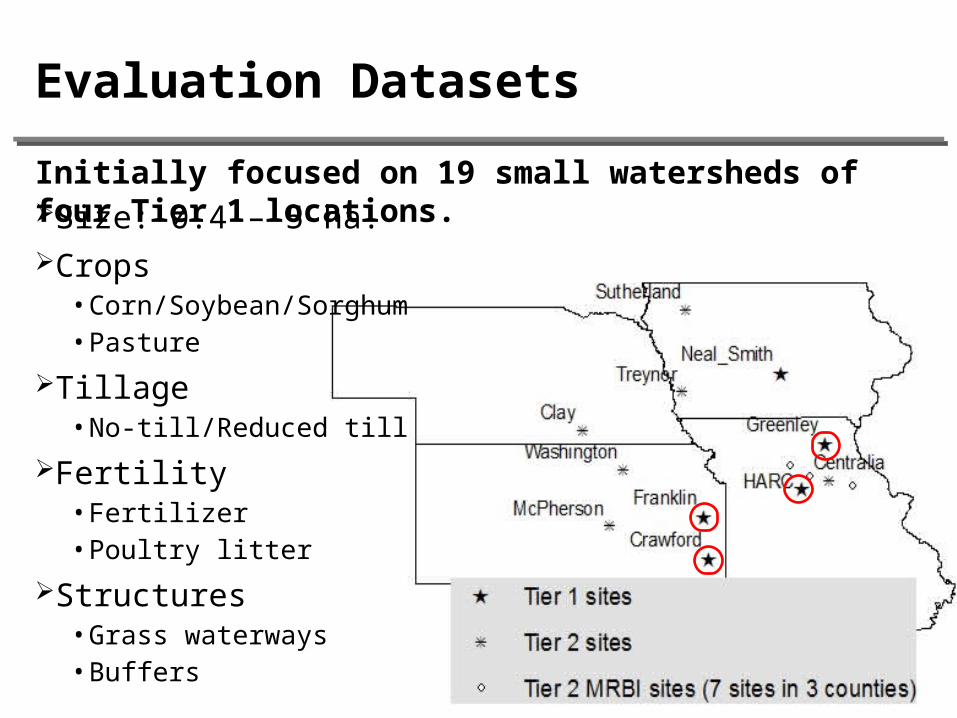
Evaluation Datasets
Size: 0.4 – 5 ha.Crops• Corn/Soybean/Sorghum• Pasture
Tillage• No-till/Reduced till
Fertility• Fertilizer• Poultry litter
Structures• Grass waterways• Buffers
Initially focused on 19 small watersheds of four Tier 1 locations.
Best Professional Judgment Parameterization Model options selected through best professional
judgmentSSURGO soils data (from web soil survey)Management data from the siteMeasured soil test P, total C, and total N.Parameter file based on best professional judgment,
recommendations from model developers, and published reports.• Included discussion with model developers and revision of
APEX source code
Full Model Calibration
Start with best professional judgment parameterizationAdd site-specific soils data • Site-specific soil investigation, measured horizon depths•Measured soil test P, total C, total N, and total P by horizon•Measured texture (bulk density and hydraulic properties if
possible)Sensitivity analysis based on model performance• r2, Nash-Sutcliffe, percent bias, regression slope, minimum
square errorManual calibration followed up with automated
parameter optimization.• Event-based calibration at each Tier I site
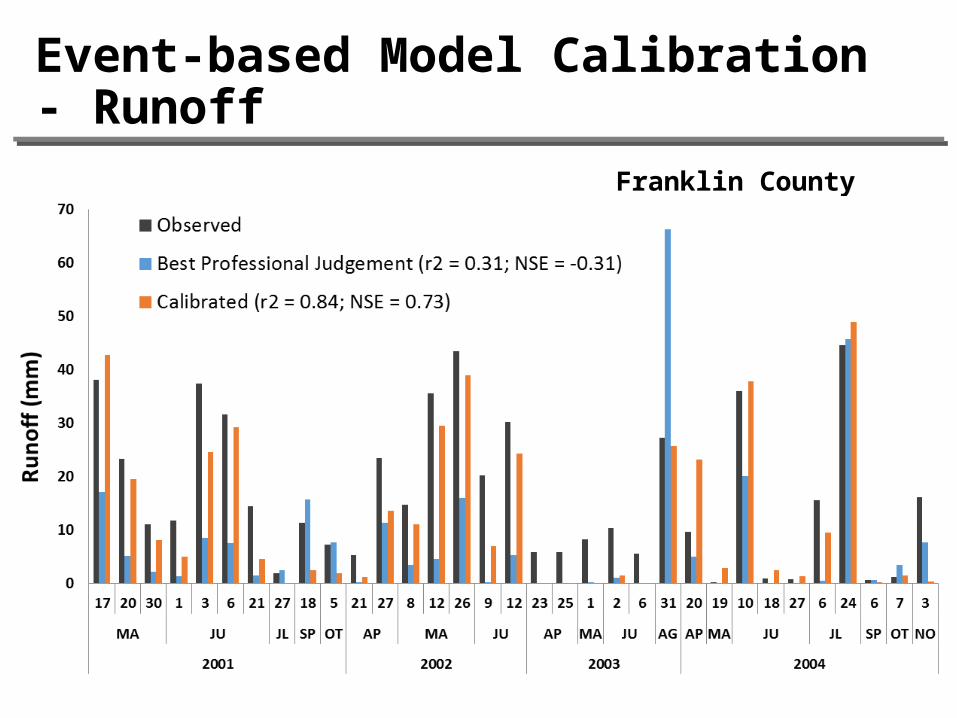
Event-based Model Calibration - Runoff
Franklin County KS, Field 7
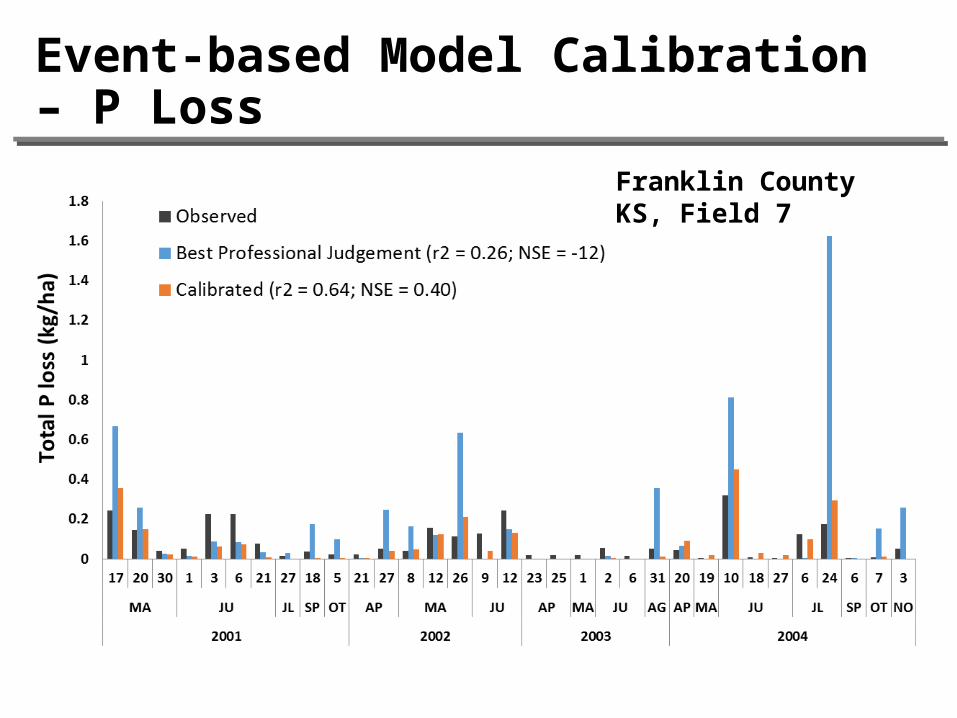
Event-based Model Calibration – P Loss
Franklin County KS, Field 7
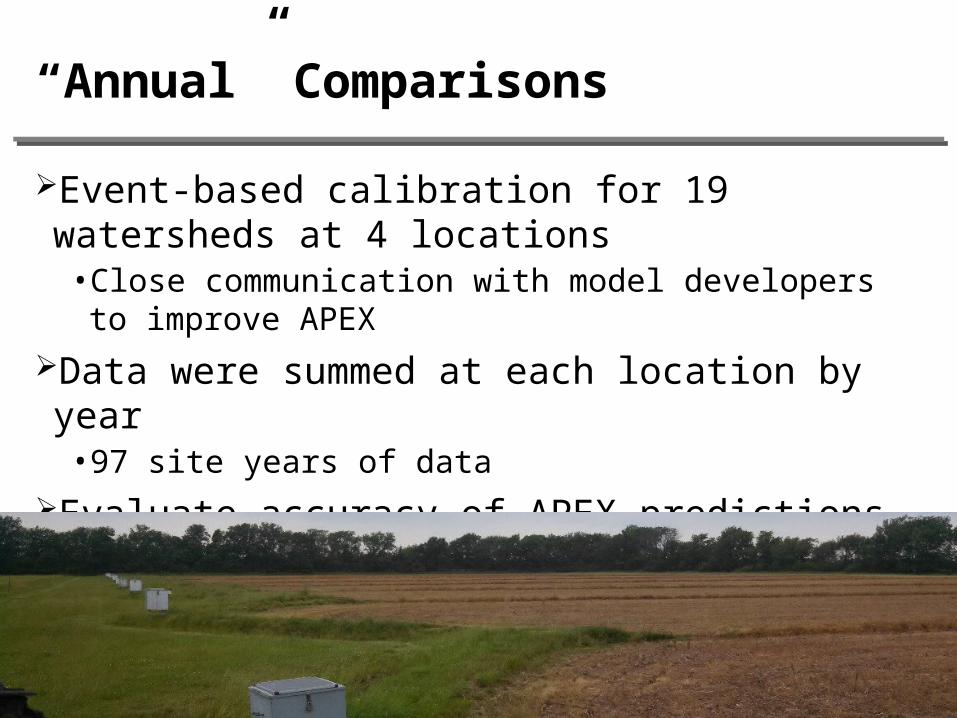
“Annual” Comparisons
Event-based calibration for 19 watersheds at 4 locations• Close communication with model developers to improve APEX
Data were summed at each location by year• 97 site years of data
Evaluate accuracy of APEX predictions across multiple sites and management
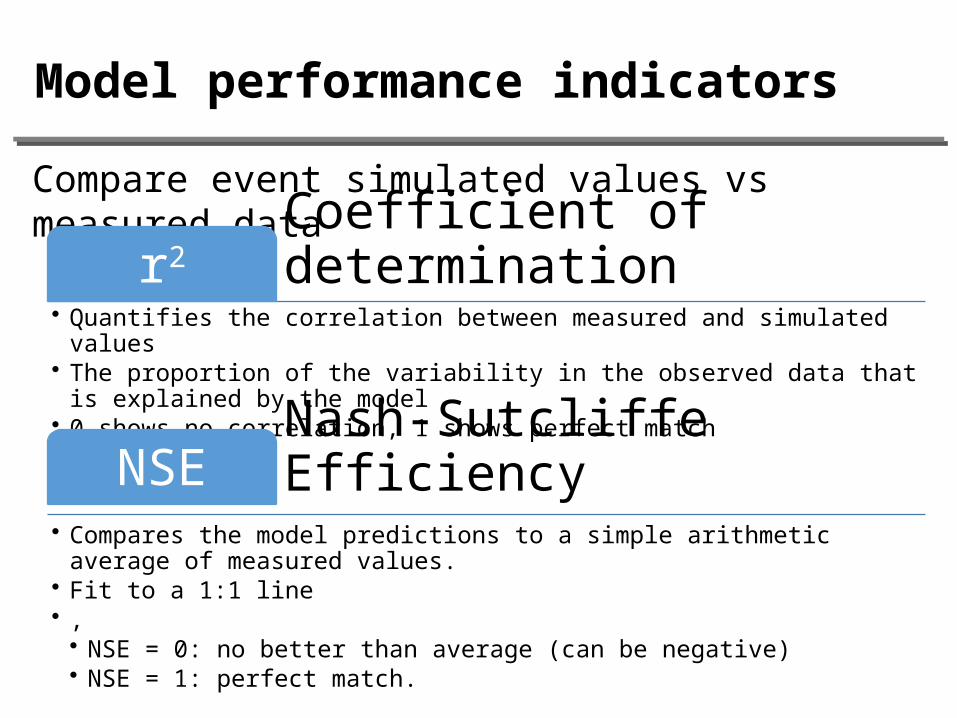
Compare event simulated values vs measured data
Model performance indicators
Coefficient of determinationr2
• Quantifies the correlation between measured and simulated values• The proportion of the variability in the observed data that is explained by the model• 0 shows no correlation, 1 shows perfect match
Nash-Sutcliffe EfficiencyNSE• Compares the model predictions to a simple arithmetic average of measured values.• Fit to a 1:1 line• ,
• NSE = 0: no better than average (can be negative) • NSE = 1: perfect match.
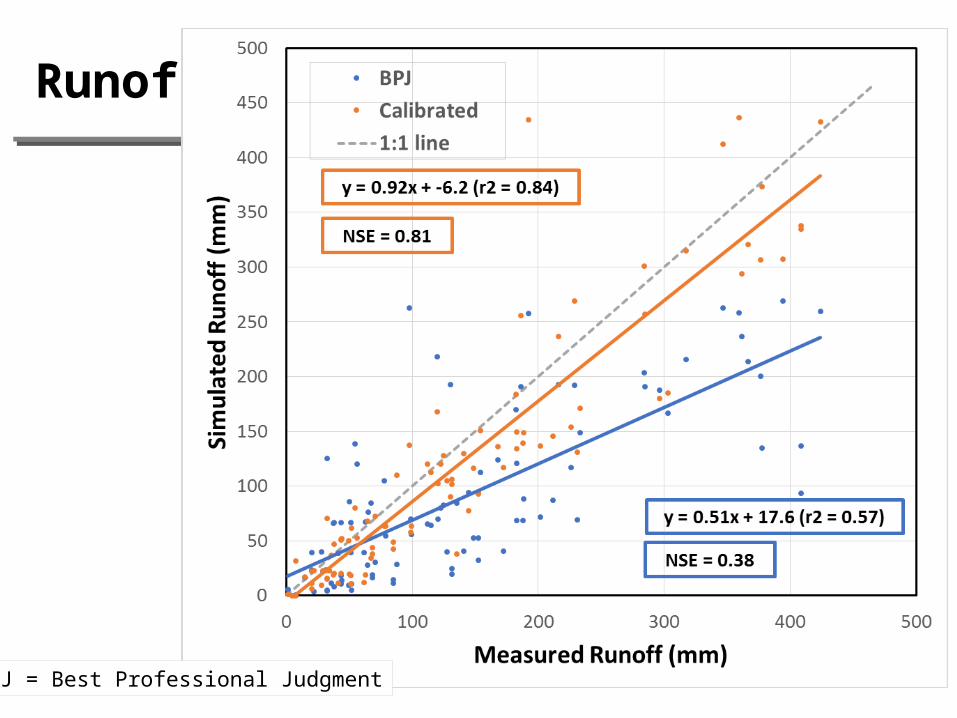
Runoff
BPJ = Best Professional Judgment
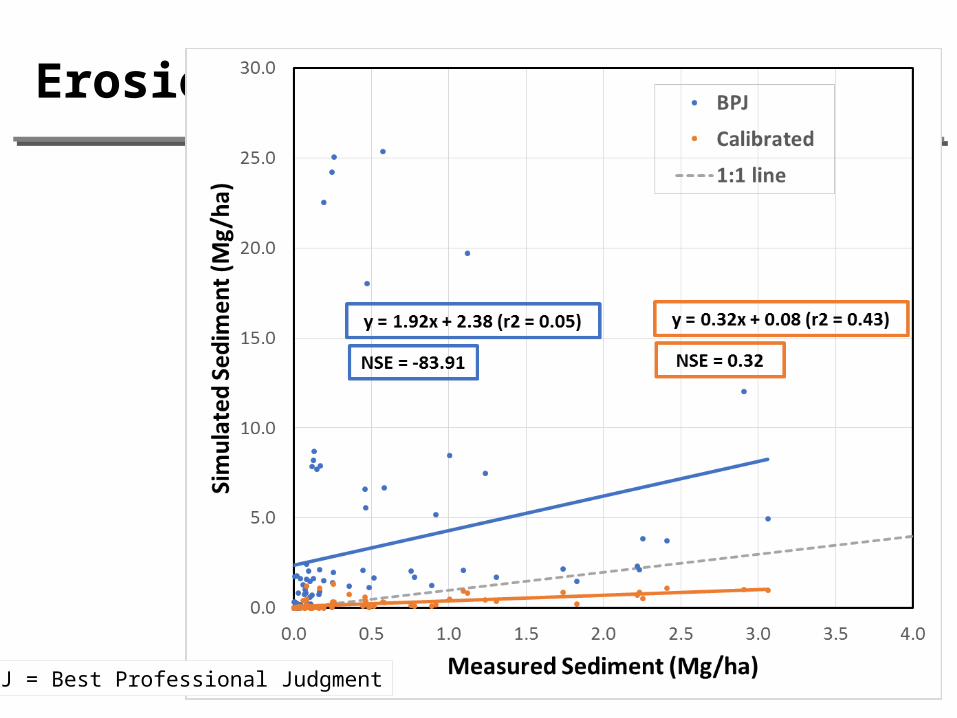
Erosion
BPJ = Best Professional Judgment
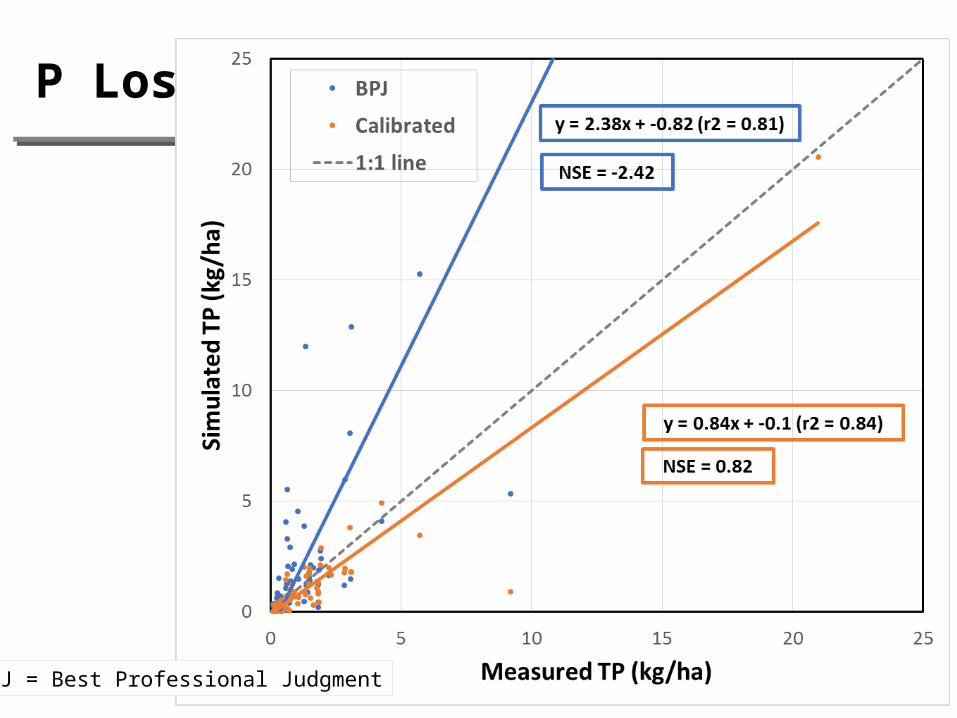
P Loss
BPJ = Best Professional Judgment
Conclusions
Relying on best professional judgment produced unsatisfactory results for simulated runoff, sediment, and total P loss.
With full calibration, APEX can produce satisfactory simulation of runoff, sediment, and total P loss• Improved runoff with calibration• Greatly improved simulation of P loss
Regional parameterization may be successful alternative to best professional judgment
Looking ahead
Current research: How much calibration is needed to provide an effective model to predict P loss?• No calibration? No• Regional calibration? ??• Full calibration? Yes
How much impact does calibration strategy have on evaluation results of P index?• Do I get different recommendation with a better calibrated
model?
• Modeling Support• Jimmy Williams• Jaehak Jeong
• Funding: USDA-NRCS Conservation Innovation Grant
Acknowledgements