estimation of leaf and stem area in the wind erosion ... estimation of... · estimation of leaf and...
TRANSCRIPT
Reprinted from Agronomy Journal Vol. 87, No. 1
Estimation of Leaf and Stem Area in the Wind Erosion Prediction System (WEPS) Amare Retta* and Dean V. Armbrust
ABSTRACT A process-oriented wind erosion prediction system (WEPS) is being
developed. Among the processes to be simulated is the influence of bio- mass cover in dissipating wind energy at the soil surface. The wind speed profile within the canopy is a function of the distribution of leaf and stem areas by height. Relationships are needed to calculate leaf and stem areas and leaf and stem masses for use in area and mass by height dis- tribution functions. Alfalfa (Medicago sah'va L.), corn (Zea mays L.), oat (Avena sativa L.), sorghum [Sorghum bicolor (L.) Moench.1, soy- bean [Glycine mar (L.) Merr.], and winter wheat (Triticum aesfivurn L.) were planted in different years, soil types, and management regimes. The objective was to obtain relationships that could be used to simulate leaf and stem area growth. Measurements were made of leaf and stem areas and leaf and stem masses. Linear and nonlinear regressions of leaf dry weight on leaf area and of stem dry weight on stem area were performed. The linear model fit the leaf data for all crops and also fit the stem data for alfalfa, oat, soybean, and winter wheat, with ? val- ues ranging from 083 to 0.99. The stem data of corn and sorghum fit the nonlinear model (with ? = 0.99 and 0.92, respectively). Regression parameters for stem appear to be less affected by environmental factors (e.g., management, different years, varieties, or soil types) than are the regression parameters for leaf. The linear and nonlinear relationships can be used to estimate leaf and stem area growth from their respective masses.
WIND EROSION PREDICTION SYSTEM (WEPS) is being A developed by scientists of the USDA-ARS (Hagen, 1991). WEPS will provide the capability for flexible eval- uation of wind erosion by incorporating new developments in erosion science into a process-based model.
One important factor determining the amount of soil removed by wind is the amount of dead or living biomass covering the soil surface. Interactions of wind and vege- tative cover are complex. The wind erosion equation (WEQ) currently being used to predict wind erosion incorporates empirical parameters that express the effects of quantity, kind, and orientation of biomass cover (Woodruff and Sid- doway, 1965).
Flexibility and arrangement of individual plant parts, distribution of plant parts by height, and number of plants per unit area are some of the factors that affect wind profile distribution through the canopy (Shaw and Pereira, 1982). Leaves tend to streamline with wind flow, whereas stems remain rigid. On a per-unit-area basis, stems are roughly 10 times more effective than leaves in depleting wind energy (Hagen, 1991). The separate effects of leaves and stems were not directly accounted for in the WEQ.
The wind erosion prediction system (WEPS) consists of a number of modular submodels that simulate related phenomena. The wind erosion crop submodel (CROP)
A. Retta, Dep. of Agronomy, and D.V. Armbrust, USDA-ARS and Dep. of Agronomy, Throckmorton Hall Kansas State Univ., Manhattan, KS 66506. Contribution from the USDA-ARS in cooperation with Kansas Agric. Exp. Stn. Contribution no. 93-438-J. Received 1 Nov. 1993. *Corresponding au- thor (Email: Rettaaweru. ksu.edu).
Published in Agron. J. 87:93-98 (1995).
is designed to simulate daily biomass and other crop state variables to meet the requirements of the EROSION and other submodels in WEPS. To calculate the effects of grow- ing plants on soil loss by wind erosion, the CROP sub- model supplies the EROSION submodel with fraction flat cover of biomass on the soil surface and the distribution of leaf area and stem silhouette area indices by height. To calculate biomass, the CROP submode1 uses procedures and relationships similar to those of the EPIC (Erosion- Productivity Impact Calculator) crop growth model (Wil- liams et al., 1989); however, EPIC does not include the capability to calculate stem silhouette area (which hence- forth will be referred to as stem area). To overcome this problem, Armbrust and Bilbro (1993), and Bilbro (1991, 1992) developed regression parameters for several crops relating leaf and stem areas to aboveground biomass. These regression parameters could then be used in submodel CROP to calculate leaf and stem areas as functions of above- ground biomass. In most cases, however, significant vari- ations occurred in the regression parameters by year and location, thus limiting the usefulness of such equations for estimating leaf and stem area growth under variable climates, soil types, and other environmental factors that affect growth.
Green leaf area of crop plants can be estimated as a product of leaf mass and specific leaf area (Charles-Edwards et al., 1986; van Keulen, 1986). Stem area can be esti- mated from stem mass in the same way. This approach assumes that prediction equations based on stem area vs. stem weight relationships may be more consistent than those based on stem area vs. aboveground biomass. Leaf mass and leaf area relationships can be influenced by tem- perature, solar radiation (Charles-Edwards, 1979), plant spacing (Bullock et al., 1988), age of the plant, water stress, and, in some crop plants, the accumulation of starch in the leaf (Brown, 1984). Little information is available in the literature on factors that influence stem area and stem weight relationships; however, we can assume that some or all of the factors influencing leaf growth probably also influence stem growth characteristics.
Field data were collected on several crops commonly grown in the Manhattan, KS, area from 1987 through 1990. The objective was to develop parameters that could be used for estimating leaf and stem areas. This paper presents a summary of prediction equations relating leaf and stem areas to their respective weights of several crops for use in estimating stem and leaf area growth.
MATERIALS AND METHODS Computational Scheme
The CROP submodel uses computational procedures from the EPIC crop model (Williams et al., 1989) to calculate bio-
Abbreviations: WEPS, wind erosion prediction system; WEQ, wind ero- sion equation; EPIC, erosion-productivity impact calculator.
93
~~
94 AGRONOMY JOURNAL, VOL 87, JANUARY-FEBRUARY 1995
mass. Partitioning of biomass into mots and aboveground biomass also is calculated in the same way as in EPIC. In the CROP submodel, aboveground biomass is partitioned into leaf and stem masses. Leaf and stem areas are then calculated using specific leaf and stem area values appropriate for each crop.
Regfission Analysis Measured leaf or stem areas were regressed on their respec-
tive measured leaf or stem dry weights using a linear model, a linear model with zero intercept, or a nonlinear model, thus:
y = d where y = leaf or stem area, x = leaf or stem weight, and a,b are regression parameters. Linear and nonlinear regression pa- rameters were calculated. Leaf and stem data taken after canopy cover were not included, because the primary interest in wind erosion modeling is to estimate leaf and stem areas as accurately as possible during the early vegetative growth period. Potential soil loss by wind erosion decreases as the plant canopy cover increases, with soil loss becoming negligible under sufficient canopy cover (ArmbNst and Lyles, 1985). Data of each plant were used in the regression analysis.
Field Experiments Plot sizes and data collection procedures for all crops were
essentially the same. For all crops except alfalfa, a 15- by 65-m plot was established and divided into three sampling sites. Ten adjacent plants were cut weekly from each sampling site and taken to the laboratory. The height of each plant was measured, then each plant was cut into five equal lengths and measure- ments of leaf area, stem area, and dry weights of leaves and stems from each one-fifth increment of plant height were made. The alfalfa plot was = 1500 m2, and 20 plants were randomly sampled weekly from the entire area. Site and growth conditions for each crop are described below.
Alfalfa
An area near the center of a commercially grown, Buffalo alfalfa field was selected. Sampling started on 26 May 1989 and
ended on 24 May 1990. The soil at the site is a Muir silt loam (fine-silty, mixed, mesic, Pachic Haplustoll). Irrigation was applied as needed from a center pivot sprinkler system.
Corn
873 X Mol7 corn was planted on 10 May 1988 in Reading silt loam (fine, mixed, mesic, Typic Argiudoll) and grown under rainfed conditions. On 29 May 1990, Pioneer 3189 was planted in Eudora silt loam (coarse-silty, mixed, mesic, Typic Argiu- doll) and grown with irrigation. The rainfed plot in 1988 ap- peared to have adequate moisture during the early vegetative growing period. Irrigation was applied in 1990 to meet crop water needs during the entire growing period.
Oat ‘Don’ oat was seeded on 14 Mar. 1989 in Ivan-Kennebec silt
loam (fine-silty, mixed, mesic Cnmulic Hapludoll) and on 9 Feb. 1990 in Smolan silt loam (fine, montmorillonitic, mesic Pachic Argiustoll). In both years, the crop was grown under rainfed conditions. In 1989, low soil moisture reserves and relatively low precipitation (Fig. 1) created severe water stress during the vegetative growing period. In 1990, growing conditions were favorable, and stress was not observed.
Sorghum
Golden Acres ‘TE-Dinero’ grain sorghum was planted on 9 lune 1989 in Reading silt loam under rainfed conditions. Grow- ing conditions were rated as favorable.
Soybean
‘DeSota’ soybean was planted on 13 May 1988 in Ivan- Kennebec silt loam and’Flyer’ soybean on 13 June 1989 in Read- ing silt loam. Both were grown under rainfed conditions. In 1989, low soil moisture reserves and relatively low precipitation (Fig. 1) created severe water stress during the vegetative growth period. In 1988, adequate soil moisture was available for most of the growing season. In 1988, stem area measurements were discontinued after the laner part of the vegetative growth period
. ~ ~ . 80 ~
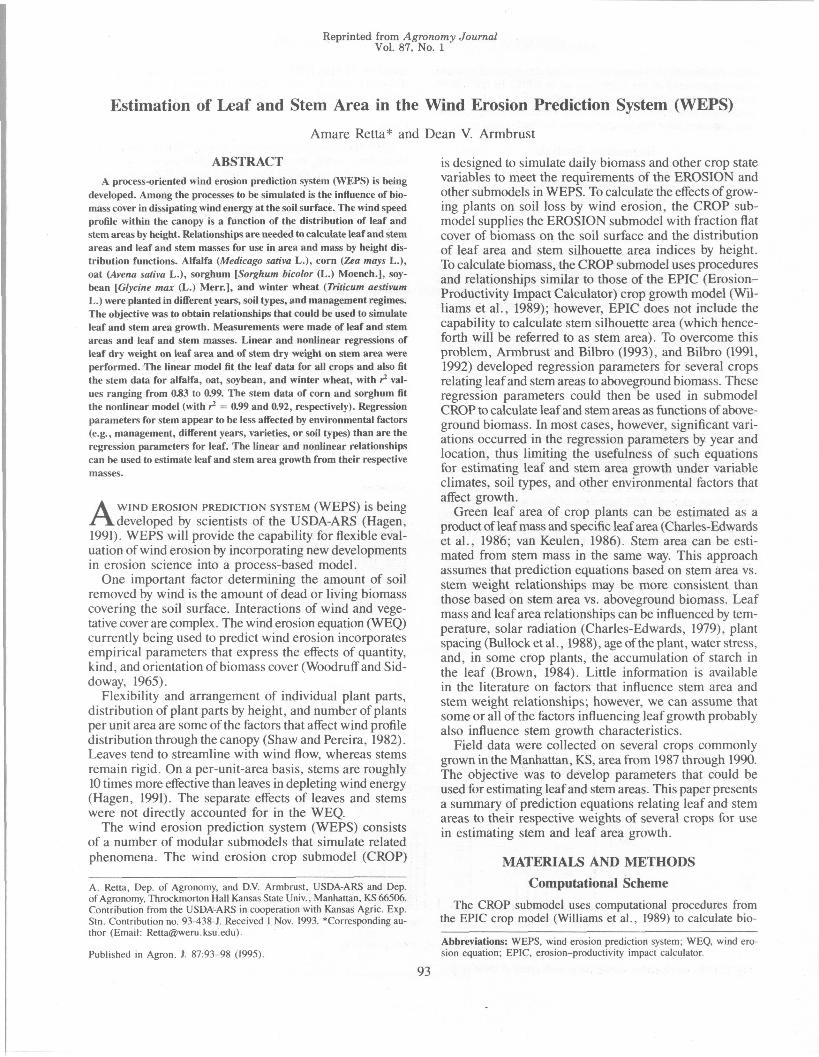
! oat 1990 soybean 1989 wheat 1988-1989
C
._ ._ a oat 1989 soybean 1988
Q 60
40
0 30 60 90 120 0 30 60 90 120 0 60 120 180 240
Days after planting
Fig. 1. Daily precipitation during the growth cycles of three crops.
RETTA & ARMBRUST WEPS ESTIMATION OF LEAF AND STEM AREA 95
1000 1 3000
7 aoo 2500
2000
N 1500
1000
500
+ C
600
6 400
200
1
m
0 0
0 5 TO 15 20 25 0 2 4 6 8 1 0 1 2
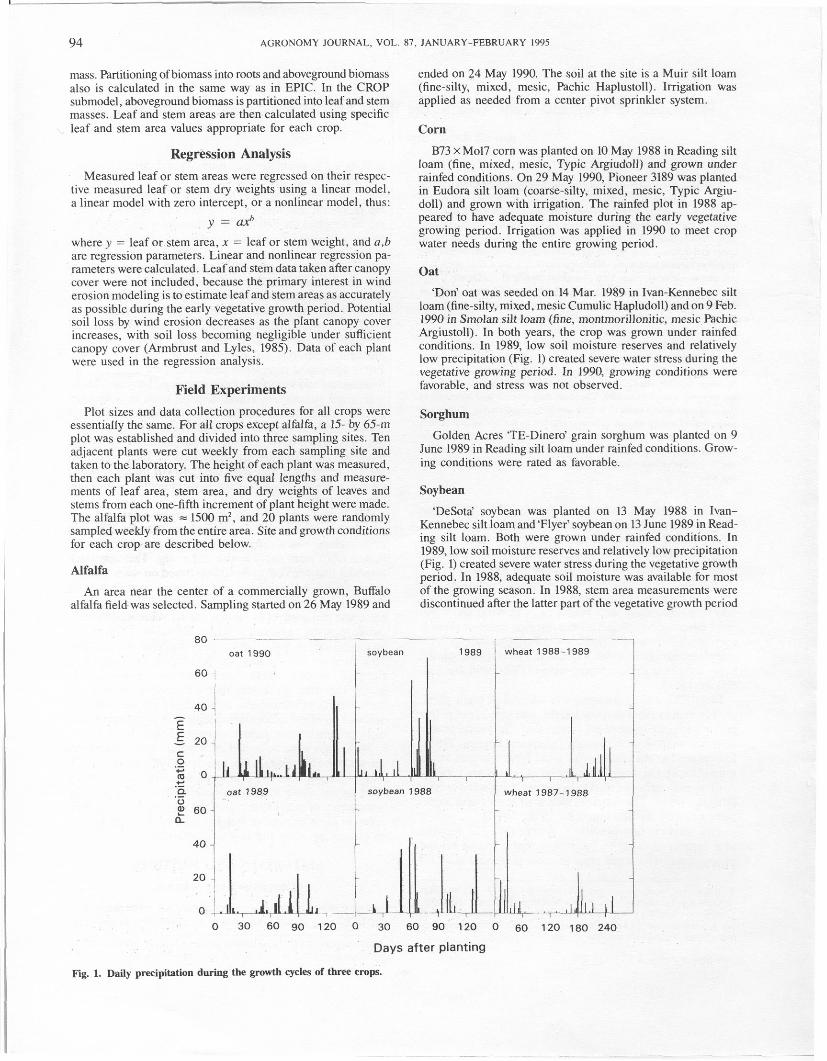
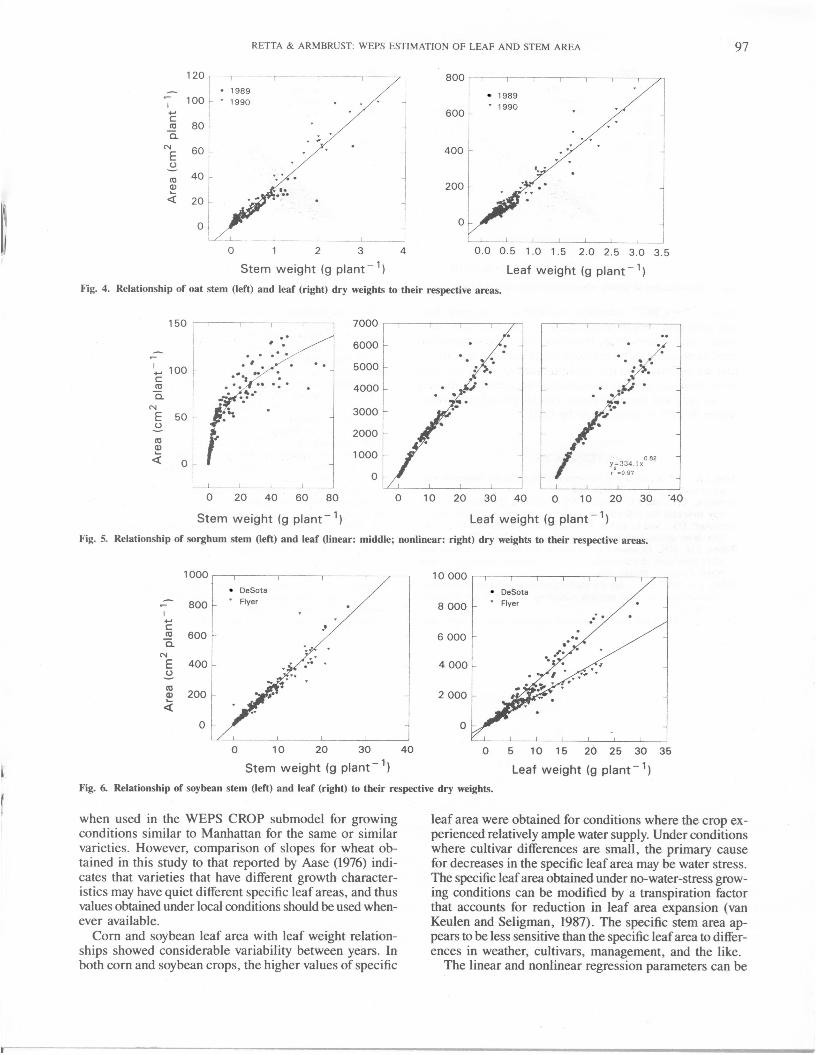
Stem weight (g plant - 1 Leaf weight (g plant-') Fig. 2. Relationship of alfalfa stem (left) and leaf (right) dry weights to their respective areas.
(last sampling date was on 11 July 1988) because the main stem and some of its branches were too big to go through the area meter.
Winter Wheat
'Tam 105' winter wheat was planted on 28 Sept. 1987 in Read- ing silt loam. 'Karl' winter wheat was planted on 10 Oct. 1988 in Smolan silt loam, and 'Triumph 66' winter wheat was planted on 10 Oct. 1988 in Ivan-Kennebec silt loam. Crops were grown under dryland conditions. Growing conditions for Tam 105 were good, but Triumph 66, which was planted following a soybean crop, experienced relatively severe drought conditions. Karl was planted in a previously fallowed plot and suffered less water stress than Triumph 66.
RESULTS Alfalfa
Leaf and stem dry weights showed strong linear cor- relations with their respective areas (Fig. 2). The inter- cept for leaf was not significant, but was significant for stem (Table 1). For both leaf and stem, the slopes obtained with the zero-intercept linear model were close to the val- ues obtained using the linear model (Table 1).
Corn Linear regression for leaf area on leaf dry weight showed
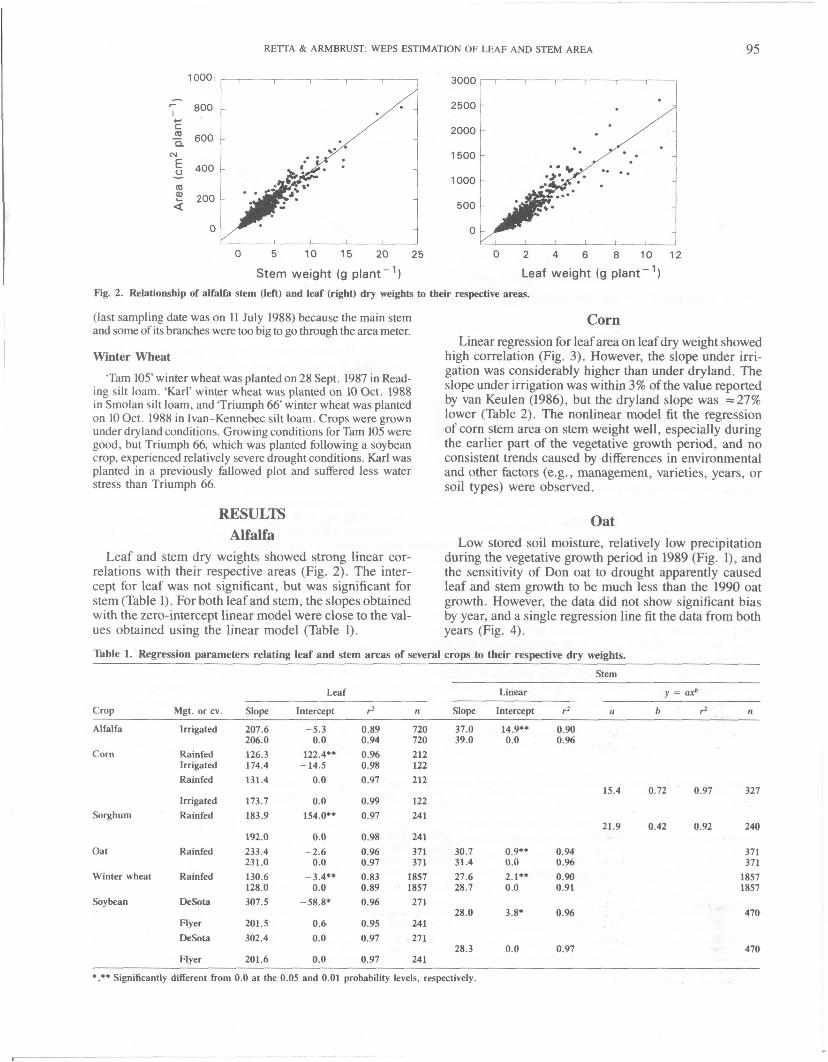
high correlation (Fig. 3). However, the slope under irri- gation was considerably higher than under dryland. The slope under irrigation was within 3% of the value reported by van Keulen (1986), but the dryland slope was ~ 2 7 % lower (Table 2). The nonlinear model fit the regression of corn stem area on stem weight well, especially during the earlier part of the vegetative growth period, and no consistent trends caused by differences in environmental and other factors (e.g., management, varieties, years, or soil types) were observed.
Oat Low stored soil moisture, relatively low precipitation
during the vegetative growth period in 1989 (Fig. l), and the sensitivity of Don oat to drought apparently caused leaf and stem growth to be much less than the 1990 oat growth. However, the data did not show significant bias by year, and a single regression line fit the data from both years (Fig. 4).
%ble 1. Regression parameters relating leaf and stem areas of several crops to their respective dry weights.
Stem
Leaf Linear y = d
Crop Mgt. or cv. Slope Intercept r2 n Slope Intercept r2 a b r2 n
Alfalfa Irrigated 207.6 -5.3 0.89 720 37.0 14.9** 0.90 206.0 0.0 0.94 720 39.0 0.0 0.96
Corn Rainfed 126.3 122.4** 0.96 212 Irrigated 174.4 -14.5 0.98 122 Rainfed 131.4 0.0 0.97 212
Irrigated 173.7 0.0 0.99 122 15.4 0.72 0.97 327
Sorghum Rainfed 183.9 154.0** 0.97 241 21.9 0.42 0.92 240
192.0 0.0 0.98 241 Oat Rainfed 233.4 -2.6 0.96 371 30.7 0.9** 0.94 371
231.0 0.0 0.97 371 31.4 0.0 O.% 371 Winter wheat Rainfed 130.6 -3,4** 0.83 1857 27.6 2.1** 0.90 1857
128.0 0.0 0.89 1857 28.7 0.0 0.91 1857 Soybean DeSota 307.5 -58.8* 0.96 271
28.0 3.8* O.% 470 Flyer 201.5 0.6 0.95 241 DeSota 302.4 0.0 0.97 271
Flyer 201.6 0.0 0.97 241 28.3 0.0 0.97 470
*,** Significantly different from 0.0 at the 0.05 and 0.01 probability levels, respectively.
7--
96
Fig. 3.
AGRONOMY JOURNAL, VOL 87, JANUARY-FEBRUARY 1995
350 1 l --1 1 -I-,-) looooi-,----, -7 1 - -, - , I
A 1988
+ - & 2501 a
E
100 I
50 f- a
01
t * 1988 I 8 000
1 6 000
. .. *./j ... .r;.(.
4 000
2 000
0
0 10 20 30 40 50
Leaf weight (g plant-’) their respective areas.
0 10 20 30 40 50 60
Stem weight (g plant - ‘1 Relationship of corn stem (left) and leaf (right) dry weights to
Sorghum The linear model fit the leaf area and leaf weight re-
lationships with intercept significantly > 0.0 (Table 1). The slope (obtained using the zero-intercept linear model) was within 4% of the specific leaf area given by van Keulen (1986) (Table 2). Leaf area and leaf weight relationships during the early stages showed a small degree of nonlin- earity (Fig. 5). However, there was no increased accuracy in fitting the data to the nonlinear model (the r2 for both linear and nonlinear models was 0.97). The nonlinear model fit the stem area and stem weight relationships well (Fig. 5) .
Soybean The leaf data of DeSota soybean cultivar showed a strong
linear fit. The linear fit for Flyer leaf area on leaf weight was also good (Fig. 6); however, DeSota had a much big- ger slope than Flyer (Table 1). Leaf area expansion is sen- sitive to water stress (Boyer, 1970). Flyer experienced stress during the early part of the vegetative growth period due to low soil moisture reserves and low precipitation, which may have contributed to the large differences in the leaf growth characteristics of Flyer and DeSota varieties. The slopes (using the zero-intercept linear model) of DeSota were higher, and of Flyer lower than the value given by van Keulen (1986) (Table 2). Linear regression of stem weight on stem area of data from both varieties showed a good fit with an intercept not significantly different from 0.0. No varietal or year differences were apparent (Fig. 6).
However, since stem area data for DeSota were not avail- able for the entire vegetative growth period, the conclu- sion that a single regression line could be used to cal- culate stem area growth in both cultivars may need further confirmation.
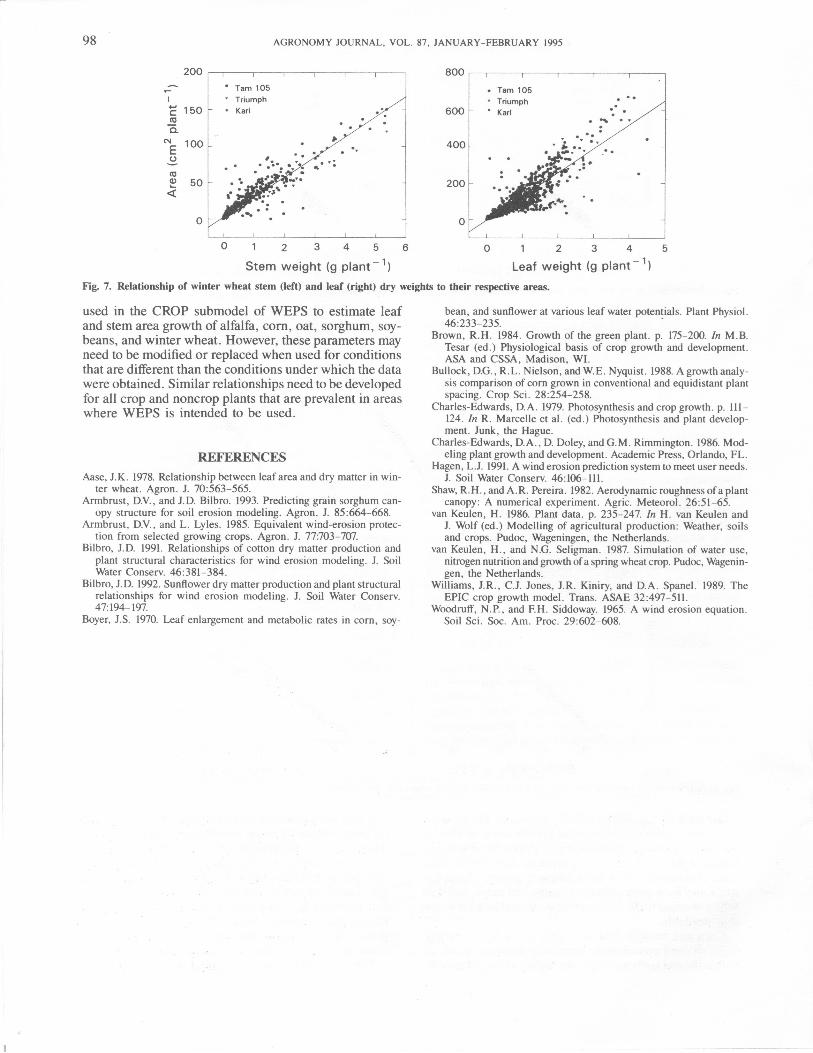
Winter Wheat Good linear fits were obtained for regression of leaf
weight on leaf area and stem weight on stem area (Fig. 7). In all cases, no trends due to year or variety were observed. The intercepts for both leaf and stem were significant (P = 0.01). The slope of linear regression of leaf area on leaf weight was 36% lower than the slope reported by Aase (1978) and van Keulen (1986). The varieties used in Aase’s study produced 22.7 times the leaf area, and 1.7 times the leaf mass of the varieties used in these experiments. The differences in specific leaf area between Aase’s and our data may reflect differences between varieties more than water stress, since Aase’s experiments were also carried out under dryland conditions.
DISCUSSION AND CONCLUSIONS Leaf area with leaf weight relationships of oat and win-
ter wheat that were grown under different environmental conditions (e.g. , multipIe years, different varieties, or man- agement) did not appear to be significantly influenced by the environment. Thus the regression parameters obtained may be expected to give reasonable estimates of leaf area,
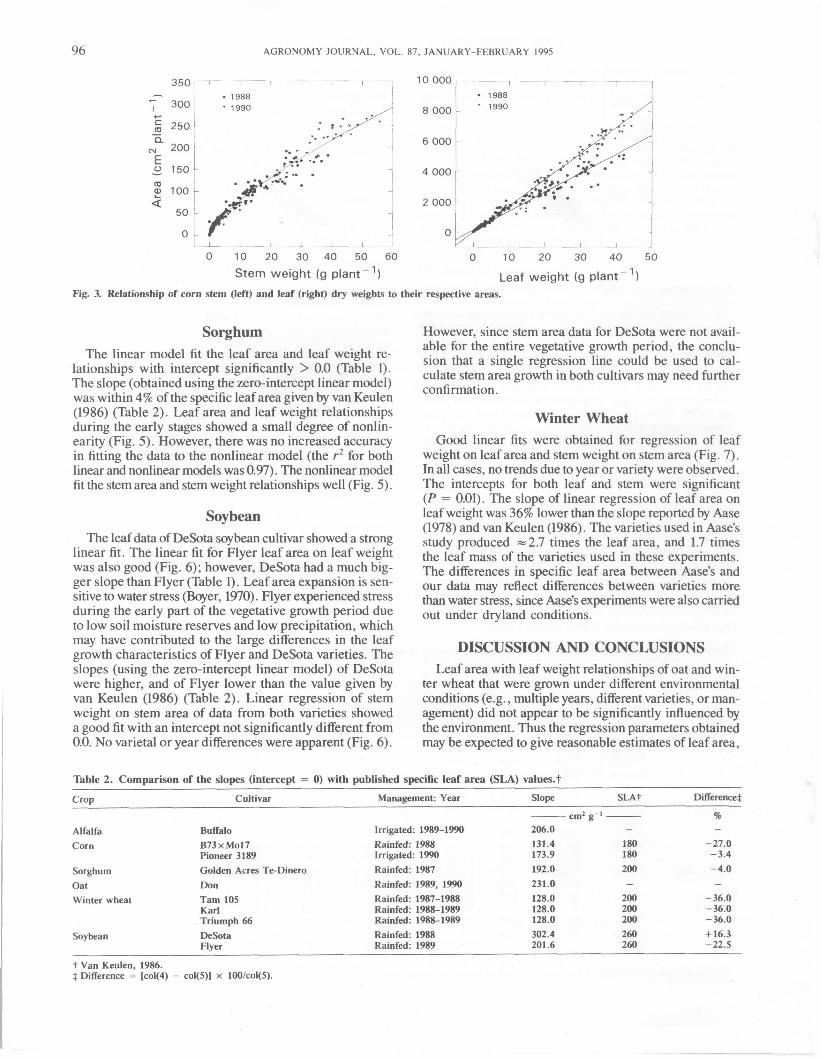
Table 2. Comparison of the slopes (intercept = 0) with published specific leaf area (SLA) va1ues.t
Crop Cultivar Management: Year Slope SLAt Difference$
cm? g-’ - w - - Alfalfa Buffalo Irrigated: 1989-1990 206.0
Corn B73 x Mol7 Rainfed: 1988 131.4 180 -27.0
Sorghum Golden Acres Te-Dinero Rainfed: 1987 192.0 200 -4.0 Pioneer 3 189 Irrigated: 1990 173.9 180 -3.4
- - Oat Don Rainfed: 1989, 1990 231.0 Winter wheat Tam 105 Rainfed: 1987-1988 128.0 200 -36.0
Karl Rainfed: 1988-1989 128.0 200 - 36.0 Triumph 66 Rainfed: 198%-1989 128.0 200 -36.0
Soybean DeSota Rainfed: 1988 302.4 260 + 16.3 Flyer Rainfed: 1989 201.6 260 -22.5
t Van Keulen. 1986. $ Difference = [co1(4) - co1(5)] x 100/co1(5).
97 RETTA & ARMBRUST: WEPS ESTIMATION OF LEAF AND STEM AREA
7000
6000
5000
4000
3000
2000
1000
0 -
7 100 w C
Q - m 80
I I I I
-
-
-
-
-
-
1 I 1 1 I
0
8oo -- 1989 - 1990
600
I 400 1
I 1 I I , I
0.0 0.5 1.0 1.5 2.0 2.5 3.0 3.5
Stem weight (g plant - 1 Leaf weight (g plant-’)
Fig. 4. Relationship of oat stem (left) and leaf (right) dry weights to their respective areas.
150 r- -1 7-77
l I 1 I I I 0 20 40 60 80
1 I I I ..
- 0 10 20 30 ‘40
Stem weight (g plant-’) Leaf weight (g plant - 1 Fig. 5. Relationship of sorghum stem (left) and leaf (linear: middle; nonlinear: right) dry weights to their respective areas.
1000
DeSota DeSota
8 000 - * Flyer - 800 - * Flyer I
C
Q
w
2 600 -
E 400 -
6 000
N
0 10 20 30 40 0 5 10 15 26 25 30 35
Stem weight (g plant-’) Leaf weight (g plant-’)
0
m - 2 200 Q
0
I Fig. 6. Relationship of soybean stem (left) and leaf (right) to their respective dry weights.
1 when used in the WEPS CROP submodel for growing conditions similar to Manhattan for the same or similar varieties. However, comparison of slopes for wheat ob- tained in this study to that reported by Aase (1976) indi- cates that varieties that have different growth character- istics may have quiet different specific leaf areas, and thus values obtained under local conditions should be used when- ever available.
Corn and soybean leaf area with leaf weight relation- ships showed considerable variabiIity between years. In both corn and soybean crops, the higher values of specific
leaf area were obtained for conditions where the crop ex- perienced relatively ample water supply. Under conditions where cultivar differences are small, the primary cause for decreases in the specific leaf area may be water stress. The specific leaf area obtained under no-water-stress grow- ing conditions can be modified by a transpiration factor that accounts for reduction in leaf area expansion (van Keulen and Seligman, 1987). The specific stem area ap- pears to be less sensitive than the specific leaf area to differ- ences in weather, cultivars, management, and the like.
The linear and nonlinear regression parameters can be
98 AGRONOMY JOURNAL, VOL. 87, JANUARY-FEBRUARY 1995
0 1 2 3 4 5 6 0 1 2 3 4 5
Stem weight (g plant-') Leaf weight (g plant-') Fig. 7. Relationship of winter wheat stem (left) and leaf (right) dry weights to their respective areas.
used in the CROP submodel of WEPS to estimate leaf and stem area growth of alfalfa, corn, oat, sorghum, soy- beans, and winter wheat. However, these parameters may need to be modified or replaced when used for conditions that are different than the conditions under which the data were obtained. Similar relationships need to be developed for all crop and noncrop plants that are prevalent in areas where WEPS is intended to be used.
REFERENCES Aase, J.K. 1978. Relationship between leaf area and dry matter in win-
ter wheat. Agron. J. 70:563-565. Armbrust, D.V., and J.D. Bilbro. 1993. Predicting grain sorghum can-
opy structure for soil erosion modeling. Agron. J. 85:664-668. Armbrust, D.V., and L. Lyles. 1985. Equivalent wind-erosion protec-
tion from selected growing crops. Agron. J. 77703-707. Bilbro, J.D. 1991. Relationships of cotton dry matter production and
plant structural characteristics for wind erosion modeling. J. Soil Water Conserv. 46:381-384.
Bilbro, J.D. 1992. Sunflower dry matter production and plant structural relationships for wind erosion modeling. J. Soil Water Conserv. 47:194-197.
Boyer, J.S. 1970. Leaf enlargement and metabolic rates in corn, soy-
bean, and sunflower at various leaf water potentials. Plant Physiol.
Brown, R.H. 1984. Growth of the green plant. p. 175-200. In M.B. Tesar (ed.) Physiological basis of crop growth and development. ASA and CSSA, Madison, WI.
Bullock, D.G., R.L. Nielson, and W.E. Nyquist. 1988. A growth analy- sis comparison of corn grown in conventional and equidistant plant spacing. Crop Sci. 28:254-258.
Charles-Edwards, D.A. 1979. Photosynthesis and crop growth. p. 111- 124. In R. Marcelle et al. (ed.) Photosynthesis and plant develop- ment. Junk, the Hague.
Charles-Edwards, D.A., D. Doley, and G.M. Rimmington. 1986. Mod- eling plant growth and development. Academic Press, Orlando, FL.
Hagen, L.J. 1991. A wind erosion prediction system to meet user needs. J. Soil Water Conserv. 46:lM-111.
Shaw, R.H., and A.R. Pereira. 1982. Aerodynamic roughness ofa plant canopy: A numerical experiment. Agric. Meteorol. 2 6 5 - 6 5 .
van Keulen, H. 1986. Plant data. p. 235-247. In H. van Keulen and J. Wolf (ed.) Modelling of agricultural production: Weather, soils and crops. Pudoc, Wageningen, the Netherlands.
van Keulen, H., and N.G. Seligman. 1987. Simulation of water use, nitrogen nutrition and growth of a spring wheat crop. Pudoc, Wagenin- gen, the Netherlands.
Williams, J.R., C.J. Jones, J.R. Kiniry, and D.A. Spanel. 1989. The EPIC crop growth model. Trans. ASAE 32:497-511.
Woodruff, N.P., and F.H. Siddoway. 1965. A wind erosion equation. Soil Sci. SOC. Am. Proc. 29:602-608.
46:233-235.