estimating reliability indices and confidence intervals for transit and traffic at the corridor...
TRANSCRIPT
Estimating Reliability Indices and Confidence Intervals for Transit and Traffic at the Corridor Level
Miguel A. Figliozzi, PhD, ProfessorTravis B. Glick, EI, GRA (Presenter)
TRB 96th Annual Meeting — Washington, DCSession: 595 — Tuesday, 10 January 2017 — 10:15am–12:00pm
Presentation Overview
• High Resolution (HR) Data• Methodology• Speed and Travel Time with Confidence Intervals• Space-Time-Speed Diagrams• Other Applications• Conclusions
Powell Blvd. in Portland, OR
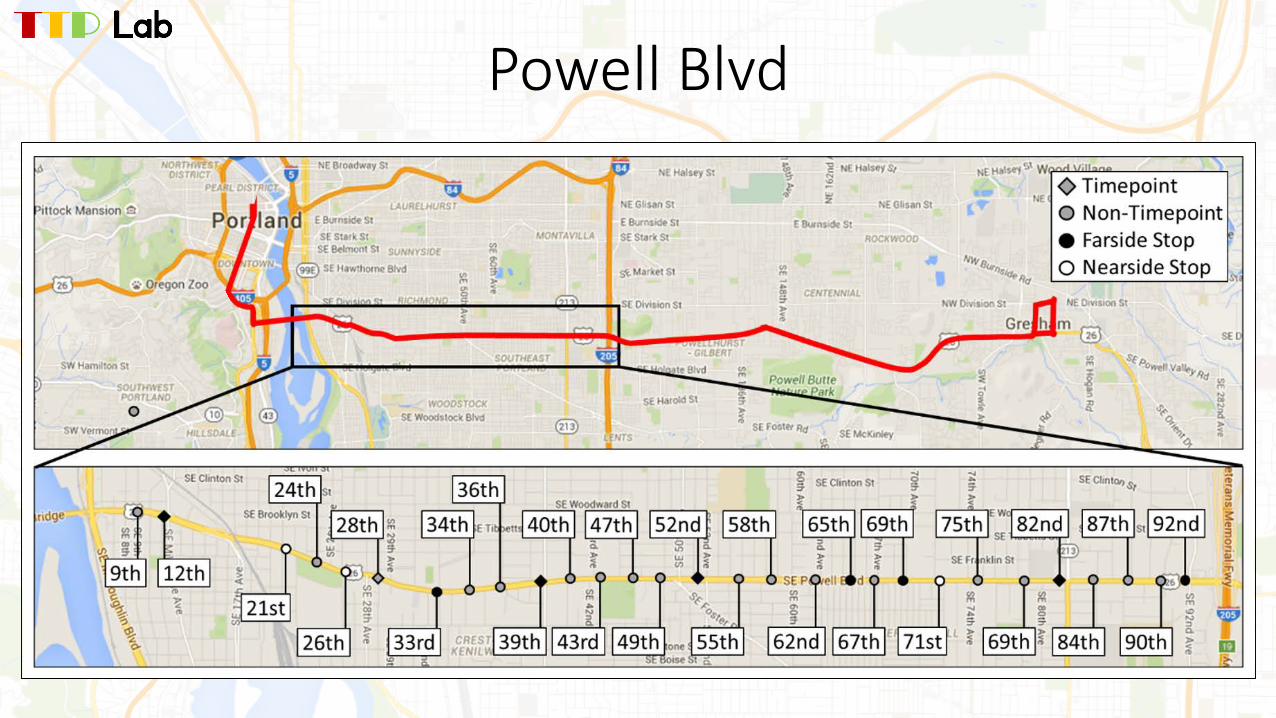
Powell Blvd
High-Resolution Data
Visualizing Collection and Analysis
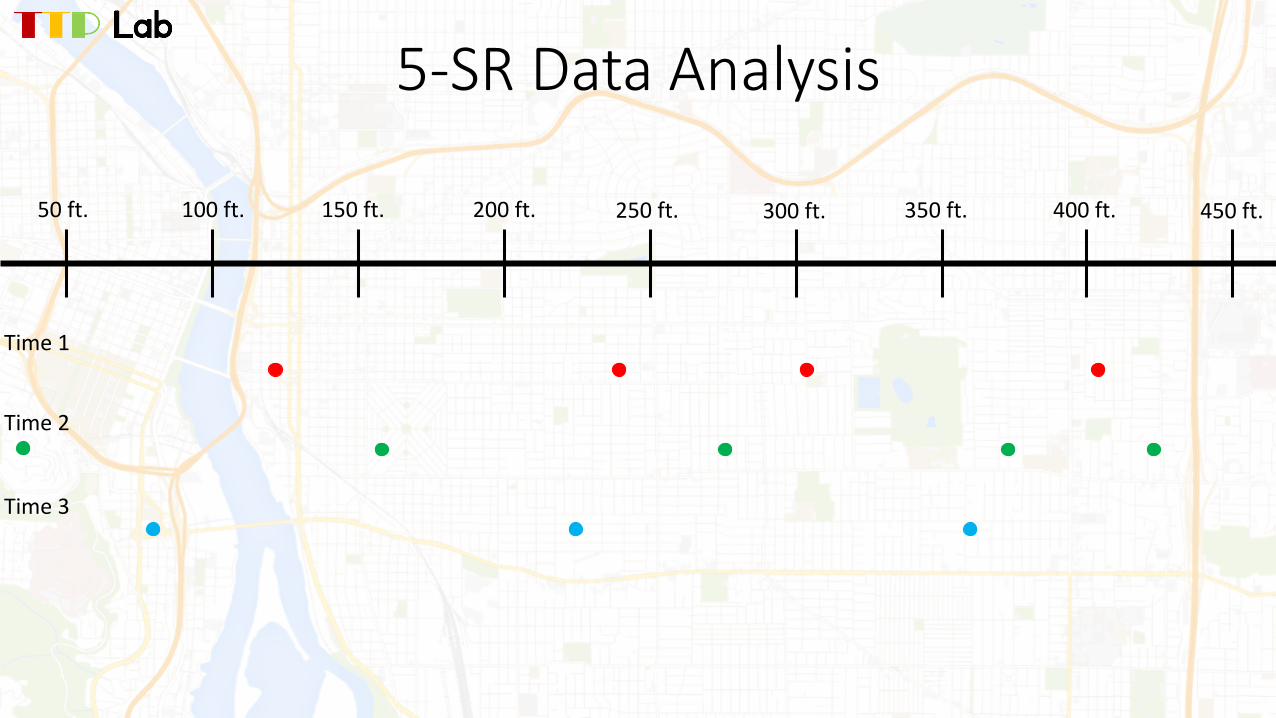
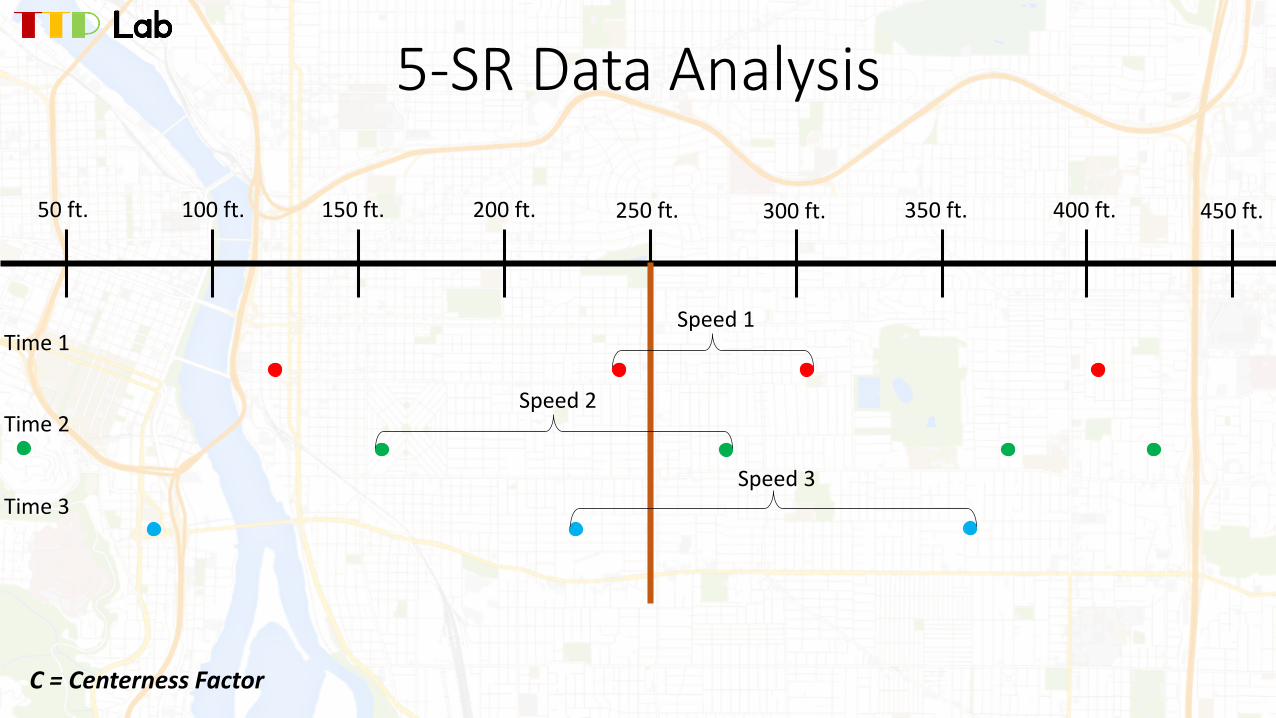
5-SR Data Analysis
450 ft.50 ft. 100 ft. 150 ft. 200 ft. 250 ft. 300 ft. 350 ft. 400 ft.
Time 1
Time 2
Time 3
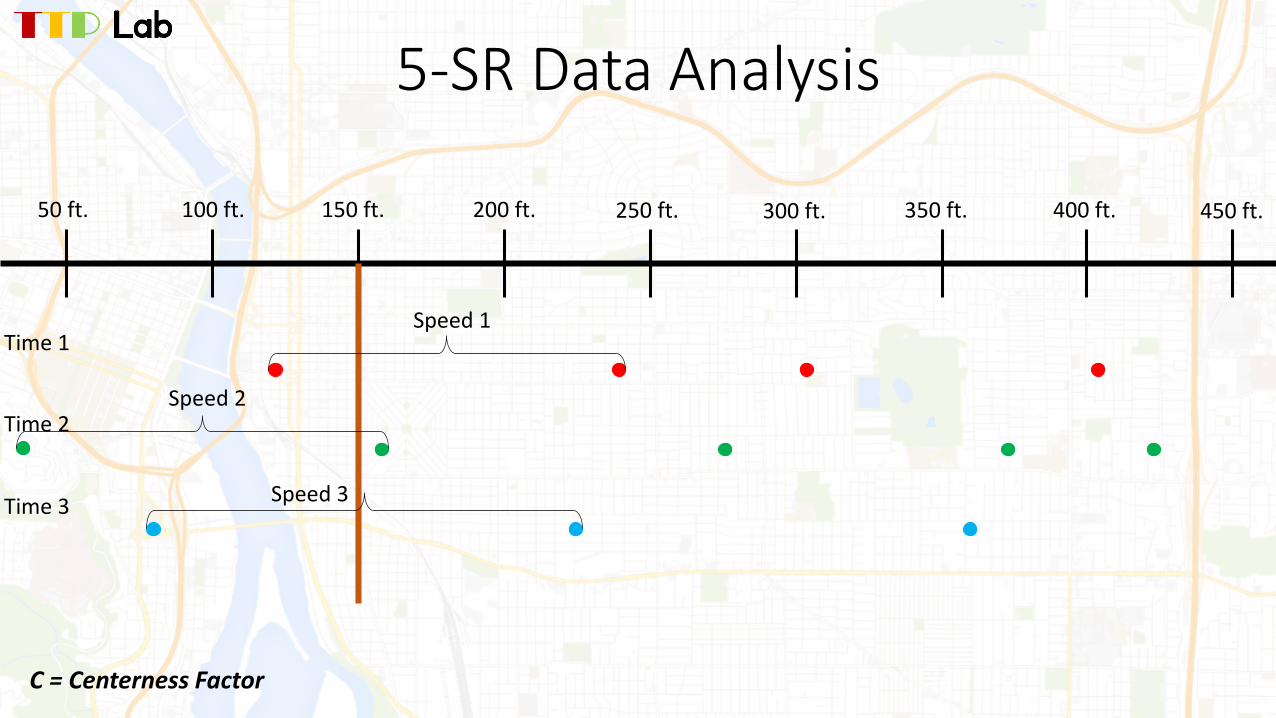
5-SR Data Analysis
450 ft.50 ft. 100 ft. 150 ft. 200 ft. 250 ft. 300 ft. 350 ft. 400 ft.
Time 2
Time 3
Speed 1
Speed 2
Speed 3
C = Centerness Factor
Time 1
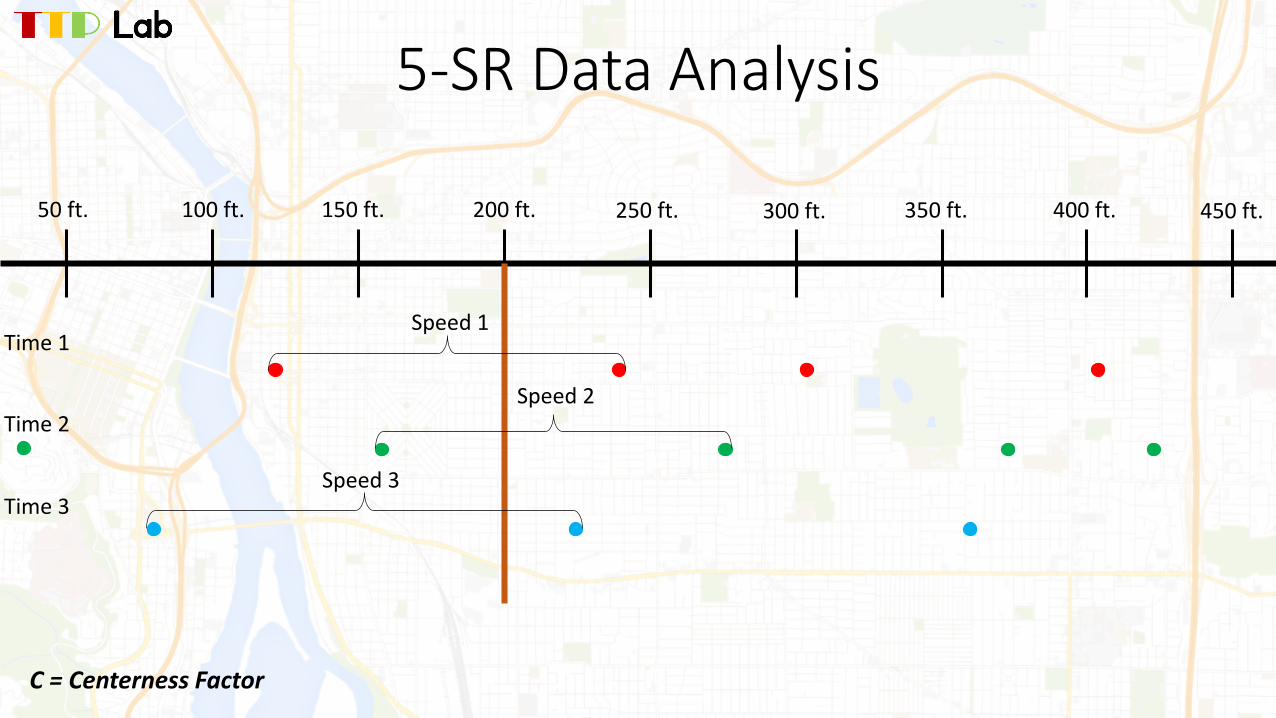
5-SR Data Analysis
450 ft.50 ft. 100 ft. 150 ft. 200 ft. 250 ft. 300 ft. 350 ft. 400 ft.
Time 2
Time 3
Speed 1
Speed 3
Speed 2
C = Centerness Factor
Time 1
5-SR Data Analysis
450 ft.50 ft. 100 ft. 150 ft. 200 ft. 250 ft. 300 ft. 350 ft. 400 ft.
Time 2
Time 3
Speed 1
Speed 2
Speed 3
C = Centerness Factor
Time 1
Methodology
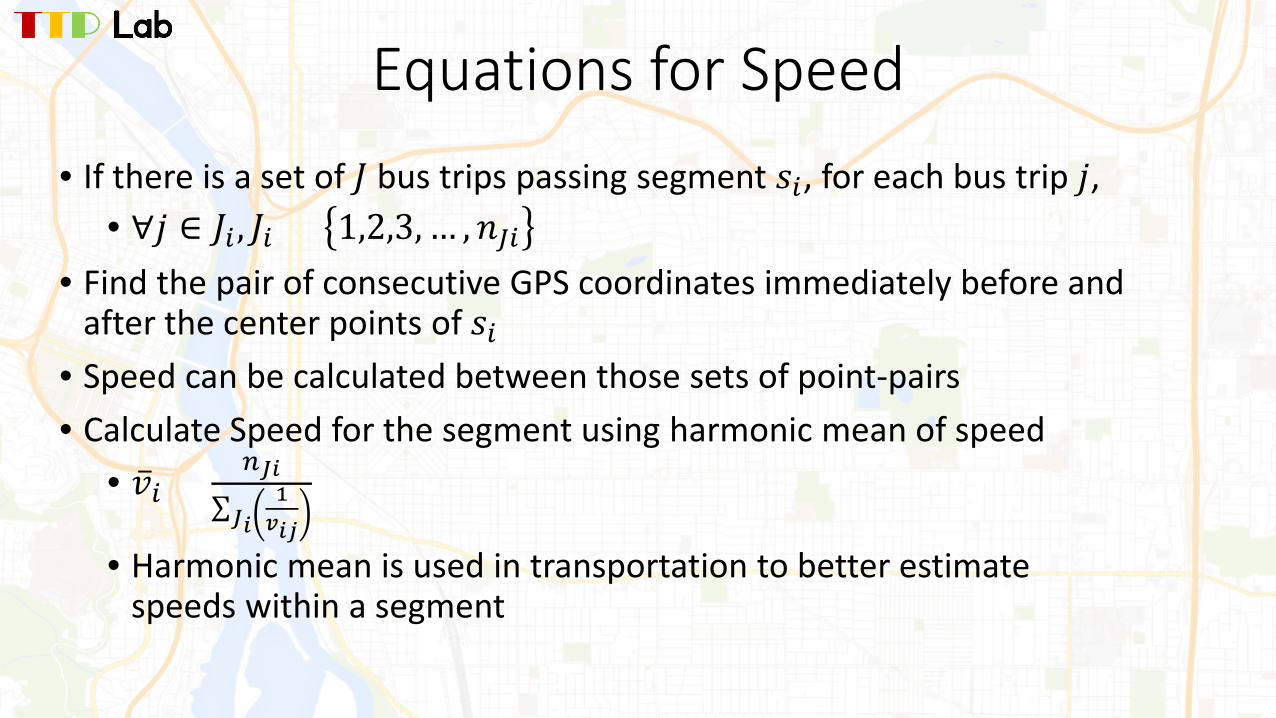
Equations for Speed• If there is a set of 𝐽𝐽 bus trips passing segment 𝑠𝑠𝑖𝑖, for each bus trip 𝑗𝑗,
• ∀𝑗𝑗 ∈ 𝐽𝐽𝑖𝑖 , 𝐽𝐽𝑖𝑖 = 1,2,3, … ,𝑛𝑛𝐽𝐽𝑖𝑖• Find the pair of consecutive GPS coordinates immediately before and
after the center points of 𝑠𝑠𝑖𝑖• Speed can be calculated between those sets of point-pairs• Calculate Speed for the segment using harmonic mean of speed
• �̅�𝑣𝑖𝑖 = 𝑛𝑛𝐽𝐽𝐽𝐽∑𝐽𝐽𝐽𝐽
1𝑣𝑣𝐽𝐽𝑖𝑖
• Harmonic mean is used in transportation to better estimate speeds within a segment
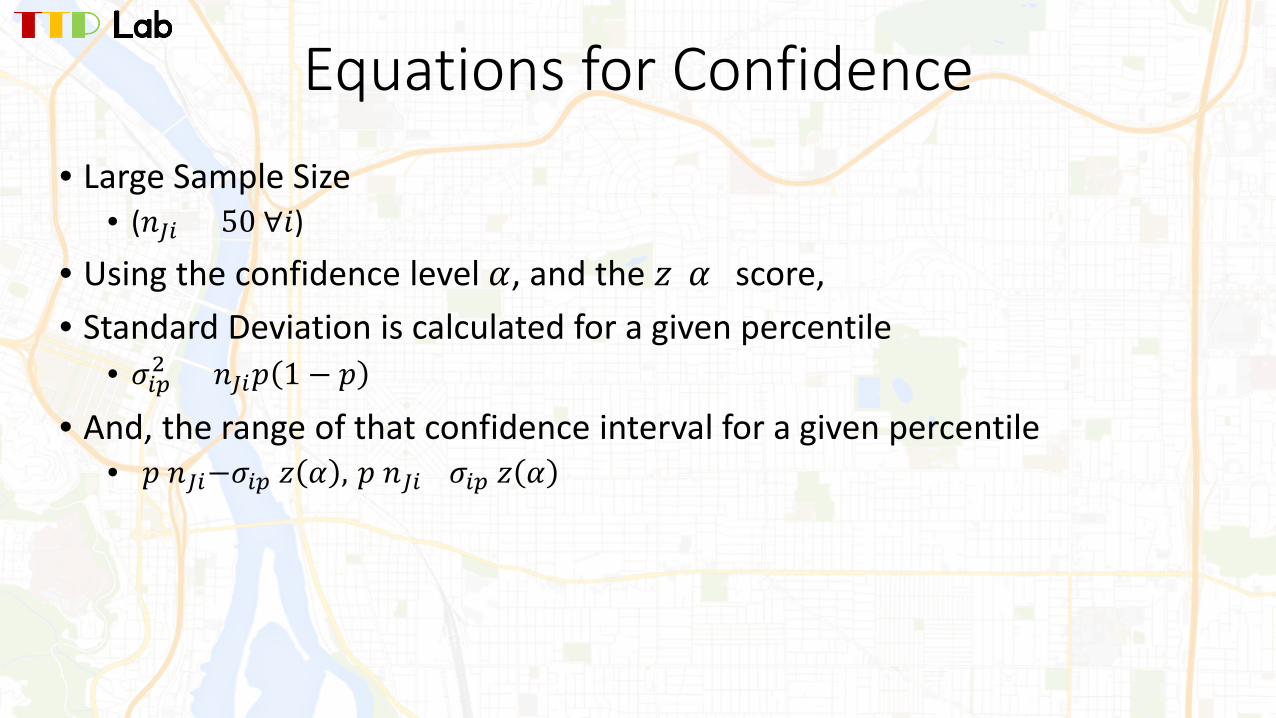
Equations for Confidence• Large Sample Size
• (𝑛𝑛𝐽𝐽𝑖𝑖 > 50 ∀𝑖𝑖)
• Using the confidence level 𝛼𝛼, and the 𝑧𝑧(𝛼𝛼) score,• Standard Deviation is calculated for a given percentile
• 𝜎𝜎𝑖𝑖𝑖𝑖2 = 𝑛𝑛𝐽𝐽𝑖𝑖𝑝𝑝 1 − 𝑝𝑝
• And, the range of that confidence interval for a given percentile• [𝑝𝑝 𝑛𝑛𝐽𝐽𝑖𝑖−𝜎𝜎𝑖𝑖𝑖𝑖 𝑧𝑧 𝛼𝛼 , 𝑝𝑝 𝑛𝑛𝐽𝐽𝑖𝑖+𝜎𝜎𝑖𝑖𝑖𝑖 𝑧𝑧 𝛼𝛼 ]
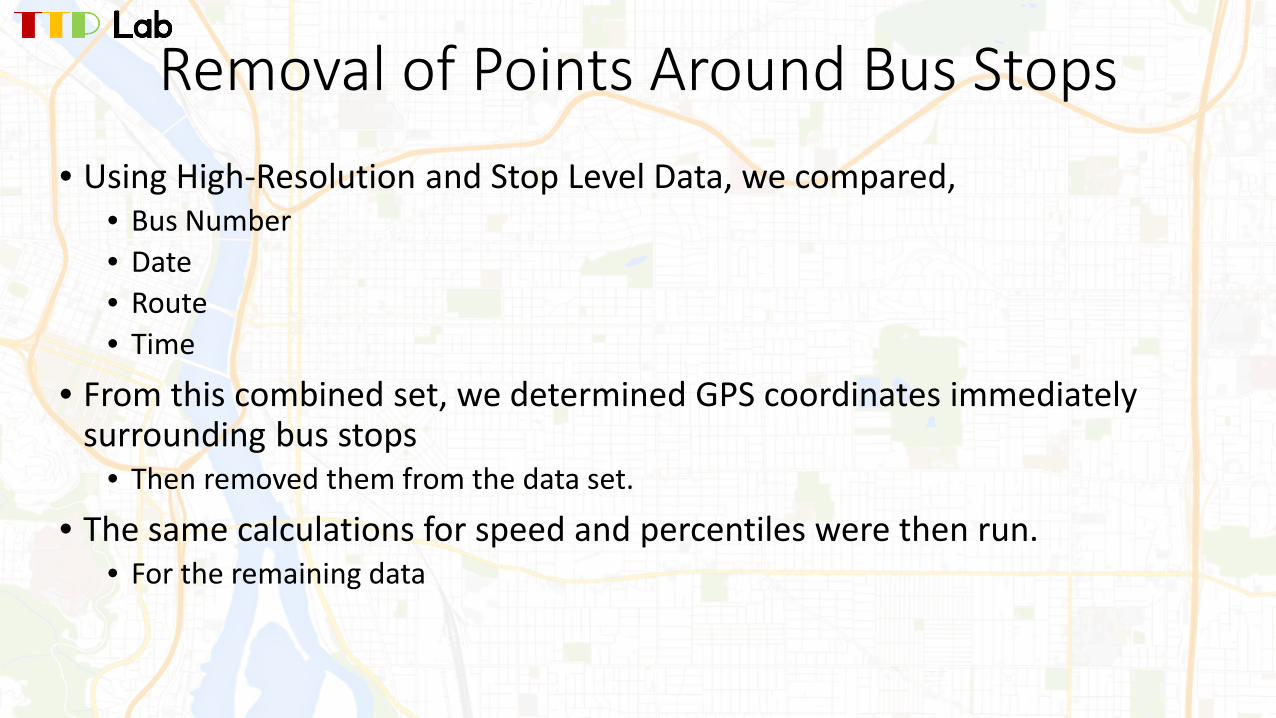
Removal of Points Around Bus Stops• Using High-Resolution and Stop Level Data, we compared,
• Bus Number• Date• Route• Time
• From this combined set, we determined GPS coordinates immediately surrounding bus stops
• Then removed them from the data set.
• The same calculations for speed and percentiles were then run.• For the remaining data
Speed Percentileswith Confidence Intervals
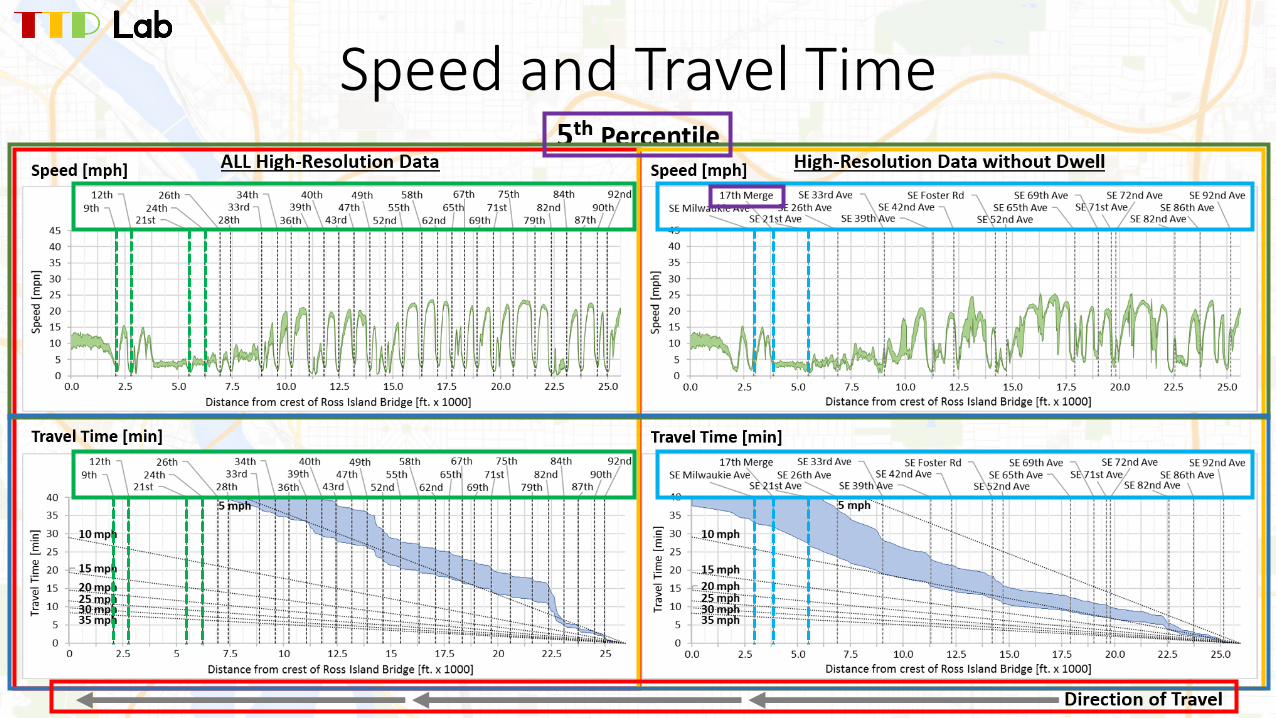
Speed and Travel Time
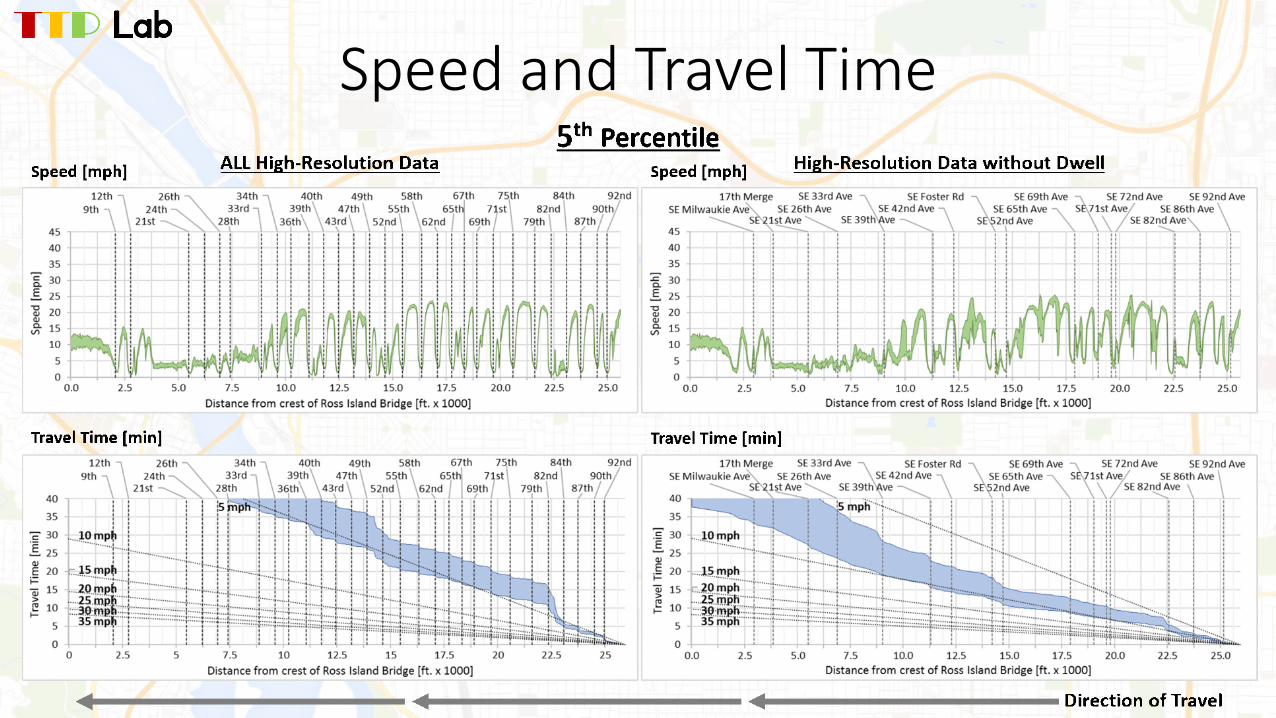
Speed and Travel Time
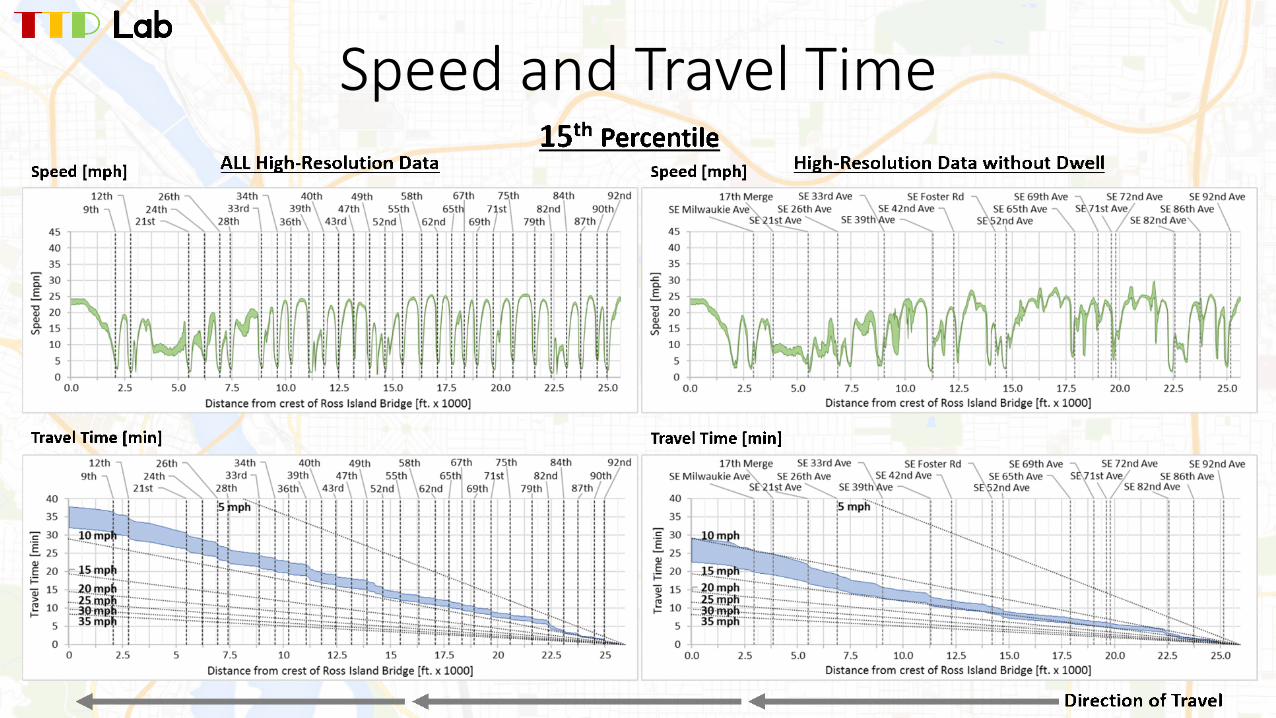
Speed and Travel Time
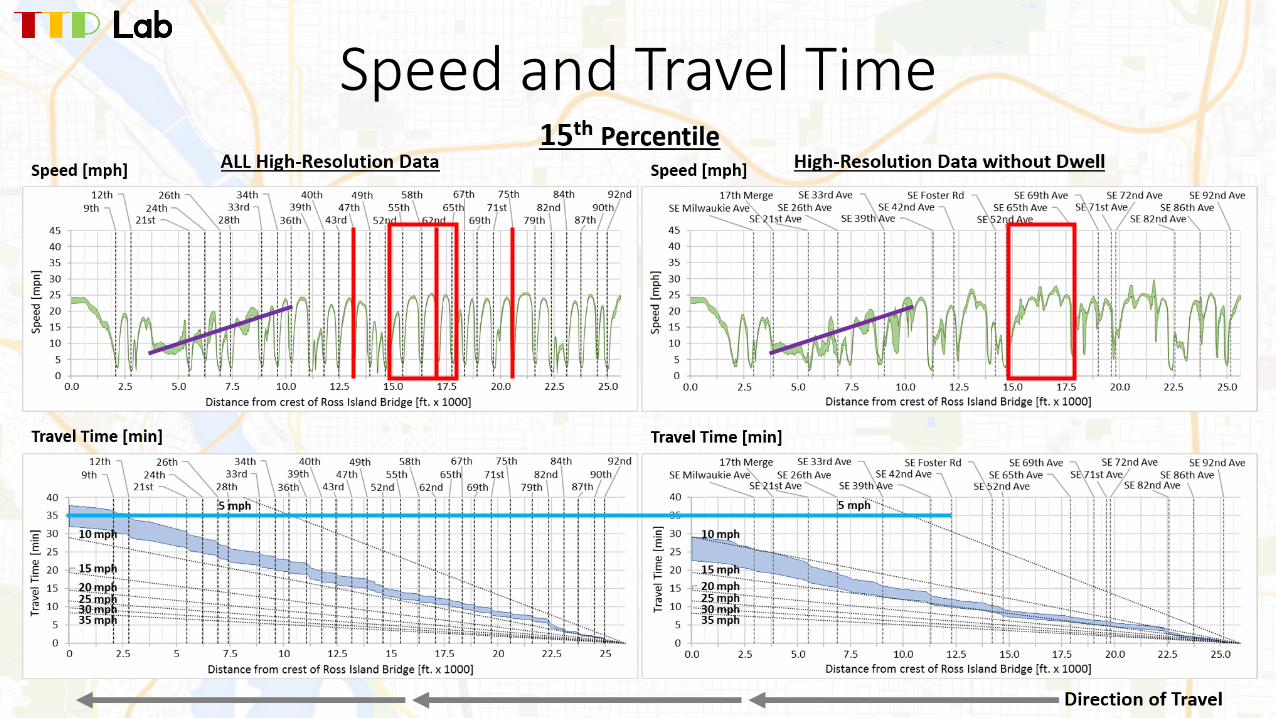
Speed and Travel Time
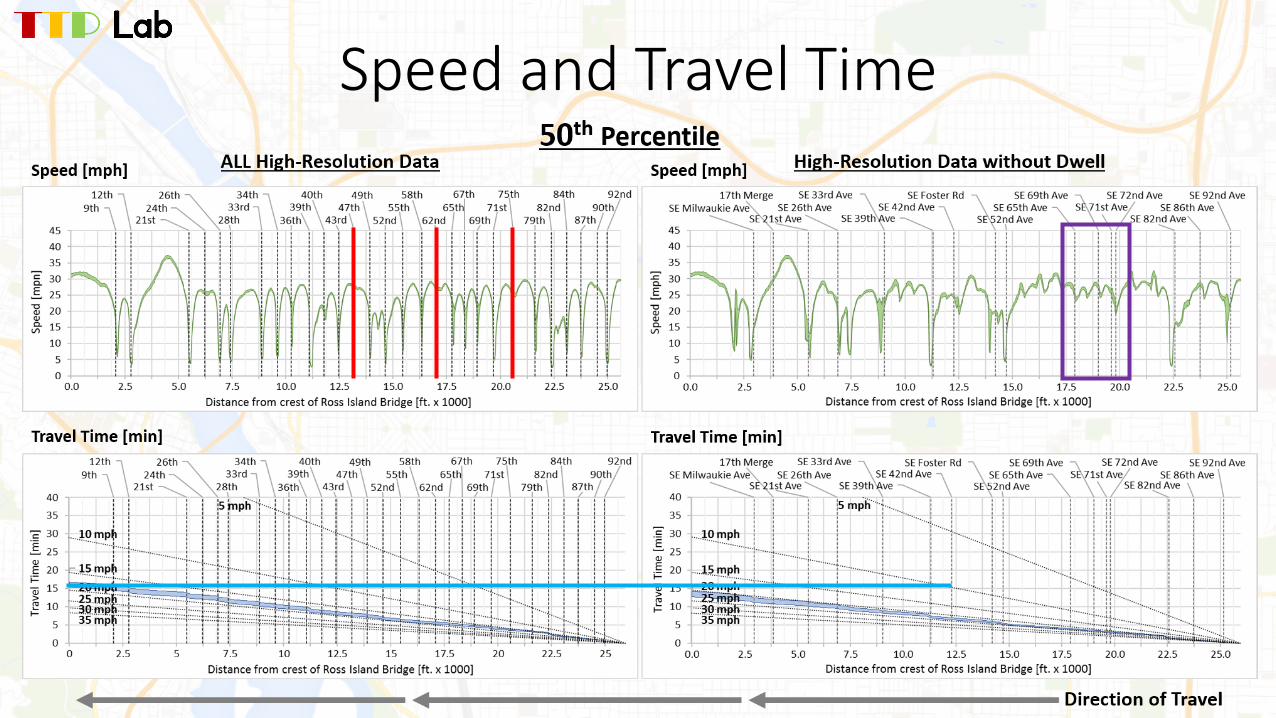
Speed and Travel Time
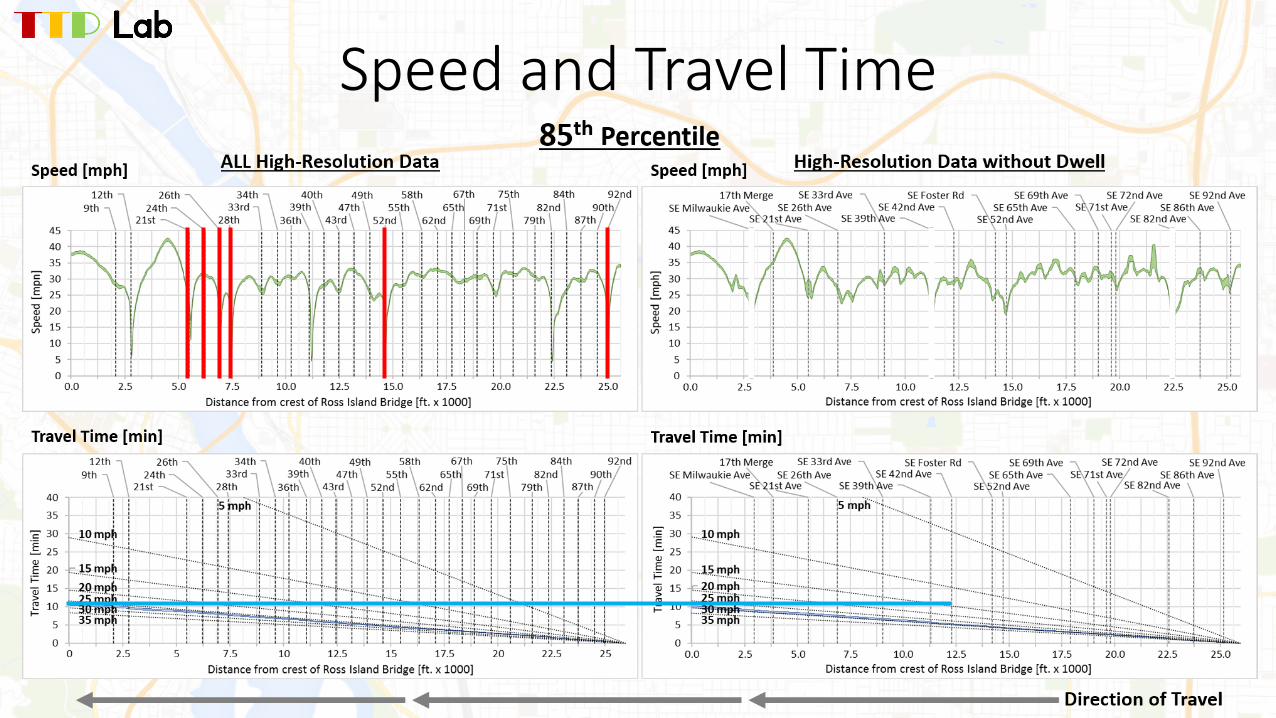
Speed and Travel Time
Time-Space-Speed Diagrams
Westbound Data
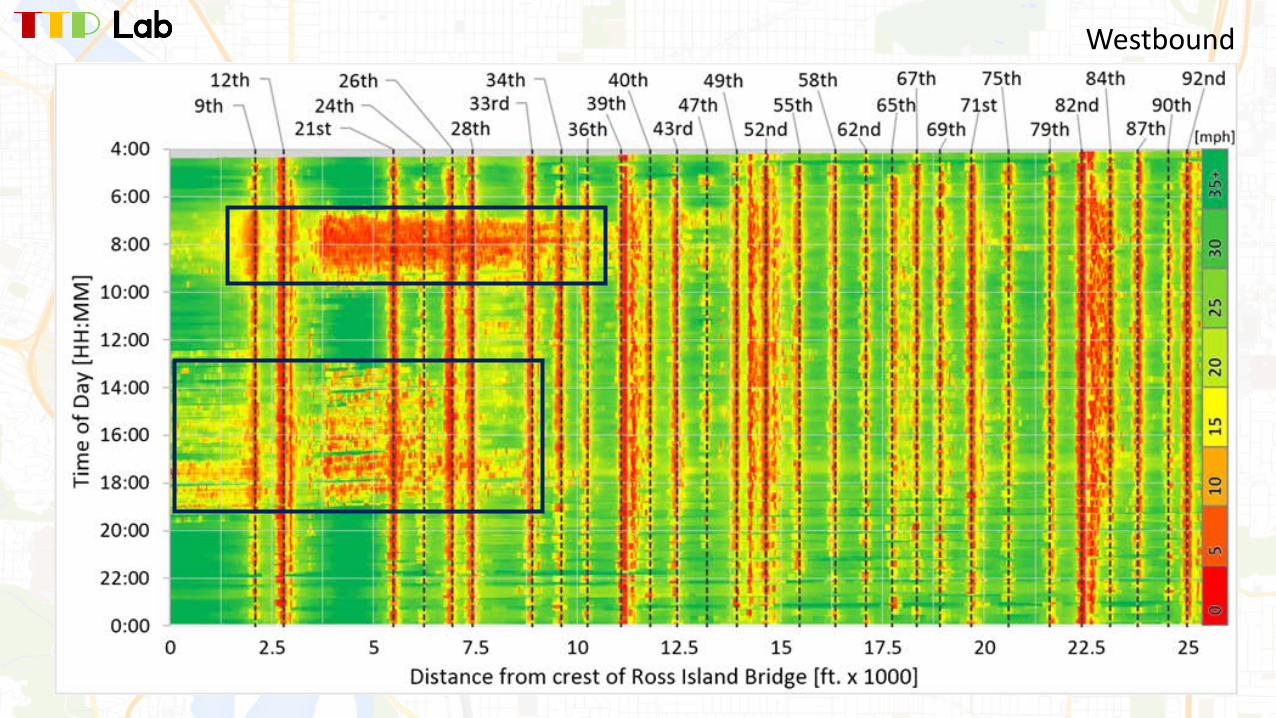
Westbound
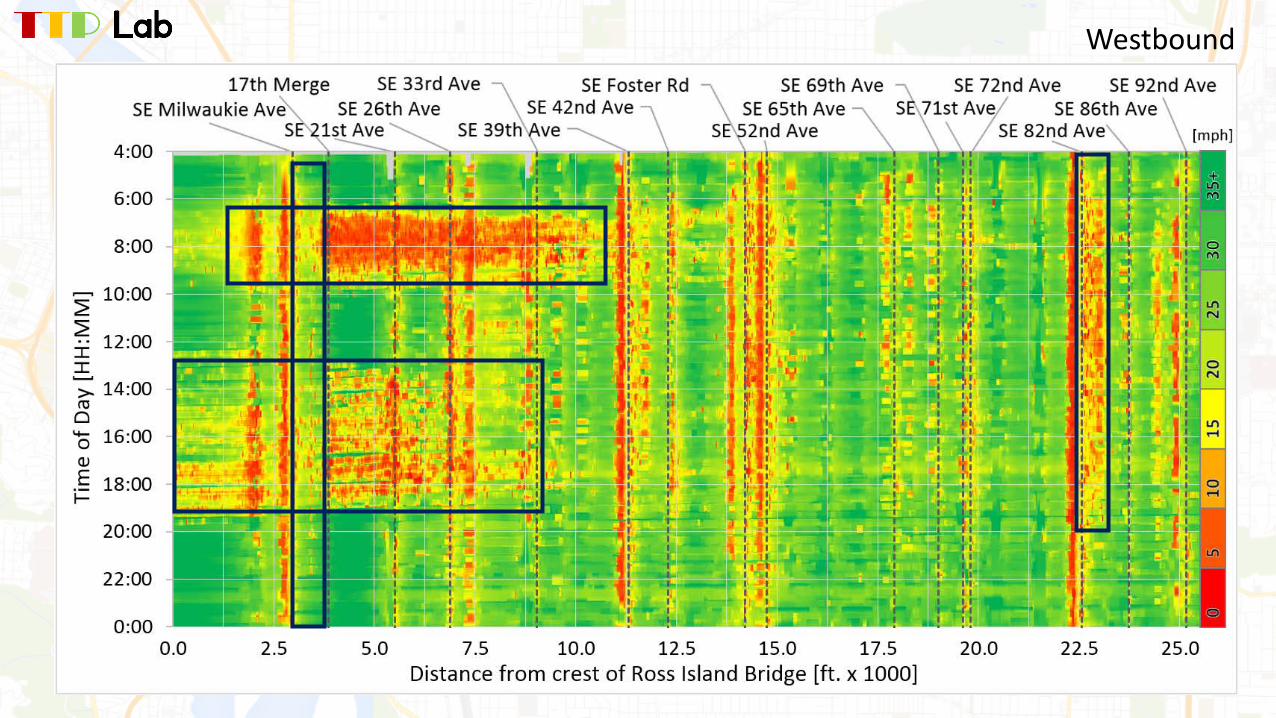
Westbound
Time-Space-Speed Diagrams
Eastbound Data
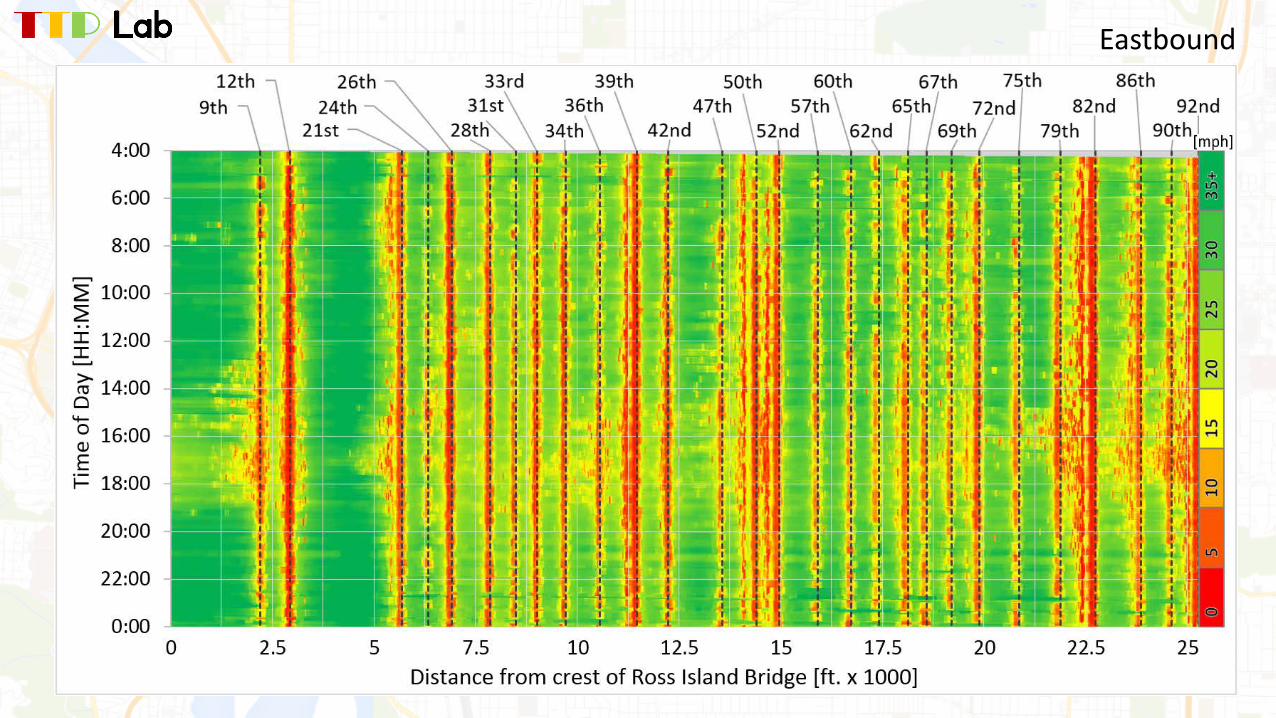
Eastbound
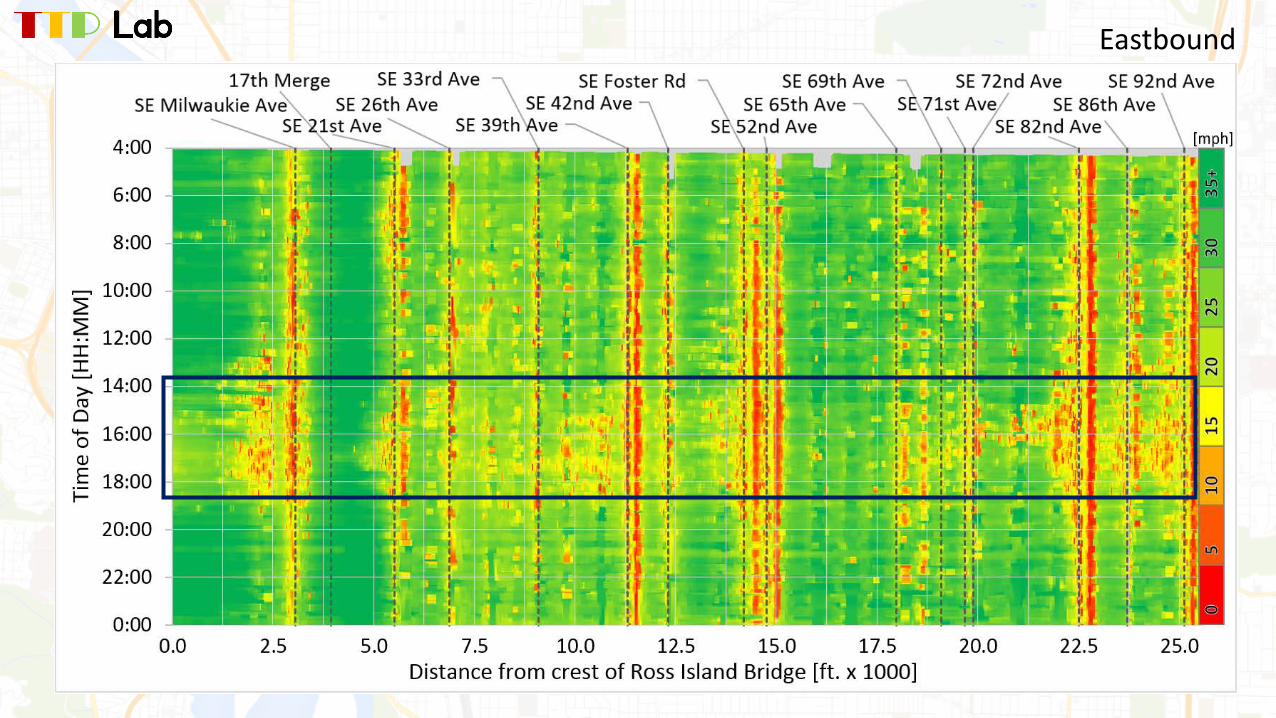
Eastbound
Other Applications
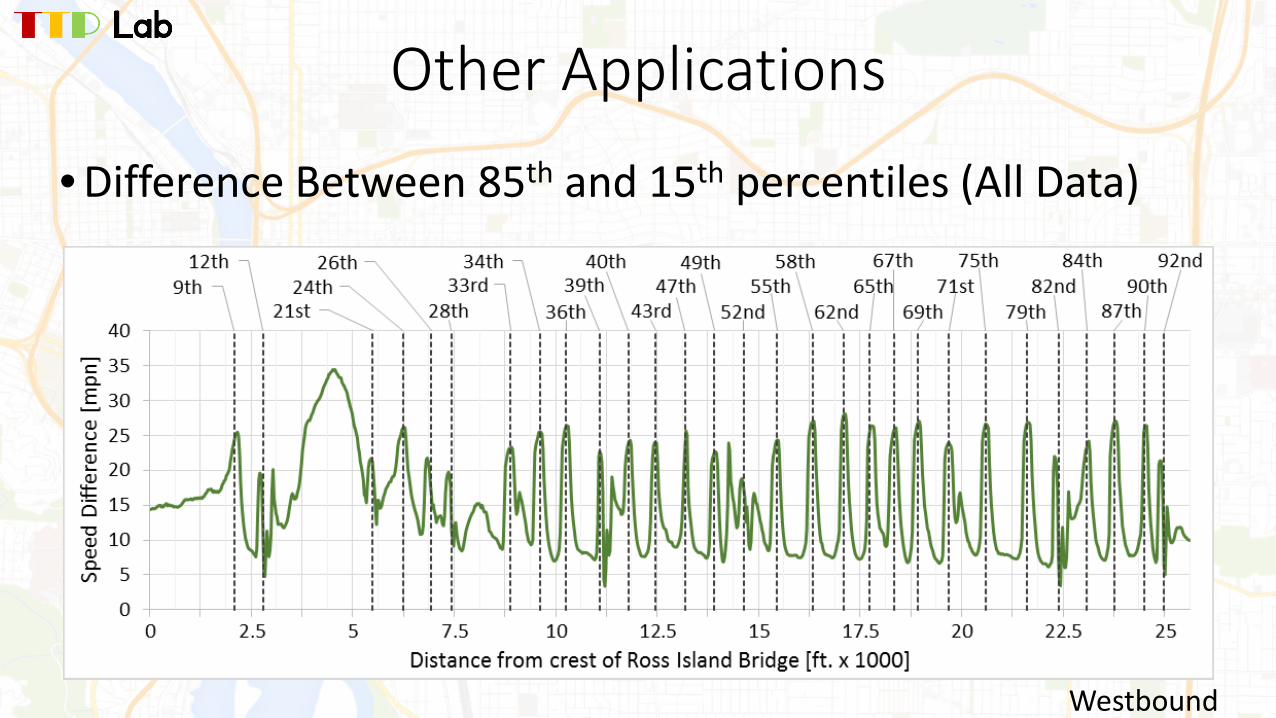
Other Applications
• Difference Between 85th and 15th percentiles (All Data)
Westbound
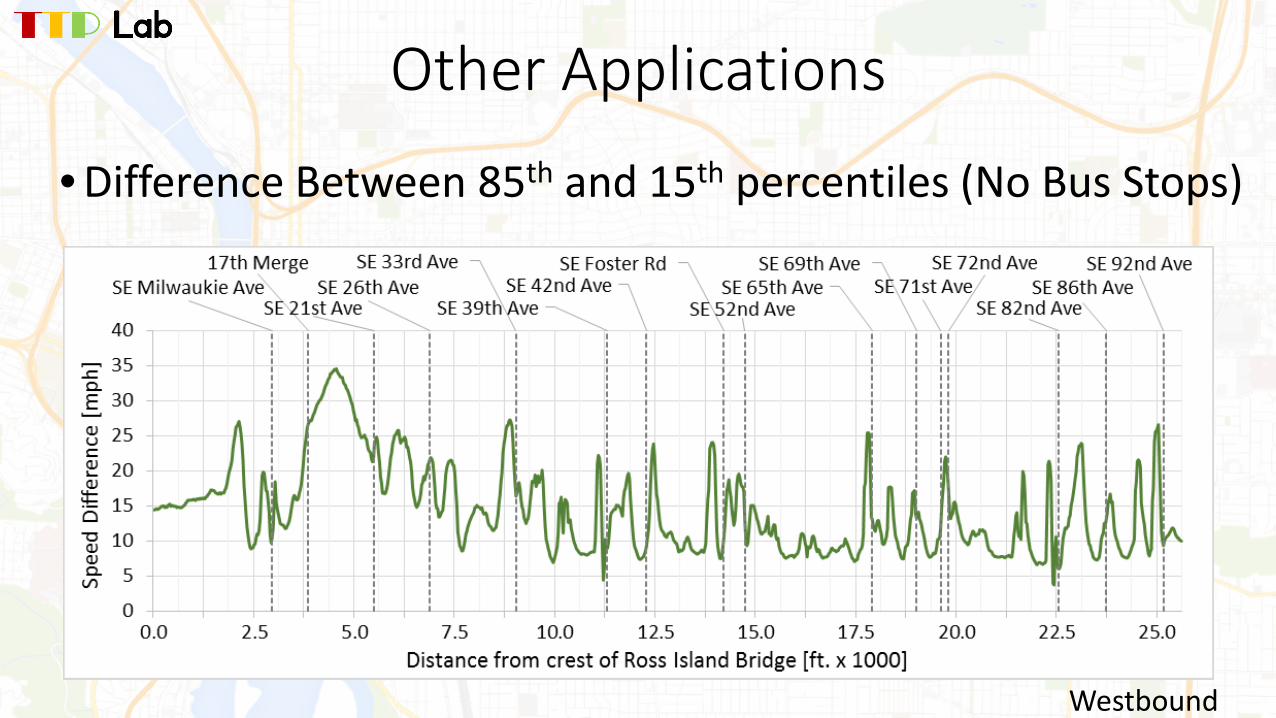
Other Applications
• Difference Between 85th and 15th percentiles (No Bus Stops)
Westbound
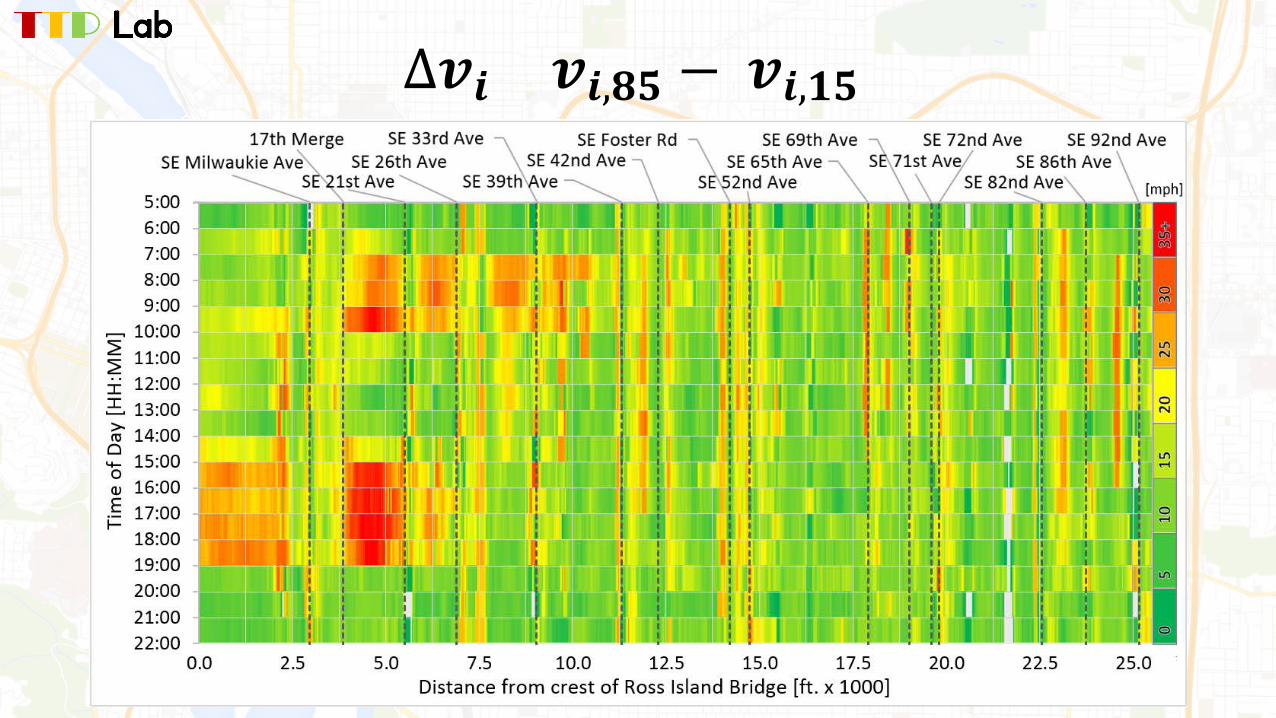
∆𝒗𝒗𝒊𝒊= 𝒗𝒗𝒊𝒊,𝟖𝟖𝟖𝟖 − 𝒗𝒗𝒊𝒊,𝟏𝟏𝟖𝟖
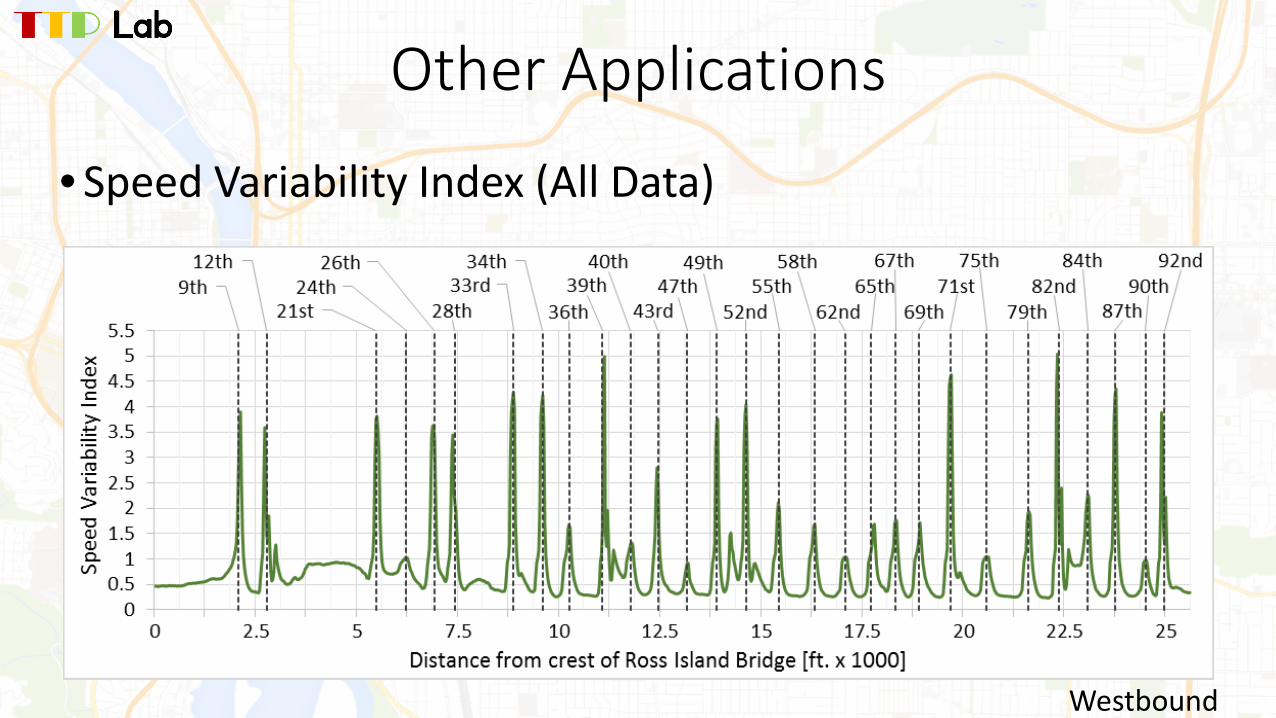
Other Applications
• Speed Variability Index (All Data)
Westbound
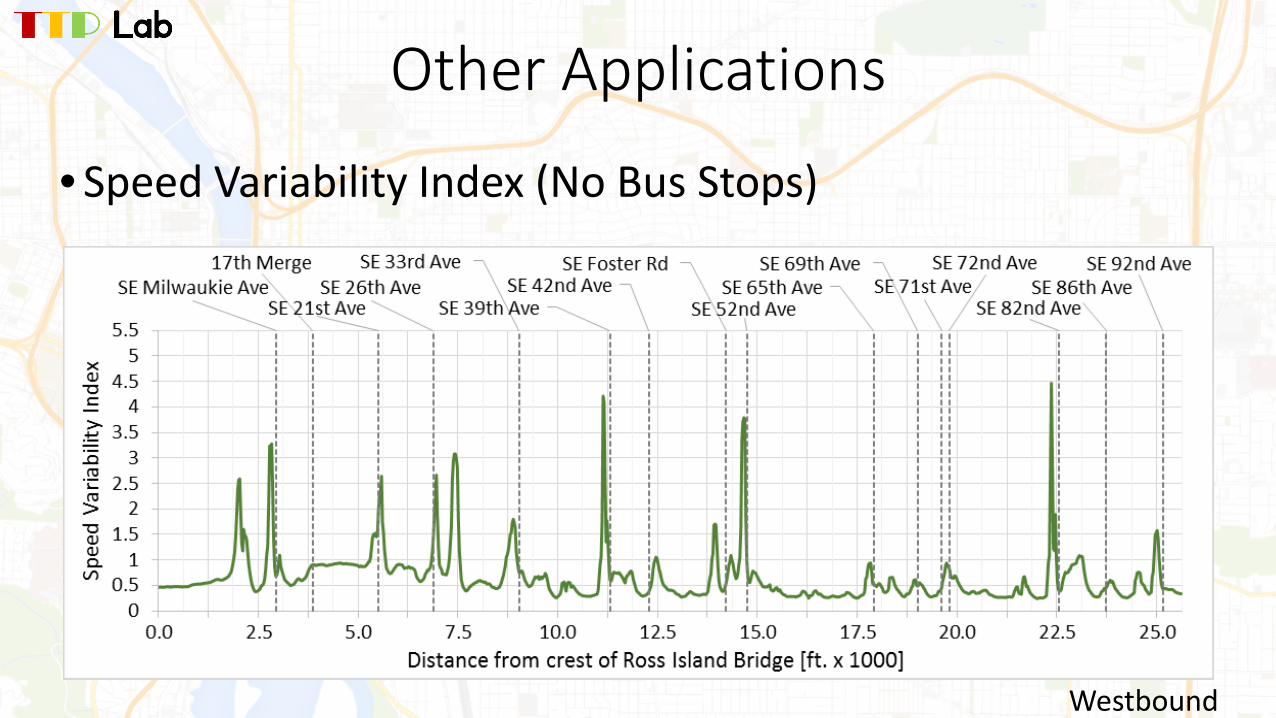
Other Applications
• Speed Variability Index (No Bus Stops)
Westbound
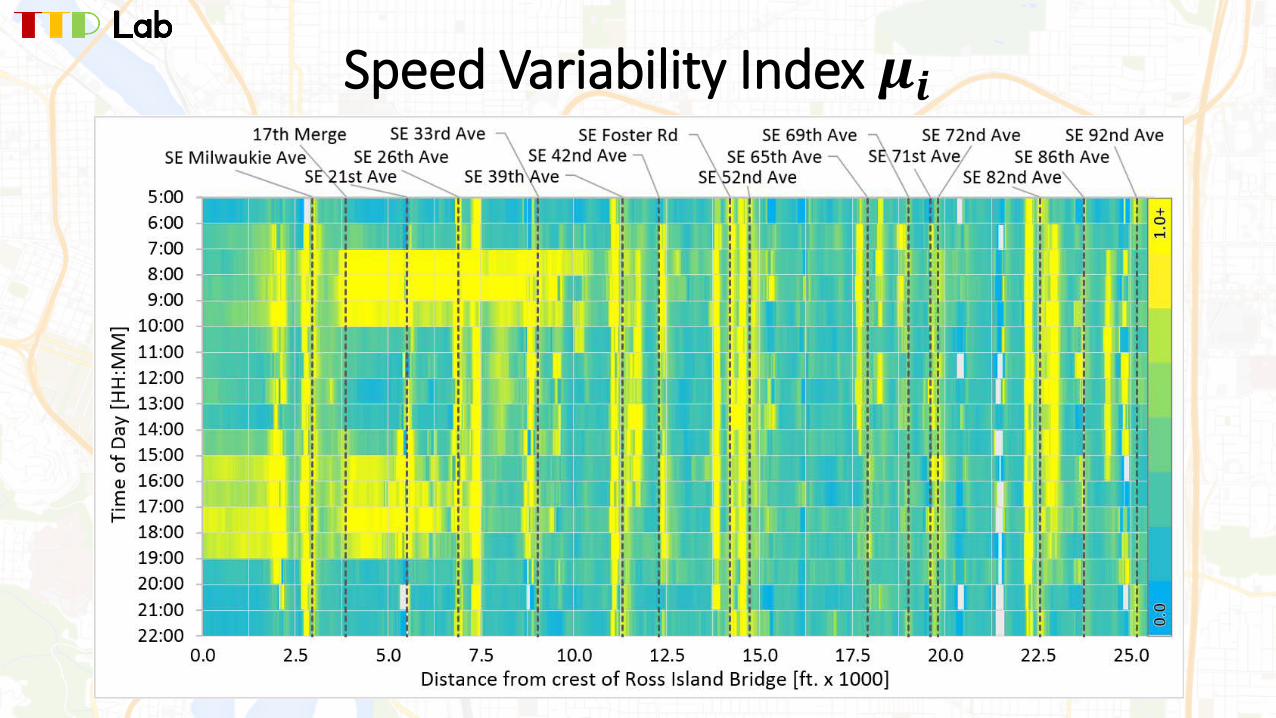
Speed Variability Index 𝝁𝝁𝒊𝒊
Conclusions
• High Resolution Data can be used:• To estimate travel-speed percentiles and associated confidence
intervals• For Time-Space-Speed Plots• To Identify Congestion Hotspots
• Can provide insights into• Travel Time Variability• The best locations for infrastructure Improvements
Acknowledgements
NITC for funding this Research
Steve Callas and Miles Crumley of TriMet for providing the data and definitions used in analysis
And to the researchers who lay the groundwork for this analysis.

Thank you for listening.
Any Questions?