estimating green jobs in bangladesh - cbdestimating green jobs in bangladesh 1 summary the purpose...
TRANSCRIPT
Estimating green jobs in Bangladesh
A GHK report for the ILO
June 2010

This page is intentionally blank
Estimating green jobs in Bangladesh
A report prepared by GHK for the
International Labour Organisation
June 2010
526 Fulham Road, London SW6 5NR
Tel: 020 7471 8000; Fax: 020 7736 0784
www.ghkint.com
Estimating green jobs in Bangladesh
30257263
Document Control
Document Estimating green jobs in Bangladesh
Job No. 30257263
Prepared by Adarsh Varma
Checked by Andrew Jarvis
Date 1 June 2010
Estimating green jobs in Bangladesh
CONTENTS
EXECUTIVE SUMMARY ........................................................................................................................ 1
1 INTRODUCTION ............................................................................................................................. 5
2 THE STRUCTURE OF EMPLOYMENT IN BANGLADESH ......................................................... 10
3 ENVIRONMENT-RELATED EMPLOYMENT ............................................................................... 14
4 ‘CORE’ ENVIRONMENT-RELATED AND GREEN EMPLOYMENT ............................................ 19
5 THE INDIRECT EMPLOYMENT ASSOCIATED WITH ‘CORE’ ENVIRONMENT-RELATED AND/OR GREEN ECONOMIC ACTIVITIES ................................................................................. 51
6 POSSIBLE FUTURES FOR THE GREEN ECONOMY – IMPACTS & ISSUES UNDER THE ‘WHAT IF?’ SCENARIOS .............................................................................................................. 63
7 CONCLUDING DISCUSSION ....................................................................................................... 71
ANNEXES ............................................................................................................................................. 75
A1 DETAILED BREAKDOWN OF CORE ENVIRONMENT-RELATED JOBS AND/OR GREEN JOBS ......................................................................................................................................... 75
A2 CONSULTATION EXERCISE ................................................................................................... 77
A3 INPUT-OUTPUT MODELLING ................................................................................................. 81
A4 SAMPLE QUESTIONNAIRE ..................................................................................................... 87
A5 REFERENCES .......................................................................................................................... 94
Estimating green jobs in Bangladesh
Abbreviations and glossary
Abbreviations
BCCSAP Bangladesh Climate Change Strategy and Action Plan
BIDS Bangladesh Institute of Development Studies
CFLs Compact fluorescent lamps
CRS Creditor Reporting System
FSC Forest Stewardship Council
GHG greenhouse gas
GTZ German International Development Cooperation
IDCOL Infrastructure Development Company Limited
ILO International Labour Organisation
IO Input-output
LFS Labour Force Survey
NAPA National Adaptation Programmes of Action
ODA Official Development Assistance
PEFC Programme for Endorsement of Forest Certification
PRSP Poverty Reduction Strategy Paper
SMA Statistical Metropolitan Area
UNEP United Nations Environment Programme
UNFCCC United Nations Framework Convention on Climate Change
Currencies have been converted at the rate US$1 = 69.893 Tk.
Estimating green jobs in Bangladesh
1
SUMMARY
The purpose of, and background to, this report
This is a report of a study estimating the scale and distribution of green employment in the economy of Bangladesh. It contributes to the ongoing work of the ‘Green Jobs Initiative’1 which is run jointly by the United Nations Environment Programme (UNEP), the International Labour Organization (ILO), the International Employers Organization (IOE) and the International Trade Union Confederation (ITUC). The initiative was launched to assess, analyze and promote the creation of ‘decent’ jobs as a consequence of environmental policies. It supports a concerted effort by governments, employers and trade unions to promote environment sustainable jobs and development in a climate-challenged world.
For the ILO, green jobs are emblematic of the transformation of economies, enterprises, workplaces and labour markets into components of a sustainable, low-carbon economy providing decent work. But most of the literature on green jobs is concentrated in OECD countries. Research on green jobs in developing countries is scant.
This study represents a small step towards reversing that imbalance. It has estimated, within the constraints of available data, environment-related employment in Bangladesh, the employment sustained by more environmentally friendly activities (described as ‘core environment-related employment in the report) and, within those areas, the number of decent jobs that thereby warrant the badge of a ‘green job’ under the UNEP/ILO definition of the term.
The economic activities ultimately identified through the research process are not necessarily same as those that emerge when similar exercises are conducted in OECD countries. This reflects, in part,
(i) structural differences between the economies of developing countries2 and developed countries3. The ‘standard’ sectors (environmental technologies, waste management, water supply and wastewater treatment, energy, etc.) figure prominently in the analysis, as they would in an equivalent OECD study but in a developing economy context other sectors may be at least as important, particularly (i) agriculture, forestry and fisheries; and (ii) activities relating to adaptation to climate change.
(ii) differences in environmental and working standards, including those that define ‘quality’ of job. For example, a high share (88%) of jobs in Bangladesh are in the informal sector. Excluding informal employment leads to a very low estimate of green jobs. The gap between employment in environmentally sustainable activities and the number of green jobs defines the size of the challenge involved in upgrading jobs that do not yet meet decent work criteria.
1 www.ilo.org/integration/themes/greenjobs/lang--fr/index.htm 2 e.g. Bangladesh – share of agriculture and other primary sectors in the economy is very high 3 e.g. OECD countries – high share of services, comparatively small primary sector .
Estimating green jobs in Bangladesh
2
Overview of the method
The work concentrated on the following sectors and activities: agriculture, sustainable forestry, green transport, manufacturing, waste management and recycling, and climate change adaptation. The job estimates and analysis of conditions of decent work in this study are based on a literature review and interviews with key experts in Bangladesh. The interviews were helpful in providing information on the quality of jobs, though they were often far from conclusive. In the absence of reliable estimates, general sector-based indicators for decent work were used, where available, to analyse the quality of jobs. Most green jobs are created by transforming existing jobs or substituting to greener activities within the same sector.
The indirect effects have been estimated using the most recent input-output table for Bangladesh, which was modified for the purposes of this report in order to separately identify the principal activities that have emerged from the screening for environmental sustainability.
Findings
The study identified nearly 3.5 million core environment-related jobs in Bangladesh. 800,000 of these jobs can be considered green as they meet decent work standards. Core environment-related jobs and green jobs account for nearly 7% and 2% respectively of total jobs (49.5 million) in the economy. Another 4 million jobs are indirectly supported as a result of these core environment-related and green jobs.
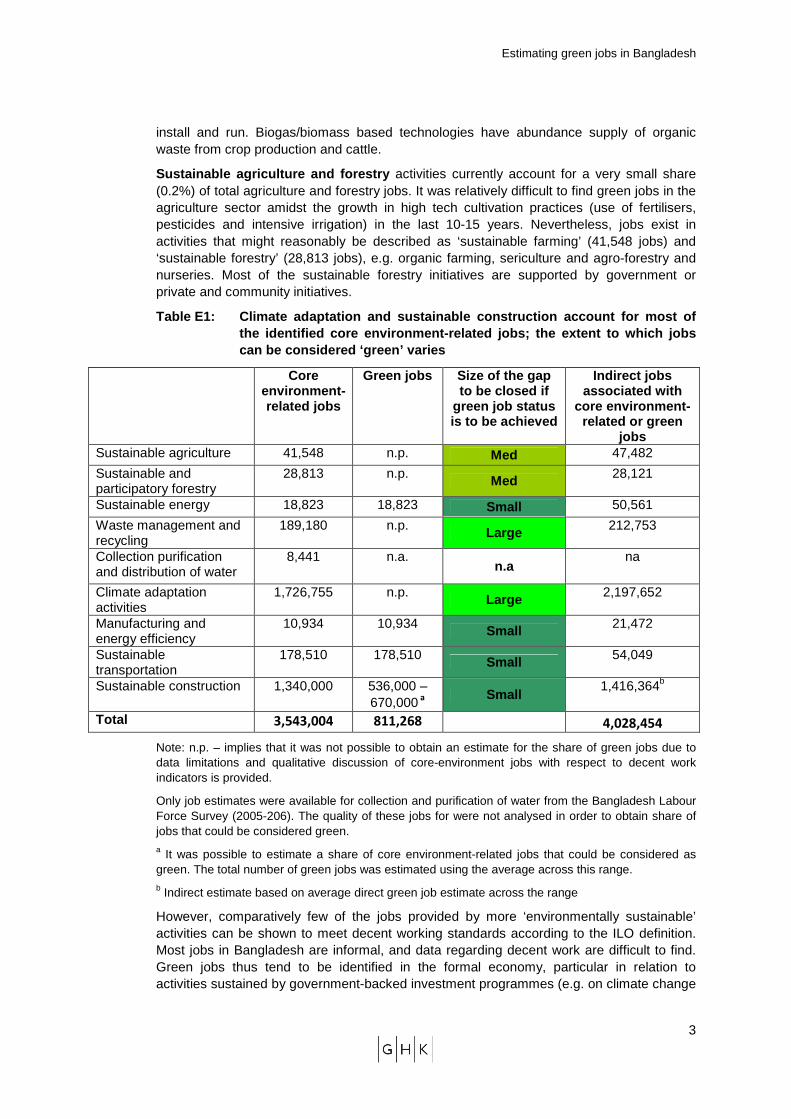
Climate adaptation activities (62%) and sustainable construction (21%) account for most of the identified environment-related jobs (see Table E1). On average nearly US$2 billion is spent on adaptation activities each year. These investments support around 1.7 million jobs across key sectors such as agriculture, water, construction and public administration. Adaptation jobs are created in physical adaptive measures - flood protection, cyclone shelters and water efficient irrigation - and ‘soft’ measures, such as early warning systems for natural hazards and better guidelines, education and communication.
On the basis of a national survey, which suggested that 66% of all construction and infrastructure companies incorporate green building criteria in their business activities, it is estimated that in 2006-2007 one million workers were engaged in construction businesses that adopt or at least consider green job requirements in terms of choice of technology and construction materials. However, only 40%-50% of these jobs comply with national occupational health and safety standards, which mean that only around 536,000 to 670,000 construction jobs can be considered green.
The majority of jobs in ‘sustainable’ transport (178,510 jobs) have been created as a result of a policy drive to convert vehicles to run on compressed natural gas (CNG). In 2008, there were around 250 CNG filling stations and 121 conversion centres.
Jobs related to ‘sustainable’ manufacturing in Bangladesh exist in energy efficient brick kiln manufacturing (7,448 jobs) and in industries linked to the World Bank ‘Clean air and sustainable environment project’ (3,340 jobs).
A number of interviewees suggested that core environment-related jobs in waste management and recycling and sustainable energy though currently small, are growing at a very high rate. Composting urban waste and plastic waste recycling account for the majority of waste management and recycling jobs (90,000 jobs and 68,000 jobs respectively). Waste management and recycling activities in Bangladesh are promoting the concept of the ‘3Rs’ (reduce, reuse and recycle) and working to improve current hazardous and unsustainable waste management practices. On the energy side, solar PV and biogas/biomass are creating new jobs opportunities in rural parts of Bangladesh. These renewable technologies are well suited to rural party of the country as they are cheap to
Estimating green jobs in Bangladesh
3
install and run. Biogas/biomass based technologies have abundance supply of organic waste from crop production and cattle.
Sustainable agriculture and forestry activities currently account for a very small share (0.2%) of total agriculture and forestry jobs. It was relatively difficult to find green jobs in the agriculture sector amidst the growth in high tech cultivation practices (use of fertilisers, pesticides and intensive irrigation) in the last 10-15 years. Nevertheless, jobs exist in activities that might reasonably be described as ‘sustainable farming’ (41,548 jobs) and ‘sustainable forestry’ (28,813 jobs), e.g. organic farming, sericulture and agro-forestry and nurseries. Most of the sustainable forestry initiatives are supported by government or private and community initiatives.
Table E1: Climate adaptation and sustainable constr uction account for most of the identified core environment-related jobs; the e xtent to which jobs can be considered ‘green’ varies
Core environment-related jobs
Green jobs Size of the gap to be closed if
green job status is to be achieved
Indirect jobs associated with
core environment-related or green
jobs Sustainable agriculture 41,548 n.p. Med 47,482
Sustainable and participatory forestry
28,813 n.p. Med 28,121
Sustainable energy 18,823 18,823 Small 50,561
Waste management and recycling
189,180 n.p. Large 212,753
Collection purification and distribution of water
8,441 n.a. n.a
na
Climate adaptation activities
1,726,755 n.p. Large 2,197,652
Manufacturing and energy efficiency
10,934 10,934 Small 21,472
Sustainable transportation
178,510 178,510 Small 54,049
Sustainable construction 1,340,000 536,000 – 670,000 a
Small 1,416,364b
Total 3,543,004 811,268 4,028,454
Note: n.p. – implies that it was not possible to obtain an estimate for the share of green jobs due to data limitations and qualitative discussion of core-environment jobs with respect to decent work indicators is provided.
Only job estimates were available for collection and purification of water from the Bangladesh Labour Force Survey (2005-206). The quality of these jobs for were not analysed in order to obtain share of jobs that could be considered green. a It was possible to estimate a share of core environment-related jobs that could be considered as green. The total number of green jobs was estimated using the average across this range. b Indirect estimate based on average direct green job estimate across the range
However, comparatively few of the jobs provided by more ‘environmentally sustainable’ activities can be shown to meet decent working standards according to the ILO definition. Most jobs in Bangladesh are informal, and data regarding decent work are difficult to find. Green jobs thus tend to be identified in the formal economy, particular in relation to activities sustained by government-backed investment programmes (e.g. on climate change
Estimating green jobs in Bangladesh
4
adaptation). To some extent, a mapping of green jobs done on this basis becomes a directory of employment in environment-related public works programmes.
Despite this there is enough information on some sectors to inform discussions about ‘shades of green’ and the size or nature of the gap that needs to be closed if the jobs are to provide decent employment as well as environmental sustainability. But for other sub-sectors the information available for screening core environment-related jobs was not detailed enough to determine the size and nature for that gap. The shading in Table E1, which is based on the various decent work indicators, qualitatively indicates the gap between core environment-related jobs and green jobs. Darker shades imply the gap is smaller or does not exist. In other words, darker shades indicate that less policy intervention is required to upgrade core environment-related jobs to green jobs. For some sub-sectors, such as sustainable energy and transport, the decent work indicators suggested that that all core-environment jobs can be considered as green jobs.
The exploration of ‘what if’ scenarios with the modified input-output model has suggested that there are opportunities, in principle, to green sector without significant loss of employment from the economy. In some areas higher productivity of sustainable activities might suggest a loss of employment from like-for-like shift of demand to such products. But these results needed to be caveated with large cautions about the limitations of input-put analysis in this context, and with the fact that a number of the sustainable activities are comparatively small scale now, and could not credibly be scaled up to (for instance) 10% of demand without supply or demand parameters changing.
This study is intended to prompt further research and analysis, not to be ‘the final word’. There are many gaps to be filled and areas of analysis and methodological approach to be strengthened. But it is a start and reveals useful information about the state of green economy in Bangladesh and about the challenges of researching green jobs in a developing country environment.
Estimating green jobs in Bangladesh
5
1 INTRODUCTION
1.1 Purpose of this study
This is the final report of a study commissioned by the International Labour Organisation (ILO) from GHK4. The purpose of the study was to develop a qualitative and quantitative assessment of green jobs in Bangladesh. The findings will contribute to the ILO Green Jobs Initiative and to discussions under the G20 umbrella.
This final report presents the findings of the study. It provides the results of a research exercise that looking at method of approach to examining the structure of employment sustained by ‘green growth’ in a developing country context and the practical issue involved in measuring the location, quantity and quality of those jobs. It documents the results obtained for Bangladesh and discusses some of the process lessons that might be useful for future country case studies.
In summary the main purpose of this study was to provide in the Bangladeshi context:
� A quantitative estimate of total environment-related employment (chapter 3);
� A quantitative estimate of the number of ‘core’ environment-related jobs sustained by economic activities that directly or indirectly improve the environmental sustainability of the economy accorded to defined criteria or performance thresholds (chapter 4);
� A map of the ‘quality’ of that core environment-related employment by reference to agreed conditions of decent work and, where data permit, a quantitative estimate of green jobs that satisfy both environmental criteria and decent work criteria according to the ILO/UNEP definition (chapter 4);
� Quantitative estimates of indirect/induced jobs sustained by these core environmental sectors and the ‘green’ activities, generated via development of a set of new input-out coefficients and modification of national input-output tables (chapter 5); and
� A modelling tool that can aid policy-making by showing the employment impacts of alternative ‘What if?’ scenarios and strategies, including identifying potential winning and losing sectors (chapter 6).
1.2 Method
The method by which the results presented here were produced is set out in more detail in the accompanying document, “Exploring the links between the environment, economy and employment in developing countries: A practitioner’s guide”5, produced by GHK for the ILO in parallel with this Bangladesh country study. While this Bangladesh paper is intended to be a free-standing report, the reader in search of a complete picture of the process and choices made is advised to refer to both documents together. In the broader context, the country studies, such as this one, should be seen as companions to the guide. The text that follows provides a ‘high level’ overview.
4 For details on GHK see www.gkhint.com 5 Hereinafter referred to as ‘the Practitioner’s Guide’
Estimating green jobs in Bangladesh
6
1.2.1 Important definitions
Green jobs
The green jobs concept used in this study follows that adopted by the ILO and UNEP (see box) and is notable for having social as well as environmental aspects. Green jobs provide ‘decent work’ (as described by the ILO) as well as contributing directly or indirectly to lower environmental impacts.
UNEP/ILO concept of green jobs
Green jobs can be generically defined as the direct employment created in different sectors of the economy and through related activities, which reduce the environmental impact of those sectors and activities, and ultimately brings it down to sustainable levels. This includes ‘decent’ jobs that help to reduce consumption of energy and raw materials, de-carbonize the economy, protect and restore ecosystem services like clean water, flood protection and biodiversity and minimize the production of waste and pollution
Core environment-related employment
The Practitioner’s Guide discusses the idea of ‘core environment-related employment’. This refers to jobs which are sustained by activities that are more environmentally sustainable (as defined by compliance with relevant standards and other performance indicators in the study process) but which have not been ‘filtered’ for decency of work.
In developing countries many jobs are sustained in the informal economy. It is often difficult for the researcher to determine the quality of jobs because of lack of robust data. The number of ‘green jobs’ as assessed by a strict interpretation of the UNEP/ILO definition may therefore be small. Information on the scale and distribution of core environment-related employment can, however, give policy-makers useful information about the ‘greening’ (in the broad sense) of the national economy, where there is scope for further growth and what measures might help provide more ‘decent work’ in those economic activities.
1.2.2 An outline of the research process
The sequence of tasks involved in the research and analysis undertaken is shown in Figure 1.1. The approach recognises that the economic and employment impact of green growth is not confined to a select few jobs but rather affects the whole economy (though impacts may vary in scale and direction of change across and within individual sectors).
As illustrated in Figure 1.2, the research method involves a step-by-step process of ‘zooming in’ on the green economy. In this process there are several stages at which choices must be made about where boundaries are to be drawn (e.g. ‘How green does an activity have to be to be of interest?’). The Practitioner’s Guide recognises that, while guidance can be given, there are areas of subjective judgement and what ‘fits’ for one country may not be appropriate to another. A key underlying principle is that the interpretations and boundaries adopted are broadly accepted as reasonable by the ‘consumers’ of each country study, whether policy-makers or researchers. The pages that follow explain the choices made in the context of this study on Bangladesh.
Estimating green jobs in Bangladesh
7
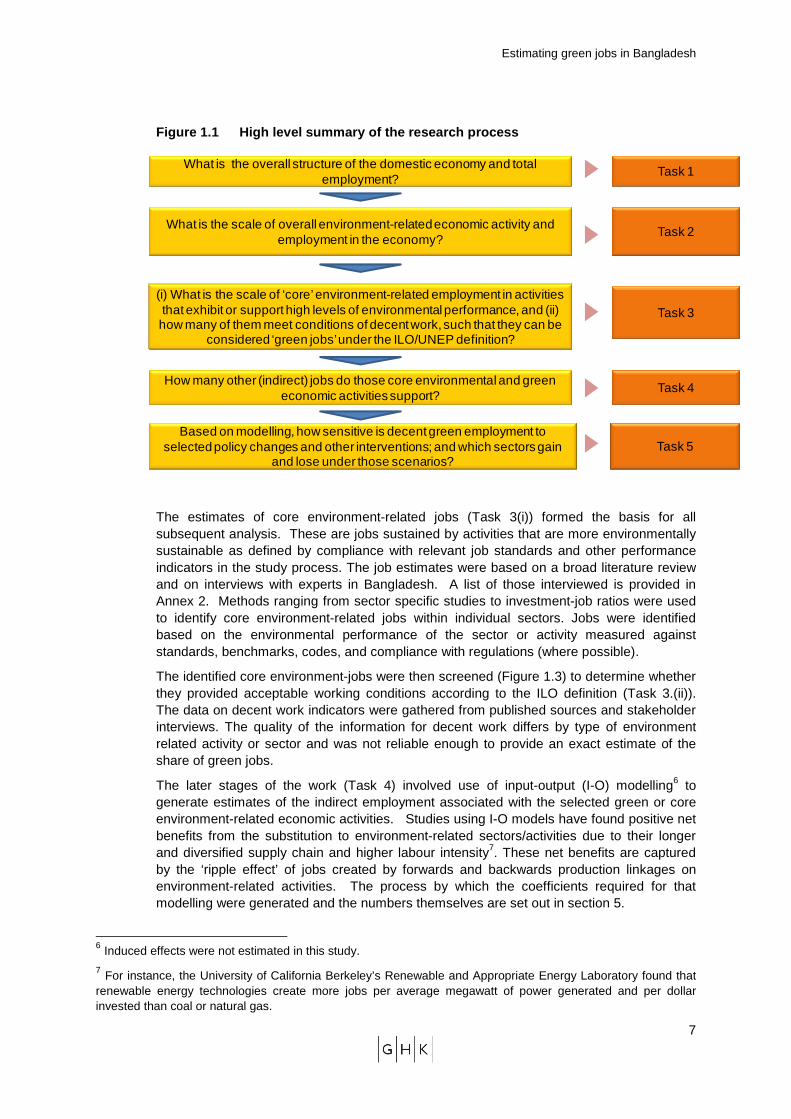
Figure 1.1 High level summary of the research proce ss
What is the overall structure of the domestic economy and total employment?
Task 1
What is the scale of overall environment-related economic activity and employment in the economy?
Task 2
(i) What is the scale of ‘core’ environment-related employment in activities that exhibit or support high levels of environmental performance, and (ii) how many of them meet conditions of decent work, such that they can be
considered ‘green jobs’ under the ILO/UNEP definition?
Task 3
How many other (indirect) jobs do those core environmental and green economic activities support?
Task 4
Based on modelling, how sensitive is decent green employment to selected policy changes and other interventions; and which sectors gain
and lose under those scenarios?Task 5
The estimates of core environment-related jobs (Task 3(i)) formed the basis for all subsequent analysis. These are jobs sustained by activities that are more environmentally sustainable as defined by compliance with relevant job standards and other performance indicators in the study process. The job estimates were based on a broad literature review and on interviews with experts in Bangladesh. A list of those interviewed is provided in Annex 2. Methods ranging from sector specific studies to investment-job ratios were used to identify core environment-related jobs within individual sectors. Jobs were identified based on the environmental performance of the sector or activity measured against standards, benchmarks, codes, and compliance with regulations (where possible).
The identified core environment-jobs were then screened (Figure 1.3) to determine whether they provided acceptable working conditions according to the ILO definition (Task 3.(ii)). The data on decent work indicators were gathered from published sources and stakeholder interviews. The quality of the information for decent work differs by type of environment related activity or sector and was not reliable enough to provide an exact estimate of the share of green jobs.
The later stages of the work (Task 4) involved use of input-output (I-O) modelling6 to generate estimates of the indirect employment associated with the selected green or core environment-related economic activities. Studies using I-O models have found positive net benefits from the substitution to environment-related sectors/activities due to their longer and diversified supply chain and higher labour intensity7. These net benefits are captured by the ‘ripple effect’ of jobs created by forwards and backwards production linkages on environment-related activities. The process by which the coefficients required for that modelling were generated and the numbers themselves are set out in section 5.
6 Induced effects were not estimated in this study. 7 For instance, the University of California Berkeley’s Renewable and Appropriate Energy Laboratory found that renewable energy technologies create more jobs per average megawatt of power generated and per dollar invested than coal or natural gas.
Estimating green jobs in Bangladesh
8
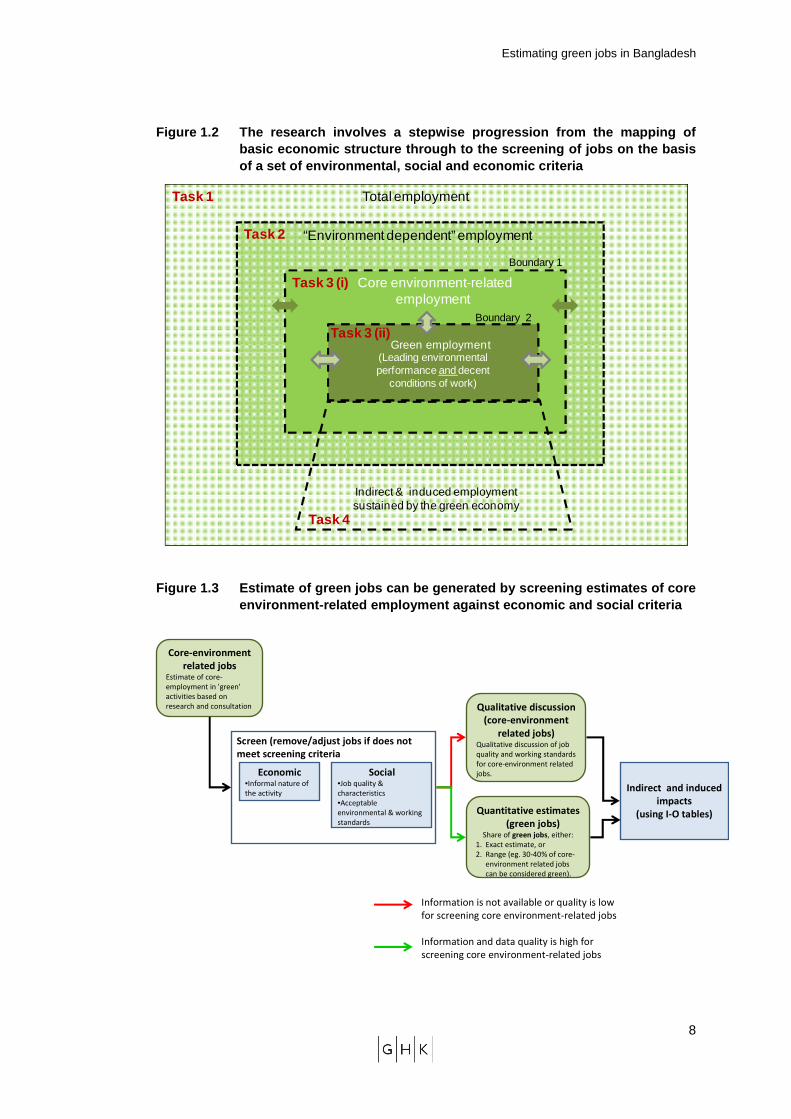
Figure 1.2 The research involves a stepwise progres sion from the mapping of basic economic structure through to the screening o f jobs on the basis of a set of environmental, social and economic crit eria
Green employment(Leading environmental performance and decent
conditions of work)
“Environment dependent” employment
Total employmentTask 1
Task 2
Task 3 (i)
Boundary 1
Boundary 2
Task 4
Indirect & induced employment sustained by the green economy
Task 3 (ii)
Core environment-relatedemployment
Figure 1.3 Estimate of green jobs can be generated by screening estimates of core environment-related employment against economic and social criteria
Economic•Informal nature of
the activity
Social•Job quality &
characteristics
•Acceptable
environmental & working
standards
Core-environment
related jobsEstimate of core-
employment in 'green'
activities based on
research and consultation
Indirect and induced
impacts
(using I-O tables)
Screen (remove/adjust jobs if does not
meet screening criteria
Qualitative discussion
(core-environment
related jobs)Qualitative discussion of job
quality and working standards
for core-environment related
jobs.
Quantitative estimates
(green jobs) Share of green jobs, either:
1. Exact estimate, or
2. Range (eg. 30-40% of core-
environment related jobs
can be considered green).
Information is not available or quality is low
for screening core environment-related jobs
Information and data quality is high for
screening core environment-related jobs
Estimating green jobs in Bangladesh
9
1.3 Structure of the report
This report is structured as follows:
� Chapter 2 provides a brief overview of the structure and growth of the Bangladeshi economy. It gives particular attention to the informal economy, which is significant in terms of both GDP share and total jobs (the formal/informal nature of work typically has important implications for job quality);
� Chapter 3 provides short summaries of environment-related employment in the country, by principal sector (activity relating to Task 2 from the method above);
� Chapter 4 is significantly longer, and provides the results of the search for core environment-related employment, and information used in the determination of whether such jobs can be considered ‘green’ under the UNEP/ILO definition (Task 3);
� Chapter 5 reports on the input-output modelling and gives estimates of the indirect employment sustained by the core environment-related economic activities identified (Task 4);
� Chapter 6 explains the content of the ‘what if’ scenarios tested and results that emerged (Task 5).
� Chapter 7 with a discussion of the main messages and issues arising.
The annexes provide detail on:
� Summary of results (Annex 1);
� Consultation exercise (Annex 2);
� Input-Output modelling (Annex 3);
� Sample questionnaire (Annex 4);
� References (Annex 5).
Estimating green jobs in Bangladesh
10
2 THE STRUCTURE OF EMPLOYMENT IN BANGLADESH
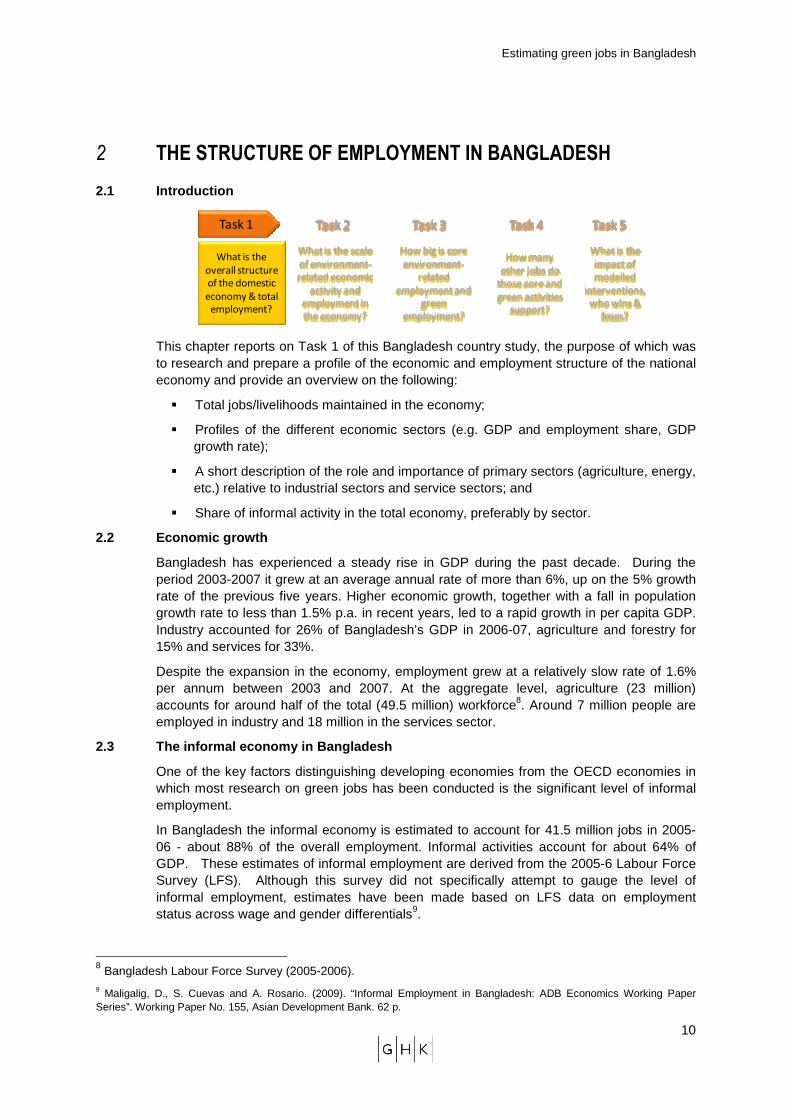
2.1 Introduction
What is the
overall structure
of the domestic
economy & total
employment?
Task 1
What is the scale
of environment-
related economic
activity and
employment in
the economy?
Task 2
How big is core
environment-
related
employment and
green
employment?
Task 3
How many
other jobs do
those core and
green activities
support?
Task 4
What is the
impact of
modelled
interventions,
who wins &
loses?
Task 5
This chapter reports on Task 1 of this Bangladesh country study, the purpose of which was to research and prepare a profile of the economic and employment structure of the national economy and provide an overview on the following:
� Total jobs/livelihoods maintained in the economy;
� Profiles of the different economic sectors (e.g. GDP and employment share, GDP growth rate);
� A short description of the role and importance of primary sectors (agriculture, energy, etc.) relative to industrial sectors and service sectors; and
� Share of informal activity in the total economy, preferably by sector.
2.2 Economic growth
Bangladesh has experienced a steady rise in GDP during the past decade. During the period 2003-2007 it grew at an average annual rate of more than 6%, up on the 5% growth rate of the previous five years. Higher economic growth, together with a fall in population growth rate to less than 1.5% p.a. in recent years, led to a rapid growth in per capita GDP. Industry accounted for 26% of Bangladesh’s GDP in 2006-07, agriculture and forestry for 15% and services for 33%.
Despite the expansion in the economy, employment grew at a relatively slow rate of 1.6% per annum between 2003 and 2007. At the aggregate level, agriculture (23 million) accounts for around half of the total (49.5 million) workforce8. Around 7 million people are employed in industry and 18 million in the services sector.
2.3 The informal economy in Bangladesh
One of the key factors distinguishing developing economies from the OECD economies in which most research on green jobs has been conducted is the significant level of informal employment.
In Bangladesh the informal economy is estimated to account for 41.5 million jobs in 2005-06 - about 88% of the overall employment. Informal activities account for about 64% of GDP. These estimates of informal employment are derived from the 2005-6 Labour Force Survey (LFS). Although this survey did not specifically attempt to gauge the level of informal employment, estimates have been made based on LFS data on employment status across wage and gender differentials9.
8 Bangladesh Labour Force Survey (2005-2006). 9 Maligalig, D., S. Cuevas and A. Rosario. (2009). “Informal Employment in Bangladesh: ADB Economics Working Paper Series”. Working Paper No. 155, Asian Development Bank. 62 p.
Estimating green jobs in Bangladesh
11
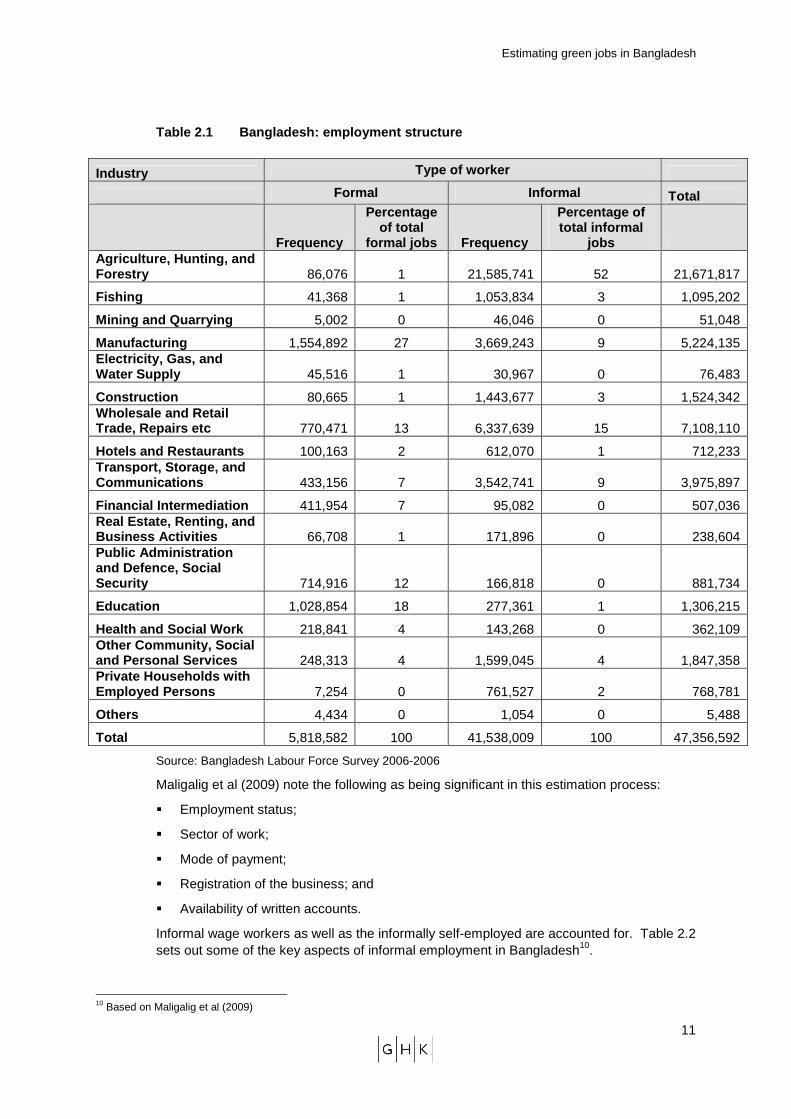
Table 2.1 Bangladesh: employment structure
Source: Bangladesh Labour Force Survey 2006-2006
Maligalig et al (2009) note the following as being significant in this estimation process:
� Employment status;
� Sector of work;
� Mode of payment;
� Registration of the business; and
� Availability of written accounts.
Informal wage workers as well as the informally self-employed are accounted for. Table 2.2 sets out some of the key aspects of informal employment in Bangladesh10.
10 Based on Maligalig et al (2009)
Industry Type of worker
Formal Informal Total
Frequency
Percentage of total
formal jobs Frequency
Percentage of total informal
jobs Agriculture, Hunting, and Forestry 86,076 1 21,585,741 52 21,671,817
Fishing 41,368 1 1,053,834 3 1,095,202
Mining and Quarrying 5,002 0 46,046 0 51,048
Manufacturing 1,554,892 27 3,669,243 9 5,224,135 Electricity, Gas, and Water Supply 45,516 1 30,967 0 76,483
Construction 80,665 1 1,443,677 3 1,524,342 Wholesale and Retai l Trade, Repairs etc 770,471 13 6,337,639 15 7,108,110
Hotels and Restaurants 100,163 2 612,070 1 712,233 Transport, Storage, and Communications 433,156 7 3,542,741 9 3,975,897
Financial Intermediation 411,954 7 95,082 0 507,036 Real Estate, Renting, a nd Business Activities 66,708 1 171,896 0 238,604 Public Administration and Defence, Social Security 714,916 12 166,818 0 881,734
Education 1,028,854 18 277,361 1 1,306,215
Health and Social Work 218,841 4 143,268 0 362,109 Other Community, Social and Personal Services 248,313 4 1,599,045 4 1,847,358 Private Households with Employed Persons 7,254 0 761,527 2 768,781
Others 4,434 0 1,054 0 5,488
Total 5,818,582 100 41,538,009 100 47,356,592
Estimating green jobs in Bangladesh
12
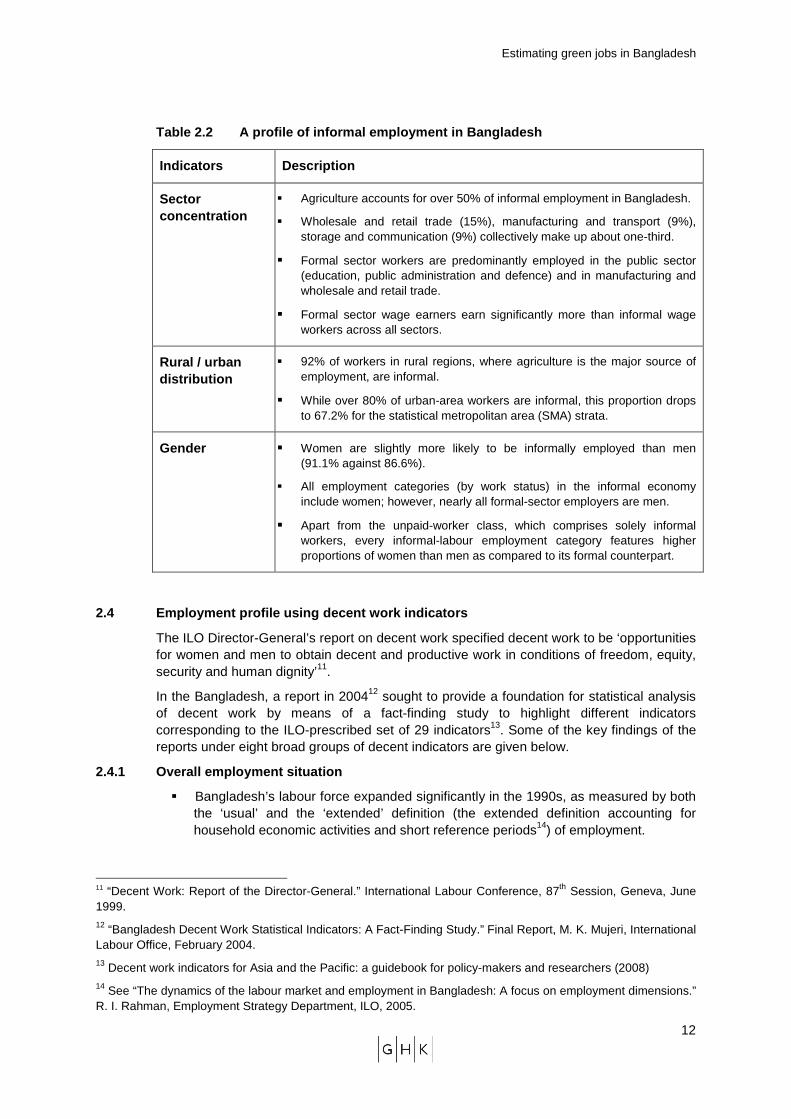
Table 2.2 A profile of informal employment in Bangl adesh
Indicators Description
Sector concentration
� Agriculture accounts for over 50% of informal employment in Bangladesh.
� Wholesale and retail trade (15%), manufacturing and transport (9%), storage and communication (9%) collectively make up about one-third.
� Formal sector workers are predominantly employed in the public sector (education, public administration and defence) and in manufacturing and wholesale and retail trade.
� Formal sector wage earners earn significantly more than informal wage workers across all sectors.
Rural / urban distribution
� 92% of workers in rural regions, where agriculture is the major source of employment, are informal.
� While over 80% of urban-area workers are informal, this proportion drops to 67.2% for the statistical metropolitan area (SMA) strata.
Gender � Women are slightly more likely to be informally employed than men (91.1% against 86.6%).
� All employment categories (by work status) in the informal economy include women; however, nearly all formal-sector employers are men.
� Apart from the unpaid-worker class, which comprises solely informal workers, every informal-labour employment category features higher proportions of women than men as compared to its formal counterpart.
2.4 Employment profile using decent work indicators
The ILO Director-General’s report on decent work specified decent work to be ‘opportunities for women and men to obtain decent and productive work in conditions of freedom, equity, security and human dignity’11.
In the Bangladesh, a report in 200412 sought to provide a foundation for statistical analysis of decent work by means of a fact-finding study to highlight different indicators corresponding to the ILO-prescribed set of 29 indicators13. Some of the key findings of the reports under eight broad groups of decent indicators are given below.
2.4.1 Overall employment situation
� Bangladesh’s labour force expanded significantly in the 1990s, as measured by both the ‘usual’ and the ‘extended’ definition (the extended definition accounting for household economic activities and short reference periods14) of employment.
11 “Decent Work: Report of the Director-General.” International Labour Conference, 87th Session, Geneva, June 1999. 12 “Bangladesh Decent Work Statistical Indicators: A Fact-Finding Study.” Final Report, M. K. Mujeri, International Labour Office, February 2004. 13 Decent work indicators for Asia and the Pacific: a guidebook for policy-makers and researchers (2008) 14 See “The dynamics of the labour market and employment in Bangladesh: A focus on employment dimensions.” R. I. Rahman, Employment Strategy Department, ILO, 2005.
Estimating green jobs in Bangladesh
13
� Urban employment rose more rapidly over the period 1983-2000 compared to rural employment. During which the share of urban employment in overall employment rose from under 14% to almost 23%.
� Women accounted for a quarter of the total work force in 2006. The sectors with the highest share of women are agriculture and health, with 35% respectively. Women in account for 2% of total jobs in the transport sector and 4% in the energy sector.
� If underemployment is taken to be the proportion of persons working fewer than 35 hours per week, almost a fifth of the employed labour force was underemployed in 1999-2000, indicating a considerable increase since 1983-84. Underemployment was proportionately higher among women and in rural areas.
2.4.2 Child labour
Child labour is defined in Bangladesh to be work undertaken by children in the age group of 5-14 years during the survey reference period15.
� The number of working children fell over the 1995-2003 period, from 6.3 million to 5 million.
� Agriculture accounted for almost two-thirds of child labourers in 1995-96 (65.4%), this proportion declined to 56% in 2002-03.
� Average weekly hours of work rose over the 1995-2003 period, but declined for girls.
2.4.3 Wages � On average, in 1999-2000, wages were low in agriculture and mining, and relatively
high in manufacturing and most services sectors.
� Wage rates were found to be highest in the energy sector, presumably owing to the greater requirement of skilled labour in the sector.
� On average, the male-female wage differential was 72%, and was starker in rural areas.
� The overall urban wage rate was also found to be 37% greater than the average rural wage.
� As regards regulation, in the public sector, government-appointed Wage Commissions set wages, while wage levels were determined by minimum-wage law and collective bargaining in the private sector. Public-sector wages often set the trend for private-sector wage levels.
15 Based on the study cited in footnote 3.
Estimating green jobs in Bangladesh
14
3 ENVIRONMENT-RELATED EMPLOYMENT
3.1 Introduction
What is the
overall structure
of the domestic
economy & total
employment?
Task 1
What is the scale
of environment-
related economic
activity and
employment in
the economy?
Task 2
How big is core
environment-
related
employment and
green
employment?
Task 3
How many
other jobs do
those core and
green activities
support?
Task 4
What is the
impact of
modelled
interventions,
who wins &
loses?
Task 5
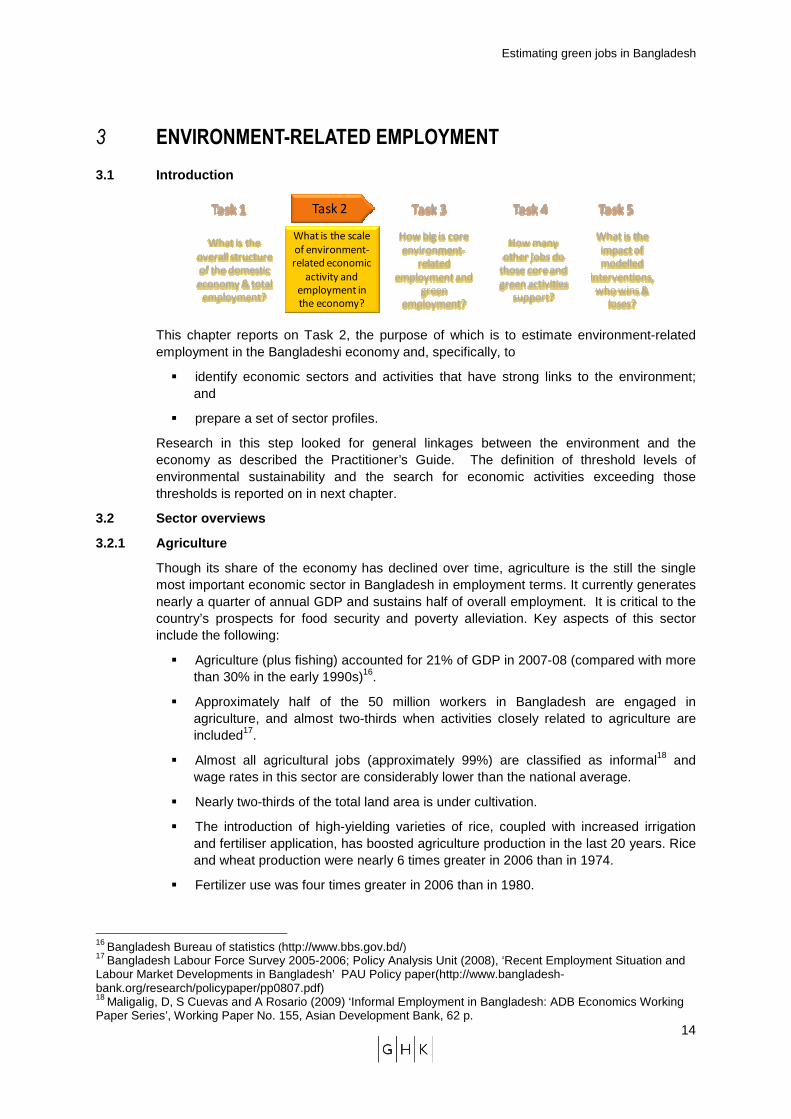
This chapter reports on Task 2, the purpose of which is to estimate environment-related employment in the Bangladeshi economy and, specifically, to
� identify economic sectors and activities that have strong links to the environment; and
� prepare a set of sector profiles.
Research in this step looked for general linkages between the environment and the economy as described the Practitioner’s Guide. The definition of threshold levels of environmental sustainability and the search for economic activities exceeding those thresholds is reported on in next chapter.
3.2 Sector overviews
3.2.1 Agriculture
Though its share of the economy has declined over time, agriculture is the still the single most important economic sector in Bangladesh in employment terms. It currently generates nearly a quarter of annual GDP and sustains half of overall employment. It is critical to the country’s prospects for food security and poverty alleviation. Key aspects of this sector include the following:
� Agriculture (plus fishing) accounted for 21% of GDP in 2007-08 (compared with more than 30% in the early 1990s)16.
� Approximately half of the 50 million workers in Bangladesh are engaged in agriculture, and almost two-thirds when activities closely related to agriculture are included17.
� Almost all agricultural jobs (approximately 99%) are classified as informal18 and wage rates in this sector are considerably lower than the national average.
� Nearly two-thirds of the total land area is under cultivation.
� The introduction of high-yielding varieties of rice, coupled with increased irrigation and fertiliser application, has boosted agriculture production in the last 20 years. Rice and wheat production were nearly 6 times greater in 2006 than in 1974.
� Fertilizer use was four times greater in 2006 than in 1980.
16 Bangladesh Bureau of statistics (http://www.bbs.gov.bd/) 17 Bangladesh Labour Force Survey 2005-2006; Policy Analysis Unit (2008), ‘Recent Employment Situation and Labour Market Developments in Bangladesh’ PAU Policy paper(http://www.bangladesh-bank.org/research/policypaper/pp0807.pdf) 18 Maligalig, D, S Cuevas and A Rosario (2009) ‘Informal Employment in Bangladesh: ADB Economics Working Paper Series’, Working Paper No. 155, Asian Development Bank, 62 p.
Estimating green jobs in Bangladesh
15
� Soil fertility has declined dramatically over time, due to increased cultivation and fertilizer use. The greatest decline – of more than 50% - was observed between 1967 and 1998, roughly beginning at the outset of the Green Revolution in this country.
3.2.2 Forestry
The forestry sector is closely linked to the agriculture sector. It has been identified as an important sector for its capacity for carbon capture. Key facts on forestry in Bangladesh include that:
� It is a major source of energy, timber and wood for furniture. It contributes about 1.7% to the national GDP and accounts for 1% of total jobs.
� Nearly all agriculture and forestry jobs (approximately 99%) are classified as informal19 and wage rates are considerably lower than the national average.
� Only 10% of the country’s total land area is forested but there is a high rate of deforestation. Deforestation contributes to global warming, loss of biodiversity, affects soils and ecosystems, and atmospheric moisture.
3.2.3 Energy
Bangladesh is an energy deprived country. Even by developing country standards per capita energy consumption is very low at about 250 kgoe20, compared to 550 kgoe for India and 430 kgoe for Sri Lanka. The lack of reliable electricity sources has deterred foreign investment and held back economic growth.
� The energy sector contributes around 1% to national GDP and accounts for less than 1% of total jobs.
� Total primary energy consumption in 2008 was 34 Mtoe21 and the energy consumption mix was estimated at: 62% biomass, 25% natural gas, 12% imported oil and 1% combined imported coal and hydroelectric.
� Approximately 80% of electricity is generated from gas, and the remainder from hydroelectric sources. In mid-2008 dependable generating capacity stood at only 4,200 MW, substantially below peak demand of 5,000 MW. Approximately 60% of households have no electricity supply.
� It is impractical and uneconomical to bring the whole country under a grid-based electricity network because Bangladesh sits on a delta with more than 400 rivers. This situation favours micro-generation and renewable energy technologies.
3.2.4 Waste management
Bangladesh is a densely populated country with a growing population and economy. Proper management of commercial and municipal waste is an increasing problem for municipal authorities, which have limited financial capacity and technical know-how. Waste management activities cut across four broad industrial sectors22 and are not considered to be a sector per se. Key aspects regarding the scale of the waste problem and nature of waste management and recycling activities include the following:
19 Maligalig, et. al (2009) Asian Development Bank. 20 kgoe: kilogramme oil equivalent 21 Mtoe: million ton oil equivalent 22 1) manufacturing, 2) trade hotel and restaurant, 3) health, education public administration and defence and 4) community and personal services.
Estimating green jobs in Bangladesh
16
� Average per capita waste has increased by 32% between 1991 and 2005.
� Urban areas in Bangladesh generate 15,000 tonnes of waste a day, nearly 20% of total waste generated. A large portion (almost 50%) of this waste remains uncollected on roads and the rest is collected and disposed of in low lying areas in a hazardous manner (Waste Concern, 2009).
� Most municipal authorities collect, transport and dump waste with few sanitary and environmental considerations. This has led to serious public health problems, contaminated water sources and emissions.
� More than 70% of the total waste is organic23. Organic waste is mainly dumped in an unsustainable manner, landfilled or composted. Inorganic waste is extensively recycled by the informal sector but in an unhygienic and unsafe manner.
3.2.5 Manufacturing
Over the past 20 years the Bangladesh economy has made the transition from aid to trade dependency, but has yet to achieve the necessary investment-led growth that would accelerate its transition to a middle-income economy. Bangladesh has utilised its abundant labour force well in low-cost and labour-intensive manufacturing. Key aspects of the manufacturing sector include the following:
� In 2007, the manufacturing sector accounted for approximately 17% of the country’s GDP and 15% of total employment;
� The textile and garment sector accounts for 40% of manufacturing output. Clothing has become Bangladesh’s most important export item, representing approximately two-thirds of export earnings. In 2006-07 the value of readymade garment exports reached US$ 9.2 billion, accounting for 76% of total export revenue;
� The industrial sector represents approximately 41% of total electricity demand, followed closely by households at 39%24. Motors consume 70% of this electricity, followed distantly by lighting (8%). Electricity consumption is therefore directly linked to polluting activities. Reduced energy consumption through the use of ‘greener’ fuels and renewable energies for electricity generation would also simultaneously decrease pollution levels. Improved energy efficiency in manufacturing processes would contribute to this effect;
� The Bangladeshi manufacturing sector (notably for garments) relies heavily on imports of raw materials and petroleum fuels for power. This exposes firms to fluctuations in exchange rates and the prices of raw materials and energy. Therefore, adopting energy and resource efficient measures has the potential to generate significant economic benefits in addition to environmental benefits.
3.2.6 Construction
The construction sector in Bangladesh has experienced strong growth since the early 1990s, especially in urban areas, to meet the needs of a growing population and rapid economic growth. Key aspects of this sector include the following:
� The construction sector has generated 8% of GDP since 2006 and currently accounts for 3% of total jobs.
23 Waste Concern presentation to ILO (2008). http://www.ilo.int/wcmsp5/groups/public/@asia/@ro-bangkok/documents/presentation/wcms_099505.pdf 24 Energy Efficiency Gains in Industrial Establishments: Bangladesh Perspective. A presentation by M. A. Rashid Sarkar http://www.unescap.org/esd/energy/efficiency/egm_2002/A5.pdf
Estimating green jobs in Bangladesh
17
� In recent years approximately 75% of total national investment has been construction-related; the private sector accounts for two-thirds of this investment25.
� The construction industry is an important source of employment for the poor but job quality is often below acceptable standards.
� In Bangladesh, households account for 39% of the country’s electricity demand (of which 40% is for lighting).
� Growth in the construction of residential buildings has increased the strain on natural resources such as gas and water, as well as power generation and sanitary services in the major cities.
� Construction plays a crucial role in adaptation activities (e.g. building embankments and dykes) and it has also generated growth in related industries, such as transport, storage, communications, housing and trade services.
3.2.7 Transport
Poor transport facilities and infrastructure are a major hindrance to Bangladesh’s economic development. The government is investing in infrastructure with the support of multilateral organisations, but the challenges remain huge, given the intense population pressure and rapid urbanisation. Key aspects of this sector include the following:
� In 2008, the transportation sector accounted for approximately 6.4% of the country’s GDP and 8% of total employment.
� Roads connecting the country’s major urban centres are poor and unreliable. The road network in Dhaka is severely congested; indeed it is one of the most congested cities in the world.
� As of 2007 there were one million registered motorised vehicles in the country. Between 2000 and 2007, the growth rate of 3-wheeler (53%), mini bus (58%) and bus (34%) was significant.
� Transport fuel is imported from the Middle East, Singapore and India. Nearly 25% of the national budget is spent on importing crude oil. Converting vehicles to run on natural gas is saving US$54 million foreign currency per year as a result of not having to import crude oil26.
� In Bangladesh most forms of urban transport are generally privately owned. Pedal rickshaws, buses, autorickshaws and taxis are the most common forms of transport.
� Air pollution is very high in the major cities of Bangladesh. An estimated 15,000 premature deaths per annum, as well as several million cases of pulmonary, respiratory and neurological illness are attributed to the poor air quality in Dhaka27.
� The transportation sector is directly linked to the reduction of polluting activities, through the use of ‘greener’ fuels (e.g. sustainable biofuels and compressed natural gas (CNG)). Currently around 4% of the gas produced daily in Bangladesh is being used for CNG-fuelled vehicles.
3.2.8 Climate adaptation
Bangladesh is frequently cited as one of the countries most vulnerable to climate change28. Its vulnerability is due to a disadvantageous geographic location (flat, low-lying topography,
25 Source: Bangladesh Bureau of Statistics. 26 Source: Asian Development Bank. 27 According to the Air Quality Management Project (AQMP), funded by the government and the World Bank.
Estimating green jobs in Bangladesh
18
river delta and proximity to the Indian Ocean), high population density, high poverty rates and reliance on climate-sensitive sectors (e.g. agriculture). Key aspects regarding the scale and impact of climate changes, and the nature of climate change adaptation activities include the following:
� Bangladesh is highly vulnerable to natural disasters. Major natural hazards include cyclones and storm surges, flash flooding, drought, tornados, earthquakes, riverbank erosion, and landslides. One or more of these weather-related hazards occur on an annual basis with severe consequences29.
� Floods affect approximately 80% of land in Bangladesh. In any given year, 20-25% of the country is flooded by rivers breaking their banks and overflowing drains.
� The scale of loss to life and property from natural hazards is substantial. For example, in 2004, floods inundated 38% of the total land area, resulting in an estimated $6.6 billion worth of damage, the loss of 700 lives and displacement of nearly 4 million people. According to the UNDP, the direct annual cost of natural disasters over the last 10 years is estimated to be between 0.5% and 1% of Bangladesh's GDP30.
� Agriculture is the sector most sensitive to climate change in terms of environmental, social and economic impacts. Changes in temperature and rainfall patterns resulting in an increased likelihood of extreme events such as droughts and floods can destroy crops and reduce yield. Many of Bangladesh’s rural poor live in areas subject to extreme floods that can destroy their crops, homes and livelihoods. Income and food security are highly precarious for the large numbers of rural poor whose subsistence depends on agriculture.
28 For example, see DOE (Department of Environment, M.o.E.a.F., Government of the Peoples Republic of Bangladesh) (2006)‘Addressing Climate Change in Bangladesh: National Efforts’, Government of the Peoples Republic of Bangladesh; GEF (2007) LDCF and SCCF Programming Update, GEF/LDCF.SCCF.2/Inf.3, Global Environment Facility, Washington, DC; Huq, S. (2001) ‘Climate Change and Bangladesh’. Science (294), p. 1617. 29 See UNFCCC (2005) National Adaptation Programme of Action (NAPA) for Bangladesh (http://unfccc.int/resource/docs/napa/ban01.pdf ). 30 Bangladesh: Economics of Adaptation to Climate Change Study, World Bank. https://beta.worldbank.org/content/bangladesh-economics-adaptation-climate-change-study
Estimating green jobs in Bangladesh
19
4 ‘CORE’ ENVIRONMENT-RELATED AND GREEN EMPLOYMENT
4.1 Introduction
What is the
overall structure
of the domestic
economy & total
employment?
Task 1
What is the scale
of environment-
related economic
activity and
employment in
the economy?
Task 2
How big is core
environment-
related
employment and
green
employment?
Task 3
How many
other jobs do
those core and
green activities
support?
Task 4
What is the
impact of
modelled
interventions,
who wins &
loses?
Task 5
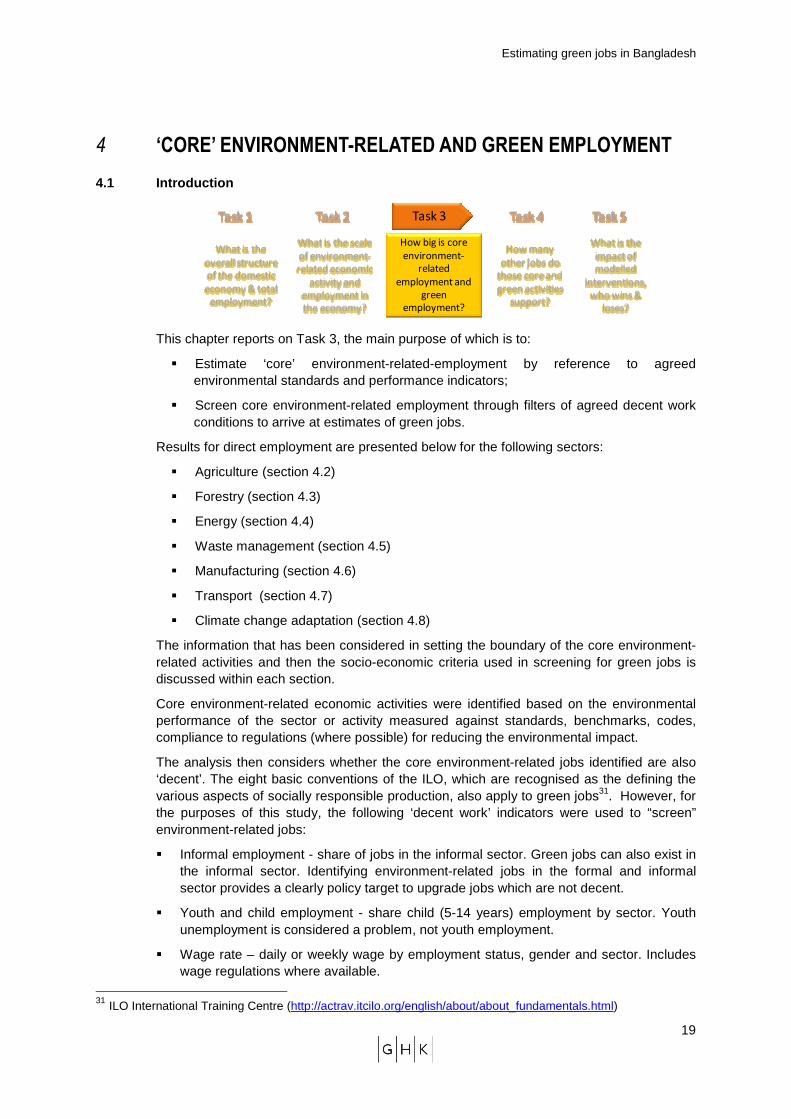
This chapter reports on Task 3, the main purpose of which is to:
� Estimate ‘core’ environment-related-employment by reference to agreed environmental standards and performance indicators;
� Screen core environment-related employment through filters of agreed decent work conditions to arrive at estimates of green jobs.
Results for direct employment are presented below for the following sectors:
� Agriculture (section 4.2)
� Forestry (section 4.3)
� Energy (section 4.4)
� Waste management (section 4.5)
� Manufacturing (section 4.6)
� Transport (section 4.7)
� Climate change adaptation (section 4.8)
The information that has been considered in setting the boundary of the core environment-related activities and then the socio-economic criteria used in screening for green jobs is discussed within each section.
Core environment-related economic activities were identified based on the environmental performance of the sector or activity measured against standards, benchmarks, codes, compliance to regulations (where possible) for reducing the environmental impact.
The analysis then considers whether the core environment-related jobs identified are also ‘decent’. The eight basic conventions of the ILO, which are recognised as the defining the various aspects of socially responsible production, also apply to green jobs31. However, for the purposes of this study, the following ‘decent work’ indicators were used to “screen” environment-related jobs:
� Informal employment - share of jobs in the informal sector. Green jobs can also exist in the informal sector. Identifying environment-related jobs in the formal and informal sector provides a clearly policy target to upgrade jobs which are not decent.
� Youth and child employment - share child (5-14 years) employment by sector. Youth unemployment is considered a problem, not youth employment.
� Wage rate – daily or weekly wage by employment status, gender and sector. Includes wage regulations where available.
31 ILO International Training Centre (http://actrav.itcilo.org/english/about/about_fundamentals.html)
Estimating green jobs in Bangladesh
20
� Gender ratio – the overall gender ratio in the sector, and for different employment categories (e.g. formal and informal) and wage rate.
� Working hours - working hours per week. Those who work less than 35 hours during the reference week are considered to be underemployed.
� Working conditions, rights and standards – job security, physical working conditions, occupational health, and non-wage benefits (e.g. paid annual leave, illness-related leave, and benefits).
� Social protection and representation - incidence of poverty by employment status, and representation of the poor in social development groups and trade unions.
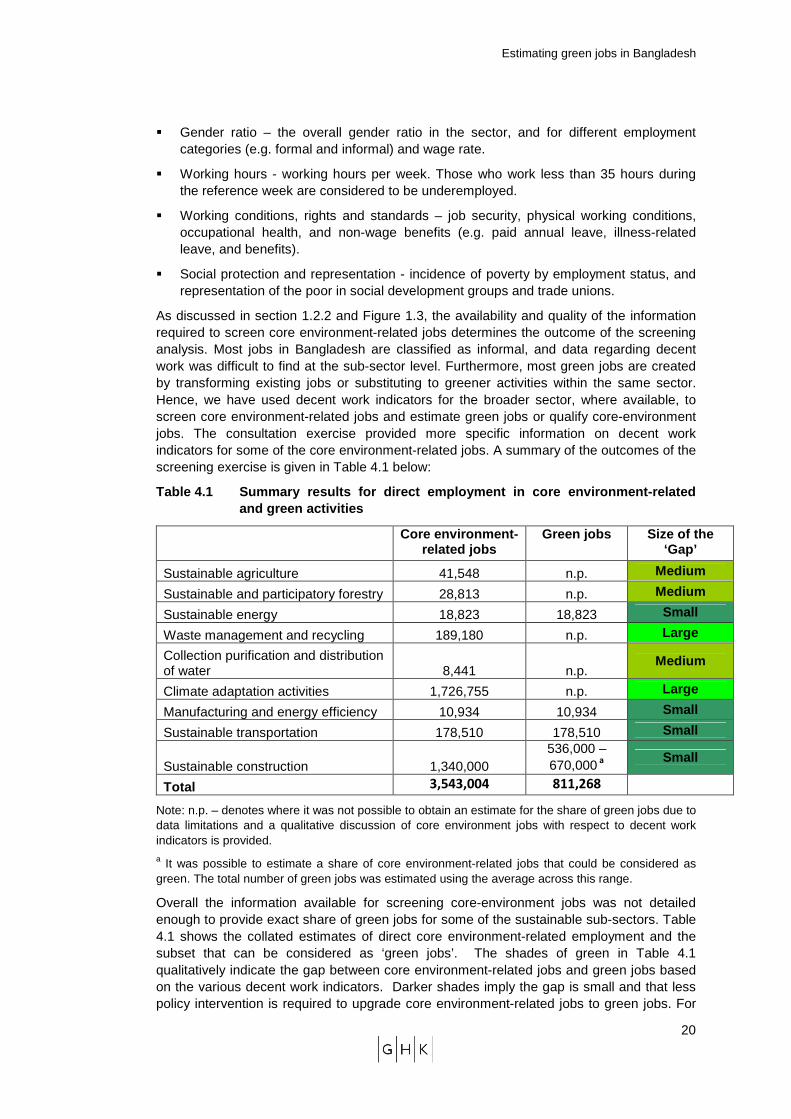
As discussed in section 1.2.2 and Figure 1.3, the availability and quality of the information required to screen core environment-related jobs determines the outcome of the screening analysis. Most jobs in Bangladesh are classified as informal, and data regarding decent work was difficult to find at the sub-sector level. Furthermore, most green jobs are created by transforming existing jobs or substituting to greener activities within the same sector. Hence, we have used decent work indicators for the broader sector, where available, to screen core environment-related jobs and estimate green jobs or qualify core-environment jobs. The consultation exercise provided more specific information on decent work indicators for some of the core environment-related jobs. A summary of the outcomes of the screening exercise is given in Table 4.1 below:
Table 4.1 Summary results for direct employment in core environment-related and green activities
Core environment -
related jobs Green jo bs Size of the
‘Gap’
Sustainable agriculture 41,548 n.p. Medium
Sustainable and participatory forestry 28,813 n.p. Medium
Sustainable energy 18,823 18,823 Small
Waste management and recycling 189,180 n.p. Large
Collection purification and distribution of water 8,441 n.p.
Medium
Climate adaptation activities 1,726,755 n.p. Large
Manufacturing and energy efficiency 10,934 10,934 Small
Sustainable transportation 178,510 178,510 Small
Sustainable construction 1,340,000 536,000 – 670,000 a
Small
Total 3,543,004 811,268
Note: n.p. – denotes where it was not possible to obtain an estimate for the share of green jobs due to data limitations and a qualitative discussion of core environment jobs with respect to decent work indicators is provided. a It was possible to estimate a share of core environment-related jobs that could be considered as green. The total number of green jobs was estimated using the average across this range.
Overall the information available for screening core-environment jobs was not detailed enough to provide exact share of green jobs for some of the sustainable sub-sectors. Table 4.1 shows the collated estimates of direct core environment-related employment and the subset that can be considered as ‘green jobs’. The shades of green in Table 4.1 qualitatively indicate the gap between core environment-related jobs and green jobs based on the various decent work indicators. Darker shades imply the gap is small and that less policy intervention is required to upgrade core environment-related jobs to green jobs. For
Estimating green jobs in Bangladesh
21
some sub-sectors, such as sustainable energy and transport, the decent work indicators implied that all core environment-related jobs can be considered as green jobs. For the construction sector there was enough information to estimate a share of core environment-related jobs that could be considered green.
The analysis highlights the practical challenges of deploying a definition of green jobs that combines environmental and social criteria. Even where economic activities that have strong environmental performance can be identified and demarcated, the allocation of the associated employment to ‘green jobs’ is constrained by:
� The fact that in a developing country context much of this core environmental employment (as for the economy as a whole) does not meet ILO conditions of decent work, resulting in those jobs being screened out by the research method;
� The exact nature of the green activity, which may not be specific to one industrial sector and cut across a range of industrial sectors; and
� Lack of information on employment conditions posing a barrier to clear classification.
In the following sections, we discuss each core environment-related sector in more detail. Each sector analysis concludes with a brief discussion of the extent to which core environment-related jobs can be considered ‘green’, based on findings from the literature review and field interviews, and expert judgment.
4.2 Agriculture
4.2.1 Defining ‘core’ environment-related jobs in a griculture
All agriculture jobs are, of course, ultimately dependent on the environment and its ecosystem services. In looking for prospective green jobs, the researchers focused on identification of more sustainable agricultural practices that are less resource intensive, more supportive of biodiversity and have a smaller carbon footprint than conventional farming. Key features of sustainable agriculture include:
� Soil conservation;
� Water efficiency practices;
� Reliance on natural nutrient cycling; and
� Reduced farm-to-market distances (and thereby reduced energy use).
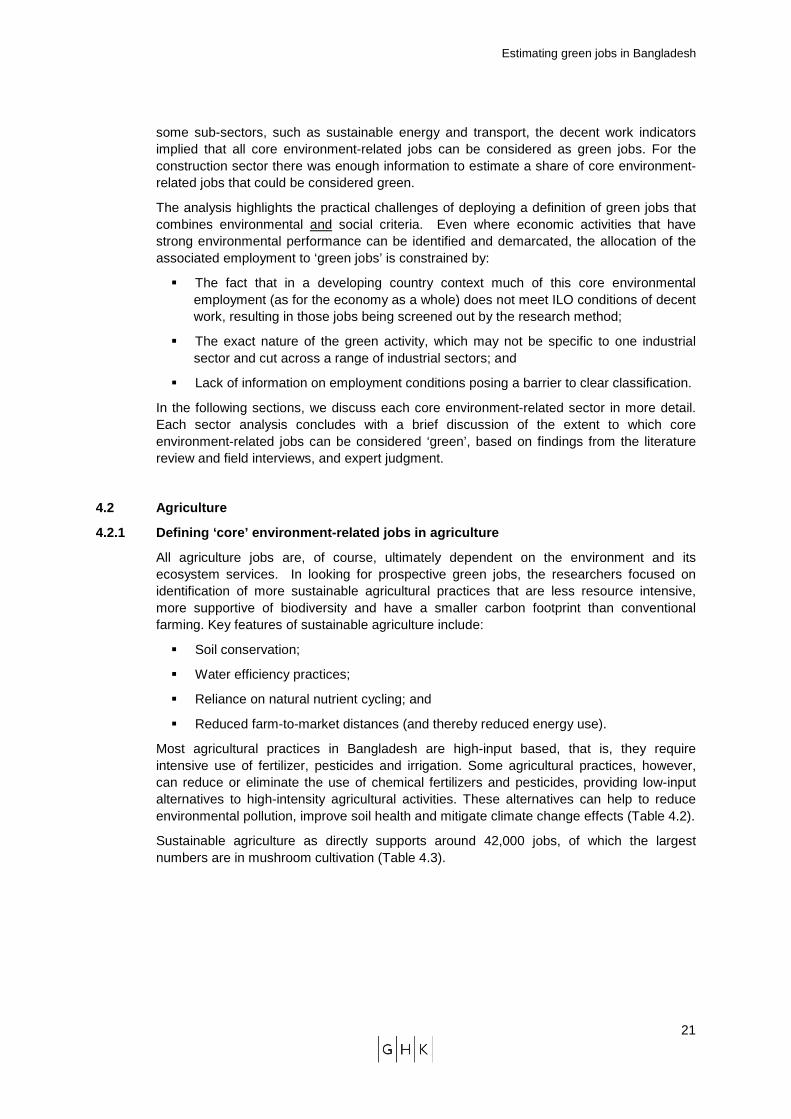
Most agricultural practices in Bangladesh are high-input based, that is, they require intensive use of fertilizer, pesticides and irrigation. Some agricultural practices, however, can reduce or eliminate the use of chemical fertilizers and pesticides, providing low-input alternatives to high-intensity agricultural activities. These alternatives can help to reduce environmental pollution, improve soil health and mitigate climate change effects (Table 4.2).
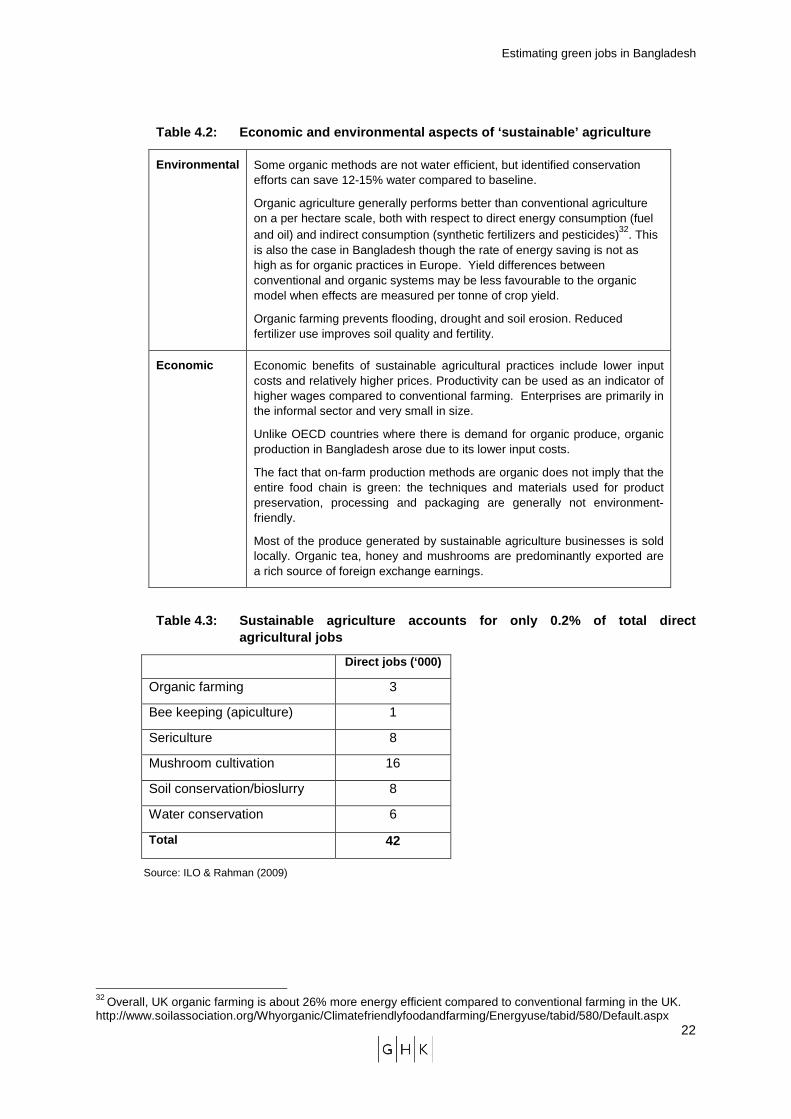
Sustainable agriculture as directly supports around 42,000 jobs, of which the largest numbers are in mushroom cultivation (Table 4.3).
Estimating green jobs in Bangladesh
22
Table 4.2: Economic and environmental aspects of ‘s ustainable’ agriculture
Environmental Some organic methods are not water efficient, but identified conservation efforts can save 12-15% water compared to baseline.
Organic agriculture generally performs better than conventional agriculture on a per hectare scale, both with respect to direct energy consumption (fuel and oil) and indirect consumption (synthetic fertilizers and pesticides)32. This is also the case in Bangladesh though the rate of energy saving is not as high as for organic practices in Europe. Yield differences between conventional and organic systems may be less favourable to the organic model when effects are measured per tonne of crop yield.
Organic farming prevents flooding, drought and soil erosion. Reduced fertilizer use improves soil quality and fertility.
Economic Economic benefits of sustainable agricultural practices include lower input costs and relatively higher prices. Productivity can be used as an indicator of higher wages compared to conventional farming. Enterprises are primarily in the informal sector and very small in size.
Unlike OECD countries where there is demand for organic produce, organic production in Bangladesh arose due to its lower input costs.
The fact that on-farm production methods are organic does not imply that the entire food chain is green: the techniques and materials used for product preservation, processing and packaging are generally not environment-friendly.
Most of the produce generated by sustainable agriculture businesses is sold locally. Organic tea, honey and mushrooms are predominantly exported are a rich source of foreign exchange earnings.
Table 4.3: Sustainable agriculture accounts for onl y 0.2% of total direct agricultural jobs
Direct jobs (‘000)
Organic farming 3
Bee keeping (apiculture) 1
Sericulture 8
Mushroom cultivation 16
Soil conservation/bioslurry 8
Water conservation 6
Total 42
Source: ILO & Rahman (2009)
32 Overall, UK organic farming is about 26% more energy efficient compared to conventional farming in the UK. http://www.soilassociation.org/Whyorganic/Climatefriendlyfoodandfarming/Energyuse/tabid/580/Default.aspx
Estimating green jobs in Bangladesh
23
4.2.2 Application of decent work criteria to sustai nable agriculture
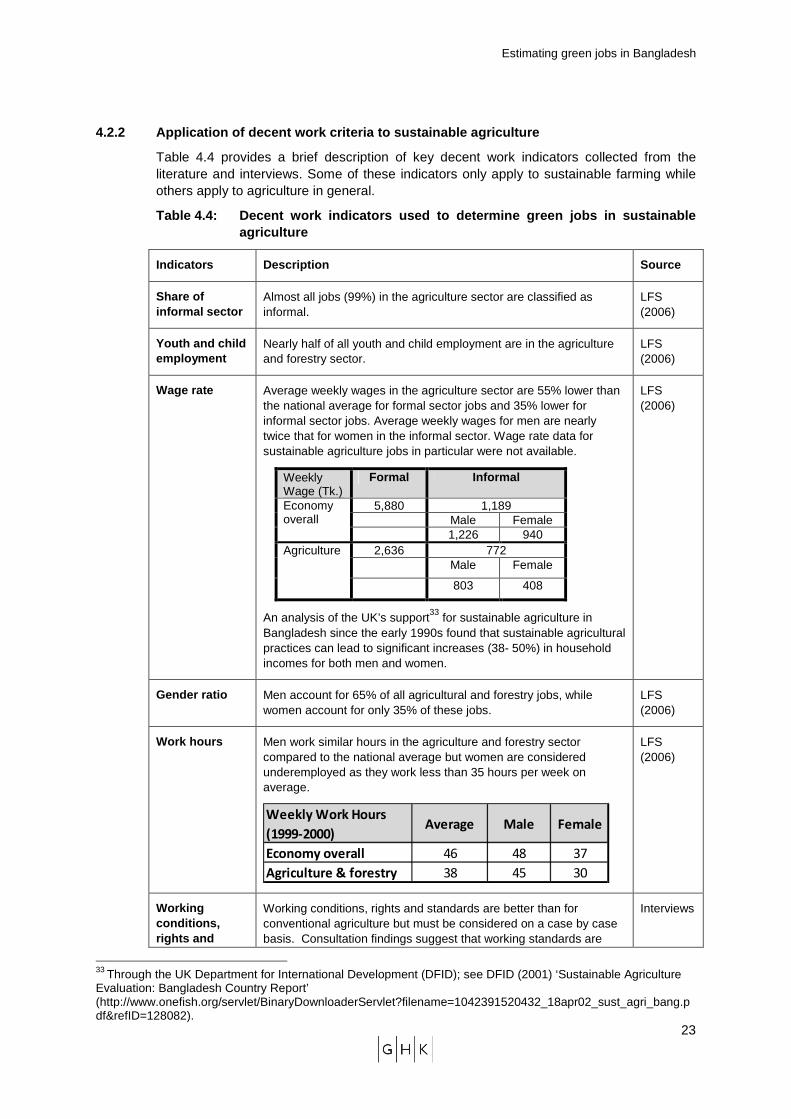
Table 4.4 provides a brief description of key decent work indicators collected from the literature and interviews. Some of these indicators only apply to sustainable farming while others apply to agriculture in general.
Table 4.4: Decent work indicators used to determine green jobs in sustainable agriculture
Indicators Description Source
Share of informal sector
Almost all jobs (99%) in the agriculture sector are classified as informal.
LFS (2006)
Youth and child employment
Nearly half of all youth and child employment are in the agriculture and forestry sector.
LFS (2006)
Wage rate Average weekly wages in the agriculture sector are 55% lower than the national average for formal sector jobs and 35% lower for informal sector jobs. Average weekly wages for men are nearly twice that for women in the informal sector. Wage rate data for sustainable agriculture jobs in particular were not available.
Weekly Wage (Tk.)
Formal Informal
Economy overall
5,880 1,189 Male Female 1,226 940
Agriculture 2,636 772 Male Female
803 408
An analysis of the UK’s support33 for sustainable agriculture in Bangladesh since the early 1990s found that sustainable agricultural practices can lead to significant increases (38- 50%) in household incomes for both men and women.
LFS (2006)
Gender ratio Men account for 65% of all agricultural and forestry jobs, while women account for only 35% of these jobs.
LFS (2006)
Work hours Men work similar hours in the agriculture and forestry sector compared to the national average but women are considered underemployed as they work less than 35 hours per week on average.
Weekly Work Hours
(1999-2000)Average Male Female
Economy overall 46 48 37
Agriculture & forestry 38 45 30
LFS (2006)
Working conditions, rights and
Working conditions, rights and standards are better than for conventional agriculture but must be considered on a case by case basis. Consultation findings suggest that working standards are
Interviews
33 Through the UK Department for International Development (DFID); see DFID (2001) ‘Sustainable Agriculture Evaluation: Bangladesh Country Report’ (http://www.onefish.org/servlet/BinaryDownloaderServlet?filename=1042391520432_18apr02_sust_agri_bang.pdf&refID=128082).
Estimating green jobs in Bangladesh
24
Indicators Description Source
standards generally better as employees. The smaller size of organic farms often means there is a closer working relationship between the employer and employees.
Most of the labourers are paid on a daily basis in rural areas and work under an individual farmer. Daily wage workers tend to work longer hours and receive fewer non-wage benefits.
Social protection and representation
Only government employees in the agriculture sector have a registered trade union: the Bangladesh Agricultural Farm Labour Federation (BAFLF). The Federation currently represents approximately 10,000 farmers according to the BAFLF president, which is a very small share of total agriculture jobs.
ILO & Rahman (2009)
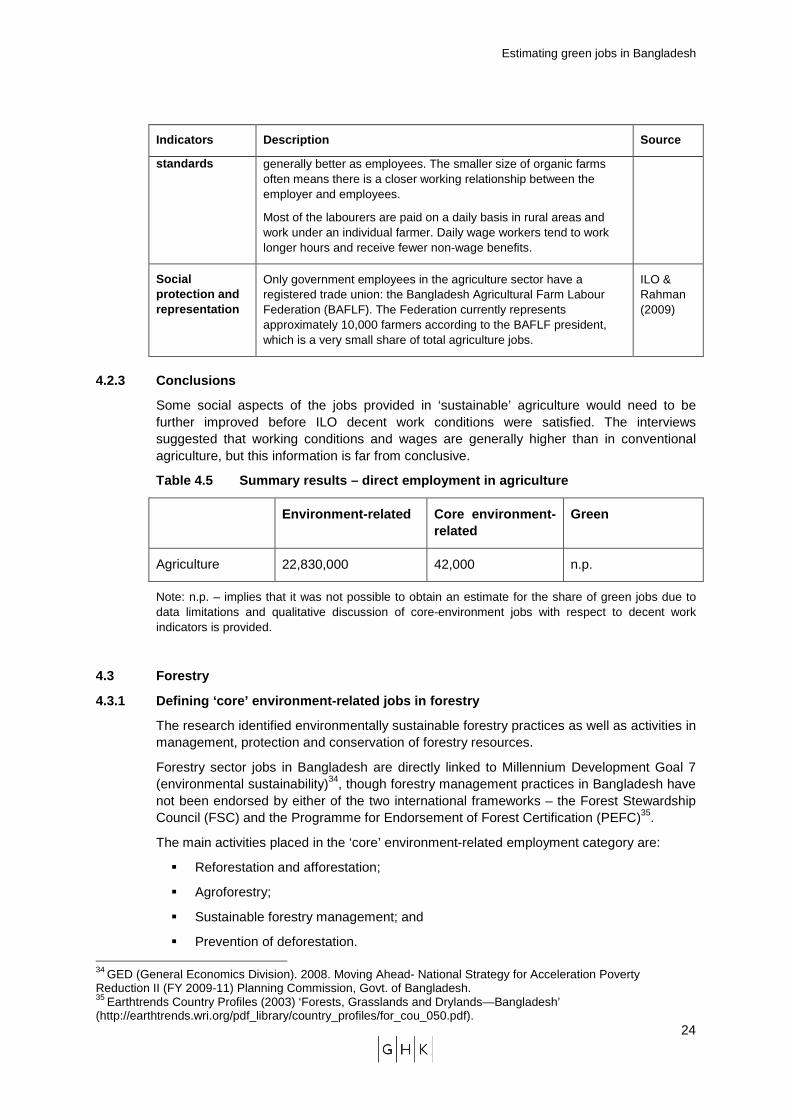
4.2.3 Conclusions
Some social aspects of the jobs provided in ‘sustainable’ agriculture would need to be further improved before ILO decent work conditions were satisfied. The interviews suggested that working conditions and wages are generally higher than in conventional agriculture, but this information is far from conclusive.
Table 4.5 Summary results – direct employment in ag riculture
Environment-related Core environment-related
Green
Agriculture 22,830,000 42,000 n.p.
Note: n.p. – implies that it was not possible to obtain an estimate for the share of green jobs due to data limitations and qualitative discussion of core-environment jobs with respect to decent work indicators is provided.
4.3 Forestry
4.3.1 Defining ‘core’ environment-related jobs in f orestry
The research identified environmentally sustainable forestry practices as well as activities in management, protection and conservation of forestry resources.
Forestry sector jobs in Bangladesh are directly linked to Millennium Development Goal 7 (environmental sustainability)34, though forestry management practices in Bangladesh have not been endorsed by either of the two international frameworks – the Forest Stewardship Council (FSC) and the Programme for Endorsement of Forest Certification (PEFC)35.
The main activities placed in the ‘core’ environment-related employment category are:
� Reforestation and afforestation;
� Agroforestry;
� Sustainable forestry management; and
� Prevention of deforestation. 34 GED (General Economics Division). 2008. Moving Ahead- National Strategy for Acceleration Poverty Reduction II (FY 2009-11) Planning Commission, Govt. of Bangladesh. 35 Earthtrends Country Profiles (2003) ‘Forests, Grasslands and Drylands—Bangladesh’ (http://earthtrends.wri.org/pdf_library/country_profiles/for_cou_050.pdf).
Estimating green jobs in Bangladesh
25
Table 4.6 Economic and environmental aspects of sus tainable forestry
Environmental There are some concerns regarding environmental standards with respect to afforestation and social forestry. Species selection has long been debated on a number of criteria including tolerance to increasing salinity and water consumption per unit of harvested land area. Site selection has also been questioned. Particular species are typically well-suited to particular sites, and this is often overlooked. There is also resistance to considering less widely-cultivated indigenous species. As a result, these factors can create adverse environmental effects, making it hard to label all the jobs as truly ‘green’, despite overall increases in yields and employment. For example, planting non-indigenous species may create jobs but the long term environmental implications are not clear.
Economic Consultation findings suggest that sustainable forestry activities can improve livelihoods for the rural poor.
The output value from sustainable forestry activities is significantly higher than from conventional forestry.
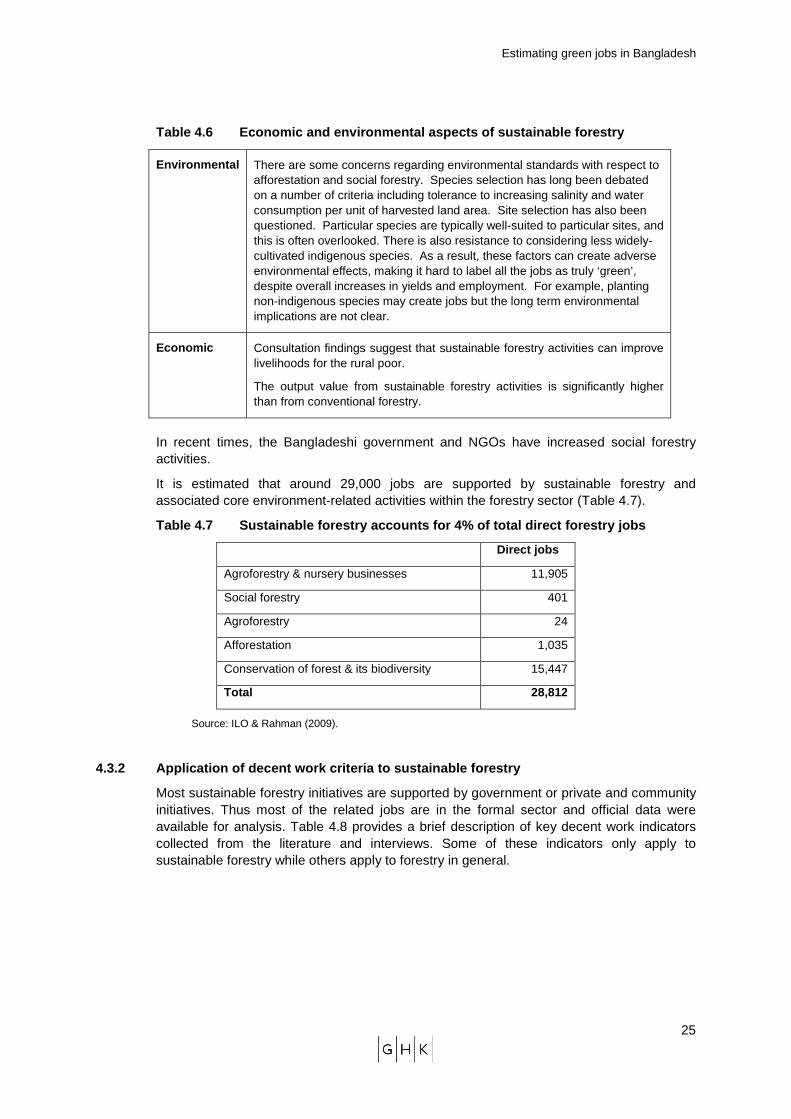
In recent times, the Bangladeshi government and NGOs have increased social forestry activities.
It is estimated that around 29,000 jobs are supported by sustainable forestry and associated core environment-related activities within the forestry sector (Table 4.7).
Table 4.7 Sustainable forestry accounts for 4% of t otal direct forestry jobs
Direct jobs
Agroforestry & nursery businesses 11,905
Social forestry 401
Agroforestry 24
Afforestation 1,035
Conservation of forest & its biodiversity 15,447
Total 28,812
Source: ILO & Rahman (2009).
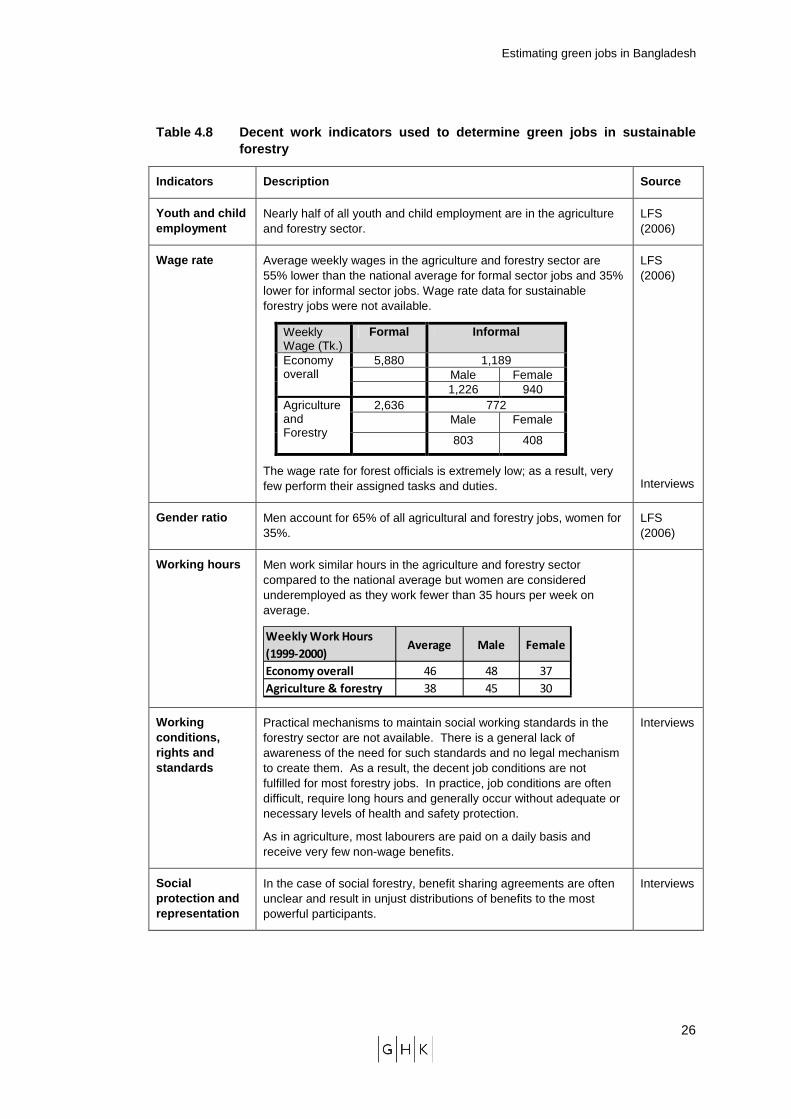
4.3.2 Application of decent work criteria to sustai nable forestry
Most sustainable forestry initiatives are supported by government or private and community initiatives. Thus most of the related jobs are in the formal sector and official data were available for analysis. Table 4.8 provides a brief description of key decent work indicators collected from the literature and interviews. Some of these indicators only apply to sustainable forestry while others apply to forestry in general.
Estimating green jobs in Bangladesh
26
Table 4.8 Decent work indicators used to determine green jobs in sustainable forestry
Indicators Description Source
Youth and child employment
Nearly half of all youth and child employment are in the agriculture and forestry sector.
LFS (2006)
Wage rate Average weekly wages in the agriculture and forestry sector are 55% lower than the national average for formal sector jobs and 35% lower for informal sector jobs. Wage rate data for sustainable forestry jobs were not available.
Weekly Wage (Tk.)
Formal Informal
Economy overall
5,880 1,189 Male Female 1,226 940
Agriculture and Forestry
2,636 772 Male Female
803 408
The wage rate for forest officials is extremely low; as a result, very few perform their assigned tasks and duties.
LFS (2006)
Interviews
Gender ratio Men account for 65% of all agricultural and forestry jobs, women for 35%.
LFS (2006)
Working hours Men work similar hours in the agriculture and forestry sector compared to the national average but women are considered underemployed as they work fewer than 35 hours per week on average.
Weekly Work Hours
(1999-2000)Average Male Female
Economy overall 46 48 37
Agriculture & forestry 38 45 30
Working conditions, rights and standards
Practical mechanisms to maintain social working standards in the forestry sector are not available. There is a general lack of awareness of the need for such standards and no legal mechanism to create them. As a result, the decent job conditions are not fulfilled for most forestry jobs. In practice, job conditions are often difficult, require long hours and generally occur without adequate or necessary levels of health and safety protection.
As in agriculture, most labourers are paid on a daily basis and receive very few non-wage benefits.
Interviews
Social protection and representation
In the case of social forestry, benefit sharing agreements are often unclear and result in unjust distributions of benefits to the most powerful participants.
Interviews
Estimating green jobs in Bangladesh
27
4.3.3 Conclusions
Research suggests that some, but not all, of the jobs identified in the sustainable forestry sub-sector can be considered green. Jobs have to be viewed in the context of existing laws and regulations, such as the Forest Act 2000, the Social Forestry Rules and the Wild Life Preservation Order. These laws and regulations are not comprehensive and there is a general lack of awareness about them. The consultation findings suggest that implementing these laws and regulations with adequate enforcement could result in more and better quality jobs.
Given the social dimension indicators above it is difficult to accurately differentiate sustainable forestry from overall forestry. Information was not available to calculate the exact share of environment-related jobs that did not satisfy acceptable working standards according to the ILO definition of green jobs. However, given the relatively high wage rates and formal ownership patterns, we may be in a position to say that the green forestry creates green jobs, all other criteria remaining equal, although considerable progress is still required to satisfy ILO decent work conditions.
Table 4.9 Summary results – direct employment in fo r forestry
Environment-related Core environment-related
Green
Forestry 711,187 28,812 n.p.
Note: n.p. – implies that it was not possible to obtain an estimate for the share of green jobs due to data limitations and qualitative discussion of core-environment jobs with respect to decent work indicators is provided.
4.4 Energy
4.4.1 Defining ‘core’ environment-related jobs
Bangladesh has significant renewable energy potential. Biomass and solar energy are the most important of the technologies deployed. The installed capacity for wind and hydro-power is small. The Government of Bangladesh’s ‘Renewable Energy Policy of Bangladesh 2008’, recognized that renewable energy is a cost-effective and sustainable energy source to meet the country’s growing energy demand.
Rural electrification plans have not been successfully implemented as set out in the Poverty Reduction Strategy Paper (PRSP I and II). On-site energy provision, particularly biomass, has the greatest potential to meet rural energy needs. Linking biogas technology to livestock and poultry operations in order to develop a sustainable biogas network has the potential to create a substantial number of green jobs.
A recent study by Waste Concern Consultancy36, commissioned by the ILO Bangladesh office, identified the four renewable technologies with the greatest potential in Bangladesh: as solar photo voltaic (PV) electrification, bio mass energy, wind energy and improved solar cooking stoves. These renewable technologies utilise small-scale community based systems and have relatively low upfront cost compared to large scale renewable projects. Biogas/biomass is well suited to Bangladeshi conditions given the availability of large quantities of organic waste from crop production and cattle.
36 Waste Concern Consultancy, 2010a
Estimating green jobs in Bangladesh
28
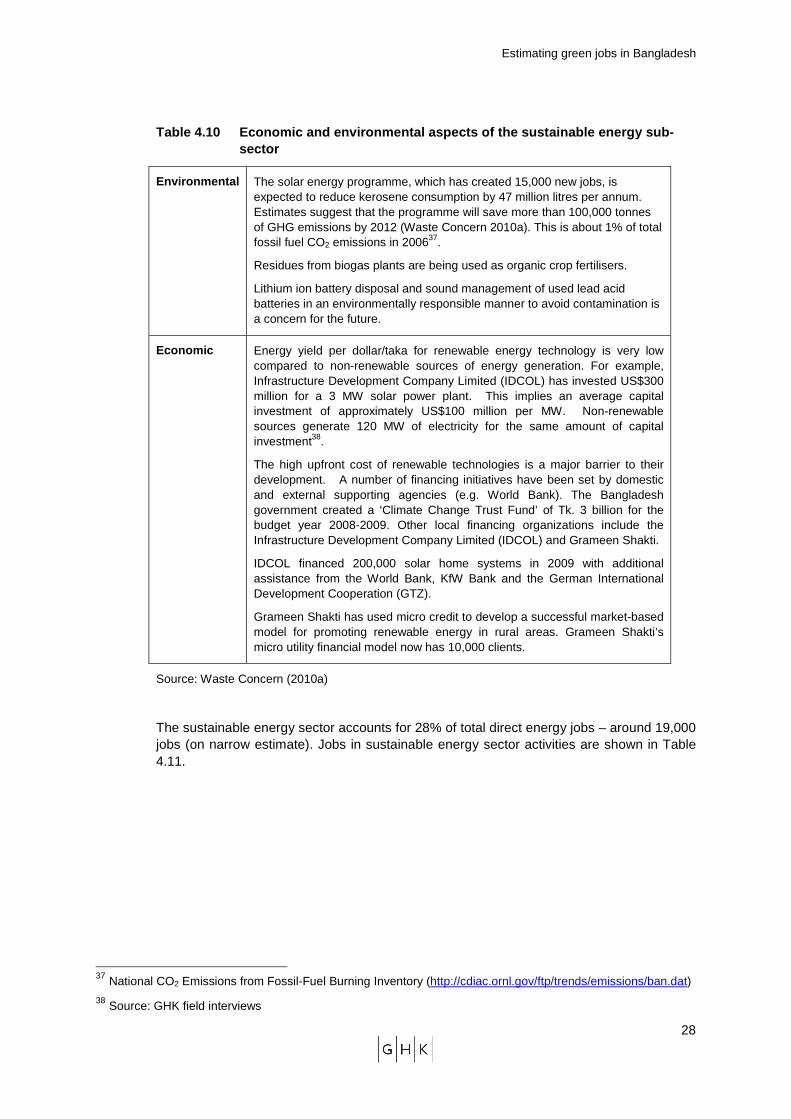
Table 4.10 Economic and environmental aspects of th e sustainable energy sub-sector
Environmental The solar energy programme, which has created 15,000 new jobs, is expected to reduce kerosene consumption by 47 million litres per annum. Estimates suggest that the programme will save more than 100,000 tonnes of GHG emissions by 2012 (Waste Concern 2010a). This is about 1% of total fossil fuel CO2 emissions in 200637.
Residues from biogas plants are being used as organic crop fertilisers.
Lithium ion battery disposal and sound management of used lead acid batteries in an environmentally responsible manner to avoid contamination is a concern for the future.
Economic Energy yield per dollar/taka for renewable energy technology is very low compared to non-renewable sources of energy generation. For example, Infrastructure Development Company Limited (IDCOL) has invested US$300 million for a 3 MW solar power plant. This implies an average capital investment of approximately US$100 million per MW. Non-renewable sources generate 120 MW of electricity for the same amount of capital investment38.
The high upfront cost of renewable technologies is a major barrier to their development. A number of financing initiatives have been set by domestic and external supporting agencies (e.g. World Bank). The Bangladesh government created a ‘Climate Change Trust Fund’ of Tk. 3 billion for the budget year 2008-2009. Other local financing organizations include the Infrastructure Development Company Limited (IDCOL) and Grameen Shakti.
IDCOL financed 200,000 solar home systems in 2009 with additional assistance from the World Bank, KfW Bank and the German International Development Cooperation (GTZ).
Grameen Shakti has used micro credit to develop a successful market-based model for promoting renewable energy in rural areas. Grameen Shakti’s micro utility financial model now has 10,000 clients.
Source: Waste Concern (2010a)
The sustainable energy sector accounts for 28% of total direct energy jobs – around 19,000 jobs (on narrow estimate). Jobs in sustainable energy sector activities are shown in Table 4.11.
37 National CO2 Emissions from Fossil-Fuel Burning Inventory (http://cdiac.ornl.gov/ftp/trends/emissions/ban.dat) 38 Source: GHK field interviews
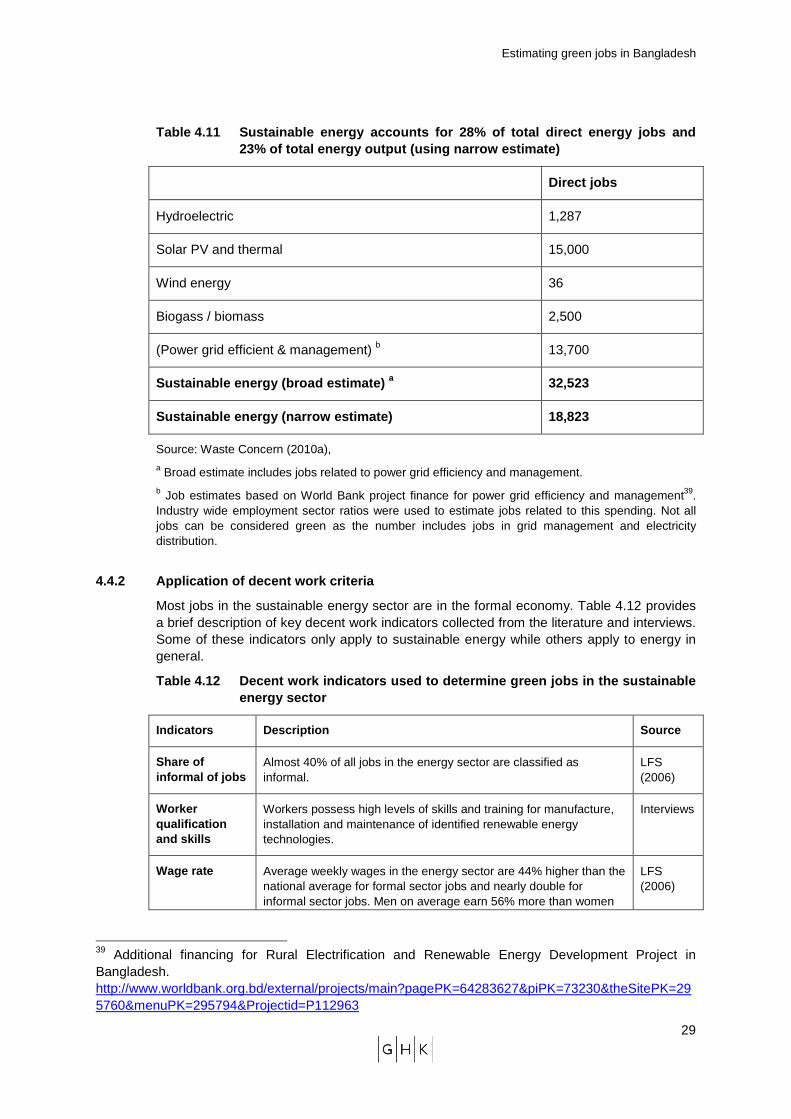
Estimating green jobs in Bangladesh
29
Table 4.11 Sustainable energy accounts for 28% of t otal direct energy jobs and 23% of total energy output (using narrow estimate)
Direct jobs
Hydroelectric 1,287
Solar PV and thermal 15,000
Wind energy 36
Biogass / biomass 2,500
(Power grid efficient & management) b 13,700
Sustainable energy (broad estimate) a 32,523
Sustainable energy (narrow estimate) 18,823
Source: Waste Concern (2010a), a Broad estimate includes jobs related to power grid efficiency and management. b Job estimates based on World Bank project finance for power grid efficiency and management39. Industry wide employment sector ratios were used to estimate jobs related to this spending. Not all jobs can be considered green as the number includes jobs in grid management and electricity distribution.
4.4.2 Application of decent work criteria
Most jobs in the sustainable energy sector are in the formal economy. Table 4.12 provides a brief description of key decent work indicators collected from the literature and interviews. Some of these indicators only apply to sustainable energy while others apply to energy in general.
Table 4.12 Decent work indicators used to determine green jobs in the sustainable energy sector
Indicators Description Source
Share of informal of jobs
Almost 40% of all jobs in the energy sector are classified as informal.
LFS (2006)
Worker qualification and skills
Workers possess high levels of skills and training for manufacture, installation and maintenance of identified renewable energy technologies.
Interviews
Wage rate Average weekly wages in the energy sector are 44% higher than the national average for formal sector jobs and nearly double for informal sector jobs. Men on average earn 56% more than women
LFS (2006)
39 Additional financing for Rural Electrification and Renewable Energy Development Project in Bangladesh. http://www.worldbank.org.bd/external/projects/main?pagePK=64283627&piPK=73230&theSitePK=295760&menuPK=295794&Projectid=P112963
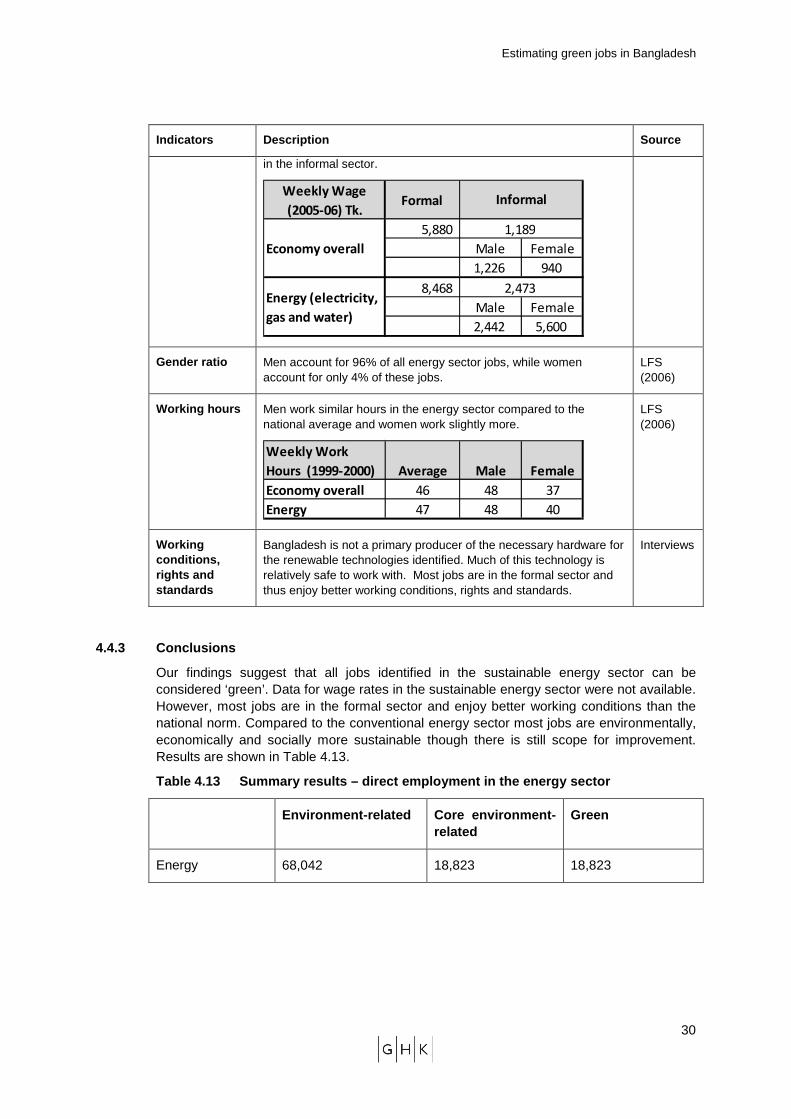
Estimating green jobs in Bangladesh
30
Indicators Description Source
in the informal sector.
Weekly Wage
(2005-06) Tk.Formal
5,880
Male Female
1,226 940
8,468
Male Female
2,442 5,600
Informal
1,189
Energy (electricity,
gas and water)
2,473
Economy overall
Gender ratio Men account for 96% of all energy sector jobs, while women account for only 4% of these jobs.
LFS (2006)
Working hours Men work similar hours in the energy sector compared to the national average and women work slightly more.
Weekly Work
Hours (1999-2000) Average Male Female
Economy overall 46 48 37
Energy 47 48 40
LFS (2006)
Working conditions, rights and standards
Bangladesh is not a primary producer of the necessary hardware for the renewable technologies identified. Much of this technology is relatively safe to work with. Most jobs are in the formal sector and thus enjoy better working conditions, rights and standards.
Interviews
4.4.3 Conclusions
Our findings suggest that all jobs identified in the sustainable energy sector can be considered ‘green’. Data for wage rates in the sustainable energy sector were not available. However, most jobs are in the formal sector and enjoy better working conditions than the national norm. Compared to the conventional energy sector most jobs are environmentally, economically and socially more sustainable though there is still scope for improvement. Results are shown in Table 4.13.
Table 4.13 Summary results – direct employment in t he energy sector
Environment-related Core environment-related
Green
Energy 68,042 18,823 18,823
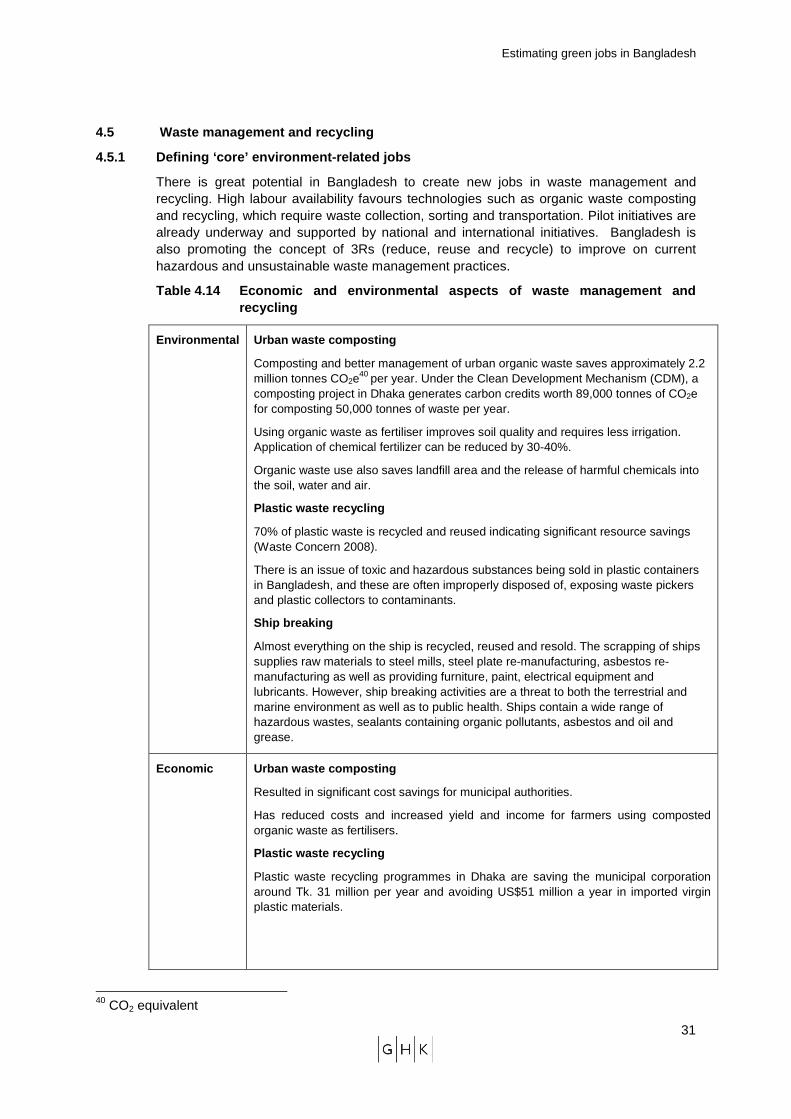
Estimating green jobs in Bangladesh
31
4.5 Waste management and recycling
4.5.1 Defining ‘core’ environment-related jobs
There is great potential in Bangladesh to create new jobs in waste management and recycling. High labour availability favours technologies such as organic waste composting and recycling, which require waste collection, sorting and transportation. Pilot initiatives are already underway and supported by national and international initiatives. Bangladesh is also promoting the concept of 3Rs (reduce, reuse and recycle) to improve on current hazardous and unsustainable waste management practices.
Table 4.14 Economic and environmental aspects of wa ste management and recycling
Environmental Urban waste composting
Composting and better management of urban organic waste saves approximately 2.2 million tonnes CO2e
40 per year. Under the Clean Development Mechanism (CDM), a composting project in Dhaka generates carbon credits worth 89,000 tonnes of CO2e for composting 50,000 tonnes of waste per year.
Using organic waste as fertiliser improves soil quality and requires less irrigation. Application of chemical fertilizer can be reduced by 30-40%.
Organic waste use also saves landfill area and the release of harmful chemicals into the soil, water and air.
Plastic waste recycling
70% of plastic waste is recycled and reused indicating significant resource savings (Waste Concern 2008).
There is an issue of toxic and hazardous substances being sold in plastic containers in Bangladesh, and these are often improperly disposed of, exposing waste pickers and plastic collectors to contaminants.
Ship breaking
Almost everything on the ship is recycled, reused and resold. The scrapping of ships supplies raw materials to steel mills, steel plate re-manufacturing, asbestos re-manufacturing as well as providing furniture, paint, electrical equipment and lubricants. However, ship breaking activities are a threat to both the terrestrial and marine environment as well as to public health. Ships contain a wide range of hazardous wastes, sealants containing organic pollutants, asbestos and oil and grease.
Economic Urban waste composting
Resulted in significant cost savings for municipal authorities.
Has reduced costs and increased yield and income for farmers using composted organic waste as fertilisers.
Plastic waste recycling
Plastic waste recycling programmes in Dhaka are saving the municipal corporation around Tk. 31 million per year and avoiding US$51 million a year in imported virgin plastic materials.
40 CO2 equivalent
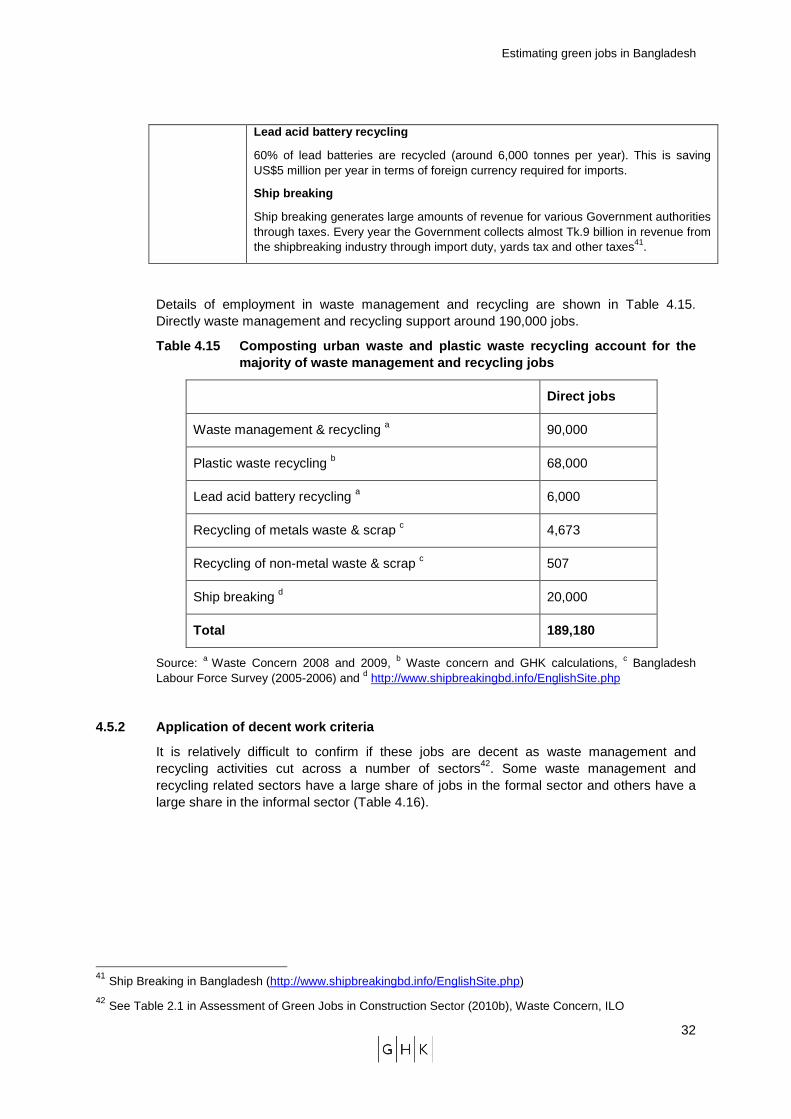
Estimating green jobs in Bangladesh
32
Lead acid battery recycling
60% of lead batteries are recycled (around 6,000 tonnes per year). This is saving US$5 million per year in terms of foreign currency required for imports.
Ship breaking
Ship breaking generates large amounts of revenue for various Government authorities through taxes. Every year the Government collects almost Tk.9 billion in revenue from the shipbreaking industry through import duty, yards tax and other taxes41.
Details of employment in waste management and recycling are shown in Table 4.15. Directly waste management and recycling support around 190,000 jobs.
Table 4.15 Composting urban waste and plastic waste recycling account for the majority of waste management and recycling jobs
Direct jobs
Waste management & recycling a 90,000
Plastic waste recycling b 68,000
Lead acid battery recycling a 6,000
Recycling of metals waste & scrap c 4,673
Recycling of non-metal waste & scrap c 507
Ship breaking d 20,000
Total 189,180
Source: a Waste Concern 2008 and 2009, b Waste concern and GHK calculations, c Bangladesh Labour Force Survey (2005-2006) and d http://www.shipbreakingbd.info/EnglishSite.php
4.5.2 Application of decent work criteria
It is relatively difficult to confirm if these jobs are decent as waste management and recycling activities cut across a number of sectors42. Some waste management and recycling related sectors have a large share of jobs in the formal sector and others have a large share in the informal sector (Table 4.16).
41 Ship Breaking in Bangladesh (http://www.shipbreakingbd.info/EnglishSite.php) 42 See Table 2.1 in Assessment of Green Jobs in Construction Sector (2010b), Waste Concern, ILO
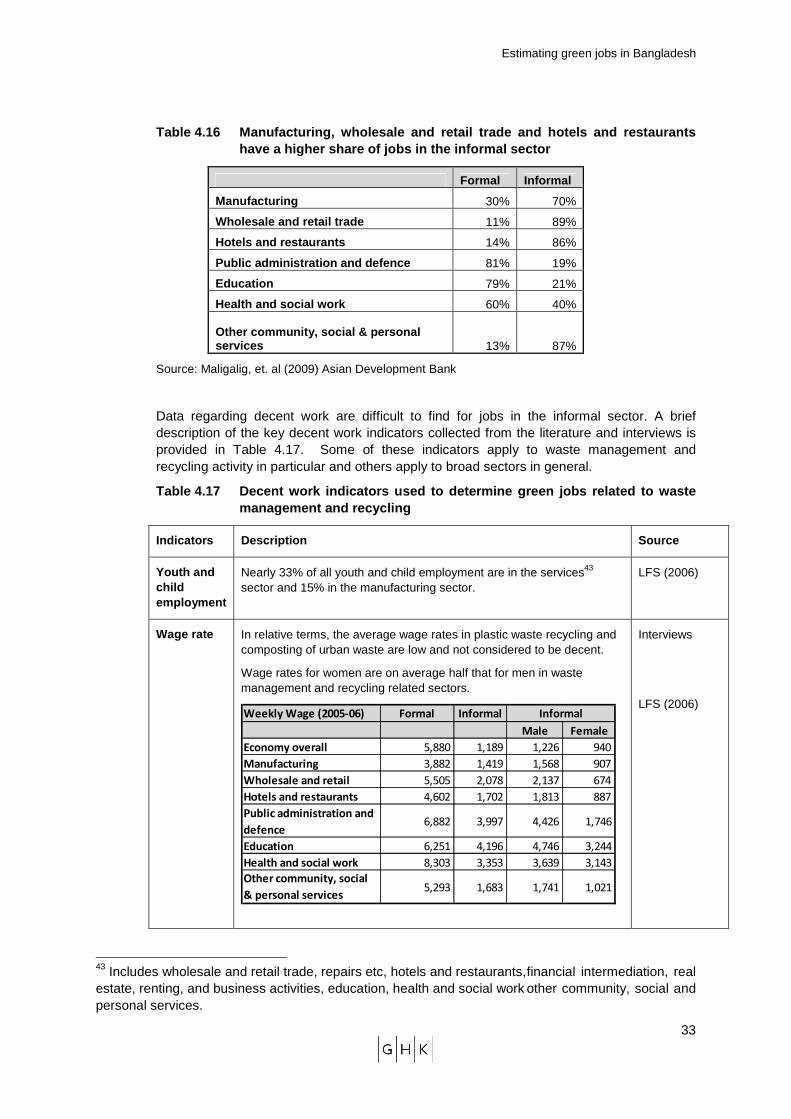
Estimating green jobs in Bangladesh
33
Table 4.16 Manufacturing, wholesale and retail trad e and hotels and restaurants have a higher share of jobs in the informal sector
Formal Informal
Manufacturing 30% 70%
Wholesale and retail trade 11% 89%
Hotels and restaurants 14% 86%
Public administration and defence 81% 19%
Education 79% 21%
Health and social work 60% 40%
Other community, social & personal services 13% 87%
Source: Maligalig, et. al (2009) Asian Development Bank
Data regarding decent work are difficult to find for jobs in the informal sector. A brief description of the key decent work indicators collected from the literature and interviews is provided in Table 4.17. Some of these indicators apply to waste management and recycling activity in particular and others apply to broad sectors in general.
Table 4.17 Decent work indicators used to determine green jobs related to waste management and recycling
Indicators Description Source
Youth and child employment
Nearly 33% of all youth and child employment are in the services43 sector and 15% in the manufacturing sector.
LFS (2006)
Wage rate In relative terms, the average wage rates in plastic waste recycling and composting of urban waste are low and not considered to be decent.
Wage rates for women are on average half that for men in waste management and recycling related sectors.
Weekly Wage (2005-06) Formal Informal
Male Female
Economy overall 5,880 1,189 1,226 940
Manufacturing 3,882 1,419 1,568 907
Wholesale and retail 5,505 2,078 2,137 674
Hotels and restaurants 4,602 1,702 1,813 887
Public administration and
defence 6,882 3,997 4,426 1,746
Education 6,251 4,196 4,746 3,244
Health and social work 8,303 3,353 3,639 3,143
Other community, social
& personal services 5,293 1,683 1,741 1,021
Informal
Interviews
LFS (2006)
43 Includes wholesale and retail trade, repairs etc, hotels and restaurants, financial intermediation, real estate, renting, and business activities, education, health and social work other community, social and personal services.
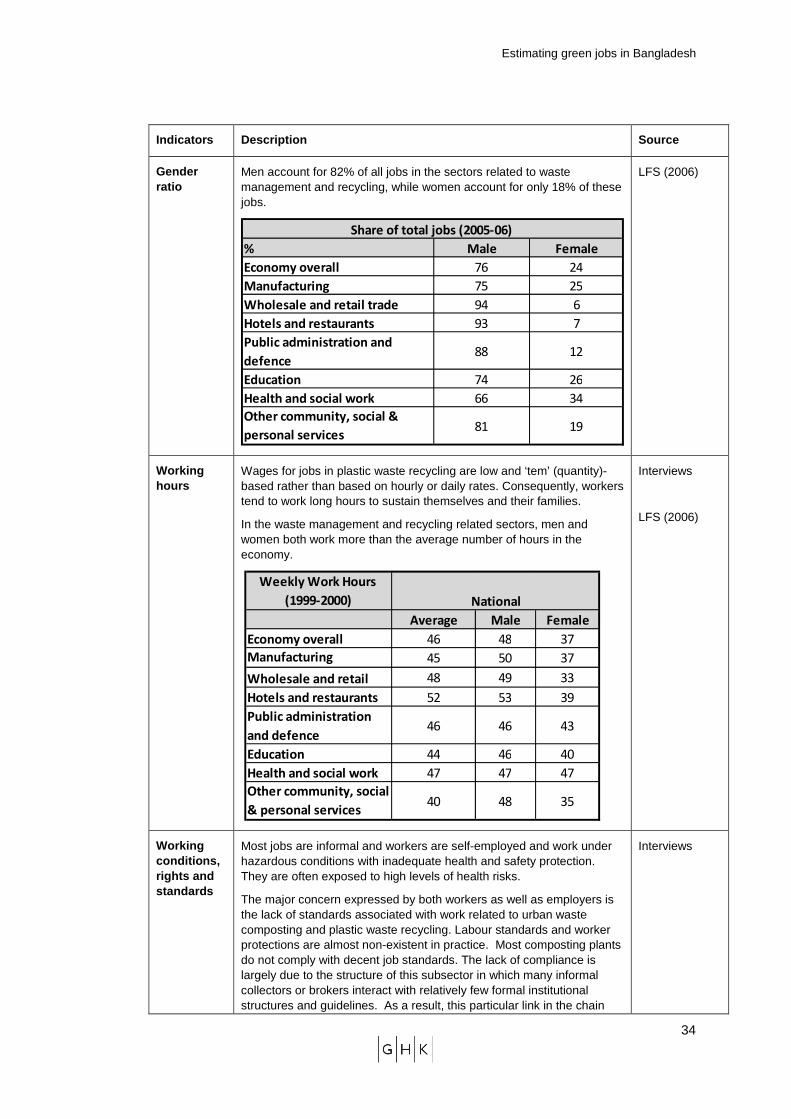
Estimating green jobs in Bangladesh
34
Indicators Description Source
Gender ratio
Men account for 82% of all jobs in the sectors related to waste management and recycling, while women account for only 18% of these jobs.
% Male Female
Economy overall 76 24
Manufacturing 75 25
Wholesale and retail trade 94 6
Hotels and restaurants 93 7
Public administration and
defence88 12
Education 74 26
Health and social work 66 34
Other community, social &
personal services81 19
Share of total jobs (2005-06)
LFS (2006)
Working hours
Wages for jobs in plastic waste recycling are low and ‘tem’ (quantity)-based rather than based on hourly or daily rates. Consequently, workers tend to work long hours to sustain themselves and their families.
In the waste management and recycling related sectors, men and women both work more than the average number of hours in the economy.
Weekly Work Hours
(1999-2000)
Average Male Female
Economy overall 46 48 37
Manufacturing 45 50 37
Wholesale and retail 48 49 33
Hotels and restaurants 52 53 39
Public administration
and defence46 46 43
Education 44 46 40
Health and social work 47 47 47
Other community, social
& personal services40 48 35
National
Interviews
LFS (2006)
Working conditions, rights and standards
Most jobs are informal and workers are self-employed and work under hazardous conditions with inadequate health and safety protection. They are often exposed to high levels of health risks.
The major concern expressed by both workers as well as employers is the lack of standards associated with work related to urban waste composting and plastic waste recycling. Labour standards and worker protections are almost non-existent in practice. Most composting plants do not comply with decent job standards. The lack of compliance is largely due to the structure of this subsector in which many informal collectors or brokers interact with relatively few formal institutional structures and guidelines. As a result, this particular link in the chain
Interviews
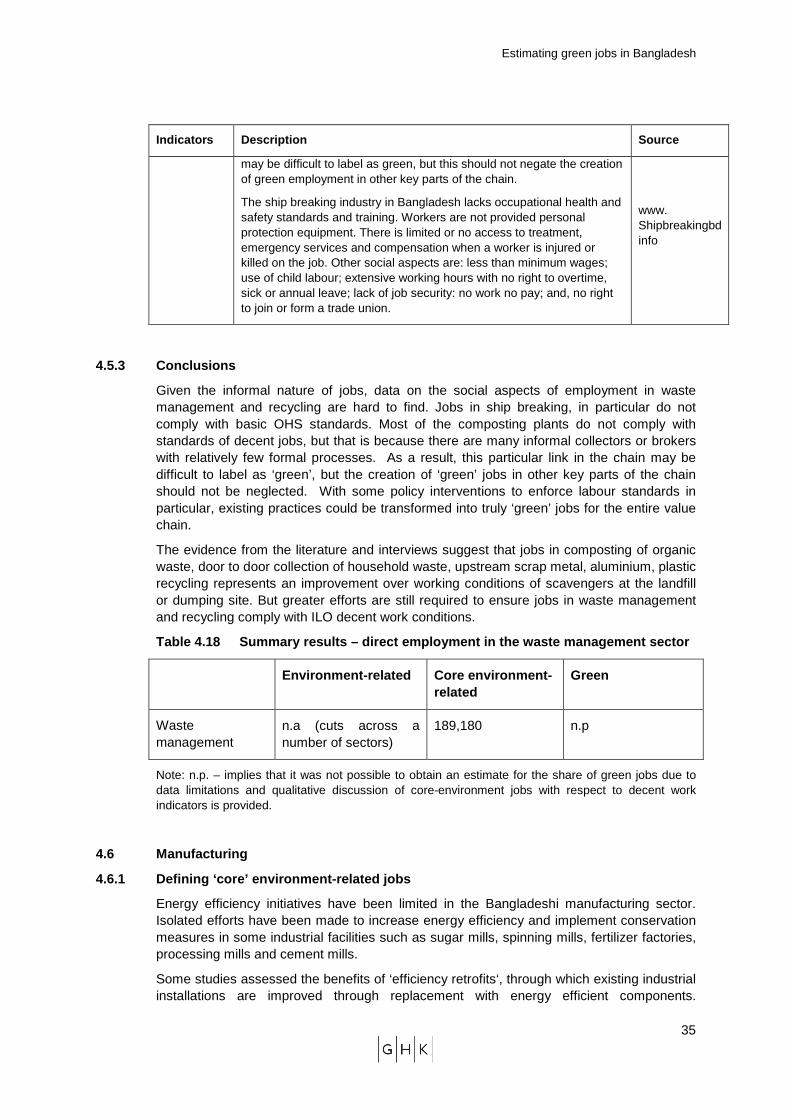
Estimating green jobs in Bangladesh
35
Indicators Description Source
may be difficult to label as green, but this should not negate the creation of green employment in other key parts of the chain.
The ship breaking industry in Bangladesh lacks occupational health and safety standards and training. Workers are not provided personal protection equipment. There is limited or no access to treatment, emergency services and compensation when a worker is injured or killed on the job. Other social aspects are: less than minimum wages; use of child labour; extensive working hours with no right to overtime, sick or annual leave; lack of job security: no work no pay; and, no right to join or form a trade union.
www. Shipbreakingbd info
4.5.3 Conclusions
Given the informal nature of jobs, data on the social aspects of employment in waste management and recycling are hard to find. Jobs in ship breaking, in particular do not comply with basic OHS standards. Most of the composting plants do not comply with standards of decent jobs, but that is because there are many informal collectors or brokers with relatively few formal processes. As a result, this particular link in the chain may be difficult to label as ‘green’, but the creation of ‘green’ jobs in other key parts of the chain should not be neglected. With some policy interventions to enforce labour standards in particular, existing practices could be transformed into truly ‘green’ jobs for the entire value chain.
The evidence from the literature and interviews suggest that jobs in composting of organic waste, door to door collection of household waste, upstream scrap metal, aluminium, plastic recycling represents an improvement over working conditions of scavengers at the landfill or dumping site. But greater efforts are still required to ensure jobs in waste management and recycling comply with ILO decent work conditions.
Table 4.18 Summary results – direct employment in t he waste management sector
Environment-related Core environment-related
Green
Waste management
n.a (cuts across a number of sectors)
189,180 n.p
Note: n.p. – implies that it was not possible to obtain an estimate for the share of green jobs due to data limitations and qualitative discussion of core-environment jobs with respect to decent work indicators is provided.
4.6 Manufacturing
4.6.1 Defining ‘core’ environment-related jobs
Energy efficiency initiatives have been limited in the Bangladeshi manufacturing sector. Isolated efforts have been made to increase energy efficiency and implement conservation measures in some industrial facilities such as sugar mills, spinning mills, fertilizer factories, processing mills and cement mills.
Some studies assessed the benefits of ‘efficiency retrofits‘, through which existing industrial installations are improved through replacement with energy efficient components.
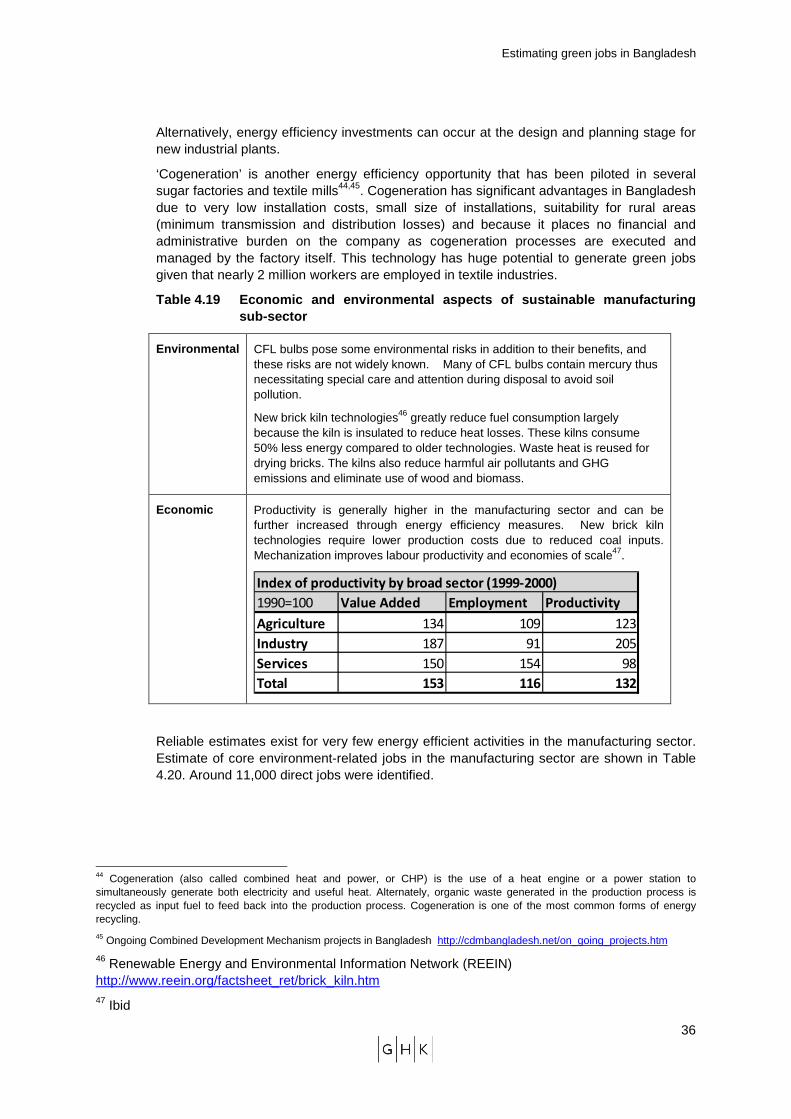
Estimating green jobs in Bangladesh
36
Alternatively, energy efficiency investments can occur at the design and planning stage for new industrial plants.
‘Cogeneration’ is another energy efficiency opportunity that has been piloted in several sugar factories and textile mills44,45. Cogeneration has significant advantages in Bangladesh due to very low installation costs, small size of installations, suitability for rural areas (minimum transmission and distribution losses) and because it places no financial and administrative burden on the company as cogeneration processes are executed and managed by the factory itself. This technology has huge potential to generate green jobs given that nearly 2 million workers are employed in textile industries.
Table 4.19 Economic and environmental aspects of su stainable manufacturing sub-sector
Environmental CFL bulbs pose some environmental risks in addition to their benefits, and these risks are not widely known. Many of CFL bulbs contain mercury thus necessitating special care and attention during disposal to avoid soil pollution.
New brick kiln technologies46 greatly reduce fuel consumption largely because the kiln is insulated to reduce heat losses. These kilns consume 50% less energy compared to older technologies. Waste heat is reused for drying bricks. The kilns also reduce harmful air pollutants and GHG emissions and eliminate use of wood and biomass.
Economic Productivity is generally higher in the manufacturing sector and can be further increased through energy efficiency measures. New brick kiln technologies require lower production costs due to reduced coal inputs. Mechanization improves labour productivity and economies of scale47.
Index of productivity by broad sector (1999-2000)
1990=100 Value Added Employment Productivity
Agriculture 134 109 123
Industry 187 91 205
Services 150 154 98
Total 153 116 132
Reliable estimates exist for very few energy efficient activities in the manufacturing sector. Estimate of core environment-related jobs in the manufacturing sector are shown in Table 4.20. Around 11,000 direct jobs were identified.
44 Cogeneration (also called combined heat and power, or CHP) is the use of a heat engine or a power station to simultaneously generate both electricity and useful heat. Alternately, organic waste generated in the production process is recycled as input fuel to feed back into the production process. Cogeneration is one of the most common forms of energy recycling.
45 Ongoing Combined Development Mechanism projects in Bangladesh http://cdmbangladesh.net/on_going_projects.htm
46 Renewable Energy and Environmental Information Network (REEIN) http://www.reein.org/factsheet_ret/brick_kiln.htm 47 Ibid
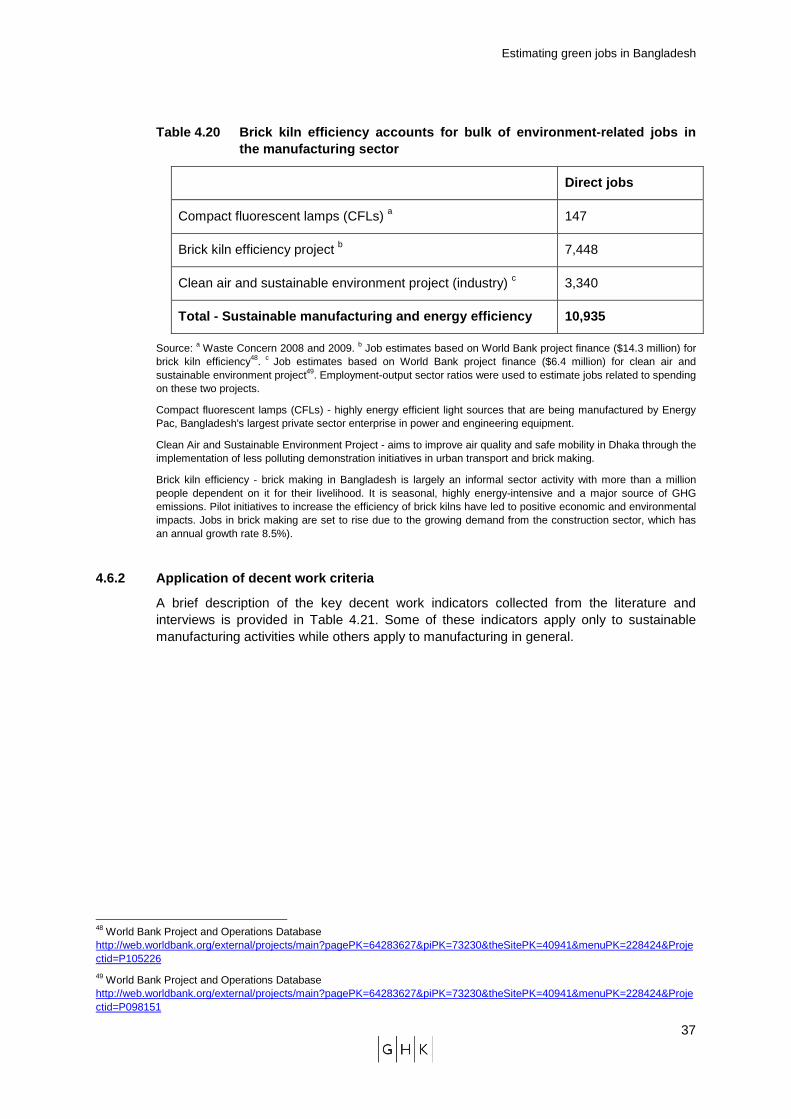
Estimating green jobs in Bangladesh
37
Table 4.20 Brick kiln efficiency accounts for bulk of environment-related jobs in the manufacturing sector
Direct jobs
Compact fluorescent lamps (CFLs) a 147
Brick kiln efficiency project b 7,448
Clean air and sustainable environment project (industry) c 3,340
Total - Sustainable manufacturing and energy effici ency 10,935
Source: a Waste Concern 2008 and 2009. b Job estimates based on World Bank project finance ($14.3 million) for brick kiln efficiency48. c Job estimates based on World Bank project finance ($6.4 million) for clean air and sustainable environment project49. Employment-output sector ratios were used to estimate jobs related to spending on these two projects.
Compact fluorescent lamps (CFLs) - highly energy efficient light sources that are being manufactured by Energy Pac, Bangladesh's largest private sector enterprise in power and engineering equipment.
Clean Air and Sustainable Environment Project - aims to improve air quality and safe mobility in Dhaka through the implementation of less polluting demonstration initiatives in urban transport and brick making.
Brick kiln efficiency - brick making in Bangladesh is largely an informal sector activity with more than a million people dependent on it for their livelihood. It is seasonal, highly energy-intensive and a major source of GHG emissions. Pilot initiatives to increase the efficiency of brick kilns have led to positive economic and environmental impacts. Jobs in brick making are set to rise due to the growing demand from the construction sector, which has an annual growth rate 8.5%).
4.6.2 Application of decent work criteria
A brief description of the key decent work indicators collected from the literature and interviews is provided in Table 4.21. Some of these indicators apply only to sustainable manufacturing activities while others apply to manufacturing in general.
48 World Bank Project and Operations Database http://web.worldbank.org/external/projects/main?pagePK=64283627&piPK=73230&theSitePK=40941&menuPK=228424&Projectid=P105226
49 World Bank Project and Operations Database http://web.worldbank.org/external/projects/main?pagePK=64283627&piPK=73230&theSitePK=40941&menuPK=228424&Projectid=P098151
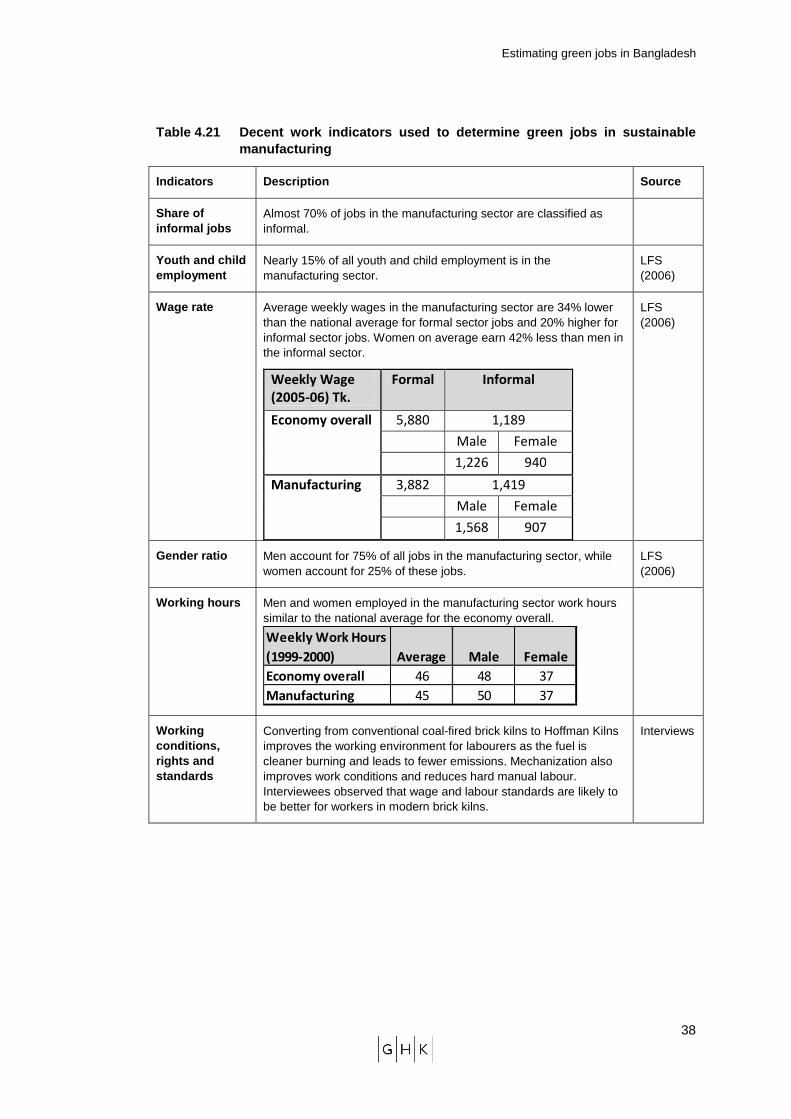
Estimating green jobs in Bangladesh
38
Table 4.21 Decent work indicators used to determine green jobs in sustainable manufacturing
Indicators Description Source
Share of informal jobs
Almost 70% of jobs in the manufacturing sector are classified as informal.
Youth and child employment
Nearly 15% of all youth and child employment is in the manufacturing sector.
LFS (2006)
Wage rate Average weekly wages in the manufacturing sector are 34% lower than the national average for formal sector jobs and 20% higher for informal sector jobs. Women on average earn 42% less than men in the informal sector.
Weekly Wage
(2005-06) Tk.
Formal Informal
Economy overall 5,880 1,189
Male Female
1,226 940
Manufacturing 3,882 1,419
Male Female
1,568 907
LFS (2006)
Gender ratio Men account for 75% of all jobs in the manufacturing sector, while women account for 25% of these jobs.
LFS (2006)
Working hours Men and women employed in the manufacturing sector work hours similar to the national average for the economy overall.
Weekly Work Hours
(1999-2000) Average Male Female
Economy overall 46 48 37
Manufacturing 45 50 37
Working conditions, rights and standards
Converting from conventional coal-fired brick kilns to Hoffman Kilns improves the working environment for labourers as the fuel is cleaner burning and leads to fewer emissions. Mechanization also improves work conditions and reduces hard manual labour. Interviewees observed that wage and labour standards are likely to be better for workers in modern brick kilns.
Interviews
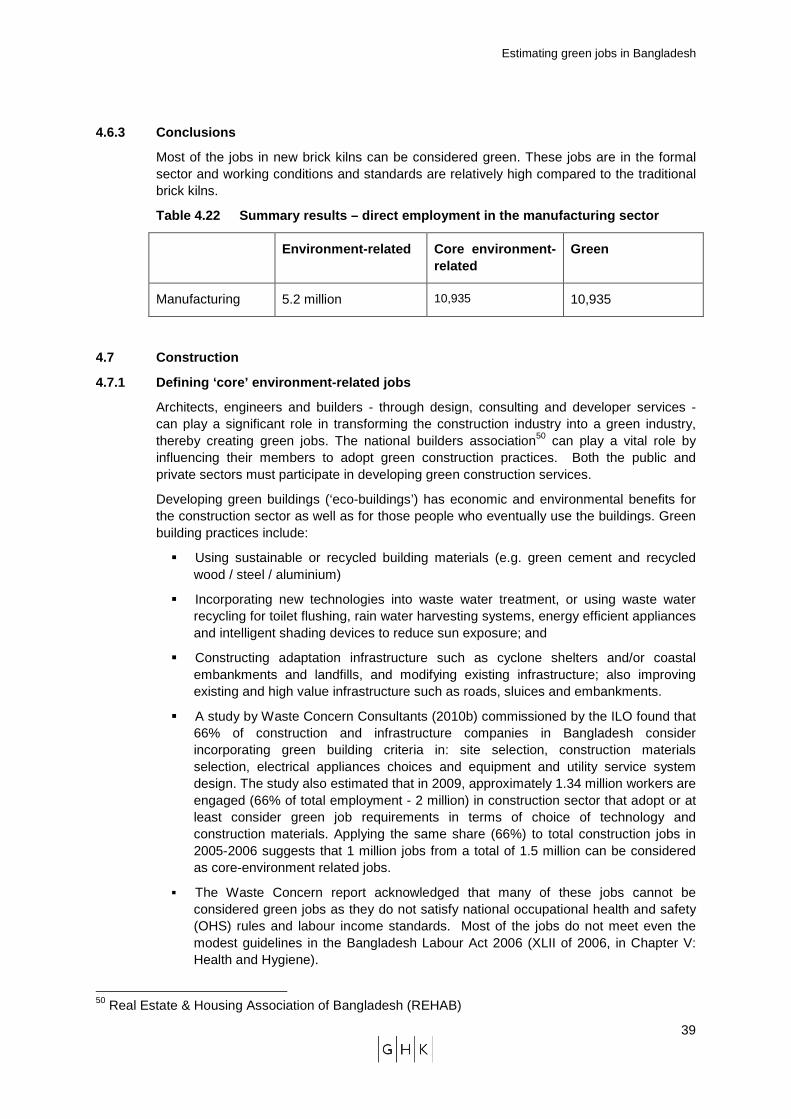
Estimating green jobs in Bangladesh
39
4.6.3 Conclusions
Most of the jobs in new brick kilns can be considered green. These jobs are in the formal sector and working conditions and standards are relatively high compared to the traditional brick kilns.
Table 4.22 Summary results – direct employment in t he manufacturing sector
Environment-related Core environment-related
Green
Manufacturing 5.2 million 10,935 10,935
4.7 Construction
4.7.1 Defining ‘core’ environment-related jobs
Architects, engineers and builders - through design, consulting and developer services - can play a significant role in transforming the construction industry into a green industry, thereby creating green jobs. The national builders association50 can play a vital role by influencing their members to adopt green construction practices. Both the public and private sectors must participate in developing green construction services.
Developing green buildings (‘eco-buildings’) has economic and environmental benefits for the construction sector as well as for those people who eventually use the buildings. Green building practices include:
� Using sustainable or recycled building materials (e.g. green cement and recycled wood / steel / aluminium)
� Incorporating new technologies into waste water treatment, or using waste water recycling for toilet flushing, rain water harvesting systems, energy efficient appliances and intelligent shading devices to reduce sun exposure; and
� Constructing adaptation infrastructure such as cyclone shelters and/or coastal embankments and landfills, and modifying existing infrastructure; also improving existing and high value infrastructure such as roads, sluices and embankments.
� A study by Waste Concern Consultants (2010b) commissioned by the ILO found that 66% of construction and infrastructure companies in Bangladesh consider incorporating green building criteria in: site selection, construction materials selection, electrical appliances choices and equipment and utility service system design. The study also estimated that in 2009, approximately 1.34 million workers are engaged (66% of total employment - 2 million) in construction sector that adopt or at least consider green job requirements in terms of choice of technology and construction materials. Applying the same share (66%) to total construction jobs in 2005-2006 suggests that 1 million jobs from a total of 1.5 million can be considered as core-environment related jobs.
� The Waste Concern report acknowledged that many of these jobs cannot be considered green jobs as they do not satisfy national occupational health and safety (OHS) rules and labour income standards. Most of the jobs do not meet even the modest guidelines in the Bangladesh Labour Act 2006 (XLII of 2006, in Chapter V: Health and Hygiene).
50 Real Estate & Housing Association of Bangladesh (REHAB)
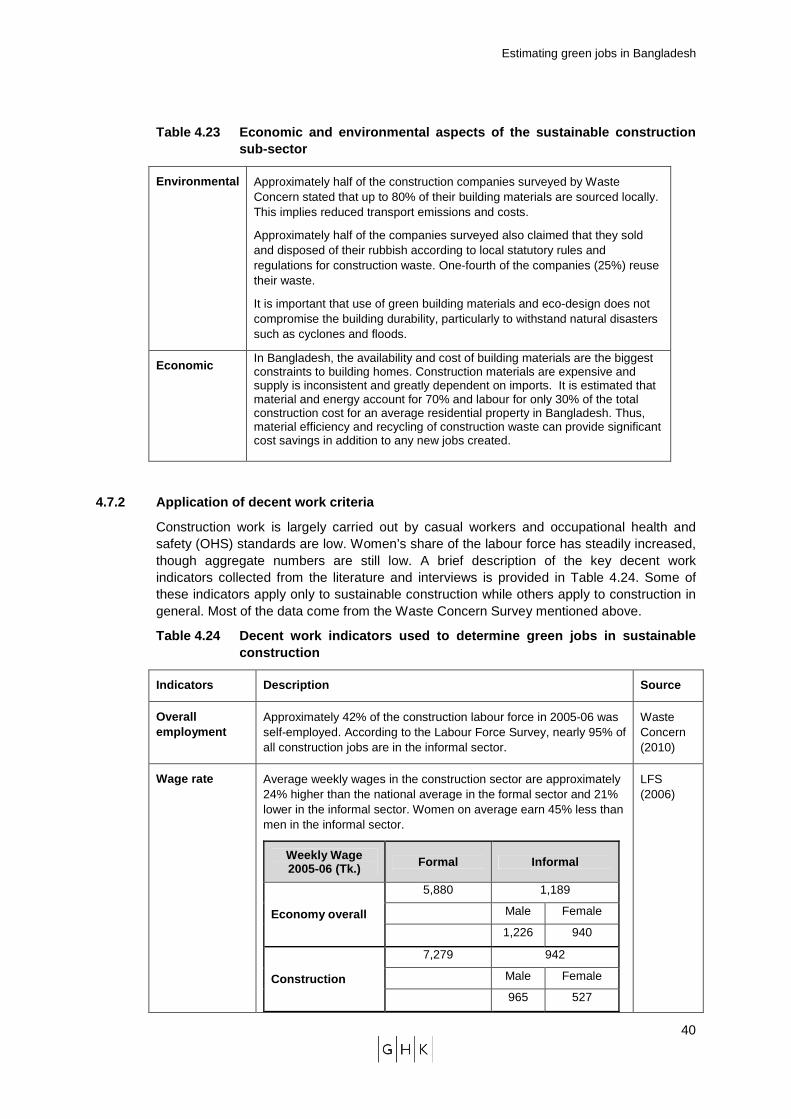
Estimating green jobs in Bangladesh
40
Table 4.23 Economic and environmental aspects of th e sustainable construction sub-sector
Environmental Approximately half of the construction companies surveyed by Waste Concern stated that up to 80% of their building materials are sourced locally. This implies reduced transport emissions and costs.
Approximately half of the companies surveyed also claimed that they sold and disposed of their rubbish according to local statutory rules and regulations for construction waste. One-fourth of the companies (25%) reuse their waste.
It is important that use of green building materials and eco-design does not compromise the building durability, particularly to withstand natural disasters such as cyclones and floods.
Economic In Bangladesh, the availability and cost of building materials are the biggest constraints to building homes. Construction materials are expensive and supply is inconsistent and greatly dependent on imports. It is estimated that material and energy account for 70% and labour for only 30% of the total construction cost for an average residential property in Bangladesh. Thus, material efficiency and recycling of construction waste can provide significant cost savings in addition to any new jobs created.
4.7.2 Application of decent work criteria
Construction work is largely carried out by casual workers and occupational health and safety (OHS) standards are low. Women’s share of the labour force has steadily increased, though aggregate numbers are still low. A brief description of the key decent work indicators collected from the literature and interviews is provided in Table 4.24. Some of these indicators apply only to sustainable construction while others apply to construction in general. Most of the data come from the Waste Concern Survey mentioned above.
Table 4.24 Decent work indicators used to determine green jobs in sustainable construction
Indicators Description Source
Overall employment
Approximately 42% of the construction labour force in 2005-06 was self-employed. According to the Labour Force Survey, nearly 95% of all construction jobs are in the informal sector.
Waste Concern (2010)
Wage rate Average weekly wages in the construction sector are approximately 24% higher than the national average in the formal sector and 21% lower in the informal sector. Women on average earn 45% less than men in the informal sector.
Weekly Wage 2005-06 (Tk.) Formal Informal
Economy overall
5,880 1,189
Male Female
1,226 940
Construction
7,279 942
Male Female
965 527
LFS (2006)
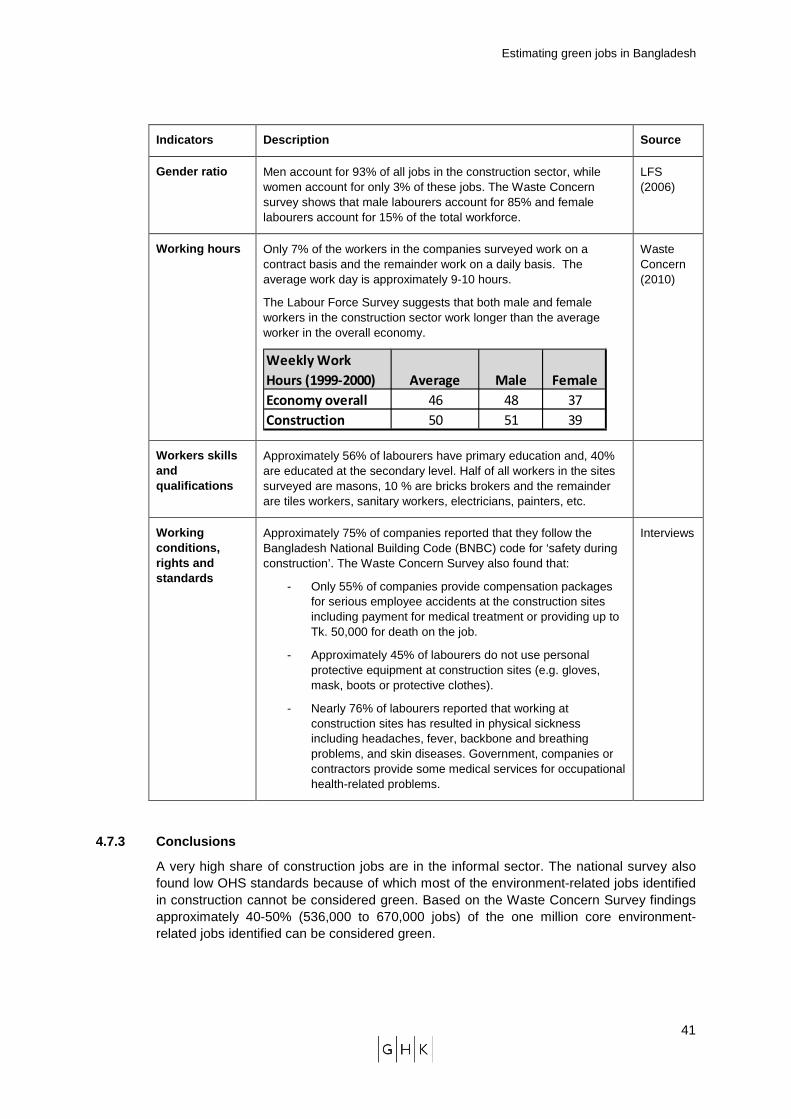
Estimating green jobs in Bangladesh
41
Indicators Description Source
Gender ratio Men account for 93% of all jobs in the construction sector, while women account for only 3% of these jobs. The Waste Concern survey shows that male labourers account for 85% and female labourers account for 15% of the total workforce.
LFS (2006)
Working hours Only 7% of the workers in the companies surveyed work on a contract basis and the remainder work on a daily basis. The average work day is approximately 9-10 hours.
The Labour Force Survey suggests that both male and female workers in the construction sector work longer than the average worker in the overall economy.
Weekly Work
Hours (1999-2000) Average Male Female
Economy overall 46 48 37
Construction 50 51 39
Waste Concern (2010)
Workers skills and qualifications
Approximately 56% of labourers have primary education and, 40% are educated at the secondary level. Half of all workers in the sites surveyed are masons, 10 % are bricks brokers and the remainder are tiles workers, sanitary workers, electricians, painters, etc.
Working conditions, rights and standards
Approximately 75% of companies reported that they follow the Bangladesh National Building Code (BNBC) code for ‘safety during construction’. The Waste Concern Survey also found that:
- Only 55% of companies provide compensation packages for serious employee accidents at the construction sites including payment for medical treatment or providing up to Tk. 50,000 for death on the job.
- Approximately 45% of labourers do not use personal protective equipment at construction sites (e.g. gloves, mask, boots or protective clothes).
- Nearly 76% of labourers reported that working at construction sites has resulted in physical sickness including headaches, fever, backbone and breathing problems, and skin diseases. Government, companies or contractors provide some medical services for occupational health-related problems.
Interviews
4.7.3 Conclusions
A very high share of construction jobs are in the informal sector. The national survey also found low OHS standards because of which most of the environment-related jobs identified in construction cannot be considered green. Based on the Waste Concern Survey findings approximately 40-50% (536,000 to 670,000 jobs) of the one million core environment-related jobs identified can be considered green.
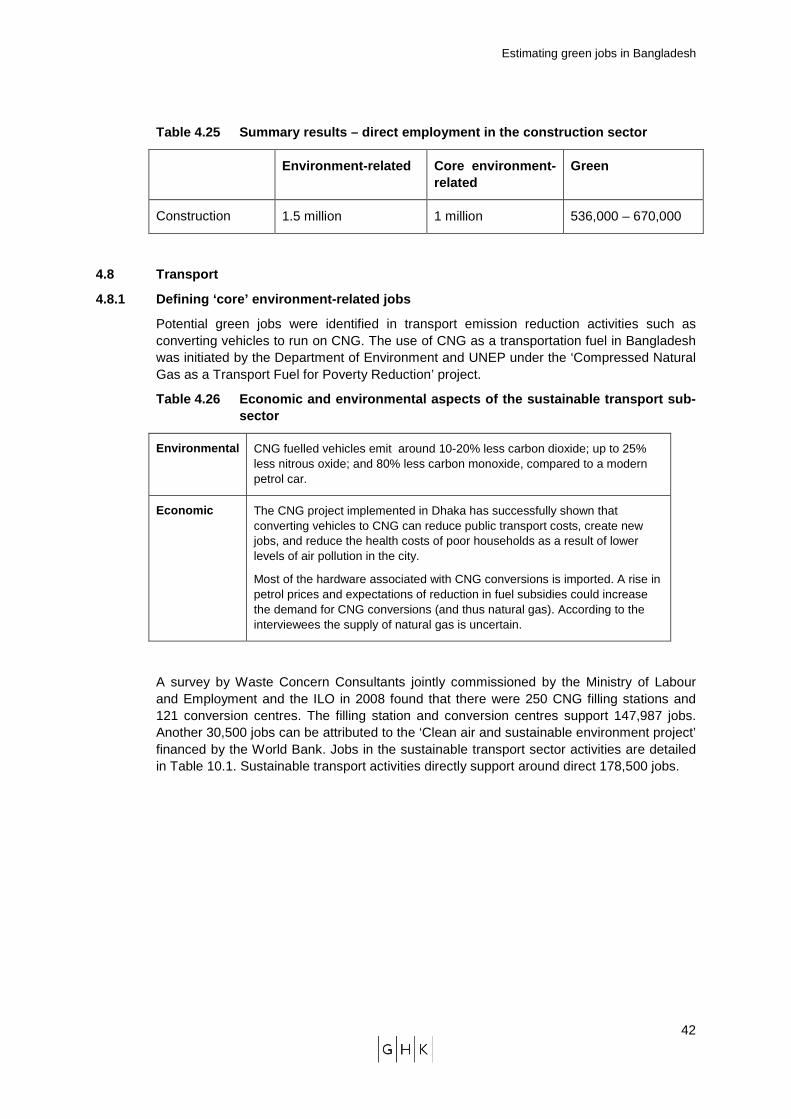
Estimating green jobs in Bangladesh
42
Table 4.25 Summary results – direct employment in t he construction sector
Environment-related Core environment-related
Green
Construction 1.5 million 1 million 536,000 – 670,000
4.8 Transport
4.8.1 Defining ‘core’ environment-related jobs
Potential green jobs were identified in transport emission reduction activities such as converting vehicles to run on CNG. The use of CNG as a transportation fuel in Bangladesh was initiated by the Department of Environment and UNEP under the ‘Compressed Natural Gas as a Transport Fuel for Poverty Reduction’ project.
Table 4.26 Economic and environmental aspects of th e sustainable transport sub-sector
Environmental CNG fuelled vehicles emit around 10-20% less carbon dioxide; up to 25% less nitrous oxide; and 80% less carbon monoxide, compared to a modern petrol car.
Economic The CNG project implemented in Dhaka has successfully shown that converting vehicles to CNG can reduce public transport costs, create new jobs, and reduce the health costs of poor households as a result of lower levels of air pollution in the city.
Most of the hardware associated with CNG conversions is imported. A rise in petrol prices and expectations of reduction in fuel subsidies could increase the demand for CNG conversions (and thus natural gas). According to the interviewees the supply of natural gas is uncertain.
A survey by Waste Concern Consultants jointly commissioned by the Ministry of Labour and Employment and the ILO in 2008 found that there were 250 CNG filling stations and 121 conversion centres. The filling station and conversion centres support 147,987 jobs. Another 30,500 jobs can be attributed to the ‘Clean air and sustainable environment project’ financed by the World Bank. Jobs in the sustainable transport sector activities are detailed in Table 10.1. Sustainable transport activities directly support around direct 178,500 jobs.
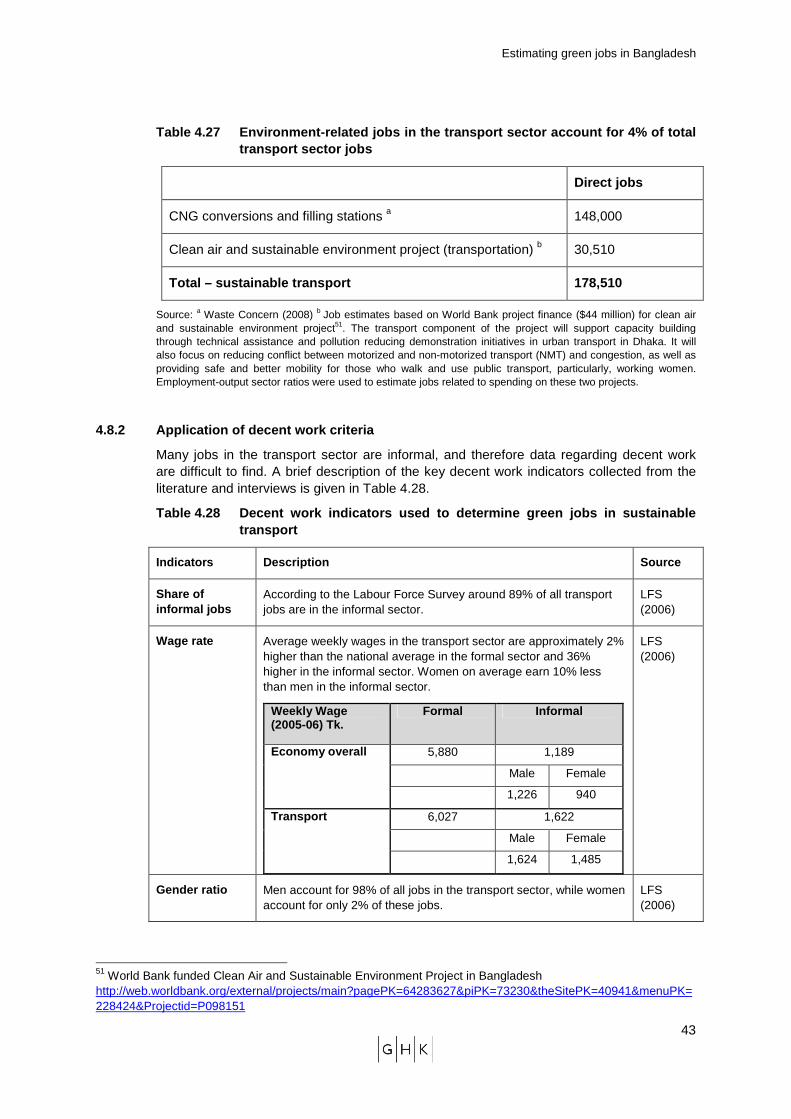
Estimating green jobs in Bangladesh
43
Table 4.27 Environment-related jobs in the transpor t sector account for 4% of total transport sector jobs
Direct jobs
CNG conversions and filling stations a 148,000
Clean air and sustainable environment project (transportation) b 30,510
Total – sustainable transport 178,510
Source: a Waste Concern (2008) b Job estimates based on World Bank project finance ($44 million) for clean air and sustainable environment project51. The transport component of the project will support capacity building through technical assistance and pollution reducing demonstration initiatives in urban transport in Dhaka. It will also focus on reducing conflict between motorized and non-motorized transport (NMT) and congestion, as well as providing safe and better mobility for those who walk and use public transport, particularly, working women. Employment-output sector ratios were used to estimate jobs related to spending on these two projects.
4.8.2 Application of decent work criteria
Many jobs in the transport sector are informal, and therefore data regarding decent work are difficult to find. A brief description of the key decent work indicators collected from the literature and interviews is given in Table 4.28.
Table 4.28 Decent work indicators used to determine green jobs in sustainable transport
Indicators Description Source
Share of informal jobs
According to the Labour Force Survey around 89% of all transport jobs are in the informal sector.
LFS (2006)
Wage rate Average weekly wages in the transport sector are approximately 2% higher than the national average in the formal sector and 36% higher in the informal sector. Women on average earn 10% less than men in the informal sector.
Weekly Wage (2005-06) Tk.
Formal Informal
Economy overall 5,880 1,189
Male Female
1,226 940
Transport 6,027 1,622
Male Female
1,624 1,485
LFS (2006)
Gender ratio Men account for 98% of all jobs in the transport sector, while women account for only 2% of these jobs.
LFS (2006)
51 World Bank funded Clean Air and Sustainable Environment Project in Bangladesh http://web.worldbank.org/external/projects/main?pagePK=64283627&piPK=73230&theSitePK=40941&menuPK=228424&Projectid=P098151
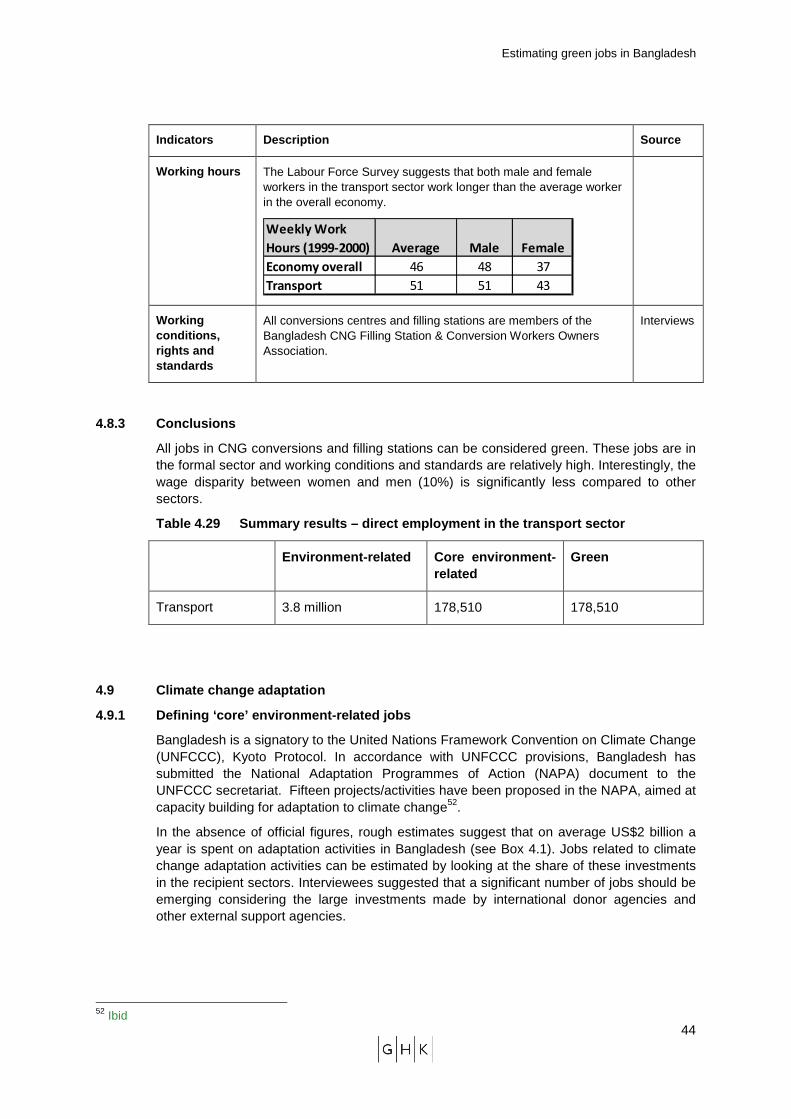
Estimating green jobs in Bangladesh
44
Indicators Description Source
Working hours The Labour Force Survey suggests that both male and female workers in the transport sector work longer than the average worker in the overall economy.
Weekly Work
Hours (1999-2000) Average Male Female
Economy overall 46 48 37
Transport 51 51 43
Working conditions, rights and standards
All conversions centres and filling stations are members of the Bangladesh CNG Filling Station & Conversion Workers Owners Association.
Interviews
4.8.3 Conclusions
All jobs in CNG conversions and filling stations can be considered green. These jobs are in the formal sector and working conditions and standards are relatively high. Interestingly, the wage disparity between women and men (10%) is significantly less compared to other sectors.
Table 4.29 Summary results – direct employment in t he transport sector
Environment-related Core environment-related
Green
Transport 3.8 million 178,510 178,510
4.9 Climate change adaptation
4.9.1 Defining ‘core’ environment-related jobs
Bangladesh is a signatory to the United Nations Framework Convention on Climate Change (UNFCCC), Kyoto Protocol. In accordance with UNFCCC provisions, Bangladesh has submitted the National Adaptation Programmes of Action (NAPA) document to the UNFCCC secretariat. Fifteen projects/activities have been proposed in the NAPA, aimed at capacity building for adaptation to climate change52.
In the absence of official figures, rough estimates suggest that on average US$2 billion a year is spent on adaptation activities in Bangladesh (see Box 4.1). Jobs related to climate change adaptation activities can be estimated by looking at the share of these investments in the recipient sectors. Interviewees suggested that a significant number of jobs should be emerging considering the large investments made by international donor agencies and other external support agencies.
52 Ibid
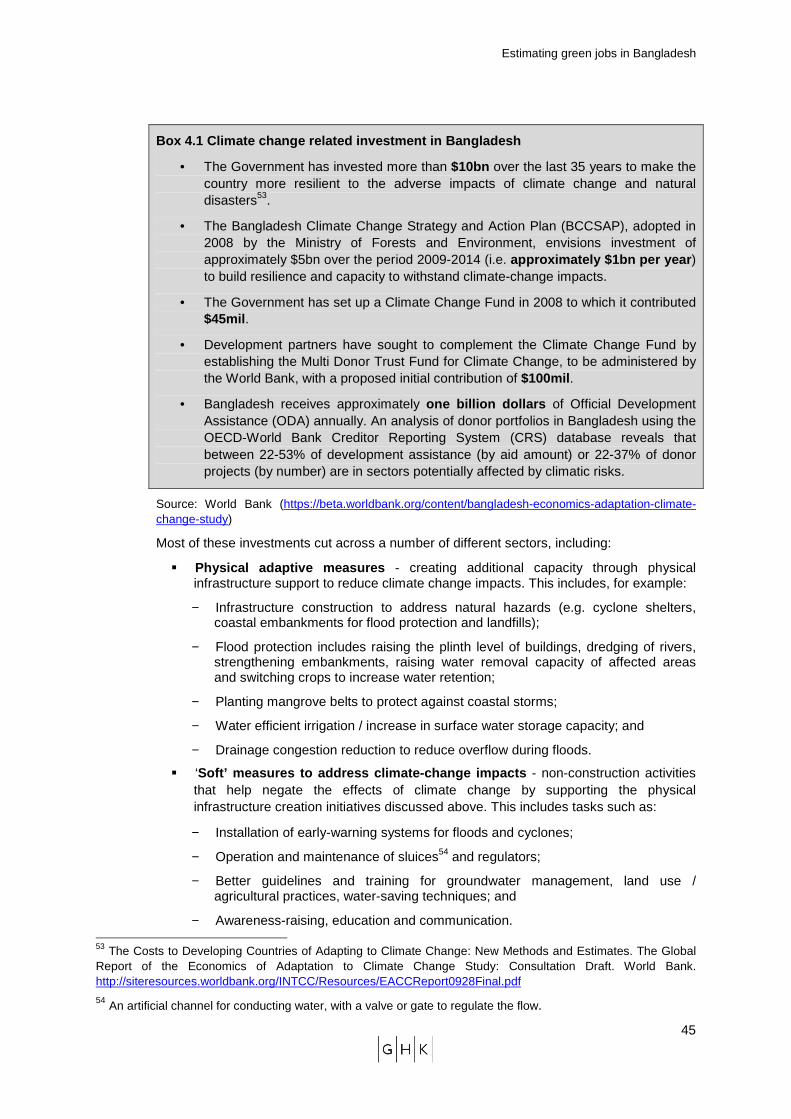
Estimating green jobs in Bangladesh
45
Box 4.1 Climate change related investment in Bangla desh
• The Government has invested more than $10bn over the last 35 years to make the country more resilient to the adverse impacts of climate change and natural disasters53.
• The Bangladesh Climate Change Strategy and Action Plan (BCCSAP), adopted in 2008 by the Ministry of Forests and Environment, envisions investment of approximately $5bn over the period 2009-2014 (i.e. approximately $1bn per year ) to build resilience and capacity to withstand climate-change impacts.
• The Government has set up a Climate Change Fund in 2008 to which it contributed $45mil .
• Development partners have sought to complement the Climate Change Fund by establishing the Multi Donor Trust Fund for Climate Change, to be administered by the World Bank, with a proposed initial contribution of $100mil .
• Bangladesh receives approximately one billion dollars of Official Development Assistance (ODA) annually. An analysis of donor portfolios in Bangladesh using the OECD-World Bank Creditor Reporting System (CRS) database reveals that between 22-53% of development assistance (by aid amount) or 22-37% of donor projects (by number) are in sectors potentially affected by climatic risks.
Source: World Bank (https://beta.worldbank.org/content/bangladesh-economics-adaptation-climate-change-study)
Most of these investments cut across a number of different sectors, including:
� Physical adaptive measures - creating additional capacity through physical infrastructure support to reduce climate change impacts. This includes, for example:
− Infrastructure construction to address natural hazards (e.g. cyclone shelters, coastal embankments for flood protection and landfills);
− Flood protection includes raising the plinth level of buildings, dredging of rivers, strengthening embankments, raising water removal capacity of affected areas and switching crops to increase water retention;
− Planting mangrove belts to protect against coastal storms;
− Water efficient irrigation / increase in surface water storage capacity; and
− Drainage congestion reduction to reduce overflow during floods.
� ‘Soft’ measures to address climate-change impacts - non-construction activities that help negate the effects of climate change by supporting the physical infrastructure creation initiatives discussed above. This includes tasks such as:
− Installation of early-warning systems for floods and cyclones;
− Operation and maintenance of sluices54 and regulators;
− Better guidelines and training for groundwater management, land use / agricultural practices, water-saving techniques; and
− Awareness-raising, education and communication. 53 The Costs to Developing Countries of Adapting to Climate Change: New Methods and Estimates. The Global Report of the Economics of Adaptation to Climate Change Study: Consultation Draft. World Bank. http://siteresources.worldbank.org/INTCC/Resources/EACCReport0928Final.pdf
54 An artificial channel for conducting water, with a valve or gate to regulate the flow.
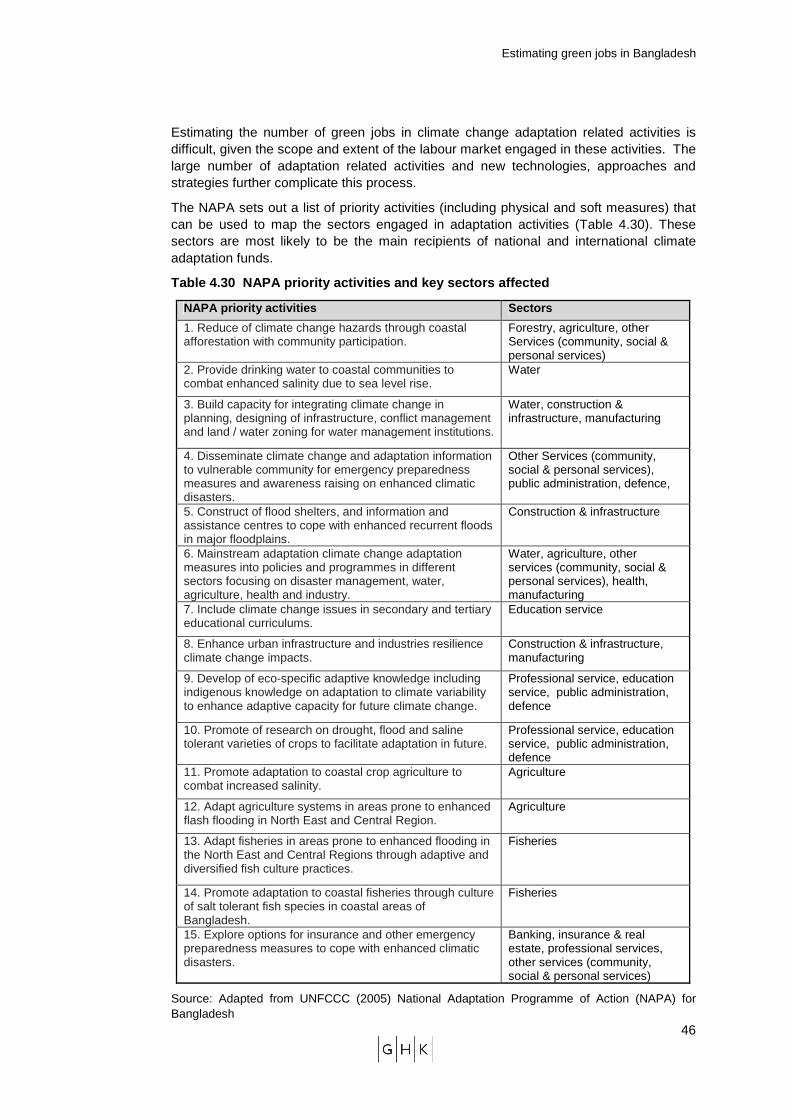
Estimating green jobs in Bangladesh
46
Estimating the number of green jobs in climate change adaptation related activities is difficult, given the scope and extent of the labour market engaged in these activities. The large number of adaptation related activities and new technologies, approaches and strategies further complicate this process.
The NAPA sets out a list of priority activities (including physical and soft measures) that can be used to map the sectors engaged in adaptation activities (Table 4.30). These sectors are most likely to be the main recipients of national and international climate adaptation funds.
Table 4.30 NAPA priority activities and key sector s affected
NAPA priority activities Sectors
1. Reduce of climate change hazards through coastal afforestation with community participation.
Forestry, agriculture, other Services (community, social & personal services)
2. Provide drinking water to coastal communities to combat enhanced salinity due to sea level rise.
Water
3. Build capacity for integrating climate change in planning, designing of infrastructure, conflict management and land / water zoning for water management institutions.
Water, construction & infrastructure, manufacturing
4. Disseminate climate change and adaptation information to vulnerable community for emergency preparedness measures and awareness raising on enhanced climatic disasters.
Other Services (community, social & personal services), public administration, defence,
5. Construct of flood shelters, and information and assistance centres to cope with enhanced recurrent floods in major floodplains.
Construction & infrastructure
6. Mainstream adaptation climate change adaptation measures into policies and programmes in different sectors focusing on disaster management, water, agriculture, health and industry.
Water, agriculture, other services (community, social & personal services), health, manufacturing
7. Include climate change issues in secondary and tertiary educational curriculums.
Education service
8. Enhance urban infrastructure and industries resilience climate change impacts.
Construction & infrastructure, manufacturing
9. Develop of eco-specific adaptive knowledge including indigenous knowledge on adaptation to climate variability to enhance adaptive capacity for future climate change.
Professional service, education service, public administration, defence
10. Promote of research on drought, flood and saline tolerant varieties of crops to facilitate adaptation in future.
Professional service, education service, public administration, defence
11. Promote adaptation to coastal crop agriculture to combat increased salinity.
Agriculture
12. Adapt agriculture systems in areas prone to enhanced flash flooding in North East and Central Region.
Agriculture
13. Adapt fisheries in areas prone to enhanced flooding in the North East and Central Regions through adaptive and diversified fish culture practices.
Fisheries
14. Promote adaptation to coastal fisheries through culture of salt tolerant fish species in coastal areas of Bangladesh.
Fisheries
15. Explore options for insurance and other emergency preparedness measures to cope with enhanced climatic disasters.
Banking, insurance & real estate, professional services, other services (community, social & personal services)
Source: Adapted from UNFCCC (2005) National Adaptation Programme of Action (NAPA) for Bangladesh
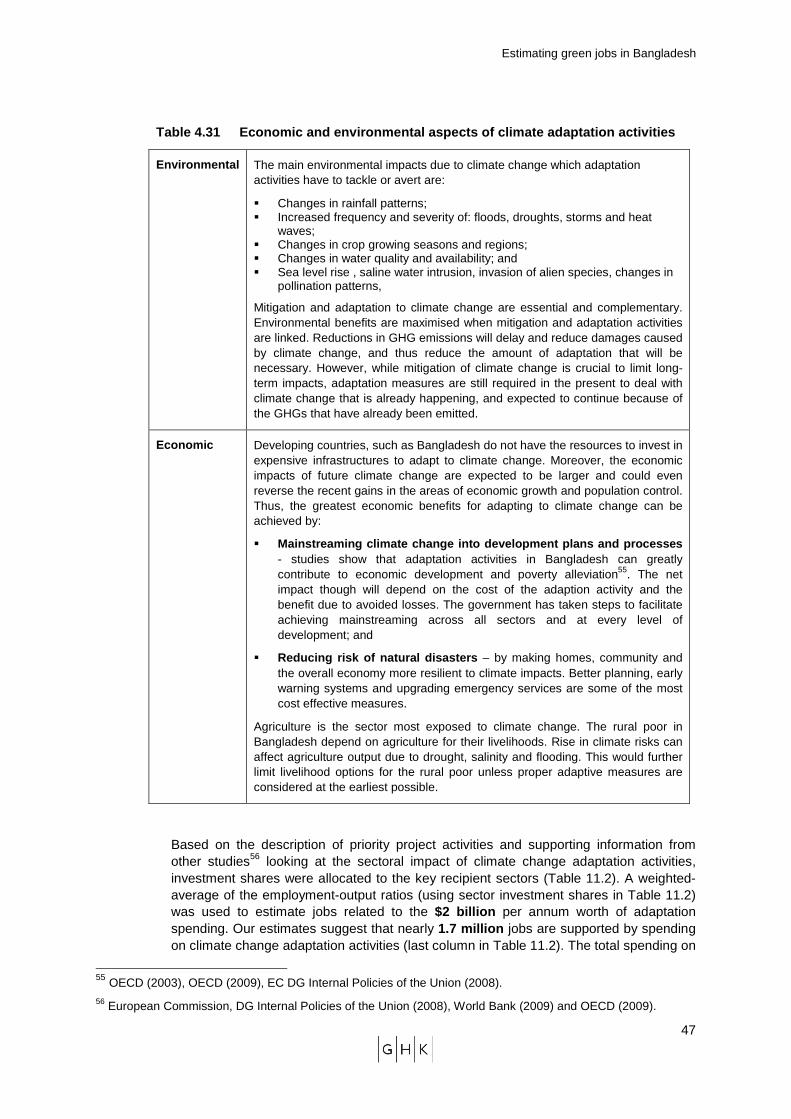
Estimating green jobs in Bangladesh
47
Table 4.31 Economic and environmental aspects of cl imate adaptation activities
Environmental The main environmental impacts due to climate change which adaptation activities have to tackle or avert are:
� Changes in rainfall patterns; � Increased frequency and severity of: floods, droughts, storms and heat
waves; � Changes in crop growing seasons and regions; � Changes in water quality and availability; and � Sea level rise , saline water intrusion, invasion of alien species, changes in
pollination patterns,
Mitigation and adaptation to climate change are essential and complementary. Environmental benefits are maximised when mitigation and adaptation activities are linked. Reductions in GHG emissions will delay and reduce damages caused by climate change, and thus reduce the amount of adaptation that will be necessary. However, while mitigation of climate change is crucial to limit long-term impacts, adaptation measures are still required in the present to deal with climate change that is already happening, and expected to continue because of the GHGs that have already been emitted.
Economic Developing countries, such as Bangladesh do not have the resources to invest in expensive infrastructures to adapt to climate change. Moreover, the economic impacts of future climate change are expected to be larger and could even reverse the recent gains in the areas of economic growth and population control. Thus, the greatest economic benefits for adapting to climate change can be achieved by:
� Mainstreaming climate change into development plans and processes - studies show that adaptation activities in Bangladesh can greatly contribute to economic development and poverty alleviation55. The net impact though will depend on the cost of the adaption activity and the benefit due to avoided losses. The government has taken steps to facilitate achieving mainstreaming across all sectors and at every level of development; and
� Reducing risk of natural disasters – by making homes, community and the overall economy more resilient to climate impacts. Better planning, early warning systems and upgrading emergency services are some of the most cost effective measures.
Agriculture is the sector most exposed to climate change. The rural poor in Bangladesh depend on agriculture for their livelihoods. Rise in climate risks can affect agriculture output due to drought, salinity and flooding. This would further limit livelihood options for the rural poor unless proper adaptive measures are considered at the earliest possible.
Based on the description of priority project activities and supporting information from other studies56 looking at the sectoral impact of climate change adaptation activities, investment shares were allocated to the key recipient sectors (Table 11.2). A weighted-average of the employment-output ratios (using sector investment shares in Table 11.2) was used to estimate jobs related to the $2 billion per annum worth of adaptation spending. Our estimates suggest that nearly 1.7 million jobs are supported by spending on climate change adaptation activities (last column in Table 11.2). The total spending on
55 OECD (2003), OECD (2009), EC DG Internal Policies of the Union (2008). 56 European Commission, DG Internal Policies of the Union (2008), World Bank (2009) and OECD (2009).
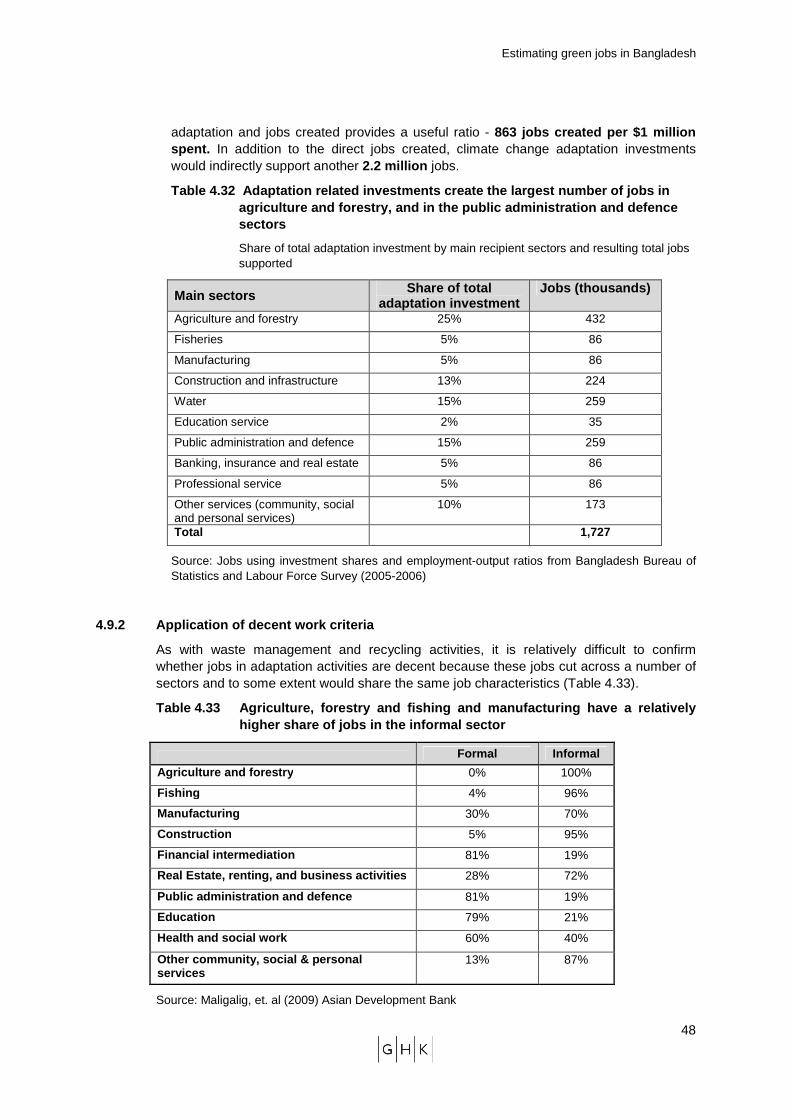
Estimating green jobs in Bangladesh
48
adaptation and jobs created provides a useful ratio - 863 jobs created per $1 million spent. In addition to the direct jobs created, climate change adaptation investments would indirectly support another 2.2 million jobs.
Table 4.32 Adaptation related investments create t he largest number of jobs in agriculture and forestry, and in the public adminis tration and defence sectors
Share of total adaptation investment by main recipient sectors and resulting total jobs supported
Main sectors Share of total adaptation investment
Jobs (thousands)
Agriculture and forestry 25% 432
Fisheries 5% 86
Manufacturing 5% 86
Construction and infrastructure 13% 224
Water 15% 259
Education service 2% 35
Public administration and defence 15% 259
Banking, insurance and real estate 5% 86
Professional service 5% 86
Other services (community, social and personal services)
10% 173
Total 1,727
Source: Jobs using investment shares and employment-output ratios from Bangladesh Bureau of Statistics and Labour Force Survey (2005-2006)
4.9.2 Application of decent work criteria
As with waste management and recycling activities, it is relatively difficult to confirm whether jobs in adaptation activities are decent because these jobs cut across a number of sectors and to some extent would share the same job characteristics (Table 4.33).
Table 4.33 Agriculture, forestry and fishing and ma nufacturing have a relatively higher share of jobs in the informal sector
Formal Informal
Agriculture and forestry 0% 100%
Fishing 4% 96%
Manufacturing 30% 70%
Construction 5% 95%
Financial intermediation 81% 19%
Real Estate, renting, and business activities 28% 72%
Public administration and defence 81% 19%
Education 79% 21%
Health and social work 60% 40%
Other community, social & personal services
13% 87%
Source: Maligalig, et. al (2009) Asian Development Bank
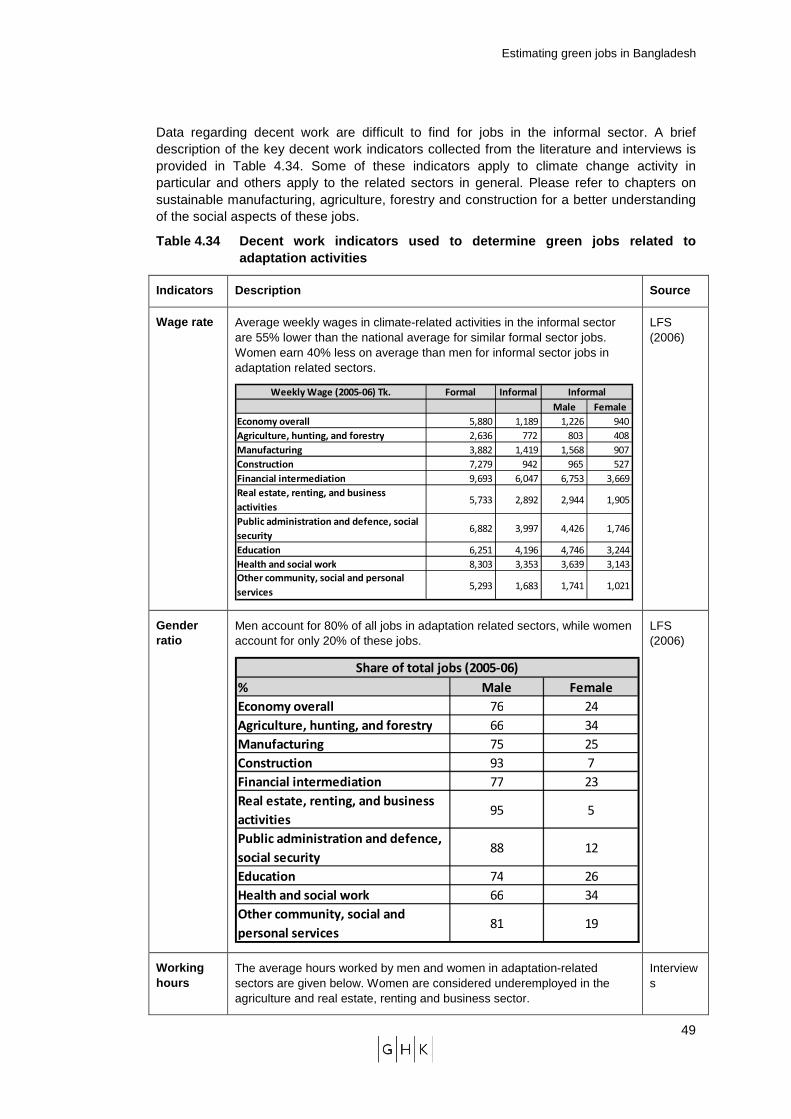
Estimating green jobs in Bangladesh
49
Data regarding decent work are difficult to find for jobs in the informal sector. A brief description of the key decent work indicators collected from the literature and interviews is provided in Table 4.34. Some of these indicators apply to climate change activity in particular and others apply to the related sectors in general. Please refer to chapters on sustainable manufacturing, agriculture, forestry and construction for a better understanding of the social aspects of these jobs.
Table 4.34 Decent work indicators used to determine green jobs related to adaptation activities
Indicators Description Source
Wage rate Average weekly wages in climate-related activities in the informal sector are 55% lower than the national average for similar formal sector jobs. Women earn 40% less on average than men for informal sector jobs in adaptation related sectors.
Weekly Wage (2005-06) Tk. Formal Informal
Male Female
Economy overall 5,880 1,189 1,226 940
Agriculture, hunting, and forestry 2,636 772 803 408
Manufacturing 3,882 1,419 1,568 907
Construction 7,279 942 965 527
Financial intermediation 9,693 6,047 6,753 3,669
Real estate, renting, and business
activities 5,733 2,892 2,944 1,905
Public administration and defence, social
security 6,882 3,997 4,426 1,746
Education 6,251 4,196 4,746 3,244
Health and social work 8,303 3,353 3,639 3,143
Other community, social and personal
services 5,293 1,683 1,741 1,021
Informal
LFS (2006)
Gender ratio
Men account for 80% of all jobs in adaptation related sectors, while women account for only 20% of these jobs.
% Male Female
Economy overall 76 24
Agriculture, hunting, and forestry 66 34
Manufacturing 75 25
Construction 93 7
Financial intermediation 77 23
Real estate, renting, and business
activities95 5
Public administration and defence,
social security88 12
Education 74 26
Health and social work 66 34
Other community, social and
personal services81 19
Share of total jobs (2005-06)
LFS (2006)
Working hours
The average hours worked by men and women in adaptation-related sectors are given below. Women are considered underemployed in the agriculture and real estate, renting and business sector.
Interviews
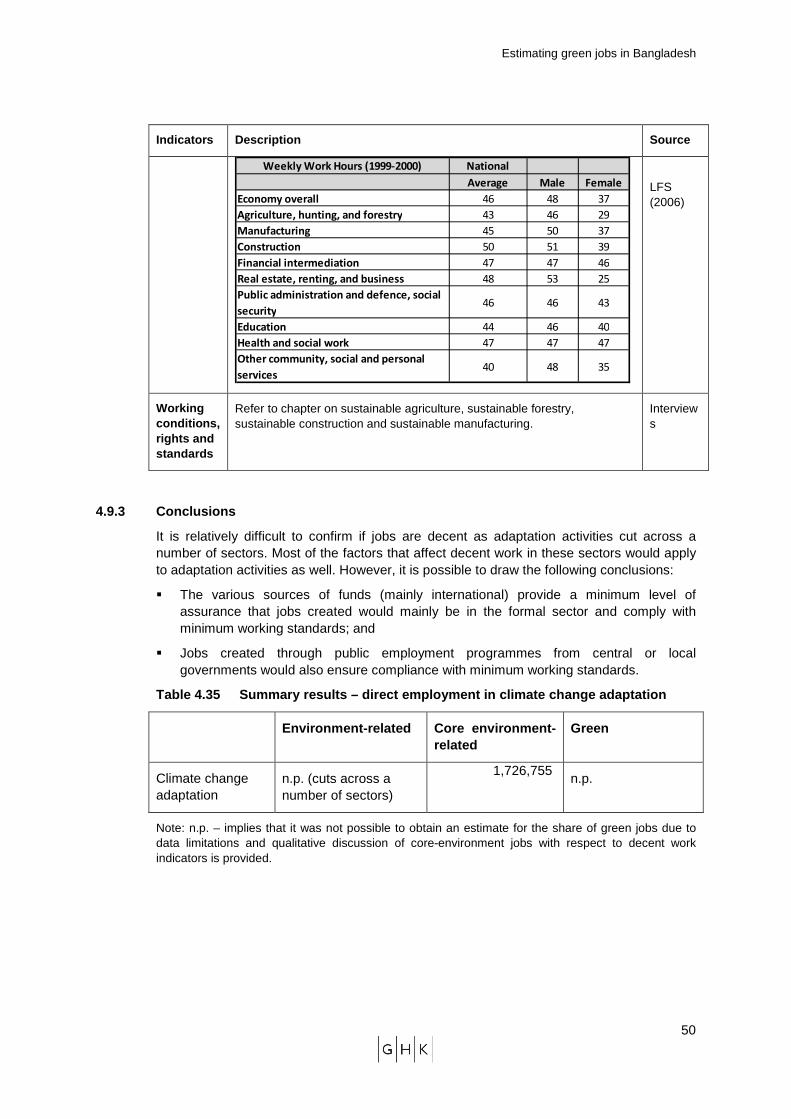
Estimating green jobs in Bangladesh
50
Indicators Description Source
Weekly Work Hours (1999-2000) National
Average Male Female
Economy overall 46 48 37
Agriculture, hunting, and forestry 43 46 29
Manufacturing 45 50 37
Construction 50 51 39
Financial intermediation 47 47 46
Real estate, renting, and business 48 53 25
Public administration and defence, social
security46 46 43
Education 44 46 40
Health and social work 47 47 47
Other community, social and personal
services40 48 35
LFS (2006)
Working conditions, rights and standards
Refer to chapter on sustainable agriculture, sustainable forestry, sustainable construction and sustainable manufacturing.
Interviews
4.9.3 Conclusions
It is relatively difficult to confirm if jobs are decent as adaptation activities cut across a number of sectors. Most of the factors that affect decent work in these sectors would apply to adaptation activities as well. However, it is possible to draw the following conclusions:
� The various sources of funds (mainly international) provide a minimum level of assurance that jobs created would mainly be in the formal sector and comply with minimum working standards; and
� Jobs created through public employment programmes from central or local governments would also ensure compliance with minimum working standards.
Table 4.35 Summary results – direct employment in c limate change adaptation
Environment-related Core environment-related
Green
Climate change adaptation
n.p. (cuts across a number of sectors)
1,726,755
n.p.
Note: n.p. – implies that it was not possible to obtain an estimate for the share of green jobs due to data limitations and qualitative discussion of core-environment jobs with respect to decent work indicators is provided.
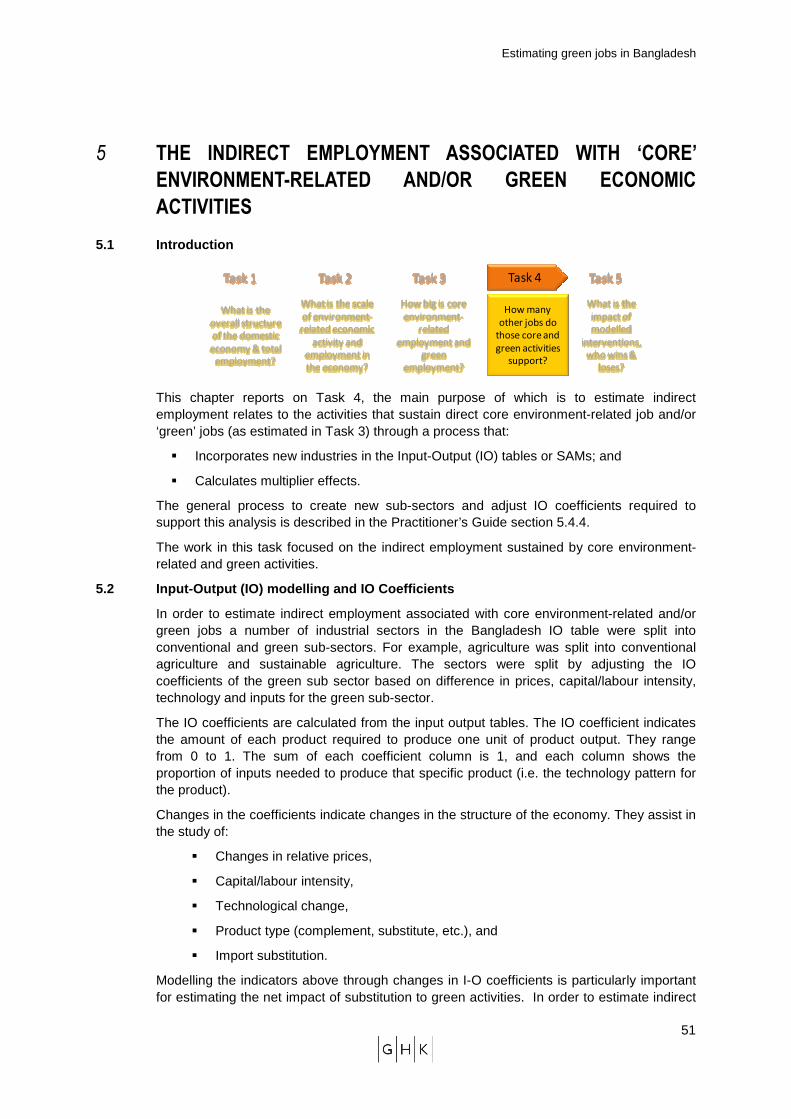
Estimating green jobs in Bangladesh
51
5 THE INDIRECT EMPLOYMENT ASSOCIATED WITH ‘CORE’
ENVIRONMENT-RELATED AND/OR GREEN ECONOMIC
ACTIVITIES
5.1 Introduction
What is the
overall structure
of the domestic
economy & total
employment?
Task 1
What is the scale
of environment-
related economic
activity and
employment in
the economy?
Task 2
How big is core
environment-
related
employment and
green
employment?
Task 3
How many
other jobs do
those core and
green activities
support?
Task 4
What is the
impact of
modelled
interventions,
who wins &
loses?
Task 5
This chapter reports on Task 4, the main purpose of which is to estimate indirect employment relates to the activities that sustain direct core environment-related job and/or ‘green’ jobs (as estimated in Task 3) through a process that:
� Incorporates new industries in the Input-Output (IO) tables or SAMs; and
� Calculates multiplier effects.
The general process to create new sub-sectors and adjust IO coefficients required to support this analysis is described in the Practitioner’s Guide section 5.4.4.
The work in this task focused on the indirect employment sustained by core environment-related and green activities.
5.2 Input-Output (IO) modelling and IO Coefficients
In order to estimate indirect employment associated with core environment-related and/or green jobs a number of industrial sectors in the Bangladesh IO table were split into conventional and green sub-sectors. For example, agriculture was split into conventional agriculture and sustainable agriculture. The sectors were split by adjusting the IO coefficients of the green sub sector based on difference in prices, capital/labour intensity, technology and inputs for the green sub-sector.
The IO coefficients are calculated from the input output tables. The IO coefficient indicates the amount of each product required to produce one unit of product output. They range from 0 to 1. The sum of each coefficient column is 1, and each column shows the proportion of inputs needed to produce that specific product (i.e. the technology pattern for the product).
Changes in the coefficients indicate changes in the structure of the economy. They assist in the study of:
� Changes in relative prices,
� Capital/labour intensity,
� Technological change,
� Product type (complement, substitute, etc.), and
� Import substitution.
Modelling the indicators above through changes in I-O coefficients is particularly important for estimating the net impact of substitution to green activities. In order to estimate indirect
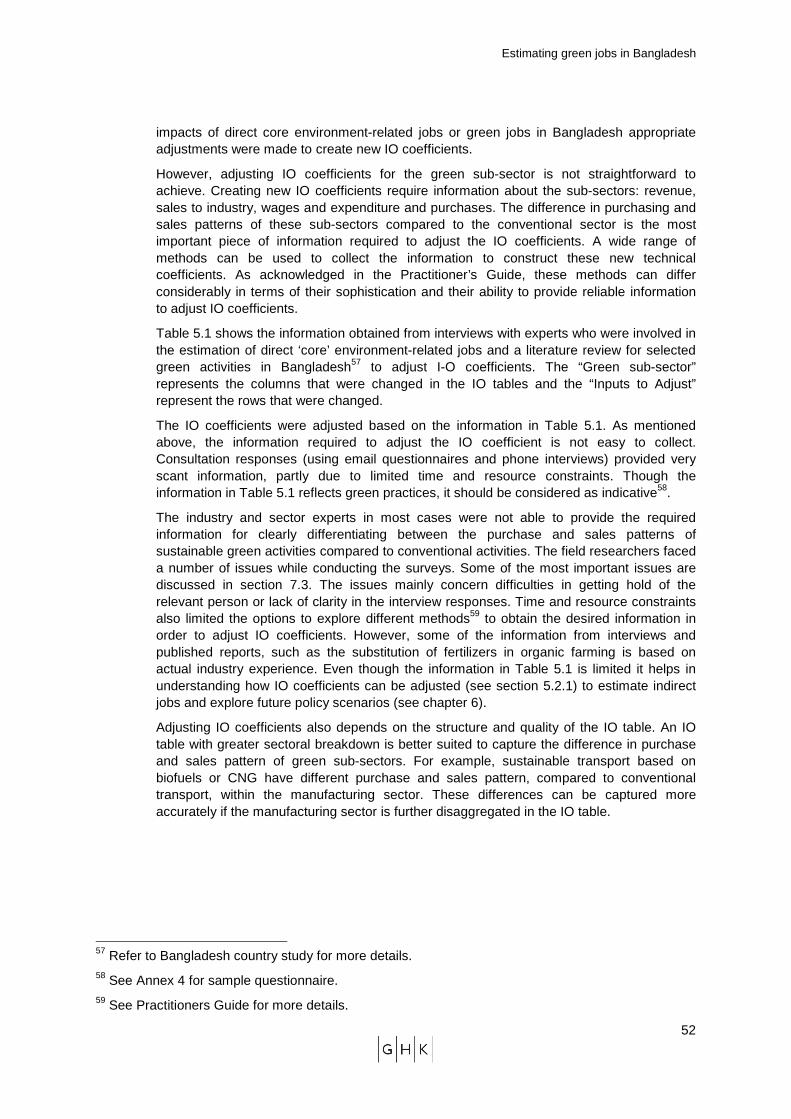
Estimating green jobs in Bangladesh
52
impacts of direct core environment-related jobs or green jobs in Bangladesh appropriate adjustments were made to create new IO coefficients.
However, adjusting IO coefficients for the green sub-sector is not straightforward to achieve. Creating new IO coefficients require information about the sub-sectors: revenue, sales to industry, wages and expenditure and purchases. The difference in purchasing and sales patterns of these sub-sectors compared to the conventional sector is the most important piece of information required to adjust the IO coefficients. A wide range of methods can be used to collect the information to construct these new technical coefficients. As acknowledged in the Practitioner’s Guide, these methods can differ considerably in terms of their sophistication and their ability to provide reliable information to adjust IO coefficients.
Table 5.1 shows the information obtained from interviews with experts who were involved in the estimation of direct ‘core’ environment-related jobs and a literature review for selected green activities in Bangladesh57 to adjust I-O coefficients. The “Green sub-sector” represents the columns that were changed in the IO tables and the “Inputs to Adjust” represent the rows that were changed.
The IO coefficients were adjusted based on the information in Table 5.1. As mentioned above, the information required to adjust the IO coefficient is not easy to collect. Consultation responses (using email questionnaires and phone interviews) provided very scant information, partly due to limited time and resource constraints. Though the information in Table 5.1 reflects green practices, it should be considered as indicative58.
The industry and sector experts in most cases were not able to provide the required information for clearly differentiating between the purchase and sales patterns of sustainable green activities compared to conventional activities. The field researchers faced a number of issues while conducting the surveys. Some of the most important issues are discussed in section 7.3. The issues mainly concern difficulties in getting hold of the relevant person or lack of clarity in the interview responses. Time and resource constraints also limited the options to explore different methods59 to obtain the desired information in order to adjust IO coefficients. However, some of the information from interviews and published reports, such as the substitution of fertilizers in organic farming is based on actual industry experience. Even though the information in Table 5.1 is limited it helps in understanding how IO coefficients can be adjusted (see section 5.2.1) to estimate indirect jobs and explore future policy scenarios (see chapter 6).
Adjusting IO coefficients also depends on the structure and quality of the IO table. An IO table with greater sectoral breakdown is better suited to capture the difference in purchase and sales pattern of green sub-sectors. For example, sustainable transport based on biofuels or CNG have different purchase and sales pattern, compared to conventional transport, within the manufacturing sector. These differences can be captured more accurately if the manufacturing sector is further disaggregated in the IO table.
57 Refer to Bangladesh country study for more details. 58 See Annex 4 for sample questionnaire. 59 See Practitioners Guide for more details.
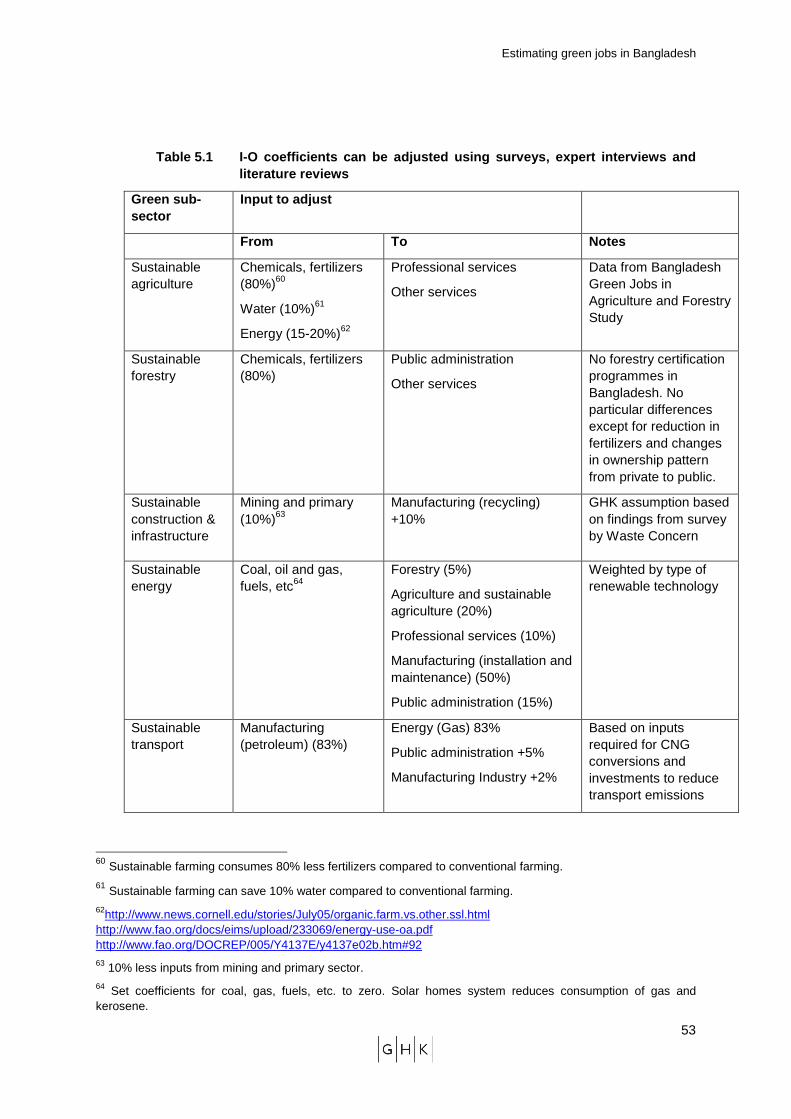
Estimating green jobs in Bangladesh
53
Table 5.1 I-O coefficients can be adjusted using su rveys, expert interviews and literature reviews
Green sub -sector
Input to adjust
From To Notes
Sustainable agriculture
Chemicals, fertilizers (80%)60
Water (10%)61
Energy (15-20%)62
Professional services
Other services
Data from Bangladesh Green Jobs in Agriculture and Forestry Study
Sustainable forestry
Chemicals, fertilizers (80%)
Public administration
Other services
No forestry certification programmes in Bangladesh. No particular differences except for reduction in fertilizers and changes in ownership pattern from private to public.
Sustainable construction & infrastructure
Mining and primary (10%)63
Manufacturing (recycling) +10%
GHK assumption based on findings from survey by Waste Concern
Sustainable energy
Coal, oil and gas, fuels, etc64
Forestry (5%)
Agriculture and sustainable agriculture (20%)
Professional services (10%)
Manufacturing (installation and maintenance) (50%)
Public administration (15%)
Weighted by type of renewable technology
Sustainable transport
Manufacturing (petroleum) (83%)
Energy (Gas) 83%
Public administration +5%
Manufacturing Industry +2%
Based on inputs required for CNG conversions and investments to reduce transport emissions
60 Sustainable farming consumes 80% less fertilizers compared to conventional farming.
61 Sustainable farming can save 10% water compared to conventional farming. 62http://www.news.cornell.edu/stories/July05/organic.farm.vs.other.ssl.html http://www.fao.org/docs/eims/upload/233069/energy-use-oa.pdf http://www.fao.org/DOCREP/005/Y4137E/y4137e02b.htm#92 63 10% less inputs from mining and primary sector. 64 Set coefficients for coal, gas, fuels, etc. to zero. Solar homes system reduces consumption of gas and kerosene.
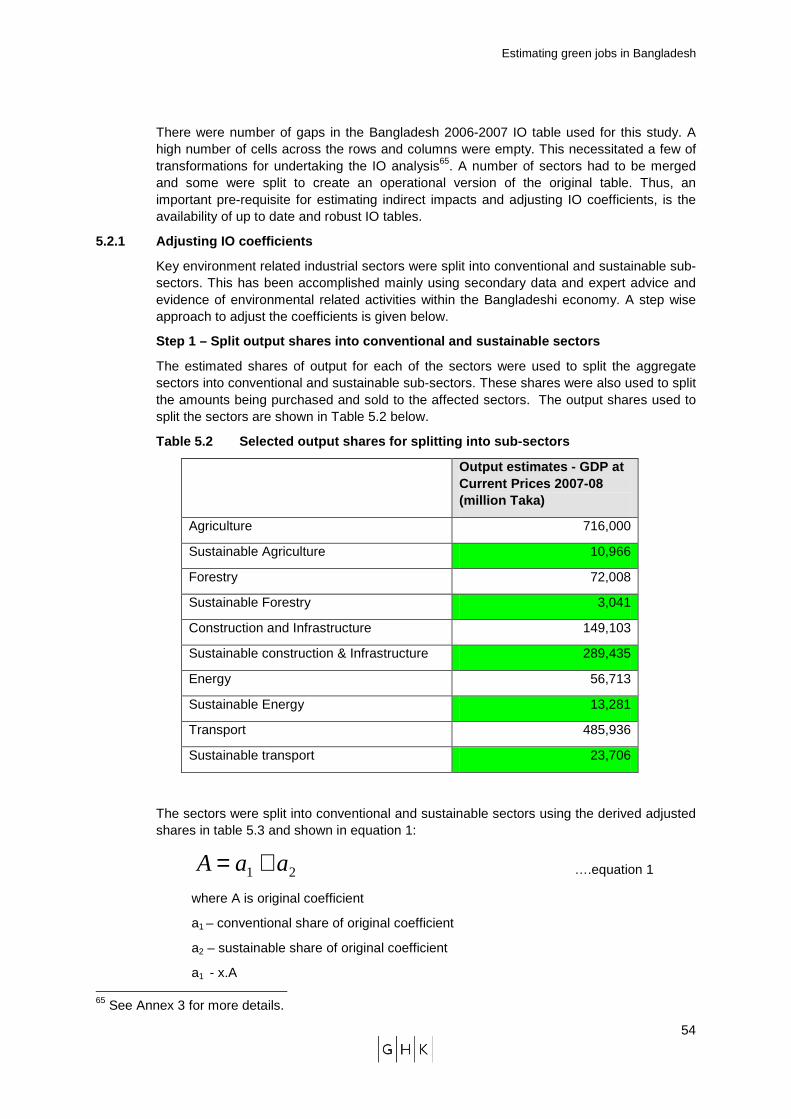
Estimating green jobs in Bangladesh
54
There were number of gaps in the Bangladesh 2006-2007 IO table used for this study. A high number of cells across the rows and columns were empty. This necessitated a few of transformations for undertaking the IO analysis65. A number of sectors had to be merged and some were split to create an operational version of the original table. Thus, an important pre-requisite for estimating indirect impacts and adjusting IO coefficients, is the availability of up to date and robust IO tables.
5.2.1 Adjusting IO coefficients
Key environment related industrial sectors were split into conventional and sustainable sub-sectors. This has been accomplished mainly using secondary data and expert advice and evidence of environmental related activities within the Bangladeshi economy. A step wise approach to adjust the coefficients is given below.
Step 1 – Split output shares into conventional and sustainable sectors
The estimated shares of output for each of the sectors were used to split the aggregate sectors into conventional and sustainable sub-sectors. These shares were also used to split the amounts being purchased and sold to the affected sectors. The output shares used to split the sectors are shown in Table 5.2 below.
Table 5.2 Selected output shares for splitting into sub-sectors
Output estimates - GDP at Current Prices 2007-08 (million Taka)
Agriculture 716,000
Sustainable Agriculture 10,966
Forestry 72,008
Sustainable Forestry 3,041
Construction and Infrastructure 149,103
Sustainable construction & Infrastructure 289,435
Energy 56,713
Sustainable Energy 13,281
Transport 485,936
Sustainable transport 23,706
The sectors were split into conventional and sustainable sectors using the derived adjusted shares in table 5.3 and shown in equation 1:
21 aaA += ….equation 1
where A is original coefficient
a1 – conventional share of original coefficient
a2 – sustainable share of original coefficient
a1 - x.A 65 See Annex 3 for more details.
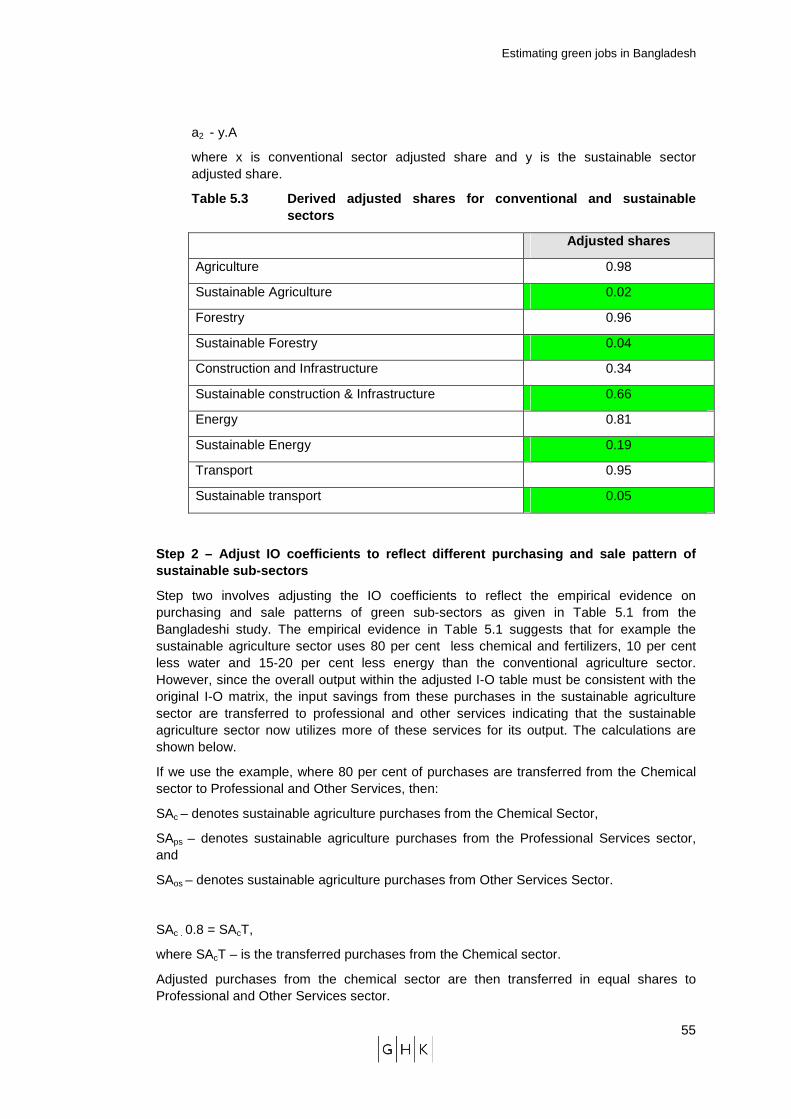
Estimating green jobs in Bangladesh
55
a2 - y.A
where x is conventional sector adjusted share and y is the sustainable sector adjusted share.
Table 5.3 Derived adjusted shares for conventional and sustainable sectors
Adjusted shares
Agriculture 0.98
Sustainable Agriculture 0.02
Forestry 0.96
Sustainable Forestry 0.04
Construction and Infrastructure 0.34
Sustainable construction & Infrastructure 0.66
Energy 0.81
Sustainable Energy 0.19
Transport 0.95
Sustainable transport 0.05
Step 2 – Adjust IO coefficients to reflect differen t purchasing and sale pattern of sustainable sub-sectors
Step two involves adjusting the IO coefficients to reflect the empirical evidence on purchasing and sale patterns of green sub-sectors as given in Table 5.1 from the Bangladeshi study. The empirical evidence in Table 5.1 suggests that for example the sustainable agriculture sector uses 80 per cent less chemical and fertilizers, 10 per cent less water and 15-20 per cent less energy than the conventional agriculture sector. However, since the overall output within the adjusted I-O table must be consistent with the original I-O matrix, the input savings from these purchases in the sustainable agriculture sector are transferred to professional and other services indicating that the sustainable agriculture sector now utilizes more of these services for its output. The calculations are shown below.
If we use the example, where 80 per cent of purchases are transferred from the Chemical sector to Professional and Other Services, then:
SAc – denotes sustainable agriculture purchases from the Chemical Sector,
SAps – denotes sustainable agriculture purchases from the Professional Services sector, and
SAos – denotes sustainable agriculture purchases from Other Services Sector.
SAc . 0.8 = SAcT,
where SAcT – is the transferred purchases from the Chemical sector.
Adjusted purchases from the chemical sector are then transferred in equal shares to Professional and Other Services sector.
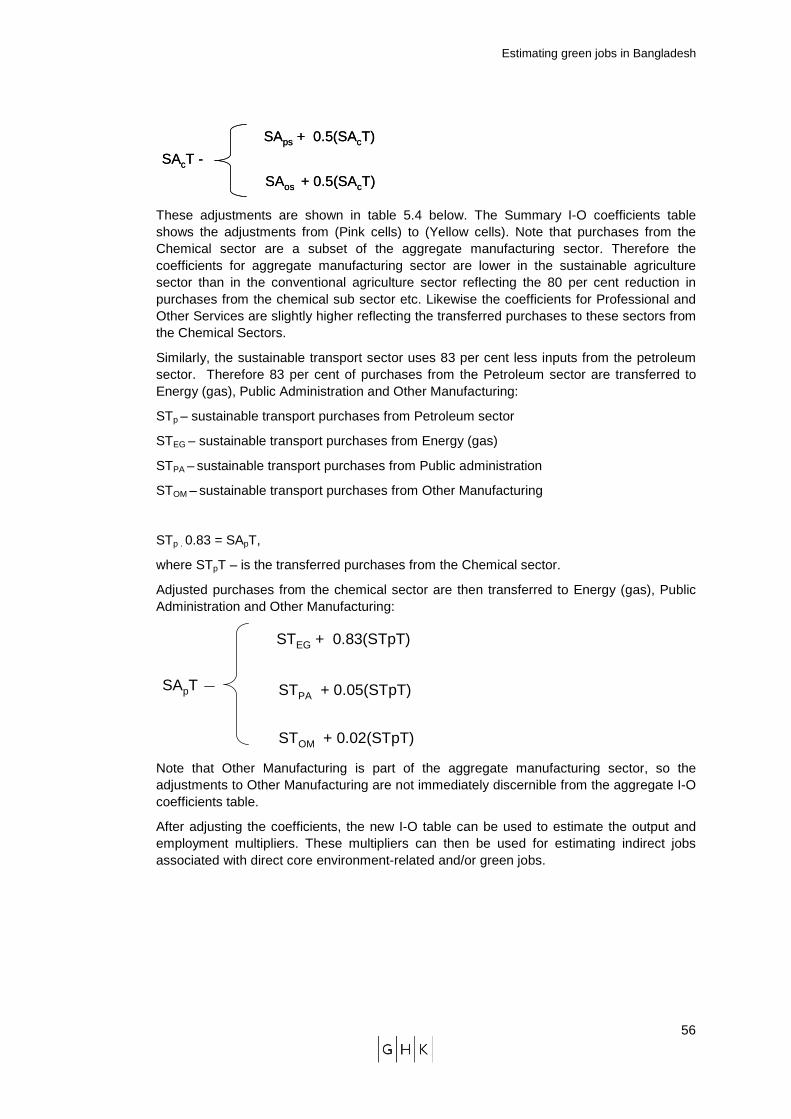
Estimating green jobs in Bangladesh
56
SAps + 0.5(SAcT)
SAos + 0.5(SAcT)
SAcT -
SAps + 0.5(SAcT)
SAos + 0.5(SAcT)
SAcT -
These adjustments are shown in table 5.4 below. The Summary I-O coefficients table shows the adjustments from (Pink cells) to (Yellow cells). Note that purchases from the Chemical sector are a subset of the aggregate manufacturing sector. Therefore the coefficients for aggregate manufacturing sector are lower in the sustainable agriculture sector than in the conventional agriculture sector reflecting the 80 per cent reduction in purchases from the chemical sub sector etc. Likewise the coefficients for Professional and Other Services are slightly higher reflecting the transferred purchases to these sectors from the Chemical Sectors.
Similarly, the sustainable transport sector uses 83 per cent less inputs from the petroleum sector. Therefore 83 per cent of purchases from the Petroleum sector are transferred to Energy (gas), Public Administration and Other Manufacturing:
STp – sustainable transport purchases from Petroleum sector
STEG – sustainable transport purchases from Energy (gas)
STPA – sustainable transport purchases from Public administration
STOM – sustainable transport purchases from Other Manufacturing
STp . 0.83 = SApT,
where STpT – is the transferred purchases from the Chemical sector.
Adjusted purchases from the chemical sector are then transferred to Energy (gas), Public Administration and Other Manufacturing:
STEG + 0.83(STpT)
STPA + 0.05(STpT)
STOM + 0.02(STpT)
SApT
Note that Other Manufacturing is part of the aggregate manufacturing sector, so the adjustments to Other Manufacturing are not immediately discernible from the aggregate I-O coefficients table.
After adjusting the coefficients, the new I-O table can be used to estimate the output and employment multipliers. These multipliers can then be used for estimating indirect jobs associated with direct core environment-related and/or green jobs.
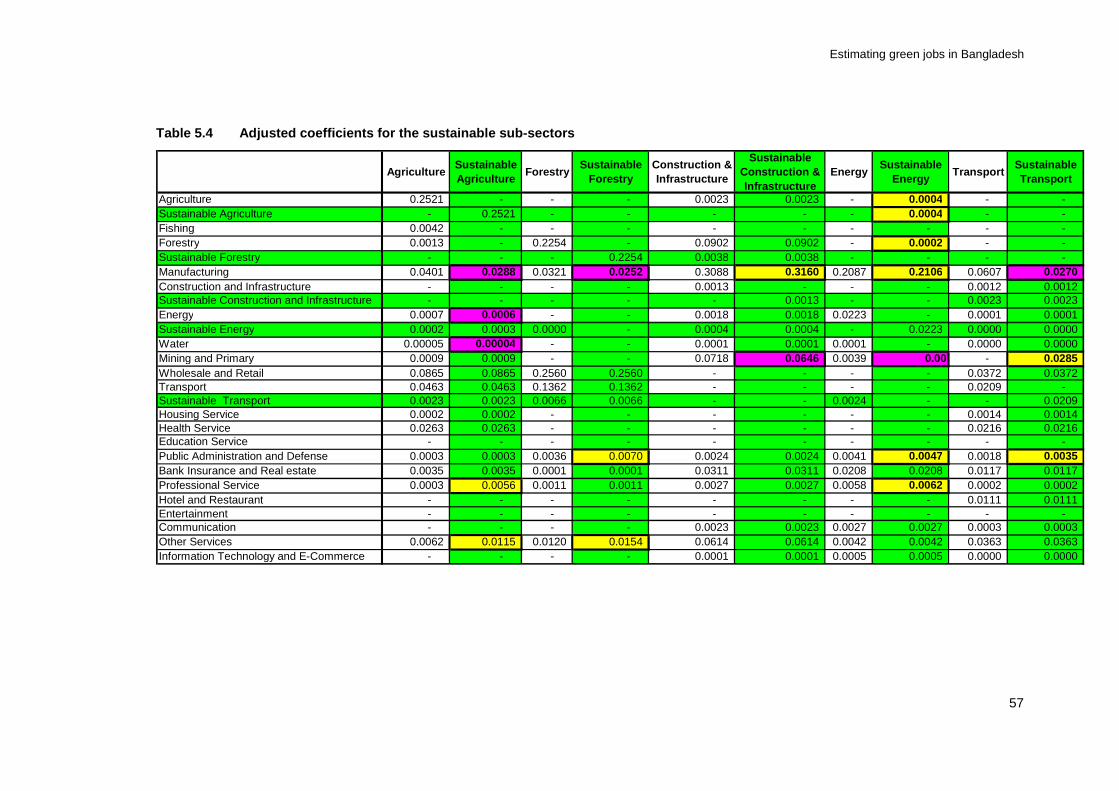
Estimating green jobs in Bangladesh
57
Table 5.4 Adjusted coefficients for the sustainable sub-sectors
AgricultureSustainable Agriculture
ForestrySustainable
ForestryConstruction & Infrastructure
Sustainable Construction & Infrastructure
EnergySustainable
EnergyTransport
Sustainable Transport
Agriculture 0.2521 - - - 0.0023 0.0023 - 0.0004 - - Sustainable Agriculture - 0.2521 - - - - - 0.0004 - - Fishing 0.0042 - - - - - - - - - Forestry 0.0013 - 0.2254 - 0.0902 0.0902 - 0.0002 - - Sustainable Forestry - - - 0.2254 0.0038 0.0038 - - - - Manufacturing 0.0401 0.0288 0.0321 0.0252 0.3088 0.3160 0.2087 0.2106 0.0607 0.0270 Construction and Infrastructure - - - - 0.0013 - - - 0.0012 0.0012 Sustainable Construction and Infrastructure - - - - - 0.0013 - - 0.0023 0.0023 Energy 0.0007 0.0006 - - 0.0018 0.0018 0.0223 - 0.0001 0.0001 Sustainable Energy 0.0002 0.0003 0.0000 - 0.0004 0.0004 - 0.0223 0.0000 0.0000 Water 0.00005 0.00004 - - 0.0001 0.0001 0.0001 - 0.0000 0.0000 Mining and Primary 0.0009 0.0009 - - 0.0718 0.0646 0.0039 0.00 - 0.0285 Wholesale and Retail 0.0865 0.0865 0.2560 0.2560 - - - - 0.0372 0.0372 Transport 0.0463 0.0463 0.1362 0.1362 - - - - 0.0209 - Sustainable Transport 0.0023 0.0023 0.0066 0.0066 - - 0.0024 - - 0.0209 Housing Service 0.0002 0.0002 - - - - - - 0.0014 0.0014 Health Service 0.0263 0.0263 - - - - - - 0.0216 0.0216 Education Service - - - - - - - - - - Public Administration and Defense 0.0003 0.0003 0.0036 0.0070 0.0024 0.0024 0.0041 0.0047 0.0018 0.0035 Bank Insurance and Real estate 0.0035 0.0035 0.0001 0.0001 0.0311 0.0311 0.0208 0.0208 0.0117 0.0117 Professional Service 0.0003 0.0056 0.0011 0.0011 0.0027 0.0027 0.0058 0.0062 0.0002 0.0002 Hotel and Restaurant - - - - - - - - 0.0111 0.0111 Entertainment - - - - - - - - - - Communication - - - - 0.0023 0.0023 0.0027 0.0027 0.0003 0.0003 Other Services 0.0062 0.0115 0.0120 0.0154 0.0614 0.0614 0.0042 0.0042 0.0363 0.0363 Information Technology and E-Commerce - - - - 0.0001 0.0001 0.0005 0.0005 0.0000 0.0000
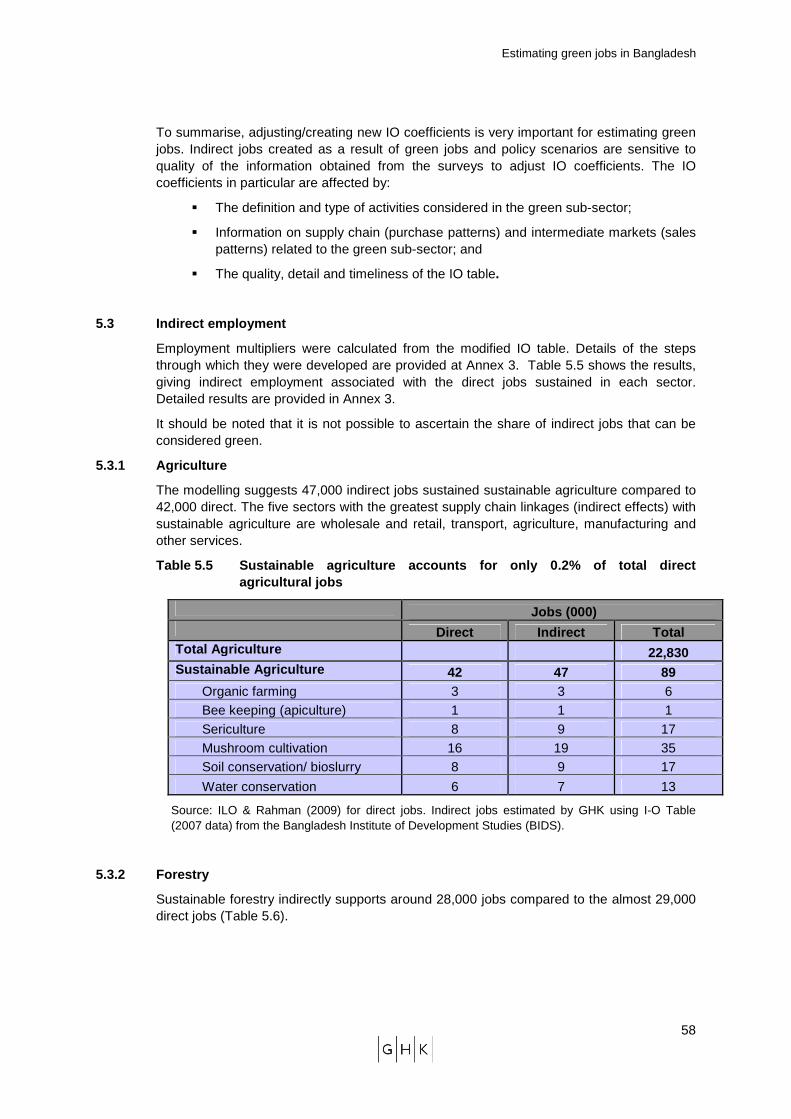
Estimating green jobs in Bangladesh
58
To summarise, adjusting/creating new IO coefficients is very important for estimating green jobs. Indirect jobs created as a result of green jobs and policy scenarios are sensitive to quality of the information obtained from the surveys to adjust IO coefficients. The IO coefficients in particular are affected by:
� The definition and type of activities considered in the green sub-sector;
� Information on supply chain (purchase patterns) and intermediate markets (sales patterns) related to the green sub-sector; and
� The quality, detail and timeliness of the IO table.
5.3 Indirect employment
Employment multipliers were calculated from the modified IO table. Details of the steps through which they were developed are provided at Annex 3. Table 5.5 shows the results, giving indirect employment associated with the direct jobs sustained in each sector. Detailed results are provided in Annex 3.
It should be noted that it is not possible to ascertain the share of indirect jobs that can be considered green.
5.3.1 Agriculture
The modelling suggests 47,000 indirect jobs sustained sustainable agriculture compared to 42,000 direct. The five sectors with the greatest supply chain linkages (indirect effects) with sustainable agriculture are wholesale and retail, transport, agriculture, manufacturing and other services.
Table 5.5 Sustainable agriculture accounts for only 0.2% of total direct agricultural jobs
Jobs (000) Direct Indirect Total Total Agriculture 22,830 Sustainable Agriculture 42 47 89
Organic farming 3 3 6 Bee keeping (apiculture) 1 1 1 Sericulture 8 9 17 Mushroom cultivation 16 19 35 Soil conservation/ bioslurry 8 9 17
Water conservation 6 7 13
Source: ILO & Rahman (2009) for direct jobs. Indirect jobs estimated by GHK using I-O Table (2007 data) from the Bangladesh Institute of Development Studies (BIDS).
5.3.2 Forestry
Sustainable forestry indirectly supports around 28,000 jobs compared to the almost 29,000 direct jobs (Table 5.6).
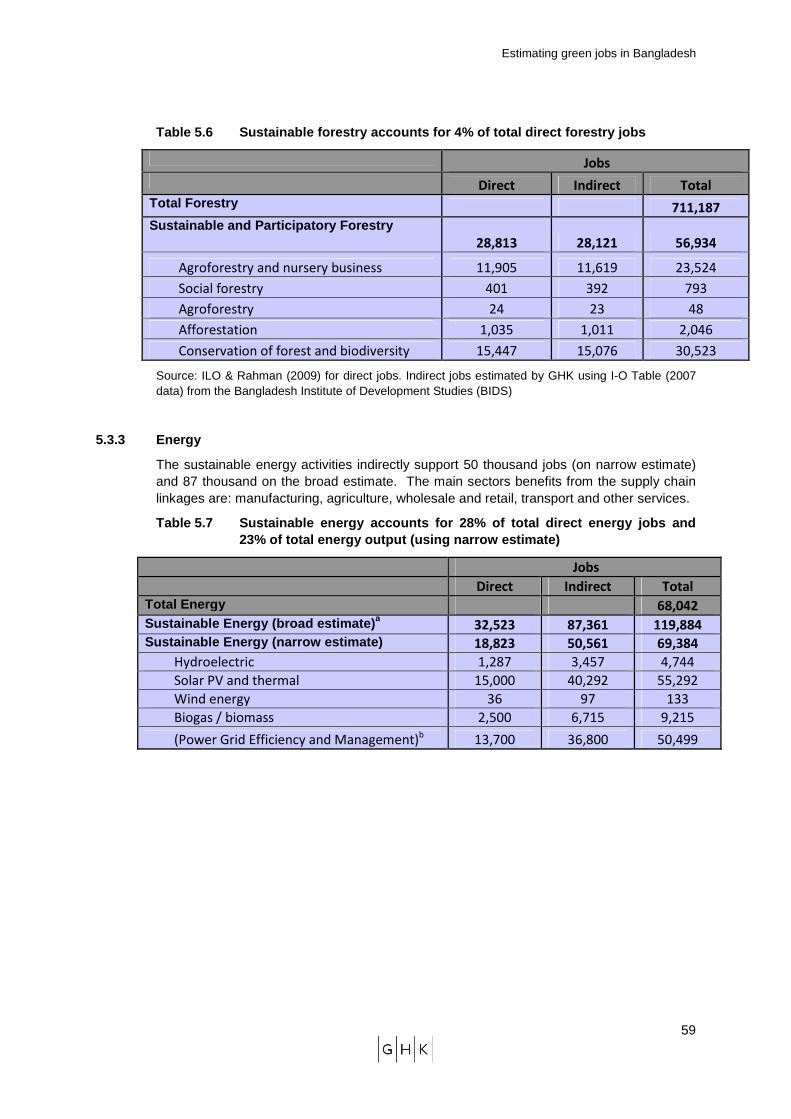
Estimating green jobs in Bangladesh
59
Table 5.6 Sustainable forestry accounts for 4% of t otal direct forestry jobs
Jobs
Direct Indirect Total
Total Forestry 711,187
Sustainable and Participatory Forestry 28,813 28,121 56,934
Agroforestry and nursery business 11,905 11,619 23,524
Social forestry 401 392 793
Agroforestry 24 23 48
Afforestation 1,035 1,011 2,046
Conservation of forest and biodiversity 15,447 15,076 30,523
Source: ILO & Rahman (2009) for direct jobs. Indirect jobs estimated by GHK using I-O Table (2007 data) from the Bangladesh Institute of Development Studies (BIDS)
5.3.3 Energy
The sustainable energy activities indirectly support 50 thousand jobs (on narrow estimate) and 87 thousand on the broad estimate. The main sectors benefits from the supply chain linkages are: manufacturing, agriculture, wholesale and retail, transport and other services.
Table 5.7 Sustainable energy accounts for 28% of to tal direct energy jobs and 23% of total energy output (using narrow estimate)
Jobs
Direct Indirect Total
Total Energy 68,042
Sustainable Energy (broad estimate) a 32,523 87,361 119,884
Sustainable Energy (narrow estimate) 18,823 50,561 69,384
Hydroelectric 1,287 3,457 4,744
Solar PV and thermal 15,000 40,292 55,292
Wind energy 36 97 133
Biogas / biomass 2,500 6,715 9,215
(Power Grid Efficiency and Management)b 13,700 36,800 50,499
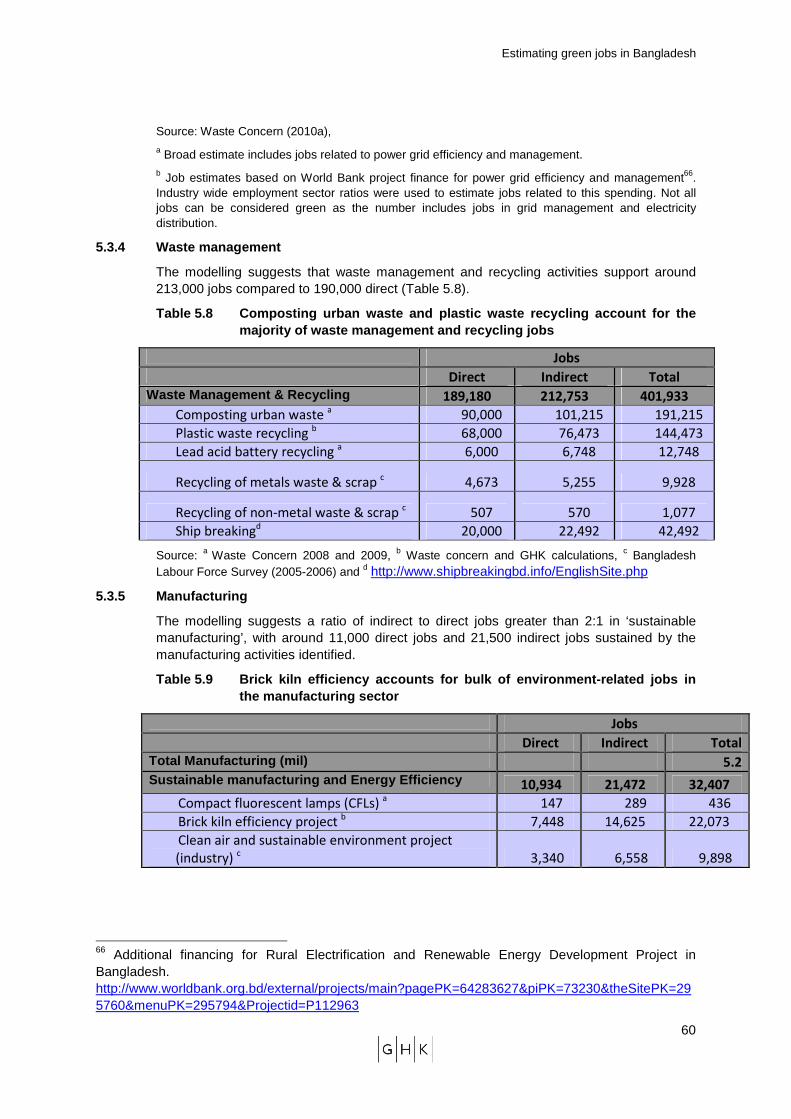
Estimating green jobs in Bangladesh
60
Source: Waste Concern (2010a), a Broad estimate includes jobs related to power grid efficiency and management. b Job estimates based on World Bank project finance for power grid efficiency and management66. Industry wide employment sector ratios were used to estimate jobs related to this spending. Not all jobs can be considered green as the number includes jobs in grid management and electricity distribution.
5.3.4 Waste management
The modelling suggests that waste management and recycling activities support around 213,000 jobs compared to 190,000 direct (Table 5.8).
Table 5.8 Composting urban waste and plastic waste recycling account for the majority of waste management and recycling jobs
Jobs
Direct Indirect Total
Waste Management & Recycling 189,180 212,753 401,933
Composting urban waste a 90,000 101,215 191,215
Plastic waste recycling b 68,000 76,473 144,473
Lead acid battery recycling a 6,000 6,748 12,748
Recycling of metals waste & scrap c 4,673 5,255 9,928
Recycling of non-metal waste & scrap c 507 570 1,077
Ship breakingd 20,000 22,492 42,492
Source: a Waste Concern 2008 and 2009, b Waste concern and GHK calculations, c Bangladesh Labour Force Survey (2005-2006) and d http://www.shipbreakingbd.info/EnglishSite.php
5.3.5 Manufacturing
The modelling suggests a ratio of indirect to direct jobs greater than 2:1 in ‘sustainable manufacturing’, with around 11,000 direct jobs and 21,500 indirect jobs sustained by the manufacturing activities identified.
Table 5.9 Brick kiln efficiency accounts for bulk o f environment-related jobs in the manufacturing sector
Jobs
Direct Indirect Total
Total Manufacturing (mil) 5.2
Sustainable manufacturing and Energy Efficiency 10,934 21,472 32,407
Compact fluorescent lamps (CFLs) a 147 289 436
Brick kiln efficiency project b 7,448 14,625 22,073
Clean air and sustainable environment project
(industry) c 3,340 6,558 9,898
66 Additional financing for Rural Electrification and Renewable Energy Development Project in Bangladesh. http://www.worldbank.org.bd/external/projects/main?pagePK=64283627&piPK=73230&theSitePK=295760&menuPK=295794&Projectid=P112963
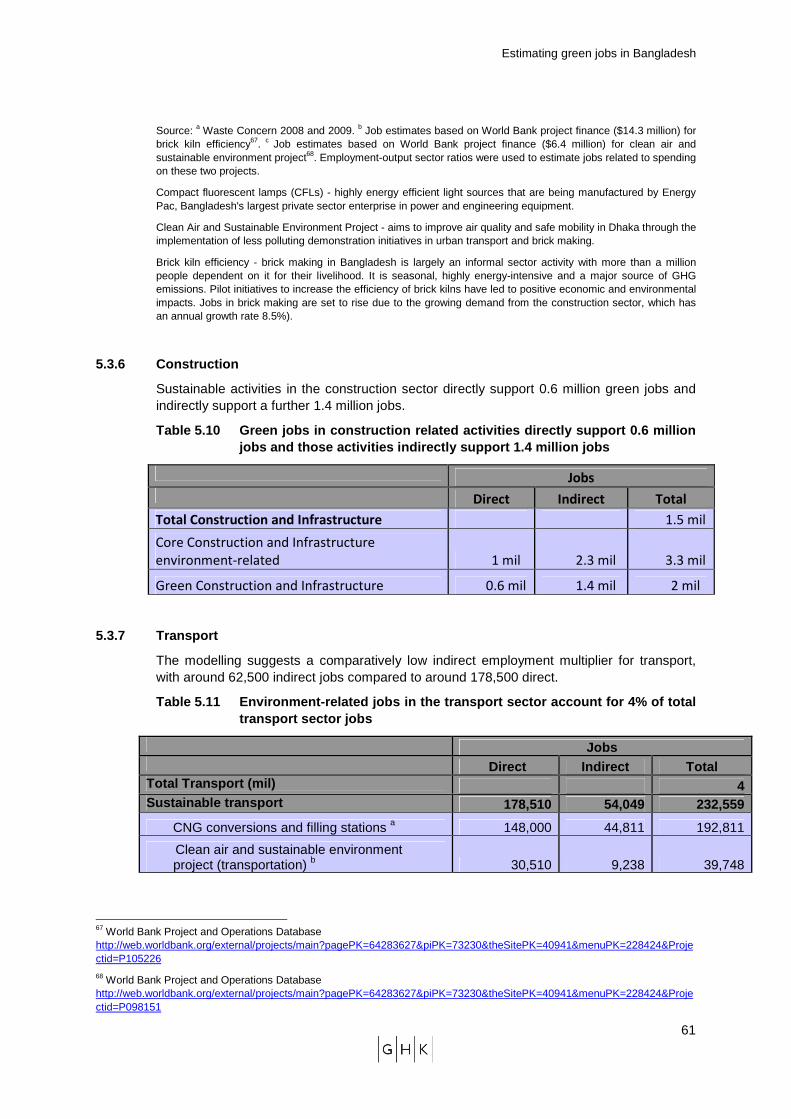
Estimating green jobs in Bangladesh
61
Source: a Waste Concern 2008 and 2009. b Job estimates based on World Bank project finance ($14.3 million) for brick kiln efficiency67. c Job estimates based on World Bank project finance ($6.4 million) for clean air and sustainable environment project68. Employment-output sector ratios were used to estimate jobs related to spending on these two projects.
Compact fluorescent lamps (CFLs) - highly energy efficient light sources that are being manufactured by Energy Pac, Bangladesh's largest private sector enterprise in power and engineering equipment.
Clean Air and Sustainable Environment Project - aims to improve air quality and safe mobility in Dhaka through the implementation of less polluting demonstration initiatives in urban transport and brick making.
Brick kiln efficiency - brick making in Bangladesh is largely an informal sector activity with more than a million people dependent on it for their livelihood. It is seasonal, highly energy-intensive and a major source of GHG emissions. Pilot initiatives to increase the efficiency of brick kilns have led to positive economic and environmental impacts. Jobs in brick making are set to rise due to the growing demand from the construction sector, which has an annual growth rate 8.5%).
5.3.6 Construction
Sustainable activities in the construction sector directly support 0.6 million green jobs and indirectly support a further 1.4 million jobs.
Table 5.10 Green jobs in construction related activ ities directly support 0.6 million jobs and those activities indirectly support 1.4 mi llion jobs
Jobs
Direct Indirect Total
Total Construction and Infrastructure 1.5 mil
Core Construction and Infrastructure
environment-related 1 mil 2.3 mil 3.3 mil
Green Construction and Infrastructure 0.6 mil 1.4 mil 2 mil
5.3.7 Transport
The modelling suggests a comparatively low indirect employment multiplier for transport, with around 62,500 indirect jobs compared to around 178,500 direct.
Table 5.11 Environment-related jobs in the transpor t sector account for 4% of total transport sector jobs
Jobs Direct Indirect Total Total Transport (mil) 4 Sustainable transport 178,510 54,049 232,559
CNG conversions and filling stations a 148,000 44,811 192,811
Clean air and sustainable environment project (transportation) b 30,510 9,238 39,748
67 World Bank Project and Operations Database http://web.worldbank.org/external/projects/main?pagePK=64283627&piPK=73230&theSitePK=40941&menuPK=228424&Projectid=P105226
68 World Bank Project and Operations Database http://web.worldbank.org/external/projects/main?pagePK=64283627&piPK=73230&theSitePK=40941&menuPK=228424&Projectid=P098151
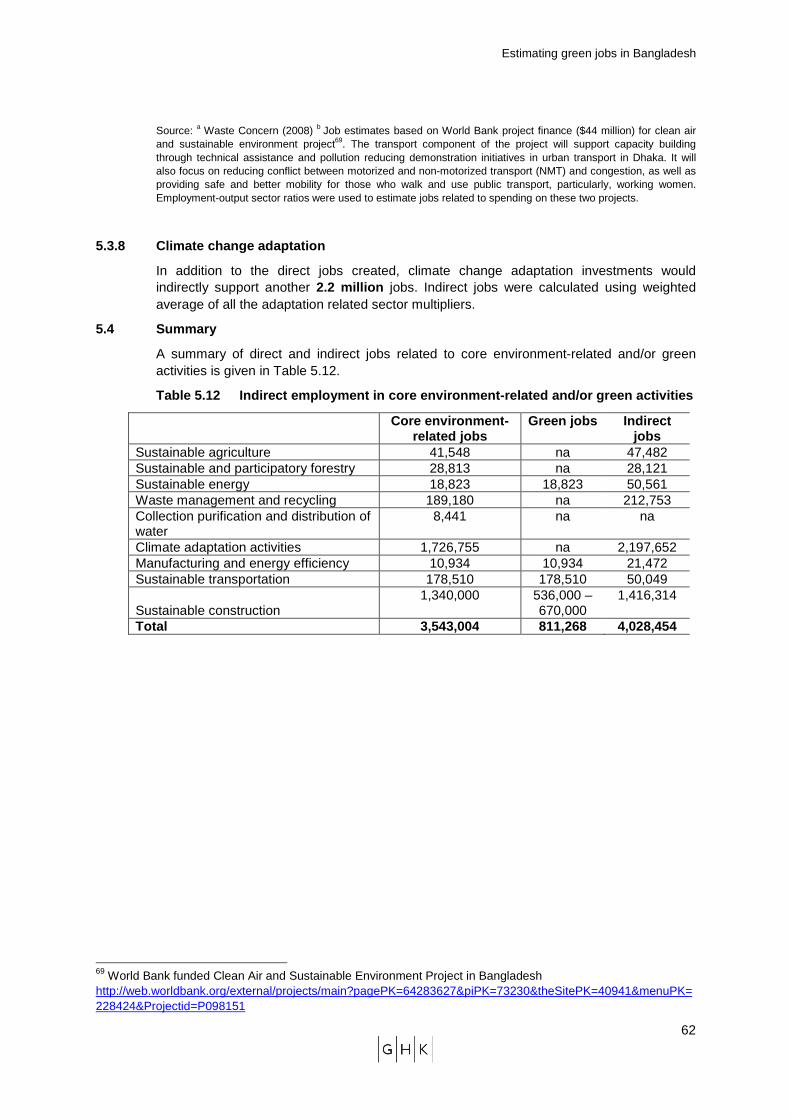
Estimating green jobs in Bangladesh
62
Source: a Waste Concern (2008) b Job estimates based on World Bank project finance ($44 million) for clean air and sustainable environment project69. The transport component of the project will support capacity building through technical assistance and pollution reducing demonstration initiatives in urban transport in Dhaka. It will also focus on reducing conflict between motorized and non-motorized transport (NMT) and congestion, as well as providing safe and better mobility for those who walk and use public transport, particularly, working women. Employment-output sector ratios were used to estimate jobs related to spending on these two projects.
5.3.8 Climate change adaptation
In addition to the direct jobs created, climate change adaptation investments would indirectly support another 2.2 million jobs. Indirect jobs were calculated using weighted average of all the adaptation related sector multipliers.
5.4 Summary
A summary of direct and indirect jobs related to core environment-related and/or green activities is given in Table 5.12.
Table 5.12 Indirect employment in core environment- related and/or green activities
Core environment -
related jobs Green jobs Indirect
jobs Sustainable agriculture 41,548 na 47,482 Sustainable and participatory forestry 28,813 na 28,121 Sustainable energy 18,823 18,823 50,561 Waste management and recycling 189,180 na 212,753 Collection purification and distribution of water
8,441 na na
Climate adaptation activities 1,726,755 na 2,197,652 Manufacturing and energy efficiency 10,934 10,934 21,472 Sustainable transportation 178,510 178,510 50,049
Sustainable construction 1,340,000 536,000 –
670,000 1,416,314
Total 3,543,004 811,268 4,028,454
69 World Bank funded Clean Air and Sustainable Environment Project in Bangladesh http://web.worldbank.org/external/projects/main?pagePK=64283627&piPK=73230&theSitePK=40941&menuPK=228424&Projectid=P098151
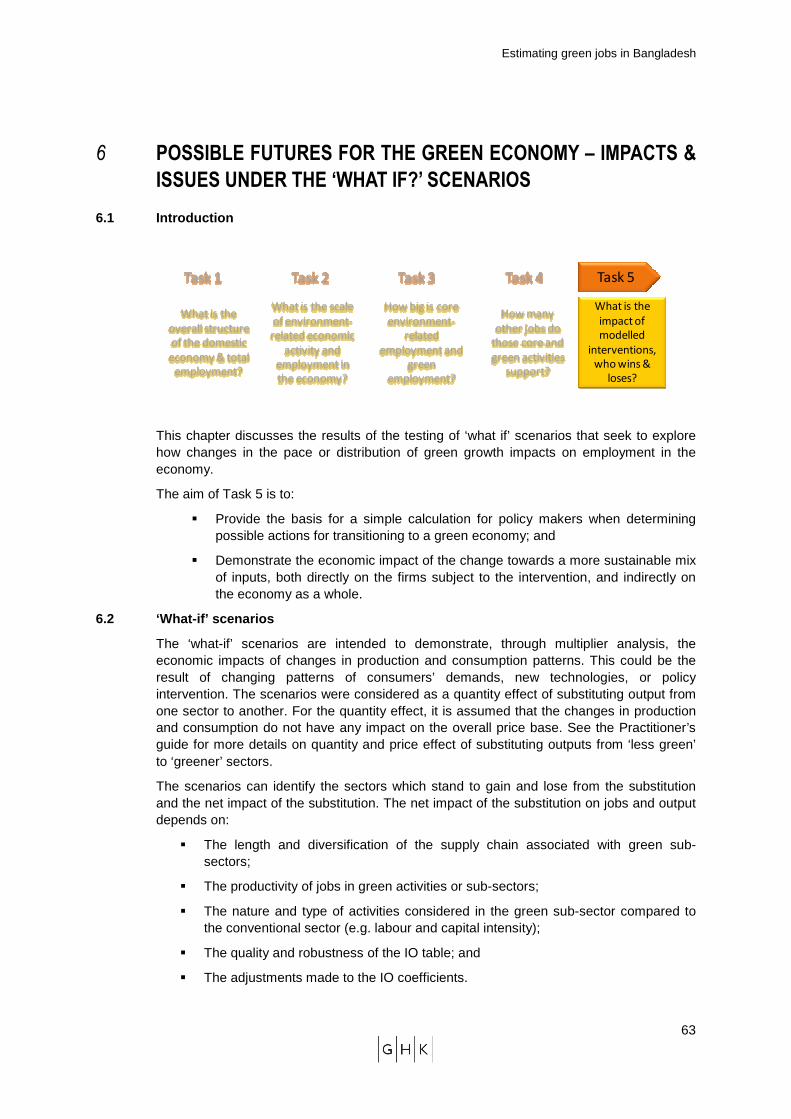
Estimating green jobs in Bangladesh
63
6 POSSIBLE FUTURES FOR THE GREEN ECONOMY – IMPACTS &
ISSUES UNDER THE ‘WHAT IF?’ SCENARIOS
6.1 Introduction
What is the
overall structure
of the domestic
economy & total
employment?
Task 1
What is the scale
of environment-
related economic
activity and
employment in
the economy?
Task 2
How big is core
environment-
related
employment and
green
employment?
Task 3
How many
other jobs do
those core and
green activities
support?
Task 4
What is the
impact of
modelled
interventions,
who wins &
loses?
Task 5
This chapter discusses the results of the testing of ‘what if’ scenarios that seek to explore how changes in the pace or distribution of green growth impacts on employment in the economy.
The aim of Task 5 is to:
� Provide the basis for a simple calculation for policy makers when determining possible actions for transitioning to a green economy; and
� Demonstrate the economic impact of the change towards a more sustainable mix of inputs, both directly on the firms subject to the intervention, and indirectly on the economy as a whole.
6.2 ‘What-if’ scenarios
The ‘what-if’ scenarios are intended to demonstrate, through multiplier analysis, the economic impacts of changes in production and consumption patterns. This could be the result of changing patterns of consumers’ demands, new technologies, or policy intervention. The scenarios were considered as a quantity effect of substituting output from one sector to another. For the quantity effect, it is assumed that the changes in production and consumption do not have any impact on the overall price base. See the Practitioner’s guide for more details on quantity and price effect of substituting outputs from ‘less green’ to ‘greener’ sectors.
The scenarios can identify the sectors which stand to gain and lose from the substitution and the net impact of the substitution. The net impact of the substitution on jobs and output depends on:
� The length and diversification of the supply chain associated with green sub-sectors;
� The productivity of jobs in green activities or sub-sectors;
� The nature and type of activities considered in the green sub-sector compared to the conventional sector (e.g. labour and capital intensity);
� The quality and robustness of the IO table; and
� The adjustments made to the IO coefficients.
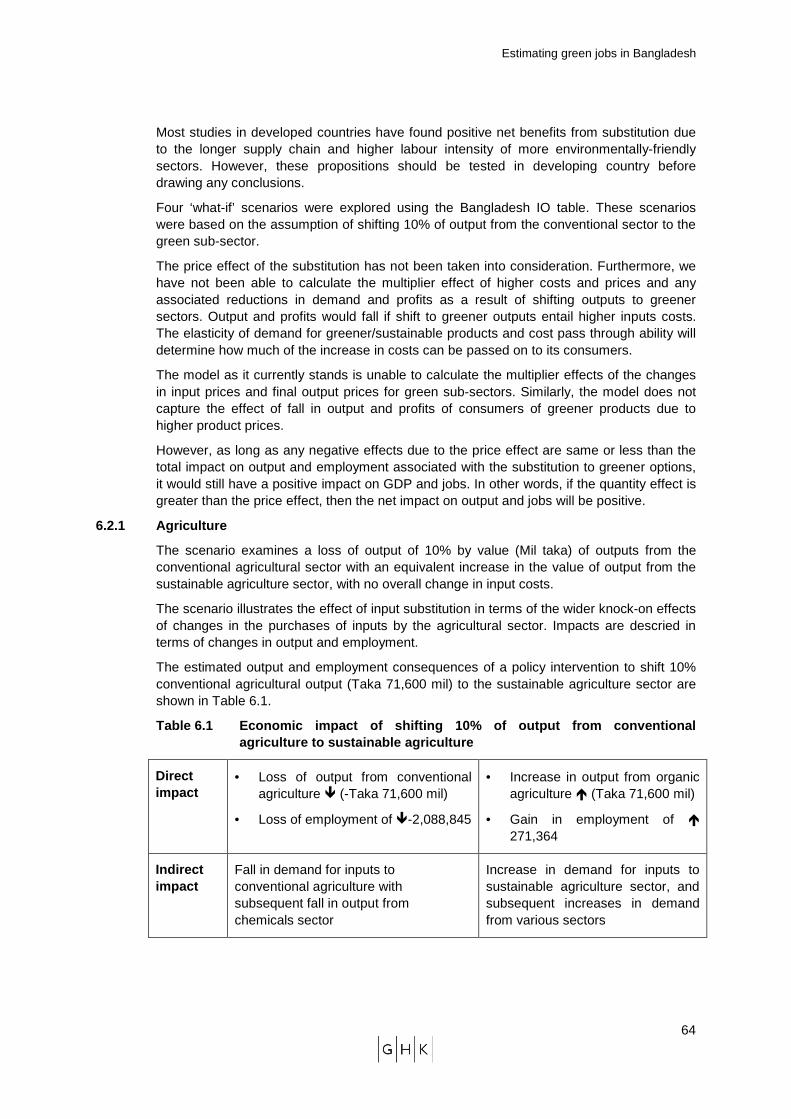
Estimating green jobs in Bangladesh
64
Most studies in developed countries have found positive net benefits from substitution due to the longer supply chain and higher labour intensity of more environmentally-friendly sectors. However, these propositions should be tested in developing country before drawing any conclusions.
Four ‘what-if’ scenarios were explored using the Bangladesh IO table. These scenarios were based on the assumption of shifting 10% of output from the conventional sector to the green sub-sector.
The price effect of the substitution has not been taken into consideration. Furthermore, we have not been able to calculate the multiplier effect of higher costs and prices and any associated reductions in demand and profits as a result of shifting outputs to greener sectors. Output and profits would fall if shift to greener outputs entail higher inputs costs. The elasticity of demand for greener/sustainable products and cost pass through ability will determine how much of the increase in costs can be passed on to its consumers.
The model as it currently stands is unable to calculate the multiplier effects of the changes in input prices and final output prices for green sub-sectors. Similarly, the model does not capture the effect of fall in output and profits of consumers of greener products due to higher product prices.
However, as long as any negative effects due to the price effect are same or less than the total impact on output and employment associated with the substitution to greener options, it would still have a positive impact on GDP and jobs. In other words, if the quantity effect is greater than the price effect, then the net impact on output and jobs will be positive.
6.2.1 Agriculture
The scenario examines a loss of output of 10% by value (Mil taka) of outputs from the conventional agricultural sector with an equivalent increase in the value of output from the sustainable agriculture sector, with no overall change in input costs.
The scenario illustrates the effect of input substitution in terms of the wider knock-on effects of changes in the purchases of inputs by the agricultural sector. Impacts are descried in terms of changes in output and employment.
The estimated output and employment consequences of a policy intervention to shift 10% conventional agricultural output (Taka 71,600 mil) to the sustainable agriculture sector are shown in Table 6.1.
Table 6.1 Economic impact of shifting 10% of output from conventional agriculture to sustainable agriculture
Direct impact
• Loss of output from conventional agriculture � (-Taka 71,600 mil)
• Loss of employment of �-2,088,845
• Increase in output from organic agriculture � (Taka 71,600 mil)
• Gain in employment of � 271,364
Indirect impact
Fall in demand for inputs to conventional agriculture with subsequent fall in output from chemicals sector
Increase in demand for inputs to sustainable agriculture sector, and subsequent increases in demand from various sectors
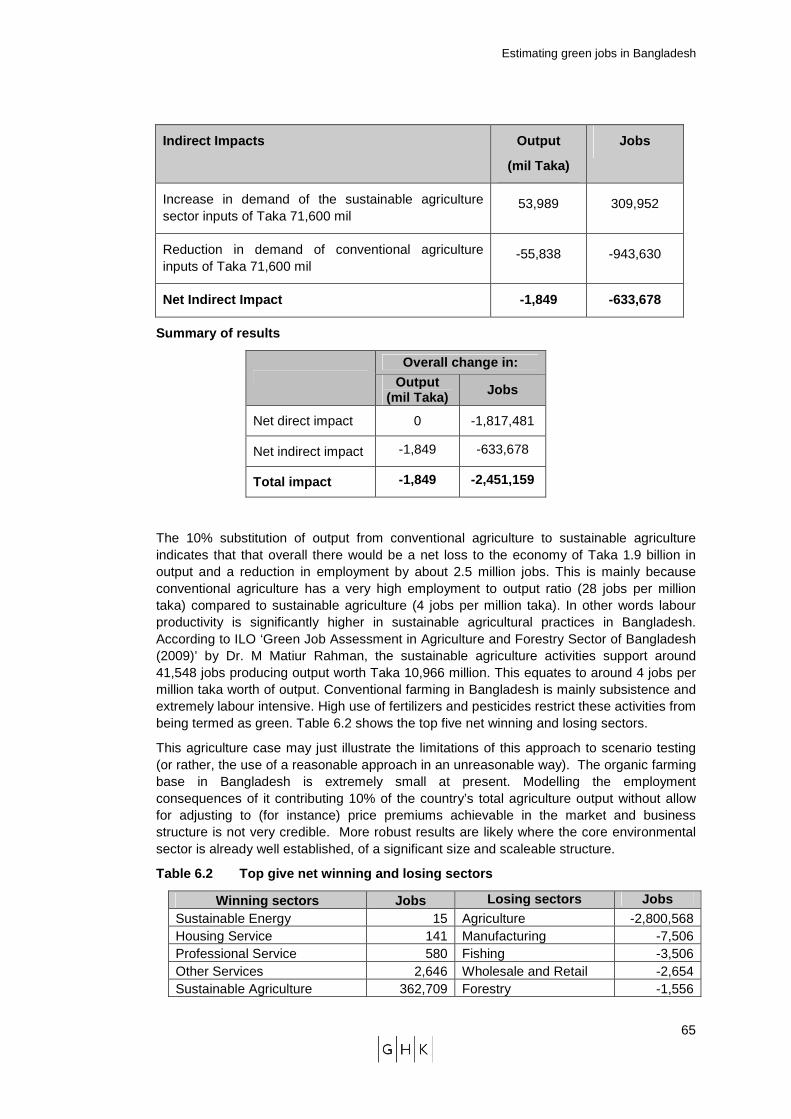
Estimating green jobs in Bangladesh
65
Indirect Impacts Output
(mil Taka)
Jobs
Increase in demand of the sustainable agriculture sector inputs of Taka 71,600 mil
53,989 309,952
Reduction in demand of conventional agriculture inputs of Taka 71,600 mil
-55,838 -943,630
Net Indirect Impact -1,849 -633,678
Summary of results
Overall change in:
Output (mil Taka) Jobs
Net direct impact 0 -1,817,481
Net indirect impact -1,849 -633,678
Total impact -1,849 -2,451,159
The 10% substitution of output from conventional agriculture to sustainable agriculture indicates that that overall there would be a net loss to the economy of Taka 1.9 billion in output and a reduction in employment by about 2.5 million jobs. This is mainly because conventional agriculture has a very high employment to output ratio (28 jobs per million taka) compared to sustainable agriculture (4 jobs per million taka). In other words labour productivity is significantly higher in sustainable agricultural practices in Bangladesh. According to ILO ‘Green Job Assessment in Agriculture and Forestry Sector of Bangladesh (2009)’ by Dr. M Matiur Rahman, the sustainable agriculture activities support around 41,548 jobs producing output worth Taka 10,966 million. This equates to around 4 jobs per million taka worth of output. Conventional farming in Bangladesh is mainly subsistence and extremely labour intensive. High use of fertilizers and pesticides restrict these activities from being termed as green. Table 6.2 shows the top five net winning and losing sectors.
This agriculture case may just illustrate the limitations of this approach to scenario testing (or rather, the use of a reasonable approach in an unreasonable way). The organic farming base in Bangladesh is extremely small at present. Modelling the employment consequences of it contributing 10% of the country’s total agriculture output without allow for adjusting to (for instance) price premiums achievable in the market and business structure is not very credible. More robust results are likely where the core environmental sector is already well established, of a significant size and scaleable structure.
Table 6.2 Top give net winning and losing sectors
Winning sectors Jobs Losing sectors Jobs Sustainable Energy 15 Agriculture -2,800,568 Housing Service 141 Manufacturing -7,506 Professional Service 580 Fishing -3,506 Other Services 2,646 Wholesale and Retail -2,654 Sustainable Agriculture 362,709 Forestry -1,556
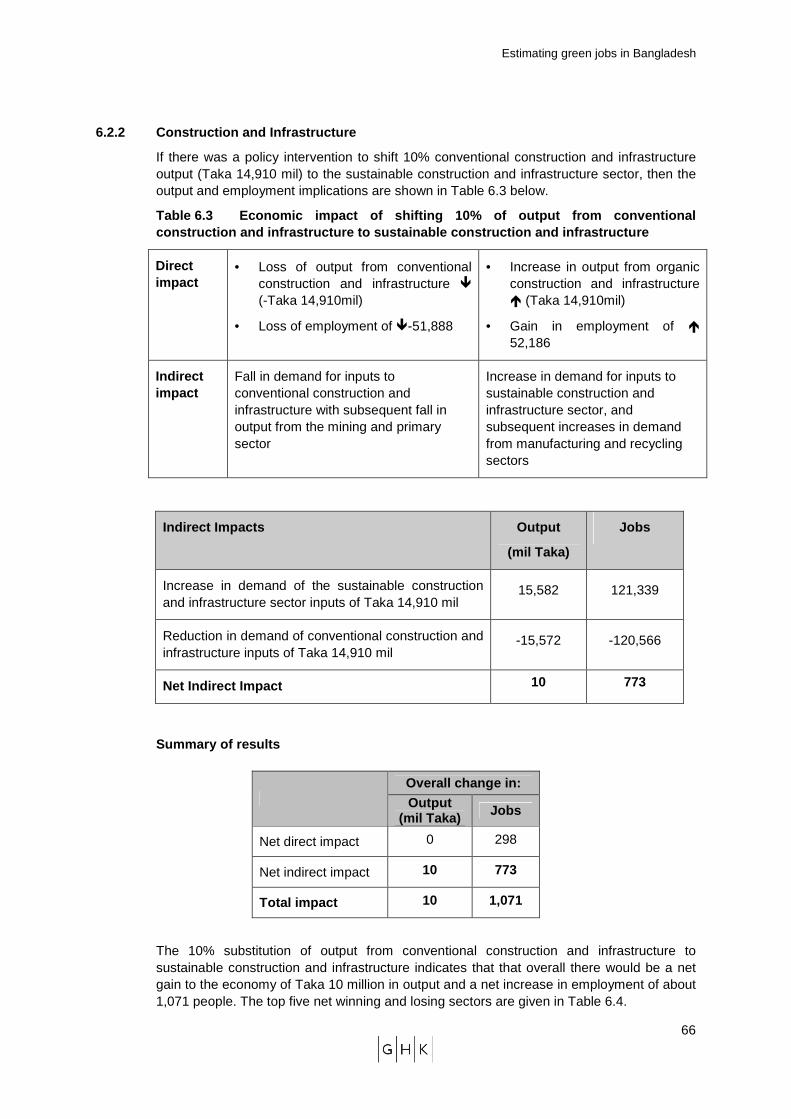
Estimating green jobs in Bangladesh
66
6.2.2 Construction and Infrastructure
If there was a policy intervention to shift 10% conventional construction and infrastructure output (Taka 14,910 mil) to the sustainable construction and infrastructure sector, then the output and employment implications are shown in Table 6.3 below.
Table 6.3 Economic impact of shifting 10% of output from conventional construction and infrastructure to sustainable cons truction and infrastructure
Direct impact
• Loss of output from conventional construction and infrastructure � (-Taka 14,910mil)
• Loss of employment of �-51,888
• Increase in output from organic construction and infrastructure � (Taka 14,910mil)
• Gain in employment of � 52,186
Indirect impact
Fall in demand for inputs to conventional construction and infrastructure with subsequent fall in output from the mining and primary sector
Increase in demand for inputs to sustainable construction and infrastructure sector, and subsequent increases in demand from manufacturing and recycling sectors
Indirect Impacts Output
(mil Taka)
Jobs
Increase in demand of the sustainable construction and infrastructure sector inputs of Taka 14,910 mil
15,582 121,339
Reduction in demand of conventional construction and infrastructure inputs of Taka 14,910 mil
-15,572 -120,566
Net Indirect Impact 10 773
Summary of results
The 10% substitution of output from conventional construction and infrastructure to sustainable construction and infrastructure indicates that that overall there would be a net gain to the economy of Taka 10 million in output and a net increase in employment of about 1,071 people. The top five net winning and losing sectors are given in Table 6.4.
Overall change in:
Output (mil Taka) Jobs
Net direct impact 0 298
Net indirect impact 10 773
Total impact 10 1,071
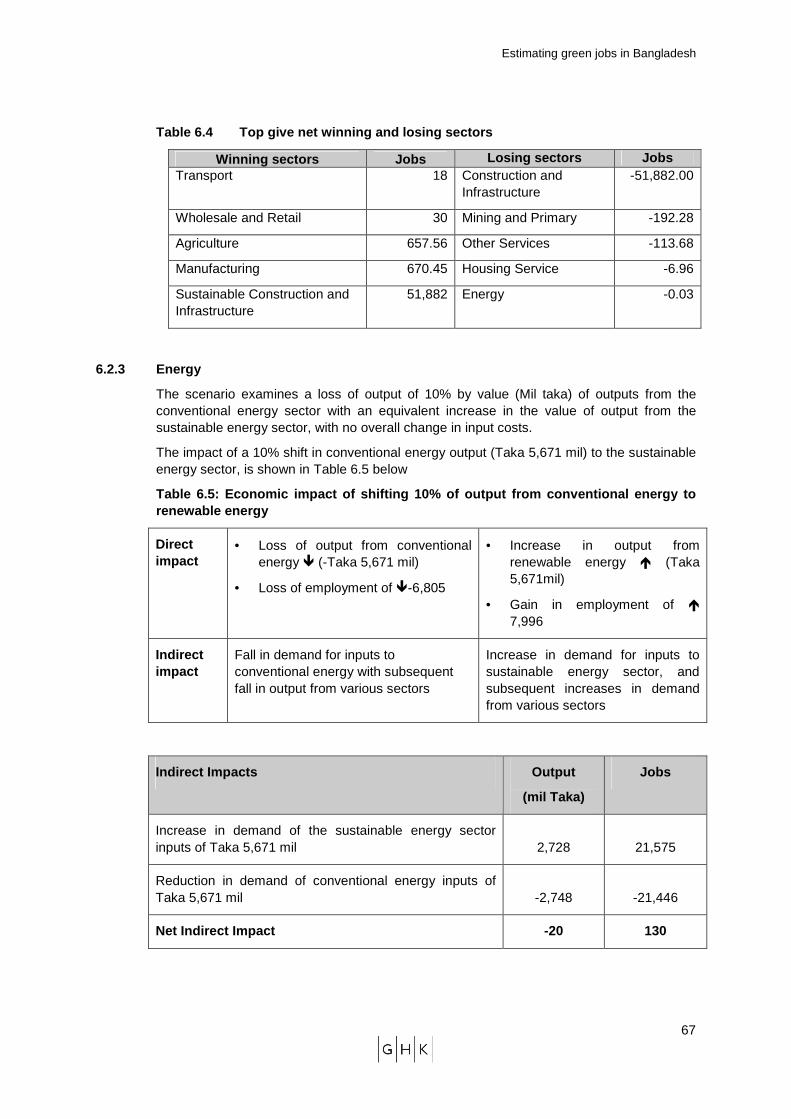
Estimating green jobs in Bangladesh
67
Table 6.4 Top give net winning and losing sectors
Winning sectors Jobs Losing sectors Jobs Transport 18 Construction and
Infrastructure -51,882.00
Wholesale and Retail 30 Mining and Primary -192.28
Agriculture 657.56 Other Services -113.68
Manufacturing 670.45 Housing Service -6.96
Sustainable Construction and Infrastructure
51,882 Energy -0.03
6.2.3 Energy
The scenario examines a loss of output of 10% by value (Mil taka) of outputs from the conventional energy sector with an equivalent increase in the value of output from the sustainable energy sector, with no overall change in input costs.
The impact of a 10% shift in conventional energy output (Taka 5,671 mil) to the sustainable energy sector, is shown in Table 6.5 below
Table 6.5: Economic impact of shifting 10% of outpu t from conventional energy to renewable energy
Direct impact
• Loss of output from conventional energy � (-Taka 5,671 mil)
• Loss of employment of �-6,805
• Increase in output from renewable energy � (Taka 5,671mil)
• Gain in employment of � 7,996
Indirect impact
Fall in demand for inputs to conventional energy with subsequent fall in output from various sectors
Increase in demand for inputs to sustainable energy sector, and subsequent increases in demand from various sectors
Indirect Impacts Output
(mil Taka)
Jobs
Increase in demand of the sustainable energy sector inputs of Taka 5,671 mil 2,728 21,575
Reduction in demand of conventional energy inputs of Taka 5,671 mil -2,748 -21,446
Net Indirect Impact -20 130
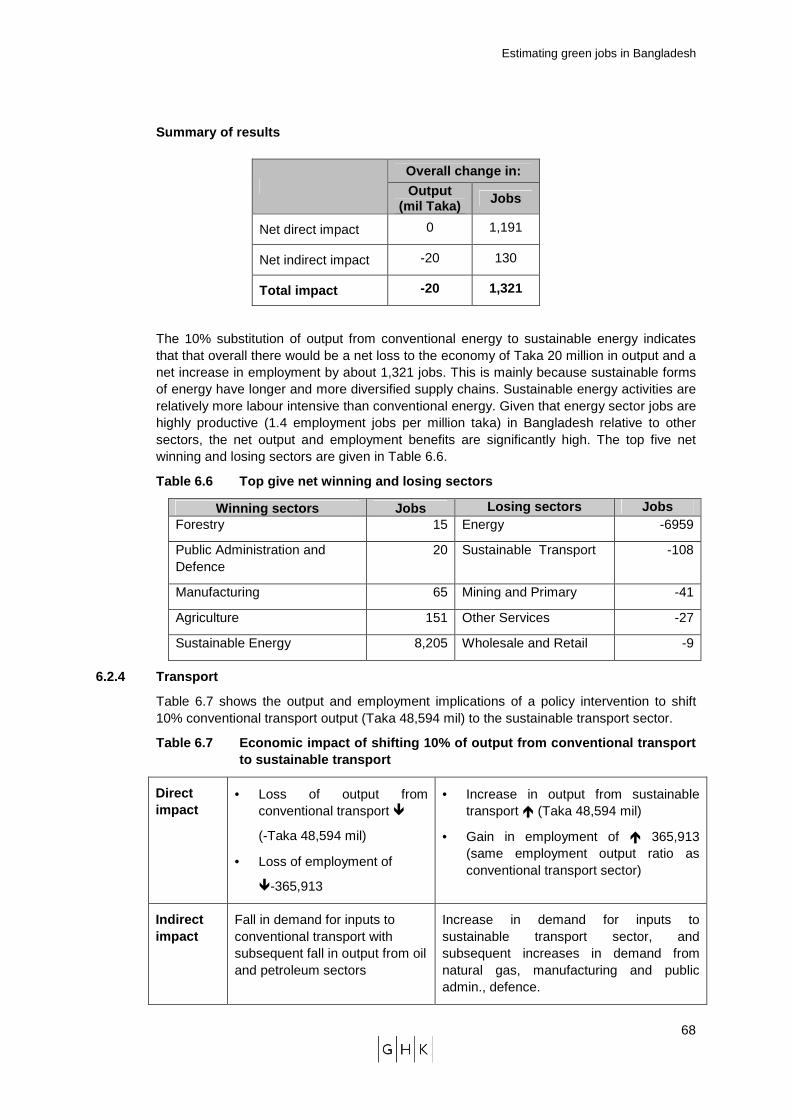
Estimating green jobs in Bangladesh
68
Summary of results
The 10% substitution of output from conventional energy to sustainable energy indicates that that overall there would be a net loss to the economy of Taka 20 million in output and a net increase in employment by about 1,321 jobs. This is mainly because sustainable forms of energy have longer and more diversified supply chains. Sustainable energy activities are relatively more labour intensive than conventional energy. Given that energy sector jobs are highly productive (1.4 employment jobs per million taka) in Bangladesh relative to other sectors, the net output and employment benefits are significantly high. The top five net winning and losing sectors are given in Table 6.6.
Table 6.6 Top give net winning and losing sectors
Winning sectors Jobs Losing sectors Jobs Forestry 15 Energy -6959
Public Administration and Defence
20 Sustainable Transport -108
Manufacturing 65 Mining and Primary -41
Agriculture 151 Other Services -27
Sustainable Energy 8,205 Wholesale and Retail -9
6.2.4 Transport
Table 6.7 shows the output and employment implications of a policy intervention to shift 10% conventional transport output (Taka 48,594 mil) to the sustainable transport sector.
Table 6.7 Economic impact of shifting 10% of outpu t from conventional transport to sustainable transport
Direct impact
• Loss of output from conventional transport �
(-Taka 48,594 mil)
• Loss of employment of
�-365,913
• Increase in output from sustainable transport � (Taka 48,594 mil)
• Gain in employment of � 365,913 (same employment output ratio as conventional transport sector)
Indirect impact
Fall in demand for inputs to conventional transport with subsequent fall in output from oil and petroleum sectors
Increase in demand for inputs to sustainable transport sector, and subsequent increases in demand from natural gas, manufacturing and public admin., defence.
Overall change in:
Output (mil Taka) Jobs
Net direct impact 0 1,191
Net indirect impact -20 130
Total impact -20 1,321
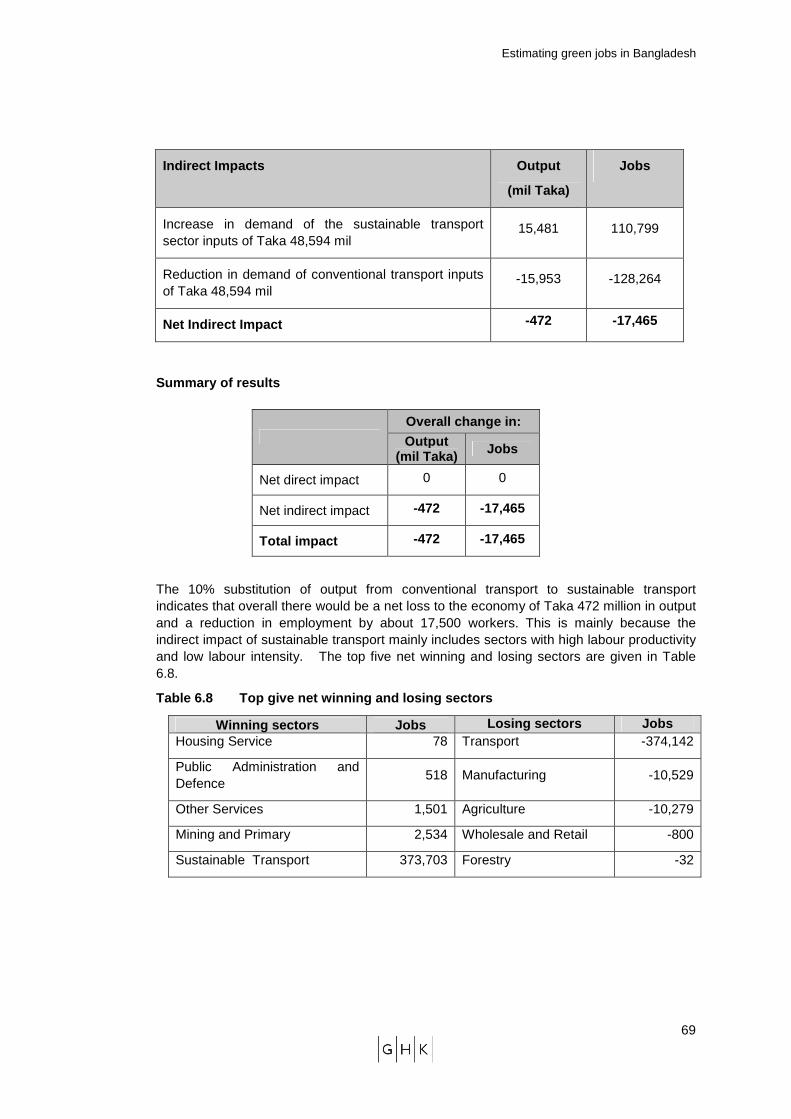
Estimating green jobs in Bangladesh
69
Indirect Impacts Output
(mil Taka)
Jobs
Increase in demand of the sustainable transport sector inputs of Taka 48,594 mil
15,481 110,799
Reduction in demand of conventional transport inputs of Taka 48,594 mil
-15,953 -128,264
Net Indirect Impact -472 -17,465
Summary of results
The 10% substitution of output from conventional transport to sustainable transport indicates that overall there would be a net loss to the economy of Taka 472 million in output and a reduction in employment by about 17,500 workers. This is mainly because the indirect impact of sustainable transport mainly includes sectors with high labour productivity and low labour intensity. The top five net winning and losing sectors are given in Table 6.8.
Table 6.8 Top give net winning and losing sectors
Winning sectors Jobs Losing sectors Jobs Housing Service 78 Transport -374,142
Public Administration and Defence
518 Manufacturing -10,529
Other Services 1,501 Agriculture -10,279
Mining and Primary 2,534 Wholesale and Retail -800
Sustainable Transport 373,703 Forestry -32
Overall change in:
Output (mil Taka) Jobs
Net direct impact 0 0
Net indirect impact -472 -17,465
Total impact -472 -17,465
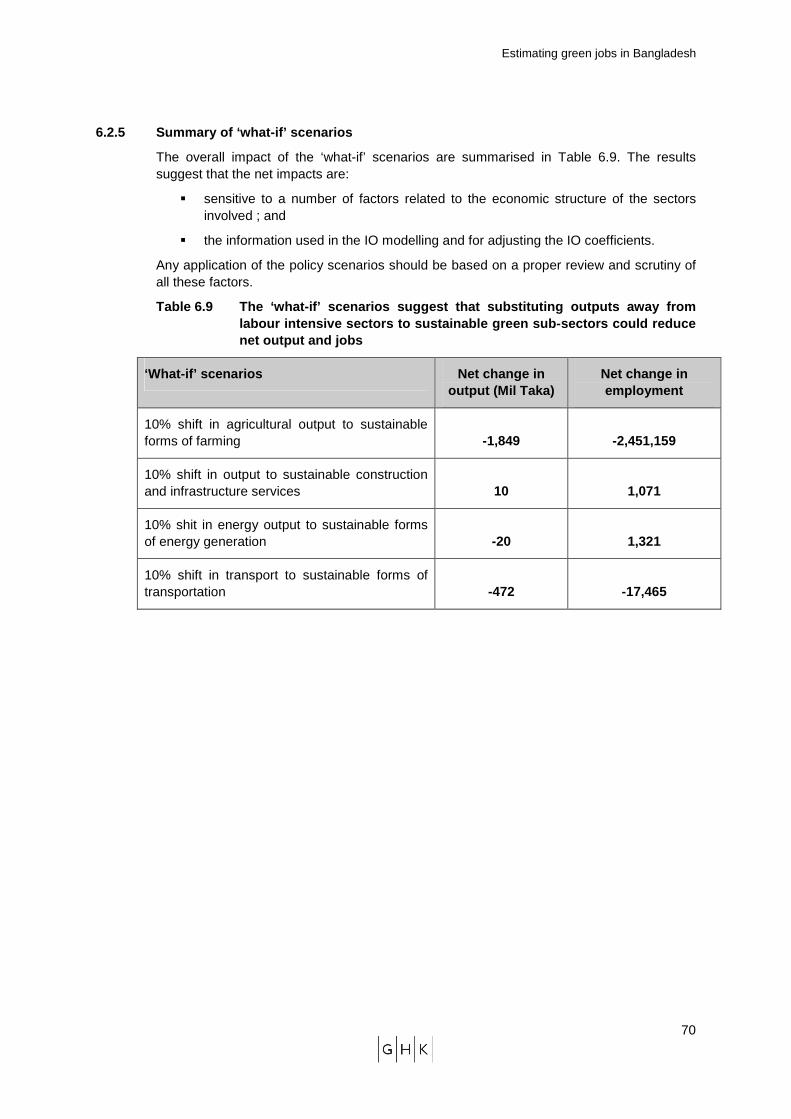
Estimating green jobs in Bangladesh
70
6.2.5 Summary of ‘what-if’ scenarios
The overall impact of the ‘what-if’ scenarios are summarised in Table 6.9. The results suggest that the net impacts are:
� sensitive to a number of factors related to the economic structure of the sectors involved ; and
� the information used in the IO modelling and for adjusting the IO coefficients.
Any application of the policy scenarios should be based on a proper review and scrutiny of all these factors.
Table 6.9 The ‘what-if’ scenarios suggest that subs tituting outputs away from labour intensive sectors to sustainable green sub-s ectors could reduce net output and jobs
‘What-if’ scenarios Net change in output (Mil Taka)
Net change in employment
10% shift in agricultural output to sustainable forms of farming -1,849 -2,451,159
10% shift in output to sustainable construction and infrastructure services 10 1,071
10% shit in energy output to sustainable forms of energy generation -20 1,321
10% shift in transport to sustainable forms of transportation -472 -17,465
Estimating green jobs in Bangladesh
71
7 CONCLUDING DISCUSSION
This chapter provides a concluding discussion of the main messages and issues arising. The discussions are covered under:
� strategic issues;
� policy considerations; and
� methodological issues for estimating green jobs.
Most of the findings are from the literature review and interviews with key experts and stakeholders in Bangladesh.
7.1 Strategic issues
Green growth and economic development can go hand i n hand, though issues regarding the concept of green jobs still remain
The Bangladesh economy has grown at about 6% per annum in the last five years. The recent global slowdown has not significantly changed these reported figures and official figures continue to cite stability in the economy. At the same time, international donor commitments to assist Bangladesh in responding to climate change have increased. Whilst the exact figures for these commitments are not available, the growth in green jobs should be seen in two relative contexts:
� Firstly, what is the proportion of growth in green jobs when compared to overall national job growth? Have green jobs exceeded national job growth as a whole, or are green jobs merely keeping up with other trends?
� Secondly, what proportion of jobs created by environment and climate change investments can be considered ‘green’? Is there any evidence that most of the jobs created are green?
Low cost small scale renewable technologies are cre ating a significant number of jobs and have great potential for the future
The potential for the growth of the renewable energy sector is significant given supply and price constraints as well as the volatility of fossil-fuel markets. In particular, solar energy (especially home based units and stoves) and bio-gas are becoming increasingly popular options. Much of the hardware for these technologies is imported from abroad, but in the past few years there has been a steady increase in cottage-based producers of solar stoves, for example. Domestic production of these technologies (and thus jobs) is projected to rise with increase in demand and fall in prices. At the moment, much of the growth is in the installation and repair of these units, although this is expected to change rapidly.
Opportunities to ‘green the supply chain’ need to b e considered in developing countries as environmental regulations are relative ly less stringent
One of the major policy challenges is to ensure that ‘greenness’ of jobs is sustained throughout the value chain. Most of the identified green activities in Bangladesh are due to isolated initiatives by the government, private companies or NGOs. Jobs in the supply chain are not necessarily green. In some cases, minor policy interventions can improve the environmental sustainability of activities that are supporting jobs in the supply chain. The forestry sector is such an example. If the legal provisions (the existing Acts and regulations) are enforced, most of the jobs related to forestry could legitimately be considered green - and these jobs will be formal in nature. There is also potential of this kind in agriculture. These changes, though desirable, will not happen over night. Thus, the
Estimating green jobs in Bangladesh
72
key question is that in the absence of regulation or non-compliance with existing regulation; is it still possible to have activities, sustaining jobs that make a positive (or even neutral) contribution to the environment?
Not all environment-related jobs in traditional sec tors are necessarily ‘green’. Most of the social issues regarding environment-related job s are endemic across the economy
Whilst there is substantial growth potential for green jobs in some sectors, not all of the work within these sectors may be considered ‘green’. This is mainly due to the definition of ‘green’ jobs, which requires that all green jobs are ‘environmentally’ sustainable and ‘decent’. Many of the environment-related jobs in sectors such as agriculture and manufacturing and in activities such as waste management and recycling are not decent. Most of the jobs in the economy, and not just in these sectors/activities, offer very low wages, provide very low labour participation rates for women and high wage disparities between men and women and are characterised by poor or hazardous working conditions.
On-plot (household based) green jobs should also be considered
A sector based analysis is not able to capture household-based jobs created as a result of rural development programmes and adaptation investments. The ability of households to spend more time on income-generating work resulting from labour saving environmental technologies should also be considered. For example, innovations and investments in rainwater harvesting and better water management techniques mean that people do not have to travel long distances to collect water. These technologies not only create new jobs but the time saved creates more livelihood opportunities.
7.2 Policy issues
Legislation and policies without enforcement are in effective to uphold labour standards and working conditions
In many cases, it’s mostly the non-compliance with existing labour standards or their inadequate enforcement that raise barriers to labelling jobs as ‘green’. Examples are jobs in waste management and plastic waste recycling. These jobs meet the environmental conditions of ‘green jobs’ but adequate labour standards don’t exist or are not enforced. Work in this sector is often undertaken on an informal basis, and many collectors and processors handle wastes in the same basic manner, with little or no regard for the remnants of the potentially toxic materials left in the containers they collect. This is true of small industries as well as larger industrial operations: all of which demand waste management and recycling services. Thus, interventions to enforce labour standards can contribute significantly to making these types of jobs genuinely ‘green’. Overall, enforcement of regulations and implementation of existing policies would address the issues related to decent work indicators identified in the study. This would greatly affect the final estimates of green jobs.
Government support does not match up with NGO initi atives and support from external agencies
Despite significant commitments by the international community, and considerable interest by both indigenous as well as international research and NGOs, little is being done in Bangladesh to stimulate investment in conservation, environmental management or responding to climate change as a whole. Little internal support is provided relative to the international support for promoting green growth. There is no single ministry managing work on climate change and many activities are arranged on an ad hoc basis with little or no coordination or discussion amongst ministries. Moreover, there is little sharing of information between institutions and among ministries. Better coordination and greater
Estimating green jobs in Bangladesh
73
initiative on the part of government entities could yield significant results in terms of green growth and the jobs that it will create.
7.3 Methodological issues
There was a noticeable difference in understanding amongst the interviewees and the interviewers on the definition of a ‘green’ job
Many respondents viewed green jobs as all jobs created by the ‘green’ economy or resulting technologies and processes, irrespective of their sustainability or other broader circumstances or conditions. This was a major challenge. Although many of the interviewees had attended the ILO Green Jobs Focus Group Discussions (FGD) held in 2009, this did not necessarily confer a good understanding of the concept of green jobs. The definition of green jobs has been difficult to convey. The respondents each had their own way of defining a green job, based on their experience, specialism and purview. For example, some of the interviewees (especially for climate adaptation activities) only considered jobs to be green if they directly led to greenhouse gas (GHG) reductions. They did not take into consideration the wider environmental sustainability aspects of adaptation related jobs such as biodiversity conservation, flood protection and water quality.
Face to face interviews were more effective means o f drawing out information and generate discussions than correspondence via email or telephone
In developing countries, where the green jobs debate is fairly in its infancy, the best approach to this type of study is to conduct as many face-to-face interviews as possible. This method is more time consuming and costly, but is the best way of ensuring reliable results.
In this study there was a lot of discussion in the face-to-face interviews that were conducted, and useful information was gathered. By contrast, conducting interviews via telephone and e-mail has not been very effective in terms of getting substantial insights into the issues. Telephone calls were more useful when a decent amount of time was set aside. Email responses tended to be cursory and lack the sophistication or insights required.
Quantifying green jobs is not straightforward and i ndicators to check if they are decent are difficult to find due to informal nature of these jobs
Identifying direct environment-related jobs is not straightforward. A number of different approaches were used to identify jobs in the absence of official figures. The responses given in telephone and face-to-face discussions (which were based on semi-structured questionnaires) tended to be qualitative. They were helpful for research on the social aspects of environment-related jobs but responses on number of jobs created were mainly based on conjecture and presented as a ‘best-guess’. Thus, the research team had to be very careful in using these figure as it was not possible to confirm or refute estimates by supporting evidence or other documentation. In most cases, the sector studies used in this study have been either commissioned by or undertaken in association with the ILO. The ‘Green Jobs Toolkit’ that accompanies this study provides more details on the pros and cons of the methods used to identify green jobs.
The indirect effects estimated through input-output modelling also have their own set of challenges70. The modelling exercise calls for specific economic data on purchases and sales to and from the green sectors. In this study, qualitative survey and literature review findings had to be translated into quantitative estimates to estimate the indirect effects. A wide range of methods can be used to obtain the economic data on purchases and sales to
70 Discussed in more detail in the Practitioner’s Guide.
Estimating green jobs in Bangladesh
74
and from green sectors. Some of them are more sophisticated than others and the choice depends on the available time and resources at disposal.
Even when environment-related jobs can be identified; understanding the quality of these jobs is not straightforward. Some of the environment related jobs exist in the formal sector, such as jobs related to sustainable energy and CNG conversions. Employment in some of the formal sectors in the past decade has been significant and job characteristics are readily available from official sources. However, jobs in the formal sector still account for a very small share of the total economy in Bangladesh. Jobs in the agricultural, forestry, fisheries and manufacturing (including recycling) sectors account for three-fourth of all jobs and are predominantly classified as informal. Information on their working conditions, wages or other indicators are not properly measured or collected. This makes it difficult to assess whether identified environment-related jobs in these sectors are decent.
Each institution, individual and sector representat ive had its own bias regarding type and quality of jobs
These biases varied within and across industrial sectors. Policy biases amongst specific government agencies, think-tanks and research agencies were also apparent. These biases are not confined to only technical or policy biases, as they often could be subtly construed as political biases as well.
The net effect of green growth on employment should also be considered
It is helpful for policy makers to look at the new jobs created and existing jobs transformed as a result of green activities. However, the impact on sectors that may lose out in the transformation should also be considered. Some economic activities have relatively less consideration for environmental sustainability. For example, ship breaking (especially of petroleum and chemical tankers) can involve environmentally unsustainable practices. Does expansion of such work warrant creation of a ‘debit’ account to be offset against green employment ‘credits’ elsewhere in the construction of a picture of the changing shape of employment in the country?
There is also a need to consider the extent of full -time versus part time work
The nature of work in Bangladesh is similar to that of other heavily indebted poor countries (HIPCs) in that many people gain their livelihoods through a variety of means. Not only does this spread the household risk of an over-reliance on any one sector, but it also allows for income smoothing on a household basis from month to month. It is quite possible for informally employed individuals to be engaged in a part time job that is green and another job that is not. This employment aspect has not been factored in this study. In a poor country such as Bangladesh, this issue, especially with the size and extent of informal labour, is an important consideration.
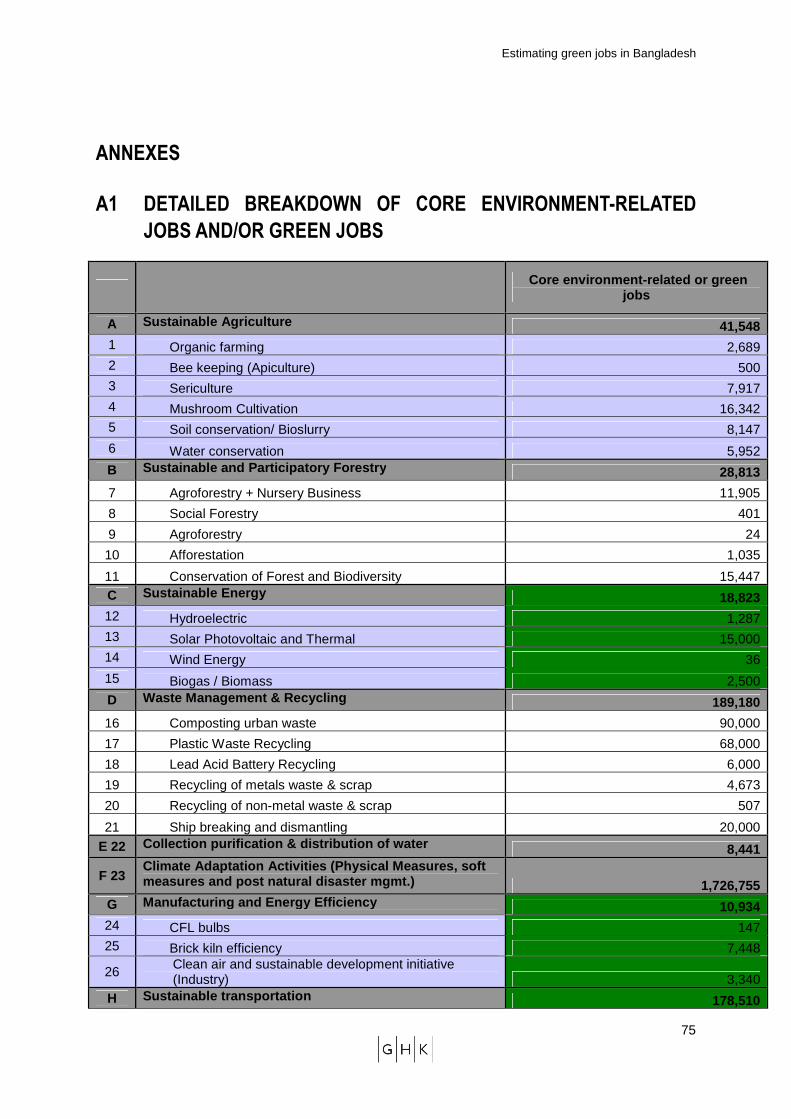
Estimating green jobs in Bangladesh
75
ANNEXES
A1 DETAILED BREAKDOWN OF CORE ENVIRONMENT-RELATED
JOBS AND/OR GREEN JOBS
Core environment-related or green jobs
A Sustainable Agriculture 41,548 1 Organic farming 2,689 2 Bee keeping (Apiculture) 500 3 Sericulture 7,917 4 Mushroom Cultivation 16,342 5 Soil conservation/ Bioslurry 8,147 6 Water conservation 5,952 B Sustai nable and Participatory Forestry 28,813
7 Agroforestry + Nursery Business 11,905
8 Social Forestry 401
9 Agroforestry 24
10 Afforestation 1,035
11 Conservation of Forest and Biodiversity 15,447 C Sustainable Energy 18,823 12 Hydroelectric 1,287 13 Solar Photovoltaic and Thermal 15,000 14 Wind Energy 36 15 Biogas / Biomass 2,500 D Waste Management & Recycling 189,180
16 Composting urban waste 90,000
17 Plastic Waste Recycling 68,000
18 Lead Acid Battery Recycling 6,000
19 Recycling of metals waste & scrap 4,673
20 Recycling of non-metal waste & scrap 507
21 Ship breaking and dismantling 20,000
E 22 Collection purification & distribution of water 8,441
F 23 Climate Adaptat ion Activities (Physical Measures, soft measures and post natural disaster mgmt.) 1,726,755
G Manufacturing and Energy Efficiency 10,934 24 CFL bulbs 147 25 Brick kiln efficiency 7,448
26 Clean air and sustainable development initiative (Industry) 3,340
H Sustainable transportation 178,510
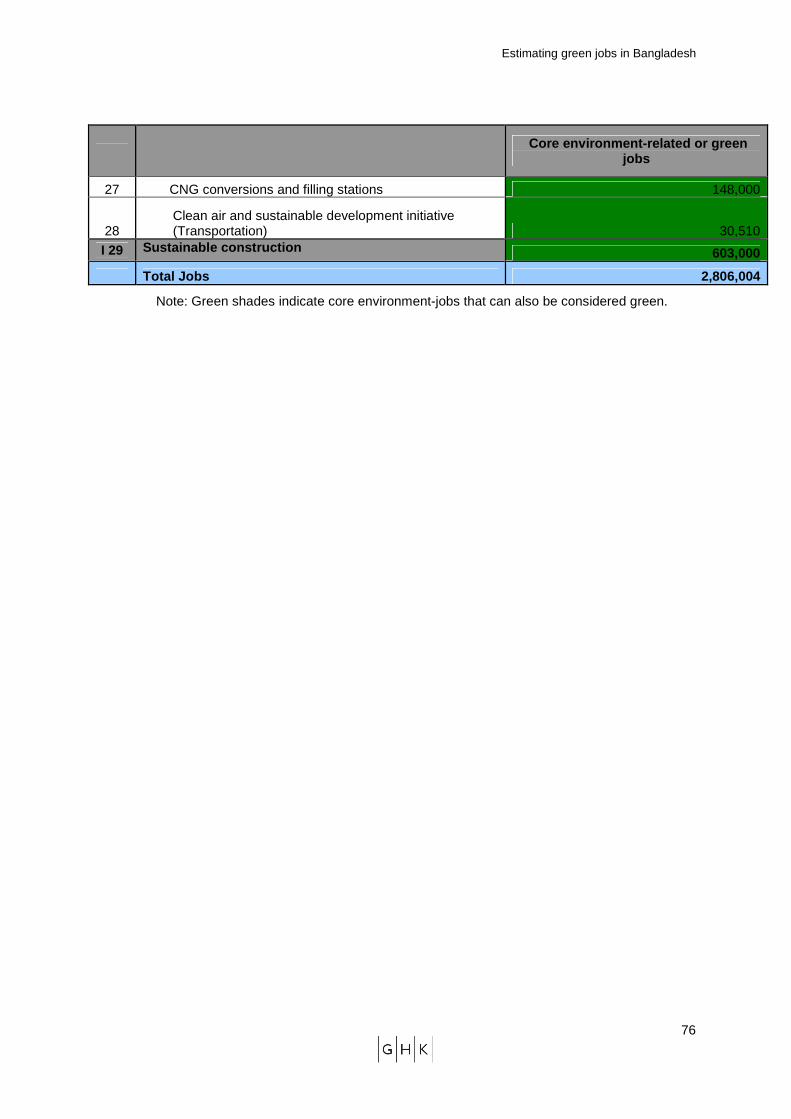
Estimating green jobs in Bangladesh
76
Core environment-related or green jobs
27 CNG conversions and filling stations 148,000
28 Clean air and sustainable development initiative (Transportation) 30,510
I 29 Sustainable construction 603,000
Total Jobs 2,806,004
Note: Green shades indicate core environment-jobs that can also be considered green.
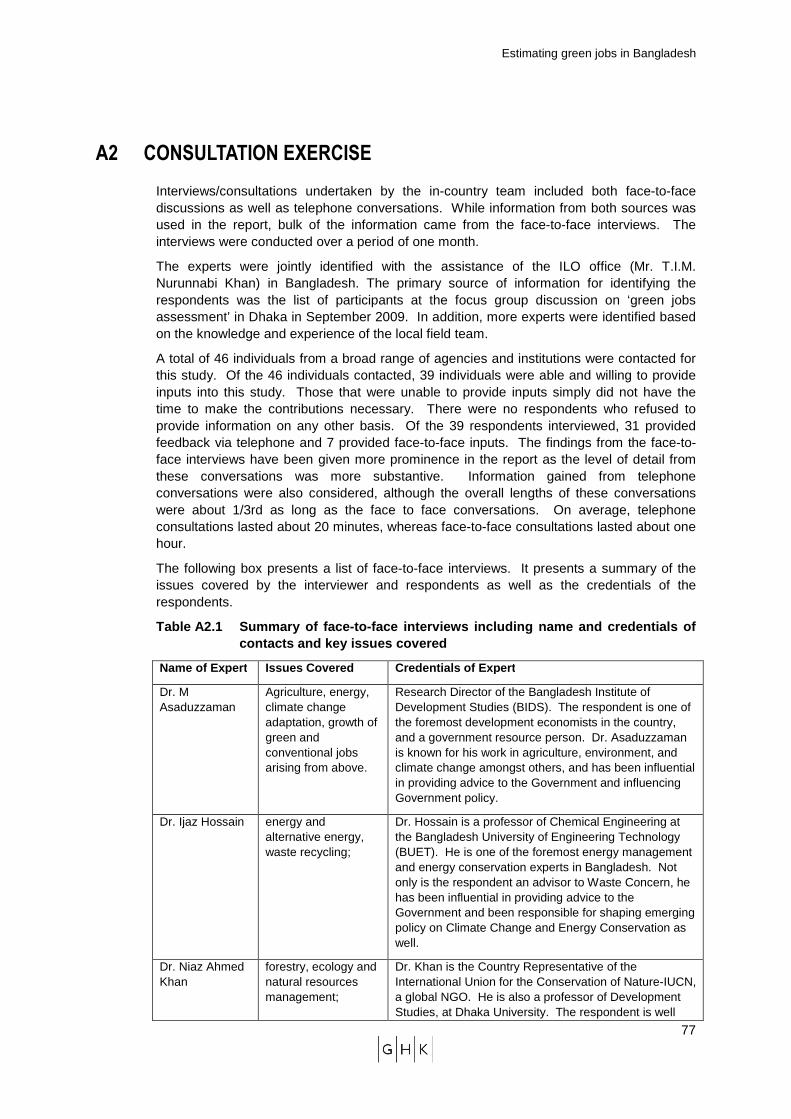
Estimating green jobs in Bangladesh
77
A2 CONSULTATION EXERCISE
Interviews/consultations undertaken by the in-country team included both face-to-face discussions as well as telephone conversations. While information from both sources was used in the report, bulk of the information came from the face-to-face interviews. The interviews were conducted over a period of one month.
The experts were jointly identified with the assistance of the ILO office (Mr. T.I.M. Nurunnabi Khan) in Bangladesh. The primary source of information for identifying the respondents was the list of participants at the focus group discussion on ‘green jobs assessment’ in Dhaka in September 2009. In addition, more experts were identified based on the knowledge and experience of the local field team.
A total of 46 individuals from a broad range of agencies and institutions were contacted for this study. Of the 46 individuals contacted, 39 individuals were able and willing to provide inputs into this study. Those that were unable to provide inputs simply did not have the time to make the contributions necessary. There were no respondents who refused to provide information on any other basis. Of the 39 respondents interviewed, 31 provided feedback via telephone and 7 provided face-to-face inputs. The findings from the face-to-face interviews have been given more prominence in the report as the level of detail from these conversations was more substantive. Information gained from telephone conversations were also considered, although the overall lengths of these conversations were about 1/3rd as long as the face to face conversations. On average, telephone consultations lasted about 20 minutes, whereas face-to-face consultations lasted about one hour.
The following box presents a list of face-to-face interviews. It presents a summary of the issues covered by the interviewer and respondents as well as the credentials of the respondents.
Table A2.1 Summary of face-to-face interviews inclu ding name and credentials of contacts and key issues covered
Name of Expert Issues Covered Credentials of Expert
Dr. M Asaduzzaman
Agriculture, energy, climate change adaptation, growth of green and conventional jobs arising from above.
Research Director of the Bangladesh Institute of Development Studies (BIDS). The respondent is one of the foremost development economists in the country, and a government resource person. Dr. Asaduzzaman is known for his work in agriculture, environment, and climate change amongst others, and has been influential in providing advice to the Government and influencing Government policy.
Dr. Ijaz Hossain energy and alternative energy, waste recycling;
Dr. Hossain is a professor of Chemical Engineering at the Bangladesh University of Engineering Technology (BUET). He is one of the foremost energy management and energy conservation experts in Bangladesh. Not only is the respondent an advisor to Waste Concern, he has been influential in providing advice to the Government and been responsible for shaping emerging policy on Climate Change and Energy Conservation as well.
Dr. Niaz Ahmed Khan
forestry, ecology and natural resources management;
Dr. Khan is the Country Representative of the International Union for the Conservation of Nature-IUCN, a global NGO. He is also a professor of Development Studies, at Dhaka University. The respondent is well
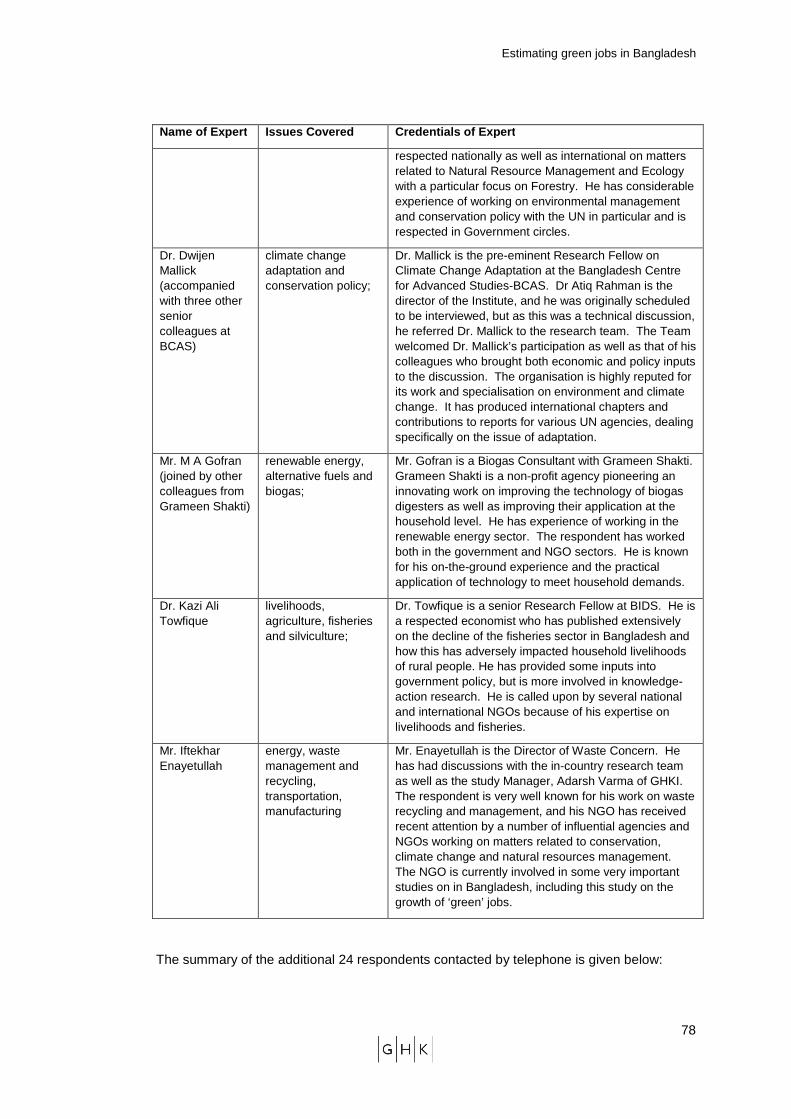
Estimating green jobs in Bangladesh
78
Name of Expert Issues Covered Credentials of Expert
respected nationally as well as international on matters related to Natural Resource Management and Ecology with a particular focus on Forestry. He has considerable experience of working on environmental management and conservation policy with the UN in particular and is respected in Government circles.
Dr. Dwijen Mallick (accompanied with three other senior colleagues at BCAS)
climate change adaptation and conservation policy;
Dr. Mallick is the pre-eminent Research Fellow on Climate Change Adaptation at the Bangladesh Centre for Advanced Studies-BCAS. Dr Atiq Rahman is the director of the Institute, and he was originally scheduled to be interviewed, but as this was a technical discussion, he referred Dr. Mallick to the research team. The Team welcomed Dr. Mallick’s participation as well as that of his colleagues who brought both economic and policy inputs to the discussion. The organisation is highly reputed for its work and specialisation on environment and climate change. It has produced international chapters and contributions to reports for various UN agencies, dealing specifically on the issue of adaptation.
Mr. M A Gofran (joined by other colleagues from Grameen Shakti)
renewable energy, alternative fuels and biogas;
Mr. Gofran is a Biogas Consultant with Grameen Shakti. Grameen Shakti is a non-profit agency pioneering an innovating work on improving the technology of biogas digesters as well as improving their application at the household level. He has experience of working in the renewable energy sector. The respondent has worked both in the government and NGO sectors. He is known for his on-the-ground experience and the practical application of technology to meet household demands.
Dr. Kazi Ali Towfique
livelihoods, agriculture, fisheries and silviculture;
Dr. Towfique is a senior Research Fellow at BIDS. He is a respected economist who has published extensively on the decline of the fisheries sector in Bangladesh and how this has adversely impacted household livelihoods of rural people. He has provided some inputs into government policy, but is more involved in knowledge-action research. He is called upon by several national and international NGOs because of his expertise on livelihoods and fisheries.
Mr. Iftekhar Enayetullah
energy, waste management and recycling, transportation, manufacturing
Mr. Enayetullah is the Director of Waste Concern. He has had discussions with the in-country research team as well as the study Manager, Adarsh Varma of GHKI. The respondent is very well known for his work on waste recycling and management, and his NGO has received recent attention by a number of influential agencies and NGOs working on matters related to conservation, climate change and natural resources management. The NGO is currently involved in some very important studies on in Bangladesh, including this study on the growth of ‘green’ jobs.
The summary of the additional 24 respondents contacted by telephone is given below:
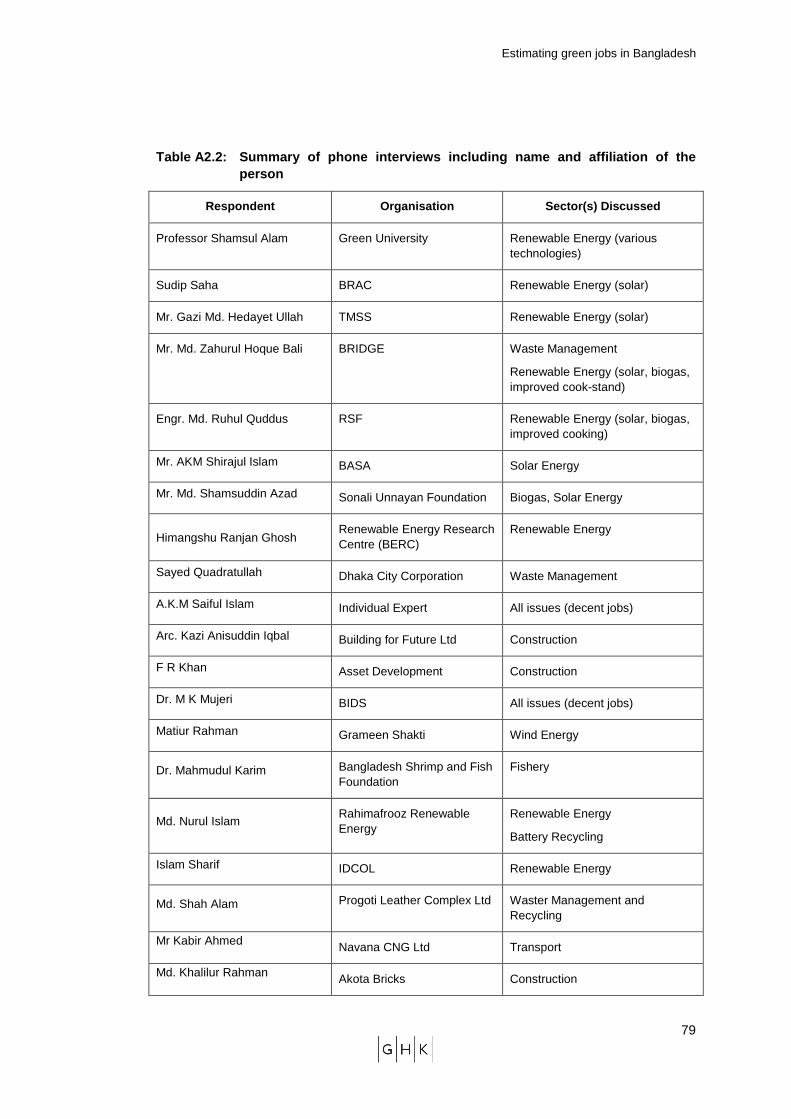
Estimating green jobs in Bangladesh
79
Table A2.2: Summary of phone interviews including n ame and affiliation of the person
Respondent Organisation Sector(s) Discussed
Professor Shamsul Alam Green University Renewable Energy (various technologies)
Sudip Saha BRAC Renewable Energy (solar)
Mr. Gazi Md. Hedayet Ullah TMSS Renewable Energy (solar)
Mr. Md. Zahurul Hoque Bali BRIDGE Waste Management
Renewable Energy (solar, biogas, improved cook-stand)
Engr. Md. Ruhul Quddus RSF Renewable Energy (solar, biogas, improved cooking)
Mr. AKM Shirajul Islam BASA Solar Energy
Mr. Md. Shamsuddin Azad Sonali Unnayan Foundation Biogas, Solar Energy
Himangshu Ranjan Ghosh Renewable Energy Research Centre (BERC)
Renewable Energy
Sayed Quadratullah Dhaka City Corporation Waste Management
A.K.M Saiful Islam Individual Expert All issues (decent jobs)
Arc. Kazi Anisuddin Iqbal Building for Future Ltd Construction
F R Khan Asset Development Construction
Dr. M K Mujeri BIDS All issues (decent jobs)
Matiur Rahman Grameen Shakti Wind Energy
Dr. Mahmudul Karim Bangladesh Shrimp and Fish Foundation
Fishery
Md. Nurul Islam Rahimafrooz Renewable Energy
Renewable Energy
Battery Recycling
Islam Sharif IDCOL Renewable Energy
Md. Shah Alam Progoti Leather Complex Ltd Waster Management and Recycling
Mr Kabir Ahmed Navana CNG Ltd Transport
Md. Khalilur Rahman Akota Bricks Construction
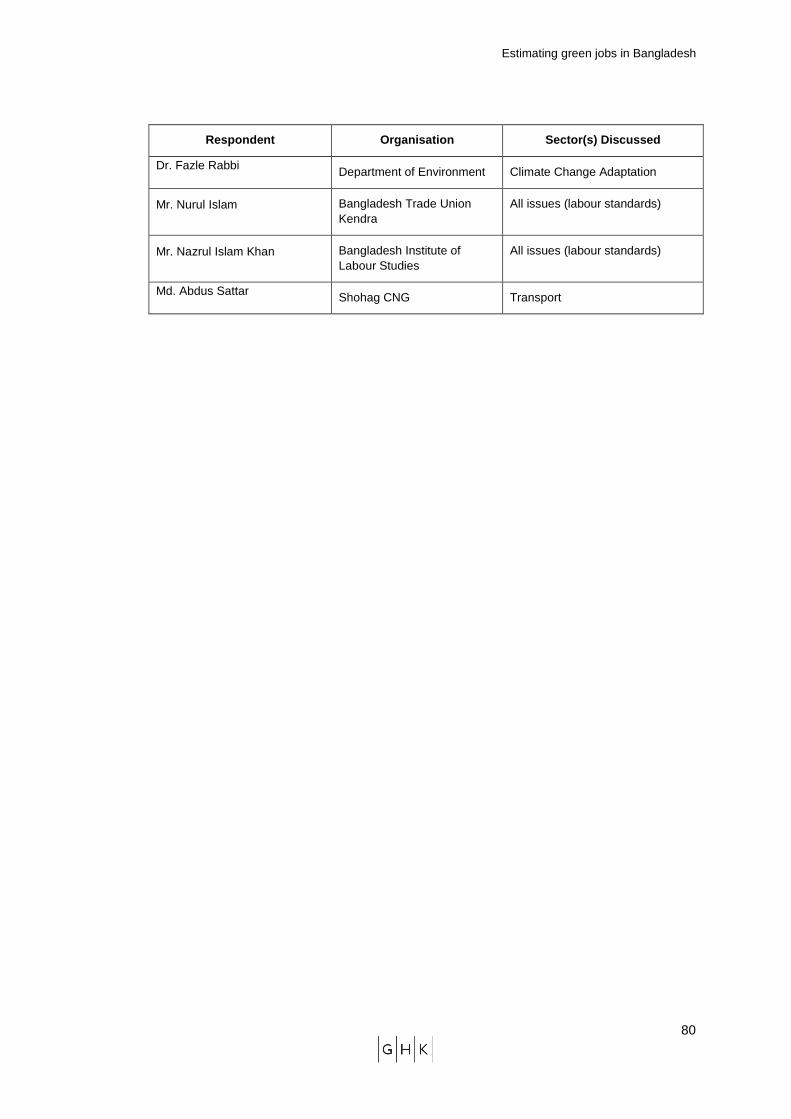
Estimating green jobs in Bangladesh
80
Respondent Organisation Sector(s) Discussed
Dr. Fazle Rabbi Department of Environment Climate Change Adaptation
Mr. Nurul Islam Bangladesh Trade Union Kendra
All issues (labour standards)
Mr. Nazrul Islam Khan Bangladesh Institute of Labour Studies
All issues (labour standards)
Md. Abdus Sattar Shohag CNG Transport
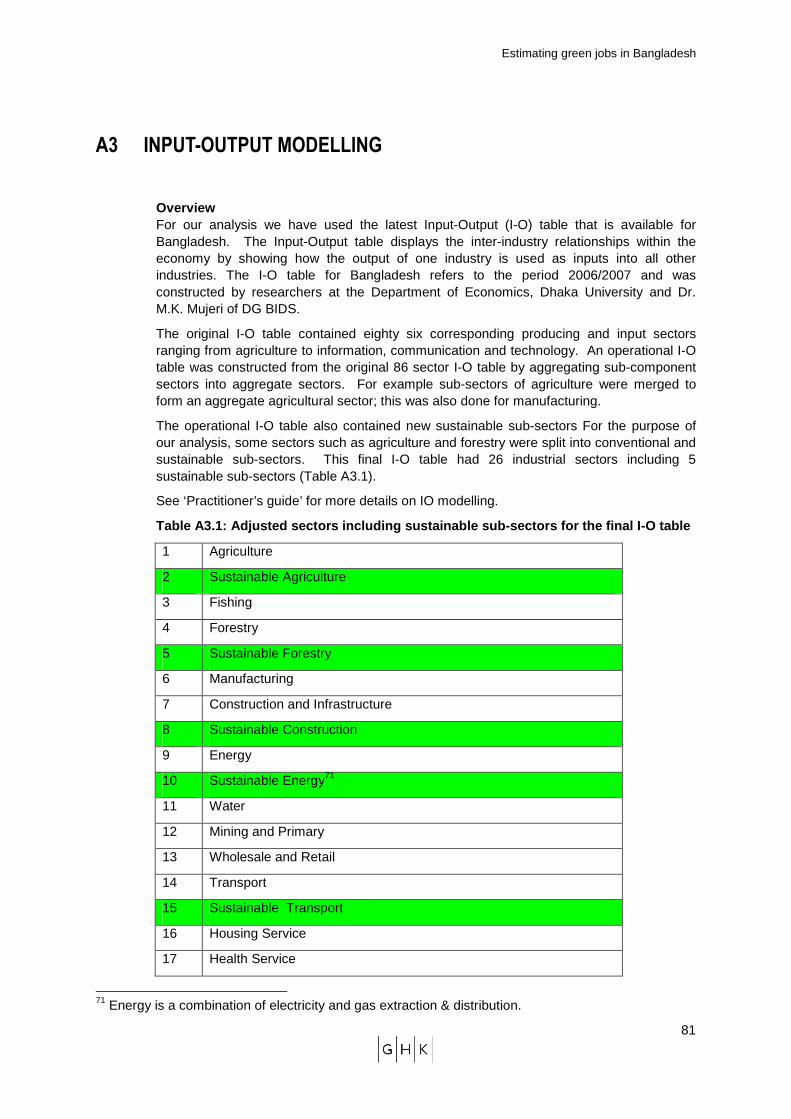
Estimating green jobs in Bangladesh
81
A3 INPUT-OUTPUT MODELLING
Overview For our analysis we have used the latest Input-Output (I-O) table that is available for Bangladesh. The Input-Output table displays the inter-industry relationships within the economy by showing how the output of one industry is used as inputs into all other industries. The I-O table for Bangladesh refers to the period 2006/2007 and was constructed by researchers at the Department of Economics, Dhaka University and Dr. M.K. Mujeri of DG BIDS.
The original I-O table contained eighty six corresponding producing and input sectors ranging from agriculture to information, communication and technology. An operational I-O table was constructed from the original 86 sector I-O table by aggregating sub-component sectors into aggregate sectors. For example sub-sectors of agriculture were merged to form an aggregate agricultural sector; this was also done for manufacturing.
The operational I-O table also contained new sustainable sub-sectors For the purpose of our analysis, some sectors such as agriculture and forestry were split into conventional and sustainable sub-sectors. This final I-O table had 26 industrial sectors including 5 sustainable sub-sectors (Table A3.1).
See ‘Practitioner’s guide’ for more details on IO modelling.
Table A3.1: Adjusted sectors including sustainable sub-sectors for the final I-O table
1 Agriculture
2 Sustainable Agriculture
3 Fishing
4 Forestry
5 Sustainable Forestry
6 Manufacturing
7 Construction and Infrastructure
8 Sustainable Construction
9 Energy
10 Sustainable Energy71
11 Water
12 Mining and Primary
13 Wholesale and Retail
14 Transport
15 Sustainable Transport
16 Housing Service
17 Health Service
71 Energy is a combination of electricity and gas extraction & distribution.
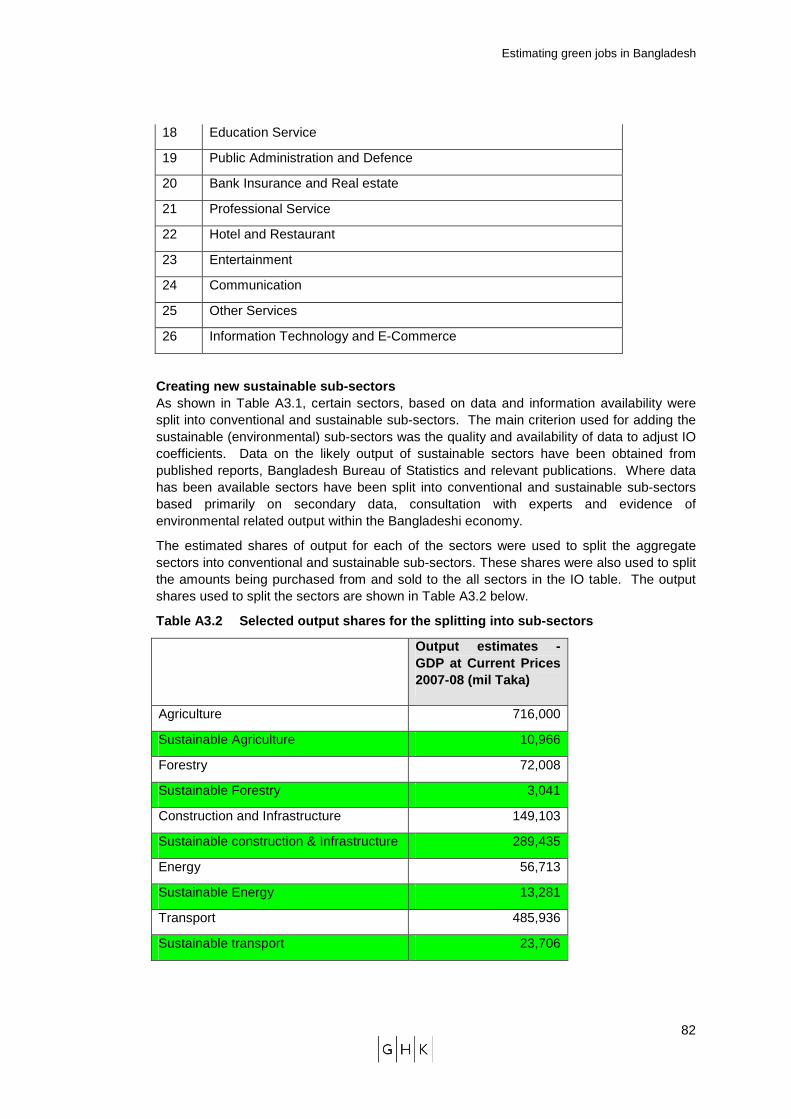
Estimating green jobs in Bangladesh
82
18 Education Service
19 Public Administration and Defence
20 Bank Insurance and Real estate
21 Professional Service
22 Hotel and Restaurant
23 Entertainment
24 Communication
25 Other Services
26 Information Technology and E-Commerce
Creating new sustainable sub-sectors As shown in Table A3.1, certain sectors, based on data and information availability were split into conventional and sustainable sub-sectors. The main criterion used for adding the sustainable (environmental) sub-sectors was the quality and availability of data to adjust IO coefficients. Data on the likely output of sustainable sectors have been obtained from published reports, Bangladesh Bureau of Statistics and relevant publications. Where data has been available sectors have been split into conventional and sustainable sub-sectors based primarily on secondary data, consultation with experts and evidence of environmental related output within the Bangladeshi economy.
The estimated shares of output for each of the sectors were used to split the aggregate sectors into conventional and sustainable sub-sectors. These shares were also used to split the amounts being purchased from and sold to the all sectors in the IO table. The output shares used to split the sectors are shown in Table A3.2 below.
Table A3.2 Selected output shares for the splitting into sub-sectors
Output estimates - GDP at Current Prices 2007-08 (mil Taka)
Agriculture 716,000
Sustainable Agriculture 10,966
Forestry 72,008
Sustainable Forestry 3,041
Construction and Infrastructure 149,103
Sustainable construction & Infrastructure 289,435
Energy 56,713
Sustainable Energy 13,281
Transport 485,936
Sustainable transport 23,706
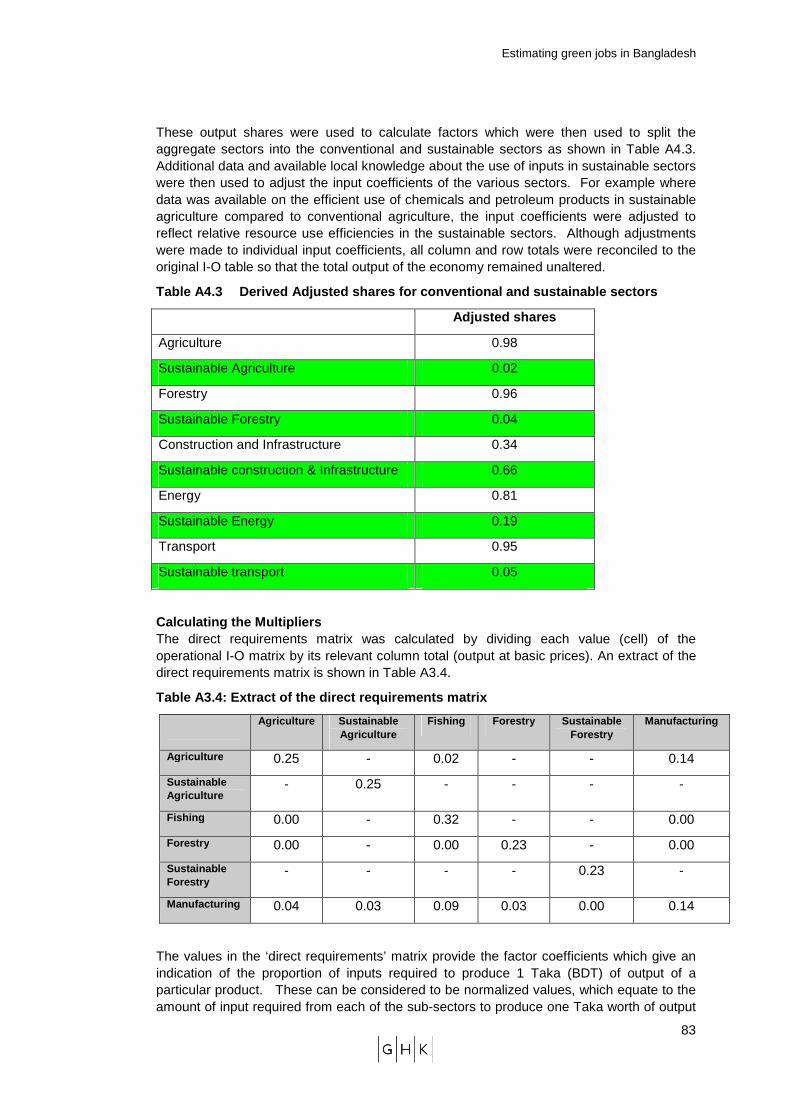
Estimating green jobs in Bangladesh
83
These output shares were used to calculate factors which were then used to split the aggregate sectors into the conventional and sustainable sectors as shown in Table A4.3. Additional data and available local knowledge about the use of inputs in sustainable sectors were then used to adjust the input coefficients of the various sectors. For example where data was available on the efficient use of chemicals and petroleum products in sustainable agriculture compared to conventional agriculture, the input coefficients were adjusted to reflect relative resource use efficiencies in the sustainable sectors. Although adjustments were made to individual input coefficients, all column and row totals were reconciled to the original I-O table so that the total output of the economy remained unaltered.
Table A4.3 Derived Adjusted shares for conventional and sustainable sectors
Adjusted shares
Agriculture 0.98
Sustainable Agriculture 0.02
Forestry 0.96
Sustainable Forestry 0.04
Construction and Infrastructure 0.34
Sustainable construction & Infrastructure 0.66
Energy 0.81
Sustainable Energy 0.19
Transport 0.95
Sustainable transport 0.05
Calculating the Multipliers The direct requirements matrix was calculated by dividing each value (cell) of the operational I-O matrix by its relevant column total (output at basic prices). An extract of the direct requirements matrix is shown in Table A3.4.
Table A3.4: Extract of the direct requirements matr ix
Agriculture Sustainable Agriculture
Fishing Forestry Sustainable Forestry
Manufacturing
Agriculture 0.25 - 0.02 - - 0.14
Sustainable Agriculture
- 0.25 - - - -
Fishing 0.00 - 0.32 - - 0.00
Forestry 0.00 - 0.00 0.23 - 0.00
Sustainable Forestry
- - - - 0.23 -
Manufacturing 0.04 0.03 0.09 0.03 0.00 0.14
The values in the ‘direct requirements’ matrix provide the factor coefficients which give an indication of the proportion of inputs required to produce 1 Taka (BDT) of output of a particular product. These can be considered to be normalized values, which equate to the amount of input required from each of the sub-sectors to produce one Taka worth of output
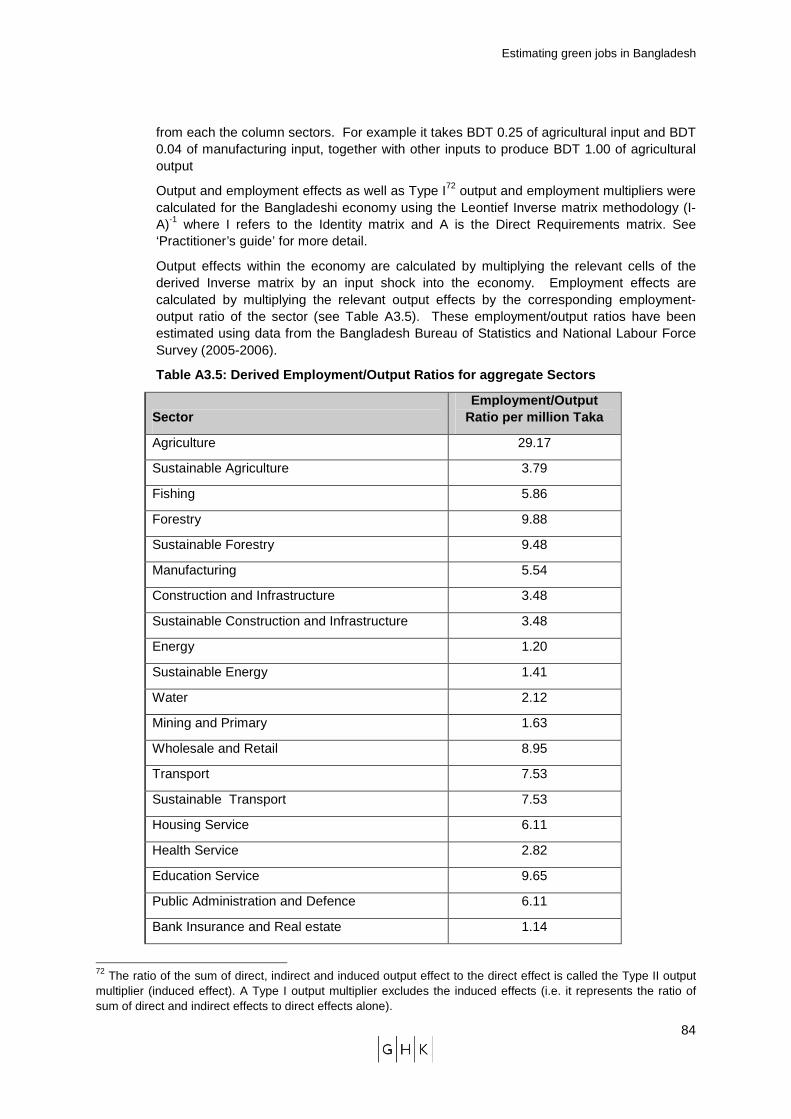
Estimating green jobs in Bangladesh
84
from each the column sectors. For example it takes BDT 0.25 of agricultural input and BDT 0.04 of manufacturing input, together with other inputs to produce BDT 1.00 of agricultural output
Output and employment effects as well as Type I72 output and employment multipliers were calculated for the Bangladeshi economy using the Leontief Inverse matrix methodology (I-A)-1 where I refers to the Identity matrix and A is the Direct Requirements matrix. See ‘Practitioner’s guide’ for more detail.
Output effects within the economy are calculated by multiplying the relevant cells of the derived Inverse matrix by an input shock into the economy. Employment effects are calculated by multiplying the relevant output effects by the corresponding employment-output ratio of the sector (see Table A3.5). These employment/output ratios have been estimated using data from the Bangladesh Bureau of Statistics and National Labour Force Survey (2005-2006).
Table A3.5: Derived Employment/Output Ratios for ag gregate Sectors
Sector Employment/Output
Ratio per million Taka
Agriculture 29.17
Sustainable Agriculture 3.79
Fishing 5.86
Forestry 9.88
Sustainable Forestry 9.48
Manufacturing 5.54
Construction and Infrastructure 3.48
Sustainable Construction and Infrastructure 3.48
Energy 1.20
Sustainable Energy 1.41
Water 2.12
Mining and Primary 1.63
Wholesale and Retail 8.95
Transport 7.53
Sustainable Transport 7.53
Housing Service 6.11
Health Service 2.82
Education Service 9.65
Public Administration and Defence 6.11
Bank Insurance and Real estate 1.14
72 The ratio of the sum of direct, indirect and induced output effect to the direct effect is called the Type II output multiplier (induced effect). A Type I output multiplier excludes the induced effects (i.e. it represents the ratio of sum of direct and indirect effects to direct effects alone).
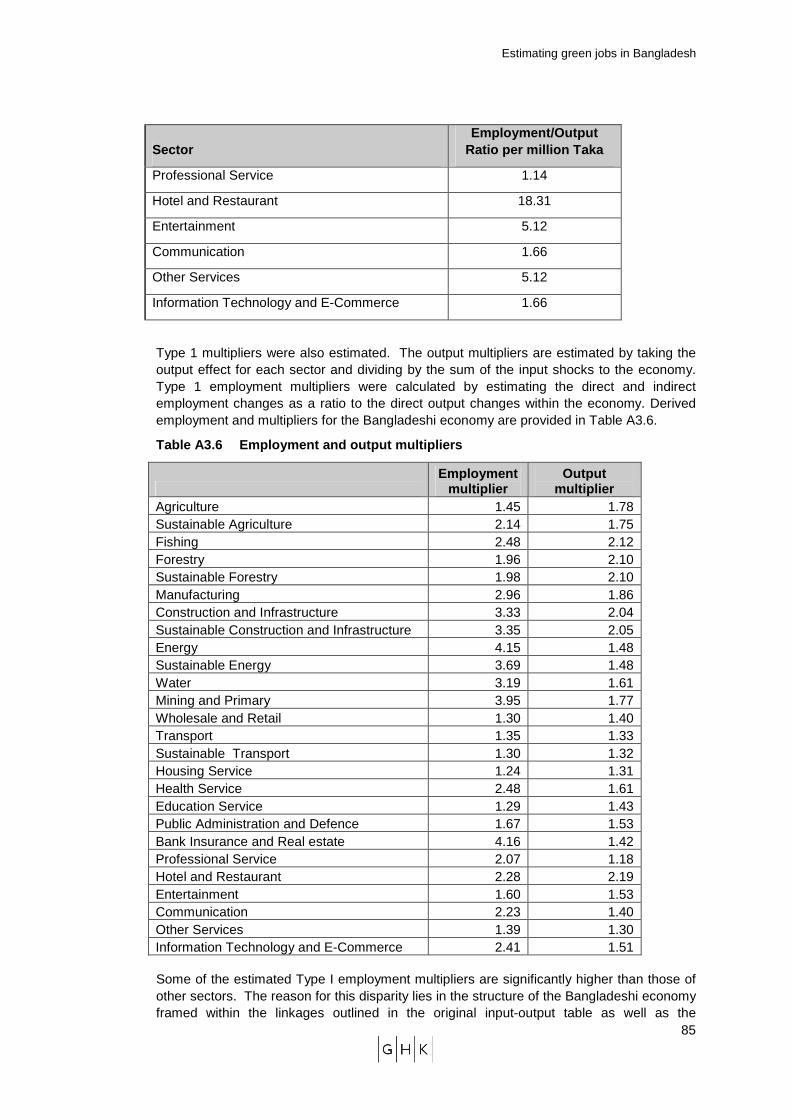
Estimating green jobs in Bangladesh
85
Sector Employment/Output
Ratio per million Taka
Professional Service 1.14
Hotel and Restaurant 18.31
Entertainment 5.12
Communication 1.66
Other Services 5.12
Information Technology and E-Commerce 1.66
Type 1 multipliers were also estimated. The output multipliers are estimated by taking the output effect for each sector and dividing by the sum of the input shocks to the economy. Type 1 employment multipliers were calculated by estimating the direct and indirect employment changes as a ratio to the direct output changes within the economy. Derived employment and multipliers for the Bangladeshi economy are provided in Table A3.6.
Table A3.6 Employment and output multipliers
Employment
multiplier Output
multiplier Agriculture 1.45 1.78 Sustainable Agriculture 2.14 1.75 Fishing 2.48 2.12 Forestry 1.96 2.10 Sustainable Forestry 1.98 2.10 Manufacturing 2.96 1.86 Construction and Infrastructure 3.33 2.04 Sustainable Construction and Infrastructure 3.35 2.05 Energy 4.15 1.48 Sustainable Energy 3.69 1.48 Water 3.19 1.61 Mining and Primary 3.95 1.77 Wholesale and Retail 1.30 1.40 Transport 1.35 1.33 Sustainable Transport 1.30 1.32 Housing Service 1.24 1.31 Health Service 2.48 1.61 Education Service 1.29 1.43 Public Administration and Defence 1.67 1.53 Bank Insurance and Real estate 4.16 1.42 Professional Service 2.07 1.18 Hotel and Restaurant 2.28 2.19 Entertainment 1.60 1.53 Communication 2.23 1.40 Other Services 1.39 1.30 Information Technology and E-Commerce 2.41 1.51
Some of the estimated Type I employment multipliers are significantly higher than those of other sectors. The reason for this disparity lies in the structure of the Bangladeshi economy framed within the linkages outlined in the original input-output table as well as the

Estimating green jobs in Bangladesh
86
underlying productivity of the economic sectors and the labour intensity of those economic sectors such as agriculture, forestry and manufacturing which are significant contributors to output within the Bangladesh economy. In 2007/2008, Agriculture & Forestry accounted for about 15 per cent of GDP while manufacturing accounted for about 17 per cent of GDP. For example, the employment output ratio of the Banking, Insurance and Real Estate sector is small when compared to the large employment multiplier (table 8.6), which suggests that its backward and forward linkages with other labour-intensive economic sectors within the economy may be significant.
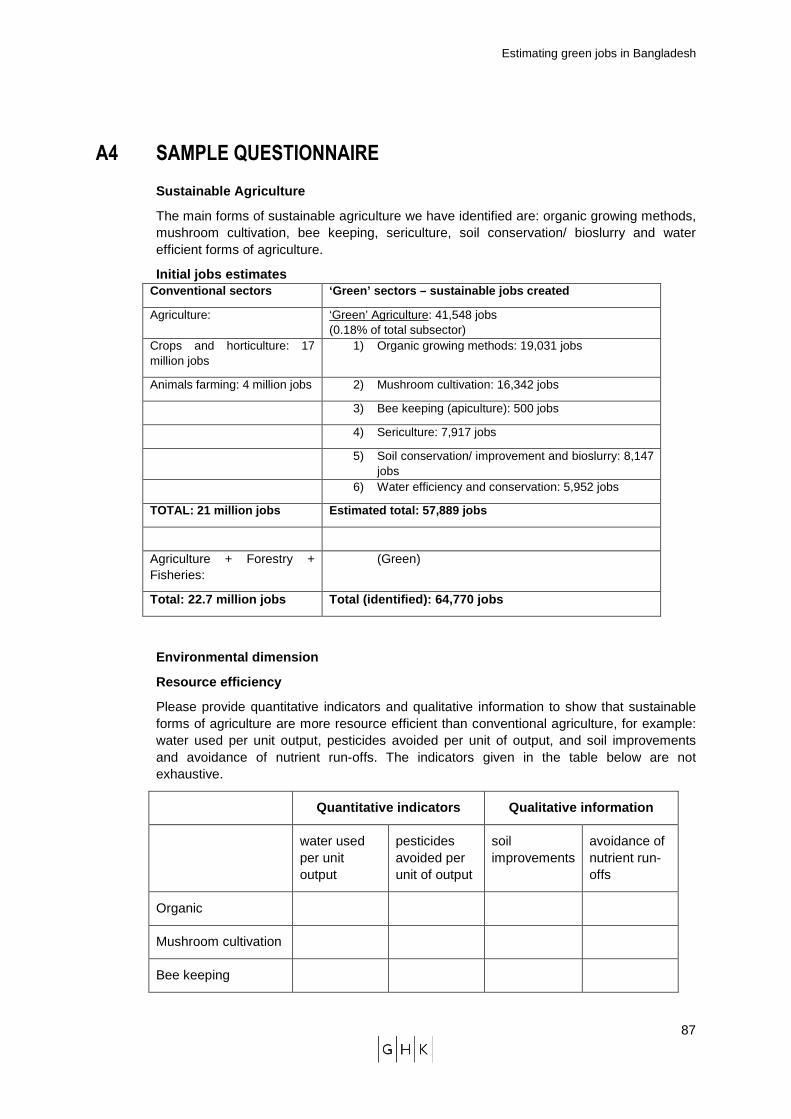
Estimating green jobs in Bangladesh
87
A4 SAMPLE QUESTIONNAIRE
Sustainable Agriculture
The main forms of sustainable agriculture we have identified are: organic growing methods, mushroom cultivation, bee keeping, sericulture, soil conservation/ bioslurry and water efficient forms of agriculture.
Initial jobs estimates Conventional sectors ‘Green’ sectors – sustainable jobs created
Agriculture: ‘Green’ Agriculture: 41,548 jobs (0.18% of total subsector)
Crops and horticulture: 17 million jobs
1) Organic growing methods: 19,031 jobs
Animals farming: 4 million jobs 2) Mushroom cultivation: 16,342 jobs
3) Bee keeping (apiculture): 500 jobs
4) Sericulture: 7,917 jobs
5) Soil conservation/ improvement and bioslurry: 8,147 jobs
6) Water efficiency and conservation: 5,952 jobs
TOTAL: 21 million jobs Estimated total: 57, 889 jobs
Agriculture + Forestry + Fisheries:
(Green)
Total: 22.7 million jobs Total (identified): 64,770 jobs
Environmental dimension
Resource efficiency
Please provide quantitative indicators and qualitative information to show that sustainable forms of agriculture are more resource efficient than conventional agriculture, for example: water used per unit output, pesticides avoided per unit of output, and soil improvements and avoidance of nutrient run-offs. The indicators given in the table below are not exhaustive.
Quantitative indicators Qualitative information
water used per unit output
pesticides avoided per unit of output
soil improvements
avoidance of nutrient run-offs
Organic
Mushroom cultivation
Bee keeping
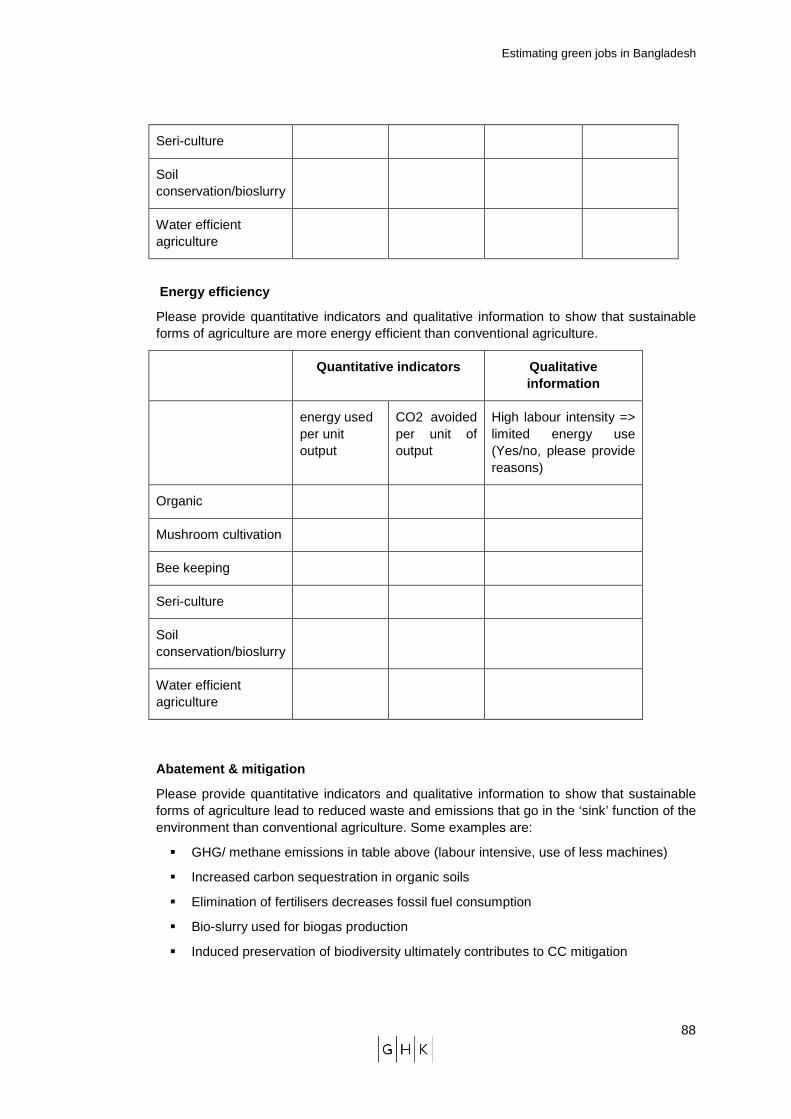
Estimating green jobs in Bangladesh
88
Seri-culture
Soil conservation/bioslurry
Water efficient agriculture
Energy efficiency
Please provide quantitative indicators and qualitative information to show that sustainable forms of agriculture are more energy efficient than conventional agriculture.
Quantitative indicators Qualitative information
energy used per unit output
CO2 avoided per unit of output
High labour intensity => limited energy use (Yes/no, please provide reasons)
Organic
Mushroom cultivation
Bee keeping
Seri-culture
Soil conservation/bioslurry
Water efficient agriculture
Abatement & mitigation
Please provide quantitative indicators and qualitative information to show that sustainable forms of agriculture lead to reduced waste and emissions that go in the ‘sink’ function of the environment than conventional agriculture. Some examples are:
� GHG/ methane emissions in table above (labour intensive, use of less machines)
� Increased carbon sequestration in organic soils
� Elimination of fertilisers decreases fossil fuel consumption
� Bio-slurry used for biogas production
� Induced preservation of biodiversity ultimately contributes to CC mitigation
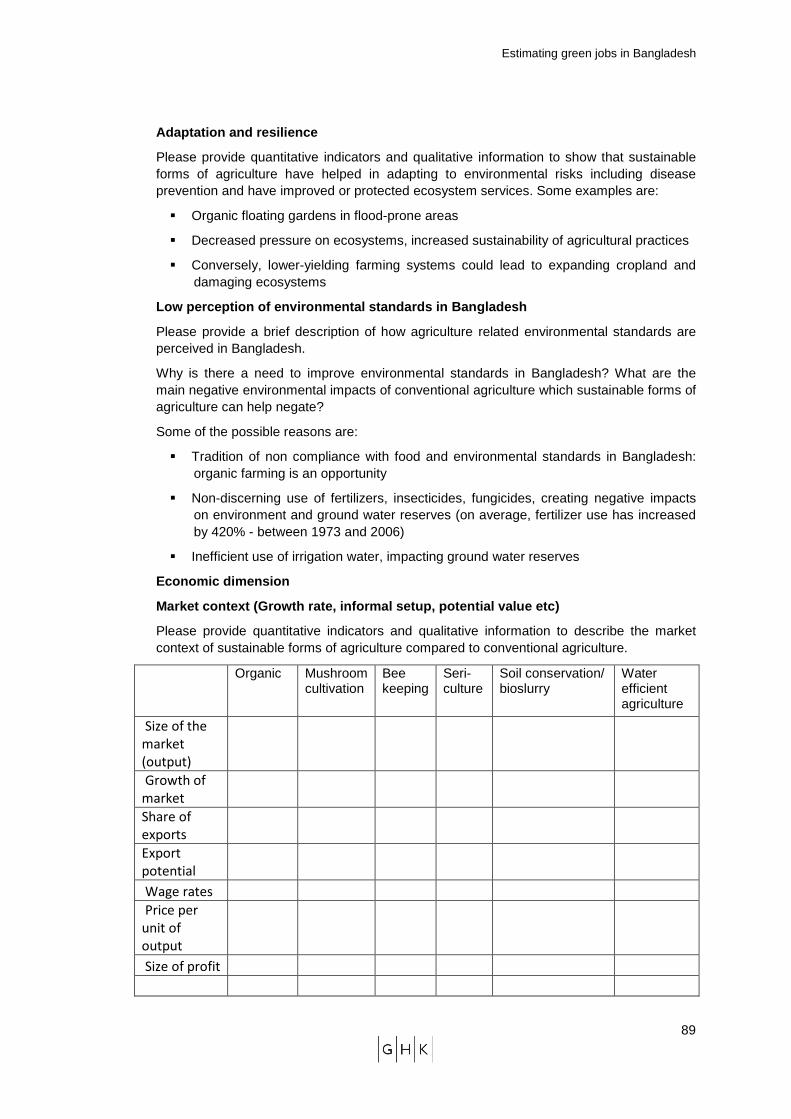
Estimating green jobs in Bangladesh
89
Adaptation and resilience
Please provide quantitative indicators and qualitative information to show that sustainable forms of agriculture have helped in adapting to environmental risks including disease prevention and have improved or protected ecosystem services. Some examples are:
� Organic floating gardens in flood-prone areas
� Decreased pressure on ecosystems, increased sustainability of agricultural practices
� Conversely, lower-yielding farming systems could lead to expanding cropland and damaging ecosystems
Low perception of environmental standards in Bangla desh
Please provide a brief description of how agriculture related environmental standards are perceived in Bangladesh.
Why is there a need to improve environmental standards in Bangladesh? What are the main negative environmental impacts of conventional agriculture which sustainable forms of agriculture can help negate?
Some of the possible reasons are:
� Tradition of non compliance with food and environmental standards in Bangladesh: organic farming is an opportunity
� Non-discerning use of fertilizers, insecticides, fungicides, creating negative impacts on environment and ground water reserves (on average, fertilizer use has increased by 420% - between 1973 and 2006)
� Inefficient use of irrigation water, impacting ground water reserves
Economic dimension
Market context (Growth rate, informal setup, potent ial value etc)
Please provide quantitative indicators and qualitative information to describe the market context of sustainable forms of agriculture compared to conventional agriculture.
Organic Mushroom cultivation
Bee keeping
Seri-culture
Soil conservation/ bioslurry
Water efficient agriculture
Size of the
market
(output)
Growth of
market
Share of
exports
Export
potential
Wage rates
Price per
unit of
output
Size of profit
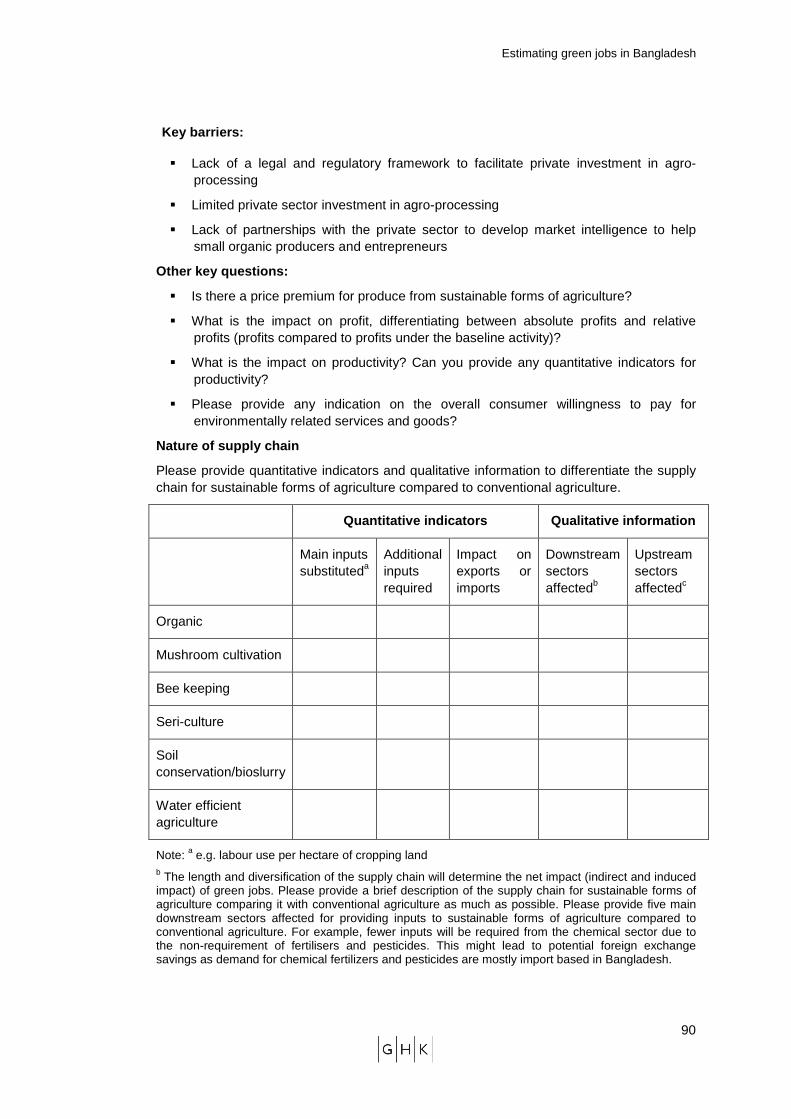
Estimating green jobs in Bangladesh
90
Key barriers:
� Lack of a legal and regulatory framework to facilitate private investment in agro-processing
� Limited private sector investment in agro-processing
� Lack of partnerships with the private sector to develop market intelligence to help small organic producers and entrepreneurs
Other key questions:
� Is there a price premium for produce from sustainable forms of agriculture?
� What is the impact on profit, differentiating between absolute profits and relative profits (profits compared to profits under the baseline activity)?
� What is the impact on productivity? Can you provide any quantitative indicators for productivity?
� Please provide any indication on the overall consumer willingness to pay for environmentally related services and goods?
Nature of supply chain
Please provide quantitative indicators and qualitative information to differentiate the supply chain for sustainable forms of agriculture compared to conventional agriculture.
Quantitative indicators Qualitative information
Main inputs substituteda
Additional inputs required
Impact on exports or imports
Downstream sectors affectedb
Upstream sectors affectedc
Organic
Mushroom cultivation
Bee keeping
Seri-culture
Soil conservation/bioslurry
Water efficient agriculture
Note: a e.g. labour use per hectare of cropping land b The length and diversification of the supply chain will determine the net impact (indirect and induced impact) of green jobs. Please provide a brief description of the supply chain for sustainable forms of agriculture comparing it with conventional agriculture as much as possible. Please provide five main downstream sectors affected for providing inputs to sustainable forms of agriculture compared to conventional agriculture. For example, fewer inputs will be required from the chemical sector due to the non-requirement of fertilisers and pesticides. This might lead to potential foreign exchange savings as demand for chemical fertilizers and pesticides are mostly import based in Bangladesh.
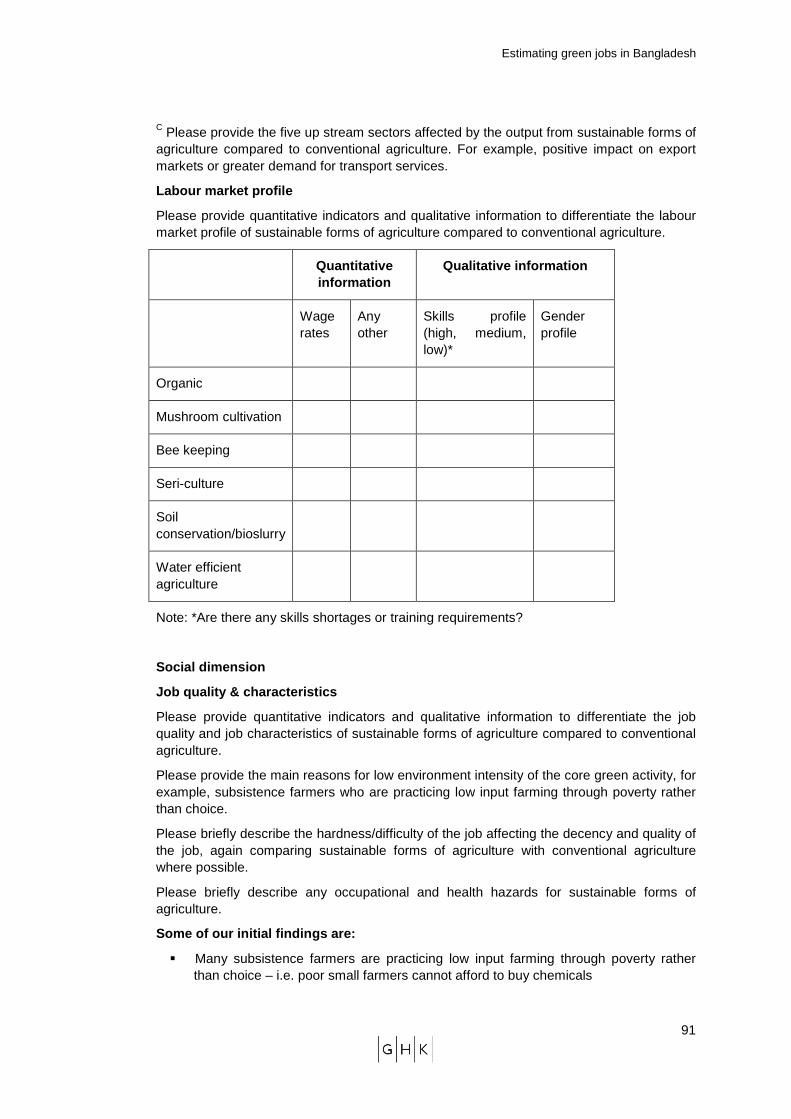
Estimating green jobs in Bangladesh
91
C Please provide the five up stream sectors affected by the output from sustainable forms of agriculture compared to conventional agriculture. For example, positive impact on export markets or greater demand for transport services.
Labour market profile
Please provide quantitative indicators and qualitative information to differentiate the labour market profile of sustainable forms of agriculture compared to conventional agriculture.
Quantitative information
Qualitative information
Wage rates
Any other
Skills profile (high, medium, low)*
Gender profile
Organic
Mushroom cultivation
Bee keeping
Seri-culture
Soil conservation/bioslurry
Water efficient agriculture
Note: *Are there any skills shortages or training requirements?
Social dimension
Job quality & characteristics
Please provide quantitative indicators and qualitative information to differentiate the job quality and job characteristics of sustainable forms of agriculture compared to conventional agriculture.
Please provide the main reasons for low environment intensity of the core green activity, for example, subsistence farmers who are practicing low input farming through poverty rather than choice.
Please briefly describe the hardness/difficulty of the job affecting the decency and quality of the job, again comparing sustainable forms of agriculture with conventional agriculture where possible.
Please briefly describe any occupational and health hazards for sustainable forms of agriculture.
Some of our initial findings are:
� Many subsistence farmers are practicing low input farming through poverty rather than choice – i.e. poor small farmers cannot afford to buy chemicals
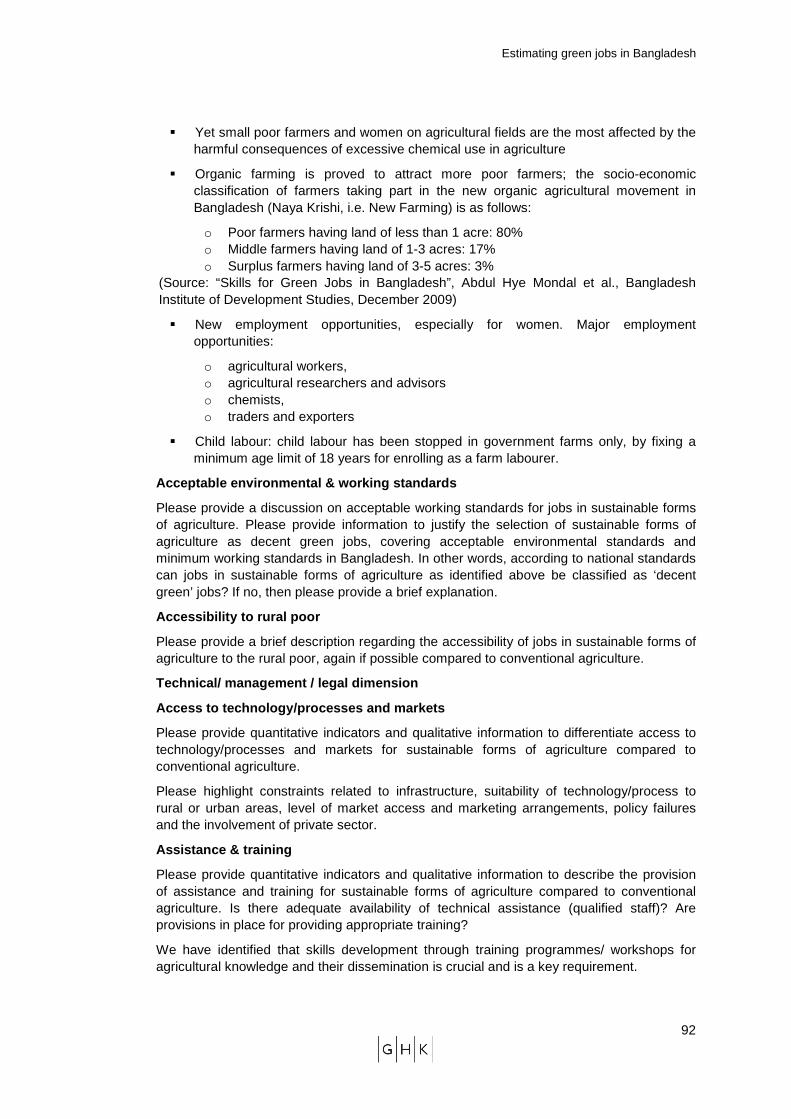
Estimating green jobs in Bangladesh
92
� Yet small poor farmers and women on agricultural fields are the most affected by the harmful consequences of excessive chemical use in agriculture
� Organic farming is proved to attract more poor farmers; the socio-economic classification of farmers taking part in the new organic agricultural movement in Bangladesh (Naya Krishi, i.e. New Farming) is as follows:
o Poor farmers having land of less than 1 acre: 80% o Middle farmers having land of 1-3 acres: 17% o Surplus farmers having land of 3-5 acres: 3%
(Source: “Skills for Green Jobs in Bangladesh”, Abdul Hye Mondal et al., Bangladesh Institute of Development Studies, December 2009)
� New employment opportunities, especially for women. Major employment opportunities:
o agricultural workers, o agricultural researchers and advisors o chemists, o traders and exporters
� Child labour: child labour has been stopped in government farms only, by fixing a minimum age limit of 18 years for enrolling as a farm labourer.
Acceptable environmental & working standards
Please provide a discussion on acceptable working standards for jobs in sustainable forms of agriculture. Please provide information to justify the selection of sustainable forms of agriculture as decent green jobs, covering acceptable environmental standards and minimum working standards in Bangladesh. In other words, according to national standards can jobs in sustainable forms of agriculture as identified above be classified as ‘decent green’ jobs? If no, then please provide a brief explanation.
Accessibility to rural poor
Please provide a brief description regarding the accessibility of jobs in sustainable forms of agriculture to the rural poor, again if possible compared to conventional agriculture.
Technical/ management / legal dimension
Access to technology/processes and markets
Please provide quantitative indicators and qualitative information to differentiate access to technology/processes and markets for sustainable forms of agriculture compared to conventional agriculture.
Please highlight constraints related to infrastructure, suitability of technology/process to rural or urban areas, level of market access and marketing arrangements, policy failures and the involvement of private sector.
Assistance & training
Please provide quantitative indicators and qualitative information to describe the provision of assistance and training for sustainable forms of agriculture compared to conventional agriculture. Is there adequate availability of technical assistance (qualified staff)? Are provisions in place for providing appropriate training?
We have identified that skills development through training programmes/ workshops for agricultural knowledge and their dissemination is crucial and is a key requirement.
Estimating green jobs in Bangladesh
93
Regulatory & institutional framework
Please provide quantitative indicators and qualitative information to highlight any differences in the regulatory and institutional framework for sustainable forms of agriculture compared to conventional agriculture.
Please provide a brief description of the suitability of laws and regulation concerning jobs in sustainable forms of agriculture?
Please identify any gaps in the regulatory and institutional framework which imposes any constraints on the growth of these green jobs?
We have identified that a lack of proper regulatory frameworks for an effective system of food quality and safety assurance, including sanitary and phyto-sanitary requirements (food safety regulations of importing countries) can affect the ability of producers to export.
Estimating green jobs in Bangladesh
94
A5 REFERENCES
Bangladesh Labour Force Survey (2005-2006) http://www.bbs.gov.bd/survey.php
European Commission, DG Internal Policies of the Union (2008) ‘Policy Department Economic and Scientific Policy Climate Change Impacts and Responses in Bangladesh’.
ILO & Dr. M Matiur Rahman (2009), Green Job Assessment in Agriculture and Forestry Sector Of Bangladesh, ILO.
Maligalig, D, S Cuevas and A Rosario (2009) ‘Informal Employment in Bangladesh: ADB Economics Working Paper Series’, Working Paper No. 155, Asian Development Bank.
OECD (2003), Development and Climate Change in Bangladesh: Focus on Coastal Flooding and the Sundarbands. Authors Shardul Agrawala, Tomoko Ota, Ahsan Uddin Ahmed, Joel Smith and Maarten van Aalst.
OECD (2009), Integrating Climate Change Adaptation into Development Co-operation: Policy Guidance.
Policy Analysis Unit (2008), ‘Recent Employment Situation and Labour Market Developments in Bangladesh’ PAU Policy paper. www.bangladesh-bank.org/research/policypaper/pp0807.pdf
Reckoning Social Forestry in Bangladesh (2005): Policy and Plan versus Implementation (by Muhammed et. al. published in Forestry; 78(4), 2005).
Skills for Green Jobs in Bangladesh (2009), Abdul Hye Mondal, Bangladesh Institute of Development Studies.
Waste Concern (2008), Concept note: Workshop on Green Jobs initiative in Bangladesh. Jointly Organized by Ministry of Labour and Employment Government of the People’s Republic of Bangladesh and International Labour Organization.
Waste Concern (2009), Preliminary Assessment of Green Jobs in three sectors: (1) Renewable energy (2) Waste management (3) Construction, ILO Bangladesh. http://www.ilo.org/wcmsp5/groups/public/---asia/---ro-bangkok/---ilo-dhaka/documents/publication/wcms_107516.pdf
Waste Concern (2010a), Assessment of Green Jobs in Renewable Energy Sector, February 2010, ILO Dhaka office.
Waste Concern (2010b), Assessment of Green Jobs in the Construction Sector, February 2010, ILO Dhaka office.
Waste Concern presentation to ILO (2008). http://www.ilo.int/wcmsp5/groups/public/@asia/@ro-bangkok/documents/presentation/wcms_099505.pdf
World Bank (2009) ‘The Costs to Developing Countries of Adapting to Climate Change: New Methods and Estimates’, The Global Report of the Economics of Adaptation to Climate Change Study, Bangladesh Country Case Study.