estero island restoration 2015 annual monitoring report ... · estero island restoration 2015...
TRANSCRIPT
ESTERO ISLAND RESTORATION
2015 ANNUAL MONITORING REPORT
(DEP Permit 0173059-001-JC)
Prepared for:
Lee County Board of County Commissioners
P.O. Box 398
Fort Myers, FL 33902-0398
and
Florida Department of Environmental Protection
3900 Commonwealth Boulevard
Tallahassee, FL 32399-3000
August 12, 2015
CEC File No. 15.102
Estero Island Restoration
2015 Annual Monitoring Report
i
TABLE OF CONTENTS
1.0 INTRODUCTION ............................................................................................................... 1 2.0 SCOPE OF WORK .............................................................................................................. 3
2.1 Physical Monitoring Plan ..................................................................................................3 2.2 Reporting ...........................................................................................................................3
3.0 EQUIPMENT AND QA/QC PROCEDURES .................................................................... 3
3.1 Survey Report ....................................................................................................................3 3.2 Equipment .........................................................................................................................4 3.3 QA/QC Procedures ............................................................................................................4 3.3.1 Data Reduction and Deliverables .............................................................................. 6
4.0 PHYSICAL MONITORING ............................................................................................... 6
4.1 Depth of Closure ...............................................................................................................6 4.2 Shoreline and Volume Change Analyses ..........................................................................6
4.2.1 General ...................................................................................................................... 6
4.2.2 Project Area ............................................................................................................ 12 4.2.3 North Adjacent Shoreline ....................................................................................... 12 4.2.4 South Adjacent Shoreline ....................................................................................... 13
4.2.5 Summary ................................................................................................................. 13 4.3 Project Area Performance ...............................................................................................13
4.4 Contingent Area Performance .........................................................................................19 5.0 CONCLUSION .................................................................................................................. 20 6.0 REFERENCES .................................................................................................................. 21
Estero Island Restoration
2015 Annual Monitoring Report
ii
LIST OF FIGURES
Figure 1. Location Map................................................................................................................. 2 Figure 2. 2014-2015 Shoreline Migration at MHW ..................................................................... 8 Figure 3. 2014-2015 Volumetric Changes Above DOC ............................................................. 10 Figure 4. 2014-2015 Volumetric Change Above MHW ............................................................ 12 Figure 5. 2012-2015 Shoreline Positions within Project Area ................................................... 16
Figure 6. 2012-2015 Volumetric Changes within Project Area ................................................. 18
LIST OF TABLES
Table 1. 2014-2015 Shoreline Positions at MHW ...................................................................... 7 Table 2. 2014-2015 Volumetric Changes Above Depth of Closure ........................................... 9
Table 3. 2014-2015 Volumetric Changes Above Mean High Water ....................................... 11 Table 4. 2012-2015 Shoreline Changes .................................................................................... 15 Table 5. 2012-2015 Volumetric Changes within Project Area ................................................. 17
LIST OF APPENDICES
APPENDIX 1: SURVEY REPORT
APPENDIX 2: BEACH PROFILES
Estero Island Restoration
2015 Annual Monitoring Report
1
1.0 INTRODUCTION
In December 2011, Lee County completed construction of the Estero Island Beach Restoration
Project including sand placement along the north-central segment of the island and the addition
of a terminal groin on the northern end of the beach fill. This report summarizes the results of
the beach fill performance during the third year of post-construction monitoring which was
conducted by Coastal Engineering Consultants, Inc. (CEC). Funding for the monitoring was
provided by Lee County and the Florida Department of Environmental Protection (FDEP).
The 2011 Project was constructed between April 2011 and December 2011. Approximately
403,000 cubic yards (cy) of sand were excavated and placed in the beach fill area between FDEP
reference monuments (R-monuments) C-174A.5 and R-181.5. The beach was constructed to a
berm height of 2.9 feet NAVD88 over a shoreline distance of approximately 6,700 feet (1.3
miles). The design berm extended seaward at the 2.9 feet NAVD88 elevation an average of 236
feet and then sloped to the -1.2 feet NAVD88 elevation at a 15H:1V slope. The design then
adjusted to a 20H:1V slope seaward until it connected with existing grade. All dredging was
conducted in the Primary Borrow Area. The terminal groin was constructed with approximately
3,630 tons of limestone rock for a length of 240 feet with a maximum crest width of
approximately 12.7 feet. A single vinyl sheetpile row was installed along the centerline of the
structure to make it sand tight. FDEP raised concerns that the groin would slow down sediment
transport below a rate that will maintain the area north of project in a stable position. As a result
Lee County is required to monitor this area and report on the trends observed (Lee County,
2003).
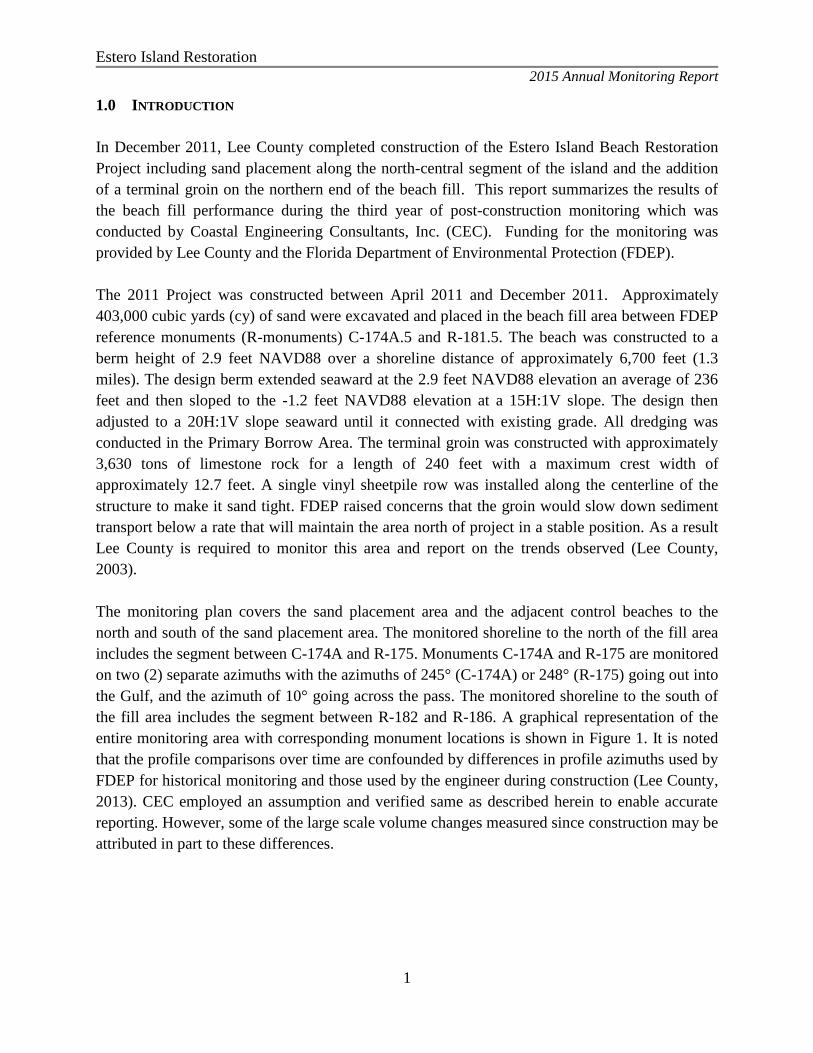
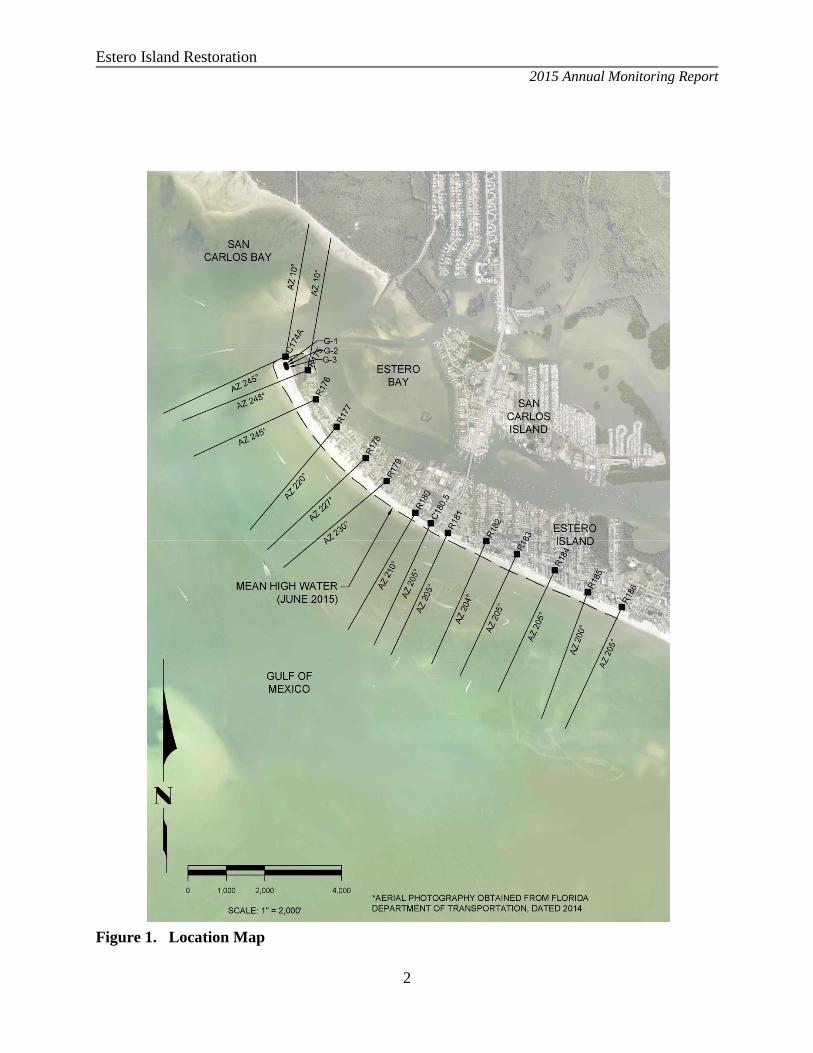
The monitoring plan covers the sand placement area and the adjacent control beaches to the
north and south of the sand placement area. The monitored shoreline to the north of the fill area
includes the segment between C-174A and R-175. Monuments C-174A and R-175 are monitored
on two (2) separate azimuths with the azimuths of 245° (C-174A) or 248° (R-175) going out into
the Gulf, and the azimuth of 10° going across the pass. The monitored shoreline to the south of
the fill area includes the segment between R-182 and R-186. A graphical representation of the
entire monitoring area with corresponding monument locations is shown in Figure 1. It is noted
that the profile comparisons over time are confounded by differences in profile azimuths used by
FDEP for historical monitoring and those used by the engineer during construction (Lee County,
2013). CEC employed an assumption and verified same as described herein to enable accurate
reporting. However, some of the large scale volume changes measured since construction may be
attributed in part to these differences.
Estero Island Restoration
2015 Annual Monitoring Report
2
Figure 1. Location Map
Estero Island Restoration
2015 Annual Monitoring Report
3
2.0 SCOPE OF WORK
The contracted Scope of Work for the monitoring includes the following components.
2.1 Physical Monitoring Plan
The physical monitoring plan (PMP) includes beach profile surveys of the active beach zone to
be collected along the shoreline at each R-monument from C-174A to R-186 including one half
monument profile at C-180.5. It also includes three (3) additional profile lines (G-lines) to be
surveyed at the terminal groin. Profile surveys shall extend landward to the FDEP monument
location or approximately 150 feet landward of the vegetation line, whichever is more
seaward. Upland profiles shall extend seaward to a wading depth deep enough to provide an
approximate 50-foot overlap with the offshore portion of the profile survey where environmental
conditions allow. Offshore profile surveys will extend seaward to the -13.2’ NAVD contour,
3,000 feet from the shoreline or to the channel center, whichever is least.
2.2 Reporting
An engineering report and the monitoring data are to be prepared and submitted to FDEP within
90 days following completion of the third year monitoring survey. The report includes:
signed and sealed survey report,
analysis for patterns, trends, or changes between surveys and for cumulative changes over
time,
evaluation of the erosion and accretion rates occurring between the initial post-
construction survey, first annual monitoring survey, and second annual monitoring
survey; and an assessment of the volume of fill remaining within the Project Area, and
comparative review of project performance to performance expectations and
identification of adverse impacts attributable to the Project.
3.0 EQUIPMENT AND QA/QC PROCEDURES
3.1 Survey Report
The Survey Report is presented in Appendix 1.
Estero Island Restoration
2015 Annual Monitoring Report
4
3.2 Equipment
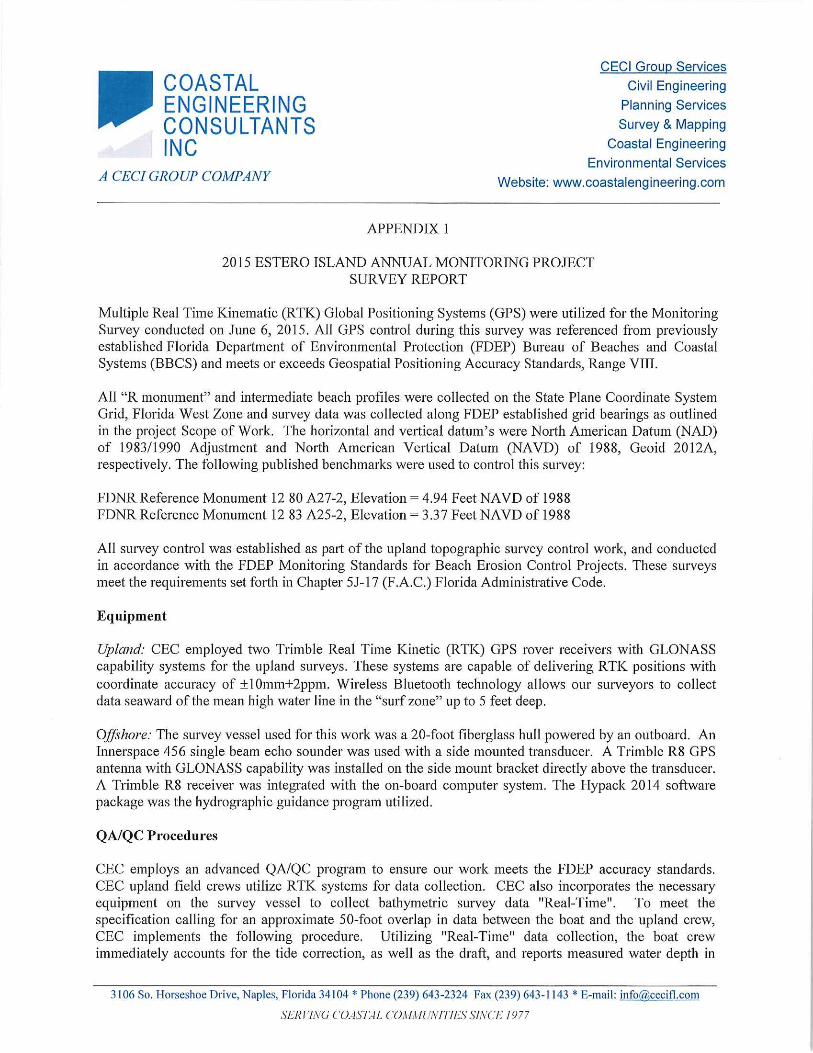
Upland: CEC employed two Trimble Real Time Kinematic (RTK) Global Positioning Systems
(GPS) with GLONASS capability for the upland surveys along with a Trimble R8 base receiver
installed on an established control point that was controlled by the existing R monument. These
systems are capable of delivering RTK positions with coordinate accuracy of 10mm+2ppm.
The standard 2 meter antenna rod allows for data collection seaward of the mean high water line
up to 5 feet deep while protecting the equipment from the elements.
Offshore: The survey vessel used for this work was a 20-foot fiberglass hull powered by an
outboard. An Innerspace 456 single beam echo sounder was used with a side mounted
transducer. The GPS antenna utilized the same side mount bracket as the transducer to place it
directly above the transducer. A Trimble R8 GLONASS RTK GPS receiver was integrated with
the on-board computer system. The Hypack 2014 software package was the hydrographic
guidance program utilized.
3.3 QA/QC Procedures
CEC employs an advanced QA/QC program to ensure our work meets the FDEP accuracy
standards. CEC upland field crews utilize RTK systems for data collection. CEC also
incorporates the necessary equipment on the survey vessel to collect bathymetric survey data
"Real-Time". To meet the specification calling for an approximate 50-foot overlap in data
between the boat and the upland crew, CEC implements the following procedure. Utilizing
"Real-Time" data collection, the boat crew immediately accounts for the tide correction, as well
as the draft and reports measured water depth in NAVD88 at each profile with the upland crew.
This gives the upland crew, who simultaneously collects the upland and nearshore profile data,
the necessary information to achieve the "overlap" specification.
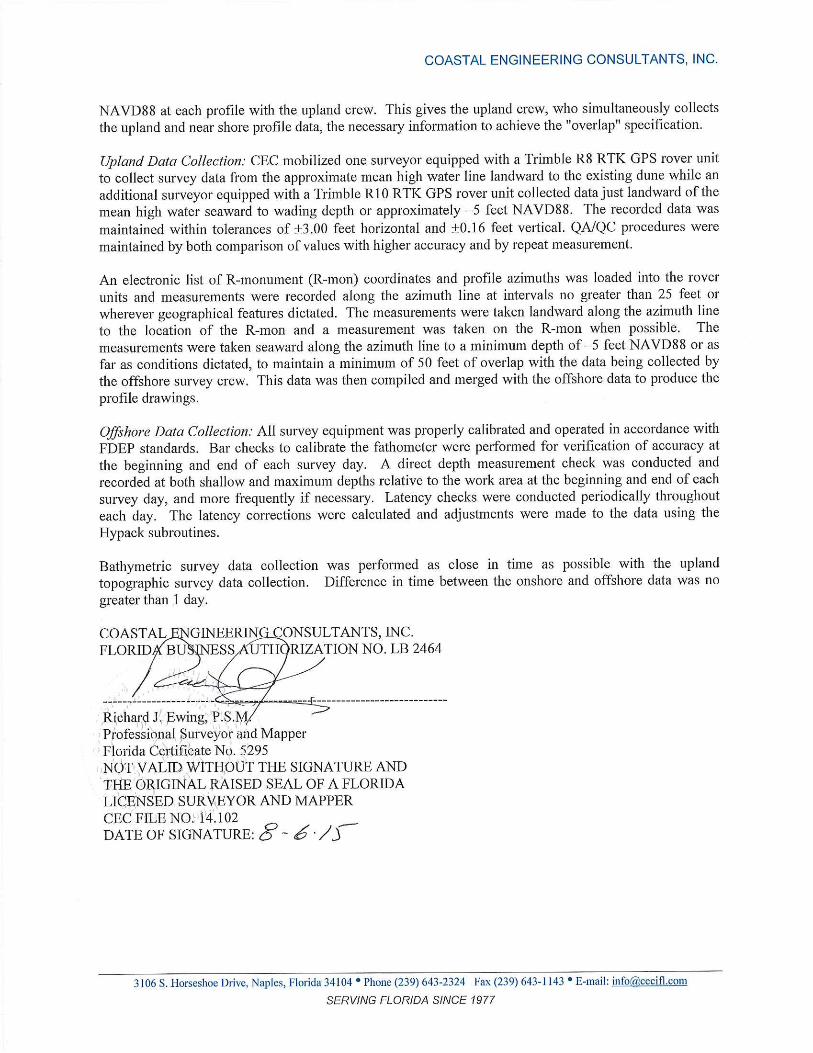
Upland Data Collection: CEC mobilized one operator and GPS rover unit to collect survey data
from the approximate mean high water line landward to the existing dune while an additional
operator and unit collected data just landward of the mean high water seaward to wading depth
or approximately –5 feet NAVD88. The recorded data was maintained within tolerances of
3.00 feet horizontal and 0.16 feet vertical. QA/QC procedures were maintained by both
comparison of values with higher accuracy and by repeat measurement.
The Trimble base station was setup on a suitable control point for GPS observations, either a
point with provided GPS coordinates or a point with coordinates derived from observations
performed during monumentation. The point designation, record coordinates, ellipsoidal height,
GEIOD model and antenna height are logged in the field book. At least one check shot was
recorded for each RTK rover on a point with known coordinates and GPS observations were
Estero Island Restoration
2015 Annual Monitoring Report
5
collected on known previously established survey control points throughout the day to ensure the
integrity of the data.
An electronic list of R-monument coordinates and profile azimuths was loaded into the rover
units and measurements were recorded along the azimuth line at intervals no greater than 25 feet
or wherever geographical features dictated. The measurements were taken landward along the
azimuth line to the location of the R-monument and a measurement was taken on the R-
monument when possible. The extent of the vegetation line and prominent features such as
seawalls were also noted in the data collection. The measurements were taken seaward along the
azimuth line to a minimum depth of –5 feet NAVD88 or as far as conditions dictated, to maintain
a minimum of 50 feet of overlap with the data being collected by the offshore survey crew. This
data was then compiled and merged with the offshore data to produce the profile drawings.
Offshore Data Collection: All survey equipment was properly calibrated and operated in
accordance with FDEP standards. Bar checks to calibrate the fathometer were performed for
verification of accuracy at the beginning and end of each survey day. A direct depth
measurement check was conducted and recorded at both shallow and maximum depths relative
to the work area at the beginning and end of each survey day, and more frequently if necessary.
If sea conditions precluded performing the bar check at the end of the day, sea conditions and
indication of inability to perform the depth check was recorded and reported. If the day’s final
bar check was not possible as a result of adverse sea conditions, then the last survey line was
repeated during the next day of survey to verify the measurements. Latency checks were
conducted periodically throughout each day. The latency corrections were calculated and
adjustments were made to the data using the Hypack subroutines.
Bathymetric survey data collection was conducted in calm seas. Maximum wave heights during
the data collection period were less than 2 feet. The data was collected at intervals not exceeding
25 feet and at all grade breaks along the profile sufficient to accurately describe the bathymetry
at the profile locations. The beach profile survey extended seaward to a minimum of 3,000 feet
from mean high water (MHW) or to –13.2 feet NAVD88, whichever was reached first.
The vertical accuracy of the profile data meets or exceeds the GPS-derived heights (0.2 to 0.5
feet) standard. The horizontal positioning system accuracy of the data was within 2 feet and the
off-line horizontal deviation was within 30 feet. Manual tide readings were performed
periodically throughout the survey as a check for the tides measured by the RTK GPS.
Bathymetric survey data collection was performed as close in time as possible with the upland
topographic survey data collection. This significantly increased efficiency by conducting the
work with the same base station set-up. Safety was also increased by having both crews visible
to each other at all times. The onshore and offshore data were collected concurrently.
Estero Island Restoration
2015 Annual Monitoring Report
6
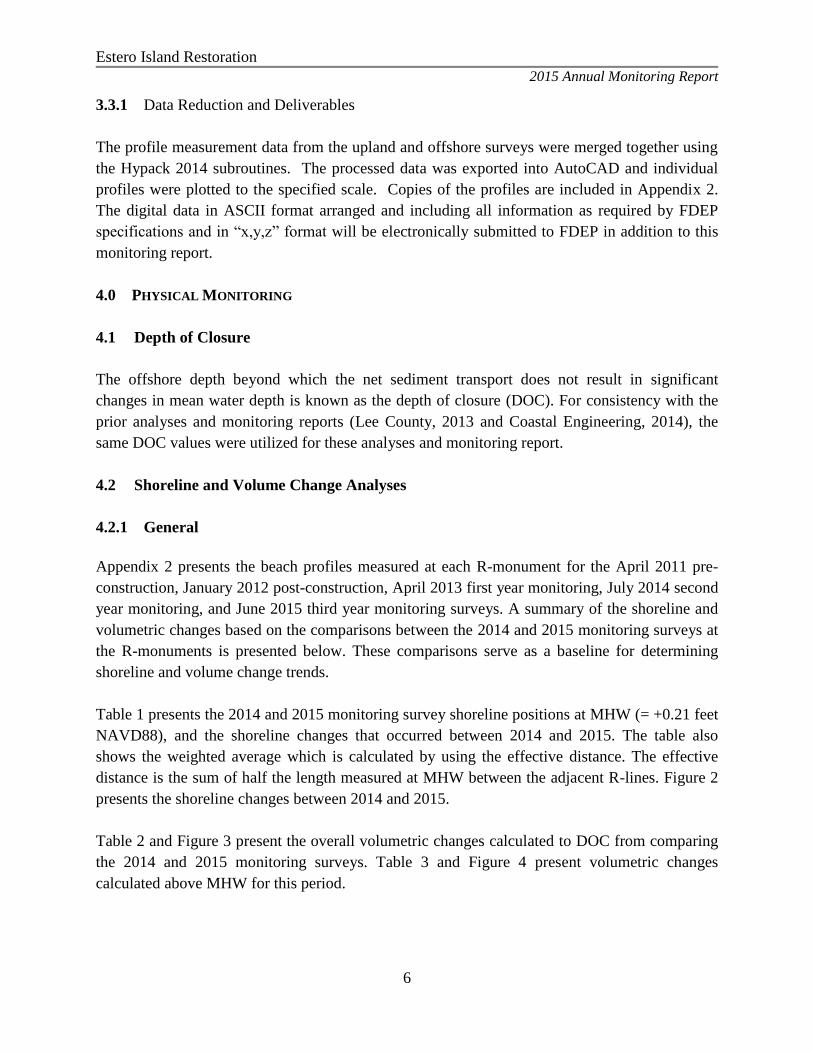
3.3.1 Data Reduction and Deliverables
The profile measurement data from the upland and offshore surveys were merged together using
the Hypack 2014 subroutines. The processed data was exported into AutoCAD and individual
profiles were plotted to the specified scale. Copies of the profiles are included in Appendix 2.
The digital data in ASCII format arranged and including all information as required by FDEP
specifications and in “x,y,z” format will be electronically submitted to FDEP in addition to this
monitoring report.
4.0 PHYSICAL MONITORING
4.1 Depth of Closure
The offshore depth beyond which the net sediment transport does not result in significant
changes in mean water depth is known as the depth of closure (DOC). For consistency with the
prior analyses and monitoring reports (Lee County, 2013 and Coastal Engineering, 2014), the
same DOC values were utilized for these analyses and monitoring report.
4.2 Shoreline and Volume Change Analyses
4.2.1 General
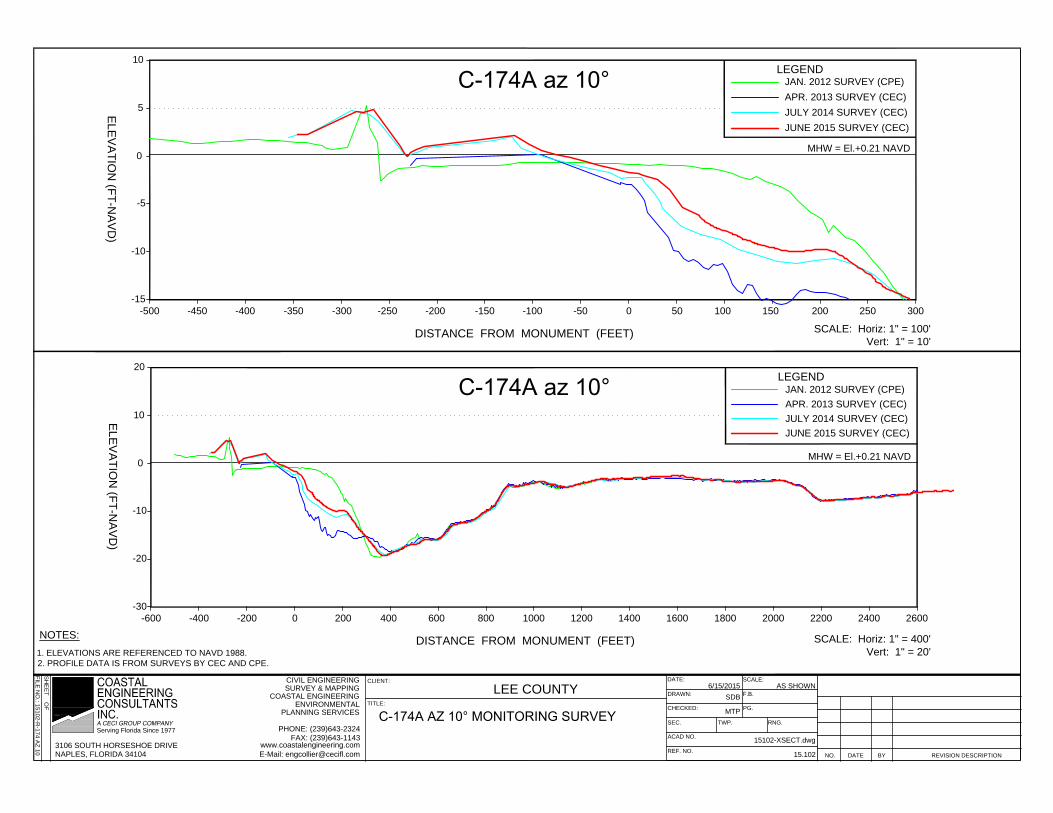
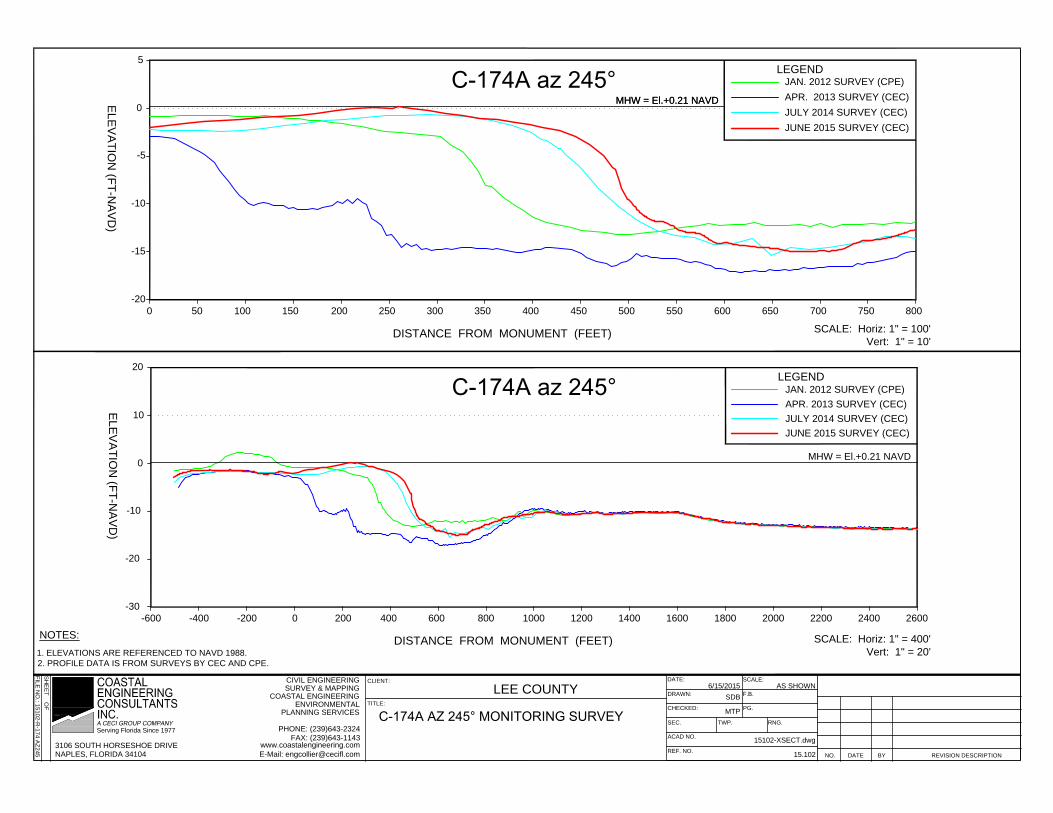
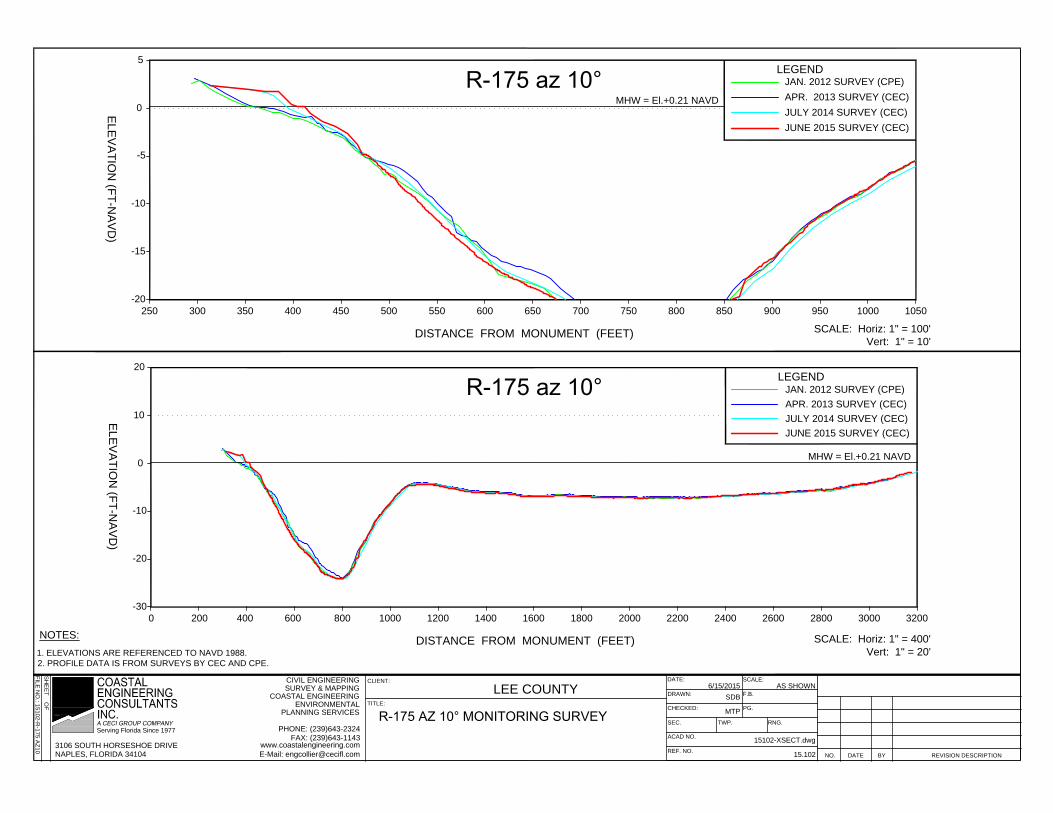
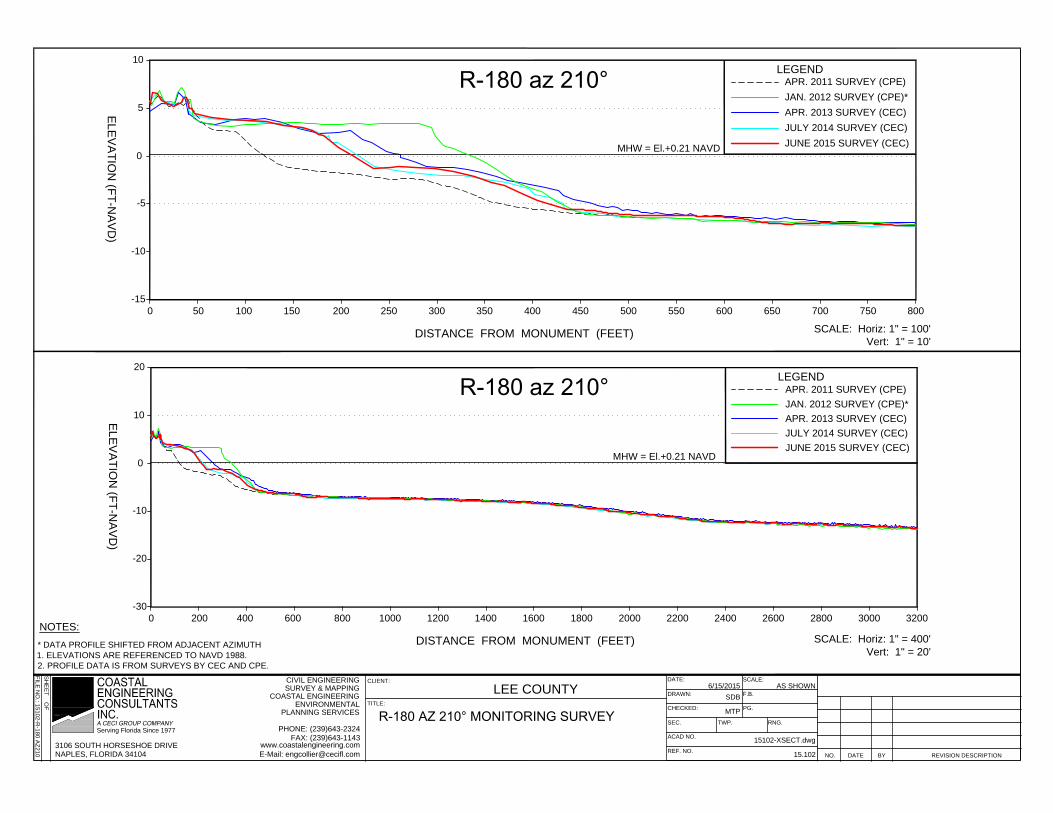
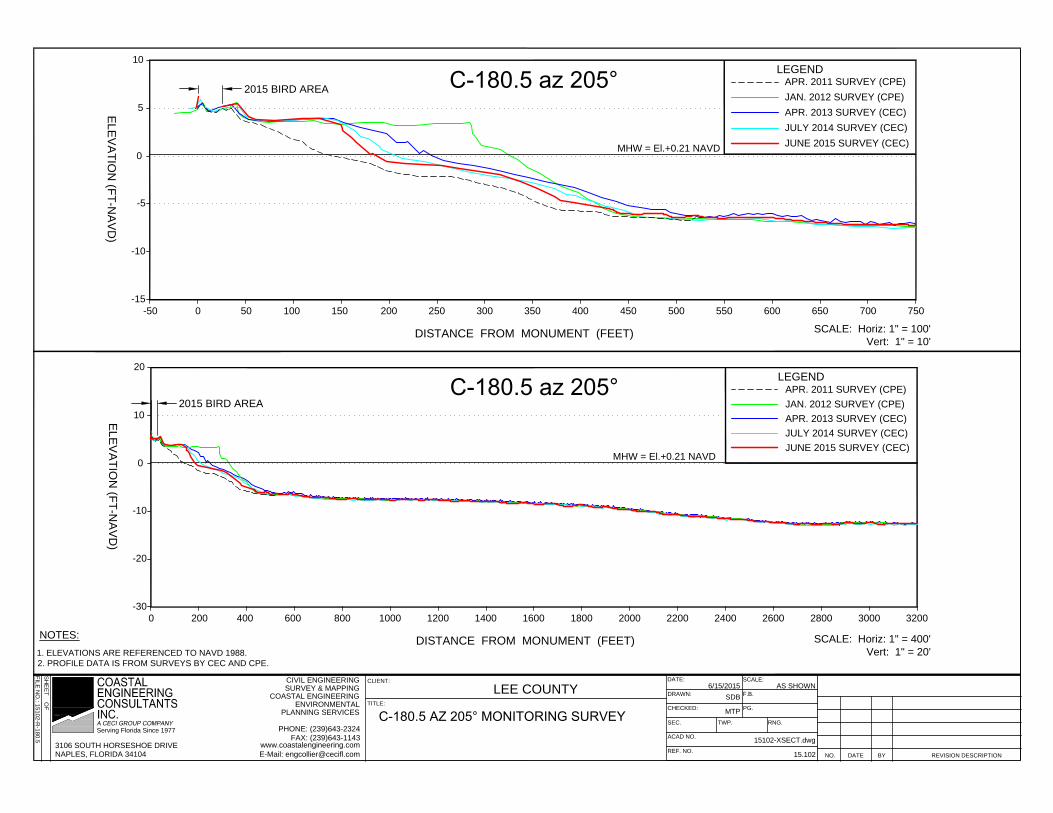
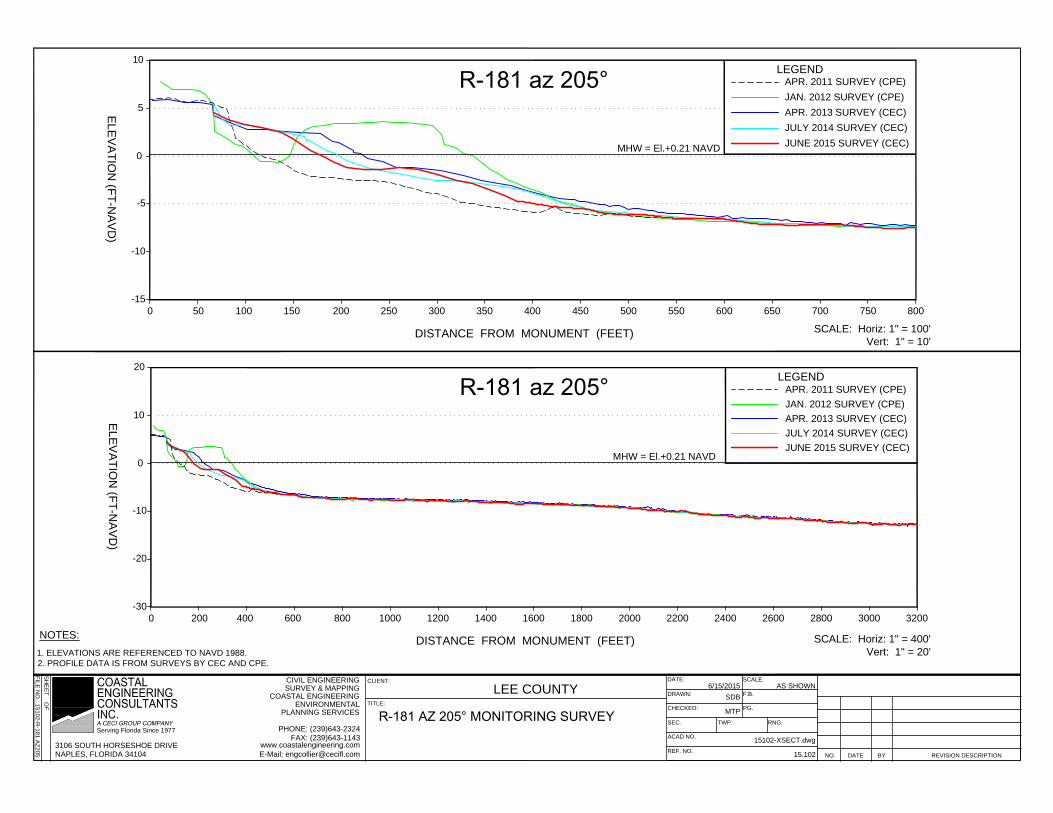
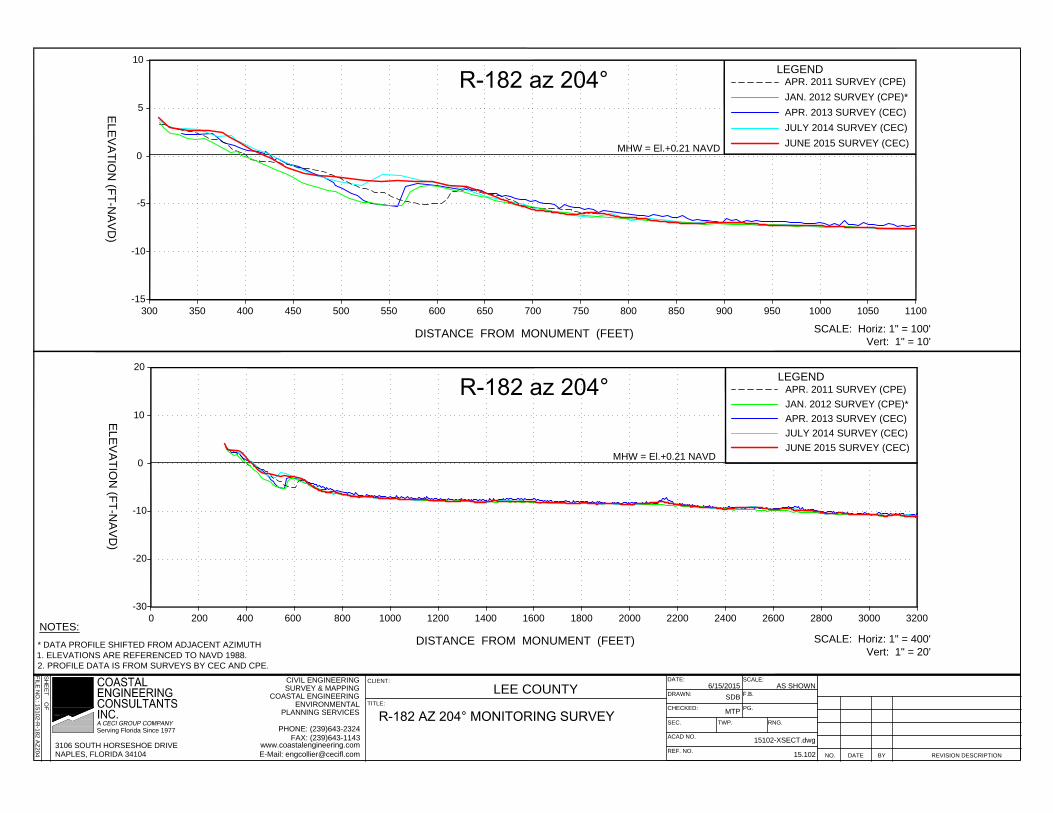
Appendix 2 presents the beach profiles measured at each R-monument for the April 2011 pre-
construction, January 2012 post-construction, April 2013 first year monitoring, July 2014 second
year monitoring, and June 2015 third year monitoring surveys. A summary of the shoreline and
volumetric changes based on the comparisons between the 2014 and 2015 monitoring surveys at
the R-monuments is presented below. These comparisons serve as a baseline for determining
shoreline and volume change trends.
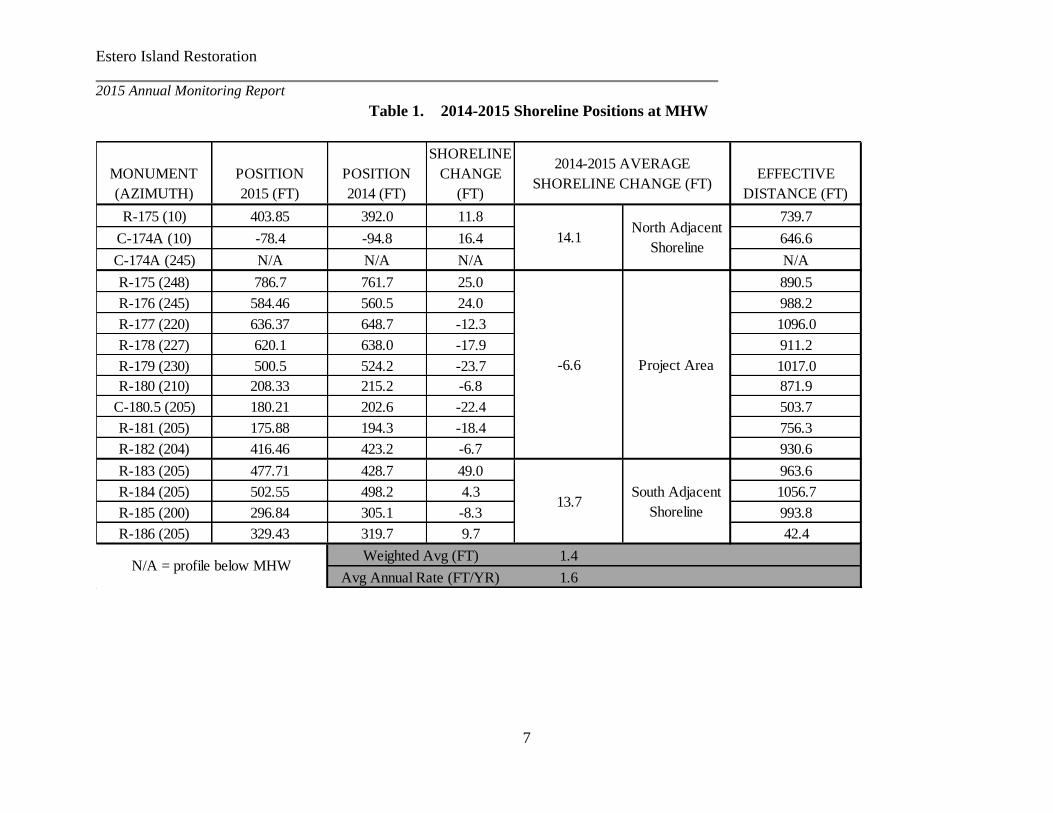
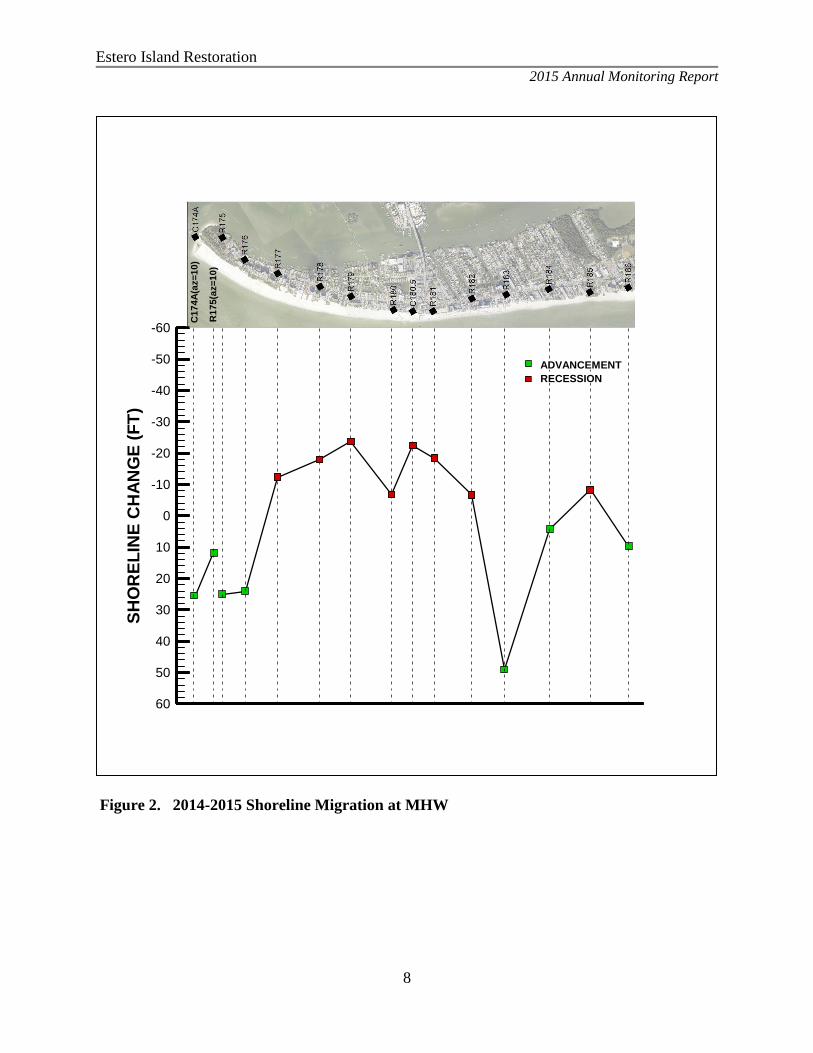
Table 1 presents the 2014 and 2015 monitoring survey shoreline positions at MHW (= +0.21 feet
NAVD88), and the shoreline changes that occurred between 2014 and 2015. The table also
shows the weighted average which is calculated by using the effective distance. The effective
distance is the sum of half the length measured at MHW between the adjacent R-lines. Figure 2
presents the shoreline changes between 2014 and 2015.
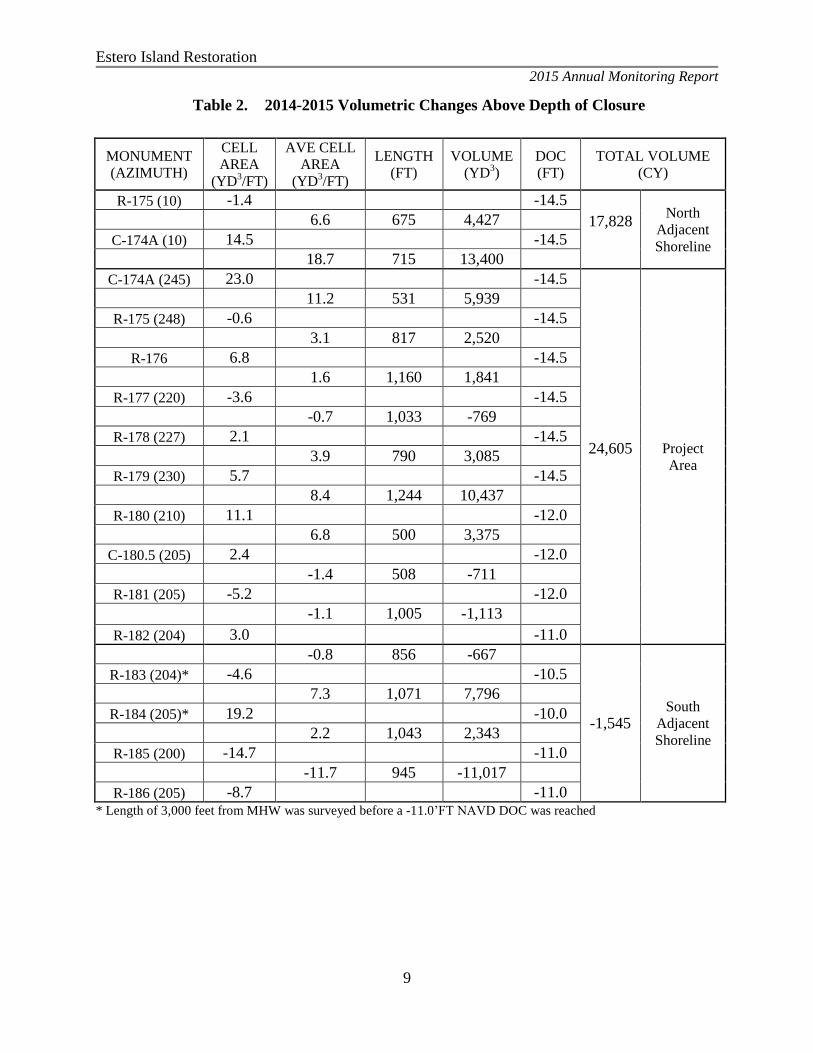
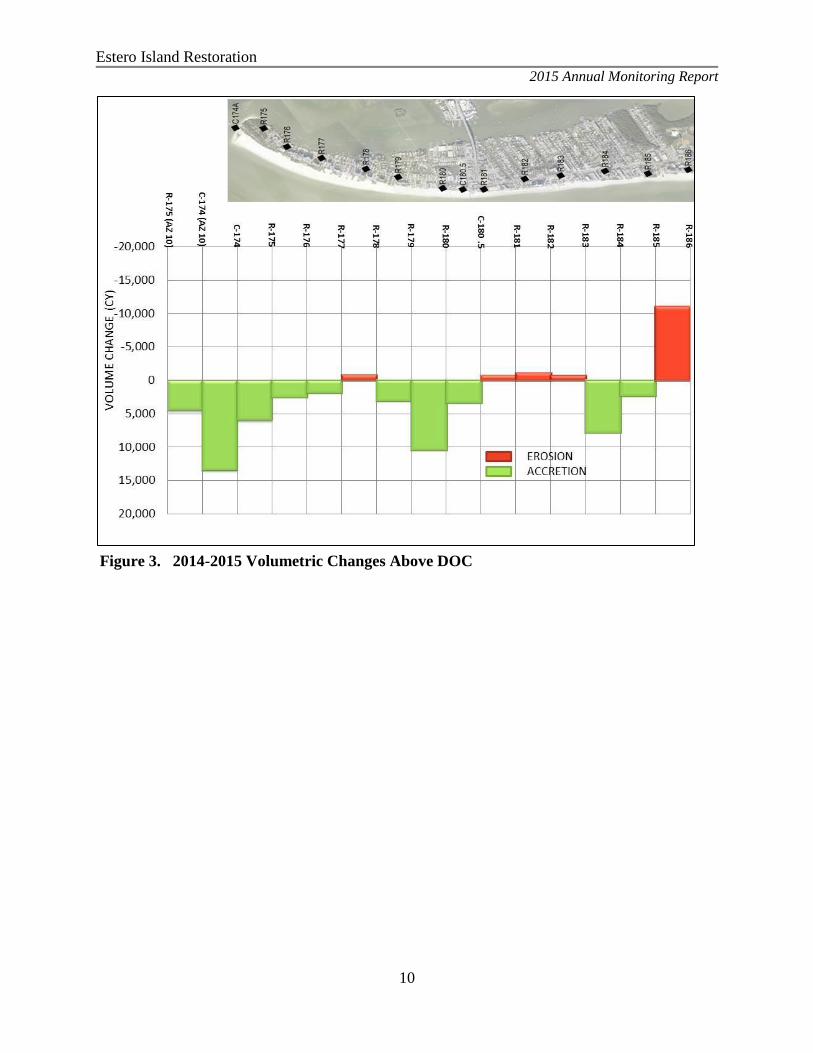
Table 2 and Figure 3 present the overall volumetric changes calculated to DOC from comparing
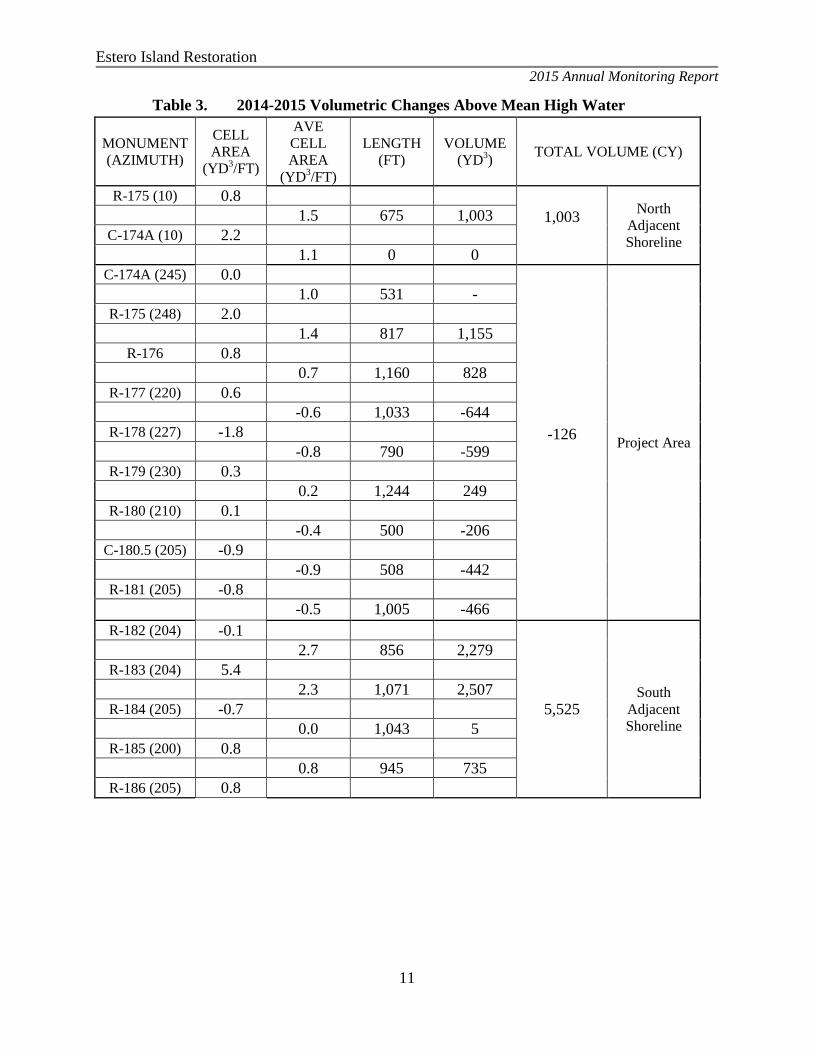
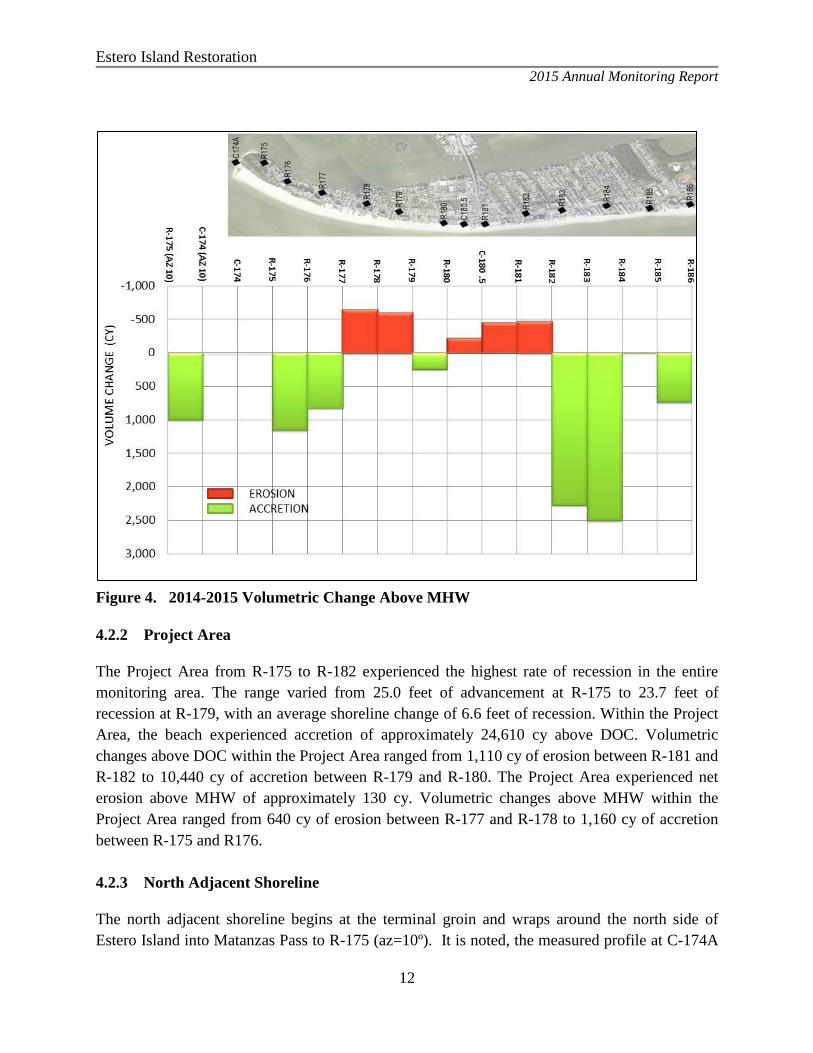
the 2014 and 2015 monitoring surveys. Table 3 and Figure 4 present volumetric changes
calculated above MHW for this period.
Estero Island Restoration
2015 Annual Monitoring Report
7
Table 1. 2014-2015 Shoreline Positions at MHW
MONUMENT
(AZIMUTH)
POSITION
2015 (FT)
POSITION
2014 (FT)
2014-2015
SHORELINE
CHANGE
(FT)
EFFECTIVE
DISTANCE (FT)
R-175 (10) 403.85 392.0 11.8 739.7
C-174A (10) -78.4 -94.8 16.4 646.6
C-174A (245) N/A N/A N/A N/A
R-175 (248) 786.7 761.7 25.0 890.5
R-176 (245) 584.46 560.5 24.0 988.2
R-177 (220) 636.37 648.7 -12.3 1096.0
R-178 (227) 620.1 638.0 -17.9 911.2
R-179 (230) 500.5 524.2 -23.7 1017.0
R-180 (210) 208.33 215.2 -6.8 871.9
C-180.5 (205) 180.21 202.6 -22.4 503.7
R-181 (205) 175.88 194.3 -18.4 756.3
R-182 (204) 416.46 423.2 -6.7 930.6
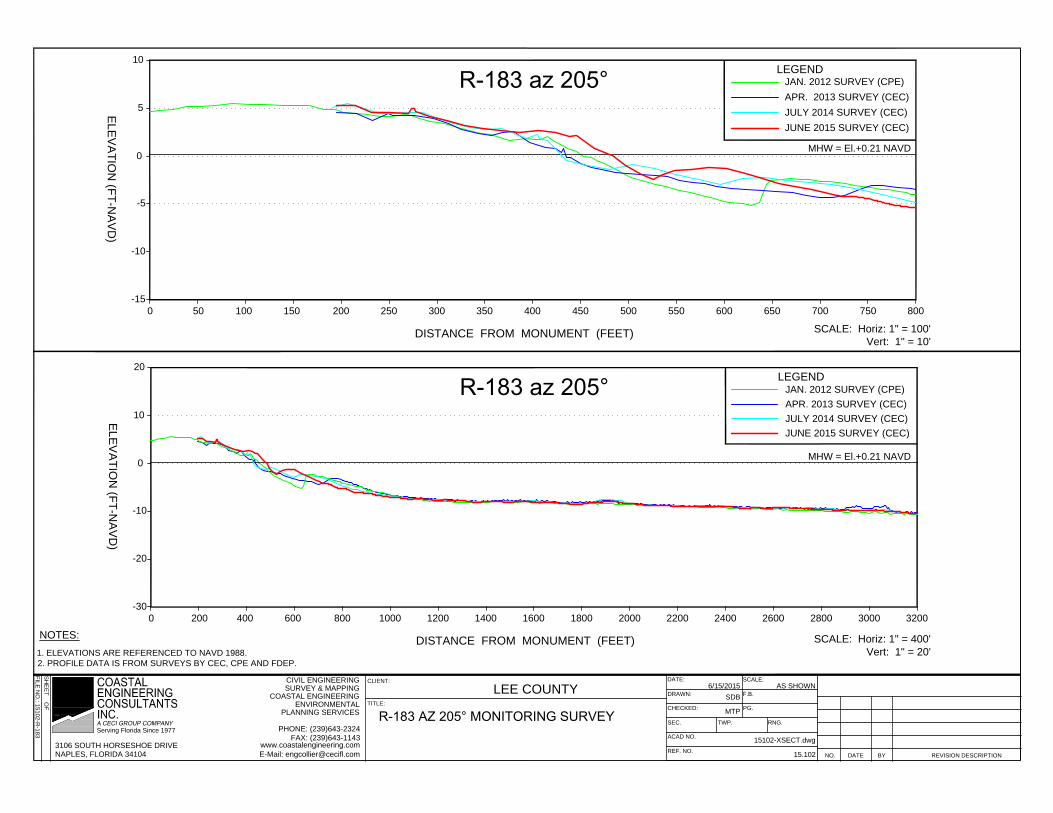
R-183 (205) 477.71 428.7 49.0 963.6
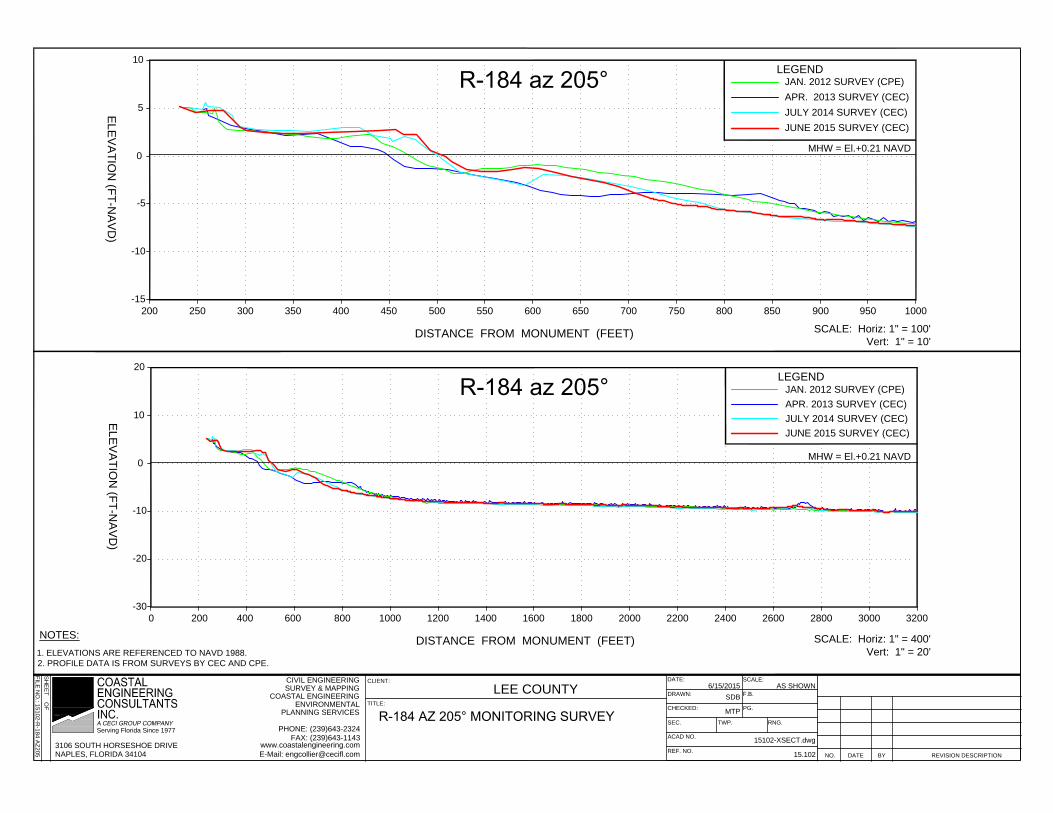
R-184 (205) 502.55 498.2 4.3 1056.7
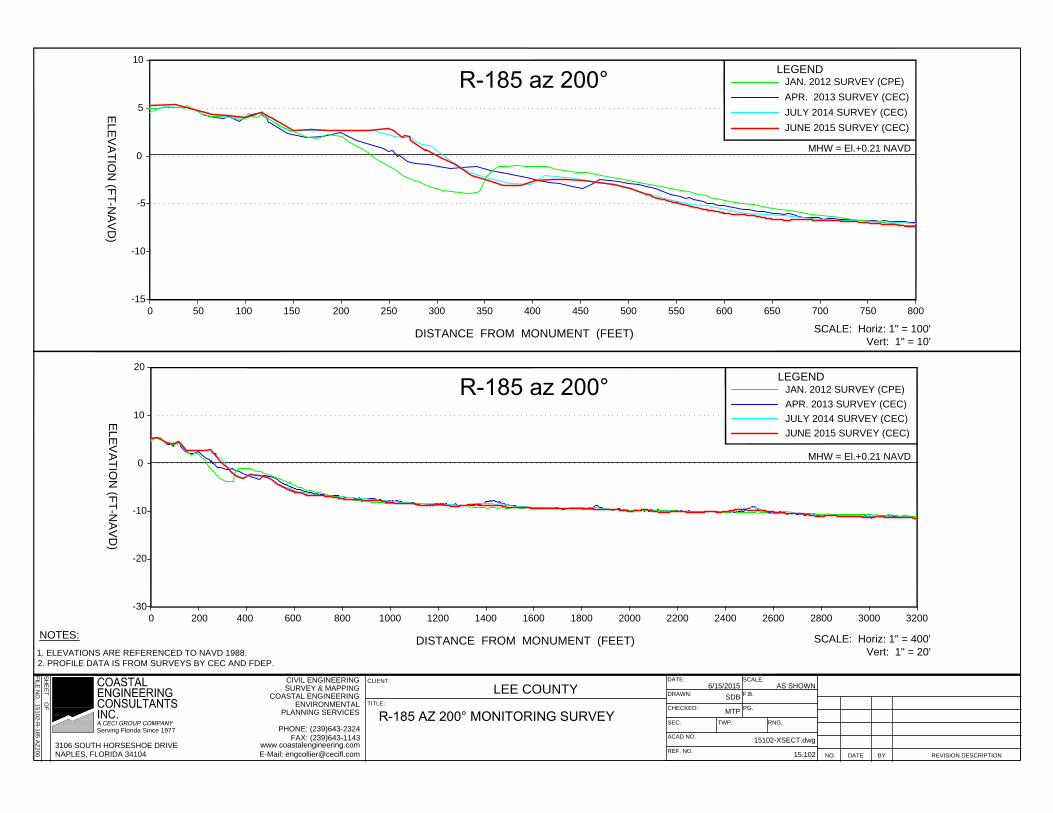
R-185 (200) 296.84 305.1 -8.3 993.8
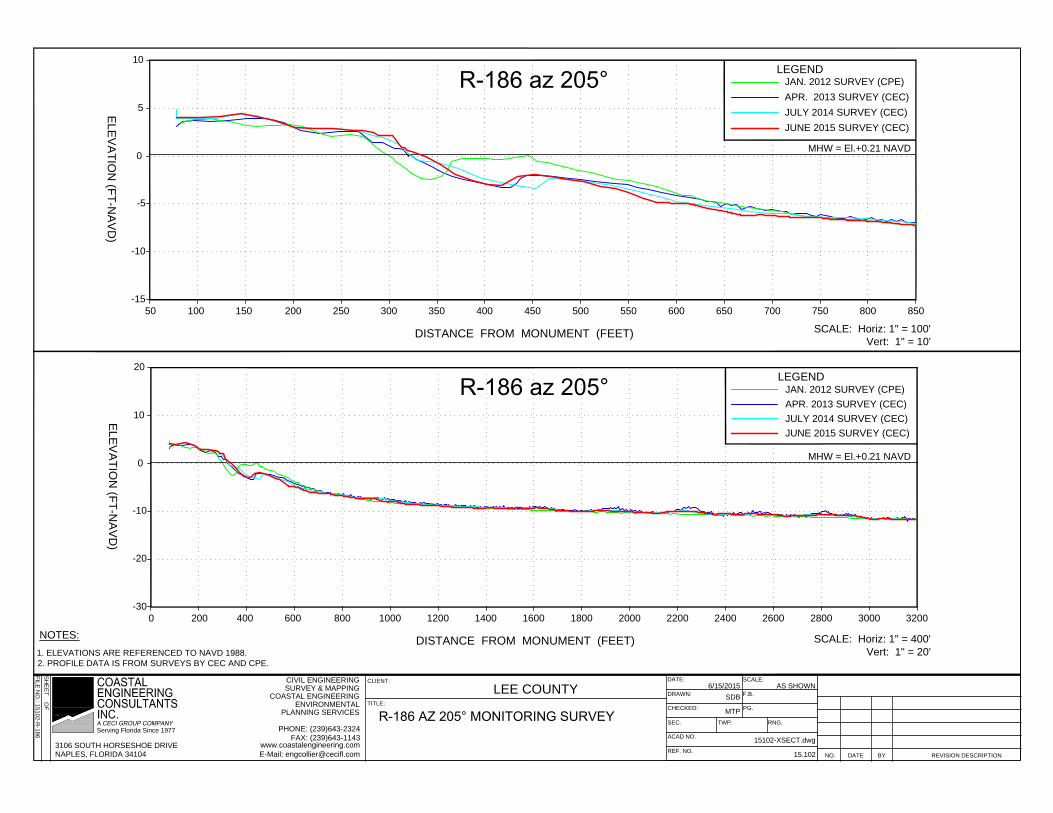
R-186 (205) 329.43 319.7 9.7 42.4
1.4
1.6
North Adjacent
Shoreline
2014-2015 AVERAGE
SHORELINE CHANGE (FT)
14.1
-6.6 Project Area
South Adjacent
Shoreline13.7
Weighted Avg (FT)
Avg Annual Rate (FT/YR)N/A = profile below MHW
Estero Island Restoration
2015 Annual Monitoring Report
8
Figure 2. 2014-2015 Shoreline Migration at MHW
SH
OR
EL
INE
CH
AN
GE
(FT
)
-60
-50
-40
-30
-20
-10
0
10
20
30
40
50
60
C1
74
A(a
z=
10
)
RECESSION
ADVANCEMENT
R1
75
(az=
10
)
Estero Island Restoration
2015 Annual Monitoring Report
9
Table 2. 2014-2015 Volumetric Changes Above Depth of Closure
MONUMENT
(AZIMUTH)
CELL
AREA
(YD3/FT)
AVE CELL
AREA
(YD3/FT)
LENGTH
(FT)
VOLUME
(YD3)
DOC
(FT)
TOTAL VOLUME
(CY)
R-175 (10) -1.4 -14.5
17,828
North
Adjacent
Shoreline
6.6 675 4,427
C-174A (10) 14.5 -14.5
18.7 715 13,400
C-174A (245) 23.0 -14.5
24,605
Project
Area
11.2 531 5,939
R-175 (248) -0.6 -14.5
3.1 817 2,520
R-176 6.8 -14.5
1.6 1,160 1,841
R-177 (220) -3.6 -14.5
-0.7 1,033 -769
R-178 (227) 2.1 -14.5
3.9 790 3,085
R-179 (230) 5.7 -14.5
8.4 1,244 10,437
R-180 (210) 11.1 -12.0
6.8 500 3,375
C-180.5 (205) 2.4 -12.0
-1.4 508 -711
R-181 (205) -5.2 -12.0
-1.1 1,005 -1,113
R-182 (204) 3.0 -11.0
-0.8 856 -667
-1,545
South
Adjacent
Shoreline
R-183 (204)* -4.6 -10.5
7.3 1,071 7,796
R-184 (205)* 19.2 -10.0
2.2 1,043 2,343
R-185 (200) -14.7 -11.0
-11.7 945 -11,017
R-186 (205) -8.7 -11.0
* Length of 3,000 feet from MHW was surveyed before a -11.0’FT NAVD DOC was reached
Estero Island Restoration
2015 Annual Monitoring Report
10
Figure 3. 2014-2015 Volumetric Changes Above DOC
Estero Island Restoration
2015 Annual Monitoring Report
11
Table 3. 2014-2015 Volumetric Changes Above Mean High Water
MONUMENT
(AZIMUTH)
CELL
AREA
(YD3/FT)
AVE
CELL
AREA
(YD3/FT)
LENGTH
(FT)
VOLUME
(YD3)
TOTAL VOLUME (CY)
R-175 (10) 0.8
1,003
North
Adjacent
Shoreline
1.5 675 1,003
C-174A (10) 2.2
1.1 0 0
C-174A (245) 0.0
-126
Project Area
1.0 531 -
R-175 (248) 2.0
1.4 817 1,155
R-176 0.8
0.7 1,160 828
R-177 (220) 0.6
-0.6 1,033 -644
R-178 (227) -1.8
-0.8 790 -599
R-179 (230) 0.3
0.2 1,244 249
R-180 (210) 0.1
-0.4 500 -206
C-180.5 (205) -0.9
-0.9 508 -442
R-181 (205) -0.8
-0.5 1,005 -466
R-182 (204) -0.1
5,525
South
Adjacent
Shoreline
2.7 856 2,279
R-183 (204) 5.4
2.3 1,071 2,507
R-184 (205) -0.7
0.0 1,043 5
R-185 (200) 0.8
0.8 945 735
R-186 (205) 0.8
Estero Island Restoration
2015 Annual Monitoring Report
12
Figure 4. 2014-2015 Volumetric Change Above MHW
4.2.2 Project Area
The Project Area from R-175 to R-182 experienced the highest rate of recession in the entire
monitoring area. The range varied from 25.0 feet of advancement at R-175 to 23.7 feet of
recession at R-179, with an average shoreline change of 6.6 feet of recession. Within the Project
Area, the beach experienced accretion of approximately 24,610 cy above DOC. Volumetric
changes above DOC within the Project Area ranged from 1,110 cy of erosion between R-181 and
R-182 to 10,440 cy of accretion between R-179 and R-180. The Project Area experienced net
erosion above MHW of approximately 130 cy. Volumetric changes above MHW within the
Project Area ranged from 640 cy of erosion between R-177 and R-178 to 1,160 cy of accretion
between R-175 and R176.
4.2.3 North Adjacent Shoreline
The north adjacent shoreline begins at the terminal groin and wraps around the north side of
Estero Island into Matanzas Pass to R-175 (az=10º). It is noted, the measured profile at C-174A
Estero Island Restoration
2015 Annual Monitoring Report
13
(az=245º) in 2014 and 2015 did not extend above MHW. Therefore, shoreline change rates could
not be determined for these two monuments for this monitoring period. The only shoreline
changes measured were at R-174A (az=10º) and R-175 (az=10º) where there was an average
advancement of approximately 14.1 feet.
The north adjacent shoreline between 2014 and 2015 experienced approximately 17,830 cy of
accretion above DOC. The north adjacent shoreline experienced approximately 1,000 cy of
accretion above MHW between 2014 and 2015.
4.2.4 South Adjacent Shoreline
The south adjacent shoreline begins at R-182 and extends south to R-186. This stretch of beach
experienced an average rate of advancement of approximately 13.7 feet between 2014 and 2015.
The shoreline changes ranged from approximately 49.0 feet of advancement at R-183 to
approximately -8.3 feet of recession at R-185.
The south adjacent shoreline between 2014 and 2015 experienced approximately 1,550 cy of
erosion above DOC. The majority of this erosion was between R-185 and R-186. Volumetric
changes above DOC ranged from 11,017 cy of erosion between R-185 and R-186 to 7,800 cy of
accretion between R-183 and R-184.
The south adjacent shoreline experienced approximately 5,530 cy of accretion above MHW.
Nearly 90% of the accretion occurred between R-182 and R-184 which corresponds with the area
of highest advancement of the shoreline. Volumetric changes above MHW ranged from 5 cy of
accretion between R-184 and R-185 to 2,510 cy of accretion between R-183 and R-184. to
4.2.5 Summary
The individual beaches within the monitoring area extending from C-174A to R-186 experienced
a high degree of variability in the shoreline changes as well as volumetric gains/losses. Overall,
shoreline within the monitoring area has receded on average an annual rate of approximately 0.3
feet between the July 2014 and June 2015 monitoring surveys. The total volume change between
the 2014 and 2015 monitoring surveys was approximately 40,890 cy of accretion above DOC
and approximately 6,400 cy of accretion above MHW.
4.3 Project Area Performance
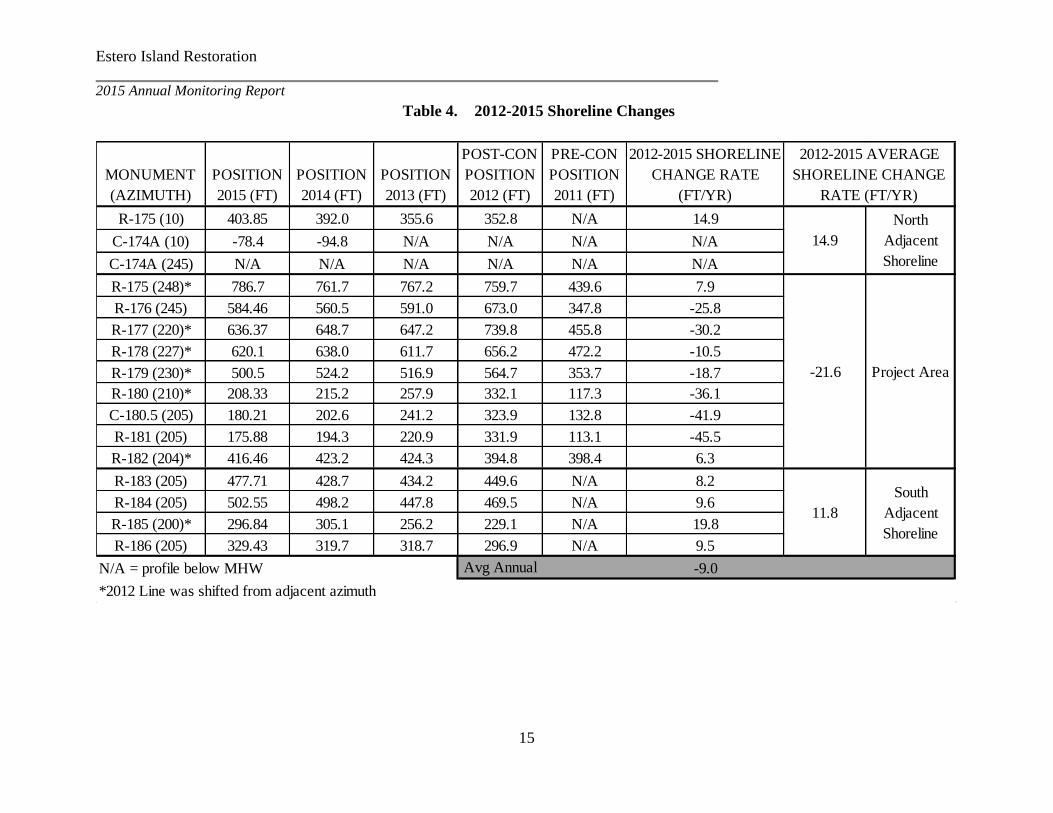
Table 4 presents the 2011 through 2015 monitoring survey shoreline positions at MHW for the
monitoring area. In addition to the positions, the table includes shoreline change rates calculated
for the 2012-2015 time period representing the three year post-construction monitoring period.
For consistency, the same effective distances as in Table 1 were utilized to determine the
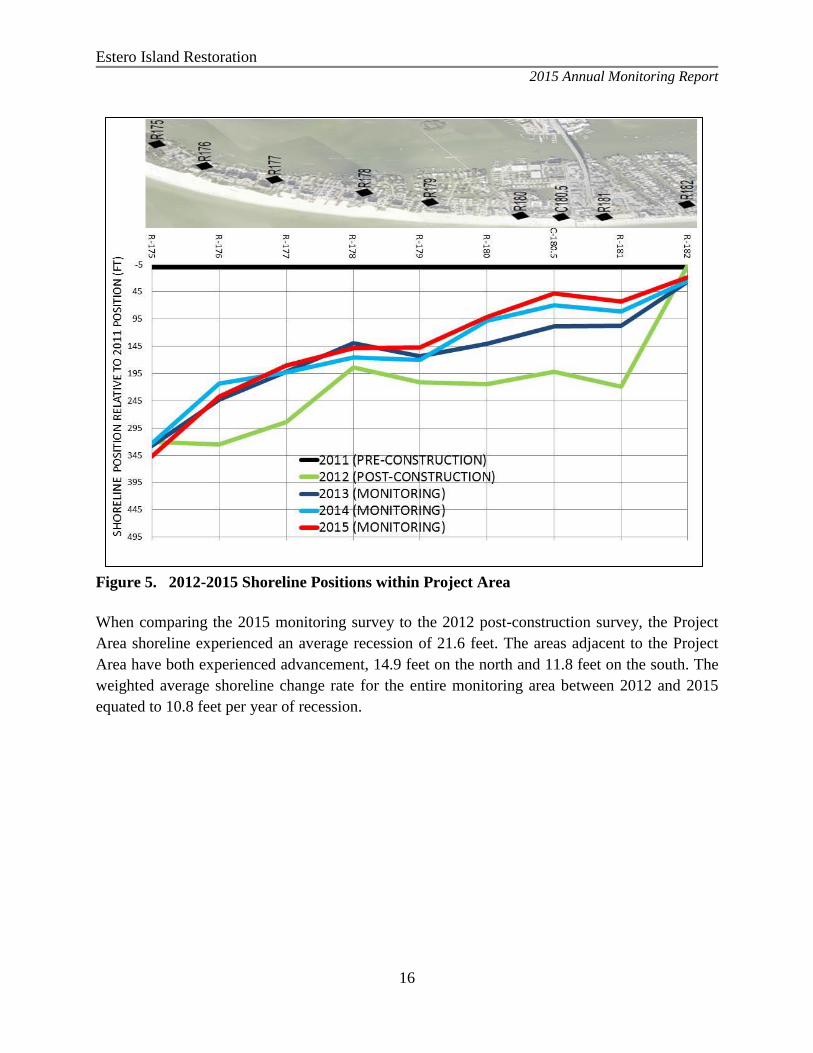
weighted average. Figure 5 presents the 2012, 2013, 2014, and 2015 MHW positions relative to

Estero Island Restoration
2015 Annual Monitoring Report
14
the 2011 pre-construction MHW positions which were utilized as the baseline for the Project
Area.
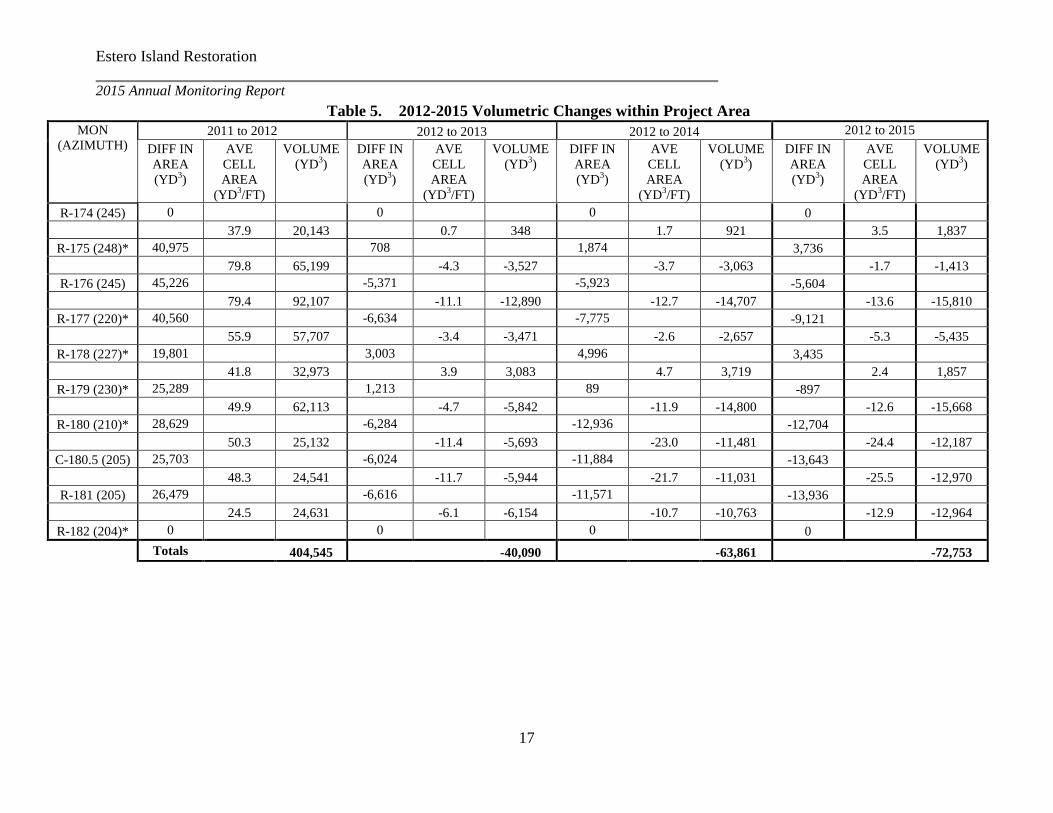
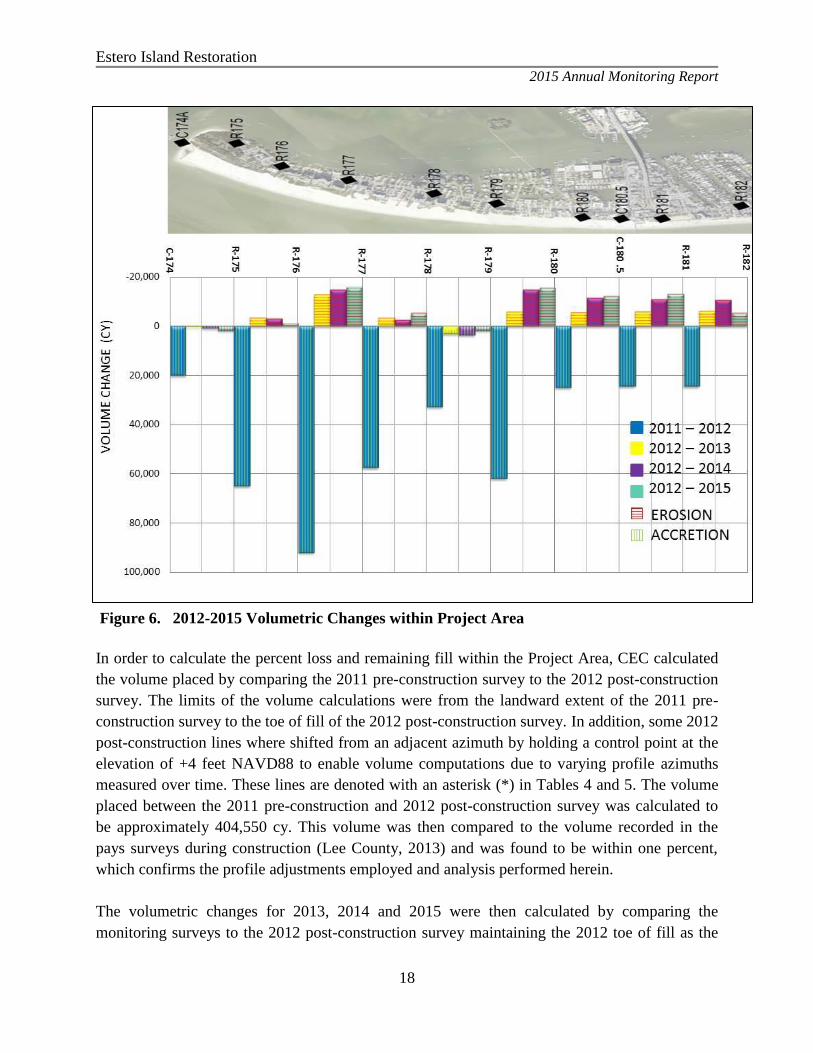
Table 5 and Figure 6 present the volumetric changes from the pre-construction survey in 2011 to
the post construction survey in 2012. In addition the table presents the volumetric changes
between 2012 post construction and each of the 2013, 2014 and 2015 monitoring surveys.
Estero Island Restoration
2015 Annual Monitoring Report
15
Table 4. 2012-2015 Shoreline Changes
MONUMENT
(AZIMUTH)
POSITION
2015 (FT)
POSITION
2014 (FT)
POSITION
2013 (FT)
POST-CON
POSITION
2012 (FT)
PRE-CON
POSITION
2011 (FT)
2012-2015 SHORELINE
CHANGE RATE
(FT/YR)
R-175 (10) 403.85 392.0 355.6 352.8 N/A 14.9
C-174A (10) -78.4 -94.8 N/A N/A N/A N/A
C-174A (245) N/A N/A N/A N/A N/A N/A
R-175 (248)* 786.7 761.7 767.2 759.7 439.6 7.9
R-176 (245) 584.46 560.5 591.0 673.0 347.8 -25.8
R-177 (220)* 636.37 648.7 647.2 739.8 455.8 -30.2
R-178 (227)* 620.1 638.0 611.7 656.2 472.2 -10.5
R-179 (230)* 500.5 524.2 516.9 564.7 353.7 -18.7
R-180 (210)* 208.33 215.2 257.9 332.1 117.3 -36.1
C-180.5 (205) 180.21 202.6 241.2 323.9 132.8 -41.9
R-181 (205) 175.88 194.3 220.9 331.9 113.1 -45.5
R-182 (204)* 416.46 423.2 424.3 394.8 398.4 6.3
R-183 (205) 477.71 428.7 434.2 449.6 N/A 8.2
R-184 (205) 502.55 498.2 447.8 469.5 N/A 9.6
R-185 (200)* 296.84 305.1 256.2 229.1 N/A 19.8
R-186 (205) 329.43 319.7 318.7 296.9 N/A 9.5Weighted
Avg Annual -9.0
14.9
-21.6
*2012 Line was shifted from adjacent azimuth
North
Adjacent
Shoreline
Project Area
South
Adjacent
Shoreline
2012-2015 AVERAGE
SHORELINE CHANGE
RATE (FT/YR)
N/A = profile below MHW
11.8
Estero Island Restoration
2015 Annual Monitoring Report
16
Figure 5. 2012-2015 Shoreline Positions within Project Area
When comparing the 2015 monitoring survey to the 2012 post-construction survey, the Project
Area shoreline experienced an average recession of 21.6 feet. The areas adjacent to the Project
Area have both experienced advancement, 14.9 feet on the north and 11.8 feet on the south. The
weighted average shoreline change rate for the entire monitoring area between 2012 and 2015
equated to 10.8 feet per year of recession.
Estero Island Restoration
2015 Annual Monitoring Report
17
Table 5. 2012-2015 Volumetric Changes within Project Area
MON
(AZIMUTH) 2011 to 2012 2012 to 2013 2012 to 2014 2012 to 2015
DIFF IN
AREA
(YD3)
AVE
CELL
AREA
(YD3/FT)
VOLUME
(YD3)
DIFF IN
AREA
(YD3)
AVE
CELL
AREA
(YD3/FT)
VOLUME
(YD3)
DIFF IN
AREA
(YD3)
AVE
CELL
AREA
(YD3/FT)
VOLUME
(YD3)
DIFF IN
AREA
(YD3)
AVE
CELL
AREA
(YD3/FT)
VOLUME
(YD3)
R-174 (245) 0 0 0 0
37.9 20,143 0.7 348 1.7 921 3.5 1,837
R-175 (248)* 40,975 708 1,874 3,736
79.8 65,199 -4.3 -3,527 -3.7 -3,063 -1.7 -1,413
R-176 (245) 45,226 -5,371 -5,923 -5,604
79.4 92,107 -11.1 -12,890 -12.7 -14,707 -13.6 -15,810
R-177 (220)* 40,560 -6,634 -7,775 -9,121
55.9 57,707 -3.4 -3,471 -2.6 -2,657 -5.3 -5,435
R-178 (227)* 19,801 3,003 4,996 3,435
41.8 32,973 3.9 3,083 4.7 3,719 2.4 1,857
R-179 (230)* 25,289 1,213 89 -897
49.9 62,113 -4.7 -5,842 -11.9 -14,800 -12.6 -15,668
R-180 (210)* 28,629 -6,284 -12,936 -12,704
50.3 25,132 -11.4 -5,693 -23.0 -11,481 -24.4 -12,187
C-180.5 (205) 25,703 -6,024 -11,884 -13,643
48.3 24,541 -11.7 -5,944 -21.7 -11,031 -25.5 -12,970
R-181 (205) 26,479 -6,616 -11,571 -13,936
24.5 24,631 -6.1 -6,154 -10.7 -10,763 -12.9 -12,964
R-182 (204)* 0 0 0 0
Totals 404,545 -40,090 -63,861 -72,753
Estero Island Restoration
2015 Annual Monitoring Report
18
Figure 6. 2012-2015 Volumetric Changes within Project Area
In order to calculate the percent loss and remaining fill within the Project Area, CEC calculated
the volume placed by comparing the 2011 pre-construction survey to the 2012 post-construction
survey. The limits of the volume calculations were from the landward extent of the 2011 pre-
construction survey to the toe of fill of the 2012 post-construction survey. In addition, some 2012
post-construction lines where shifted from an adjacent azimuth by holding a control point at the
elevation of +4 feet NAVD88 to enable volume computations due to varying profile azimuths
measured over time. These lines are denoted with an asterisk (*) in Tables 4 and 5. The volume
placed between the 2011 pre-construction and 2012 post-construction survey was calculated to
be approximately 404,550 cy. This volume was then compared to the volume recorded in the
pays surveys during construction (Lee County, 2013) and was found to be within one percent,
which confirms the profile adjustments employed and analysis performed herein.
The volumetric changes for 2013, 2014 and 2015 were then calculated by comparing the
monitoring surveys to the 2012 post-construction survey maintaining the 2012 toe of fill as the
Estero Island Restoration
2015 Annual Monitoring Report
19
seaward limit. Between 2012 and 2013 (15 months), the Project Area experienced erosion of
approximately 40,090 cy. Between 2012 to 2014 (30 months), the Project Area experienced
approximately 63,860 cy of erosion. Between 2012 and 2015 (41 months), the Project Area
experienced approximately 72,750 cy of erosion. The percent remaining in the Project Area in
2015 equates to approximately 82.0%.
Accounting for the time period between the surveys, the annualized erosion rates for the Project
Area for the first, second, and third monitoring periods equate to approximately 32,070 cy/year,
19,020 cy/year, and 9,700 cy/year, respectively. As anticipated, the erosion rate was highest in
the first year attributed to both profile equilibration and fill diffusion.
4.4 Contingent Area Performance
The area of contingency includes the northern tip of Estero Island north and west of the terminal
groin (Lee County, 2003). This area is monitored to evaluate the potential of downdrift effect as
a result of the terminal groin. Because the measured profile C-174A (az=245º) did not extend
above MHW for one or more of the monitoring surveys, the only shoreline change calculation
that could be performed was between R-174A (az=10º) and R-175 (az=10º) which experienced
significant advancement between 2014 and 2015. A review of the profile comparisons depicts
accretion on the upper beach and nearshore with little change across the channel at R-175
(az=10º), accretion on the upper beach and south side of the channel with little change in the
channel on the north side at C-174A (az=10º), and accretion in the nearshore at C-174A
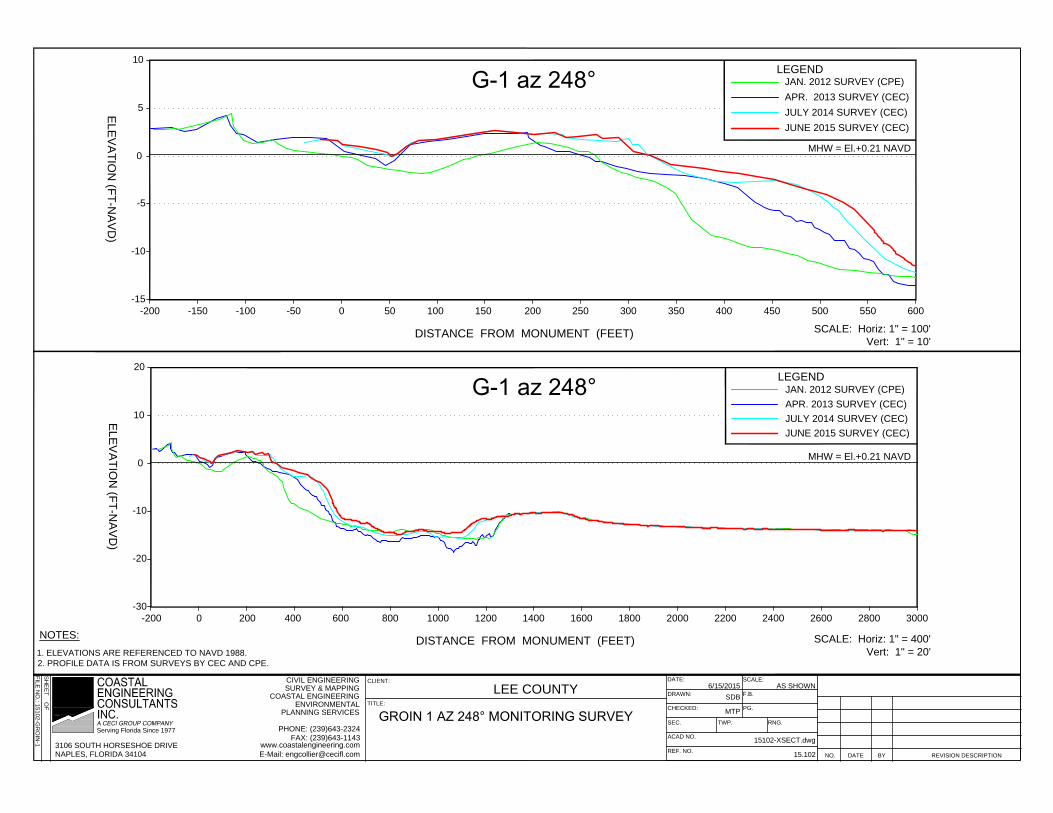
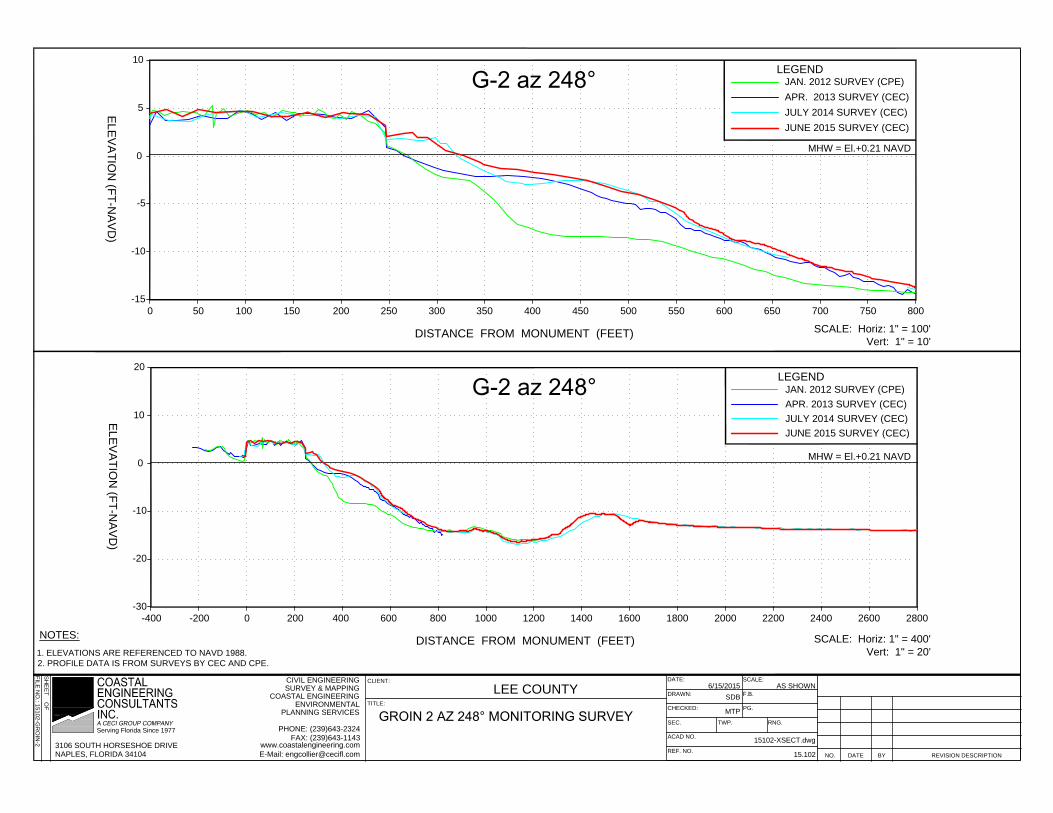
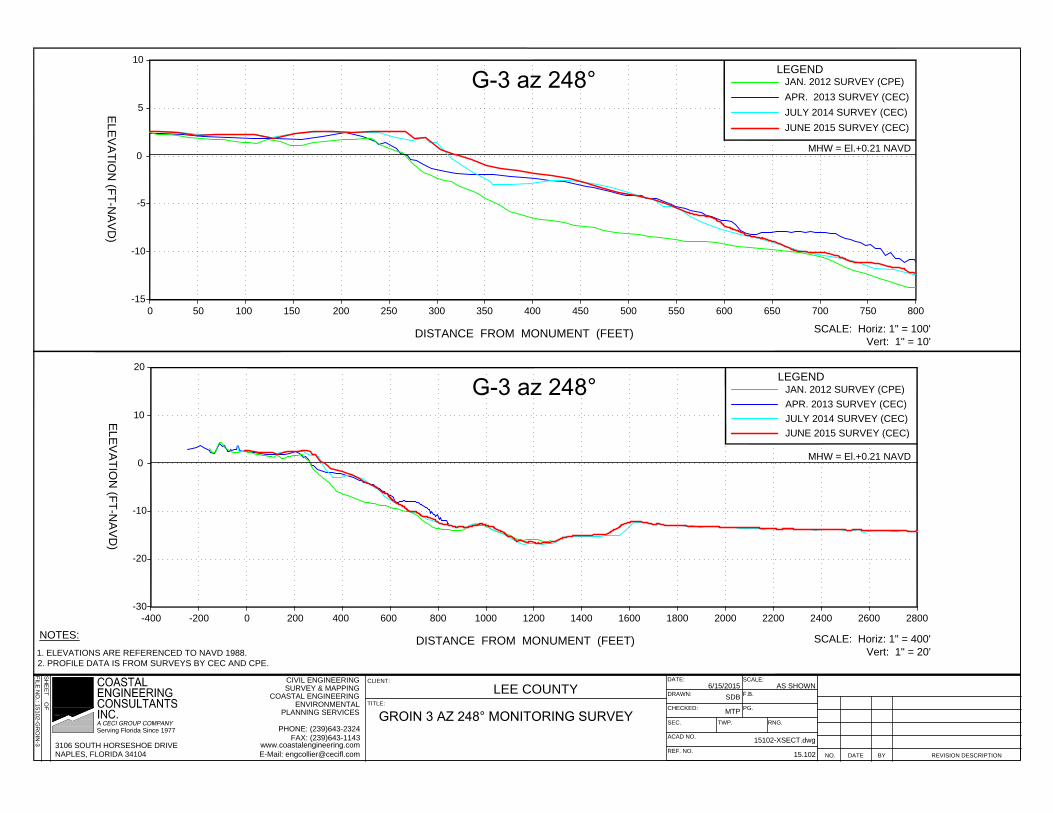
(az=245º) which lies immediately downdrift of the terminal groin (Appendix 2). A review of the
G-line profiles indicates negligible changes between 2014 and 2015 with mild flattening of the
slopes below MHW at all three profile lines. Net accretion is observed at all G-line profiles.
Based on the 2015 monitoring, no adverse impacts to the contingent shoreline were documented
due to the terminal groin.
Estero Island Restoration
2015 Annual Monitoring Report
20
5.0 CONCLUSION
This report describes the third annual monitoring results of the Estero Island Restoration Project.
The information presented herein provides the necessary data for both Lee County and FDEP to
regularly observe and assess, with quantitative measurements, the performance of the project,
any adverse effects which have occurred, and the need for any adjustments, modifications, or
mitigative response to the Project. The scientific monitoring processes also provides the County
and FDEP information necessary to plan, design, and optimize subsequent follow-up projects,
potentially reducing the need for and costs of unnecessary work, as well as potentially reducing
any environmental impacts that may have occurred or be expected. While the assumption on
profile adjustments employed herein was verified, some of the large scale volume changes
measured since construction may be attributed in part to differences in profile azimuths
measured over time.
Between July 2014 and June 2015, the beach fill segments along the entire monitoring area
experienced net shoreline recession of approximately 0.3 feet per year, net accretion of
approximately 40,890 cy measured above DOC, and net accretion of approximately 6,400 cy
measured above MWH.
Between 2014 and 2015, the Project Area experienced average shoreline recession of
approximately 6.6 feet, net accretion of approximately 24,610 cy measured above DOC, and net
erosion of approximately 130 cy measured above MWH.
The Project Area which received fill in 2011 experienced erosion of approximately 40,090 cy
between 2012 and 2013, 23,770 cy between 2013 and 2014, and 8,890 cy between 2014 and
2015 as measured within the fill template. There is approximately 331,800 cy or 82% remaining
within the design template from the original volume placed.
Monitoring of the contingency area, adjacent to and downdrift of the terminal groin, indicated
there were no documented impacts to the contingency shoreline from the terminal structure.
Based on the monitoring, there were no unanticipated or documented adverse impacts to the
natural resources or coastal system within the Project Area or adjacent control beaches.
Estero Island Restoration
2015 Annual Monitoring Report
21
6.0 REFERENCES
Lee County. (2003). Estero Island, Lovers Key & Bonita Beach restoration; contingency plan.
DEP permit 0173059-JC & 0200803-JC. Fort Myers.
Lee County. (2013). “Estero Island Restoration; 1st Year Annual Monitoring Report.” Lee
County Division of Natural Resources, Fort Myers.
Coastal Engineering. (2014) “Estero Island Restoration; 2nd
Year Annual Monitoring Report.”
Coastal Engineering Consultants Inc., Naples.
I:\2015\15102\Reports\15102_2015_Annual_Monitoring_Report-draft-20120701.docx

APPENDIX 1
SURVEY REPORT

APPENDIX 2
BEACH PROFILES
1200
DISTANCE FROM MONUMENT (FEET)
0
-30
400200 800600 1000
-20
-10
0
200016001400 1800 2200 2400
10
20
C-174A az 10°
ELE
VA
TIO
N (F
T-N
AV
D)
MHW = El.+0.21 NAVD
-200-400-600 2600
LEGEND
APR. 2013 SURVEY (CEC)
JAN. 2012 SURVEY (CPE)
JULY 2014 SURVEY (CEC)
JUNE 2015 SURVEY (CEC)
DISTANCE FROM MONUMENT (FEET)
-15
0
-5
0
-10
20015050 100 250 300
C-174A az 10°
10
5
ELE
VA
TIO
N (F
T-N
AV
D)
MHW = El.+0.21 NAVD
-350 -150-200-300 -250 -100 -50-500 -450 -400
LEGEND
JUNE 2015 SURVEY (CEC)
JAN. 2012 SURVEY (CPE)
JULY 2014 SURVEY (CEC)
APR. 2013 SURVEY (CEC)
FILE
N
O.: 15102-R
-174 A
Z 10
SH
EE
T O
F
CIVIL ENGINEERING
SURVEY & MAPPING
COASTAL ENGINEERING
ENVIRONMENTAL
PLANNING SERVICES
Serving Florida Since 1977
3106 SOUTH HORSESHOE DRIVE
NAPLES, FLORIDA 34104
PHONE: (239)643-2324
FAX: (239)643-1143
www.coastalengineering.com
E-Mail: [email protected]
TITLE:
CLIENT:
C-174A AZ 10° MONITORING SURVEY
LEE COUNTY
NO. REVISION DESCRIPTIONDATE BY
CHECKED:
F.B.
ACAD NO.
PG.
DRAWN:
DATE:
REF. NO.
SCALE:
SEC. TWP. RNG.
AS SHOWN
15102-XSECT.dwg
6/15/2015
SDB
MTP
15.102
SCALE: Horiz: 1" = 400'
Vert: 1" = 20'
SCALE: Horiz: 1" = 100'
Vert: 1" = 10'
NOTES:
1. ELEVATIONS ARE REFERENCED TO NAVD 1988.
2. PROFILE DATA IS FROM SURVEYS BY CEC AND CPE.
1200
DISTANCE FROM MONUMENT (FEET)
0
-30
400200 800600 1000
-20
-10
0
200016001400 1800 2200 26002400
10
20
C-174A az 245°
ELE
VA
TIO
N (F
T-N
AV
D)
-200-400-600
MHW = El.+0.21 NAVD
LEGEND
APR. 2013 SURVEY (CEC)
JAN. 2012 SURVEY (CPE)
JULY 2014 SURVEY (CEC)
JUNE 2015 SURVEY (CEC)
DISTANCE FROM MONUMENT (FEET)
-15
0
-5
0
-10
20015050 100 350250 300 550400 450 500 600 650 700 800750
C-174A az 245°
5
ELE
VA
TIO
N (F
T-N
AV
D)
MHW = El.+0.21 NAVD
-20
LEGEND
JAN. 2012 SURVEY (CPE)
MHW = El.+0.21 NAVD
JULY 2014 SURVEY (CEC)
APR. 2013 SURVEY (CEC)
JUNE 2015 SURVEY (CEC)
FILE
N
O.: 15102-R
-174 A
Z245
SH
EE
T O
F
CIVIL ENGINEERING
SURVEY & MAPPING
COASTAL ENGINEERING
ENVIRONMENTAL
PLANNING SERVICES
Serving Florida Since 1977
3106 SOUTH HORSESHOE DRIVE
NAPLES, FLORIDA 34104
PHONE: (239)643-2324
FAX: (239)643-1143
www.coastalengineering.com
E-Mail: [email protected]
TITLE:
CLIENT:
C-174A AZ 245° MONITORING SURVEY
LEE COUNTY
NO. REVISION DESCRIPTIONDATE BY
CHECKED:
F.B.
ACAD NO.
PG.
DRAWN:
DATE:
REF. NO.
SCALE:
SEC. TWP. RNG.
AS SHOWN
15102-XSECT.dwg
6/15/2015
SDB
MTP
15.102
SCALE: Horiz: 1" = 400'
Vert: 1" = 20'
SCALE: Horiz: 1" = 100'
Vert: 1" = 10'
NOTES:
1. ELEVATIONS ARE REFERENCED TO NAVD 1988.
2. PROFILE DATA IS FROM SURVEYS BY CEC AND CPE.
DISTANCE FROM MONUMENT (FEET)
-30
2000
-20
-10
0
1000600400 800 14001200 1600 320024001800 2000 2200 28002600 3000
R-175 az 10°
10
20
ELE
VA
TIO
N (F
T-N
AV
D)
MHW = El.+0.21 NAVD
LEGEND
APR. 2013 SURVEY (CEC)
JAN. 2012 SURVEY (CPE)
JULY 2014 SURVEY (CEC)
JUNE 2015 SURVEY (CEC)
-15
-10
0
-5
DISTANCE FROM MONUMENT (FEET)
300250 450400350 650600500 550 750 800700
5
R-175 az 10°
ELE
VA
TIO
N (F
T-N
AV
D)
850 900 950 1000 1050
MHW = El.+0.21 NAVD
-20
LEGEND
JULY 2014 SURVEY (CEC)
JAN. 2012 SURVEY (CPE)
APR. 2013 SURVEY (CEC)
JUNE 2015 SURVEY (CEC)
FILE
N
O.: 15102-R
-175 A
Z10
SH
EE
T O
F
CIVIL ENGINEERING
SURVEY & MAPPING
COASTAL ENGINEERING
ENVIRONMENTAL
PLANNING SERVICES
Serving Florida Since 1977
3106 SOUTH HORSESHOE DRIVE
NAPLES, FLORIDA 34104
PHONE: (239)643-2324
FAX: (239)643-1143
www.coastalengineering.com
E-Mail: [email protected]
TITLE:
CLIENT:
R-175 AZ 10° MONITORING SURVEY
LEE COUNTY
NO. REVISION DESCRIPTIONDATE BY
CHECKED:
F.B.
ACAD NO.
PG.
DRAWN:
DATE:
REF. NO.
SCALE:
SEC. TWP. RNG.
AS SHOWN
15102-XSECT.dwg
6/15/2015
SDB
MTP
15.102
SCALE: Horiz: 1" = 400'
Vert: 1" = 20'
SCALE: Horiz: 1" = 100'
Vert: 1" = 10'
NOTES:
1. ELEVATIONS ARE REFERENCED TO NAVD 1988.
2. PROFILE DATA IS FROM SURVEYS BY CEC AND CPE.
20
10
32002800 300026002400220018001400 1600 2000
0
-10
-20
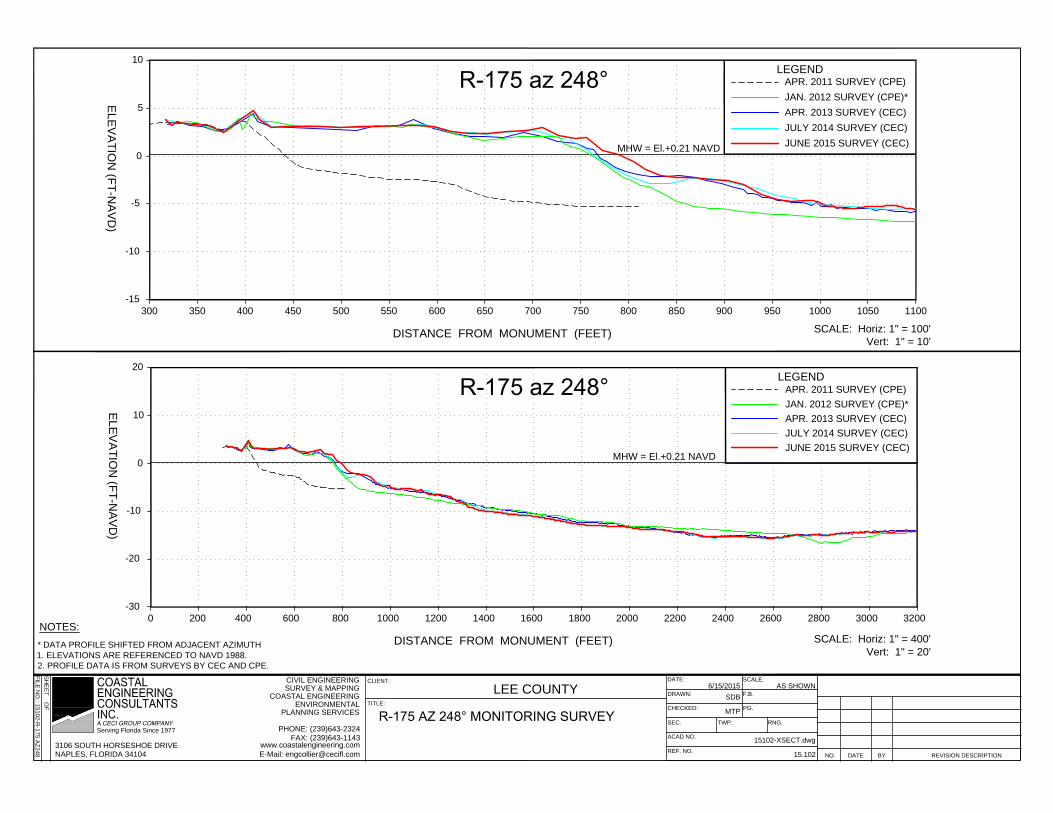
1000800600400200
-30
0 1200
DISTANCE FROM MONUMENT (FEET)
R-175 az 248°
ELE
VA
TIO
N (F
T-N
AV
D)
LEGEND
MHW = El.+0.21 NAVD
APR. 2013 SURVEY (CEC)
JAN. 2012 SURVEY (CPE)*
APR. 2011 SURVEY (CPE)
JULY 2014 SURVEY (CEC)
JUNE 2015 SURVEY (CEC)
10
5
800750650 700600500450400 550350300
-5
0
-10
-15
DISTANCE FROM MONUMENT (FEET)
R-175 az 248°
ELE
VA
TIO
N (F
T-N
AV
D)
900850 1000950 11001050
MHW = El.+0.21 NAVD
LEGEND
APR. 2013 SURVEY (CEC)
APR. 2011 SURVEY (CPE)
JAN. 2012 SURVEY (CPE)*
JUNE 2015 SURVEY (CEC)
JULY 2014 SURVEY (CEC)
FILE
N
O.: 15102-R
-175 A
Z248
SH
EE
T O
F
CIVIL ENGINEERING
SURVEY & MAPPING
COASTAL ENGINEERING
ENVIRONMENTAL
PLANNING SERVICES
Serving Florida Since 1977
3106 SOUTH HORSESHOE DRIVE
NAPLES, FLORIDA 34104
PHONE: (239)643-2324
FAX: (239)643-1143
www.coastalengineering.com
E-Mail: [email protected]
TITLE:
CLIENT:
R-175 AZ 248° MONITORING SURVEY
LEE COUNTY
NO. REVISION DESCRIPTIONDATE BY
CHECKED:
F.B.
ACAD NO.
PG.
DRAWN:
DATE:
REF. NO.
SCALE:
SEC. TWP. RNG.
AS SHOWN
15102-XSECT.dwg
6/15/2015
SDB
MTP
15.102
SCALE: Horiz: 1" = 400'
Vert: 1" = 20'
SCALE: Horiz: 1" = 100'
Vert: 1" = 10'
NOTES:
* DATA PROFILE SHIFTED FROM ADJACENT AZIMUTH
1. ELEVATIONS ARE REFERENCED TO NAVD 1988.
2. PROFILE DATA IS FROM SURVEYS BY CEC AND CPE.
-30
0
-20
-10
DISTANCE FROM MONUMENT (FEET)
1000200 400 600 800 14001200 1600 1800 28002000 2200 2400 2600 32003000
0
10
20
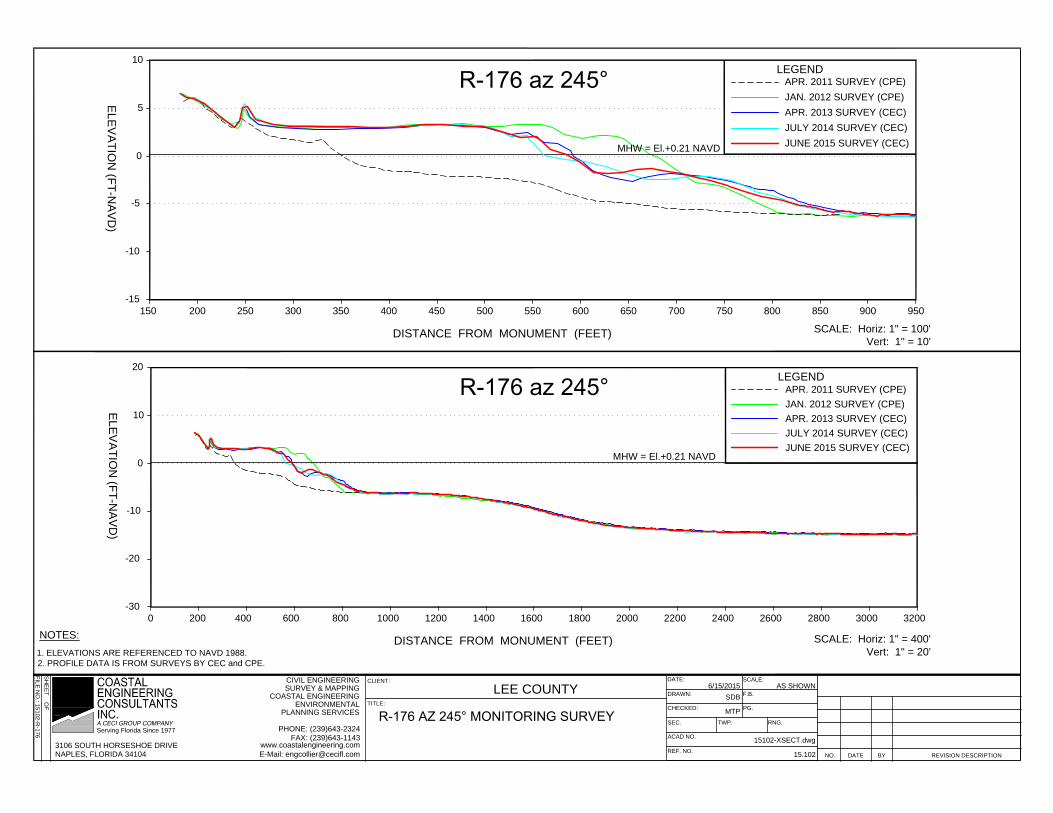
R-176 az 245°
ELE
VA
TIO
N (F
T-N
AV
D)
MHW = El.+0.21 NAVD
LEGEND
APR. 2013 SURVEY (CEC)
JAN. 2012 SURVEY (CPE)
APR. 2011 SURVEY (CPE)
JULY 2014 SURVEY (CEC)
JUNE 2015 SURVEY (CEC)
-10
-15
550
DISTANCE FROM MONUMENT (FEET)
300250200150 500450400350 750700650600 800
5
0
-5
10
R-176 az 245°
ELE
VA
TIO
N (F
T-N
AV
D)
850 900 950
LEGEND
MHW = El.+0.21 NAVD
APR. 2013 SURVEY (CEC)
APR. 2011 SURVEY (CPE)
JAN. 2012 SURVEY (CPE)
JUNE 2015 SURVEY (CEC)
JULY 2014 SURVEY (CEC)
FILE
N
O.: 15102-R
-176
SH
EE
T O
F
CIVIL ENGINEERING
SURVEY & MAPPING
COASTAL ENGINEERING
ENVIRONMENTAL
PLANNING SERVICES
Serving Florida Since 1977
3106 SOUTH HORSESHOE DRIVE
NAPLES, FLORIDA 34104
PHONE: (239)643-2324
FAX: (239)643-1143
www.coastalengineering.com
E-Mail: [email protected]
TITLE:
CLIENT:
R-176 AZ 245° MONITORING SURVEY
LEE COUNTY
NO. REVISION DESCRIPTIONDATE BY
CHECKED:
F.B.
ACAD NO.
PG.
DRAWN:
DATE:
REF. NO.
SCALE:
SEC. TWP. RNG.
AS SHOWN
15102-XSECT.dwg
6/15/2015
SDB
MTP
15.102
SCALE: Horiz: 1" = 400'
Vert: 1" = 20'
SCALE: Horiz: 1" = 100'
Vert: 1" = 10'
NOTES:
1. ELEVATIONS ARE REFERENCED TO NAVD 1988.
2. PROFILE DATA IS FROM SURVEYS BY CEC and CPE.
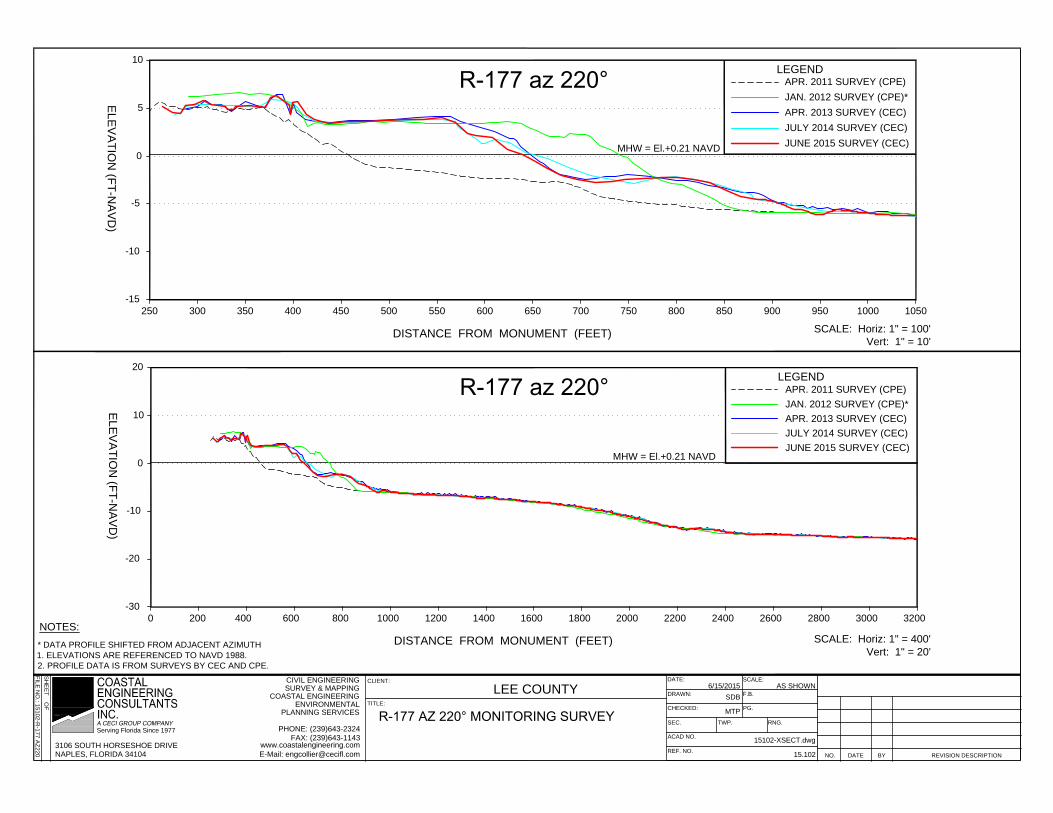
R-177 az 220°
-30
0
-20
-10
DISTANCE FROM MONUMENT (FEET)
1000200 400 600 800 14001200 1600 1800 28002000 2200 2400 2600 32003000
0
10
20
ELE
VA
TIO
N (F
T-N
AV
D)
LEGEND
MHW = El.+0.21 NAVD
APR. 2013 SURVEY (CEC)
JAN. 2012 SURVEY (CPE)*
APR. 2011 SURVEY (CPE)
JULY 2014 SURVEY (CEC)
JUNE 2015 SURVEY (CEC)
R-177 az 220°
-10
-15
550
DISTANCE FROM MONUMENT (FEET)
300250 500450400350 750700650600 800
5
0
-5
10
ELE
VA
TIO
N (F
T-N
AV
D)
850 900 950 1000 1050
LEGEND
MHW = El.+0.21 NAVD
APR. 2013 SURVEY (CEC)
APR. 2011 SURVEY (CPE)
JAN. 2012 SURVEY (CPE)*
JUNE 2015 SURVEY (CEC)
JULY 2014 SURVEY (CEC)
FILE
N
O.: 15102-R
-177 A
Z220
SH
EE
T O
F
CIVIL ENGINEERING
SURVEY & MAPPING
COASTAL ENGINEERING
ENVIRONMENTAL
PLANNING SERVICES
Serving Florida Since 1977
3106 SOUTH HORSESHOE DRIVE
NAPLES, FLORIDA 34104
PHONE: (239)643-2324
FAX: (239)643-1143
www.coastalengineering.com
E-Mail: [email protected]
TITLE:
CLIENT:
R-177 AZ 220° MONITORING SURVEY
LEE COUNTY
NO. REVISION DESCRIPTIONDATE BY
CHECKED:
F.B.
ACAD NO.
PG.
DRAWN:
DATE:
REF. NO.
SCALE:
SEC. TWP. RNG.
AS SHOWN
15102-XSECT.dwg
6/15/2015
SDB
MTP
15.102
SCALE: Horiz: 1" = 400'
Vert: 1" = 20'
SCALE: Horiz: 1" = 100'
Vert: 1" = 10'
NOTES:
* DATA PROFILE SHIFTED FROM ADJACENT AZIMUTH
1. ELEVATIONS ARE REFERENCED TO NAVD 1988.
2. PROFILE DATA IS FROM SURVEYS BY CEC AND CPE.
-30
0
-20
-10
DISTANCE FROM MONUMENT (FEET)
1000200 400 600 800 14001200 1600 1800 28002000 2200 2400 2600 32003000
0
10
20
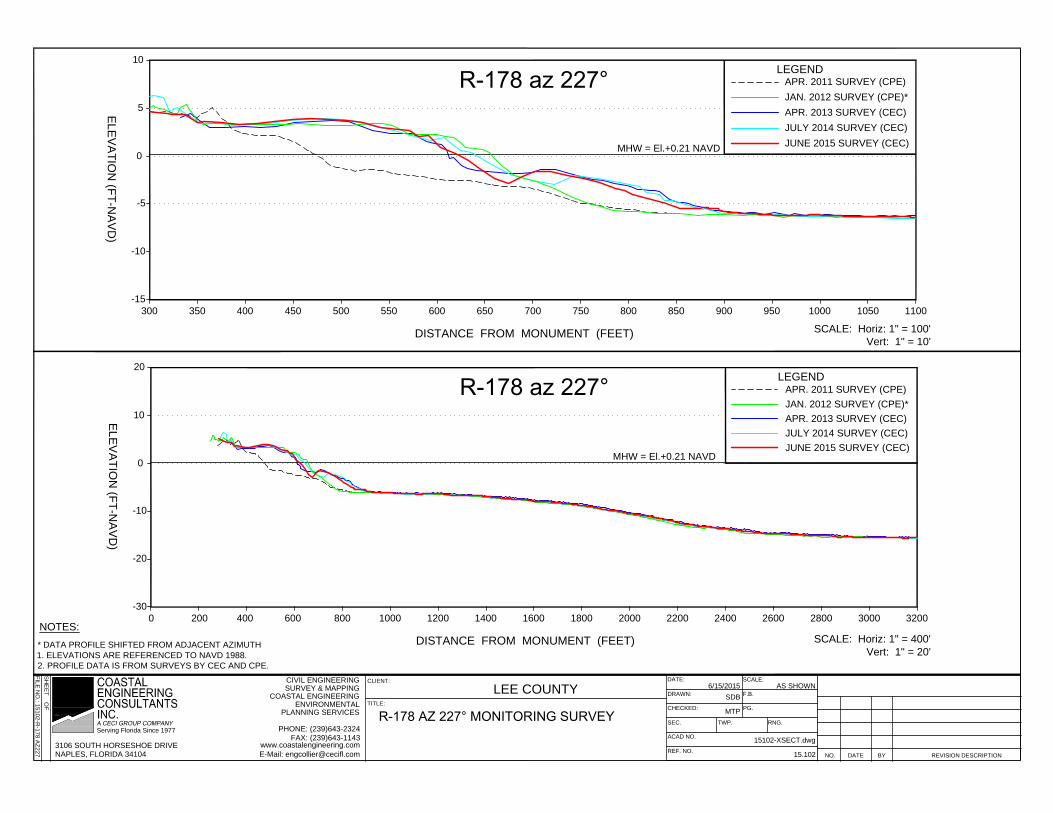
R-178 az 227°
ELE
VA
TIO
N (F
T-N
AV
D)
LEGEND
MHW = El.+0.21 NAVD
APR. 2013 SURVEY (CEC)
JAN. 2012 SURVEY (CPE)*
APR. 2011 SURVEY (CPE)
JULY 2014 SURVEY (CEC)
JUNE 2015 SURVEY (CEC)
-10
-15
550
DISTANCE FROM MONUMENT (FEET)
300 500450400350 750700650600 800
5
0
-5
10
R-178 az 227°
ELE
VA
TIO
N (F
T-N
AV
D)
1100850 10501000950900
LEGEND
MHW = El.+0.21 NAVD
APR. 2013 SURVEY (CEC)
APR. 2011 SURVEY (CPE)
JAN. 2012 SURVEY (CPE)*
JUNE 2015 SURVEY (CEC)
JULY 2014 SURVEY (CEC)
FILE
N
O.: 15102-R
-178 A
Z227
SH
EE
T O
F
CIVIL ENGINEERING
SURVEY & MAPPING
COASTAL ENGINEERING
ENVIRONMENTAL
PLANNING SERVICES
Serving Florida Since 1977
3106 SOUTH HORSESHOE DRIVE
NAPLES, FLORIDA 34104
PHONE: (239)643-2324
FAX: (239)643-1143
www.coastalengineering.com
E-Mail: [email protected]
TITLE:
CLIENT:
R-178 AZ 227° MONITORING SURVEY
LEE COUNTY
NO. REVISION DESCRIPTIONDATE BY
CHECKED:
F.B.
ACAD NO.
PG.
DRAWN:
DATE:
REF. NO.
SCALE:
SEC. TWP. RNG.
AS SHOWN
15102-XSECT.dwg
6/15/2015
SDB
MTP
15.102
SCALE: Horiz: 1" = 400'
Vert: 1" = 20'
SCALE: Horiz: 1" = 100'
Vert: 1" = 10'
NOTES:
* DATA PROFILE SHIFTED FROM ADJACENT AZIMUTH
1. ELEVATIONS ARE REFERENCED TO NAVD 1988.
2. PROFILE DATA IS FROM SURVEYS BY CEC AND CPE.

20
10
32002800 300026002400220018001400 1600 2000
0
-10
-20
1000800600400200
-30
0 1200
DISTANCE FROM MONUMENT (FEET)
R-179 az 230°
ELE
VA
TIO
N (F
T-N
AV
D)
LEGEND
MHW = El.+0.21 NAVD
APR. 2013 SURVEY (CEC)
JAN. 2012 SURVEY (CPE)*
APR. 2011 SURVEY (CPE)
JULY 2014 SURVEY (CEC)
JUNE 2015 SURVEY (CEC)
10
5
800750650 700600500450400 550350300250200
-5
0
-10
-15
DISTANCE FROM MONUMENT (FEET)
R-179 az 230°
ELE
VA
TIO
N (F
T-N
AV
D)
850 900 950 1000
LEGEND
MHW = El.+0.21 NAVD
APR. 2013 SURVEY (CEC)
APR. 2011 SURVEY (CPE)
JAN. 2012 SURVEY (CPE)*
JUNE 2015 SURVEY (CEC)
JULY 2014 SURVEY (CEC)
FILE
N
O.: 15102-R
-179 A
Z230
SH
EE
T O
F
CIVIL ENGINEERING
SURVEY & MAPPING
COASTAL ENGINEERING
ENVIRONMENTAL
PLANNING SERVICES
Serving Florida Since 1977
3106 SOUTH HORSESHOE DRIVE
NAPLES, FLORIDA 34104
PHONE: (239)643-2324
FAX: (239)643-1143
www.coastalengineering.com
E-Mail: [email protected]
TITLE:
CLIENT:
R-179 AZ 230° MONITORING SURVEY
LEE COUNTY
NO. REVISION DESCRIPTIONDATE BY
CHECKED:
F.B.
ACAD NO.
PG.
DRAWN:
DATE:
REF. NO.
SCALE:
SEC. TWP. RNG.
AS SHOWN
15102-XSECT.dwg
6/15/2015
SDB
MTP
15.102
SCALE: Horiz: 1" = 400'
Vert: 1" = 20'
SCALE: Horiz: 1" = 100'
Vert: 1" = 10'
NOTES:
* DATA PROFILE SHIFTED FROM ADJACENT AZIMUTH
1. ELEVATIONS ARE REFERENCED TO NAVD 1988.
2. PROFILE DATA IS FROM SURVEYS BY CEC AND CPE.
-30
0
-20
-10
DISTANCE FROM MONUMENT (FEET)
1000200 400 600 800 14001200 1600 1800 28002000 2200 2400 2600 32003000
0
10
20
R-180 az 210°
ELE
VA
TIO
N (F
T-N
AV
D)
LEGEND
MHW = El.+0.21 NAVD
APR. 2013 SURVEY (CEC)
JAN. 2012 SURVEY (CPE)*
APR. 2011 SURVEY (CPE)
JULY 2014 SURVEY (CEC)
JUNE 2015 SURVEY (CEC)
100
-10
500
-15
550
DISTANCE FROM MONUMENT (FEET)
300250200150 500450400350 750700650600 800
5
0
-5
10
R-180 az 210°
ELE
VA
TIO
N (F
T-N
AV
D)
LEGEND
MHW = El.+0.21 NAVD
APR. 2013 SURVEY (CEC)
APR. 2011 SURVEY (CPE)
JAN. 2012 SURVEY (CPE)*
JUNE 2015 SURVEY (CEC)
JULY 2014 SURVEY (CEC)
FILE
N
O.: 15102-R
-180 A
Z210
SH
EE
T O
F
CIVIL ENGINEERING
SURVEY & MAPPING
COASTAL ENGINEERING
ENVIRONMENTAL
PLANNING SERVICES
Serving Florida Since 1977
3106 SOUTH HORSESHOE DRIVE
NAPLES, FLORIDA 34104
PHONE: (239)643-2324
FAX: (239)643-1143
www.coastalengineering.com
E-Mail: [email protected]
TITLE:
CLIENT:
R-180 AZ 210° MONITORING SURVEY
LEE COUNTY
NO. REVISION DESCRIPTIONDATE BY
CHECKED:
F.B.
ACAD NO.
PG.
DRAWN:
DATE:
REF. NO.
SCALE:
SEC. TWP. RNG.
AS SHOWN
15102-XSECT.dwg
6/15/2015
SDB
MTP
15.102
SCALE: Horiz: 1" = 400'
Vert: 1" = 20'
SCALE: Horiz: 1" = 100'
Vert: 1" = 10'
NOTES:
* DATA PROFILE SHIFTED FROM ADJACENT AZIMUTH
1. ELEVATIONS ARE REFERENCED TO NAVD 1988.
2. PROFILE DATA IS FROM SURVEYS BY CEC AND CPE.
-30
0
-20
-10
DISTANCE FROM MONUMENT (FEET)
1000200 400 600 800 14001200 1600 1800 28002000 2200 2400 2600 32003000
0
10
20
C-180.5 az 205°
ELE
VA
TIO
N (F
T-N
AV
D)
2015 BIRD AREA
LEGEND
MHW = El.+0.21 NAVD
APR. 2013 SURVEY (CEC)
JAN. 2012 SURVEY (CPE)
APR. 2011 SURVEY (CPE)
JULY 2014 SURVEY (CEC)
JUNE 2015 SURVEY (CEC)
100
-10
500
-15
550
DISTANCE FROM MONUMENT (FEET)
300250200150 500450400350 750700650600
5
0
-5
ELE
VA
TIO
N (F
T-N
AV
D)
C-180.5 az 205°
-50
2015 BIRD AREA
LEGEND
MHW = El.+0.21 NAVD
APR. 2013 SURVEY (CEC)
APR. 2011 SURVEY (CPE)
JAN. 2012 SURVEY (CPE)
JUNE 2015 SURVEY (CEC)
JULY 2014 SURVEY (CEC)
10
FILE
N
O.: 15102-R
-180.5
SH
EE
T O
F
CIVIL ENGINEERING
SURVEY & MAPPING
COASTAL ENGINEERING
ENVIRONMENTAL
PLANNING SERVICES
Serving Florida Since 1977
3106 SOUTH HORSESHOE DRIVE
NAPLES, FLORIDA 34104
PHONE: (239)643-2324
FAX: (239)643-1143
www.coastalengineering.com
E-Mail: [email protected]
TITLE:
CLIENT:
C-180.5 AZ 205° MONITORING SURVEY
LEE COUNTY
NO. REVISION DESCRIPTIONDATE BY
CHECKED:
F.B.
ACAD NO.
PG.
DRAWN:
DATE:
REF. NO.
SCALE:
SEC. TWP. RNG.
AS SHOWN
15102-XSECT.dwg
6/15/2015
SDB
MTP
15.102
SCALE: Horiz: 1" = 400'
Vert: 1" = 20'
SCALE: Horiz: 1" = 100'
Vert: 1" = 10'
NOTES:
1. ELEVATIONS ARE REFERENCED TO NAVD 1988.
2. PROFILE DATA IS FROM SURVEYS BY CEC AND CPE.
-30
0
-20
-10
DISTANCE FROM MONUMENT (FEET)
1000200 400 600 800 14001200 1600 1800 28002000 2200 2400 2600 32003000
0
10
20
R-181 az 205°
ELE
VA
TIO
N (F
T-N
AV
D)
LEGEND
MHW = El.+0.21 NAVD
APR. 2013 SURVEY (CEC)
JAN. 2012 SURVEY (CPE)
APR. 2011 SURVEY (CPE)
JULY 2014 SURVEY (CEC)
JUNE 2015 SURVEY (CEC)
100
-10
500
-15
550
DISTANCE FROM MONUMENT (FEET)
300250200150 500450400350 750700650600 800
5
0
-5
ELE
VA
TIO
N (F
T-N
AV
D)
R-181 az 205°
LEGEND
MHW = El.+0.21 NAVD
APR. 2013 SURVEY (CEC)
APR. 2011 SURVEY (CPE)
JAN. 2012 SURVEY (CPE)
JUNE 2015 SURVEY (CEC)
JULY 2014 SURVEY (CEC)
10
FILE
N
O.: 15102-R
-181 A
Z205
SH
EE
T O
F
CIVIL ENGINEERING
SURVEY & MAPPING
COASTAL ENGINEERING
ENVIRONMENTAL
PLANNING SERVICES
Serving Florida Since 1977
3106 SOUTH HORSESHOE DRIVE
NAPLES, FLORIDA 34104
PHONE: (239)643-2324
FAX: (239)643-1143
www.coastalengineering.com
E-Mail: [email protected]
TITLE:
CLIENT:
R-181 AZ 205° MONITORING SURVEY
LEE COUNTY
NO. REVISION DESCRIPTIONDATE BY
CHECKED:
F.B.
ACAD NO.
PG.
DRAWN:
DATE:
REF. NO.
SCALE:
SEC. TWP. RNG.
AS SHOWN
15102-XSECT.dwg
6/15/2015
SDB
MTP
15.102
SCALE: Horiz: 1" = 400'
Vert: 1" = 20'
SCALE: Horiz: 1" = 100'
Vert: 1" = 10'
NOTES:
1. ELEVATIONS ARE REFERENCED TO NAVD 1988.
2. PROFILE DATA IS FROM SURVEYS BY CEC AND CPE.
20
10
32002800 300026002400220018001400 1600 2000
0
-10
-20
1000800600400200
-30
0 1200
DISTANCE FROM MONUMENT (FEET)
R-182 az 204°
ELE
VA
TIO
N (F
T-N
AV
D)
LEGEND
MHW = El.+0.21 NAVD
APR. 2013 SURVEY (CEC)
JAN. 2012 SURVEY (CPE)*
APR. 2011 SURVEY (CPE)
JULY 2014 SURVEY (CEC)
JUNE 2015 SURVEY (CEC)
10
5
800750650 700600500450400 550350300
-5
0
-10
-15
DISTANCE FROM MONUMENT (FEET)
R-182 az 204°
ELE
VA
TIO
N (F
T-N
AV
D)
850 10501000950900 1100
LEGEND
MHW = El.+0.21 NAVD
APR. 2013 SURVEY (CEC)
APR. 2011 SURVEY (CPE)
JAN. 2012 SURVEY (CPE)*
JUNE 2015 SURVEY (CEC)
JULY 2014 SURVEY (CEC)
FILE
N
O.: 15102-R
-182 A
Z204
SH
EE
T O
F
CIVIL ENGINEERING
SURVEY & MAPPING
COASTAL ENGINEERING
ENVIRONMENTAL
PLANNING SERVICES
Serving Florida Since 1977
3106 SOUTH HORSESHOE DRIVE
NAPLES, FLORIDA 34104
PHONE: (239)643-2324
FAX: (239)643-1143
www.coastalengineering.com
E-Mail: [email protected]
TITLE:
CLIENT:
R-182 AZ 204° MONITORING SURVEY
LEE COUNTY
NO. REVISION DESCRIPTIONDATE BY
CHECKED:
F.B.
ACAD NO.
PG.
DRAWN:
DATE:
REF. NO.
SCALE:
SEC. TWP. RNG.
AS SHOWN
15102-XSECT.dwg
6/15/2015
SDB
MTP
15.102
SCALE: Horiz: 1" = 400'
Vert: 1" = 20'
SCALE: Horiz: 1" = 100'
Vert: 1" = 10'
NOTES:
* DATA PROFILE SHIFTED FROM ADJACENT AZIMUTH
1. ELEVATIONS ARE REFERENCED TO NAVD 1988.
2. PROFILE DATA IS FROM SURVEYS BY CEC AND CPE.
-30
0
-20
-10
DISTANCE FROM MONUMENT (FEET)
1000200 400 600 800 14001200 1600 1800 28002000 2200 2400 2600 32003000
0
10
20
R-183 az 205°
ELE
VA
TIO
N (F
T-N
AV
D)
MHW = El.+0.21 NAVD
LEGEND
APR. 2013 SURVEY (CEC)
JAN. 2012 SURVEY (CPE)
JULY 2014 SURVEY (CEC)
JUNE 2015 SURVEY (CEC)
100
-10
500
-15
550
DISTANCE FROM MONUMENT (FEET)
300250200150 500450400350 750700650600 800
5
0
-5
ELE
VA
TIO
N (F
T-N
AV
D)
R-183 az 205°
LEGEND
MHW = El.+0.21 NAVD
JULY 2014 SURVEY (CEC)
JAN. 2012 SURVEY (CPE)
APR. 2013 SURVEY (CEC)
JUNE 2015 SURVEY (CEC)
10
FILE
N
O.: 15102-R
-183
SH
EE
T O
F
CIVIL ENGINEERING
SURVEY & MAPPING
COASTAL ENGINEERING
ENVIRONMENTAL
PLANNING SERVICES
Serving Florida Since 1977
3106 SOUTH HORSESHOE DRIVE
NAPLES, FLORIDA 34104
PHONE: (239)643-2324
FAX: (239)643-1143
www.coastalengineering.com
E-Mail: [email protected]
TITLE:
CLIENT:
R-183 AZ 205° MONITORING SURVEY
LEE COUNTY
NO. REVISION DESCRIPTIONDATE BY
CHECKED:
F.B.
ACAD NO.
PG.
DRAWN:
DATE:
REF. NO.
SCALE:
SEC. TWP. RNG.
AS SHOWN
15102-XSECT.dwg
6/15/2015
SDB
MTP
15.102
SCALE: Horiz: 1" = 400'
Vert: 1" = 20'
SCALE: Horiz: 1" = 100'
Vert: 1" = 10'
NOTES:
1. ELEVATIONS ARE REFERENCED TO NAVD 1988.
2. PROFILE DATA IS FROM SURVEYS BY CEC, CPE AND FDEP.
20
10
32002800 300026002400220018001400 1600 2000
0
-10
-20
1000800600400200
-30
0 1200
DISTANCE FROM MONUMENT (FEET)
R-184 az 205°
ELE
VA
TIO
N (F
T-N
AV
D)
MHW = El.+0.21 NAVD
LEGEND
APR. 2013 SURVEY (CEC)
JAN. 2012 SURVEY (CPE)
JULY 2014 SURVEY (CEC)
JUNE 2015 SURVEY (CEC)
10
5
800750650 700600500450400 550350300250200
-5
0
-10
-15
DISTANCE FROM MONUMENT (FEET)
R-184 az 205°
ELE
VA
TIO
N (F
T-N
AV
D)
850 900 950 1000
LEGEND
MHW = El.+0.21 NAVD
JULY 2014 SURVEY (CEC)
JAN. 2012 SURVEY (CPE)
APR. 2013 SURVEY (CEC)
JUNE 2015 SURVEY (CEC)
FILE
N
O.: 15102-R
-184 A
Z205
SH
EE
T O
F
CIVIL ENGINEERING
SURVEY & MAPPING
COASTAL ENGINEERING
ENVIRONMENTAL
PLANNING SERVICES
Serving Florida Since 1977
3106 SOUTH HORSESHOE DRIVE
NAPLES, FLORIDA 34104
PHONE: (239)643-2324
FAX: (239)643-1143
www.coastalengineering.com
E-Mail: [email protected]
TITLE:
CLIENT:
R-184 AZ 205° MONITORING SURVEY
LEE COUNTY
NO. REVISION DESCRIPTIONDATE BY
CHECKED:
F.B.
ACAD NO.
PG.
DRAWN:
DATE:
REF. NO.
SCALE:
SEC. TWP. RNG.
AS SHOWN
15102-XSECT.dwg
6/15/2015
SDB
MTP
15.102
SCALE: Horiz: 1" = 400'
Vert: 1" = 20'
SCALE: Horiz: 1" = 100'
Vert: 1" = 10'
NOTES:
1. ELEVATIONS ARE REFERENCED TO NAVD 1988.
2. PROFILE DATA IS FROM SURVEYS BY CEC AND CPE.
-30
0
-20
-10
DISTANCE FROM MONUMENT (FEET)
1000200 400 600 800 14001200 1600 1800 28002000 2200 2400 2600 32003000
0
10
20
R-185 az 200°
ELE
VA
TIO
N (F
T-N
AV
D)
MHW = El.+0.21 NAVD
LEGEND
APR. 2013 SURVEY (CEC)
JAN. 2012 SURVEY (CPE)
JULY 2014 SURVEY (CEC)
JUNE 2015 SURVEY (CEC)
100
-10
500
-15
550
DISTANCE FROM MONUMENT (FEET)
300250200150 500450400350 750700650600 800
5
0
-5
ELE
VA
TIO
N (F
T-N
AV
D)
R-185 az 200°
LEGEND
MHW = El.+0.21 NAVD
JULY 2014 SURVEY (CEC)
JAN. 2012 SURVEY (CPE)
APR. 2013 SURVEY (CEC)
JUNE 2015 SURVEY (CEC)
10
FILE
N
O.: 15102-R
-185 A
Z200
SH
EE
T O
F
CIVIL ENGINEERING
SURVEY & MAPPING
COASTAL ENGINEERING
ENVIRONMENTAL
PLANNING SERVICES
Serving Florida Since 1977
3106 SOUTH HORSESHOE DRIVE
NAPLES, FLORIDA 34104
PHONE: (239)643-2324
FAX: (239)643-1143
www.coastalengineering.com
E-Mail: [email protected]
TITLE:
CLIENT:
R-185 AZ 200° MONITORING SURVEY
LEE COUNTY
NO. REVISION DESCRIPTIONDATE BY
CHECKED:
F.B.
ACAD NO.
PG.
DRAWN:
DATE:
REF. NO.
SCALE:
SEC. TWP. RNG.
AS SHOWN
15102-XSECT.dwg
6/15/2015
SDB
MTP
15.102
SCALE: Horiz: 1" = 400'
Vert: 1" = 20'
SCALE: Horiz: 1" = 100'
Vert: 1" = 10'
NOTES:
1. ELEVATIONS ARE REFERENCED TO NAVD 1988.
2. PROFILE DATA IS FROM SURVEYS BY CEC AND FDEP.
20
10
32002800 300026002400220018001400 1600 2000
0
-10
-20
1000800600400200
-30
0 1200
DISTANCE FROM MONUMENT (FEET)
R-186 az 205°
ELE
VA
TIO
N (F
T-N
AV
D)
MHW = El.+0.21 NAVD
LEGEND
APR. 2013 SURVEY (CEC)
JAN. 2012 SURVEY (CPE)
JULY 2014 SURVEY (CEC)
JUNE 2015 SURVEY (CEC)
10
5
800750650 700600500450400 55035030025015010050 200
-5
0
-10
-15
DISTANCE FROM MONUMENT (FEET)
R-186 az 205°
ELE
VA
TIO
N (F
T-N
AV
D)
850
LEGEND
MHW = El.+0.21 NAVD
JULY 2014 SURVEY (CEC)
JAN. 2012 SURVEY (CPE)
APR. 2013 SURVEY (CEC)
JUNE 2015 SURVEY (CEC)
FILE
N
O.: 15102-R
-186
SH
EE
T O
F
CIVIL ENGINEERING
SURVEY & MAPPING
COASTAL ENGINEERING
ENVIRONMENTAL
PLANNING SERVICES
Serving Florida Since 1977
3106 SOUTH HORSESHOE DRIVE
NAPLES, FLORIDA 34104
PHONE: (239)643-2324
FAX: (239)643-1143
www.coastalengineering.com
E-Mail: [email protected]
TITLE:
CLIENT:
R-186 AZ 205° MONITORING SURVEY
LEE COUNTY
NO. REVISION DESCRIPTIONDATE BY
CHECKED:
F.B.
ACAD NO.
PG.
DRAWN:
DATE:
REF. NO.
SCALE:
SEC. TWP. RNG.
AS SHOWN
15102-XSECT.dwg
6/15/2015
SDB
MTP
15.102
SCALE: Horiz: 1" = 400'
Vert: 1" = 20'
SCALE: Horiz: 1" = 100'
Vert: 1" = 10'
NOTES:
1. ELEVATIONS ARE REFERENCED TO NAVD 1988.
2. PROFILE DATA IS FROM SURVEYS BY CEC AND CPE.
G-1 az 248°
-30
0
-20
-10
DISTANCE FROM MONUMENT (FEET)
1000200 400 600 800 14001200 1600 1800 28002000 2200 2400 2600 3000
0
10
20
ELE
VA
TIO
N (F
T-N
AV
D)
-200
MHW = El.+0.21 NAVD
LEGEND
APR. 2013 SURVEY (CEC)
JAN. 2012 SURVEY (CPE)
JULY 2014 SURVEY (CEC)
JUNE 2015 SURVEY (CEC)
G-1 az 248°
100
-10
500
-15
550
DISTANCE FROM MONUMENT (FEET)
300250200150 500450400350 600
5
0
-5
10
ELE
VA
TIO
N (F
T-N
AV
D)
-50-100-150-200
LEGEND
MHW = El.+0.21 NAVD
JULY 2014 SURVEY (CEC)
JAN. 2012 SURVEY (CPE)
APR. 2013 SURVEY (CEC)
JUNE 2015 SURVEY (CEC)
FILE
N
O.: 15102-G
RO
IN
-1
SH
EE
T O
F
CIVIL ENGINEERING
SURVEY & MAPPING
COASTAL ENGINEERING
ENVIRONMENTAL
PLANNING SERVICES
Serving Florida Since 1977
3106 SOUTH HORSESHOE DRIVE
NAPLES, FLORIDA 34104
PHONE: (239)643-2324
FAX: (239)643-1143
www.coastalengineering.com
E-Mail: [email protected]
TITLE:
CLIENT:
GROIN 1 AZ 248° MONITORING SURVEY
LEE COUNTY
NO. REVISION DESCRIPTIONDATE BY
CHECKED:
F.B.
ACAD NO.
PG.
DRAWN:
DATE:
REF. NO.
SCALE:
SEC. TWP. RNG.
AS SHOWN
15102-XSECT.dwg
6/15/2015
SDB
MTP
15.102
SCALE: Horiz: 1" = 400'
Vert: 1" = 20'
SCALE: Horiz: 1" = 100'
Vert: 1" = 10'
NOTES:
1. ELEVATIONS ARE REFERENCED TO NAVD 1988.
2. PROFILE DATA IS FROM SURVEYS BY CEC AND CPE.
20
10
280026002400220018001400 1600 2000
0
-10
-20
1000800600400200
-30
0 1200
DISTANCE FROM MONUMENT (FEET)
G-2 az 248°
ELE
VA
TIO
N (F
T-N
AV
D)
-200-400
MHW = El.+0.21 NAVD
LEGEND
APR. 2013 SURVEY (CEC)
JAN. 2012 SURVEY (CPE)
JULY 2014 SURVEY (CEC)
JUNE 2015 SURVEY (CEC)
10
5
800750650 700600500450400 55035030025015010050 200
-5
0
-10
-15
0
DISTANCE FROM MONUMENT (FEET)
G-2 az 248°
ELE
VA
TIO
N (F
T-N
AV
D)
LEGEND
MHW = El.+0.21 NAVD
JULY 2014 SURVEY (CEC)
JAN. 2012 SURVEY (CPE)
APR. 2013 SURVEY (CEC)
JUNE 2015 SURVEY (CEC)
FILE
N
O.: 15102-G
RO
IN
-2
SH
EE
T O
F
CIVIL ENGINEERING
SURVEY & MAPPING
COASTAL ENGINEERING
ENVIRONMENTAL
PLANNING SERVICES
Serving Florida Since 1977
3106 SOUTH HORSESHOE DRIVE
NAPLES, FLORIDA 34104
PHONE: (239)643-2324
FAX: (239)643-1143
www.coastalengineering.com
E-Mail: [email protected]
TITLE:
CLIENT:
GROIN 2 AZ 248° MONITORING SURVEY
LEE COUNTY
NO. REVISION DESCRIPTIONDATE BY
CHECKED:
F.B.
ACAD NO.
PG.
DRAWN:
DATE:
REF. NO.
SCALE:
SEC. TWP. RNG.
AS SHOWN
15102-XSECT.dwg
6/15/2015
SDB
MTP
15.102
SCALE: Horiz: 1" = 400'
Vert: 1" = 20'
SCALE: Horiz: 1" = 100'
Vert: 1" = 10'
NOTES:
1. ELEVATIONS ARE REFERENCED TO NAVD 1988.
2. PROFILE DATA IS FROM SURVEYS BY CEC AND CPE.
20
10
280026002400220018001400 1600 2000
0
-10
-20
1000800600400200
-30
0 1200
DISTANCE FROM MONUMENT (FEET)
G-3 az 248°
ELE
VA
TIO
N (F
T-N
AV
D)
-200-400
MHW = El.+0.21 NAVD
LEGEND
APR. 2013 SURVEY (CEC)
JAN. 2012 SURVEY (CPE)
JULY 2014 SURVEY (CEC)
JUNE 2015 SURVEY (CEC)
10
5
800750650 700600500450400 55035030025015010050 200
-5
0
-10
-15
0
DISTANCE FROM MONUMENT (FEET)
G-3 az 248°
ELE
VA
TIO
N (F
T-N
AV
D)
LEGEND
MHW = El.+0.21 NAVD
JULY 2014 SURVEY (CEC)
JAN. 2012 SURVEY (CPE)
APR. 2013 SURVEY (CEC)
JUNE 2015 SURVEY (CEC)
FILE
N
O.: 15102-G
RO
IN
-3
SH
EE
T O
F
CIVIL ENGINEERING
SURVEY & MAPPING
COASTAL ENGINEERING
ENVIRONMENTAL
PLANNING SERVICES
Serving Florida Since 1977
3106 SOUTH HORSESHOE DRIVE
NAPLES, FLORIDA 34104
PHONE: (239)643-2324
FAX: (239)643-1143
www.coastalengineering.com
E-Mail: [email protected]
TITLE:
CLIENT:
GROIN 3 AZ 248° MONITORING SURVEY
LEE COUNTY
NO. REVISION DESCRIPTIONDATE BY
CHECKED:
F.B.
ACAD NO.
PG.
DRAWN:
DATE:
REF. NO.
SCALE:
SEC. TWP. RNG.
AS SHOWN
15102-XSECT.dwg
6/15/2015
SDB
MTP
15.102
SCALE: Horiz: 1" = 400'
Vert: 1" = 20'
SCALE: Horiz: 1" = 100'
Vert: 1" = 10'
NOTES:
1. ELEVATIONS ARE REFERENCED TO NAVD 1988.
2. PROFILE DATA IS FROM SURVEYS BY CEC AND CPE.