establishing temperature and humidity profiles in fluidized bed particulate coating
TRANSCRIPT
ELSEVIER Powder Technology 94 ( 19971 181-185
POWDER TECHNOLOGY
Letter
Establishing temperature and humidity profiles in fluidized bed particulate coating
S.J. Maronga, P. Wnukowski * Department n.f Chemical Engineering am/Tecimolo.~y. Royal h~titute n/Techmdogy. I00 44 Slnckhohn. Su'e~h,n
Received 2 January 199fl: revised 4 August 1997
Abstract
A method fl)r establishing temperature and humidity pmliles inside a ltuidized bed during patliculate coating has been developed. The process involves direct measurement of the variable.`' at selected points, generating extra points in between the measured point.,, and then processing them to obtain the pmfile,~. A computer program is used to superimpose the profiles and contours, thus shov,!ng how different parts of the bed are involved in the coating process. The analysis of the prohles together with the characteristics of the measured values has led to the delineation of the bed into different zones. Different colours or greys can be used to represent different inten.sities in assessing the effect of different variables on the process and thus provide a valuable tool for the design and optimization of fluidized bed processes. © I097 Elsevier Science S.A.
Kevu'm'd.~: Coaling process: l-luidized bed.,,: Granulalion: Temperature plolile,,: Humidily pmlile,,
1. Introduct ion
The efliciency of Iluidizing bed particulate coating proc- esses depends on many factors in and around the bed itself. Among the important factors influencing heat and mass ll'allS- fer in the bed are the nlechanism and tale of spraying, prop- erties of the coating material, seed particles and equipment design. The understanding of how the above factors inltuence the coating process is essential in producing coated particles with required properties. Since different bed designs may have different operating features, a more general procedure lbr establishing the conditions inside the bed is required.
As explained by earlier studies [I-3] the humidity and temperature measurements are indicators of mass and heat transfer during particulate coating or in similar fluid bed proc- esses. The absence of information on how these variables are distributed inside the bed will likely lead to operation below the optimum conditions because of tear of wet quenching which, if it happen::, will normally result in the loss of the whole batch [ 4]. Some of the works on thermal profiles show that most of the ,,;pra~ ed liquid evaporates in a region around the atomizer. Smith and Nienow [ 5 ] used high-speed X-ray cine-photography in constructing temperature protiles tbr the diametric phme when a liquid feed nozzle was submerged in
* Corresponding author. Tel.: +46 8790 8232: lax: +46 81(}5 228: e-mail: [email protected]
0032-5910197/$17.00 © 1997 Elsevier Science S.A. All rights reserved PII S 0 0 3 2 - 5 9 1 0 ( 97 )03353-6
the bed and showed how the profiles change with change in ttuidizing gas flow rate. They showed that there was a creation of a low-temperature zone near the nozzle where most of the evaporation takes place. Wnukowski 161. using glad,, head particles sprayed with water, found th'~t for a fluidized bed with top spraying three distinct temperature regions could be identified.
Some of the previous investigations on the effect of dif- ferent drying temperatures on the lbrmation of granules de:dt with agglomerates. Schaefer and Worts 171 used the Glatt WSGI5 fluidized bed granulator to find the effect of the temperature and humidity of the inlet gas on the size of agglomerates formed. Earlier, Davies and Gloor, Jr. 181 found that very high fluidization temperatures result in little or no particle growth because of the spray-drying of the binder solution. Also. at low fluidization temperatures, wet quench- ing causes defluidization of the bed. More recently. Hovfirth and OrmOs [ 91. while coating ,,eeds with polymers in a flui- dized bed. found that different fluidizing temperatures may result in coating layers with differe')t characteristics, even when the same coating material is used.
There is a need. theretbre, to establish a method of assess- ing ~i,-rmal profiles in the bed. especially in and around the spraying zone, in order to find out the mechan;..,,, of growth and to be able to produce coated p~/n,cles with required char- acteristics. The answer to the question how much and how
182 S.J. Maronga, P. Wmlkow,@i / l)owder Teclmology ~4 ¢ It)~71 181-185
far the spray reaches is necessary in understanding and con- trolling different fluidized bed processes. Being able to estab- lish the humidity protile will provide a way of monitoring and assessing that effect. The procedure ought to be easy to use and applicable under different conditions and to many types of particles.
which had broken up and a few that were outside the range. The lactose particles used in the study passed through the w= 1.25 mm sieve and were retained by the w=0.8 mm sieve: they had a density of 1525 kg/m ~ and an average weight of !. i 395 × I 0 ~ g.
2.2. Measlo'ement technique
2. Experimental
2. !. Pilot phmt and seed particles
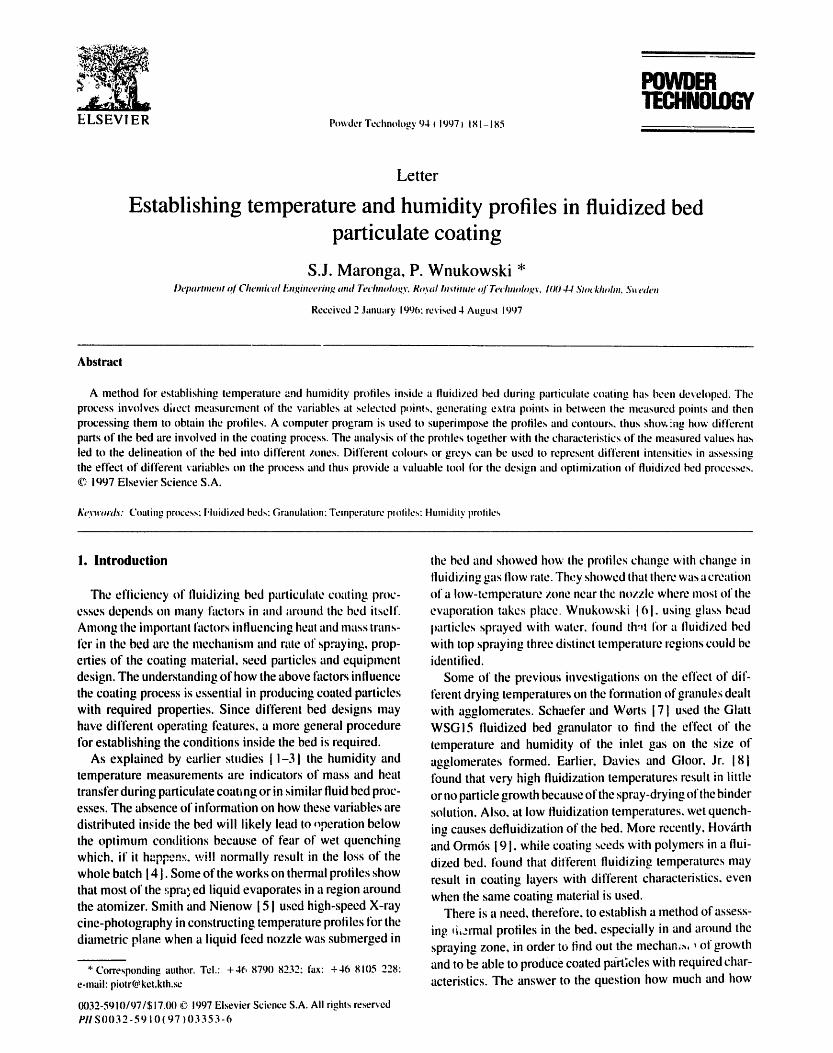
Experiments were performed in a closed-cycle fluidized bed at the Department of Chemical Engineering and Tech- nology of the Royal Institute of Technology, Stockholm. Sweden. The pilot plant ~',,; a capacity of up to 10 kg and is capable of both batch and continuous modes of operation. The fluidizing region is half conical, half cylindrical, with the conical part situated at the bottom close to the distributor plate. The diameter of the conical part of the bed is 0.225 m at the bottom and 0.3 m at the top. To provide an even air distribution, the distributor plate is made up of two stainless steel punched plates, ope on top of the other, and a stainless steel wire mesh ( w= 0.325 mm ) at the top. Each of the steel plates is I mm thick and has I mm rectangular spaced punched holes. The effective fluidizing height can be varied up to 0.4 m because the spraying nozzle position is adjustable. Fig. I shows the main features of the pilot phmt.
The particles used in this study were spherical lactose gran- ules. All batches were screened with sieves to remove those
Freeboard Chamber
II
Nozzle
Probe
Glass Cy=',~der
Distdb,4,~r
('1' 1 Tube Air Inlet
Fig, I. Main features of the pilot plant.
A batch of 4.0 kg lactose particles was introduced to the bed and fluidized using hot air with an excess gas velocity range U - U,,, of 0.874 m/s. The fluidized air was supplied at about 69°C and the top spraying with water was at a rate of 0.9 X 10- ~' m3/s. The spraying nozzle ( Schlick 940 Form 7-1) was placed 300 mm from the distributor plate. The nozzle was supplied with atomizing air at 351) kPa and set to give a full c,mical spray covering of 40 °.
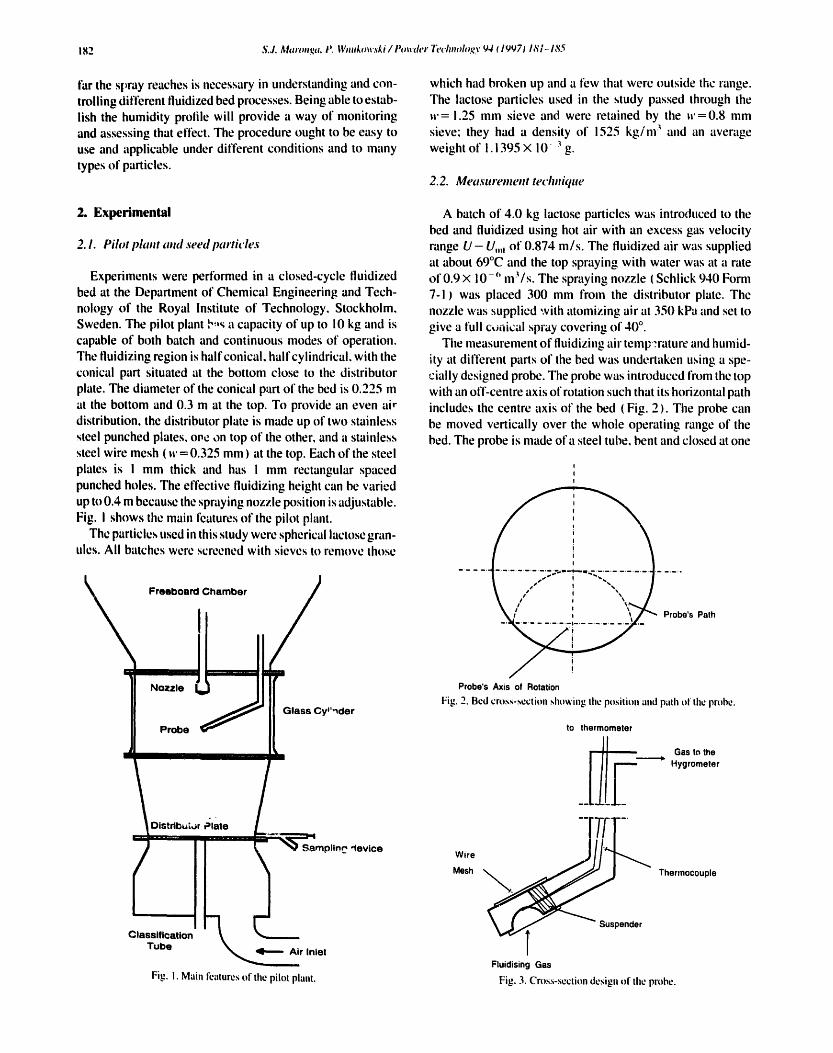
The measurement of fluidizing air temF'rature and humid- ity at different parts of the bed was undertaken using a spe- cially designed probe. The probe was introduced from the top with an off-centre axis of rotation such that its horizontal path includes the centre axis of the bed ( Fig. 2). The probe can be moved vertically over the whole operating range of the bed. The probe is made of a steel tube, bent and closed at one
I I I
Probe s Path
Probe's Axis ot Rotation Fig. 2. Bed cross-.section .,,howiqg the posititm and path of the probe.
to thermometer
W . e
Mesh
Suspender
l Fluidising Gas
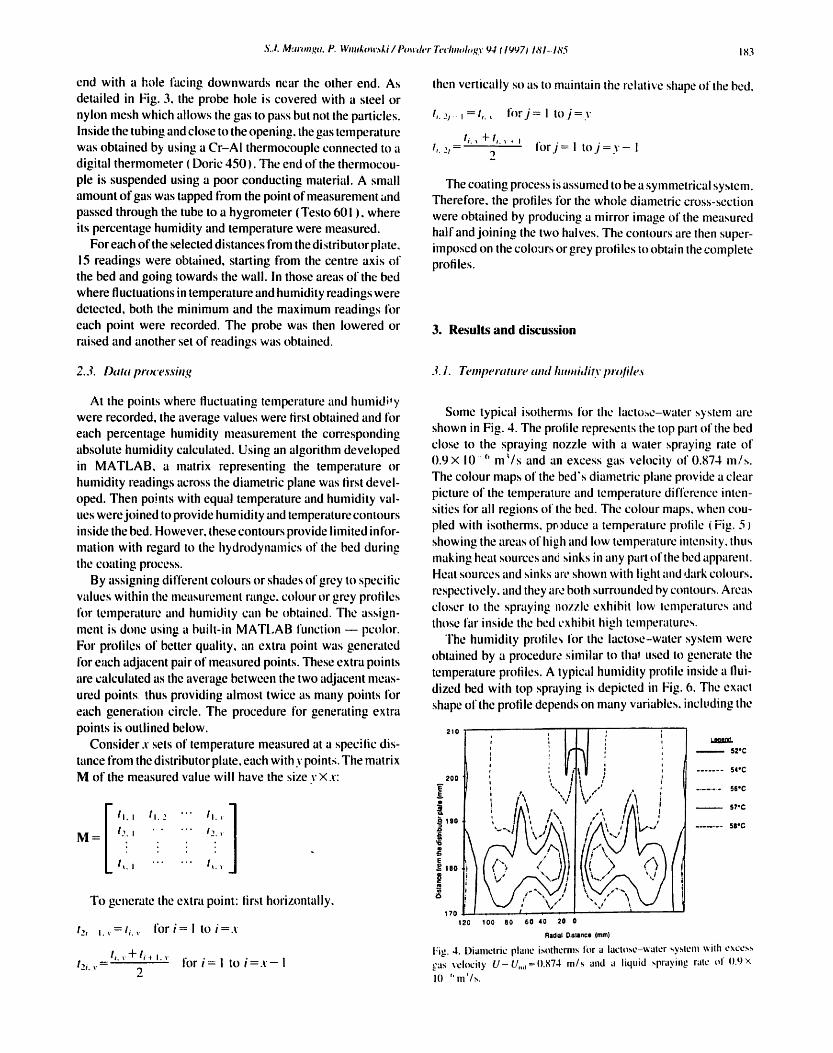
Fig. 3. Cross-section design of tile probe.
Gas to the I t
Hygrometer
Thermocouple
s..I. M,n'onga. P. Wnuko,'.~l~i / Pow, h,r Te,'lm,h,gy 94 ¢ 19971 181-185 183
end with a hole facing downwards near the other end. As detailed in Fig. 3, the probe hole is covered with a steel or nylon mesh which allows the gas to pass but not the panicles. Inside the tubing and close to the opening, the gas temperature was obtained by using a Cr-AI thermocouple connected to a digital thermometer ( Doric 450). The end of the thermocou- pie is suspended using a poor conducting material. A small amount of gas was tapped from the point of measurement and passed through the tube to a hygrometer (Testo 601 ), where its percentage humidity and temperature were measured.
For each of the selected distances from the distributor plate. 15 readings were obtained, starting from the centre axis of the bed and going towards the wall. In those areas of the bed where fluctuations in temperature and humidity readings were detected, both the minimum and the maximum readings for each point were recorded. The probe was then lowered or raised and another set of readings was obtained.
then vertically so as to maintain tile relative shape of the bed.
t , . e / , = 6 . , tot j = ! to . i=v
t,. 2 ,- ,) f o r j = I to.j = y - I
The coating process is assumed to be a symmetrical system. Therefore, the profiles lor the whole diametric cross-section were obtained by producing a mirror image of the measured half and joining the two halves. The contours are then super- imposed on the colours or grey profiles to obtain the complete profiles.
3 . R e s u l t s a n d d i s c u s s i o n
2.3. Data processing 3.1. Teml,erann'e and Immidity profile.~
At the points where fluctuating temperature and humidi,y were recorded, the average values were first obtained and for each percentage humidity measurement the corresponding absolute humidity calculated. Using an algorithm developed in MATLAB, a matrix representing the temperature or humidity readings across the diametric plane was first devel- oped. Then points with equal temperature and humidity val- ues were joined to provide humidity and temperature contours inside the bed. However, these contours provide limited infor- mation with regard to the hydrodynamics of the bed during the coating process.
By assigning different colours or shades of grey to specific values within the measurement range, colour or grey profiles for temperature and humidity can be obtained. The assign- ment is done using a built-in MATI.AB function - - pcolor. For profiles of better quality, an extra point was generated for each adjacent pair of measured points. These extra points are calculated as the average between the two adjacent meas- ured points thus providing almost twice as many points for each generation circle. The procedure for generating extra points is outlined below.
Consider x sets of temperature measured at a specific dis- tance from the distributor plate, each with y points. The matrix M of the measured value will have the size v xx:
M =
10., , , . _ . . . . l,., / -I
] 12. I . . . . . 12. v
1~. I . . . . . . l~.
To generate the extra point: first horizontally.
t2, t.,.=6.,, f o r i = l to i= .~
l i . v 7t- l i t I . v
I2,. , . - 2 for i = i to i = x - I
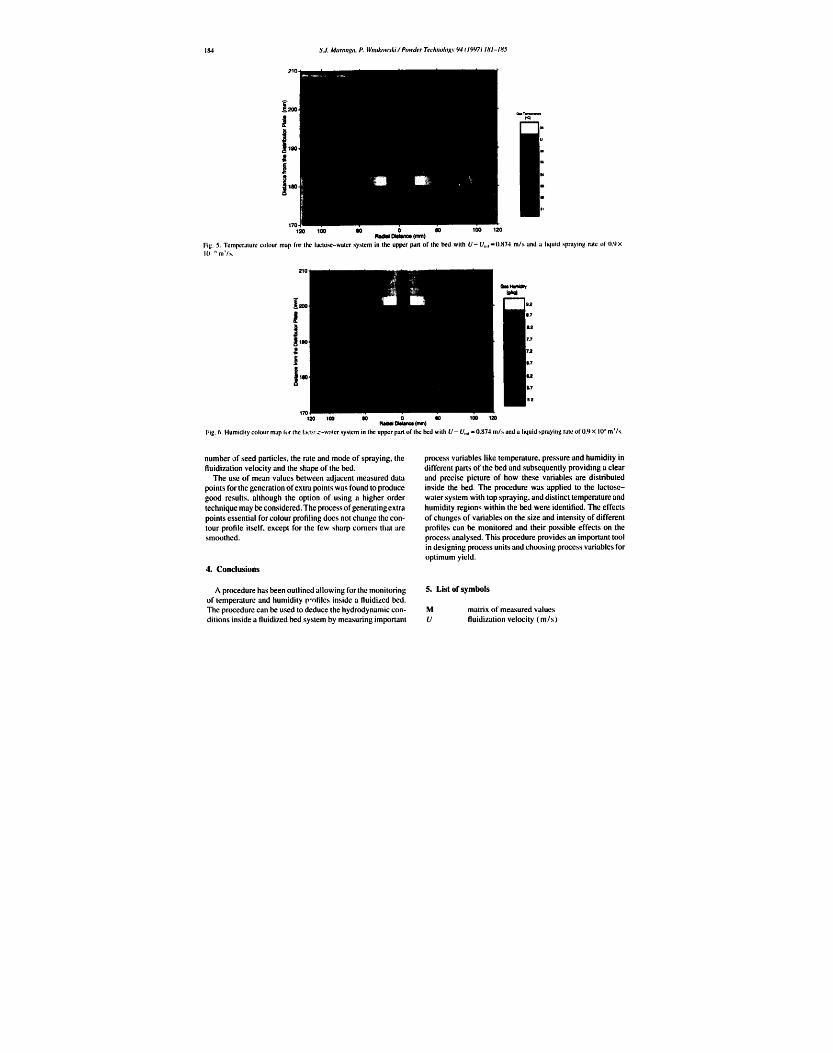
Some typical isotherms for the lactose-water system are shown in Fig. 4. The profile represents the top part of the bed dose to the spraying nozzle with a water spraying rate of 0.9X 1 0 " m~/s and an excess gas velocity of 0.874 m/.,,. The colour maps of the bed's diametric plane provide a clear picture of the temperature and temperature difference inten- sities lbr all regions of the bed. The colour maps. when cou- pled with isotherms, produce a temperature prolile ( Fig. 5 ) showing the areas of high and low tempel'alure intensity, thus making heat sources ant sinks in any part of the bed apparent. Heat sources and sinks are shown with light and dark colours. respectively, and they are both sum)unded by contour.,,. Areas closer to the spraying nozzle exhibit low temperatures and those far inside the bed exhibit high temperature,,.
The humidity prolile,, lot the lactose-water system were obtained by a procedure similar to that used to generate the temperature profiles. A typical humidity profile inside a IIui- dized bed with top spraying is depicted in Fig. 6. The exact shape of the profile depends on many variable.,,, including the
2 1 0
2 0 0
i 190
E
~eo
170
I I i i i i I ' : i i , *, i i , i ' %
I l ~ ~t
120 100 80 60 40 20
t l i
#
i ,J
v "~ I • .o • . . "
L lme l~_
, 52"C
. . . . . . . 54"C
. . . . . . . . SO'C
S? 'C
58oc
Radial O~slance (rnm)
Fig. 4. Diametric plane isothenn.~ for a lacto.~e-~ater ~ystem with exce.~s ,~'as velocity U-U,,,I=0.874 m/s and a liquid ~praying rate of ().9×
m /,~. I 0 " '
184 S.J. Maronga, P. Wm~kon'xki / Pon'der Technology 94 tl997) 1~1-185
Qnl L'q
120 100 IlO 0 (iO 100 120 P4dml Oimno* (~h'.)
Fi 8. 5. Temperature ¢ohmr map for the lacto.~-water system in the upper part of the bed with U- U,,,~ -0.874 m/s and u liquid sprayin 8 rate of 0.9 x 10 "m'/s .
I~lO 100 IlO 0 ilO 100 l~eO
Fig. 6. Humidity colour map fi,r ;he la,:t:r.c-w;,ler system in the upper part of the bed with U - U.,, ~ 0.874 m/s and a liquid spr, iyin 8 rate of 0.9 × 10" m ~/s.
number of ~ e d particles, the rate and mode of spraying, the fluidization velocity and the shape of the bed.
The use of mean values between adjacent measured data points for the generation of extra points was found to produce good results, although the option of using a higher order technique may be considered. The process of generafing extra points essential for colour profiling does not change the con- tour profile i t~lf , except for the few sharp corners that are smoothed.
4. Conclusions
process variables like temperature, pressure and humidity in different parts of the bed and subsequently providing a clear and precise picture of how these variables are distributed inside the bed. The procedure was applied to the lactose- water system with top spraying, and distinct temperature and humidity regions within the bed were identified. The effects of changes of variables on the size and intensity of different profiles can be monitored and their possible effects on the process analysed. This procedure provides an important tool in designing process units and choosing process variables for optimum yield.
A procedure has been outlined allowing for the monitoring of temperature and humidity profiles inside a fluidized bed. The procedure can be used to deduce the hydrodynamic con- ditions inside a fluidized bed system by measuring important
5. List of symbols
M matrix of measured values U fluidization velocity ( m / s )

S.J. Maronga. P. WnukeJw@i / Pem'der Te~'hmJhJgy 9,411~7) II~l- 11¢5 185
Umr U - U,.~. w .IE .%'
m i n i m u m fluidization veloci ty ( m / s )
excess gas veloci ty ( m / s ) s ieve s ize ( m m ) number of sets o f measured va lues
number of measured values in each ~ t
A c k n o w l e d g e m e n t s
The authors grateful ly acknowledge the Universi ty of
Dar-Es-Salaam and the Norwegian Agency for International
Deve lopment ( N O R A D ) for part ial ly support ing this work,
R e f e r e n c e s
I I I D. Reay and C.G.J. Baker. in J.F, David.~m. R, Cliff and D. Harri.~a ( nds. ). Ruidiza6on. Academic Pr¢~,,, London, 2nd edn., 1985, p. 529.
121 K. Muroyama and L.S. Fan. AIChEJ.. 31 (1985) I. 13 ] S. Agrdwal and E.N. Zicglcr, Chem. Eng. Sci., 24 ( 1969 ) 1235. 141 P.G. Smilh and A.W. Nicnow, Chem. Eng. Sci., 38 (1983) 12~3. 151 P.G. Smith and A.W. Nicno~a'. Chem, Eng. Sci., 37 (1982) 950. 161 P. Wnukowski. On Ihe coating of parlicles in fluid bed granulalor, Ph.D.
Thesis, Ro','al Instiluzc of T,..'chm~l~.z,y, Stockholm. Sv,'eden. 1989. [ 7 ] T. Schacl~:r and O. Worls, Arch. -Phann. Chem. Sci. Ed.. 6 (1978) I. 181 W.L Davies and W.To Gksw. Jr,, J. Pha~. Sci,, 60 ( 1971 ) 1869. 191 E. Hovdrlh and Z. Orm6s, Acla Phann. T~'chnol., 35 (1989) 90.