esrd network 2017 annual report report_network_14 tc... · in-center hemodialysis consumer...
TRANSCRIPT
ESRD NETWORK 2017 ANNUAL REPORT
Description of the patient and facility population in the ESRD (End Stage
Renal Disease) Network program and the outcomes of the quality
improvement activities performed by this Network compared to the
Network program performance.
ESRD Network 14

1
Table of Contents ESRD Demographic Data .................................................................................................................... 2
ESRD Network Grievance and Access to Care Data .............................................................................. 6
Grievance Quality Improvement Activities ............................................................................................... 8
ESRD Network Quality Improvement Activity Data ........................................................................... 10
In-Center Hemodialysis Consumer Assessment of Healthcare Providers and Systems Quality
Improvement Activity ............................................................................................................................. 11
Long Term Catheter Quality Improvement Activity ................................................................................ 13
Blood-Stream Infection Quality Improvement Activity .......................................................................... 15
Hepatitis B and Pneumococcal Pneumonia Vaccination Quality Improvement Activity ........................ 17
Population Health Focused Pilot Projects Quality Improvement Activity .............................................. 19
Quality Incentive Program Quality Improvement Activity ...................................................................... 21
National Healthcare Safety Network Data Quality Improvement Activity ............................................. 23
Emergency Preparedness Response.. ................................................................................................ 24
Facilities that Consistently Failed to Cooperate with Network Goals .................................................. 25
Recommendations to CMS for Additional Facilities .......................................................................... 26

2
ESRD DEMOGRAPHIC
DATA
3
Source of data: CROWNWeb
Source of data: CROWNWeb
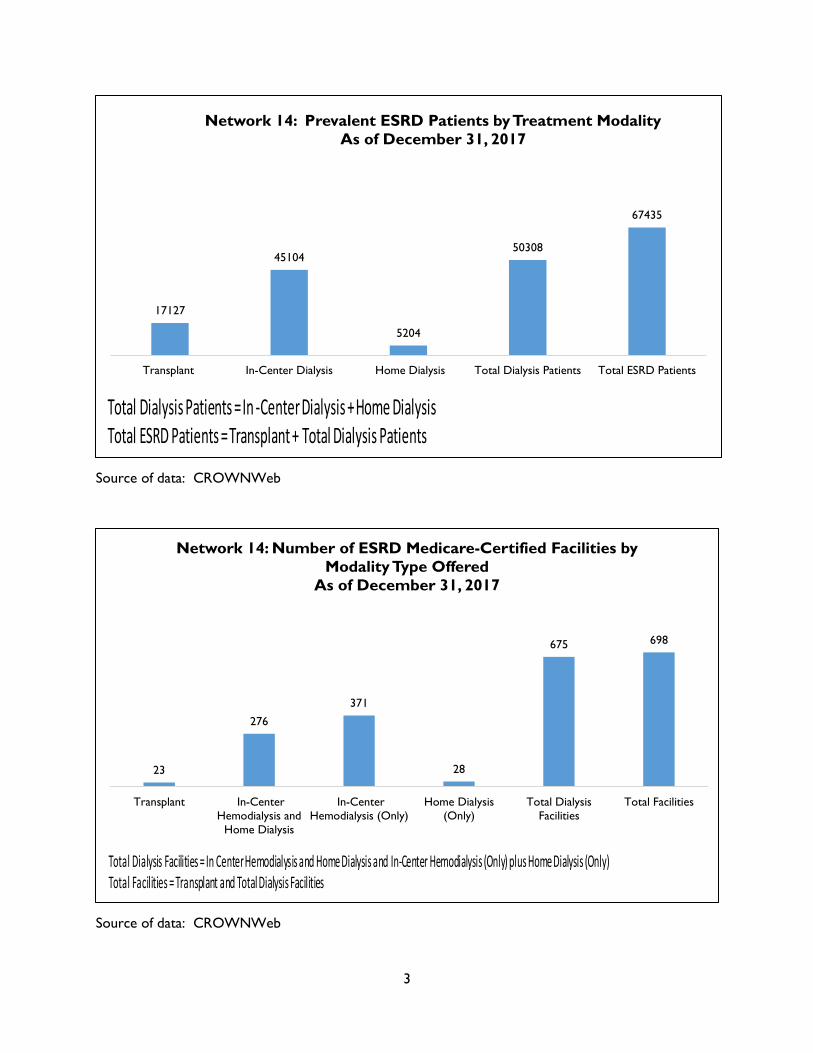
17127
45104
5204
50308
67435
Transplant In-Center Dialysis Home Dialysis Total Dialysis Patients Total ESRD Patients
Network 14: Prevalent ESRD Patients by Treatment Modality
As of December 31, 2017
Total Dialysis Patients = In -Center Dialysis + Home Dialysis Total ESRD Patients = Transplant + Total Dialysis Patients
23
276
371
28
675 698
Transplant In-Center
Hemodialysis and
Home Dialysis
In-Center
Hemodialysis (Only)
Home Dialysis
(Only)
Total Dialysis
Facilities
Total Facilities
Network 14: Number of ESRD Medicare-Certified Facilities by
Modality Type Offered
As of December 31, 2017
Total Dialysis Facilities = In Center Hemodialysis and Home Dialysis and In-Center Hemodialysis (Only) plus Home Dialysis (Only) Total Facilities = Transplant and Total Dialysis Facilities

4
Source of data: CROWNWeb
Source of data: CROWNWeb
Source of data: CROWNWeb
14669 (3%)
29851 (6%)
19818 (4%)
20389
(4%)
27356 (5%)
49148 (10%)
31311 (6%)
28237 (6%)
33556 (7%)
20502 (4%)
28149 (6%)
16654 (3%)
20006 (4%)
50308 (10%)
24946 (5%)
14914 (3%)
28497 (6%)
46765 (9%)
NW 1 NW 2 NW 3 NW 4 NW 5 NW 6 NW 7 NW 8 NW 9 NW 10 NW 11 NW 12 NW 13 NW 14 NW 15 NW 16 NW 17 NW 18
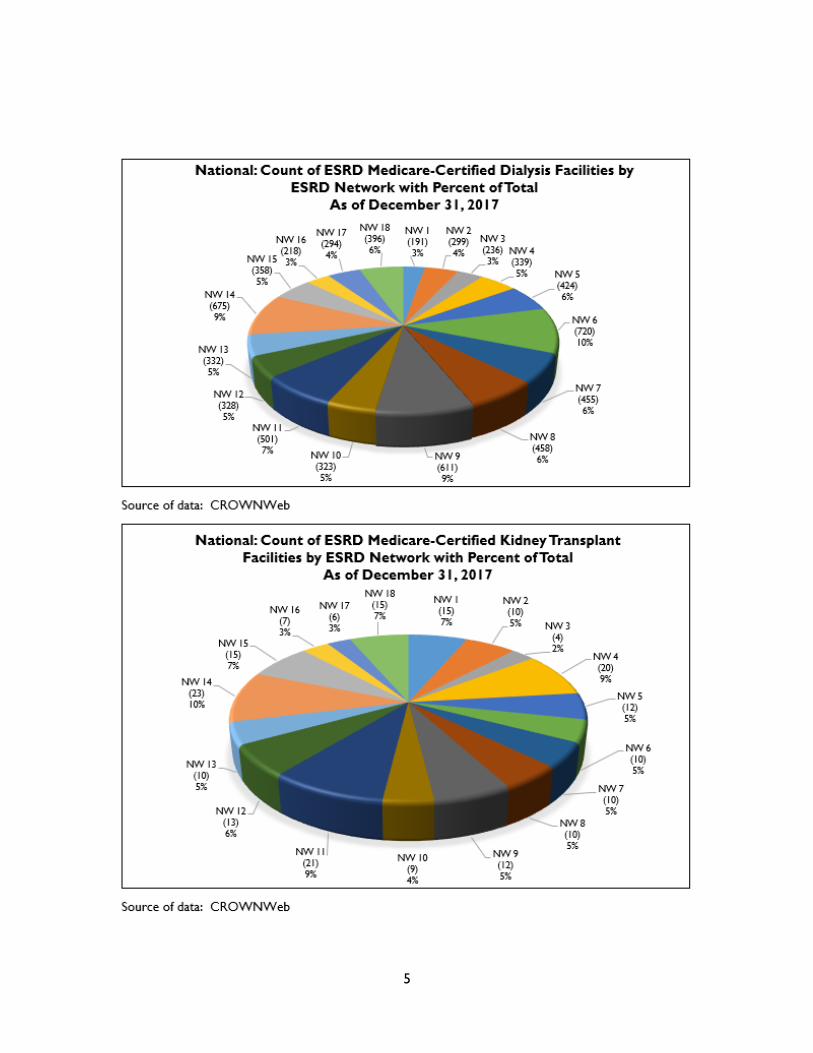
National: Count of Prevalent Dialysis Patients (Home and In-
Center) by ESRD Network with Percent of Total
As of December 31, 2017
10993 (5%)
14559 (7%)
5736 (3%)
12359 (6%)
13555 (6%)
14728 (7%) 11890
(5%) 9379 (4%)
14637 (7%)
8996 (4%)
21039 (9%)
10444 (5%)
6477 (3%)
17127 (8%) 13595
(6%)
7702 (3%)
13004 (6%)
17174 (8%)
NW 1 NW 2 NW 3 NW 4 NW 5 NW 6 NW 7 NW 8 NW 9 NW 10 NW 11 NW 12 NW 13 NW 14 NW 15 NW 16 NW 17 NW 18
National: Count of Transplant Patients by ESRD Network with
Percent of Total
As of December 31, 2017
1655
(3%)
1986
(3%) 1431
(2%)
2275
(4%)
3284
(5%)
6220
(10%)
3742
(6%) 3666
(6%)
4275
(7%) 3376
(6%) 3335
(6%) 2664
(4%) 2593
(4%)
5204
(9%)
3095
(5%) 2358
(4%)
3738
(6%)
5535
(9%)
NW 1 NW 2 NW 3 NW 4 NW 5 NW 6 NW 7 NW 8 NW 9 NW 10 NW 11 NW 12 NW 13 NW 14 NW 15 NW 16 NW 17 NW 18
National: Count of Prevalent Home Hemodialysis and Peritoneal
Dialysis Patients by Network with Percent of Total
As of December 31, 2017
5
ESRD NETWORK
GRIEVANCE AND ACCESS
TO CARE DATA
6
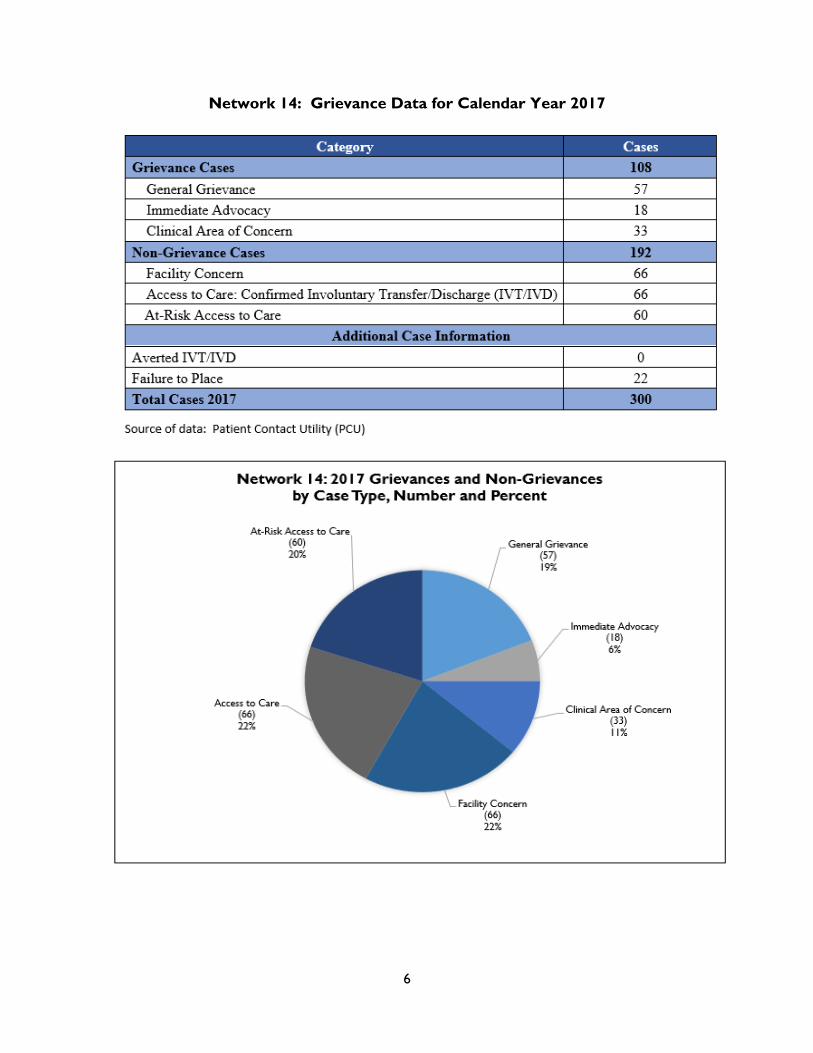
Network 14: Grievance Data for Calendar Year 2017

7
Source of data: Patient Contact Utility (PCU)
Source of data: October 2017 ESRD Network Dashboard
Source of data: October 2017 ESRD Network Dashboard
100.0% 100.0% 100.0% 100.0% 100.0% 100.0% 100.0% 100.0% 100.0%
99.8% 99.8%
January February March April May June July August September
Network 14: Grievance Timeliness by Case Type with National
Comparison January - September 2017
General Grievance (GG) and Quality of Care (QoC) Timliness Immediate Advocacy (IA)Timliness All Networks - IA All Networks - GG and QoC
The Network goal was to maintain a rate of at least 80% of all Immediate Advocacy cases completed within 7 business days, and a rate of at least 90% of all grievance cases completed within 60 calendar days for all cases received by the Network.
7.700
5.400
9.900 9.900
4.700
3.800
4.900 6.160
10.158
6.188 6.892
6.299
4.791 4.246
3.538
Baseline April May June July August September
Network 14: Average Grievance Scores for Grievance Quality
Improvement Activity (QIA) with National QIA Rate
Comparison
March 2016-August 2017
Network 14 QIA Network 14 Goal National QIA

8
Grievance Quality Improvement Activities
The aim of the Grievance QIA was to promote and improve the utilization of the grievance
process at the facility level and improve communication among patients, facility staff, and
Network 14. Facility participation was based on a focused audit of Patient Contact Utility (PCU)
data for 2016: the Grievance QIA worked to improve internal grievance processes in twelve
dialysis facilities with the highest number of grievances and access to care issues recorded in
the CMS Patient Contact Utility (PCU) in 2016. The purpose of the QIA was to:
Increase use of and functionality of the internal facility grievance process
Improve communication between patients and facility staff
Decrease operational and environmental grievances (as defined by CMS) by 20% from a
mean grievance score of 7.70 for the ten facilities to 6.16
The Network identified ten target facilities and over sampled by two for a total of twelve
facilities. Facilities submitted a monthly list of patient grievances using the CMS template log
provided by the ESRD Network. ESRD Network 14 implemented the CMS grievance log and
scored the facility’s grievances on a five-point severity scale as established by CMS. The QIA
baseline was established by dividing the combined grievance score by the total number of
facilities in the project. A two-month pilot period (January and February) established the (7.70)
baseline score.
A Root Cause Analysis (RCA) survey was used to determine interventions. Patient Advisory
Committee (PAC) members were solicited for involvement and provided input into the
development of the QIA and the RCA. The RCA was completed, via survey, by the focus
facilities, which allowed for identification of common root causes.
Barrier categories identified on the RCA included the following: • Staffing • Facility • Patient and Family • Operational • Methods and Processes Data from the RCA survey was used to determine interventions. To foster buy-in and
engagement, facilities were given the liberty to select interventions that targeted their root
causes. Facilities were provided with sample interventions that were then implemented in
three phases. Focus facilities were monitored monthly via grievance logs. Facilities were made
aware of their progress through monthly progress reports. The Network exceeded the goal of
6.16 with a mean score of 4.90 based on September grievances.
The practice of allowing facilities to select interventions proved to be very helpful as facilities
were more engaged in what they selected and created. The practice of having "how to" or
procedural answers to frequently asked questions on the Network 14 website was also helpful.

9
ESRD NETWORK QUALITY
IMPROVEMENT ACTIVITY
DATA
10
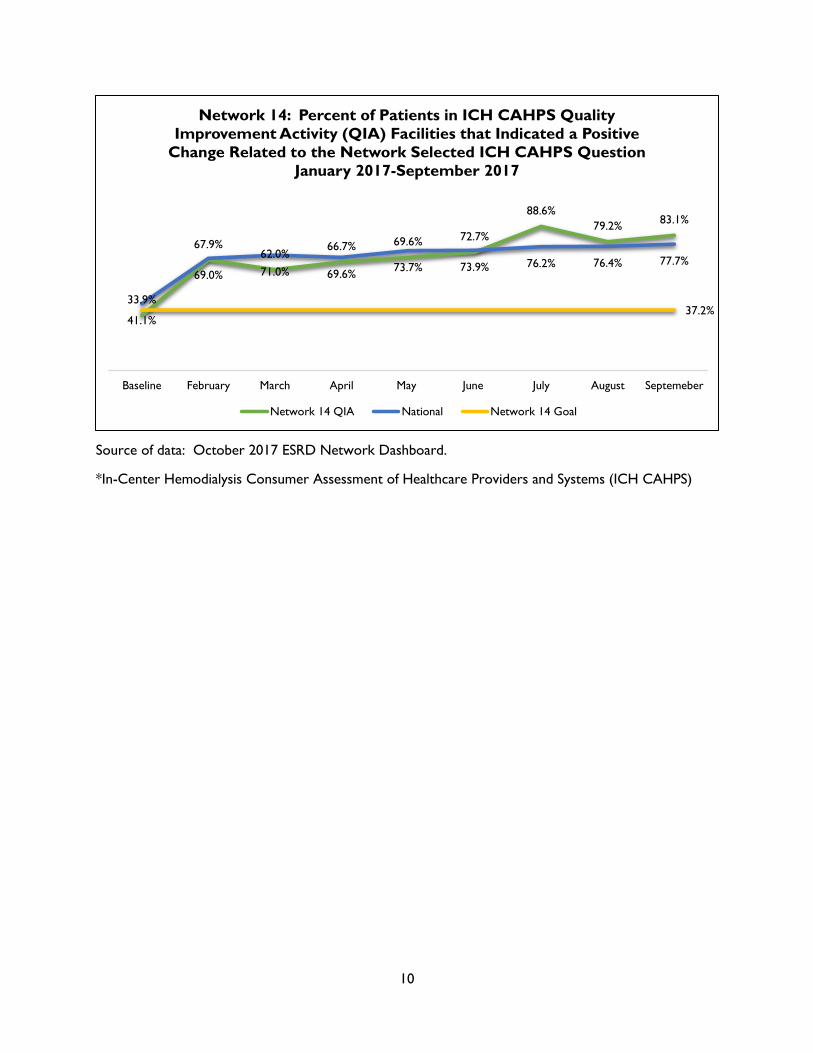
Source of data: October 2017 ESRD Network Dashboard.
*In-Center Hemodialysis Consumer Assessment of Healthcare Providers and Systems (ICH CAHPS)
33.9%
67.9% 62.0%
66.7% 69.6% 72.7%
88.6%
79.2% 83.1%
41.1%
69.0% 71.0% 69.6% 73.7% 73.9% 76.2% 76.4% 77.7%
37.2%
Baseline February March April May June July August Septemeber
Network 14: Percent of Patients in ICH CAHPS Quality
Improvement Activity (QIA) Facilities that Indicated a Positive
Change Related to the Network Selected ICH CAHPS Question
January 2017-September 2017
Network 14 QIA National Network 14 Goal

11
In-Center Hemodialysis Consumer Assessment of Healthcare Providers and Systems Quality
Improvement Activity
In 2017, Network 14 continued to collaborate with in-center hemodialysis facilities to promote
the In-Center Hemodialysis Consumer Assessment of Healthcare Providers and Systems (ICH
CAHPS) survey. ICH CAHPS is part of the ESRD Quality Incentive Program (QIP) and how patients
score their experience of care with a given in-center hemodialysis facility can be found in the
Dialysis Facility Compare section on the www.medicare.gov website. Specifically, the Network
enrolled 26 dialysis facilities across the state that belonged to different dialysis affiliations in
the Be the Voice, Be the Change QI project in February for the purpose of improving patient
engagement and patient scores on an ICH CAHPS question related to providing information to
patients. The ICH CAHPS question #39 (Q#39) that the facilities focused on improving the
positive responses states: “Peritoneal dialysis is dialysis given through the belly and is usually
done at home. In the last 12 months, did either your kidney doctors or dialysis center staff talk
to you about peritoneal dialysis?” The question was chosen because it had the highest number
of negative patient scores in the state and the facilities were chosen because they had the
worst scores compared to Texas peer facilities.
Network 14 utilized a set of interventions that included a project notification letter explaining
the purpose of the project and why the facilities were chosen to be in the project. Facilities
were given a schedule of project activities, which included a required introductory webinar that
covered patient engagement strategies and patient and family centered care resources. A
patient survey toolkit was distributed and contained a survey card containing Q#39. From
February 2017 through September 2017, the survey card was to be given to one-eighth of their
patient population monthly. Patient involvement in the project at the facility level included
small patient group discussions, facility-designed interventions, facility progress reports, and a
sustainability plan.
The project facilities collectively had a baseline score of 33.9% of patient respondents who
answered positively to Q#39 as compared to a Texas average of 56.6%. By September 2017,
project facilities had made a 49.2 percentage point improvement from baseline, far exceeding
the five percent relative improvement goal set by CMS and the Network. At the conclusion of
the QIA, Network 14 exceeded the goal with a rate of 83.1% of patients responding positively to
the question.
12
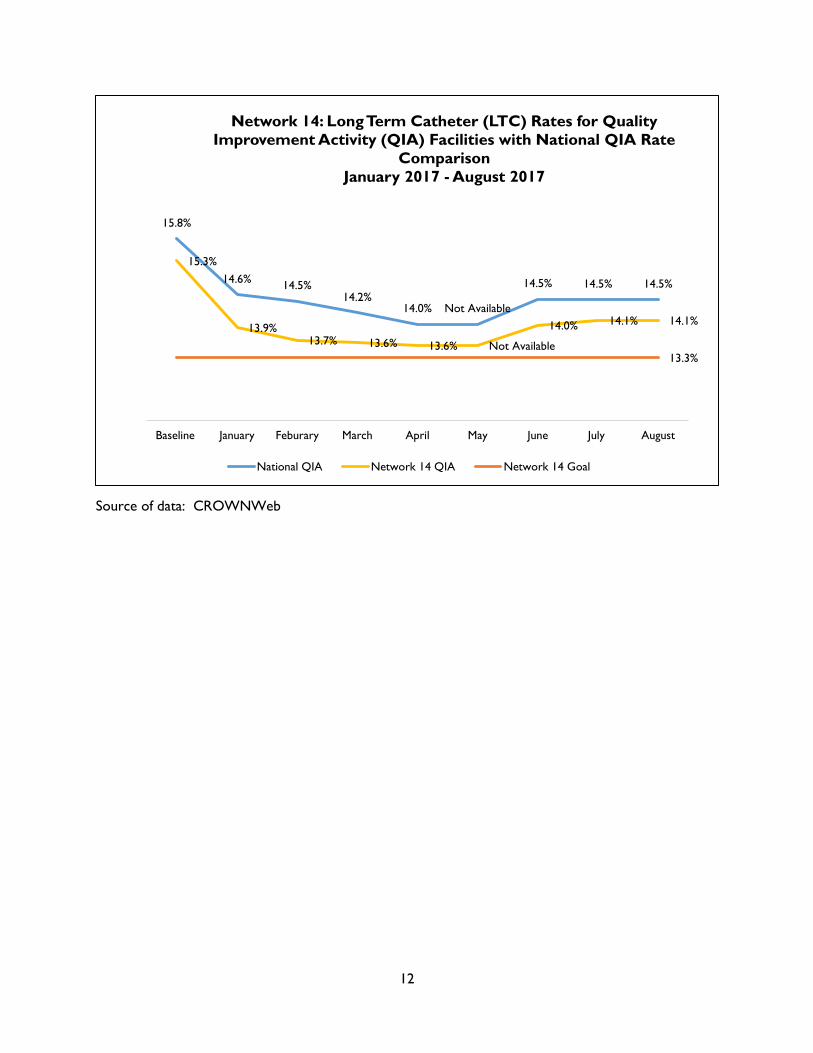
Source of data: CROWNWeb
15.8%
14.6% 14.5%
14.2% 14.0% Not Available
14.5% 14.5% 14.5%
15.3%
13.9% 13.7% 13.6% 13.6% Not Available
14.0% 14.1% 14.1%
13.3%
Baseline January Feburary March April May June July August
Network 14: Long Term Catheter (LTC) Rates for Quality
Improvement Activity (QIA) Facilities with National QIA Rate
Comparison
January 2017 - August 2017
National QIA Network 14 QIA Network 14 Goal
13
Long Term Catheter Quality Improvement Activity
In preparation for the 2017 QIA, Network 14 completed a gap analysis with other Networks in
December 2016 and focused on successful approaches and commonalities that contributed to
the other Networks success. The findings were reviewed by Network staff and Subject Matter
Experts (SMEs) such as the Medical Review Board (MRB) and the Patient Advisory Committee
(PAC), and considered for choosing focus facilities and developing interventions. The Network’s
Long-term Catheter QIA enrolled 240 facilities with an LTC rate > 10% at baseline according to
CROWNWeb data from September 2016. Facilities were divided into two intervention
groupings depending on their current LTC rate and participation in other Network QIAs. The
aggregate baseline LTC rate for the 240 facilities was 15.26% with a goal of achieving at least a
2% reduction by September 2017. Facility interventions were developed with guidance and
input from the MRB and patient subject matter experts such as the PAC. Focus facilities were
notified of project selection via a standardized project notification letter. Project kick-off
occurred with an introductory webinar on January 31, 2017, and provided an introduction to
the project goals, interventions, tools, resources and requirements. Network staff provided a
range of assistance and support to these facilities including monthly one-on-one coaching calls,
data review through the LTC monthly reports, collaboration with large dialysis organizations
(LDOs) regional vascular access coordinators, rapid cycle improvement (RCI) and action plans,
site visits to selected facilities, encouraging utilization of the Medical Advisory Council (MAC)
Catheter Reduction Toolkit from the FORUM of ESRD Networks, using Facility Patient
Representatives (FPRs) as liaisons, and the provision of educational materials.
A total of 469 monthly one-on-one coaching calls with the focus facilities were completed from
February 26, 2017, to September 30, 2017. The Network achieved a 1.2 percentage point
reduction in the LTC rate from baseline (15.3%) to the last set of data released in September
2017, which represented July 2017 at 14.1%. Overall, facilities achieved a total decrease of 191
long-term catheters from baseline, thus reducing the risk of infections for their patients.
Best practices were identified during the project including: the appointment and sustainment of
vascular access coordinators/managers at the facility, regional and/or weekly/regular meetings
between the interdisciplinary team and the vascular access coordinator. Outcomes were
reviewed during Quality Assessment and Performance Improvement (QAPI) meetings.
Utilization of Network-recommended tools such as the LTC monthly report and the MAC
Catheter Reduction Toolkit, engagement of FPRs as liaisons between the patients and the
vascular access process, and standardization of a sustainability plan were to be used with
outgoing and incoming focus facilities.
Barriers encountered during this project included notable staff turnover and data discrepancies
such as missing data for May 2017 and a significant increase in LTC rates for June and July,
which represented an unusual data anomaly as compared to facilities self-reported data.

14
Source of data: June 2017 National Healthcare Safety Network (NHSN) data
28
287
Network 14: Bloodstream Infections (BSIs) and Quality
Improvement Activity (QIA) by ESRD Network
BSI Required for Reduction to meet Goal Actual BSI Prevented
The Network goal was to decrease the rate of blood-stream infections (BSI) by a 5% or greater relative reduction in the pooled semi-annual mean in facilities participating in the quality improvement activity.
15
Bloodstream Infection Quality Improvement Activity
The Bloodstream Infection (BSI) Quality Improvement Activity (QIA) included 20% of Network
14’s facilities with the highest bloodstream infection (BSI) rates, a total of 114 facilities
impacting a population of over 9,000 patients. Focus facility selection began with an analysis of
BSI data from the National Healthcare Safety Network (NHSN) database for the first and second
quarters of 2016. Facilities were ranked by BSI rate, from highest to lowest with 114 facilities
with the worst (highest) BSI rates selected. The goal of each facility was to achieve a 5% or
greater reduction in its semi-annual pooled mean rate at re-measurement compared to their
2016 BSI rates.
Facilities participated in three monthly patient engagement activities with their patients
covering specific infection topics. The first one was held in March during Patient Safety
Awareness Week. The facility’s BSI and Dialysis Event rates as reported into the National
Healthcare Safety Network (NHSN) were to be shared with patients using the CDC’s
Conversation Starter to Prevent Infections in Dialysis Patients. In April, during Patient
Experience Week, staff discussed their facility’s policy regarding chlorhexidine or any other
alternative disinfectant used for infection prevention. Finally in May, during World Hand
Hygiene Day, the Conversation Starter tool was used again to share important hand hygiene
practices with patients and connect them with the Clean Hands Count campaign resources. As a
result of facility reported feedback, patients were more likely to be engaged in their care,
discuss any concerns and clarify their role in infection safety. Staff themselves found the
activities to be very useful in guiding them through their education efforts.
Facility staff also had to ensure that the CDC’s nine best practices (the CDC Core Interventions
for Dialysis Bloodstream Infection [BSI] Prevention) were in active use. Focus facilities were
requested to identify their current level of use and implementation of each of the nine CDC
Core Interventions for Dialysis Bloodstream Infection (BSI) Prevention at the start of the
project, mid-project and post-project (January, May, and September respectively). The results
showed an increase in facility implementation of the CDC’s Core Interventions from 83% pre-
project, to 90% at mid-project and finally 93% post-project. The ten percentage point increase
from pre to post results may be attributed to a detailed focus on each core intervention each
month and providing specific education around each topic for staff and patients.
Due to substantial staff turnover in the short nine months of the project, the Network
continues to recommend that all focus facilities have two NHSN-trained associates who are able
to access and submit dialysis events (DEs) and prevention process measures (PPMs) data into
NHSN. Results: Out of the 114 facilities in the project, 98 facilities (86%) surpassed the project
goal of a 5% or greater reduction in their pooled mean BSI rate at re-measurement. Further
analysis showed a statistically significant difference between the focus and non-focus facilities’
(not in the QIA) BSI rates. The focus facilities’ BSI rates decreased on average by 0.76
percentage point , while the non-focus facilities increased on average by 0.03 percentage point
from baseline to re-measure (p<.0001).
16
Source of data: CROWNWeb
Source of data: CROWNWeb
49.7%
57.2%
60.4% 61.9%
63.7% 64.9% 65.6% 66.6%
40.7% 37.7%
58.6% 61.1%
63.3% 63.4% 63.2%
65.8% 67.4%
Baseline January February March April May June July
Network 14: Hepatitis B Vaccination (HBV) Rates for Quality
Improvement Activity (QIA) Facilities with
National QIA Rate Comparison
January 2017 - July 2017
National QIA Network 14 QIA Goal Network 14 QIA
39.8%
52.2%
56.4% 59.8%
61.8% 62.7% 64.3% 65.1%
31.8% 28.8%
60.3% 63.2%
65.1% 67.3% 67.1% 68.5%
70.8%
Baseline January February March April May June July
Network 14: Pneumococcal Pneumonia Vaccination (PPV)
Rates for Quality Improvement Activity (QIA) Facilities with
National QIA Rate Comparison
January 2017 - July 2017
National QIA Network 14 QIA Goal Network 14 QIA

17
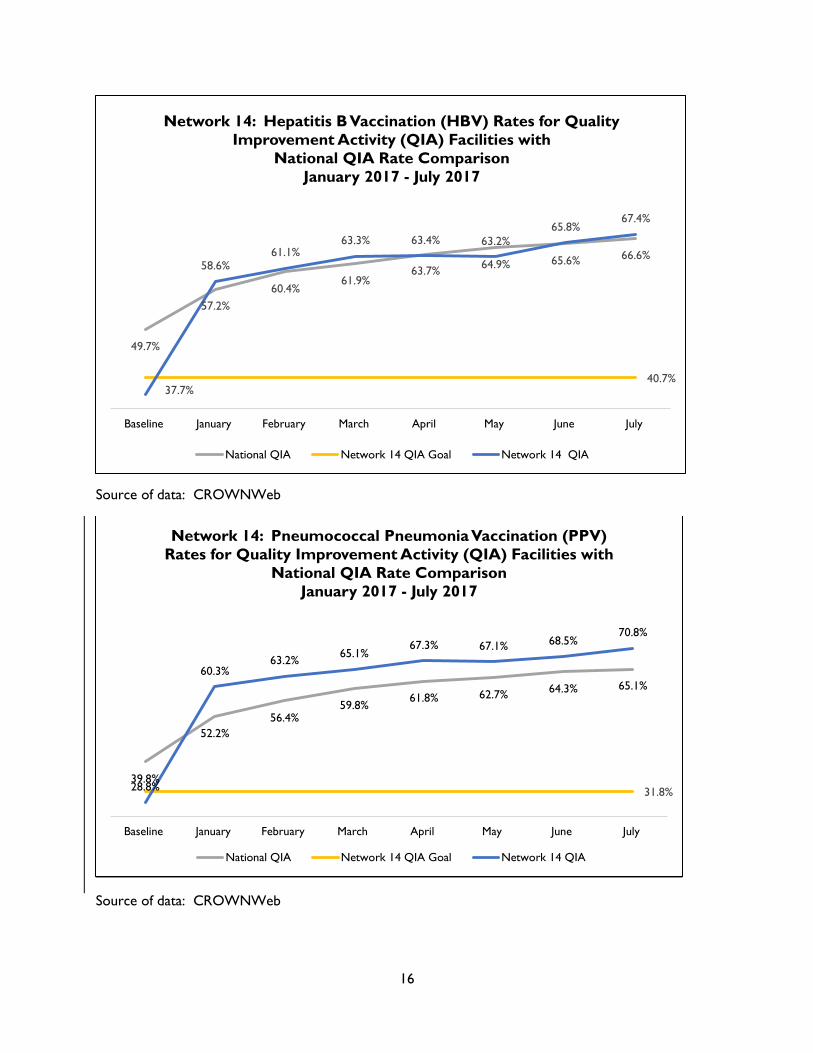
Hepatitis B and Pneumococcal Pneumonia Vaccination
Quality Improvement Activity
For 2017, ESRD Network 14 chose to continue with the Vaccinations QIA to increase dialysis patient
hepatitis B (HBV) and pneumococcal pneumonia (PPV) vaccination rates within the focus facilities by at
least 3 percentage points. This selection was made by the Network Medical Review Board (MRB) based
on previous success and indications that this project would have the highest probability of success.
Examples of these indications include previous favorable results and current low vaccination rates. The
Network developed a selection process and identified 22 final focus facilities serving 1,579 eligible
patients. These facilities met the main criteria of low performing vaccination rates below 25% of eligible
patients. Other criteria included a census of >10 patients and exclusion of providers that were acute
hospital-based units, prisons, and pediatric units. A cross-functional team, which included Network staff,
MRB members, and dialysis facility and patient subject matter experts such as members of the PAC
designed interventions including manual data validation and correction, root cause analysis (RCA),
Vaccination Discussion Groups with FPRs to validate the patient factors on the facility-specific RCAs,
facility-specific vaccination awareness and educational campaigns, and sustainability plans. Focus
facilities were contacted and notified of project selection via a standardized project notification letter
developed by the Network. Project kick-off occurred with an introductory webinar on January 26, 2017,
and provided an introduction to the project goals, interventions, tools, resources and requirements.
The Network collaborated with the 22 focus facilities and provided interventions that resulted in a 29.7
percentage point increase in the mean HBV rate and a 42 percentage point increase in the mean PPV
rate. From baseline to project completion (based on data from July 2017), the HBV rate increased from
37.7% to 67.4%, and the PPV rate increased from 28.8% to 70.8% which represents a significant
improvement based on statistical analysis for both vaccines. A total of 493 patients were vaccinated
against hepatitis B and 772 patients were vaccinated against pneumococcal disease during the project
period.
In 2017, several facilities agreed that this project promoted good communication between staff,
patients, and their families. Project goals were discussed and addressed during QAPI meetings as a
sustainability initiative. Misconceptions were clarified during patient discussion groups and some
patients ended up receiving vaccination(s). Facilities reported a lack of knowledge among patients and
family members. As a result of facility participation in this QIA, patients have been educated on
vaccination(s) upon admission or within the first week of dialysis. Patient discussion groups were more
successful at addressing general misconceptions and brought a more educated consensus among
patients. Effective tracking tools developed by the Network allowed charge nurses to maintain up-to-
date patient vaccination records. In addition, the Network implemented a standardized QIA
Sustainability Plan via SurveyMonkey that will continue to be utilized as best practice in future projects.
Barriers encountered during this project included significant staff turnover and a lack of communication
on QIA requirements to incoming staff. These events negatively impacted timely completion of project
requirements and continuity of interventions.
18
Source of data: October 2017 ESRD Network Dashboard
Source of data: October 2017 ESRD Network Dashboard
*Disparate population is Hispanic or Latino and non-disparate population is Not Hispanic or Latino
13.9%
22.9% 25.1%
30.6%
35.4% 38.5%
44.5% 47.1%
49.5%
8.1% 12.4%
15.2% 18.6%
24.3% 27.0%
30.7% 33.3%
36.2%
18.9%
Baseline % February March April May June July August September
Network 14: Home Therapy Rates for Quality Improvement
Activity (QIA) Facilities with Pilot Project Comparison Rate
January 2017- September 2017 .
Network 14 QIA National Home Therapy QIA Network 14 Goal
7.9%
15.6% 17.0%
25.3%
32.3%
38.0%
45.9%
51.9%
56.3%
15.4%
24.8% 27.3%
32.0%
36.3% 38.6%
44.1% 45.8%
47.6%
Baseline February March April May June July August September
Network 14: Disparate and Non-Disparate Quality Improvement
Activity (QIA)
by ESRD Network
January 2017 - September 2017
Network 14: Disparate Network 14: Non-Disparate
19
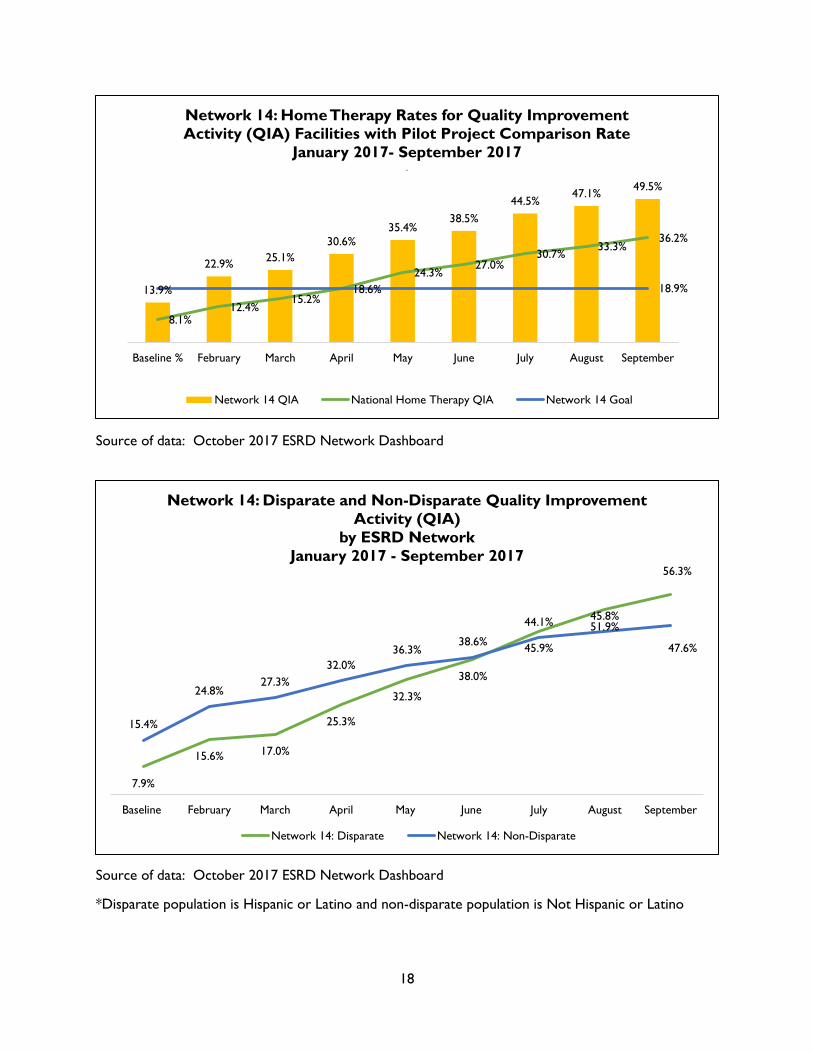
Population Health Focused Pilot Projects Quality Improvement Activity
In 2017, Network 14 continued to collaborate with in-center hemodialysis facilities to promote
home modality education and referrals. The Network worked with 24 focus facilities in Texas
selected with referral rates equal to or less than 75%. The project baseline was 13.9%; there
was also a gap between Hispanic and non-Hispanic patients of 7.5 percentage points. The goals
outlined in the statement of work were to increase referrals 5 percentage points (from 13.9%
to 18.9%) and decrease the disparity by 1 percentage point (from 7.9 percentage points to 6.9
percentage points).
The project ran from February 2017 through September 2017 and included the implementation
of the six CMS attributes: Boundarilessness, Customer Focus, Unconditional Teamwork, Rapid
Cycle Improvement, Sustainability, and Innovation. The Home Referrals QIA incorporated all six
attributes throughout the contract year via six phases of interventions and two separate project
tracks. The facilities were separated into two separate tracks determined by their performance
during the base year. Group A consisted of facilities that were below the average focus facility
home referral rate of 13.9% identified in Q2 and Q3 of 2016. Group B included facilities with
referral rates above the focus facility average achieved at the end of the baseline year. The
facilities in Group A were required to complete all six phases of the project. The phases
included: Project Introduction, Facility Patient Representative (FRP) Recruitment, Root Cause
Analysis (RCA), Discussion Groups (DGs), Educational Campaigns, and Sustainability. Group B
was required to complete three to four of the six phases by excluding the FPR Recruitment,
RCA, and DGs. The facilities were also required to attend three Advance Renal Education
Program (AREP) webinars on home therapies.
The project facilities had a mean baseline referral rate of 13.9%. By September 2017, project
facilities referred 49.5% of their patients for a home modality, far exceeding the five percentage
point project improvement goal set by CMS and the Network, which was greater than or equal
to 18.9%. The disparity gap was 7.5 percentage points at baseline, and by September 2017 was
at -8.7 percentage points.
Promoting teamwork among staff and patients and one-on-one calls with Network staff helped
facilities identify and address barriers they hadn’t considered. Project goals were added to QAPI
meetings by targeting pre-dialysis patients for home modalities and sharing success stories.
Patients who had been interested in home modalities, but could not gain family support,
invited their family to lobby days on home modalities and are now exploring PD as an option.
Including PD nurses in monthly facility team meetings, to discuss patient referrals, led to four
facilities recruiting a new FPR. In addition to these examples, the following best practices were
implemented as a result of this project: Network standardized quarterly contact forms and
building in sustainability throughout the QIA that resulted in a measurable increase of
sustainable practices.

20
Source of data: October 2017 ESRD Network Dashboard
10 10 10 10 10 10 10 10 17
8
January February March April May June July August September
Network 14: Count of Quality Incentive Program (QIP)
Quality Improvement Activity (QIA) Facilities that Successfully
Completed Plan-Do-Study-Act (PDSA) Cycles and Met the
Improvement Target for Three Consecutive Months
April 2016 - September 2017
Network 14 QIA Network 14 Goal
21
Quality Incentive Program Quality Improvement Activity
The Hypercalcemia Quality Improvement Activity (QIA), Taking Care, focused on ten facilities
with the lowest Quality Incentive Program QIP scores on the Hypercalcemia measure within the
Network’s service area. The goal of each facility was to achieve a 25% improvement from their
baseline, amongst patient suffering with hypercalcemia. Hypercalcemia is defined by CMS as an
uncorrected serum calcium > 10.2 mg/dL.
During this project, the ten facilities completed a patient engagement activity in April during
Patient Experience Week (04/24/2017-04/28/2017). The staff reviewed fourteen Motivational
Interviewing Strategies and Techniques: Rationales and Examples with their Facility Patient
Representative (FPR) or another engaged patient. Together they determined the best methods
to communicate hypercalcemia education with other patients in the clinic. Afterwards, the staff
member implemented the selected strategy with another patient in the facility with
hypercalcemia. Once this was completed, facilities reported back to the Network the results of
their efforts. The Top 3 Motivational Interviewing Methods used and recommended by staff
and patients in the QIP QIA were: Open-Ended Questions, Reflective Listening, and Exploring
Importance and Confidence.
Initial root cause analysis was conducted one on one with each facility by reviewing their
patient population in 2016. Plan, Do, Study, Act plans were then implemented that were
tailored around their identified barriers. Monthly review of the facility’s hypercalcemia rates
from Arbor Research was compared to self-reported data by the facility for a more accurate
view of the patients for directed interventions. An effective combination of educational
webinars, a focus on individual successes and working through identified barriers and
challenges allowed facilities to reduce their hypercalcemia rates by the end of the project.
At the beginning of the QIA, all ten facilities had Hypercalcemia rates greater than the CMS
ESRD QIP PY2019 achievement threshold of 4.24% of patients. By the end of the QIA, nine out
of the ten facilities had Hypercalcemia rates less than the QIP PY2019 threshold of 4.24% and
overall as a group reduced their rates by a mean of 4.77 percentage points with three facilities
achieving a 0% Hypercalcemia rate.
22
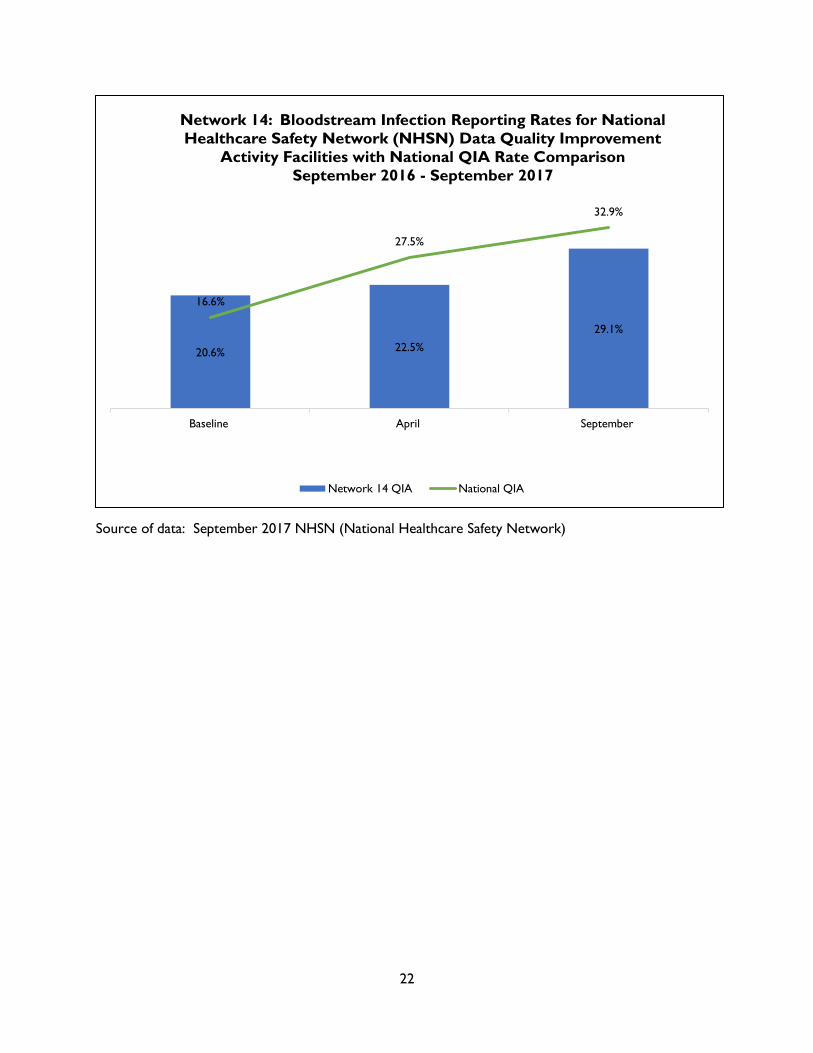
Source of data: September 2017 NHSN (National Healthcare Safety Network)
20.6% 22.5%
29.1%
16.6%
27.5%
32.9%
Baseline April September
Network 14: Bloodstream Infection Reporting Rates for National
Healthcare Safety Network (NHSN) Data Quality Improvement
Activity Facilities with National QIA Rate Comparison
September 2016 - September 2017
Network 14 QIA National QIA

23
National Healthcare Safety Network Data Quality Improvement Activity
The goal of the NHSN Data Quality QIA (Culture Exchange) was to increase facility reporting of
BSIs among dialysis patients that are identified within one calendar day following a hospital
admission. The Network selected 22 dialysis facilities to improve communication and ensure
appropriate, sufficient and timely information exchange between the hospitals and dialysis
facilities. The Network also identified five hospitals that receive patients from these 22 QIA
facilities.
The 22 target facilities possessed a 20.6% baseline rate of positive blood cultures collected in
hospitals and/or Emergency Departments. The project goal was to demonstrate a 1 percentage
point increase over baseline in the percentage of BSIs reported in NHSN that were identified
within one calendar day following a hospital admission. Target facilities exceeded the goal with
a rate of 29.1% by the end of project year 2017.
During the project the Network partnered with Texas Medical Foundation’s Care Coordination
Community Coalition which hosted meetings for care providers about transition of care issues.
All 22 project facilities were invited to attend to network and voice their concerns about
obtaining information from hospitals during transitions of care. Based on discussions at the
meeting, providers felt there was a breakdown in communication. There was also discussion
regarding common barriers and nephrologists’ expectations as to how the care coordination
community coalition stakeholders could better understand the challenges of dialysis, and renal
disease patients.
Plan Do Study Act (PDSA) reports showed that the majority of facilities implemented hospital
communication policies, procedures, and/or processes that were already in place but were not
being followed or not understood by staff.
6 facilities initiated a new process for retrieving positive blood cultures from hospitals
and reporting results in NHSN.
18 facilities revised and/or enforced an already existing process to retrieve positive
blood culture information from hospitals and report results in NHSN.
After a thorough review of the NHSN data facilities submitted each month, we determined that
a more rigorous monitoring system from the Network was necessary to ensure facilities
complied with QIA project requirements. The QIA plan maintained the 2016 recommendation
that facilities have two staff members NHSN trained and maintain active access. By the
conclusion of the QIA, the Network increased NHSN user participation among the facilities, with
19 facilities reporting having a second staff member trained and with NHSN access.

24
Emergency Preparedness Response
On August 26, 2017, the Texas Gulf coast was hit by the most powerful hurricane in over 12
years. Hurricane Harvey made landfall on the Texas coast not only once, but twice. The
Network began alerting coastal facilities of the approaching storm 120 hours prior to landfall.
The Network activated the Texas ESRD Emergency Coalition (TEEC) steering committee on
August 24, 2017, and activated the emergency command center on August 26, 2017. The
command center was staffed by Network 14 staff and over 80 provider volunteers until
September 2, 2017. More than 260 dialysis centers and 18,000 dialysis patients in the coastal
cities of Texas were directly impacted by Hurricane Harvey. Facilities outside of the direct
impact zone experienced medical surges, with some facilities dialyzing more than 100 transient
and evacuee patients. During the peak storm times we experienced about half of all of the
coastal facilities being closed or inoperable. Facilities were not only closed due to storm
damage but also, flooded roads, lack of a working water system, and low staffing. As a result of
Hurricane Harvey, 231 ESRD dialysis and transplant facilities were closed between August 24,
2017 and September 2, 2017.
Daily emergency coalition calls were hosted by the ESRD Network to assist the renal community
during Hurricane Harvey. The daily calls were hosted by the Network and would not have been
as fruitful if not for the TEEC. The TEEC was formed in 2006 to facilitate the provision of quality
care to people with ESRD in the event of an emergency that negatively impacts the delivery of
dialysis and transplant services. The TEEC consists of a diverse group of providers including
regional directors, biomedical technicians, nurses, nephrologists, state emergency
representatives and other ESRD professionals who helped us maintain accurate EMResource
community web based records of facility closures, identify areas of need for supplies and
staffing, coordinate transportation for patients needing treatment, and share a cohesive
message with local emergency responders in the impacted areas. The TEEC steering committee
also provided aid in staffing the command center with volunteers from dialysis corporations in
the Dallas area. The Network also relied heavily on the collaborative efforts of dialysis
organizations, rescuers such as the Cajun Navy, and third party partners such as HealthCare
Ready. The ESRD Network identified and coordinated with federal, state, and local resources to
support patients during daily calls. By utilizing EMResource, the Texas ESRD Emergency
Coalition (TEEC), local, state, and national resources, patient placement and ensuring needed
resources for our patients was performed daily in the command center.
The command center and Network staff processed over 700 calls from dialysis patients, family
members, friends, renal professionals, as well as emergency disaster management
organizations and hospitals with the primary objective of arranging needed dialysis for patients
and protecting patient safety.

25
Facilities that Consistently Failed to Cooperate with Network Goals
Provider participation in the Network service area is monitored throughout the year for
compliance with activities specified in the Network’s CMS contract and for performance on
quality measures. Facilities that fail to comply with Network requests have the potential to be
placed on the Network Watch List, and subsequently may be referred for sanctions by CMS.
Networks may recommend that sanctions or alternative sanctions be imposed on facilities that
do not cooperate in meeting Network goals or the ESRD Conditions for Coverage.
In 2017, no facilities were referred to CMS for sanctions. However, there were facilities that
struggled to maintain expected levels of participation in ESRD Network 14 goals. The Network
Watch List was successful in reducing the number of facilities placed on the Network Watch List
from 14 to five facilities with a five day deadline to conduct/submit delinquent project
deliverables. Five Medicare-certified providers did not fully participate in one or more
designated QIAs and failed to complete and submit project deliverables by the given QIA
deadline despite a written, verbal notice; thus they were placed on the Network Watch List.
This process entailed sending the facility leadership a letter that detailed the reason the facility
was being placed on the Network Watch List, the actions required to be removed from the
Watch List, and consequences if those actions were not completed within five business days
from receipt of the letter. The letter was copied and sent to the facility’s Administrator and a
corporate leader (if applicable) as well as the CMS Contracting Officer’s Representative for
ESRD Network 14.
ESRD Network 14 strongly believes in fostering partnerships with the dialysis facilities in Texas
to meet and exceed the Network goals established by CMS to support HHS and CMS national
improvement goals and priorities. While ESRD Network 14 has always valued a collaborative,
collegial approach, in 2016 we initiated the Network Watch List to address ongoing failure of
facilities to fully participate, complete projects and achieve project goals, despite outreach to
corporate levels.

26
Recommendations to CMS for Additional Facilities
Although the Network has no official role with CMS in the approval process for new or expanded facilities, it does monitor and review overall capabilities in the state. The Network continued to receive contacts during 2017 from patients who stated that they were experiencing difficulty locating a facility after being involuntarily discharged due to actual harm or threats of harm to others, ongoing disruptive behaviors, or non-adherence to physicians’ orders. Upon Network investigation, many of these patients who were discharged had been provided adequate opportunities to correct the offending action prior to dismissal. ESRD Network 14 continued to observe the disturbing practice of discharges due to treatment non-adherence. Physicians may, and sometimes do, discharge patients from their practices, and, when no other admitting physicians will accept the patients, involuntary discharges from the dialysis facilities result. In other cases, such as those involving physical aggression, the patients are dismissed prior to acceptance to other facilities. 108 patients received an Involuntary Discharge (IVD) in 2017, of which 29 were due to immediate and severe threat and 13 due to disruptive behavior. When this occurs, patients often experience rejection from facilities under the same physician or corporate group and other providers. In 2017 the Network had 22 such patients representing failure to place cases. These patients must rely on hospitals to provide treatment on an emergency basis until new facilities are located. The Network recommends that CMS encourage innovation by fostering the establishment of special needs dialysis facilities in the major metropolitan areas to serve displaced patients who require chronic dialysis yet do not have a chronic provider. It is anticipated that these special needs facilities would require at least the following special services to meet the needs of this population of patients:
Security guards and metal detectors
Social workers and registered nurses on staff whenever patients are dialyzing
Lower patient care staff to patient ratio
Higher hourly pay rate for all staff (high risk/hazardous pay)
Psychological counseling on site These additional services would certainly inflate the cost of delivering services to this population, which would require a higher reimbursement rate for such facilities; however, it is highly likely that these centers would prevent a multitude of emergency department treatments and hospitalizations that would produce a net savings for the Medicare Program. Establishment of these special needs facilities could be fostered through:
A CMS-sponsored demonstration project, implemented through the Center for Medicare & Medicaid Innovation (CMMI)
Higher reimbursement rates for initial set up of facilities enrolled in ESRD Seamless Care Organization (ESCO) programs