ert461 biosystems engineering design 1 ert424 bioprocess plant design 1
TRANSCRIPT
PROJECT PLANNING USING MS PROJECT
ERT461 BIOSYSTEMS ENGINEERING DESIGN 1
ERT424 BIOPROCESS PLANT DESIGN 1
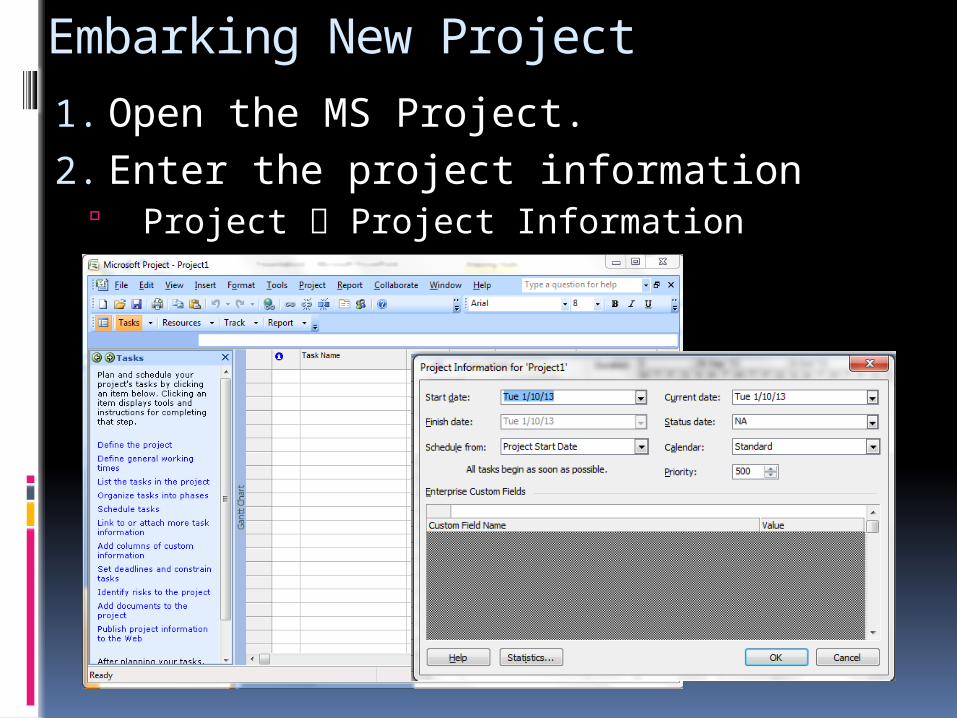
Embarking New Project1. Open the MS Project.2. Enter the project information
Project Project Information
3. Select Gantt Chart view from the view menu.
4. You’ll have a spreadsheet where you can now enter information of all the activities i.e. task name, duration, start date, end date, predecessors and various other fields.
5. For predecessor activity you need to write activity number.
6. The MS Project will calculate start and end date.
7. Now the Gantt Chart is complete.
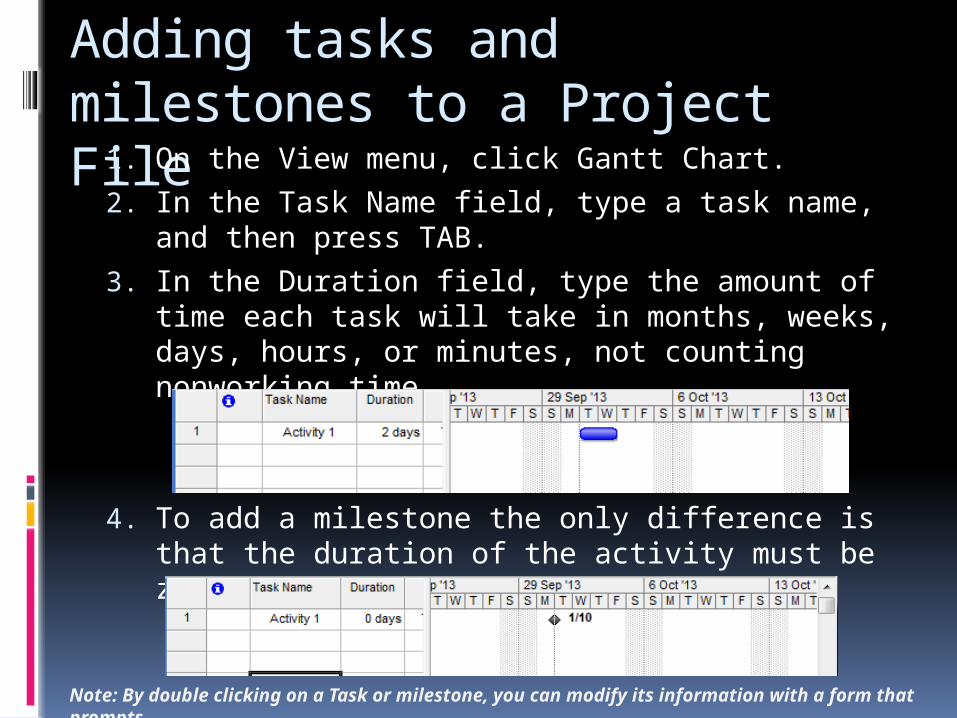
Adding tasks and milestones to a Project File1. On the View menu, click Gantt Chart.
2. In the Task Name field, type a task name, and then press TAB.
3. In the Duration field, type the amount of time each task will take in months, weeks, days, hours, or minutes, not counting nonworking time.
4. To add a milestone the only difference is that the duration of the activity must be zero.
Note: By double clicking on a Task or milestone, you can modify its information with a form that prompts
Grouping Tasks in Logical Order (WBS)
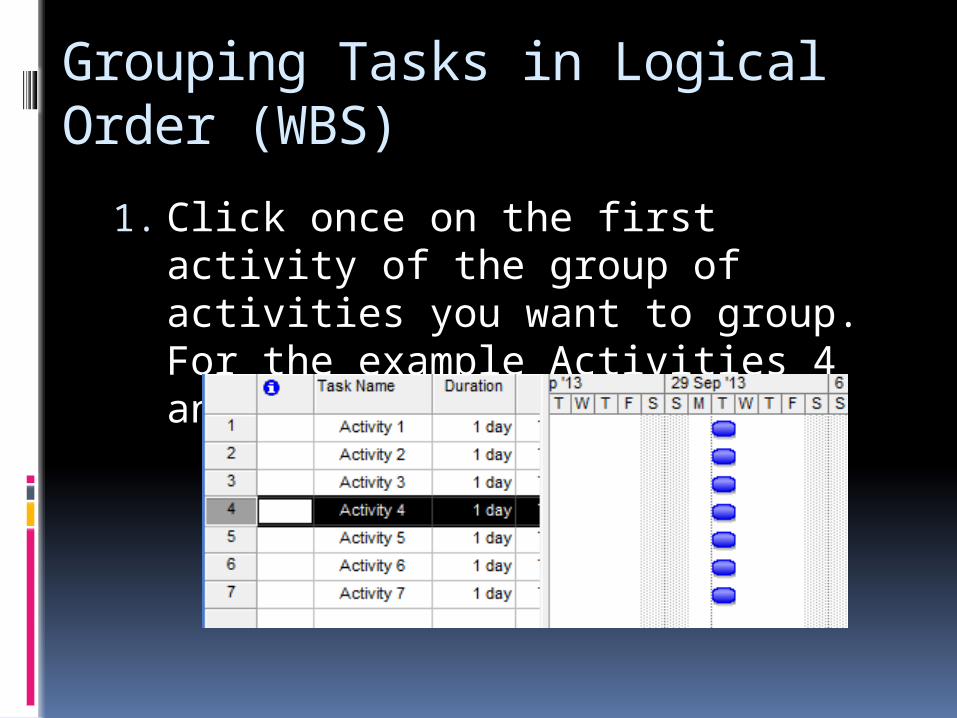
1. Click once on the first activity of the group of activities you want to group. For the example Activities 4 and 5
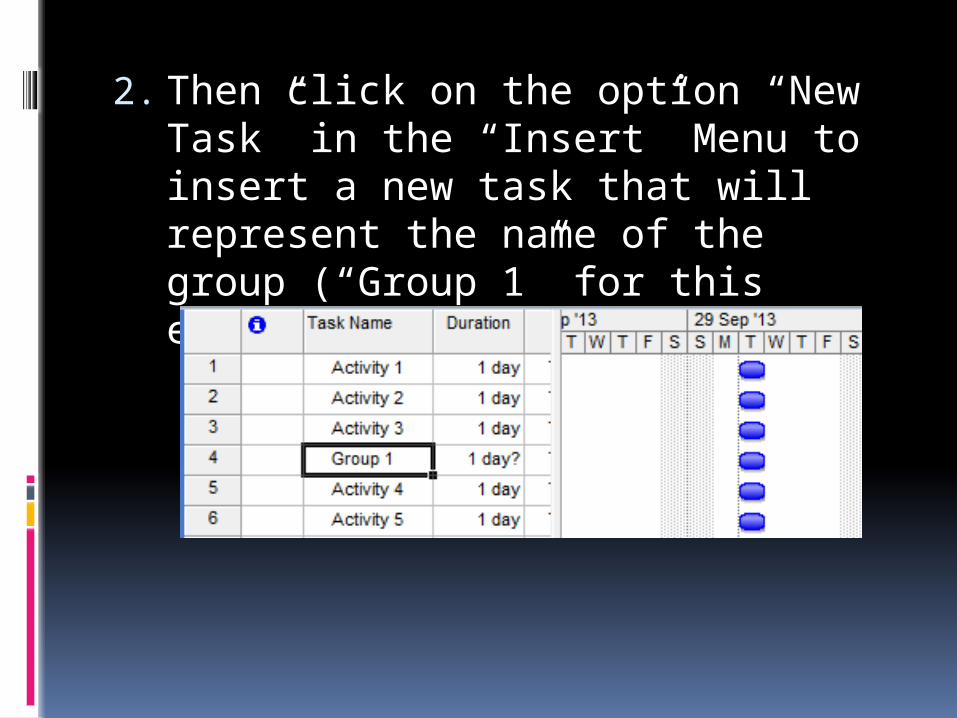
2. Then click on the option “New Task” in the “Insert” Menu to insert a new task that will represent the name of the group (“Group 1” for this example)
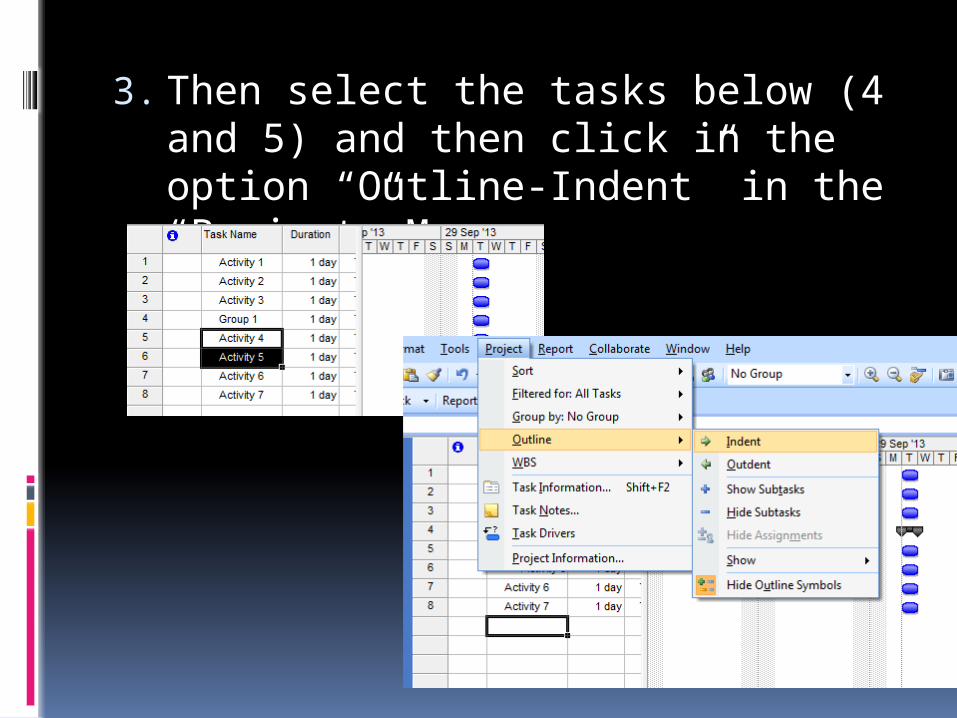
3. Then select the tasks below (4 and 5) and then click in the option “Outline-Indent” in the “Project” Menu.
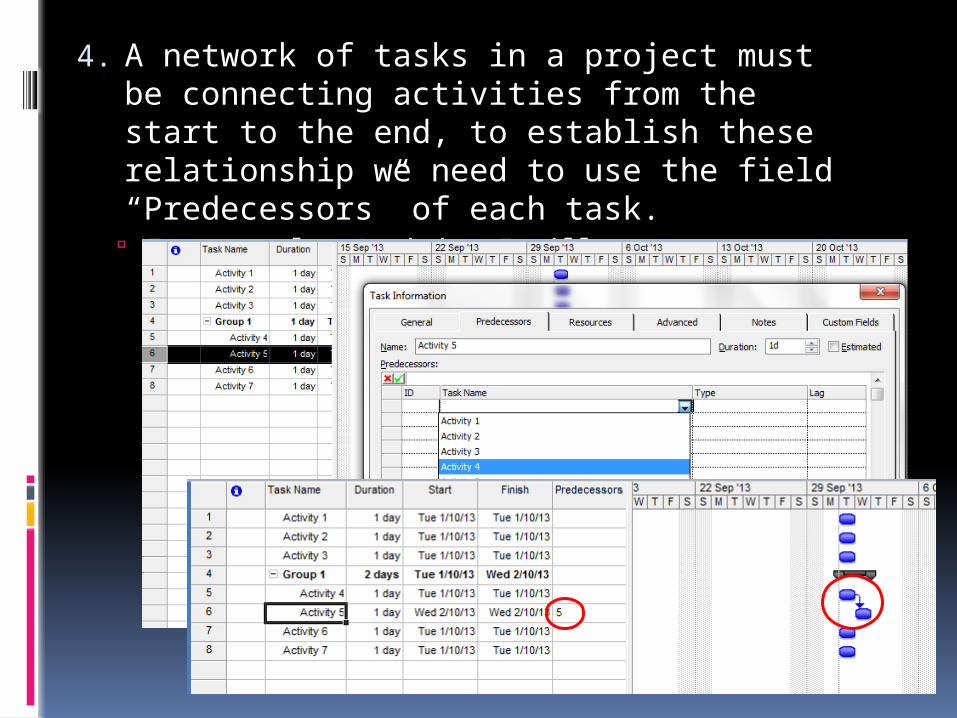
4. A network of tasks in a project must be connecting activities from the start to the end, to establish these relationship we need to use the field “Predecessors” of each task. For example, Activity 5 will start once Activity 4 is
completed.
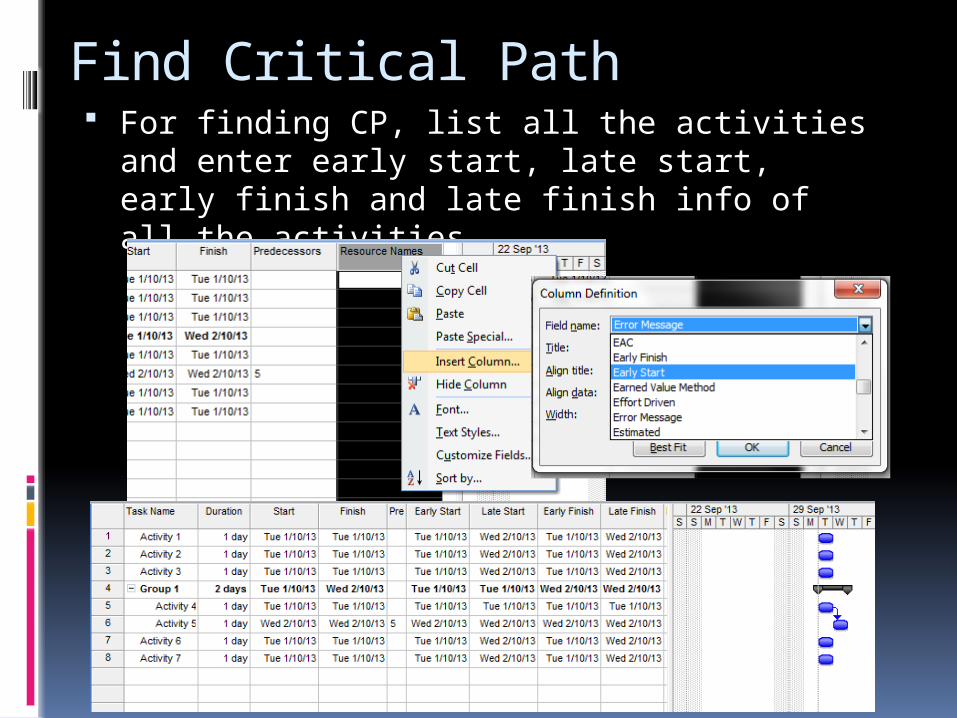
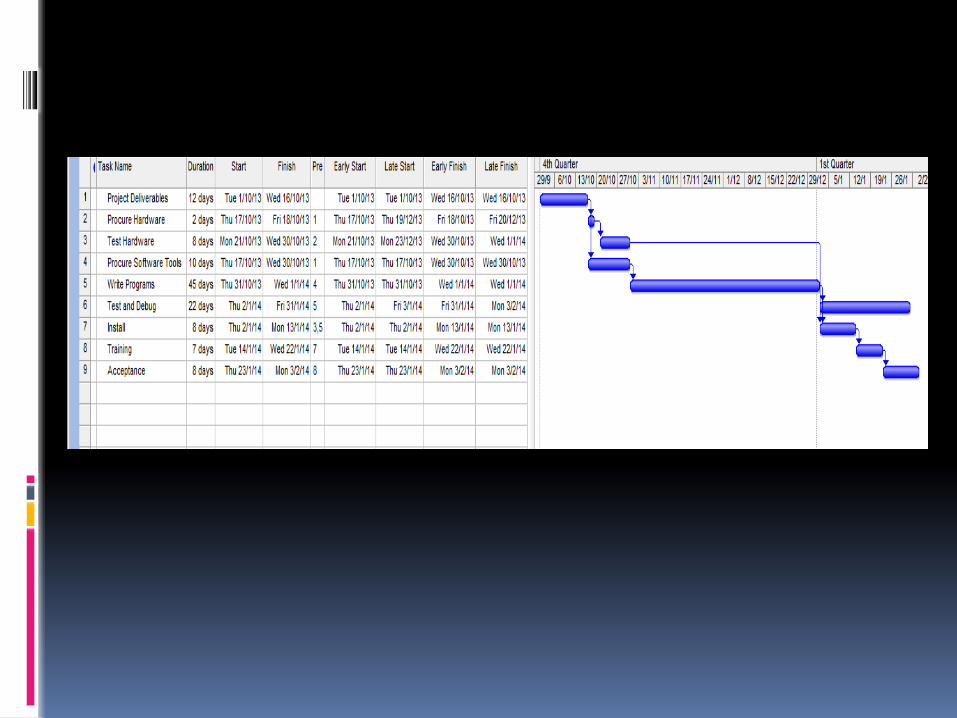
Find Critical Path For finding CP, list all the activities and enter
early start, late start, early finish and late finish info of all the activities.
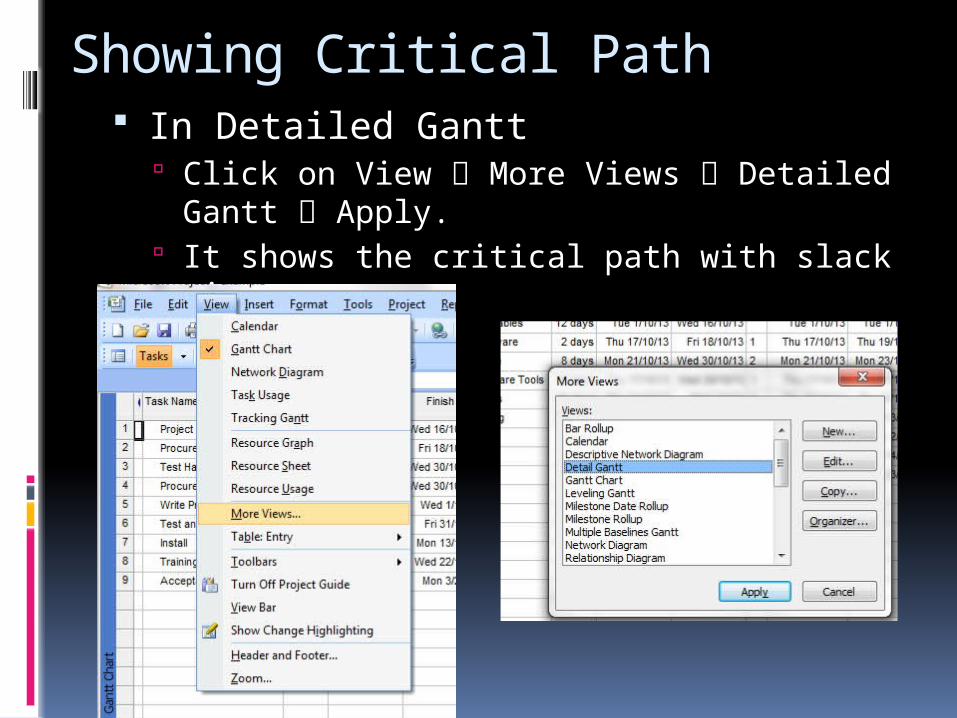
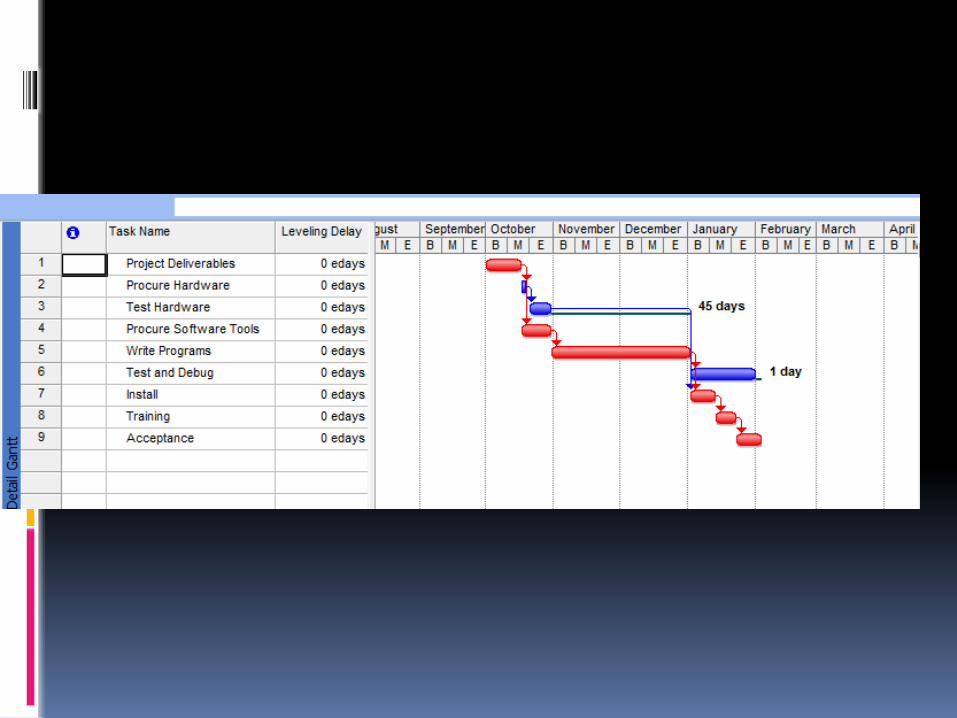
Showing Critical Path In Detailed Gantt
Click on View More Views Detailed Gantt Apply.
It shows the critical path with slack time.
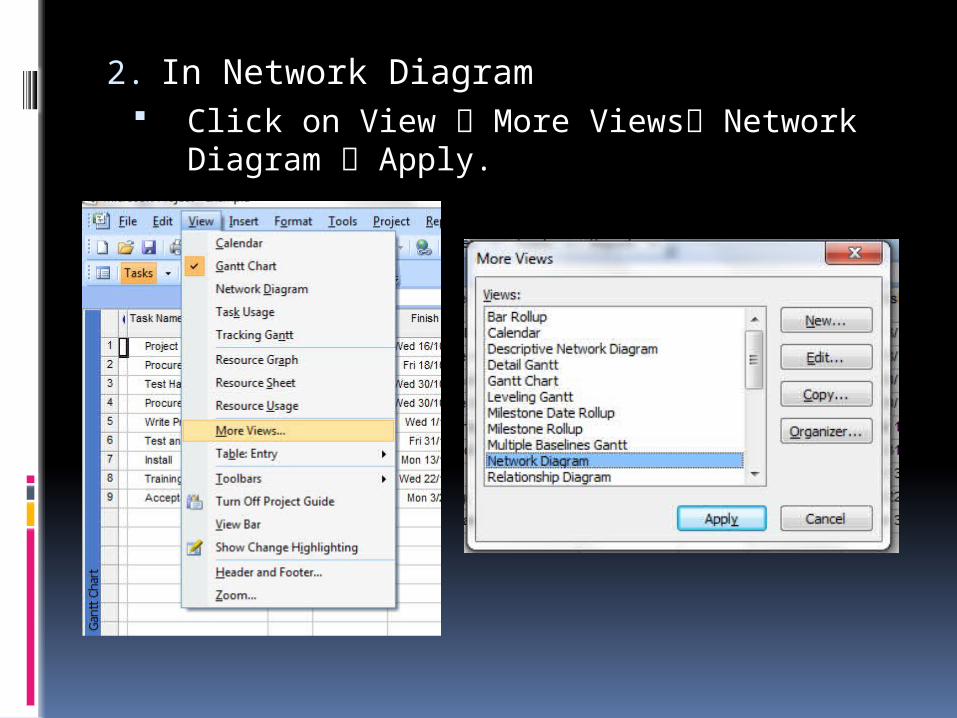
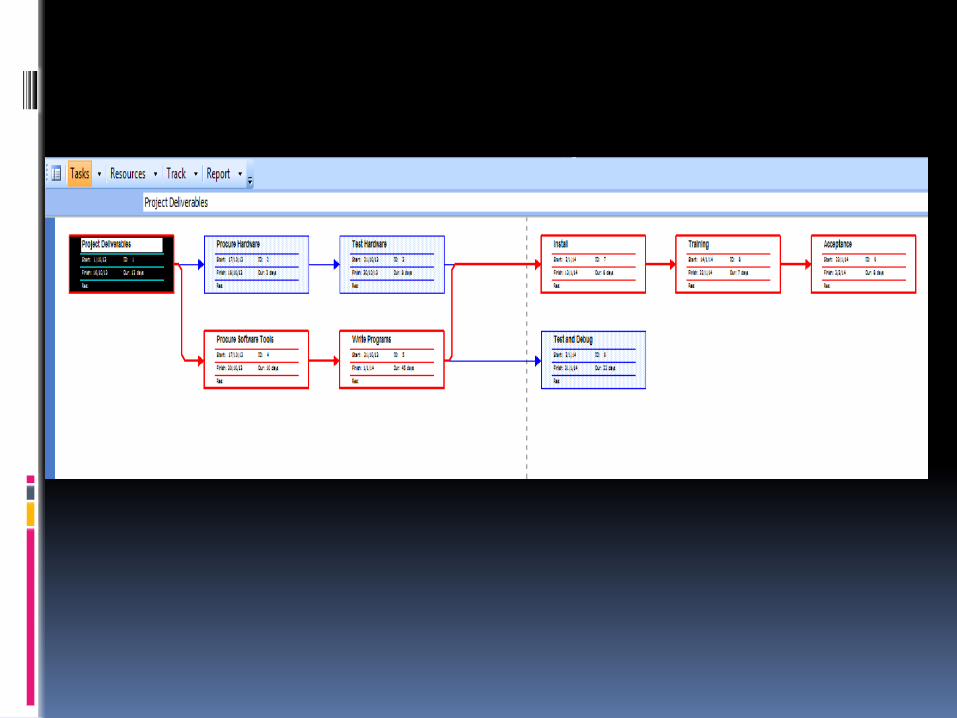
2. In Network Diagram Click on View More Views Network
Diagram Apply.
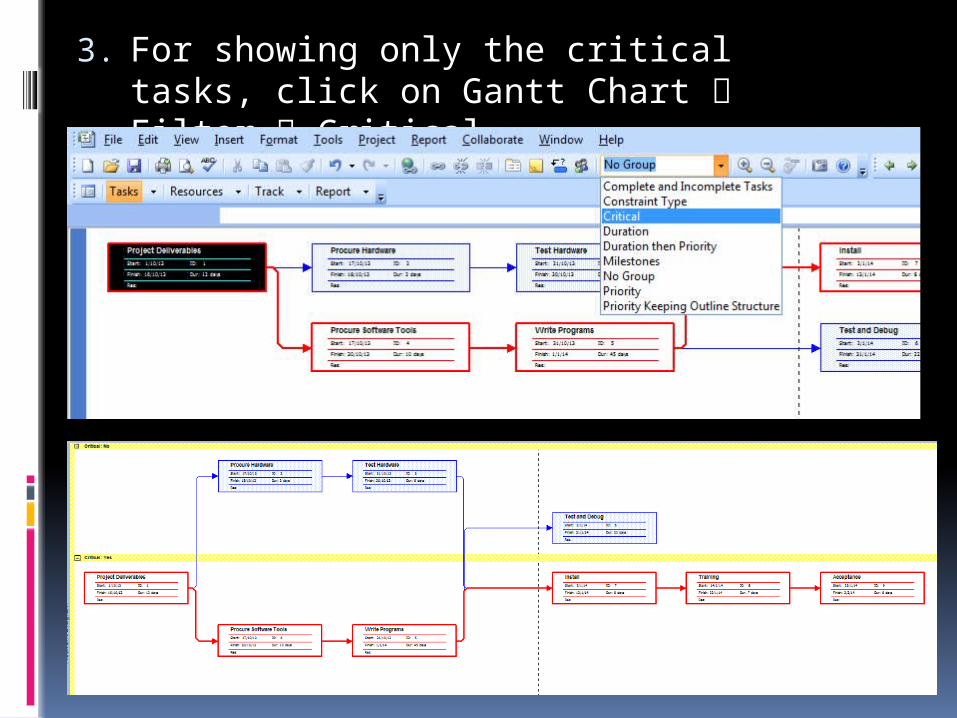
3. For showing only the critical tasks, click on Gantt Chart Filter Critical.
Resources
Three different types of resources can be entered using MS Project: Work resources Material resources Cost resource
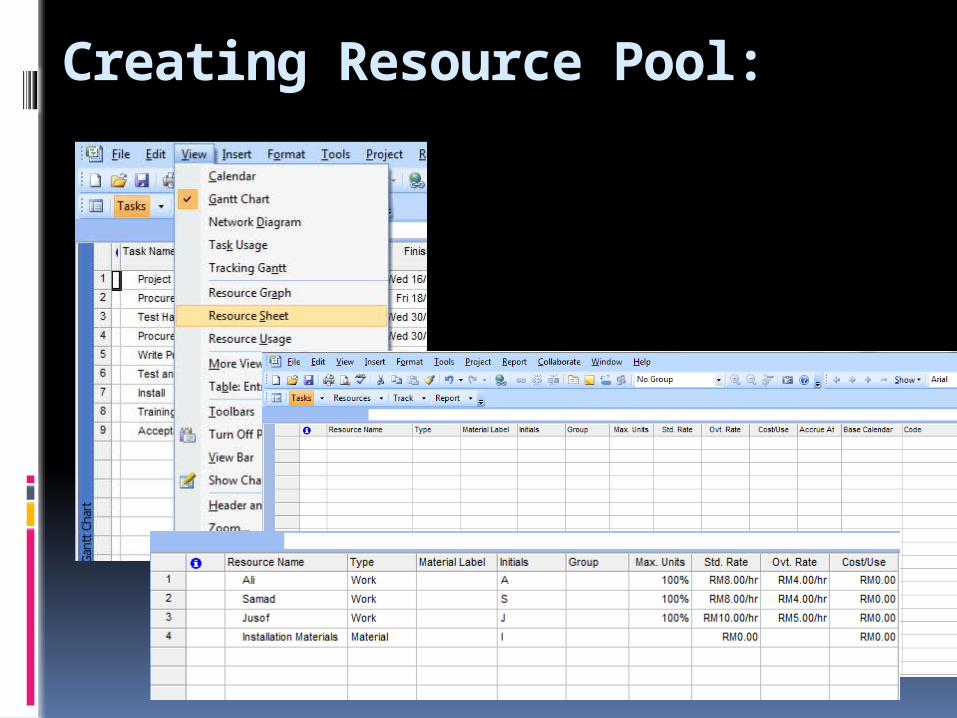
Creating Resource Pool:
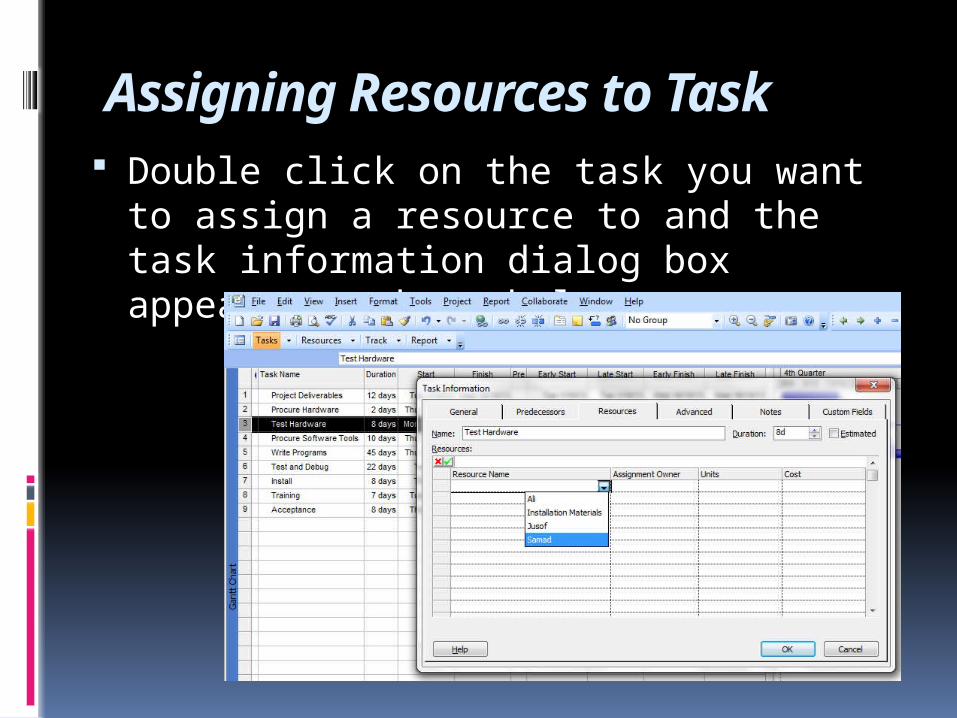
Assigning Resources to Task Double click on the task you want to assign a resource to and the task information dialog box appears as shown below.
EXERCISE
A Bioethanol Production / Development of Diary Farm project was awarded to your organization. As a project manager, you need to form a group to prepare the schedule and project planning using MS Project.