erosion effects on soil water storage, plant water uptake, and corn growth
TRANSCRIPT
Erosion Effects on Soil Water Storage, Plant Water Uptake,and Corn Growth
B. J. Andraski and B. Lowery*
ABSTRACTMany investigators have suggested that the greatest negative effect
of erosion on soil productivity is the decrease in available water-hold-ing capacity, but few have attempted to evaluate this relation directly.In this 4-yr study, we evaluated the effects of past erosion on soilwater storage, plant water uptake, and corn (Zea mays L.) growth ona linear slope of Dubuque silt loam soil (fine-silty, mixed, mesic TypicHapludalf) in southwestern Wisconsin. Levels of past erosion werebased on depth to red clay (2Bt horizon): flight, 0.95 m; moderate,0.74 m; and severe, 0.45 m. The total quantity of plant-extractablewater that could be stored in the upper 1 m of slightly eroded soil(181 mm) was 7% more than that for moderately eroded soil (169mm) and 14% more than that for severely eroded soil (159 mm). Forall erosion levels, water retained in the 0.5- to 1.0-m soil depth wasutilized by corn. Erosion level had no negative effect on early-seasonplant growth. As plant-extractable water decreased to <55 to 60% oftotal, evapotranspiration (ET) and vegetative-growth rates decreasedas erosion level increased. The greatest differences in ET rates amongerosion levels were observed during a 35-d period in the drought yearof 1988 when rates averaged 3.7 mm d~' for slight erosion, 2.6 mmd~' for moderate erosion, and 2.2 mm d~' for severe erosion. For the3 yr in which plant water stress was observed, maximum plant heightsfor the slight erosion level averaged 7% more than those for moderateerosion and 13% more than those for severe erosion. Although thesoil's capacity to store and supply water decreased as erosion in-creased, the observed effects of erosion level on grain and stover yields,grain-yield components, and harvest populations typically were notsignificant.
EROSION affects soil productivity because it alterschemical, physical, and biological properties of
soil. In general, soil erosion results in loss of availableplant nutrients and organic matter, degradation of soilstructure, decreased rooting depth, and decreasedavailable soil water, all of which can have negativeeffects on soil productivity.
The effect of erosion on soil productivity can varygreatly between locations and years. In a 3-yr studyon southern Piedmont soils, Langdale et al. (1979)observed that, relative to uneroded sites, corn grainyields ranged from 12% greater to 41% less for mod-erately eroded sites and ranged from 60 to 70% lessfor severely eroded sites. Schertz et al. (1989) did a6-yr study on three Indiana soils and reported a trendof decreasing corn grain yields with increasing sever-ity of past erosion, but there were (largely unexplain-able) exceptions. In their study, yields for slightlyeroded sites ranged from as much as 288% greater to25% less than those for severely eroded sites. In astudy on loess soils in southwestern Wisconsin, Swanet al. (1987) observed increased corn grain yields with
B.J. Andraski, U.S. Geological Survey, 333 W. Nye Lane, Car-son City, NV 89706; and B. Lowery, Dep. of Soil Science, 1525Observatory Dr., Univ. of Wisconsin, Madison, WI 53706. Re-search supported by the College of Agricultural and Life Sciences,Univ. of Wisconsin-Madison. Received 30 Sept. 1991. "Corre-sponding author.
Published in Soil Sci. Soc. Am. J. 56:1911-1919 (1992).
increased soil depth to red-clay residuum in 3 of 5 yr.In contrast, Alberts and Spomer (1987) generally ob-served no significant effect of erosion class on corngrain yields for a large field-scale study using 18 yrof data from deep loess soils.
The relation between past erosion and crop yieldcan vary because of differences in soil properties andbecause of the influence of climate and landscape po-sition on the soil-plant environment. For soils withroot-restrictive zones, the intensity of the positive re-lation between soil depth and yield increased in yearswith decreased precipitation during critical stages ofcrop development (Frye et al., 1983; Swan et al.,1987). Stover yields, however, were less sensitive thangrain yields to soil depth (Langdale et al., 1979). Con-versely, on the deep loess soils studied by Alberts andSpomer (1987), the climatic year had no effect onrelative grain yields among erosion levels. The effectof landscape positions on soil erosion can greatly modifythe relations between the degree of past erosion andsoil productivity. For example, landscape positionsthat received both surface and subsurface water fromhigher elevations in the field produced the greatestcorn grain yields, regardless of erosion class (Stoneet al., 1985).
Leeper et al. (1974) concluded that, with adequatefertility and a high level of management, the potentialof a soil to produce corn was largely determined bythe capacity of the soil to store and supply water toplants. Accordingly, many investigators have con-cluded or implied that the most important yield-lim-iting effect of soil erosion is the decrease in availablewater-holding capacity. These conclusions commonlyhave been inferred from correlations between final yieldand soil properties or site and climatic conditions thataffect soil water availability, but few attempts havebeen made to evaluate this relation directly. The ob-jective of this study was to determine the effects ofpast erosion on soil water storage, plant water uptake,and corn growth through several growing seasons ona silty soil in southwestern Wisconsin.
MATERIALS AND METHODSThe effects of past erosion on soil water storage, plant
water uptake, and corn growth were investigated during1985 to 1988 at the University of Wisconsin Lancaster Ex-perimental Station (42°52'N, 90°42'W) in the driftless re-gion of southwestern Wisconsin. This area has been affectedby both geologic and postcultivational erosion. Soils areformed in loess and a red-clayey residuum that has a sub-angular blocky structure (Glocker, 1966). Requirements forselection of a study site were that the site be within onesoil mapping unit, have a uniform landscape position, andhave a wide range of past erosion. The study site selectedis mapped as a Dubuque silt loam soil and is on a linear,southwest-facing, 10 to 14% slope. The area of the studysite is 90 m long by 45 m wide with the long axis directedacross slope. Within this area, depth to red clay (2Bt ho-rizon) was used as an indicator of past erosion and rangesfrom 0.3 to 1.2 m deep. Three levels of past erosion (slight,
1911
1912 SOIL SCI. SOC. AM. I., VOL. 56, NOVEMBER-DECEMBER 1992
moderate, and severe) were identified on the basis of depthto red clay. Three replicate plots (13.7 m long by 7.3 mwide, the long axis directed across slope) were establishedwithin each erosion level. For each erosion level, averagevalues for depth to red clay, slope aspect, slope steepness,and elevation were based on plot measurements (Table 1).Depth to red clay was measured at seven points on eachplot. Slope aspect was measured by compass. Elevation(relative to a site benchmark) and slope steepness weredetermined by rod and level using nine points on each plot.One to two soil samples from each of the nominal horizons(A, Bt, and 2Bt) of each plot were collected for use intextural classification (Table 2).
The site was in continuous alfalfa (Medicago saliva L.)for 5 yr prior to this study. Beginning in 1984, the site wascropped with continuous corn and tillage operations werefall chisel plowing and spring disking. Preplan! N fertilizerwas applied as anhydrous NH3 at rates of 224 kg N ha-1
in 1985 and 1986 and 280 kg N ha-1 in 1987 and 1988.Nitrogen, P, and K fertilizer (6-10.5-20 [6-24-24 oxidebasis]) was applied at planting at rates of 224 kg ha-1 in1985 and 1986, 254 kg ha-1 in 1987, and 280 kg ha-1 in1988. 'Pioneer 3737' corn was planted in rows 0.91 mapart. Planting dates and rates (in parentheses) were 2 May1985 and 1986 (74 100 seeds ha-1), 1 May 1987 (75 300seeds ha-1), and 5 May 1988 (77 800 seeds ha-1). Weedsand insects were controlled as needed. Surface residue coverafter planting was estimated by photographing a 0.61-m-long by 0.91-m-wide grid on the soil surface at two loca-tions in each plot and determining the percentage of gridintersections over residue. Residue cover averaged 24 ±6% for 1985, 21 ± 6% for 1986, and 17 ± 5% for 1987(residue cover was not measured in 1988).
Precipitation at the study site was measured from plantingthrough harvest by a tipping-bucket rain gauge (Model 6010,Weathertronics, West Sacramento, CA1). Long-term pre-cipitation data are based on Lancaster Experimental Stationrecords.
Soil water content was measured weekly with a neutronmoisture probe (Model 503, Campbell Pacific Nuclear Corp.,Martinez, CA). Two steel access tubes were installed in therow near the upper and lower perimeters of each plot. Neu-tron-probe measurements were made at 0.25-m depth in-crements to 1 m and an additional measurement was madeat 0.15 m deep. At each depth, neutron counts were takenuntil two were within 1% and water content was determinedfrom the average of these values. Calibration of the neutronprobe was done outside of the plot area at five locationsthat were wetted at different rates. Calibration equationswere developed for count ratios at a depth of 0.15 m and
1 The use of a trade name is for identification purposes onlyand does not constitute endorsement by the U.S. Geological Sur-vey or Univ. of Wisconsin.
for depths > 0.15 m. The 0.15-m-depth equation adjustedfor neutron escape errors and was used to estimate volu-metric soil water content in the.O- to 0.25-m soil depth.Both equations had coefficients of determination (r2) >0.%.The standard error of estimate was 0.015 m3 m-3 for the0.15-m-depth equation and 0.012 m3 m-3 for the > 0.15-m-depth equation.
The quantity of plant-extractable water that could be storedin the upper 1 m of the soil profile was calculated as thedifference between the drained, upper limit and the lowerlimit of soil water storage determined from field measure-ments (Ritchie, 1981). The upper limit is analogous to theconcept of field capacity and is based on measurementsmade after the soil has been wetted and allowed to drain.For each erosion level, the drained, upper limit of soil waterstorage (0-1-m depth) was estimated from neutron-probemeasurements made on 16 May (Day 136) 1985, =24 hafter a 2-d period with 27 mm of precipitation. The lowerlimits of extraction were estimated from soil water storagevalues measured on 28 July (Day 210) during the droughtyear of 1988. Evapotranspiration rates were calculated for7- to 8-d periods of low precipitation (<10 mm) using raingauge data and changes in soil water storage with the as-sumptions of zero runoff and negligible deep percolation.
Plants in four, 7.6-m-long interior corn rows in each plotwere counted periodically to determine dates of 100%emergence and 50% silking. Plant height (leaf extended)was used as an indicator of crop growth and was measuredfollowing 100% emergence through silking using eight plantsper plot. Grain yield was sampled by hand harvesting theears from four, 7.6-m-long interior rows of each plot. Foreach plot, a subsample of 10 randomly selected ears wasweighed, dried at 55 °C, and shelled for determinations ofgrain moisture and shelling percentage. Grain yield wasreported on a 15.5% moisture basis. For each plot, harvestpopulation and number of barren plants were determinedby plant counts in four, 7.6-m-long interior rows and stoveryield was sampled by hand harvesting one, 7.6-m-long row.For each plot, 15 randomly selected plants were choppedand a subsample was weighed and dried at 55 °C for stovermoisture determination.
Plant height and harvest data were analyzed using a one-way analysis of variance procedure. Treatment means werecompared using Fisher's protected least significant differ-ence test (Steel and Torrie, 1980) at the 0.10 probabilitylevel.
RESULTS AND DISCUSSIONPrecipitation and Soil Water Storage
Precipitation amounts and timing varied among theyears studied (Fig. 1-4). Precipitation during May
Table 1. Average depth to red clay, slope aspect, slope steepness,and elevation for plots established on a linear slope of slightly,moderately, and severely eroded Dubuque silt loam soil.
Erosionlevel
SlightModerateSevereP>F§
Depth tored clay
m0.95 at0.74 b0.45 c0.002
SlopeAspect
° from north228 a219 a220 a0.263
Steepness%
14 a12 a14 a
0.530
Elevationfm
3.72 a4.66 a2.79 a0.515
t Elevation relative to a site benchmark.i Column values that are followed by the same letter are not significantly
different at the 0.10 probability level, as determined by Fisher's leastsignificant difference test.
§ Denotes probability that no significant differences exist within a column.
Table 2. Textural classification of nominal soil horizons forthe slight, moderate, and severe erosion levels of a Dubuquesilt loam soil.
Erosionlevel
Slight
Moderate
Severe
Soilhorizon
ABt
2BtABt
2BtABt2Bt
Averagedepth
m0-0.36
0.36-0.950.95->1.13
0-0.200.20-0.740.74->0.99
0-0.170.17-0.450.45-0.79
Texturalclass
silt loamsilty clay loam
silty claysilt loam
silty clay loamsilty claysilt loam
silty clay loamsilty clay
Sand— 9525623534
Clayb ——
133254162945173340
ANDRASKI & LOWERY: EROSION EFFECTS ON PLANT WATER RELATIONS 1913
1OU
120
110
100"g"E. 90
<? 30a:
iTE
R S
TO
§ 3
1 »
40
30
20
1013
130
120
110
100
E. 90UJ§ 8 0orP 70w11 60UJ ou
i-40
30
20
10 1
1985• SLIGHT
^ A MODERATE- *\ • SEVERE
^&^*^4fc
- ""̂ ^ s -' \ A/ :
\ 2s^ / 2 u
• A^A • /
V / •4, SILKING
0 145 160 175 190 205 220 235 25
DAY OF THE YEAR
Water Storage in 0.50- to 0.75- m Depth
1985• SLIGHTA MODERATE '
. *•••-•••"• •-̂ • SEVERE
A-A — A.A-A-A S0•«•. ^N V V0
'• •-•-•••^B^ A ^v A"^" "*•s
•~~B-B H
---
J, SILKING
30 145 160 175 190 205 220 235 2
DAY OF THE YEAR
40 u I i i I • i I <
•§• 35 i-£ 30 =-
I " h1 « F |a 1° rlJE :M| I ,i
1OU
120
110
100
?E, 90UJI80P 70(/)CC RQUJ
|50
40
30
20
0 '°.
130
120
110
100
E. 90UJO 80< eoCCP. 70(/>CC ftnUJ ""
|50
40
30
20
o 10,
II ,
i i | i i i i i | i , i . . i . . i i i ( • •
1985• SLIGHTA MODERATE
^ • SEVERE9*A /^\
:*: /̂'\*N% • "
: " Vx!̂ A -"\
SH-BB'B
4, SILKING
10 45 160 175 190 205 220 235 25
DAY OF THE YEAR
Water Storage in 0.75- to 1 .0- m Depth
1985• SLIGHT
- ̂ _ A MODERATE -^" '̂̂ "^•-0-0.— • SEVERE
•^fift&feA^ Vj..:5
"*-• *B
-
-
-
-
4, SILKING
30 145 160 175 190 205 220 235 25
DAY OF THE YEAR
H
-j-I-i
^^ ^L i130 145 160 175 190 205 220 235 250
DAY OF THE YEAR
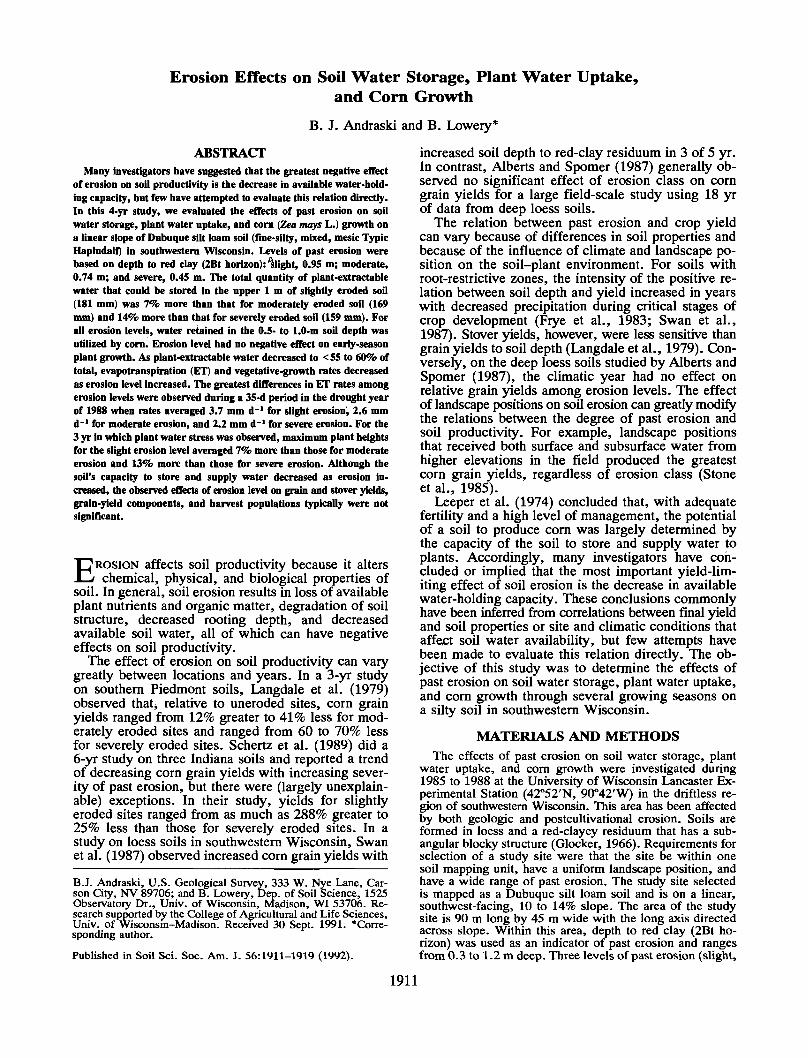
Fig. 1. Soil water storage at four depths for the slight, moderate, and severe erosion levels, corn silking date, and daily precipitationduring the 1985 growing season.
through September totaled 473 mm in 1985, 496 mmin 1986, 604 mm in 1987, and 253 mm in 1988. Long-term average total precipitation for May through Sep-tember (26-yr record) is 509 mm with monthly aver-age values of: May, 88 mm; June, 112 mm; July, 107mm; August, 112 mm; and September, 90 mm.
For each year, total profile soil water storage (0-1-m depth) was typically greatest early in the growingseason, with values ranging from =315 to 410 mm.With the exception of 1988, initial soil water storagevalues for all depths increased as erosion level in-creased (Fig. 1-4). As each growing season pro-gressed, the rank of soil water storage values amongerosion levels typically remained the same: slight <moderate < severe.
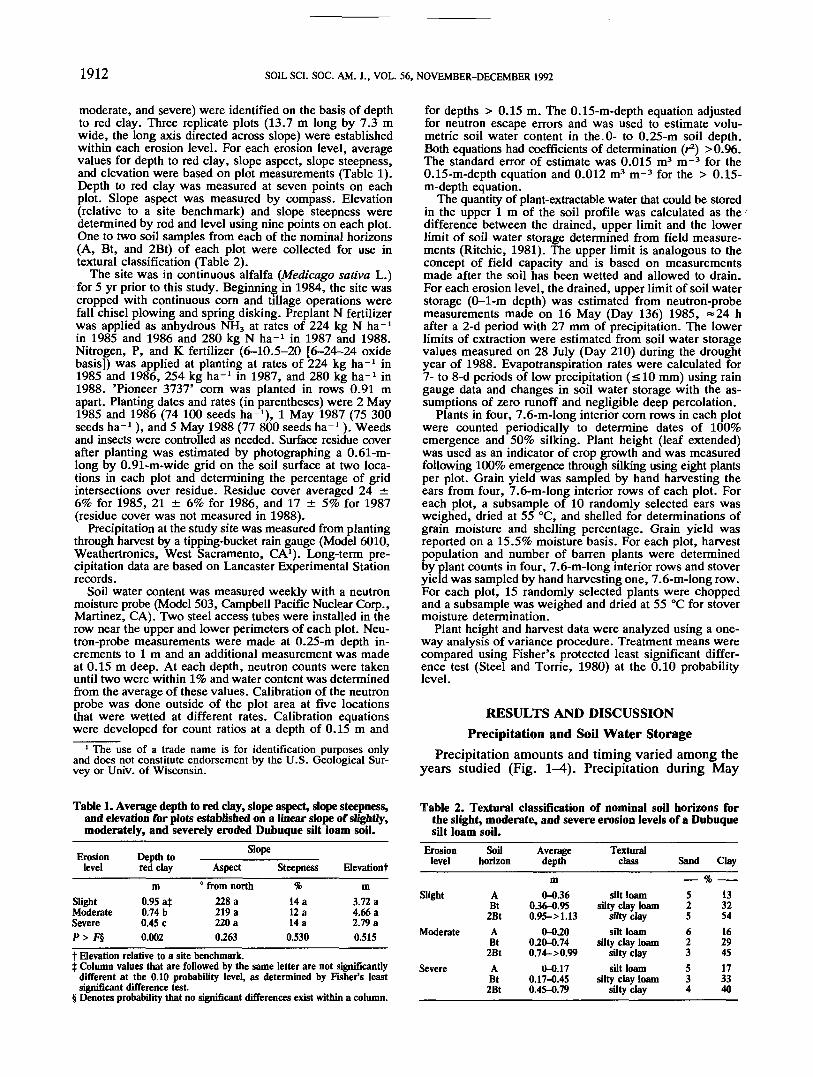
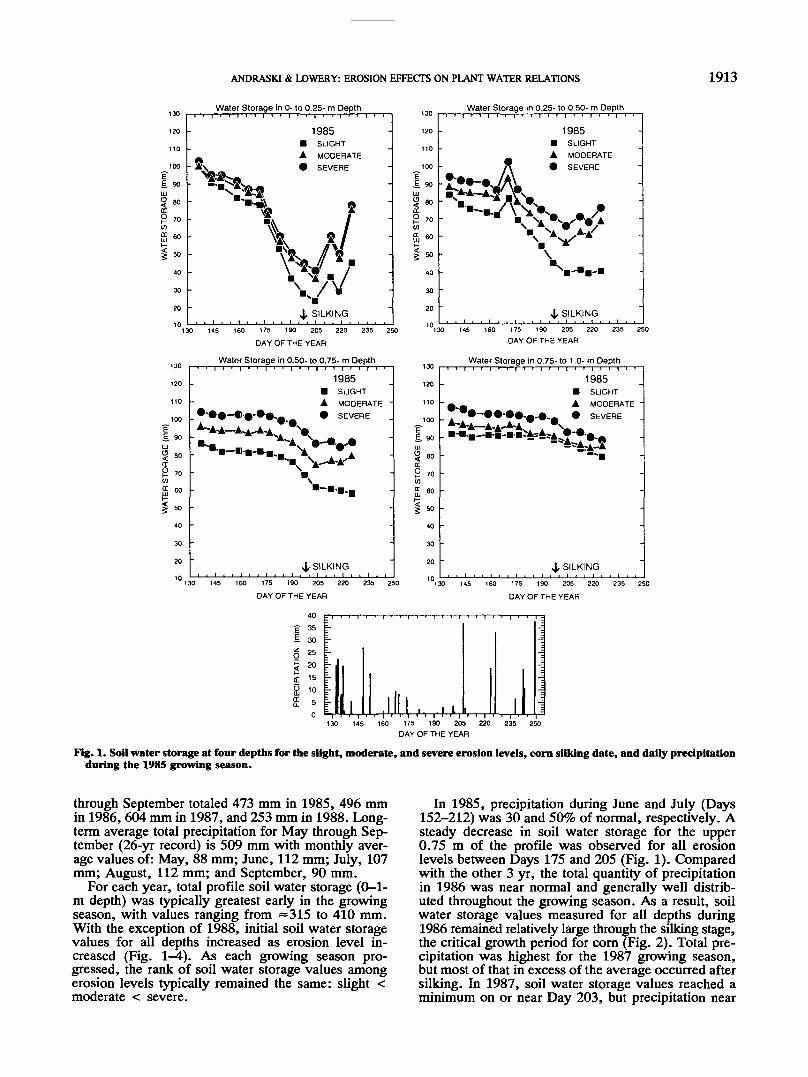
In 1985, precipitation during June and July (Days152-212) was 30 and 50% of normal, respectively. Asteady decrease in soil water storage for the upper0.75 m of the profile was observed for all erosionlevels between Days 175 and 205 (Fig. 1). Comparedwith the other 3 yr, the total quantity of precipitationin 1986 was near normal and generally well distrib-uted throughout the growing season. As a result, soilwater storage values measured for all depths during1986 remained relatively large through the silking stage,the critical growth period for corn (Fig. 2). Total pre-cipitation was highest for the 1987 growing season,but most of that in excess of the average occurred aftersilking. In 1987, soil water storage values reached aminimum on or near Day 203, but precipitation near
1914 SOIL SCI. SOC. AM. J., VOL. 56, NOVEMBER-DECEMBER 1992
Water Storage in 0- to 0.25- m Depthi i ' i i i i > i i i i i i i i > i i
Water Storage in 0.25- lo 0.50- m Depth
175 190 205
DAY OF THE YEAR
130
120
110
100
?E, 90UJO «n<; ourr£ 70CO
£ 6°1 50
40
30
20
">,:
Water Storage in 0.50- to 0.75- m Depth
1986• SLIGHTA MODERATE
-f^*\ -•-••• * SEVERE
A-A^A-A-A-A-A-A^* *^0
"•"•-•-•-• « •-•_HXj^» • •m*~m-m-m
4, SILKING
0 145 160 175 190 205 220 235
DAY OF THE YEAR
-
_
_
-
-
-
-
-
-
25
120
110
100
£ 90UJ$ 80CCP 7n
45 160 175 190 205 220 235 250
DAY OF THE YEAR
Water Storage in 0.75- to 1.0- m Depth
1986• SLIGHTA MODERATE• SEVERE
4, SILKING
130 145 160 175 190 205 220 235 250
DAY OF THE YEAR
60 rr55 r50
S. "0§ 35
130 145 160 175 190 205 220 235 250DAY OF THE YEAR
Fig. 2. Soil water storage at four depths for the slight, moderate, and severe erosion levels, corn silking date, and daily precipitationduring the 1986 growing season.
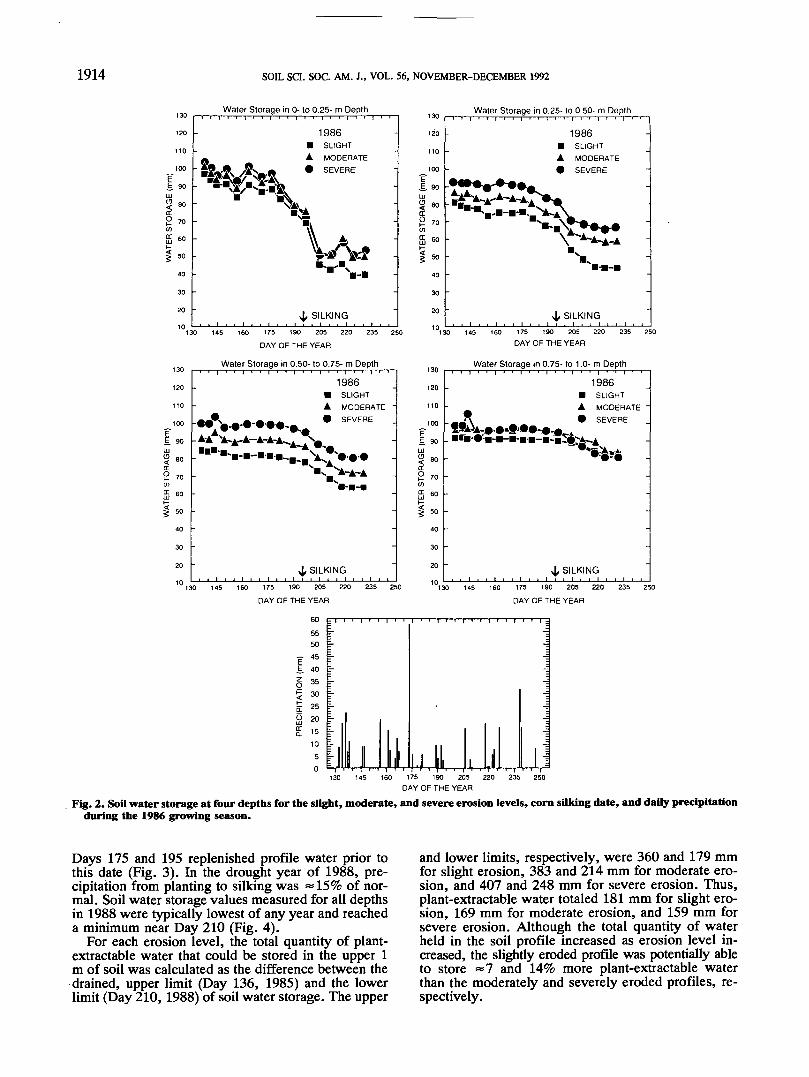
Days 175 and 195 replenished profile water prior tothis date (Fig. 3). In the drought year of 1988, pre-cipitation from planting to silking was —15% of nor-mal. Soil water storage values measured for all depthsin 1988 were typically lowest of any year and reacheda minimum near Day 210 (Fig. 4).
For each erosion level, the total quantity of plant-extractable water that could be stored in the upper 1m of soil was calculated as the difference between thedrained, upper limit (Day 136, 1985) and the lowerlimit (Day 210,1988) of soil water storage. The upper
and lower limits, respectively, were 360 and 179 mmfor slight erosion, 383 and 214 mm for moderate ero-sion, and 407 and 248 mm for severe erosion. Thus,plant-extractable water totaled 181 mm for slight ero-sion, 169 mm for moderate erosion, and 159 mm forsevere erosion. Although the total quantity of waterheld in the soil profile increased as erosion level in-creased, the slightly eroded profile was potentially ableto store ~1 and 14% more plant-extractable waterthan the moderately and severely eroded profiles, re-spectively.
ANDRASKI & LOWERY: EROSION EFFECTS ON PLANT WATER RELATIONS 1915
low
120
110
100
E. 90UJ3 60IT
FER
STO
I
S-4 0
|50
40
30
20
10 i:
,_ 1987• SLIGHTA MODERATE• SEVERE
^-^
\\ A)A 'Oft //\\j»
•
w <// "Wjr/1/
--
4/ SILKING, , i i i i i i i i i i i i i
0 145 ' 160 175 190 205 220 235 2!
low
120
110
100
£ 90UJ§ 6 0tr0 7001
S 60
1 *>
40
30
20
>o 10i:
' ' '
-
-
2-ff-2-Am
: V.xjv!
-
-
1987• SLIGHTA MODERATE -• SEVERE
n_ .•'5>"A"2.
$V\ '""'"-"*VB'*'
-
4, SILKING
» 145 160 175 190 205 220 235 25
DAY OF THE YEAR DAY OF THE YEAR
( 3Q Water Storage in 0.50- to 0.75- m Depth < ̂ Water Storage in 0.75- to 1 .0- m Depth
120
110
100?I. 90UJ< 60o:
i 70o: KQUJ
40
30
20
1987• SLIGHTA MODERATE
_ • SEVERE Jt^ .A-A"w"^'v*A A A«V 9A * A A A ™ ™*A-A— ̂ -** *"A^* . V«>^
"" ^*A ^^^•-•"'-'•• '* >A XA'
B-Bj^M XA
"S«ss>-
.
--
0 x^~A"• AV •\XI\ / \ "
.V " "_
4, SILKING
120
110
100
E. 90UJ<? 80or° 70
ffi 6°
40
30
20
-
• ••••«••
4***fc*4*j--
--
1987• SLIGHTA MODERATE
k* SEVE -̂»'*»-
^Jx_ ,• A-A"^A^w-^ A^A— A^
•**'•-•-•-•••-
-
-
-
4, SILKING
130 145 160 175 190 205 220 235 250 '"130 145 160 175 190 205 220 235 25
DAY OF THE YEAR DAY OF THE YEAR
8580
7570
65
60
f 55~ 50
0 45
f 400- ,-0 35
£ 30°" 25
20
1510
5
0
j- J
h 2-\r -k
~^ -=.
I- 4
r -j;- -=:- -=L J
f- -Ir|-=-
=-1- 1
r i u i j I N
-:-=-=
i 1 ll 1 1 '=JM.i130 145 160 175 190 205 220 235 250
DAY OF THE YEAR
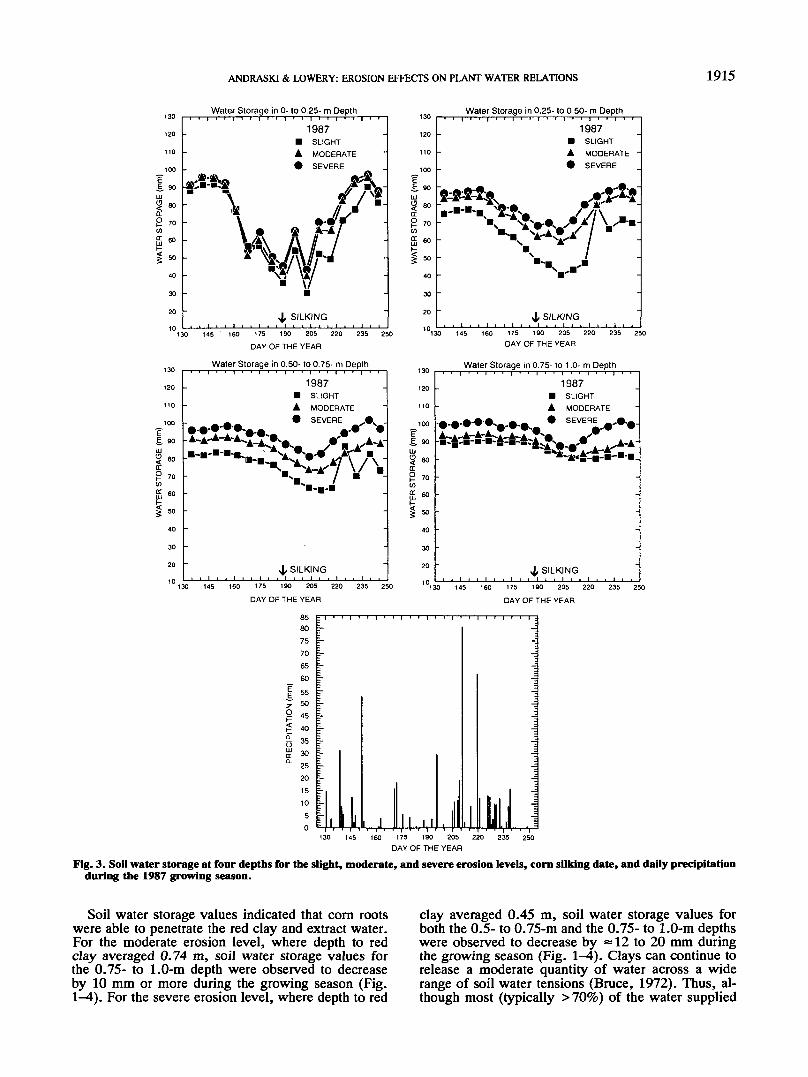
Fig. 3. Soil water storage at four depths for the slight, moderate, and severe erosion levels, corn silking date, and daily precipitationduring the 1987 growing season.
Soil water storage values indicated that com rootswere able to penetrate the red clay and extract water.For the moderate erosion level, where depth to redclay averaged 0.74 m, soil water storage values forthe 0.75- to 1.0-m depth were observed to decreaseby 10 mm or more during the growing season (Fig.1-4). For the severe erosion level, where depth to red
clay averaged 0.45 m, soil water storage values forboth the 0.5- to 0.75-m and the 0.75- to 1.0-m depthswere observed to decrease by =12 to 20 mm duringthe growing season (Fig. 1-4). Clays can continue torelease a moderate quantity of water across a widerange of soil water tensions (Bruce, 1972). Thus, al-though most (typically > 70%) of the water supplied
1916 SOIL SCI. SOC. AM. J., VOL. 56, NOVEMBER-DECEMBER 1992
130
120
110
100
E. 90111<? 80tre 70wCT enL1J bU
| 50
40
30
20
10
Water Storage in 0- to 0.25- m Depth
1988• SLIGHTA MODERATE• SEVERE
4< SILKING
Water Storage in 0.25- to 0.50- m DepthIOV
120
110
100?E. 90UJ|eo
0 70(/)
£ 60
rf
| 50
40
30
20
' 1 1 ' ' 1 ' ' 1
-
-
-
•-•.
r V*.- V•"
•
--
1 1 1 1 ' 1 1 1 1 1 i 1 1 i
1988• SLIGHTA MODERATE• SEVERE
-
>.£y*-^^_•-••-.4, SILKING
175 190 205 220
DAY OF THE YEAR
Water Storage in O.SO- to 0.75- m Depth
145 160 175 190 205 220 235 250
DAY OF THE YEAR
Water Storage in 0.75- to 1.0- m Depth
120
110
100
90
80
70
60
50
40
30
20
10 1.
1988• SLIGHTA MODERATE -• SEVERE
•'*"*-«,0
: "^^T :S*XB.
-
-
-
J, SILKING
0 145 160 175 190 205 220 235 2E
DAY OF THE YEAR
f 30 . | . . i . , i .
£ 25 j-
0 20 j-f- ^ :_
E 10 1-a 5 hCC :
TJU
120
110
100
£
LU
g 80
§ 7 0CO
£ 60
|50
40
30
20
o
i 1 1 1 1
J
1988• SLIGHT
A MODERATE -• SEVERE
*>A-A^**X
- '"^^ ;-
-
--
4, SILKING
0 145 160 175 190 205 220 235 25
DAY OF THE YEAR
i i 1 i i 1 i i 1 i i 1 .
4i ]
i . M130 145 160 175 190 205 220 235 250
DAY OF THE YEAR
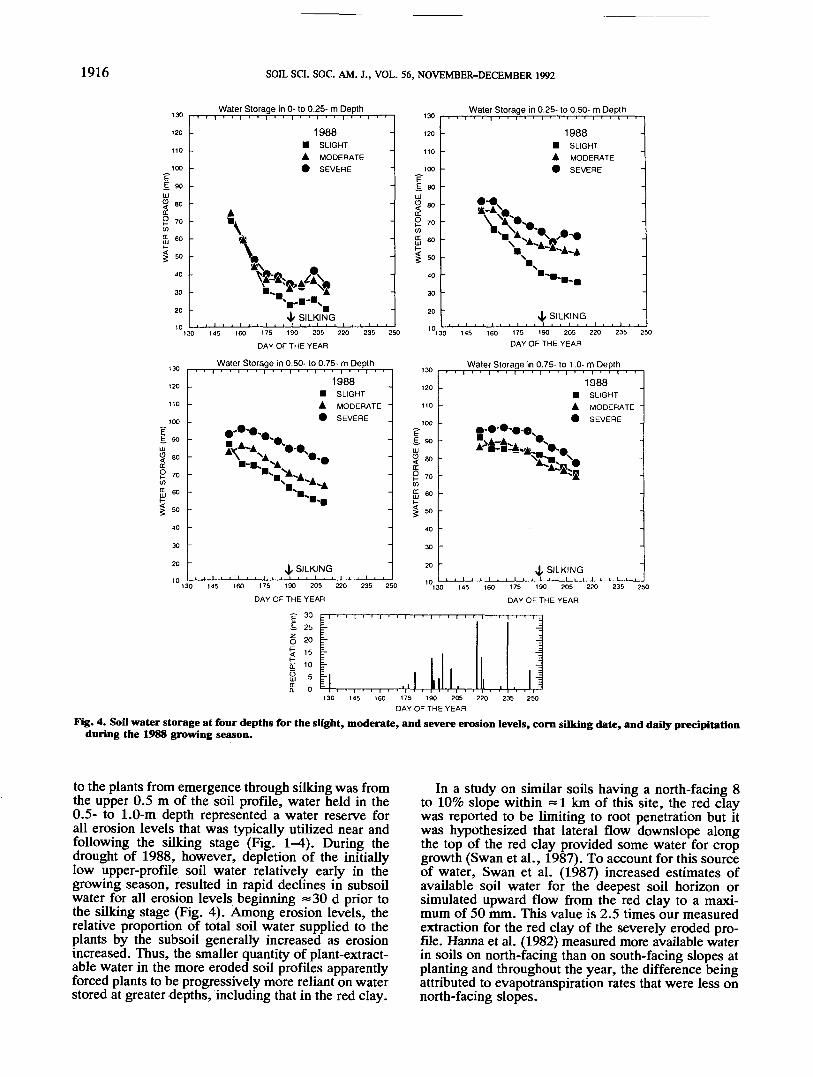
Fig. 4. Soil water storage at four depths for the slight, moderate, and severe erosion levels, corn silking date, and daily precipitationduring the 1988 growing season.
to the plants from emergence through silking was fromthe upper 0.5 m of the soil profile, water held in the0.5- to 1.0-m depth represented a water reserve forall erosion levels that was typically utilized near andfollowing the silking stage (Fig. 1-4). During thedrought of 1988, however, depletion of the initiallylow upper-profile soil water relatively early in thegrowing season, resulted in rapid declines in subsoilwater for all erosion levels beginning =30 d prior tothe silking stage (Fig. 4). Among erosion levels, therelative proportion of total soil water supplied to theplants by the subsoil generally increased as erosionincreased. Thus, the smaller quantity of plant-extract-able water in the more eroded soil profiles apparentlyforced plants to be progressively more reliant on waterstored at greater depths, including that in the red clay.
In a study on similar soils having a north-facing 8to 10% slope within ~ 1 km of this site, the red claywas reported to be limiting to root penetration but itwas hypothesized that lateral flow downslope alongthe top of the red clay provided some water for cropgrowth (Swan et al., 1987). To account for this sourceof water, Swan et al. (1987) increased estimates ofavailable soil water for the deepest soil horizon orsimulated upward flow from the red clay to a maxi-mum of 50 mm. This value is 2.5 times our measuredextraction for the red clay of the severely eroded pro-file. Hanna et al. (1982) measured more available waterin soils on north-facing than on south-facing slopes atplanting and throughout the year, the difference beingattributed to evapotranspiration rates that were less onnorth-facing slopes.
ANDRASKI & LOWERY: EROSION EFFECTS ON PLANT WATER RELATIONS 1917
A. B.
oiD 150
o. 100
1985• SLIGHT
A MODERATE• SEVERE
LSD0.10
SILKING
•g. 200
I-
Q] 150
1986 Jj=|• SLIGHT •/A MODERATE _/
4< SILKING130 140 150 160 170 180 190 200 210 220
DAY OF THE YEAR
C.
130 140 150 160 170 180 190 200 210 220
DAY OF THE YEAR
D.
Iom 15°ii-2
Q. 100
1987• SLIGHT
A MODERATE• SEVERE
LSD0.10
SILKING
1988• SLIGHTA MODERATE• SEVERE
LSD0.10
4, SILKING
140 150 160 170 180 190 200 210 220
DAY OF THE YEAR130 140 150 160 170 180 190 200 210 220
DAY OF THE YEAR
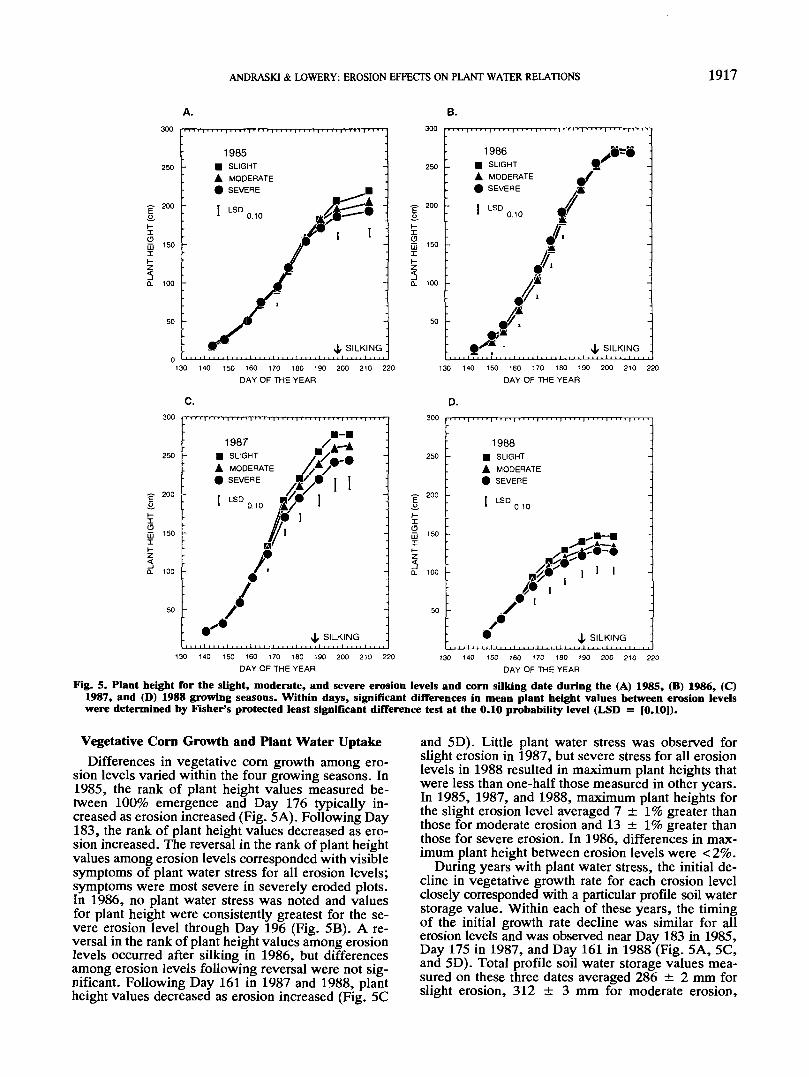
Fig. 5. Plant height for the slight, moderate, and severe erosion levels and corn silking date during the (A) 1985, (B) 1986, (C)1987, and (D) 1988 growing seasons. Within days, significant differences in mean plant height values between erosion levelswere determined by Fisher's protected least significant difference test at the 0.10 probability level (LSD = [0.10]).
Vegetative Corn Growth and Plant Water UptakeDifferences in vegetative corn growth among ero-
sion levels varied within the four growing seasons. In1985, the rank of plant height values measured be-tween 100% emergence and Day 176 typically in-creased as erosion increased (Fig. 5 A). Following Day183, the rank of plant height values decreased as ero-sion increased. The reversal in the rank of plant heightvalues among erosion levels corresponded with visiblesymptoms of plant water stress for all erosion levels;symptoms were most severe in severely eroded plots.In 1986, no plant water stress was noted and valuesfor plant height were consistently greatest for the se-vere erosion level through Day 196 (Fig. 5B). A re-versal in the rank of plant height values among erosionlevels occurred after silking in 1986, but differencesamong erosion levels following reversal were not sig-nificant. Following Day 161 in 1987 and 1988, plantheight values decreased as erosion increased (Fig. 5C
and 5D). Little plant water stress was observed forslight erosion in 1987, but severe stress for all erosionlevels in 1988 resulted in maximum plant heights thatwere less than one-half those measured in other years.In 1985, 1987, and 1988, maximum plant heights forthe slight erosion level averaged 7 ± 1% greater thanthose for moderate erosion and 13 ± 1% greater thanthose for severe erosion. In 1986, differences in max-imum plant height between erosion levels were <2%.
During years with plant water stress, the initial de-cline in vegetative growth rate for each erosion levelclosely corresponded with a particular profile soil waterstorage value. Within each of these years, the timingof the initial growth rate decline was similar for allerosion levels and was observed near Day 183 in 1985,Day 175 in 1987, and Day 161 in 1988 (Fig. 5A, 5C,and 5D). Total profile soil water storage values mea-sured on these three dates averaged 286 ± 2 mm forslight erosion, 312 ± 3 mm for moderate erosion,
1918 SOIL SCI. SOC. AM. J., VOL. 56, NOVEMBER-DECEMBER 1992
Table 3. Average evapotranspiration rates for the slight,moderate, and severe erosion levels for periods of lowprecipitation near corn silking stage during the 1985 through1988 growing seasons.!
Table 4. Harvest parameters for the slight, moderate, andsevere erosion levels for the 1985 through 1988 growingseasons.
Period of lowprecipitation
Duration TotalEvapotranspiration rate
Year Days of period precipitation Slight Moderate Severe
1985198619871988
176-205196-204175-189154-189
d2981435
9<0.31511
3.85.34.33.7
3.35.14.02.6
2.85.33.82.2
t Evapotranspiration rates were calculated for 7- to 8-d periods with £10mm precipitation using rain gage data and changes in soil water storagewith the assumptions of zero runoff and negligible deep percolation. Datesof 50% silking were: Day 198, 1985; Day 195, 1986; Day 188, 1987; andDay 189, 1988.
and 336 ± 4 mm for severe erosion. These averagewater storage values are 107, 98, and 88 mm greaterthan the lower limits of plant-extractable water esti-mated for the slight, moderate, and severe erosionlevels, respectively. Thus, for each erosion level, veg-etative growth appeared to be little affected by soilwater deficit until the quantity of plant-extractable waterremaining in the profile dropped to =55 to 60% oftotal. As plant-extractable water decreased below thislevel, the magnitude of the growth rate decline in-creased as erosion level increased.
Relative differences in growth rates among erosionlevels corresponded with differences in rates of plantwater uptake. Evapotranspiration rates observed dur-ing the three water-stress years (1985, 1987, and 1988)decreased as erosion increased (Table 3). Among years,the magnitude of the percentage differences in eva-potranspiration rates among erosion levels increasedas the duration of the low precipitation period in-creased. Thus, the greatest differences were observedin the drought year of 1988 when, relative to the slight-erosion level, average evapotranspiration rates were30% less for moderate erosion and 41% less for severeerosion. These results demonstrate the deleterious ef-fects erosion can have in reducing the capacity of thesoil to supply water at rates necessary to meet cropdemands. In 1986, plant-extractable water for eacherosion level did not drop below the 55 to 60% thresh-old value until after Day 196 (i.e., following silking),which resulted in similar evapotranspiration rates amongerosion levels and no observed plant water stress.
Harvest ParametersDifferences in grain yield among erosion levels var-
ied from year to year (Table 4). In 1985, the signifi-cance of differences among erosion levels was justoutside the critical region (P > F = 0.103). In 1986,grain yields for the slight and severe erosion levelswere greater than that for moderate erosion. In 1987,grain yield for slight erosion was significantly greaterthan that for severe erosion. For the drought year of1988, relatively large variability in grain yields withinerosion levels resulted in the lack of significant dif-ferences. Although differences between erosion levelsoften were not significant, grain-yield values for slighterosion ranked greatest in all 4 yr. For 2 (1987 and
Year
1985198619871988
1985198619871988
1985198619871988
1985198619871988
Slight
10.375a*ll.SSOa12.192a2.649a
28.0a22.6a20.9a12.9a
88.8a89.0a89.6a84.9a
5.897a6.686a7.651a2.666a
Moderate SevereGrain yield (Mg ha-')
9.402a 9.531a10.666b 11.462a11.598ab 11.175b2.459a 2.380a
Gram moisture (%)29.2a 29.1a21.2b 20.1b21.5a 20.8a12.5a 11.9a
Shelling percentage (%)88.3ab 87.6b89.1a 88.9a90. la 90.2a85.1a 83.9a
Stover yield (Mg ha-')5.837a 5.787a5.963a 6.852a6.317a 7.073a2.589a 2.270a
Significancelevel
P> Ft
0.1030.0380.0700.378
0.3400.0130.6350.381
0.0650.8560.2650.290
0.9420.3400.1920.452
Population at harvest (plants ha~' x 103)1985198619871988
64.4a65.7a72.9a63.3a
62.9a 66.6a66.8a 67.3a71.6a 70.0a65.1a 65.2a
0.1280.6410.2670.725
Barren plants (plants ha-1 x 10³)1985198619871988
1.8a1.9a1.3a
10.3a
4.1a 3.2a4.1a 1.8a1.3a 0.4a
10.4a 10.5a
0.5240.1720.3261.00
t Denotes probability that no significant differences exist within a row.t Row values that are followed by the same letter are not significantly
different at the 0.10 probability level, as determined by Fisher's leastsignificant difference test.
1988) of the 3 yr in which plant water stress wasobserved, the relative ranking of grain-yield valuesdecreased as erosion level increased. Letey and Peters(1957) showed that the effect of subsoil water on grainyields is critical in the latter part of the growing sea-son, even when adequate water may be available inthe upper profile. Had plants been unable to obtainwater from the red-clay subsoil during the reproduc-tive growth stage, any additive effects of erosion levelon grain yields may have been more pronounced.
Grain moisture content at harvest was significantlygreater for the slight erosion level than for moderateand severe erosion in 1986, but no consistent trendswere observed among erosion levels within years (Ta-ble 4). Shelling percentage was significantly greaterfor the slight erosion level compared with severe ero-sion in 1985 but, like grain moisture, no consistenttrends were observed among erosion levels within years(Table 4). Lack of consistent trends in grain moistureand shelling percentage indicated that observed dif-ferences in plant water stress among erosion levelswere not substantial enough to have a detectable effecton grain-yield components. Among years, however,severe plant water stress in 1988 did result in thesmallest grain yields, smallest grain moisture, andsmallest shelling percentage for all erosion levels (Ta-ble 4).
Stover yield, harvest population, and number of
ANDRASKI & LOWERY: EROSION EFFECTS ON PLANT WATER RELATIONS 1919
barren plants showed no significant differences amongerosion levels in any year (Table 4). Similar to theresults of Langdale et al. (1979), stover yields ap-peared to be less sensitive than grain yields to soilerosion. For two (1985 and 1988) of the three waterstress years, however, relative trends in stover yieldsdid follow those observed for maximum plant heightsand decreased as erosion level increased. The reasonfor the lack of consistency between 1987 trends instover yields and maximum plant heights is unclear.Extremely low rainfall in 1988 resulted in stover yieldsthat were less than one-half those of other years (Table4). Similar to results for grain-yield components, lackof any consistent trends in harvest populations andnumber of barren plants indicated that observed dif-ferences in plant water stress among erosion levelswere not substantial enough to have a detectable effecton these parameters. Severe plant water stress in 1988,however, did result in a relatively large number ofbarren plants for all erosion levels.
CONCLUSIONSAlthough the total quantity of water held in the soil
profile increased as erosion level increased, the slightlyeroded profile was potentially able to store »7 and14% more plant-extractable water than the moderatelyand severely eroded profiles, respectively. Most (typ-ically >70%) of the water supplied to the plants throughthe silking stage was from the upper 0.5 m of the soilprofile, but water retained in the 0.5- to 1.0-m depth,which included a red-clayey subsoil, represented a waterreserve for all erosion levels that was typically utilizednear and following the silking stage. Vegetative growthappeared to be little affected by soil water deficit untilthe quantity of plant-extractable water remaining inthe profile dropped to =55 to 60% of total. As ex-tractable water decreased below this level, rates ofplant water uptake were increasingly restricted by thecapacity of more eroded soil to supply water at ratesnecessary to meet crop demands and vegetative growthrates accordingly declined. For 2 of 3 yr with plantwater stress, a trend of decreasing grain yield withincreasing erosion level was observed, but differencesbetween erosion levels typically were not significant.Had the plants on the more eroded soils been unableto obtain water from the red-clayey subsoil, any ad-ditive effects of erosion level on grain yields might
have been more pronounced. Stover yields seemedless sensitive than grain yields to erosion level. Lackof any consistent trends in grain-yield components andharvest populations indicated that observed differ-ences in plant water stress among erosion levels werenot substantial enough to have a detectable effect onthese parameters.
ACKNOWLEDGMENTSThe authors gratefully acknowledge the following peo-
ple: Kerry Verrier for her invaluable assistance in process-ing much of the data into an interpretable form; Dr. KevinMcSweeney for assistance in delineating master horizonthicknesses within the study area; John Schuetze for fielddata collection in 1987; Dr. William Paulson and his as-sociates Dorland Cliff, Julian Lane, and Loyd Swenson fortheir assistance in establishment and maintenance of thefield site; John C. Stone and Steven Girouard for illustra-tions.