erc lep dashboard presentation birmingham october 9th 2014
TRANSCRIPT
Cluster Analysis and the LEP Growth Dashboard
ERC and GrowthAccelerator
LEP Presentation - Birmingham 9th October 2014
State of Small Business Britain
http://enterpriseresearch.ac.uk/home-8/report-back-state-small-business-britain-conference-2014/
Structure
• Background – developing policy context
• LEP Cluster Analysis
• LEP Growth Dashboard
• Discussion
Background
• BIS commissioned the Enterprise Research Centre (ERC) to undertake an analysis of industrial clusters in the UK – Anyadike-Danes et al (2013) “Localisation of Industrial Activity across England’s LEPs: 2008 & 2012”
• Local Enterprise Partnerships (LEPs) the sub-national spatial frame in England.
• ERC working with the BIS Local Growth team, the What Works Centre and Grant Thornton/Growth Accelerator to provide analysis on the LEPs and Growth Hubs.
Developing Policy Agenda around Growth
• LEP SEPs and ESIFs submitted and funding allocated
• Growth Hubs – initial pathfinders; Wave 2 Cities (Lancaster University RGF Programme)
• BIS - Simplifying the Local Business Support Landscape - a guide for Cities and LEPs – 3 pilots: EM3 LEP; Northamptonshire LEP; Sheffield City Region LEP
Clusters
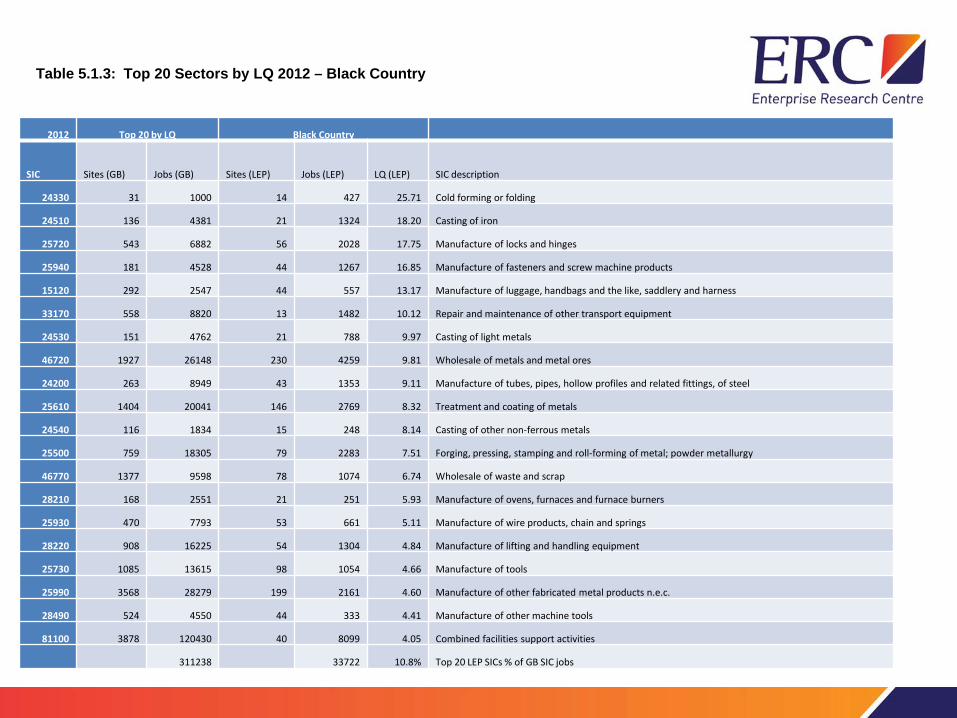
2012 Top 20 by LQ Black Country
SIC Sites (GB) Jobs (GB) Sites (LEP) Jobs (LEP) LQ (LEP) SIC description
24330 31 1000 14 427 25.71 Cold forming or folding
24510 136 4381 21 1324 18.20 Casting of iron
25720 543 6882 56 2028 17.75 Manufacture of locks and hinges
25940 181 4528 44 1267 16.85 Manufacture of fasteners and screw machine products
15120 292 2547 44 557 13.17 Manufacture of luggage, handbags and the like, saddlery and harness
33170 558 8820 13 1482 10.12 Repair and maintenance of other transport equipment
24530 151 4762 21 788 9.97 Casting of light metals
46720 1927 26148 230 4259 9.81 Wholesale of metals and metal ores
24200 263 8949 43 1353 9.11 Manufacture of tubes, pipes, hollow profiles and related fittings, of steel
25610 1404 20041 146 2769 8.32 Treatment and coating of metals
24540 116 1834 15 248 8.14 Casting of other non-ferrous metals
25500 759 18305 79 2283 7.51 Forging, pressing, stamping and roll-forming of metal; powder metallurgy
46770 1377 9598 78 1074 6.74 Wholesale of waste and scrap
28210 168 2551 21 251 5.93 Manufacture of ovens, furnaces and furnace burners
25930 470 7793 53 661 5.11 Manufacture of wire products, chain and springs
28220 908 16225 54 1304 4.84 Manufacture of lifting and handling equipment
25730 1085 13615 98 1054 4.66 Manufacture of tools
25990 3568 28279 199 2161 4.60 Manufacture of other fabricated metal products n.e.c.
28490 524 4550 44 333 4.41 Manufacture of other machine tools
81100 3878 120430 40 8099 4.05 Combined facilities support activities
311238 33722 10.8% Top 20 LEP SICs % of GB SIC jobs
Table 5.1.3: Top 20 Sectors by LQ 2012 – Black Country
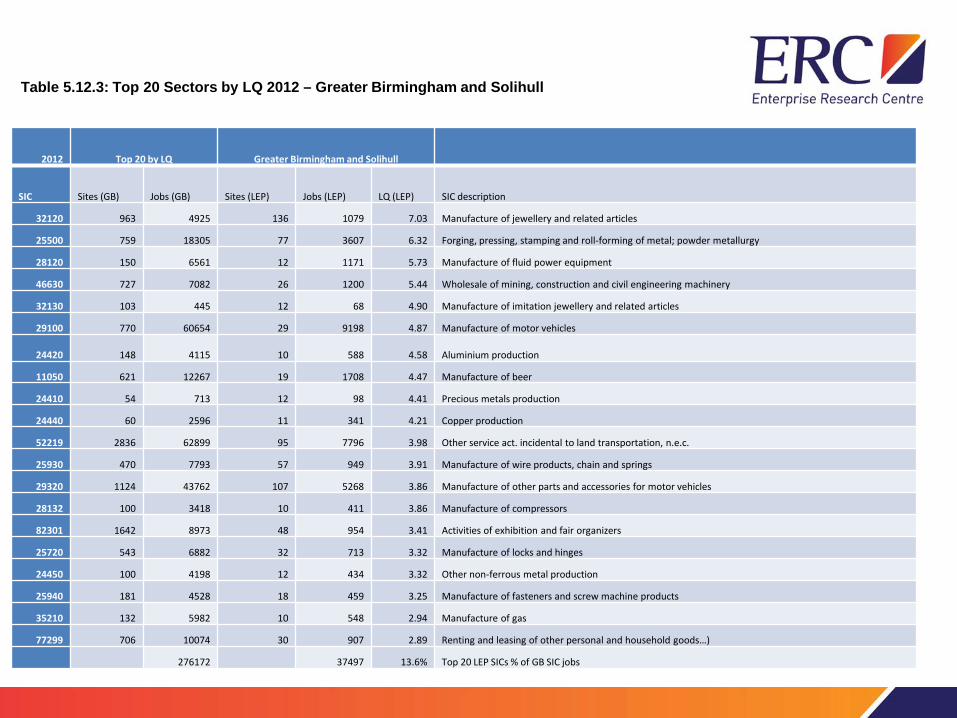
2012 Top 20 by LQ Greater Birmingham and Solihull
SIC Sites (GB) Jobs (GB) Sites (LEP) Jobs (LEP) LQ (LEP) SIC description
32120 963 4925 136 1079 7.03 Manufacture of jewellery and related articles
25500 759 18305 77 3607 6.32 Forging, pressing, stamping and roll-forming of metal; powder metallurgy
28120 150 6561 12 1171 5.73 Manufacture of fluid power equipment
46630 727 7082 26 1200 5.44 Wholesale of mining, construction and civil engineering machinery
32130 103 445 12 68 4.90 Manufacture of imitation jewellery and related articles
29100 770 60654 29 9198 4.87 Manufacture of motor vehicles
24420 148 4115 10 588 4.58 Aluminium production
11050 621 12267 19 1708 4.47 Manufacture of beer
24410 54 713 12 98 4.41 Precious metals production
24440 60 2596 11 341 4.21 Copper production
52219 2836 62899 95 7796 3.98 Other service act. incidental to land transportation, n.e.c.
25930 470 7793 57 949 3.91 Manufacture of wire products, chain and springs
29320 1124 43762 107 5268 3.86 Manufacture of other parts and accessories for motor vehicles
28132 100 3418 10 411 3.86 Manufacture of compressors
82301 1642 8973 48 954 3.41 Activities of exhibition and fair organizers
25720 543 6882 32 713 3.32 Manufacture of locks and hinges
24450 100 4198 12 434 3.32 Other non-ferrous metal production
25940 181 4528 18 459 3.25 Manufacture of fasteners and screw machine products
35210 132 5982 10 548 2.94 Manufacture of gas
77299 706 10074 30 907 2.89 Renting and leasing of other personal and household goods…)
276172 37497 13.6% Top 20 LEP SICs % of GB SIC jobs
Table 5.12.3: Top 20 Sectors by LQ 2012 – Greater Birmingham and Solihull
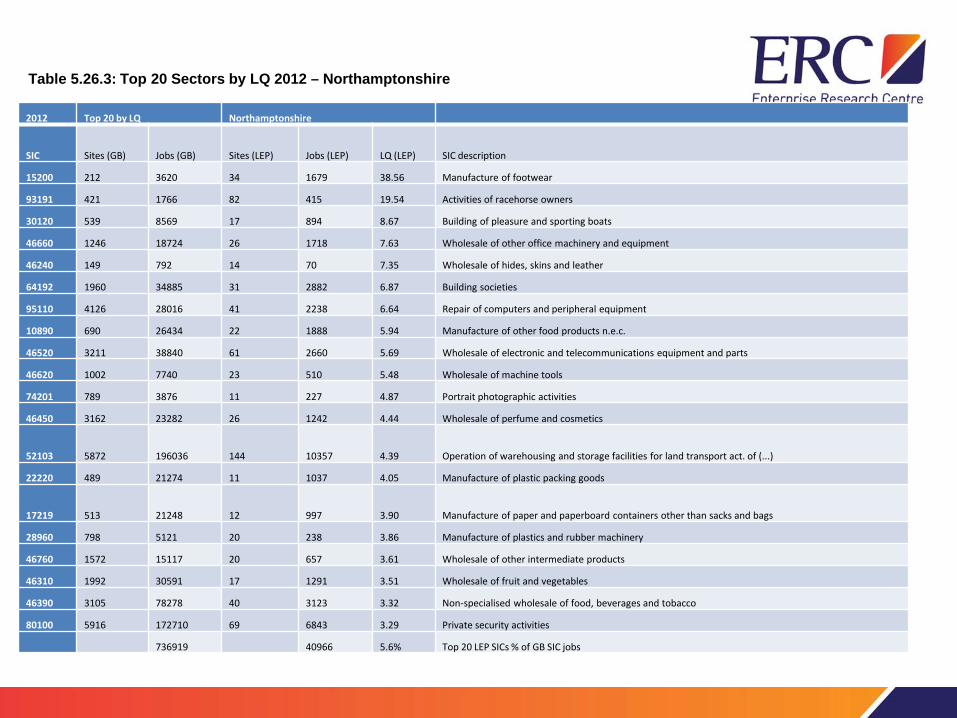
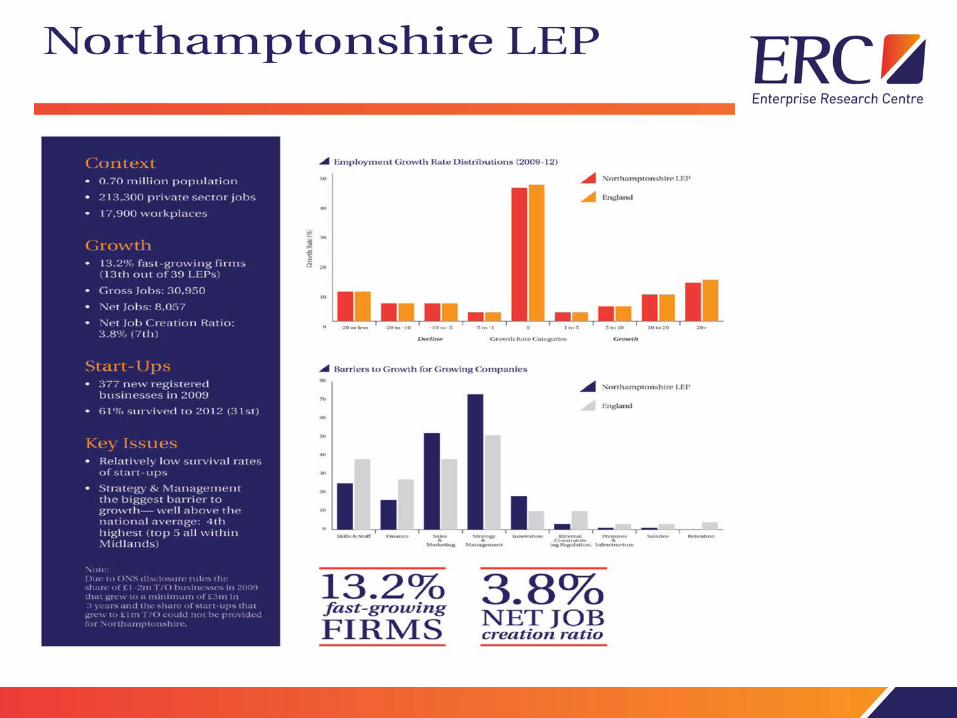
2012 Top 20 by LQ Northamptonshire
SIC Sites (GB) Jobs (GB) Sites (LEP) Jobs (LEP) LQ (LEP) SIC description
15200 212 3620 34 1679 38.56 Manufacture of footwear
93191 421 1766 82 415 19.54 Activities of racehorse owners
30120 539 8569 17 894 8.67 Building of pleasure and sporting boats
46660 1246 18724 26 1718 7.63 Wholesale of other office machinery and equipment
46240 149 792 14 70 7.35 Wholesale of hides, skins and leather
64192 1960 34885 31 2882 6.87 Building societies
95110 4126 28016 41 2238 6.64 Repair of computers and peripheral equipment
10890 690 26434 22 1888 5.94 Manufacture of other food products n.e.c.
46520 3211 38840 61 2660 5.69 Wholesale of electronic and telecommunications equipment and parts
46620 1002 7740 23 510 5.48 Wholesale of machine tools
74201 789 3876 11 227 4.87 Portrait photographic activities
46450 3162 23282 26 1242 4.44 Wholesale of perfume and cosmetics
52103 5872 196036 144 10357 4.39 Operation of warehousing and storage facilities for land transport act. of (...)
22220 489 21274 11 1037 4.05 Manufacture of plastic packing goods
17219 513 21248 12 997 3.90 Manufacture of paper and paperboard containers other than sacks and bags
28960 798 5121 20 238 3.86 Manufacture of plastics and rubber machinery
46760 1572 15117 20 657 3.61 Wholesale of other intermediate products
46310 1992 30591 17 1291 3.51 Wholesale of fruit and vegetables
46390 3105 78278 40 3123 3.32 Non-specialised wholesale of food, beverages and tobacco
80100 5916 172710 69 6843 3.29 Private security activities
736919 40966 5.6% Top 20 LEP SICs % of GB SIC jobs
Table 5.26.3: Top 20 Sectors by LQ 2012 – Northamptonshire
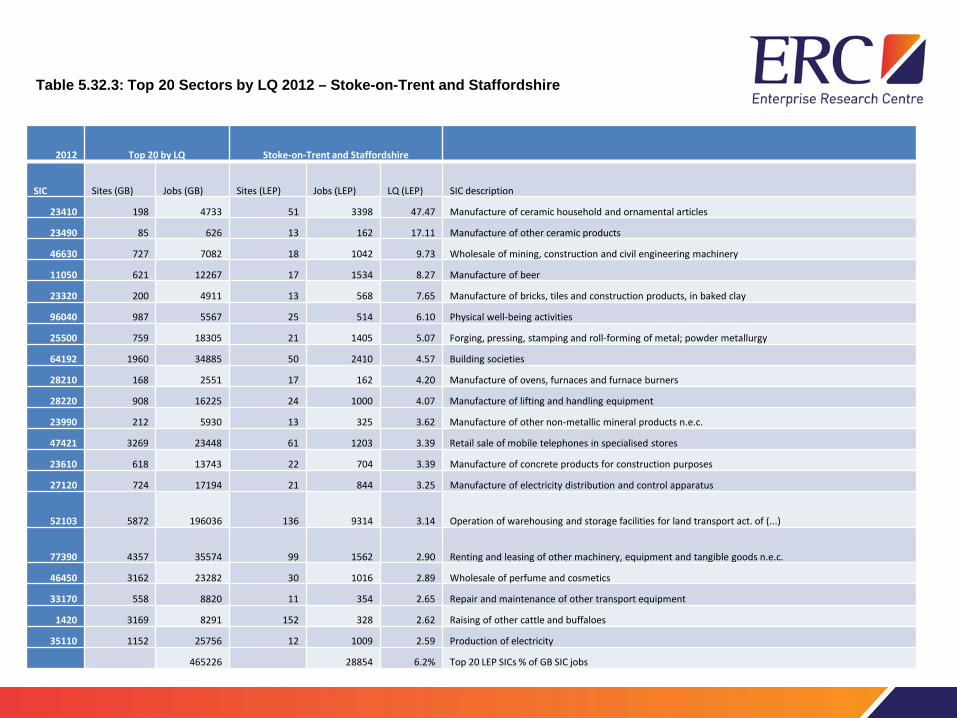
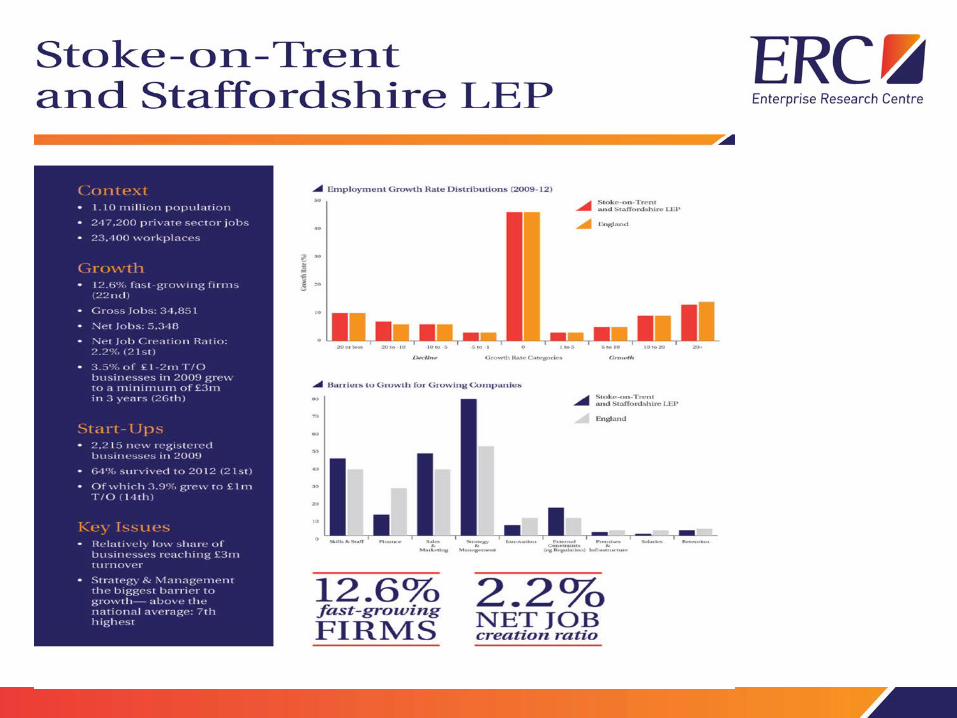
2012 Top 20 by LQ Stoke-on-Trent and Staffordshire
SIC Sites (GB) Jobs (GB) Sites (LEP) Jobs (LEP) LQ (LEP) SIC description
23410 198 4733 51 3398 47.47 Manufacture of ceramic household and ornamental articles
23490 85 626 13 162 17.11 Manufacture of other ceramic products
46630 727 7082 18 1042 9.73 Wholesale of mining, construction and civil engineering machinery
11050 621 12267 17 1534 8.27 Manufacture of beer
23320 200 4911 13 568 7.65 Manufacture of bricks, tiles and construction products, in baked clay
96040 987 5567 25 514 6.10 Physical well-being activities
25500 759 18305 21 1405 5.07 Forging, pressing, stamping and roll-forming of metal; powder metallurgy
64192 1960 34885 50 2410 4.57 Building societies
28210 168 2551 17 162 4.20 Manufacture of ovens, furnaces and furnace burners
28220 908 16225 24 1000 4.07 Manufacture of lifting and handling equipment
23990 212 5930 13 325 3.62 Manufacture of other non-metallic mineral products n.e.c.
47421 3269 23448 61 1203 3.39 Retail sale of mobile telephones in specialised stores
23610 618 13743 22 704 3.39 Manufacture of concrete products for construction purposes
27120 724 17194 21 844 3.25 Manufacture of electricity distribution and control apparatus
52103 5872 196036 136 9314 3.14 Operation of warehousing and storage facilities for land transport act. of (...)
77390 4357 35574 99 1562 2.90 Renting and leasing of other machinery, equipment and tangible goods n.e.c.
46450 3162 23282 30 1016 2.89 Wholesale of perfume and cosmetics
33170 558 8820 11 354 2.65 Repair and maintenance of other transport equipment
1420 3169 8291 152 328 2.62 Raising of other cattle and buffaloes
35110 1152 25756 12 1009 2.59 Production of electricity
465226 28854 6.2% Top 20 LEP SICs % of GB SIC jobs
Table 5.32.3: Top 20 Sectors by LQ 2012 – Stoke-on-Trent and Staffordshire
Industrial Sectors Analysis • Witty Review sought to examine ways in which universities
can support economic growth working in conjunction with organisations such as Local Enterprise Partnerships (LEPs).
• Two main hypotheses: – strongest basis for regional economic growth is based on a
comprehensive understanding of a locality’s comparative economic advantage;
– much of the UK’s comparative economic advantage could be derived from its universities and research in fields relevant to the Industrial Strategy sectors and technologies.
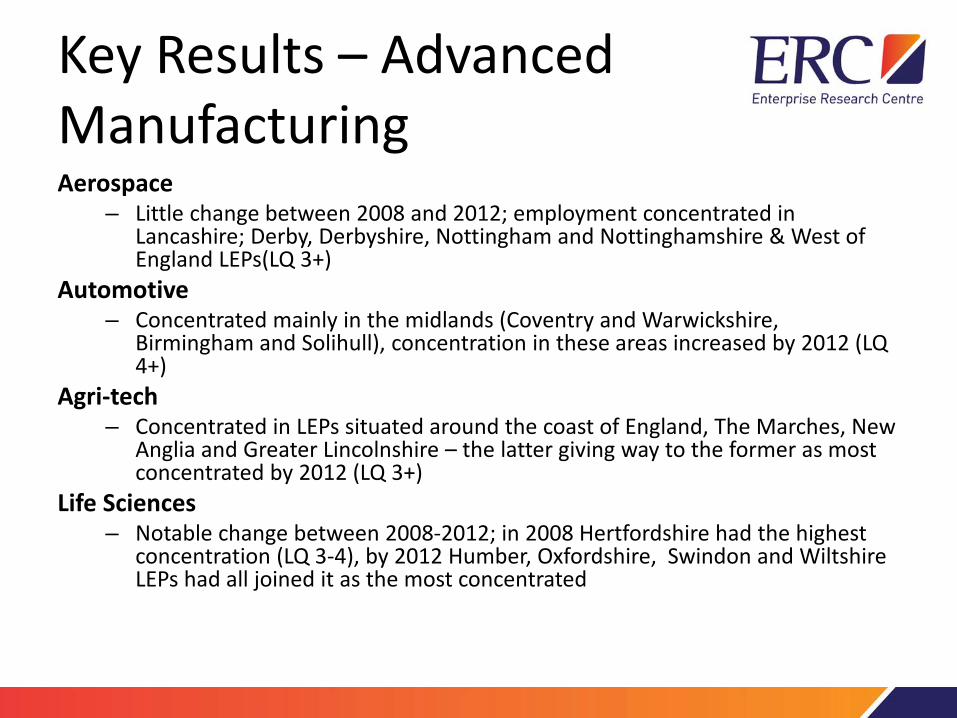
Key Results – Advanced Manufacturing Aerospace
– Little change between 2008 and 2012; employment concentrated in Lancashire; Derby, Derbyshire, Nottingham and Nottinghamshire & West of England LEPs(LQ 3+)
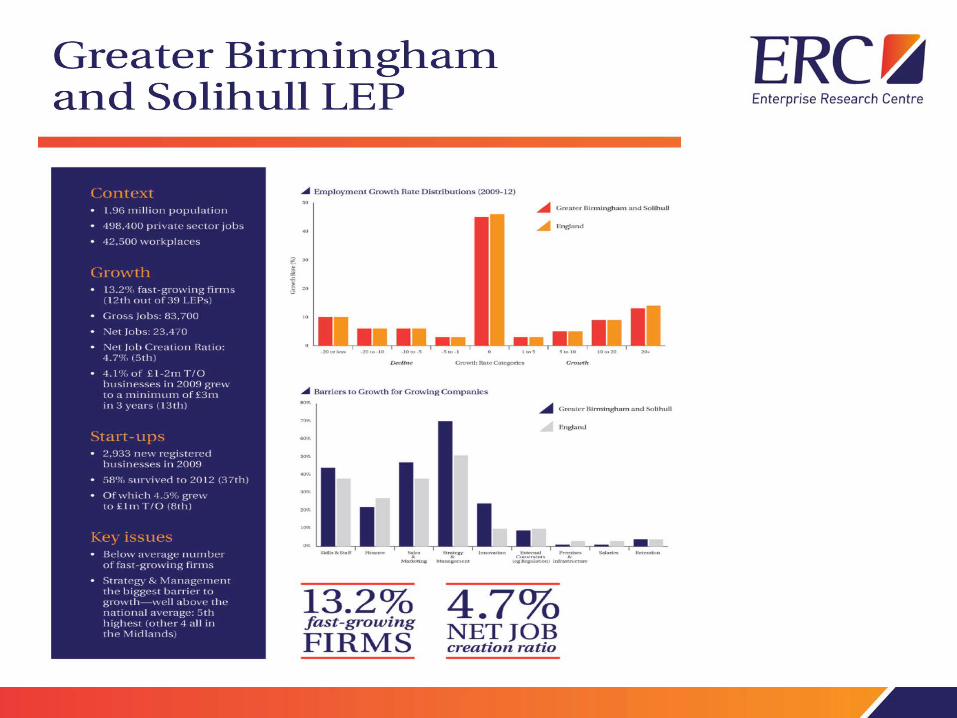
Automotive – Concentrated mainly in the midlands (Coventry and Warwickshire,
Birmingham and Solihull), concentration in these areas increased by 2012 (LQ 4+)
Agri-tech – Concentrated in LEPs situated around the coast of England, The Marches, New
Anglia and Greater Lincolnshire – the latter giving way to the former as most concentrated by 2012 (LQ 3+)
Life Sciences – Notable change between 2008-2012; in 2008 Hertfordshire had the highest
concentration (LQ 3-4), by 2012 Humber, Oxfordshire, Swindon and Wiltshire LEPs had all joined it as the most concentrated
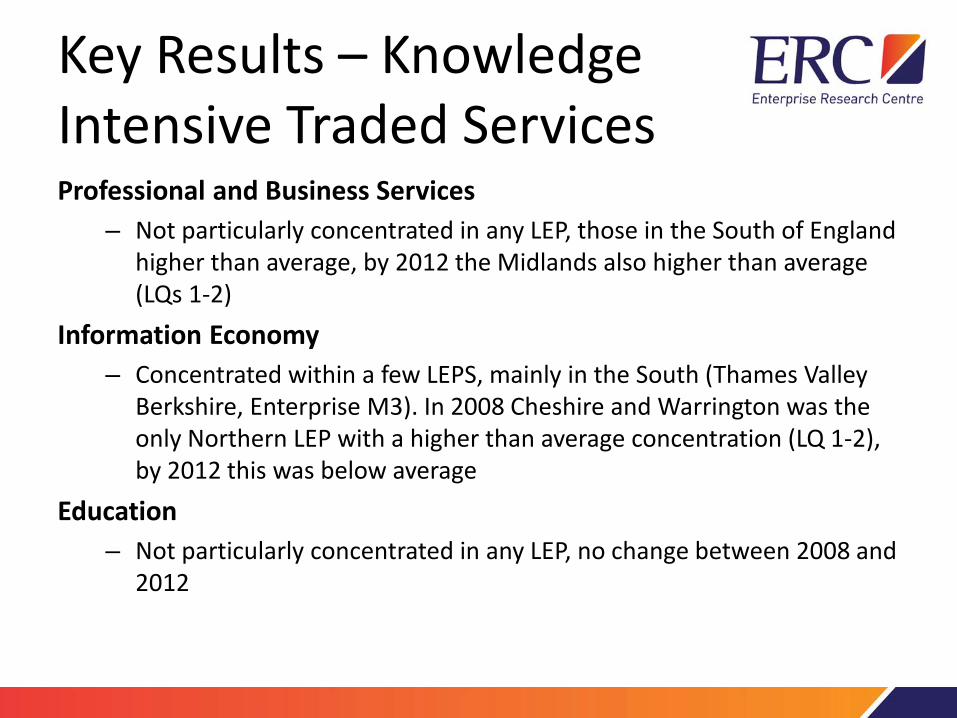
Key Results – Knowledge Intensive Traded Services Professional and Business Services
– Not particularly concentrated in any LEP, those in the South of England higher than average, by 2012 the Midlands also higher than average (LQs 1-2)
Information Economy – Concentrated within a few LEPS, mainly in the South (Thames Valley
Berkshire, Enterprise M3). In 2008 Cheshire and Warrington was the only Northern LEP with a higher than average concentration (LQ 1-2), by 2012 this was below average
Education – Not particularly concentrated in any LEP, no change between 2008 and
2012
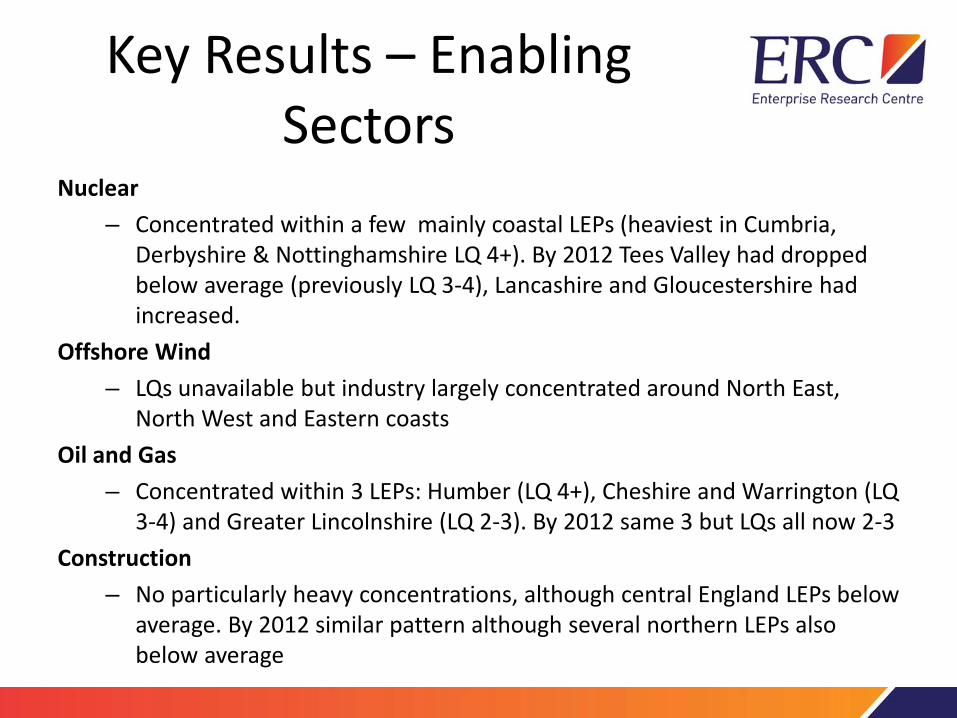
Key Results – Enabling Sectors
Nuclear – Concentrated within a few mainly coastal LEPs (heaviest in Cumbria,
Derbyshire & Nottinghamshire LQ 4+). By 2012 Tees Valley had dropped below average (previously LQ 3-4), Lancashire and Gloucestershire had increased.
Offshore Wind – LQs unavailable but industry largely concentrated around North East,
North West and Eastern coasts Oil and Gas
– Concentrated within 3 LEPs: Humber (LQ 4+), Cheshire and Warrington (LQ 3-4) and Greater Lincolnshire (LQ 2-3). By 2012 same 3 but LQs all now 2-3
Construction – No particularly heavy concentrations, although central England LEPs below
average. By 2012 similar pattern although several northern LEPs also below average

UK Industrial Sectors - Summary • Overall, few changes between 2008-2012 • Increase in Life Sciences amongst Oxfordshire, Swindon and
Wiltshire and Humber LEPs • Majority of industry concentrated largely where it has been
historically: – Heavy advanced manufacturing concentrated in the
midlands area – Information and Professional Services skewed towards
Southern areas – Enabling sectors situated in Northern coastal areas
LEP Growth Dashboard
Joint venture between ERC and GrowthAccelerator
What is it?
• Its purpose is to provide each LEP with a set of simple metrics on the growth of existing firms and start-ups in the LEP area.
• Set alongside the key barriers to growth flagged by businesses
who are seeking to grow and have become a participant in the GrowthAccelerator programme.
• The Dashboard, based primarily on ONS data, can be used as
a source of evidence to inform discussions on priorities in business support and includes easily understood metrics which can be readily updated on an annual basis.
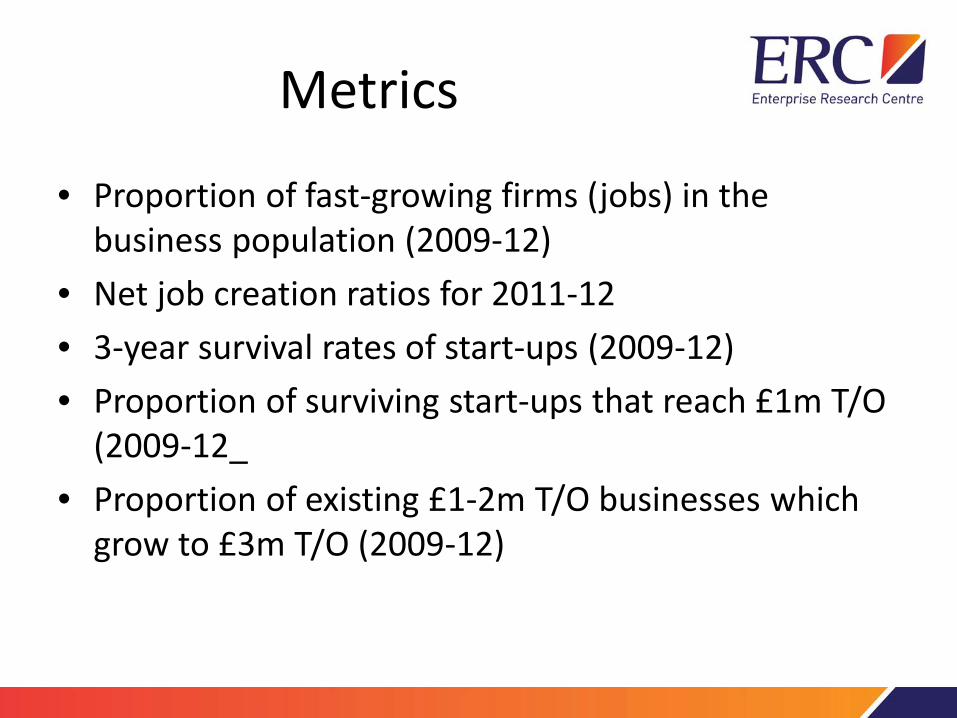
Metrics
• Proportion of fast-growing firms (jobs) in the business population (2009-12)
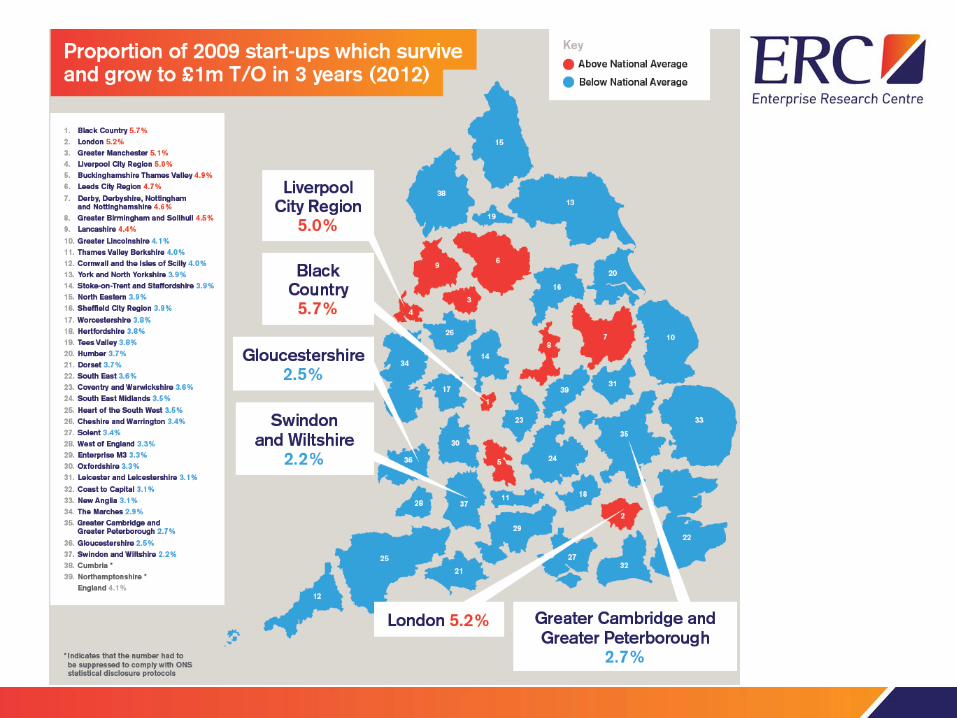
• Net job creation ratios for 2011-12 • 3-year survival rates of start-ups (2009-12) • Proportion of surviving start-ups that reach £1m T/O
(2009-12_ • Proportion of existing £1-2m T/O businesses which
grow to £3m T/O (2009-12)
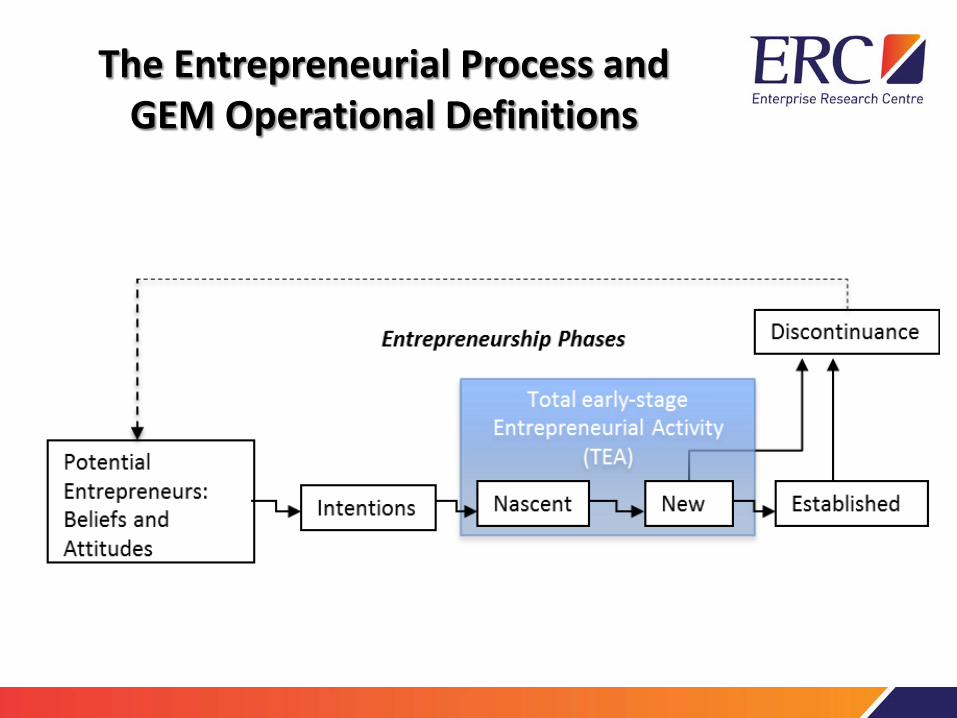
The Entrepreneurial Process and GEM Operational Definitions
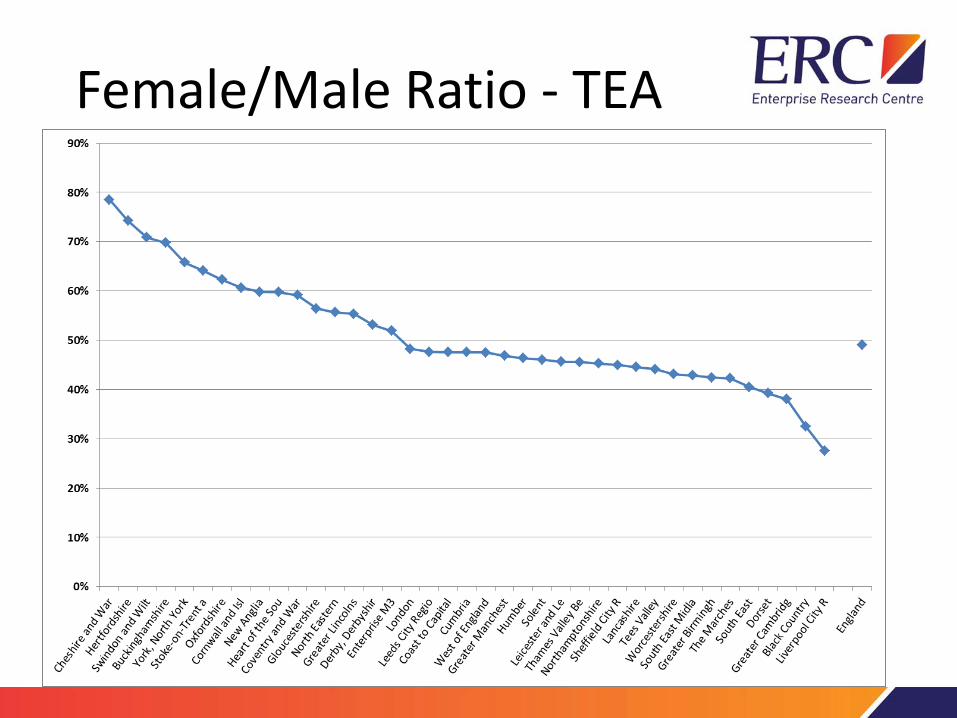
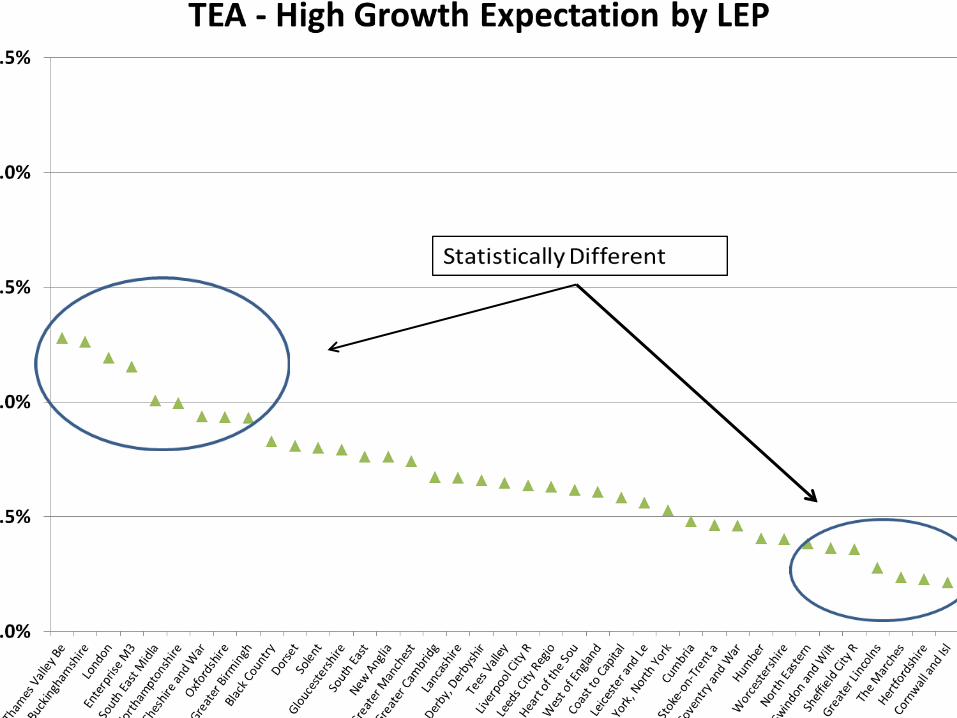
Female/Male Ratio - TEA
Summary
• Clusters: connecting cluster analysis to policy – the art of the possible? - there is no simple 'read-through' from a ‘cluster’ identified by high LQs to a strategy.
• LEP Dashboard: a complex LEP geography which provides a challenge to some of the preconceptions held about the ‘hotspots’ of growth across England while confirming others.
Discussion
• Building a robust evidence base for effective policy design – how can ERC assist
• Connecting metrics to LEP strategy and policy
initiatives? • What other metrics would be useful?
Contact us:
If you would like any more information about the ERC and any of its activities please contact the Theme Lead, Mark Hart at [email protected]
More details about the activities of the ERC and our latest events can be
found at: www.enterpriseresearch.ac.uk