equity market liberalization in emerging markets · equity market liberalization in emerging...
TRANSCRIPT
Equity Market Liberalization in EmergingMarketsGeert Bekaert, Campbell R. Harvey, and Christian T. Lundblad
JULY/AUGUST 2003 53
One of the most important national policydecisions of the past 25 years has been thefinancial liberalization of equity markets
across the world. Equity market liberalizationsgive foreign investors the opportunity to invest indomestic equity securities and domestic investorsthe right to transact in foreign equity securities.
It is important to distinguish between the con-cepts of liberalization and integration. For example,a country might pass a law that seemingly dropsall barriers to foreign participation in local capitalmarkets. This is a liberalization—but it might notbe an effective liberalization that results in marketintegration. Indeed, there are two possibilities inthis example. First, the market might have beenintegrated before the regulatory liberalization. Thatis, foreigners might have had the ability to accessthe market through other means, such as countryfunds and depository receipts. Second, the liberal-ization might have little or no effect because eitherforeign investors do not believe the regulatoryreforms will be long lasting or other market imper-fections exist.
Liberalizations must be dated to be studied, butpinpointing specific dates is difficult because coun-tries have pursued varied liberalization strategies.Our paper begins by analyzing the progress that hasbeen made on dating liberalizations. We examineregulatory changes, the ability of investors to accessthe local market via proxies such as country funds,and the behavior of foreign portfolio holdings.
If liberalization is effective, it leads to marketintegration, which has a fundamental impact on
both the financial and real sectors of developingcountries. Our paper also summarizes some recentresearch on the impact of liberalization on the realsector.
FINANCIAL LIBERALIZATION
Official Equity Market Liberalization
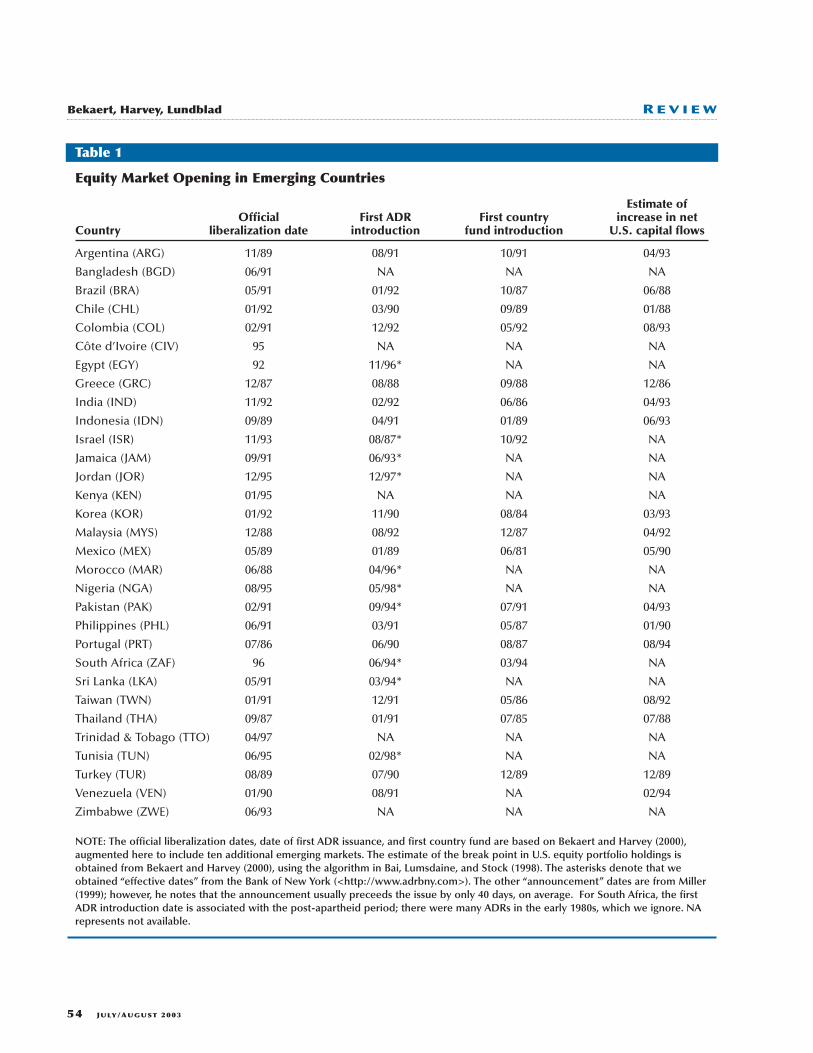
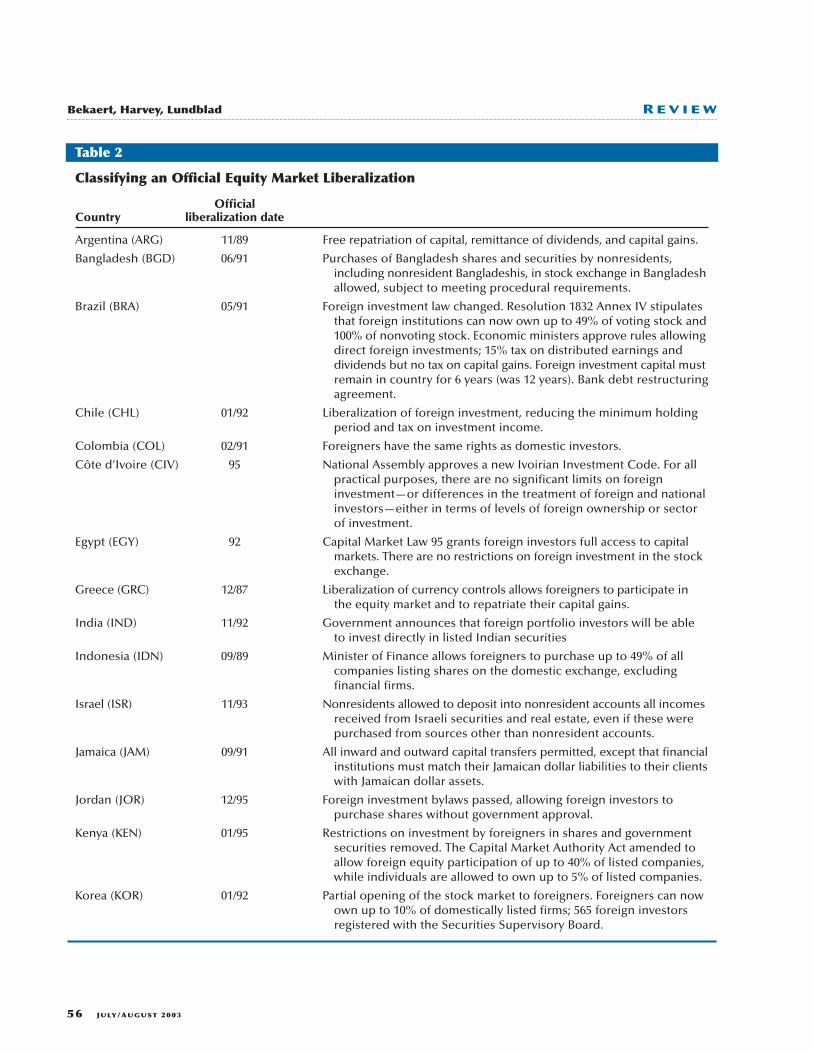
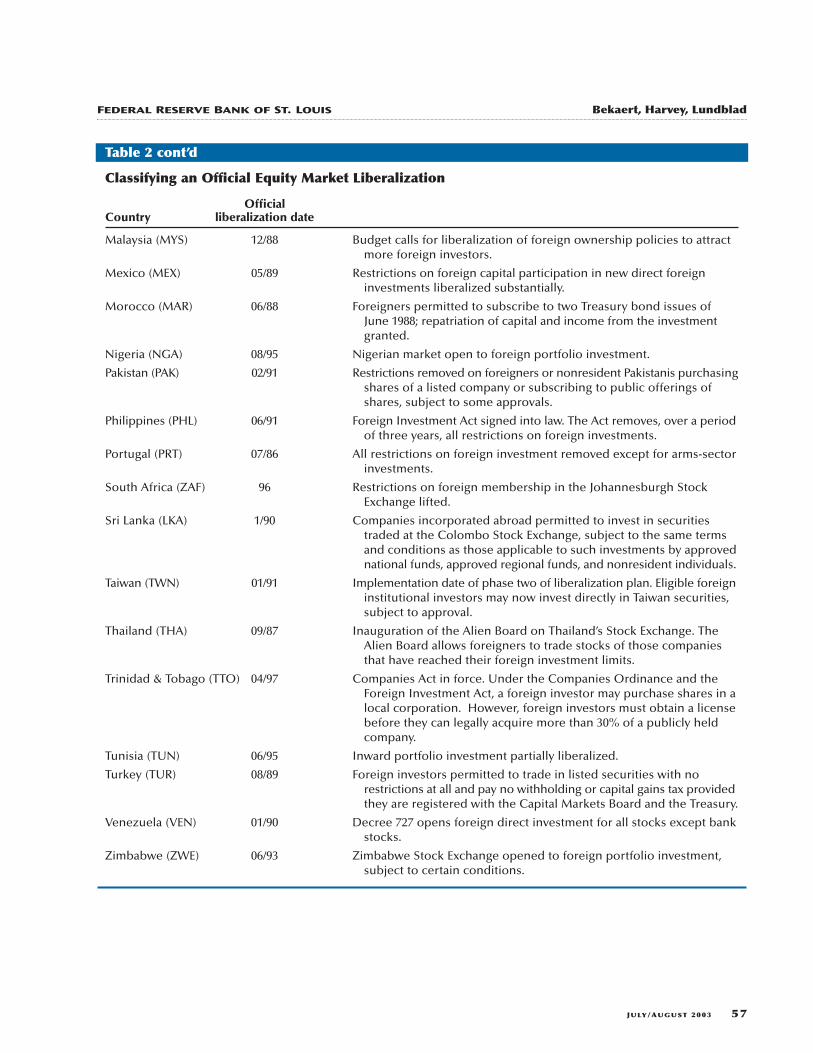
As a start, Bekaert and Harvey (2000) (BH) pro-vide a detailed examination of the key economicevents that could potentially impact the financialliberalization and reform process in a large numberof emerging countries.1 Further, to explore theeffects of foreign access to domestic equity markets,BH date an “official equity market liberalization” foreach country—that is, a date of formal regulatorychange giving foreign investors the opportunity toinvest in domestic equity securities and domesticinvestors the right to transact in foreign equity secu-rities. For example, Brazil rewrote its foreign invest-ment law in May 1991. Resolution 1832 Annex IVstipulated that foreign institutions can own up to49 percent of voting stock and 100 percent of non-voting stock. Similarly, January 1992 signified apartial opening of the Korean stock market to for-eigners, after which foreign investors could own upto 10 percent of domestically listed firms. In Table 1,we present the BH official liberalization dates for30 emerging equity markets. As can be observed,many liberalizations are clustered in the late 1980sor early 1990s. Based upon the chronologies pre-sented in BH, Table 2 provides a more detailed analy-sis describing the particular regulatory changes thatoccurred at the BH official liberalization date. Gener-ally, as in the examples provided above, thesereforms involved (for the first time) the removal ofrestrictions on foreigners holding domestic equities.Further, these dates generally correspond to theliberalization dates provided by the InternationalFinance Corporation (IFC); however, there are other“equity market liberalization” dates provided in thisliterature which, employing somewhat different
1 Detailed BH chronologies for each of the emerging market countriespresented here are available in the country risk analysis at <http://www.duke.edu/~charvey/Country_risk/couindex.htm>.
Geert Bekaert is the L. Cooperman Professor of Finance andEconomics at the Graduate School of Business, Columbia University,and a research associate at the National Bureau of Economic Research.Campbell R. Harvey is the J. Paul Sticht Professor of InternationalBusiness at the Fuqua School of Business, Duke University, and aresearch associate at the National Bureau of Economic Research.Christian T. Lundblad is an assistant professor of finance at the KelleySchool of Business, Indiana University. The authors thank Xin Huangfor excellent research support and Peter Henry and the participantsof the Federal Reserve Bank of St. Louis’s 27th Annual EconomicPolicy Conference, “Finance and Real Economic Activity,” for helpfulcomments.
© 2003, The Southern and Southwestern Finance Association. Thisarticle is forthcoming in the Journal of Financial Research.
54 JULY/AUGUST 2003
Bekaert, Harvey, Lundblad R E V I E W
Equity Market Opening in Emerging Countries
Estimate of Official First ADR First country increase in net
Country liberalization date introduction fund introduction U.S. capital flows
Argentina (ARG) 11/89 08/91 10/91 04/93
Bangladesh (BGD) 06/91 NA NA NA
Brazil (BRA) 05/91 01/92 10/87 06/88
Chile (CHL) 01/92 03/90 09/89 01/88
Colombia (COL) 02/91 12/92 05/92 08/93
Côte d’Ivoire (CIV) 95 NA NA NA
Egypt (EGY) 92 11/96* NA NA
Greece (GRC) 12/87 08/88 09/88 12/86
India (IND) 11/92 02/92 06/86 04/93
Indonesia (IDN) 09/89 04/91 01/89 06/93
Israel (ISR) 11/93 08/87* 10/92 NA
Jamaica (JAM) 09/91 06/93* NA NA
Jordan (JOR) 12/95 12/97* NA NA
Kenya (KEN) 01/95 NA NA NA
Korea (KOR) 01/92 11/90 08/84 03/93
Malaysia (MYS) 12/88 08/92 12/87 04/92
Mexico (MEX) 05/89 01/89 06/81 05/90
Morocco (MAR) 06/88 04/96* NA NA
Nigeria (NGA) 08/95 05/98* NA NA
Pakistan (PAK) 02/91 09/94* 07/91 04/93
Philippines (PHL) 06/91 03/91 05/87 01/90
Portugal (PRT) 07/86 06/90 08/87 08/94
South Africa (ZAF) 96 06/94* 03/94 NA
Sri Lanka (LKA) 05/91 03/94* NA NA
Taiwan (TWN) 01/91 12/91 05/86 08/92
Thailand (THA) 09/87 01/91 07/85 07/88
Trinidad & Tobago (TTO) 04/97 NA NA NA
Tunisia (TUN) 06/95 02/98* NA NA
Turkey (TUR) 08/89 07/90 12/89 12/89
Venezuela (VEN) 01/90 08/91 NA 02/94
Zimbabwe (ZWE) 06/93 NA NA NA
NOTE: The official liberalization dates, date of first ADR issuance, and first country fund are based on Bekaert and Harvey (2000),augmented here to include ten additional emerging markets. The estimate of the break point in U.S. equity portfolio holdings isobtained from Bekaert and Harvey (2000), using the algorithm in Bai, Lumsdaine, and Stock (1998). The asterisks denote that weobtained “effective dates” from the Bank of New York (<http://www.adrbny.com>). The other “announcement” dates are from Miller(1999); however, he notes that the announcement usually preceeds the issue by only 40 days, on average. For South Africa, the firstADR introduction date is associated with the post-apartheid period; there were many ADRs in the early 1980s, which we ignore. NArepresents not available.
Table 1
criteria, do differ significantly from those providedby BH for certain countries (see Henry, 2000a, Kimand Singal, 2000, and Levine and Zervos, 1998b).
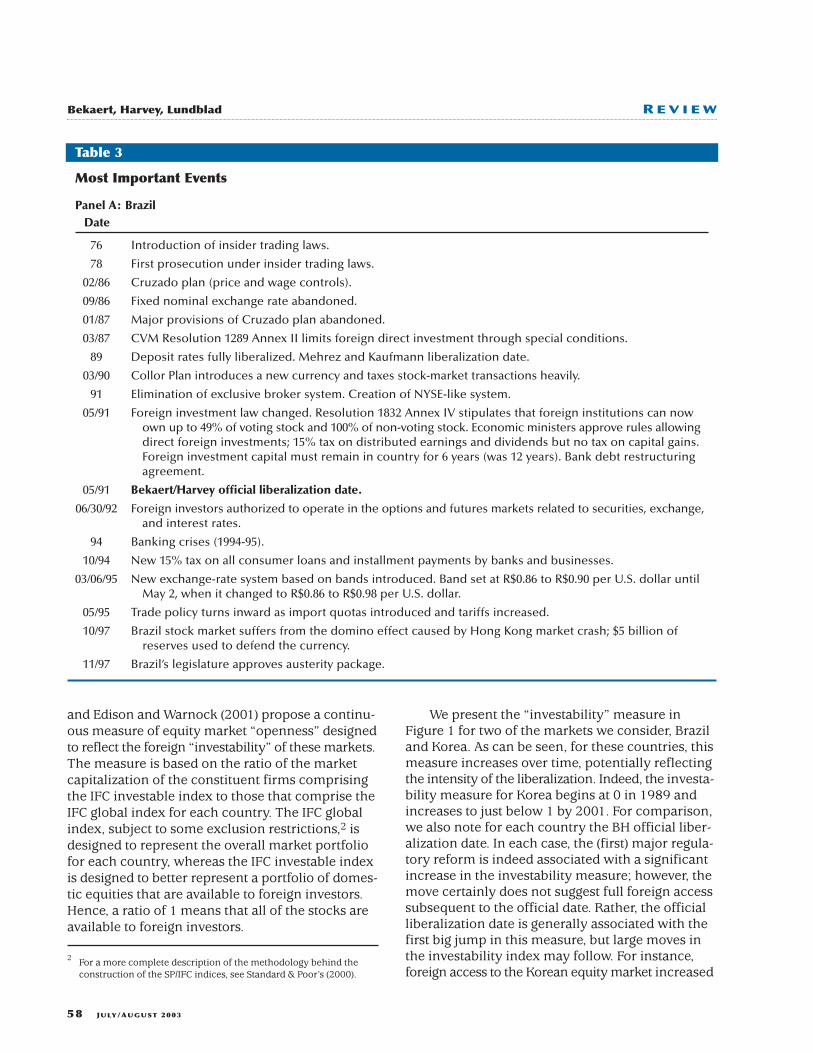
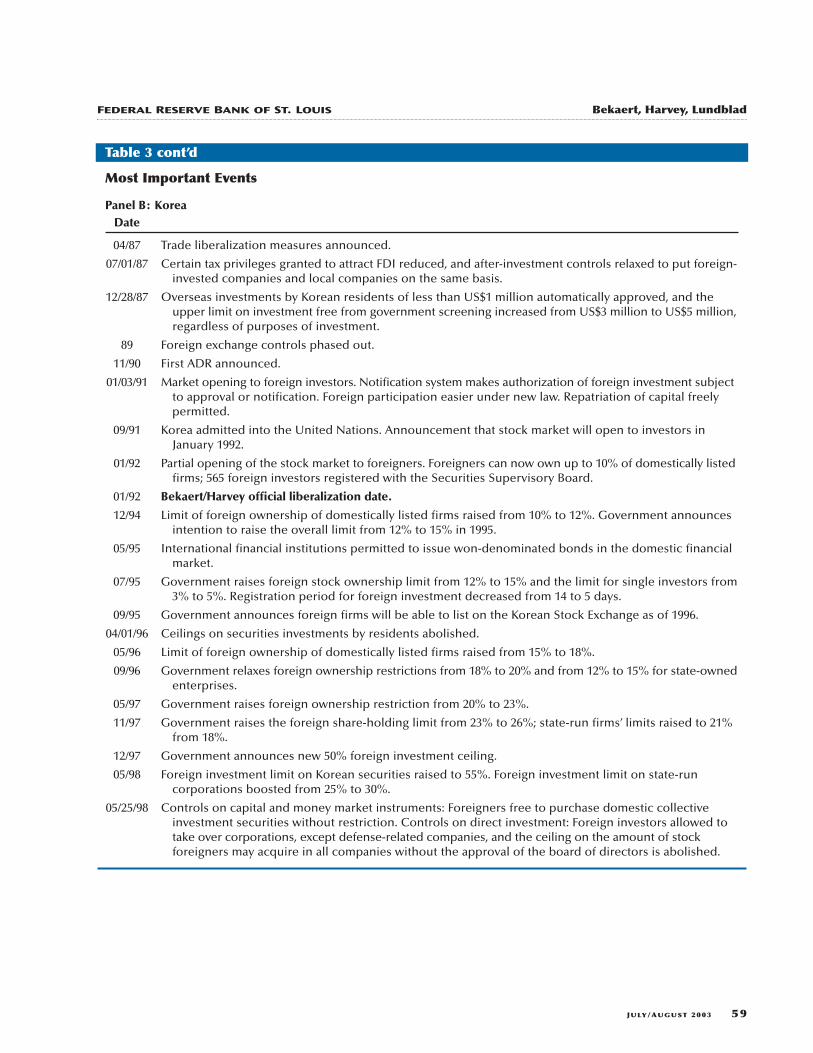
To illustrate the difficulty associated with datingmarket integration, Table 3 presents chronologiesof major economic events for two countries, Braziland Korea. For example, over the 20-year periodpresented, Brazil (shown in panel A) introducedinsider trading laws, undertook macroeconomicreforms, employed several different exchange rateregimes, and gradually allowed increased foreigndirect and portfolio investment. Additionally, theseevents were not one-directional, as exchange rateand trade restrictions were reintroduced over thereform time-line. Taken together, this multifacetedreform effort makes the dating of economic andfinancial integration a matter of judgment, particu-larly as this and previous work are interested inisolating the financial and economic effects of anequity market liberalization (see Bekaert, Harvey,and Lundblad, 2001 and 2002). Further, Brazil is byno means unique or unusual; in panel B, we displaythe comparable chronology for Korea, which exhibitsthe same challenging features. For example, Koreawas admitted into the United Nations and initiateda political rapprochement with the DemocraticPeople’s Republic of Korea in 1991, the same yearto which BH ascribe the equity market liberalization.This complete series of events makes the analysissomewhat challenging. Unfortunately, the simul-taneity of macroeconomic, political, and financialreform is not the only factor potentially confoundingan examination of a single reform’s key economiceffects. In practice, there are additional factors thatmay cloud the importance of the particular regula-tory changes that BH (and others) document. First,it is possible that the investment restrictions werenot binding prior to the reform. Second, the officialregulatory changes permitting foreign investmentare often implemented gradually. For instance, ascan be observed in Table 3, the restrictions foreign-ers faced when investing in Korean securities werelifted only gradually throughout the 1990s. Hence,dating the “official liberalization” is not unambigu-ous. Third, although countries might undertakeofficial regulatory reform efforts, foreign investorsmay still face significant liquidity costs; Chuhan(1994), for example, reports that market participantsin many industrialized countries mentioned liquidityconcerns as one of the major impediments to invest-ing in emerging markets.
Alternative Entry: Country Funds andAmerican Depository Receipts
Another challenge when dating an equity marketliberalization is that many of these emerging marketswere already indirectly open to foreign investmentprior to official reform by way of country funds andAmerican depository receipts (ADRs). A closed-endcountry fund is an investment company that investsin a portfolio of assets in a foreign country but issuesa fixed number of shares domestically. Closed-endmutual funds were the original vehicles for foreigninvestment in emerging financial markets. For exam-ple, the Korea Fund partially opened up the Koreanequity market to foreign investors in 1984, longbefore the capital market liberalizations of 1991. Incontrast, ADRs are rights to foreign shares that tradein dollars on a U.S. exchange or over the counter.Further, since ADRs are treated as U.S. securities inmost legal situations, they enable mutual funds,pension funds, and other U.S. institutions to holdsecurities that are fungible with foreign shares.Table 1 details the earliest country fund and ADRintroduction for the emerging markets in our sample.
The Intensity of Liberalization
Market integration is usually a gradual process,and the speed of the process is determined by theparticular situation in each individual country. Whenone starts from the segmented state, the barriers toinvestment are often numerous. Bekaert (1995)details three different categories of barriers to emerg-ing market investment: (i) legal barriers; (ii) indirectbarriers that arise because of information asymmetry,accounting standards, and investor protection; and(iii) risks that are especially important in emergingmarkets such as liquidity, political, economic policy,and currency risk. These barriers discourage foreigninvestment, and it is unlikely that any/all of thesebarriers disappear at a single point in time. Sincereform is usually a gradual process, the usual 0/1indicators variables are perhaps too coarse, failingto capture the intensity or comprehensiveness ofthe liberalization.
Empirical models have been developed thatallow the degree of market integration to changethrough time (see Bekaert and Harvey, 1995). Thismoves us away from the static segmented/integratedparadigm to a dynamic partial segmentation/partialintegration setting. Whereas these models are indi-rect, relying on a model and econometric estimationto infer changes in the degree of integration, thereare more direct measures available. Bekaert (1995)
JULY/AUGUST 2003 55
FEDERAL RESERVE BANK OF ST. LOUIS Bekaert, Harvey, Lundblad
56 JULY/AUGUST 2003
Bekaert, Harvey, Lundblad R E V I E W
Classifying an Official Equity Market Liberalization
Official Country liberalization date
Argentina (ARG) 11/89 Free repatriation of capital, remittance of dividends, and capital gains.
Bangladesh (BGD) 06/91 Purchases of Bangladesh shares and securities by nonresidents, including nonresident Bangladeshis, in stock exchange in Bangladeshallowed, subject to meeting procedural requirements.
Brazil (BRA) 05/91 Foreign investment law changed. Resolution 1832 Annex IV stipulates that foreign institutions can now own up to 49% of voting stock and100% of nonvoting stock. Economic ministers approve rules allowingdirect foreign investments; 15% tax on distributed earnings anddividends but no tax on capital gains. Foreign investment capital mustremain in country for 6 years (was 12 years). Bank debt restructuringagreement.
Chile (CHL) 01/92 Liberalization of foreign investment, reducing the minimum holding period and tax on investment income.
Colombia (COL) 02/91 Foreigners have the same rights as domestic investors.
Côte d’Ivoire (CIV) 95 National Assembly approves a new Ivoirian Investment Code. For all practical purposes, there are no significant limits on foreigninvestment—or differences in the treatment of foreign and national investors—either in terms of levels of foreign ownership or sector of investment.
Egypt (EGY) 92 Capital Market Law 95 grants foreign investors full access to capital markets. There are no restrictions on foreign investment in the stock exchange.
Greece (GRC) 12/87 Liberalization of currency controls allows foreigners to participate in the equity market and to repatriate their capital gains.
India (IND) 11/92 Government announces that foreign portfolio investors will be able to invest directly in listed Indian securities
Indonesia (IDN) 09/89 Minister of Finance allows foreigners to purchase up to 49% of all companies listing shares on the domestic exchange, excluding financial firms.
Israel (ISR) 11/93 Nonresidents allowed to deposit into nonresident accounts all incomes received from Israeli securities and real estate, even if these were purchased from sources other than nonresident accounts.
Jamaica (JAM) 09/91 All inward and outward capital transfers permitted, except that financialinstitutions must match their Jamaican dollar liabilities to their clientswith Jamaican dollar assets.
Jordan (JOR) 12/95 Foreign investment bylaws passed, allowing foreign investors to purchase shares without government approval.
Kenya (KEN) 01/95 Restrictions on investment by foreigners in shares and government securities removed. The Capital Market Authority Act amended to allow foreign equity participation of up to 40% of listed companies, while individuals are allowed to own up to 5% of listed companies.
Korea (KOR) 01/92 Partial opening of the stock market to foreigners. Foreigners can now own up to 10% of domestically listed firms; 565 foreign investors registered with the Securities Supervisory Board.
Table 2
JULY/AUGUST 2003 57
FEDERAL RESERVE BANK OF ST. LOUIS Bekaert, Harvey, Lundblad
Classifying an Official Equity Market Liberalization
Official Country liberalization date
Malaysia (MYS) 12/88 Budget calls for liberalization of foreign ownership policies to attract more foreign investors.
Mexico (MEX) 05/89 Restrictions on foreign capital participation in new direct foreign investments liberalized substantially.
Morocco (MAR) 06/88 Foreigners permitted to subscribe to two Treasury bond issues of June 1988; repatriation of capital and income from the investment granted.
Nigeria (NGA) 08/95 Nigerian market open to foreign portfolio investment.
Pakistan (PAK) 02/91 Restrictions removed on foreigners or nonresident Pakistanis purchasingshares of a listed company or subscribing to public offerings of shares, subject to some approvals.
Philippines (PHL) 06/91 Foreign Investment Act signed into law. The Act removes, over a periodof three years, all restrictions on foreign investments.
Portugal (PRT) 07/86 All restrictions on foreign investment removed except for arms-sectorinvestments.
South Africa (ZAF) 96 Restrictions on foreign membership in the Johannesburgh Stock Exchange lifted.
Sri Lanka (LKA) 1/90 Companies incorporated abroad permitted to invest in securities traded at the Colombo Stock Exchange, subject to the same terms and conditions as those applicable to such investments by approvednational funds, approved regional funds, and nonresident individuals.
Taiwan (TWN) 01/91 Implementation date of phase two of liberalization plan. Eligible foreigninstitutional investors may now invest directly in Taiwan securities, subject to approval.
Thailand (THA) 09/87 Inauguration of the Alien Board on Thailand’s Stock Exchange. The Alien Board allows foreigners to trade stocks of those companies that have reached their foreign investment limits.
Trinidad & Tobago (TTO) 04/97 Companies Act in force. Under the Companies Ordinance and the Foreign Investment Act, a foreign investor may purchase shares in alocal corporation. However, foreign investors must obtain a licensebefore they can legally acquire more than 30% of a publicly held company.
Tunisia (TUN) 06/95 Inward portfolio investment partially liberalized.
Turkey (TUR) 08/89 Foreign investors permitted to trade in listed securities with no restrictions at all and pay no withholding or capital gains tax provided they are registered with the Capital Markets Board and the Treasury.
Venezuela (VEN) 01/90 Decree 727 opens foreign direct investment for all stocks except bankstocks.
Zimbabwe (ZWE) 06/93 Zimbabwe Stock Exchange opened to foreign portfolio investment, subject to certain conditions.
Table 2 cont’d
and Edison and Warnock (2001) propose a continu-ous measure of equity market “openness” designedto reflect the foreign “investability” of these markets.The measure is based on the ratio of the marketcapitalization of the constituent firms comprisingthe IFC investable index to those that comprise theIFC global index for each country. The IFC globalindex, subject to some exclusion restrictions,2 isdesigned to represent the overall market portfoliofor each country, whereas the IFC investable indexis designed to better represent a portfolio of domes-tic equities that are available to foreign investors.Hence, a ratio of 1 means that all of the stocks areavailable to foreign investors.
We present the “investability” measure inFigure 1 for two of the markets we consider, Braziland Korea. As can be seen, for these countries, thismeasure increases over time, potentially reflectingthe intensity of the liberalization. Indeed, the investa-bility measure for Korea begins at 0 in 1989 andincreases to just below 1 by 2001. For comparison,we also note for each country the BH official liber-alization date. In each case, the (first) major regula-tory reform is indeed associated with a significantincrease in the investability measure; however, themove certainly does not suggest full foreign accesssubsequent to the official date. Rather, the officialliberalization date is generally associated with thefirst big jump in this measure, but large moves inthe investability index may follow. For instance,foreign access to the Korean equity market increased
58 JULY/AUGUST 2003
Bekaert, Harvey, Lundblad R E V I E W
Most Important Events
Panel A: BrazilDate
76 Introduction of insider trading laws.
78 First prosecution under insider trading laws.
02/86 Cruzado plan (price and wage controls).
09/86 Fixed nominal exchange rate abandoned.
01/87 Major provisions of Cruzado plan abandoned.
03/87 CVM Resolution 1289 Annex II limits foreign direct investment through special conditions.
89 Deposit rates fully liberalized. Mehrez and Kaufmann liberalization date.
03/90 Collor Plan introduces a new currency and taxes stock-market transactions heavily.
91 Elimination of exclusive broker system. Creation of NYSE-like system.
05/91 Foreign investment law changed. Resolution 1832 Annex IV stipulates that foreign institutions can now own up to 49% of voting stock and 100% of non-voting stock. Economic ministers approve rules allowing direct foreign investments; 15% tax on distributed earnings and dividends but no tax on capital gains. Foreign investment capital must remain in country for 6 years (was 12 years). Bank debt restructuring agreement.
05/91 Bekaert/Harvey official liberalization date.
06/30/92 Foreign investors authorized to operate in the options and futures markets related to securities, exchange, and interest rates.
94 Banking crises (1994-95).
10/94 New 15% tax on all consumer loans and installment payments by banks and businesses.
03/06/95 New exchange-rate system based on bands introduced. Band set at R$0.86 to R$0.90 per U.S. dollar until May 2, when it changed to R$0.86 to R$0.98 per U.S. dollar.
05/95 Trade policy turns inward as import quotas introduced and tariffs increased.
10/97 Brazil stock market suffers from the domino effect caused by Hong Kong market crash; $5 billion of reserves used to defend the currency.
11/97 Brazil’s legislature approves austerity package.
Table 3
2 For a more complete description of the methodology behind theconstruction of the SP/IFC indices, see Standard & Poor’s (2000).
JULY/AUGUST 2003 59
FEDERAL RESERVE BANK OF ST. LOUIS Bekaert, Harvey, Lundblad
Most Important Events
Panel B: KoreaDate
04/87 Trade liberalization measures announced.
07/01/87 Certain tax privileges granted to attract FDI reduced, and after-investment controls relaxed to put foreign-invested companies and local companies on the same basis.
12/28/87 Overseas investments by Korean residents of less than US$1 million automatically approved, and the upper limit on investment free from government screening increased from US$3 million to US$5 million,regardless of purposes of investment.
89 Foreign exchange controls phased out.
11/90 First ADR announced.
01/03/91 Market opening to foreign investors. Notification system makes authorization of foreign investment subject to approval or notification. Foreign participation easier under new law. Repatriation of capital freely permitted.
09/91 Korea admitted into the United Nations. Announcement that stock market will open to investors in January 1992.
01/92 Partial opening of the stock market to foreigners. Foreigners can now own up to 10% of domestically listedfirms; 565 foreign investors registered with the Securities Supervisory Board.
01/92 Bekaert/Harvey official liberalization date.
12/94 Limit of foreign ownership of domestically listed firms raised from 10% to 12%. Government announces intention to raise the overall limit from 12% to 15% in 1995.
05/95 International financial institutions permitted to issue won-denominated bonds in the domestic financial market.
07/95 Government raises foreign stock ownership limit from 12% to 15% and the limit for single investors from3% to 5%. Registration period for foreign investment decreased from 14 to 5 days.
09/95 Government announces foreign firms will be able to list on the Korean Stock Exchange as of 1996.
04/01/96 Ceilings on securities investments by residents abolished.
05/96 Limit of foreign ownership of domestically listed firms raised from 15% to 18%.
09/96 Government relaxes foreign ownership restrictions from 18% to 20% and from 12% to 15% for state-ownedenterprises.
05/97 Government raises foreign ownership restriction from 20% to 23%.
11/97 Government raises the foreign share-holding limit from 23% to 26%; state-run firms’ limits raised to 21% from 18%.
12/97 Government announces new 50% foreign investment ceiling.
05/98 Foreign investment limit on Korean securities raised to 55%. Foreign investment limit on state-runcorporations boosted from 25% to 30%.
05/25/98 Controls on capital and money market instruments: Foreigners free to purchase domestic collective investment securities without restriction. Controls on direct investment: Foreign investors allowed to take over corporations, except defense-related companies, and the ceiling on the amount of stockforeigners may acquire in all companies without the approval of the board of directors is abolished.
Table 3 cont’d
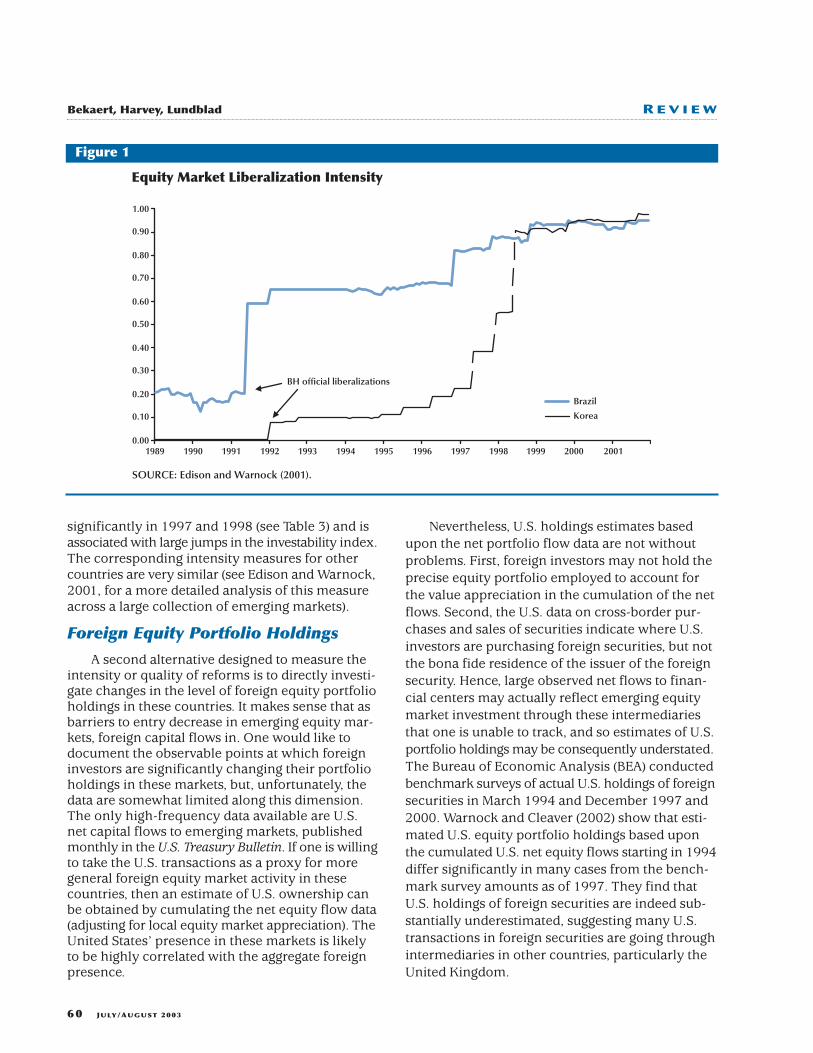
significantly in 1997 and 1998 (see Table 3) and isassociated with large jumps in the investability index.The corresponding intensity measures for othercountries are very similar (see Edison and Warnock,2001, for a more detailed analysis of this measureacross a large collection of emerging markets).
Foreign Equity Portfolio Holdings
A second alternative designed to measure theintensity or quality of reforms is to directly investi-gate changes in the level of foreign equity portfolioholdings in these countries. It makes sense that asbarriers to entry decrease in emerging equity mar-kets, foreign capital flows in. One would like todocument the observable points at which foreigninvestors are significantly changing their portfolioholdings in these markets, but, unfortunately, thedata are somewhat limited along this dimension.The only high-frequency data available are U.S.net capital flows to emerging markets, publishedmonthly in the U.S. Treasury Bulletin. If one is willingto take the U.S. transactions as a proxy for moregeneral foreign equity market activity in thesecountries, then an estimate of U.S. ownership canbe obtained by cumulating the net equity flow data(adjusting for local equity market appreciation). TheUnited States’ presence in these markets is likelyto be highly correlated with the aggregate foreignpresence.
Nevertheless, U.S. holdings estimates basedupon the net portfolio flow data are not withoutproblems. First, foreign investors may not hold theprecise equity portfolio employed to account forthe value appreciation in the cumulation of the netflows. Second, the U.S. data on cross-border pur-chases and sales of securities indicate where U.S.investors are purchasing foreign securities, but notthe bona fide residence of the issuer of the foreignsecurity. Hence, large observed net flows to finan-cial centers may actually reflect emerging equitymarket investment through these intermediariesthat one is unable to track, and so estimates of U.S.portfolio holdings may be consequently understated.The Bureau of Economic Analysis (BEA) conductedbenchmark surveys of actual U.S. holdings of foreignsecurities in March 1994 and December 1997 and2000. Warnock and Cleaver (2002) show that esti-mated U.S. equity portfolio holdings based uponthe cumulated U.S. net equity flows starting in 1994differ significantly in many cases from the bench-mark survey amounts as of 1997. They find thatU.S. holdings of foreign securities are indeed sub-stantially underestimated, suggesting many U.S.transactions in foreign securities are going throughintermediaries in other countries, particularly theUnited Kingdom.
60 JULY/AUGUST 2003
Bekaert, Harvey, Lundblad R E V I E W
Equity Market Liberalization Intensity
0.00
0.10
0.20
0.30
0.40
0.50
0.60
0.70
0.80
0.90
1.00
Brazil
BH official liberalizations
SOURCE: Edison and Warnock (2001).
1989 1990 1991 1992 1993 1994 1995 1996 1997 1998 1999 2000 2001
Korea
Figure 1
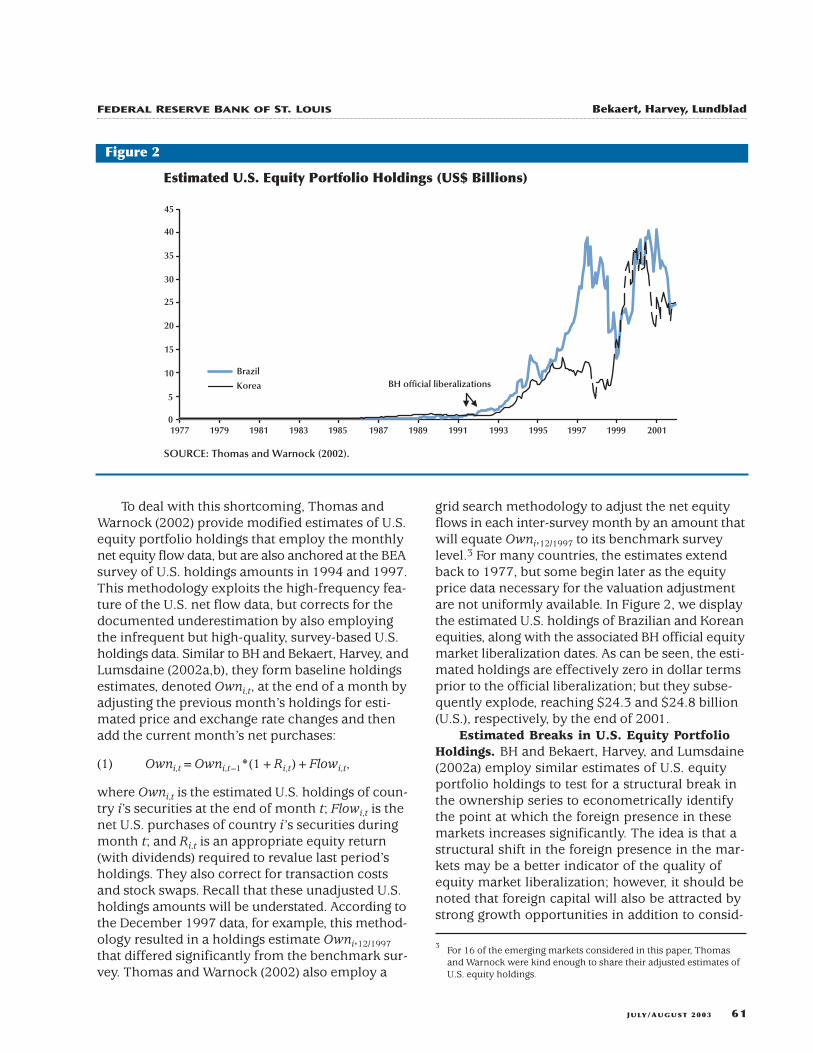
To deal with this shortcoming, Thomas andWarnock (2002) provide modified estimates of U.S.equity portfolio holdings that employ the monthlynet equity flow data, but are also anchored at the BEAsurvey of U.S. holdings amounts in 1994 and 1997.This methodology exploits the high-frequency fea-ture of the U.S. net flow data, but corrects for thedocumented underestimation by also employingthe infrequent but high-quality, survey-based U.S.holdings data. Similar to BH and Bekaert, Harvey, andLumsdaine (2002a,b), they form baseline holdingsestimates, denoted Owni,t, at the end of a month byadjusting the previous month’s holdings for esti-mated price and exchange rate changes and thenadd the current month’s net purchases:
(1) Owni,t=Owni,t–1*(1+Ri,t)+Flowi,t,
where Owni,t is the estimated U.S. holdings of coun-try i’s securities at the end of month t; Flowi,t is thenet U.S. purchases of country i’s securities duringmonth t; and Ri,t is an appropriate equity return(with dividends) required to revalue last period’sholdings. They also correct for transaction costsand stock swaps. Recall that these unadjusted U.S.holdings amounts will be understated. According tothe December 1997 data, for example, this method-ology resulted in a holdings estimate Owni,12/1997that differed significantly from the benchmark sur-vey. Thomas and Warnock (2002) also employ a
grid search methodology to adjust the net equityflows in each inter-survey month by an amount thatwill equate Owni,12/1997 to its benchmark surveylevel.3 For many countries, the estimates extendback to 1977, but some begin later as the equityprice data necessary for the valuation adjustmentare not uniformly available. In Figure 2, we displaythe estimated U.S. holdings of Brazilian and Koreanequities, along with the associated BH official equitymarket liberalization dates. As can be seen, the esti-mated holdings are effectively zero in dollar termsprior to the official liberalization; but they subse-quently explode, reaching $24.3 and $24.8 billion(U.S.), respectively, by the end of 2001.
Estimated Breaks in U.S. Equity PortfolioHoldings. BH and Bekaert, Harvey, and Lumsdaine(2002a) employ similar estimates of U.S. equityportfolio holdings to test for a structural break inthe ownership series to econometrically identifythe point at which the foreign presence in thesemarkets increases significantly. The idea is that astructural shift in the foreign presence in the mar-kets may be a better indicator of the quality ofequity market liberalization; however, it should benoted that foreign capital will also be attracted bystrong growth opportunities in addition to consid-
JULY/AUGUST 2003 61
3 For 16 of the emerging markets considered in this paper, Thomasand Warnock were kind enough to share their adjusted estimates ofU.S. equity holdings.
FEDERAL RESERVE BANK OF ST. LOUIS Bekaert, Harvey, Lundblad
Estimated U.S. Equity Portfolio Holdings (US$ Billions)
0
5
10
15
20
25
30
35
40
45
BH official liberalizations
SOURCE: Thomas and Warnock (2002).
1977 1979 1981 1983 1985 1987 1989 1991 1993 1995 1997 1999 2001
Brazil
Korea
Figure 2
erations such as the comprehensiveness, quality,and stability of capital market reforms. Note, theholdings data reflect both increased U.S. net trans-actions as well as the significant (and well docu-mented) equity appreciation observed for thesemarkets over the post-liberalization period (see BHand Henry, 2000a). Consequently, to control for thevaluation component, they divide these figures bythe domestic equity market capitalization. BH andBekaert, Harvey, and Lumsdaine (2002a) employthe endogenous break point tests detailed in Bai,Lumsdaine, and Stock (1998), which search for abreak in the mean within the context of an auto-regressive model for the U.S. ownership series. Addi-tionally, the procedure yields a break date with a90 percent confidence interval. We report the BHestimated portfolio holdings break dates in the lastcolumn of Table 1. As can be seen, there are severalcountries for which the official liberalization dateand estimated break date are within a year or twoof one another; see, for example, Turkey which hasan official liberalization in August 1989 and anestimate of the portfolio holding break date inDecember of that same year. In contrast, there areseveral countries for which the dates are quite dif-ferent (see, for example, Argentina, Portugal, andVenezuela). Taken together, the lack of uniformityacross these dates presents a challenge to researchersin this area. For this reason, it is important to eval-uate the robustness of any estimated liberalizationeffects to alternative dating schemes.
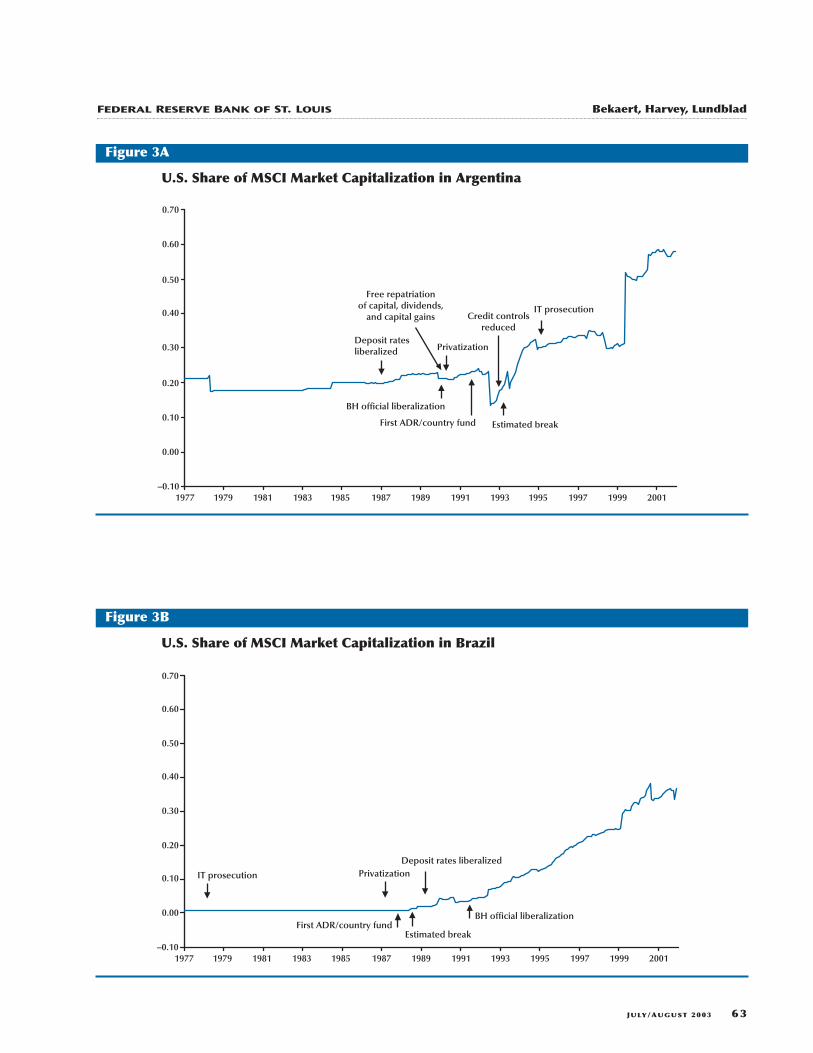
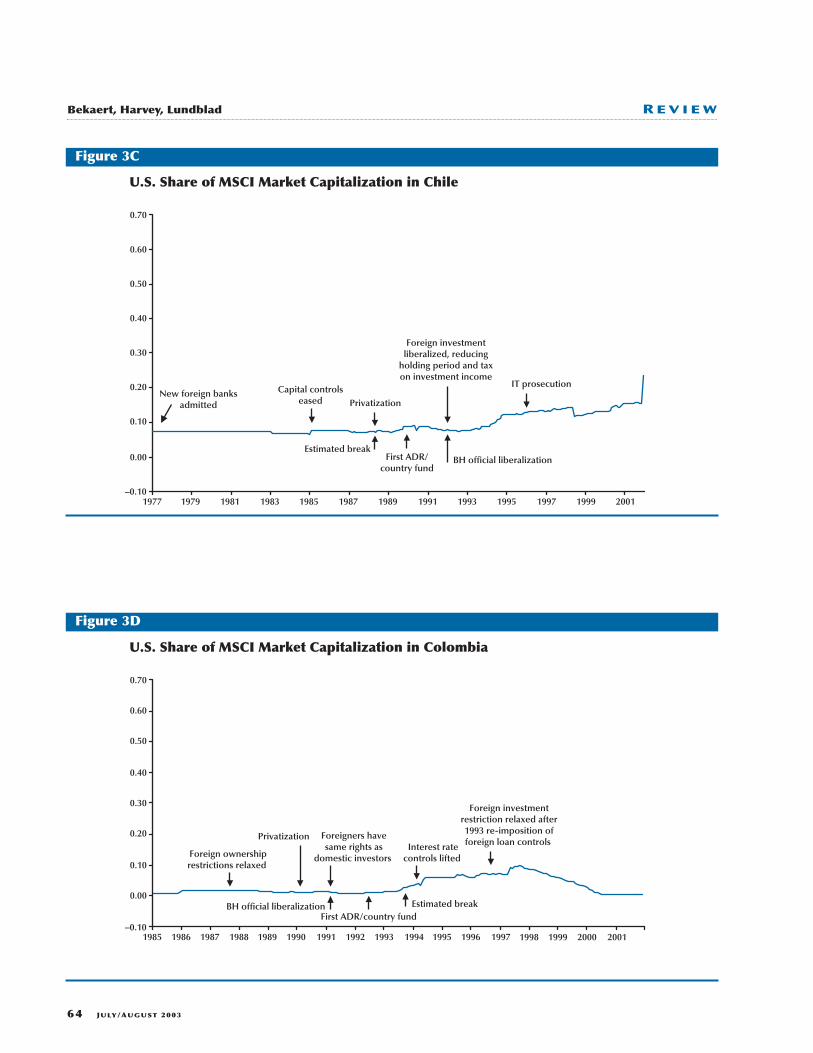
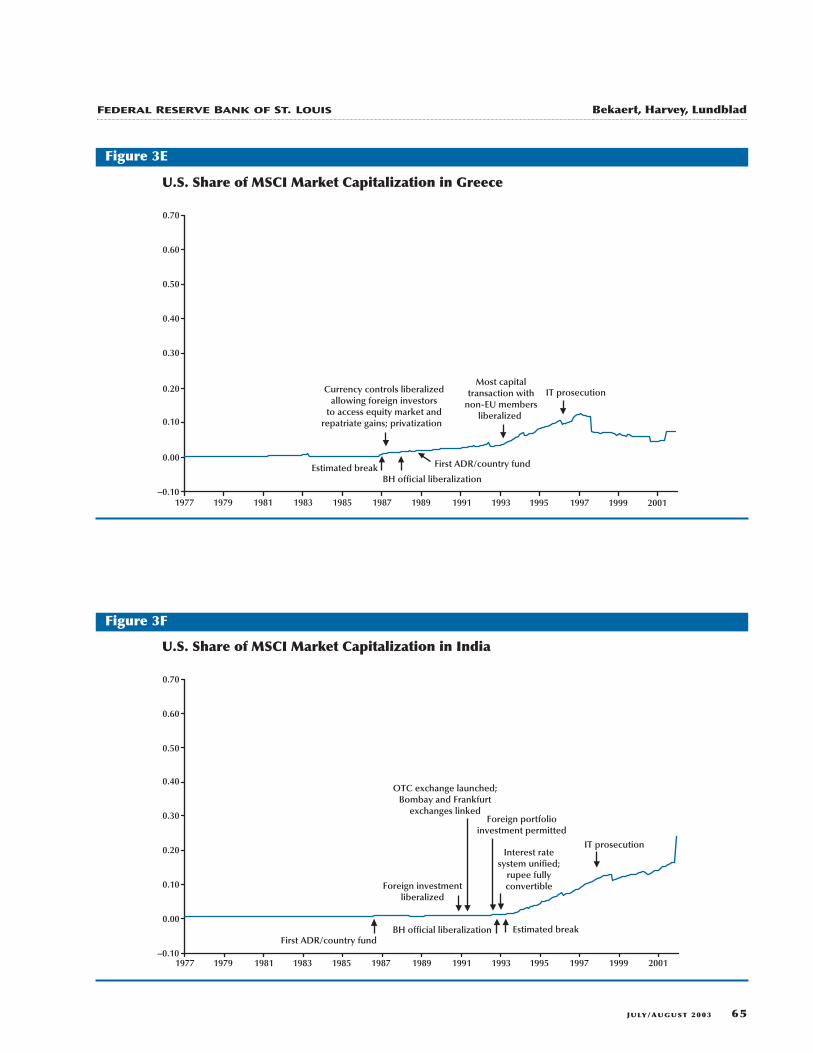
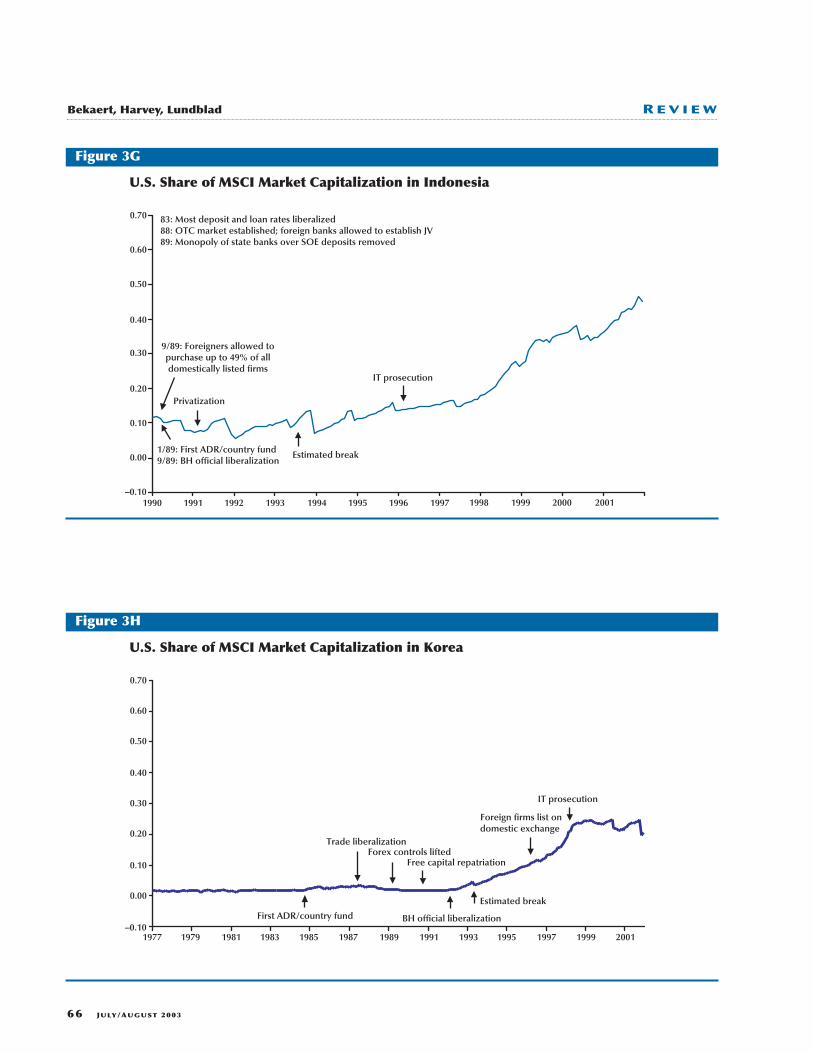
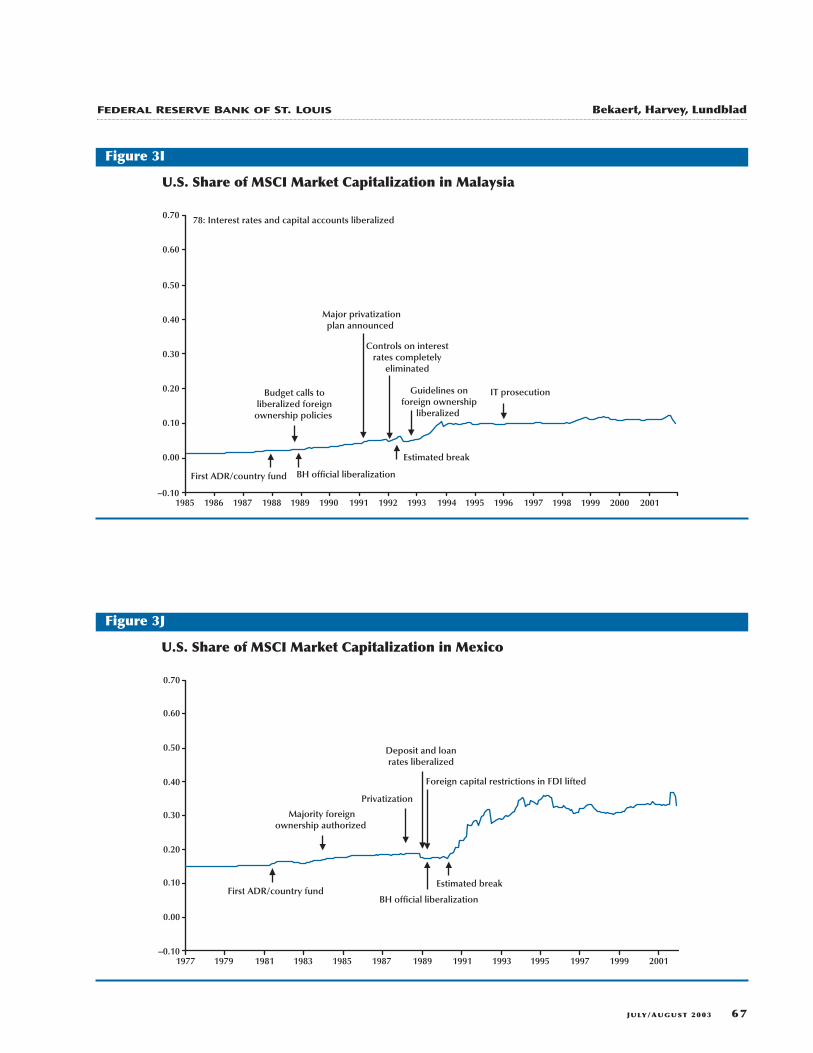
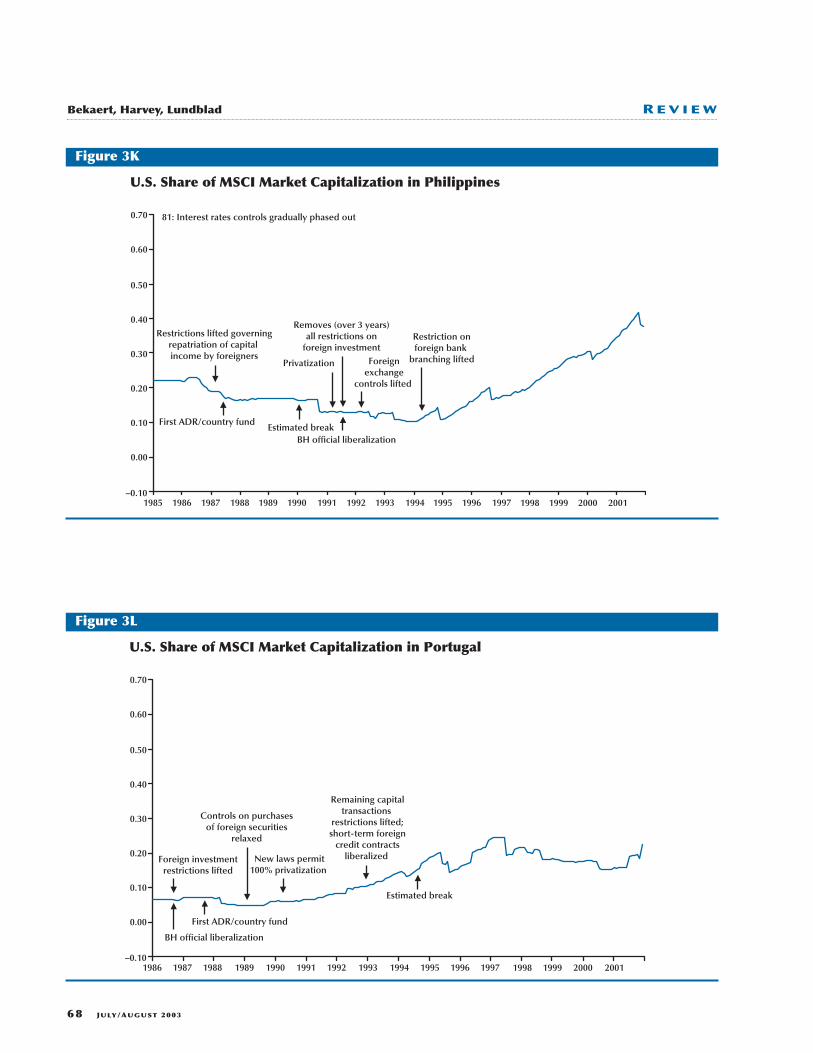
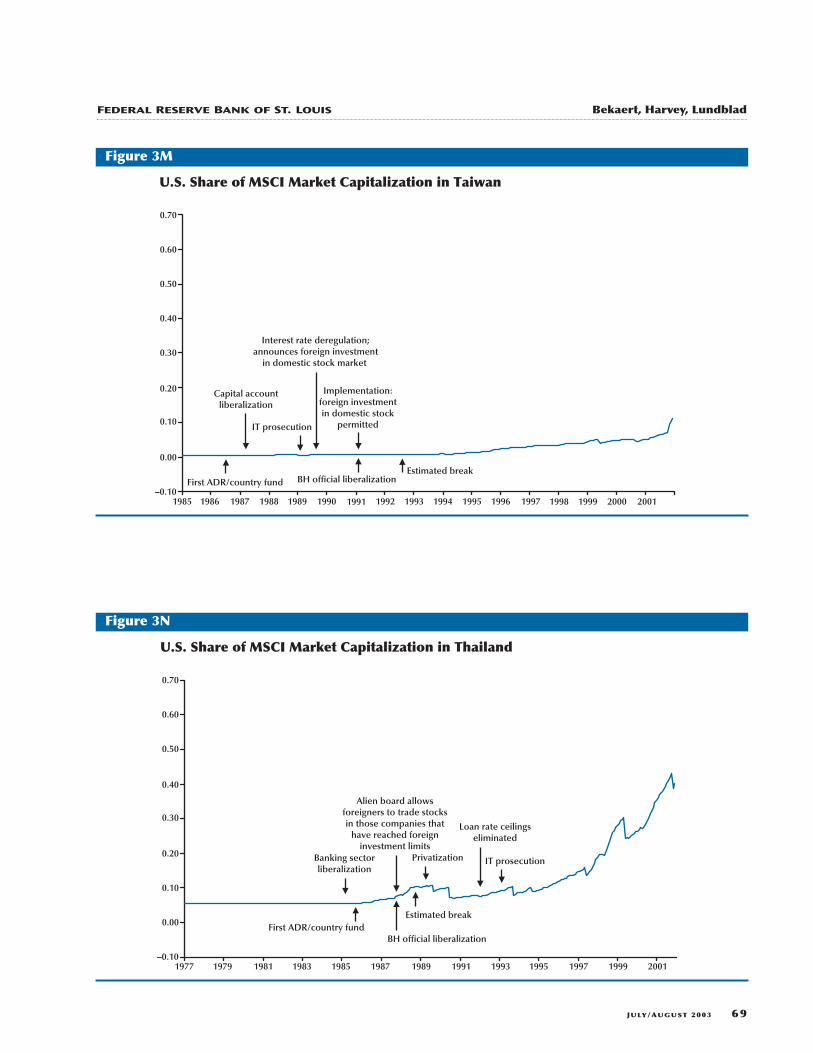
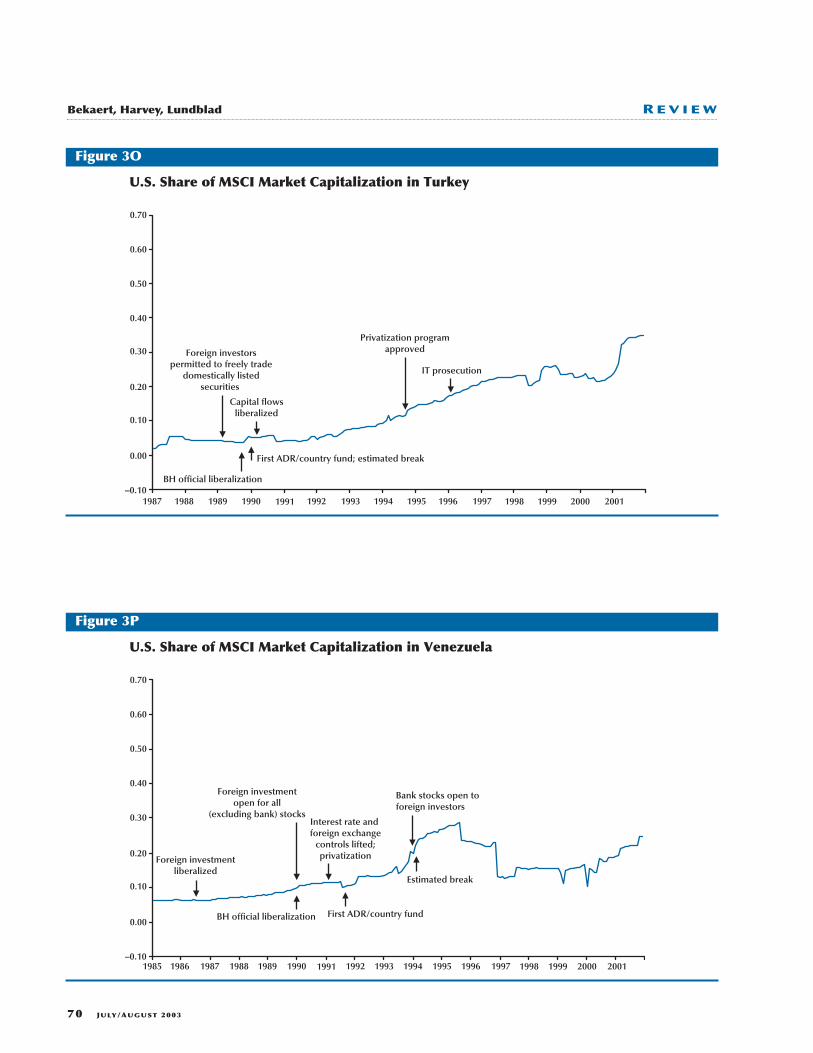
In Figure 3 (panels A through P), we present theratio of the estimated U.S. equity portfolio holdings(from Thomas and Warnock, 2002) to the marketcapitalization of the Morgan Stanley CapitalInternational (MSCI) (2001) indices for each country(which they use to make valuation adjustments).Below each estimate, we provide the BH official lib-eralization date, the date associated with either thefirst country fund or ADR, and the estimated breakdate. Additionally, we highlight key macroeconomic,trade, legal, and financial reforms that may impactforeign interest and/or access. As can be seen, acrossalmost all of the countries considered, estimatedU.S. holdings of domestic equities in these countriescomprised almost none of the domestic marketcapitalization at the start dates; in contrast, by theend of 2001, the U.S. equity holdings exceeded 25percent, on average, of the MSCI index capitalizationacross these markets, with several countries exceed-ing 50 percent. It is important to realize that theseholdings do not reflect the percent of total market
capitalization held by U.S. residents because the MSCIindices represent only between 50 percent and 70percent of the total market capitalization. Hence, a25 percent holding translates approximately into a(0.25 times 0.6 =) 15 percent U.S. holding. Thesefigures, showing a strong upward trend in almostevery case, demonstrate a dramatic change in theimportance of foreign investors to the domesticequity markets in each of these countries over thepast two decades. The more important question,however, is whether this increased foreign presencehas significantly altered or improved (i) the levelof financial development and (ii) real economicdevelopment through growth. These questions arethe subject of our recent work (see Bekaert, Harvey,and Lundblad, 2001 and 2002).
ECONOMIC EFFECTS OF FINANCIALLIBERALIZATION
There are a number of channels through whichfinancial liberalization may affect the real economy.First, once they are allowed access, foreign investors,exploiting the benefits of diversification, will driveup domestic equity market values; BH and Henry(2000a) demonstrate that the cost of capital fallssubsequent to major regulatory reforms that permitforeign investors access to domestic equity markets.Second, Henry (2000b) and Bekaert, Harvey, andLundblad (2002) document that aggregate domesticinvestment increases significantly after liberaliza-tion, potentially stimulating economic growth.There is also a booming literature (see, for example,Atje and Jovanovic, 1993, King and Levine, 1993, andLevine and Zervos, 1998a) that associates enhancedeconomic growth with deeper financial markets andbanking sectors. Because equity market liberaliza-tion promotes financial development and liquidity(see Bekaert, Harvey, and Lundblad, 2002), this mayprovide an additional channel through which liber-alization stimulates growth. Finally, as foreigninvestors may demand improved corporate gover-nance and transparency in these countries, liberal-ization may reduce the wedge between costs ofexternal and internal financing at the firm level,stimulating corporate investment (see Love, 2000).In this paper, we summarize some recent evidenceon the liberalization effects on real gross domesticproduct (GDP) and investment growth for a collec-tion of developing economies that house emergingequity markets.
For a collection of emerging and frontier markets
62 JULY/AUGUST 2003
Bekaert, Harvey, Lundblad R E V I E W
JULY/AUGUST 2003 63
FEDERAL RESERVE BANK OF ST. LOUIS Bekaert, Harvey, Lundblad
U.S. Share of MSCI Market Capitalization in Argentina
–0.10
0.00
0.10
0.20
0.30
0.40
0.50
0.60
0.70
Deposit ratesliberalized
Estimated breakFirst ADR/country fund
Free repatriationof capital, dividends,
and capital gains
Privatization
Credit controlsreduced
1977 1979 1981 1983 1985 1987 1989 1991 1993 1995 1997 1999 2001
BH official liberalization
IT prosecution
Figure 3A
U.S. Share of MSCI Market Capitalization in Brazil
–0.10
0.00
0.10
0.20
0.30
0.40
0.50
0.60
0.70
First ADR/country fund
Privatization
BH official liberalization
Estimated break
Deposit rates liberalized
IT prosecution
1977 1979 1981 1983 1985 1987 1989 1991 1993 1995 1997 1999 2001
Figure 3B
64 JULY/AUGUST 2003
Bekaert, Harvey, Lundblad R E V I E W
Privatization
BH official liberalizationEstimated break
First ADR/country fund
New foreign banksadmitted
Foreign investmentliberalized, reducing
holding period and taxon investment income
Capital controlseased
IT prosecution
U.S. Share of MSCI Market Capitalization in Chile
–0.10
0.00
0.10
0.20
0.30
0.40
0.50
0.60
0.70
1977 1979 1981 1983 1985 1987 1989 1991 1993 1995 1997 1999 2001
Figure 3C
First ADR/country fund
Privatization
BH official liberalization Estimated break
Interest ratecontrols lifted Foreign ownership
restrictions relaxed
Foreigners havesame rights as
domestic investors
Foreign investmentrestriction relaxed after1993 re-imposition offoreign loan controls
U.S. Share of MSCI Market Capitalization in Colombia
–0.10
0.00
0.10
0.20
0.30
0.40
0.50
0.60
0.70
1985 1986 1987 1988 1989 1990 1991 1992 1993 1994 1995 1996 1997 1998 1999 2000 2001
Figure 3D
JULY/AUGUST 2003 65
FEDERAL RESERVE BANK OF ST. LOUIS Bekaert, Harvey, Lundblad
Currency controls liberalizedallowing foreign investors
to access equity market andrepatriate gains; privatization
BH official liberalizationEstimated break First ADR/country fund
Most capitaltransaction with
non-EU membersliberalized
IT prosecution
U.S. Share of MSCI Market Capitalization in Greece
–0.10
0.00
0.10
0.20
0.30
0.40
0.50
0.60
0.70
1977 1979 1981 1983 1985 1987 1989 1991 1993 1995 1997 1999 2001
Figure 3E
First ADR/country fund
Foreign investmentliberalized
BH official liberalization
OTC exchange launched;Bombay and Frankfurt
exchanges linked Foreign portfolio
investment permitted
Estimated break
Interest ratesystem unified;
rupee fullyconvertible
U.S. Share of MSCI Market Capitalization in India
–0.10
0.00
0.10
0.20
0.30
0.40
0.50
0.60
0.70
1977 1979 1981 1983 1985 1987 1989 1991 1993 1995 1997 1999 2001
IT prosecution
Figure 3F
66 JULY/AUGUST 2003
Bekaert, Harvey, Lundblad R E V I E W
Privatization
1/89: First ADR/country fund9/89: BH official liberalization
Estimated break
83: Most deposit and loan rates liberalized88: OTC market established; foreign banks allowed to establish JV89: Monopoly of state banks over SOE deposits removed
IT prosecution
9/89: Foreigners allowed topurchase up to 49% of alldomestically listed firms
U.S. Share of MSCI Market Capitalization in Indonesia
–0.10
0.00
0.10
0.20
0.30
0.40
0.50
0.60
0.70
1990 1991 1992 1993 1994 1995 1996 1997 1998 1999 2000 2001
Figure 3G
First ADR/country fund
Trade liberalizationForex controls lifted
BH official liberalization
Free capital repatriation
Foreign firms list ondomestic exchange
IT prosecution
U.S. Share of MSCI Market Capitalization in Korea
–0.10
0.00
0.10
0.20
0.30
0.40
0.50
0.60
0.70
1977 1979 1981 1983 1985 1987 1989 1991 1993 1995 1997 1999 2001
Estimated break
Figure 3H
JULY/AUGUST 2003 67
FEDERAL RESERVE BANK OF ST. LOUIS Bekaert, Harvey, Lundblad
Major privatizationplan announced
BH official liberalization
Estimated break
78: Interest rates and capital accounts liberalized
IT prosecution
First ADR/country fund
Budget calls toliberalized foreign
ownership policies
Controls on interestrates completely
eliminated
Guidelines onforeign ownership
liberalized
U.S. Share of MSCI Market Capitalization in Malaysia
–0.10
0.00
0.10
0.20
0.30
0.40
0.50
0.60
0.70
1985 1986 1987 1988 1989 1990 1991 1992 1993 1994 1995 1996 1997 1998 1999 2000 2001
Figure 3I
First ADR/country fund
Privatization
Foreign capital restrictions in FDI lifted
BH official liberalization
Majority foreignownership authorized
Estimated break
Deposit and loanrates liberalized
U.S. Share of MSCI Market Capitalization in Mexico
–0.10
0.00
0.10
0.20
0.30
0.40
0.50
0.60
0.70
1977 1979 1981 1983 1985 1987 1989 1991 1993 1995 1997 1999 2001
Figure 3J
68 JULY/AUGUST 2003
Bekaert, Harvey, Lundblad R E V I E W
Privatization
BH official liberalizationEstimated break
81: Interest rates controls gradually phased out
First ADR/country fund
Restrictions lifted governingrepatriation of capital income by foreigners
Removes (over 3 years)all restrictions on
foreign investmentForeign
exchangecontrols lifted
Restriction onforeign bank
branching lifted
U.S. Share of MSCI Market Capitalization in Philippines
–0.10
0.00
0.10
0.20
0.30
0.40
0.50
0.60
0.70
1985 1986 1987 1988 1989 1990 1991 1992 1993 1994 1995 1996 1997 1998 1999 2000 2001
Figure 3K
New laws permit100% privatization
BH official liberalization
Estimated break
First ADR/country fund
Foreign investmentrestrictions lifted
Remaining capitaltransactions
restrictions lifted;short-term foreign
credit contractsliberalized
Controls on purchasesof foreign securities
relaxed
U.S. Share of MSCI Market Capitalization in Portugal
–0.10
0.00
0.10
0.20
0.30
0.40
0.50
0.60
0.70
1986 1987 1988 1989 1990 1991 1992 1993 1994 1995 1996 1997 1998 1999 2000 2001
Figure 3L
JULY/AUGUST 2003 69
FEDERAL RESERVE BANK OF ST. LOUIS Bekaert, Harvey, Lundblad
BH official liberalizationFirst ADR/country fund
Capital accountliberalization
Interest rate deregulation;announces foreign investment
in domestic stock market
Implementation:foreign investmentin domestic stock
permittedIT prosecution
U.S. Share of MSCI Market Capitalization in Taiwan
–0.10
0.00
0.10
0.20
0.30
0.40
0.50
0.60
0.70
1985 1986 1987 1988 1989 1990 1992 1993 1994 1995 1996 1997 1998 1999 2000 20011991
Estimated break
Figure 3M
Privatization
BH official liberalization
Estimated breakFirst ADR/country fund
Banking sectorliberalization
Alien board allowsforeigners to trade stocksin those companies that
have reached foreigninvestment limits
Loan rate ceilingseliminated
IT prosecution
U.S. Share of MSCI Market Capitalization in Thailand
–0.10
0.00
0.10
0.20
0.30
0.40
0.50
0.60
0.70
1977 1979 1981 1983 1985 1987 1989 1991 1993 1995 1997 1999 2001
Figure 3N
70 JULY/AUGUST 2003
Bekaert, Harvey, Lundblad R E V I E W
Capital flowsliberalized
BH official liberalization
First ADR/country fund; estimated break
Foreign investorspermitted to freely trade
domestically listedsecurities
Privatization programapproved
IT prosecution
U.S. Share of MSCI Market Capitalization in Turkey
–0.10
0.00
0.10
0.20
0.30
0.40
0.50
0.60
0.70
1987 1988 1989 1990 1992 1993 1994 1995 1996 1997 1998 1999 2000 20011991
Figure 3O
BH official liberalization
Estimated break
First ADR/country fund
Foreign investmentliberalized
Foreign investmentopen for all
(excluding bank) stocksInterest rate and foreign exchange
controls lifted;privatization
Bank stocks open toforeign investors
U.S. Share of MSCI Market Capitalization in Venezuela
–0.10
0.00
0.10
0.20
0.30
0.40
0.50
0.60
0.70
1985 1986 1987 1988 1989 1990 1992 1993 1994 1995 1996 1997 1998 1999 2000 20011991
Figure 3P
over the 1980-97 period, Bekaert, Harvey, andLundblad (2001) document that an “official equitymarket liberalization” leads to an increase in averageannual per capita GDP of around 1 percent, control-ling for other macroeconomic, demographic, andfinancial factors that have been shown to predictcross-sectional variation in economic growth. Weexplore GDP and investment growth across a similarset of countries here, updating our data set to includethe highly influential South East Asian crises, forwhich several countries in that region actuallycontracted by more than 10 percent. For example,according to the World Bank, real per capita GDPgrowth in 1998 was –12.1 percent in Thailand, –15.7percent in Indonesia, and –7.8 percent in Korea.
Summary Statistics
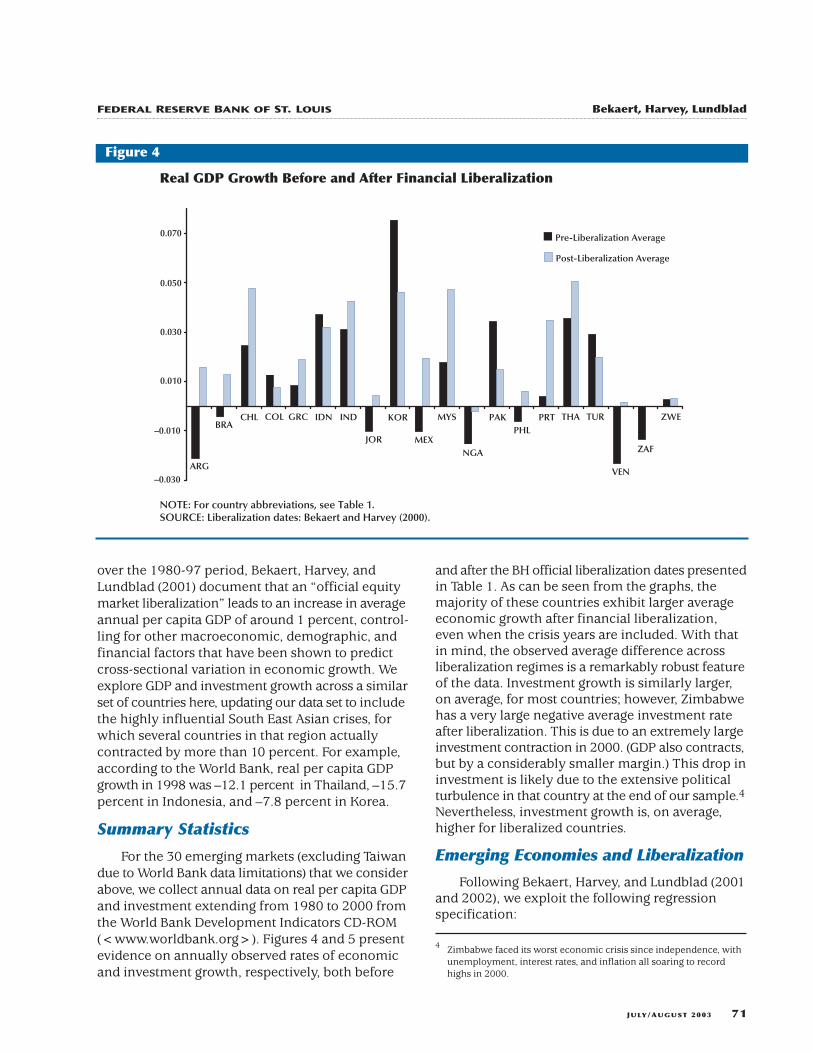
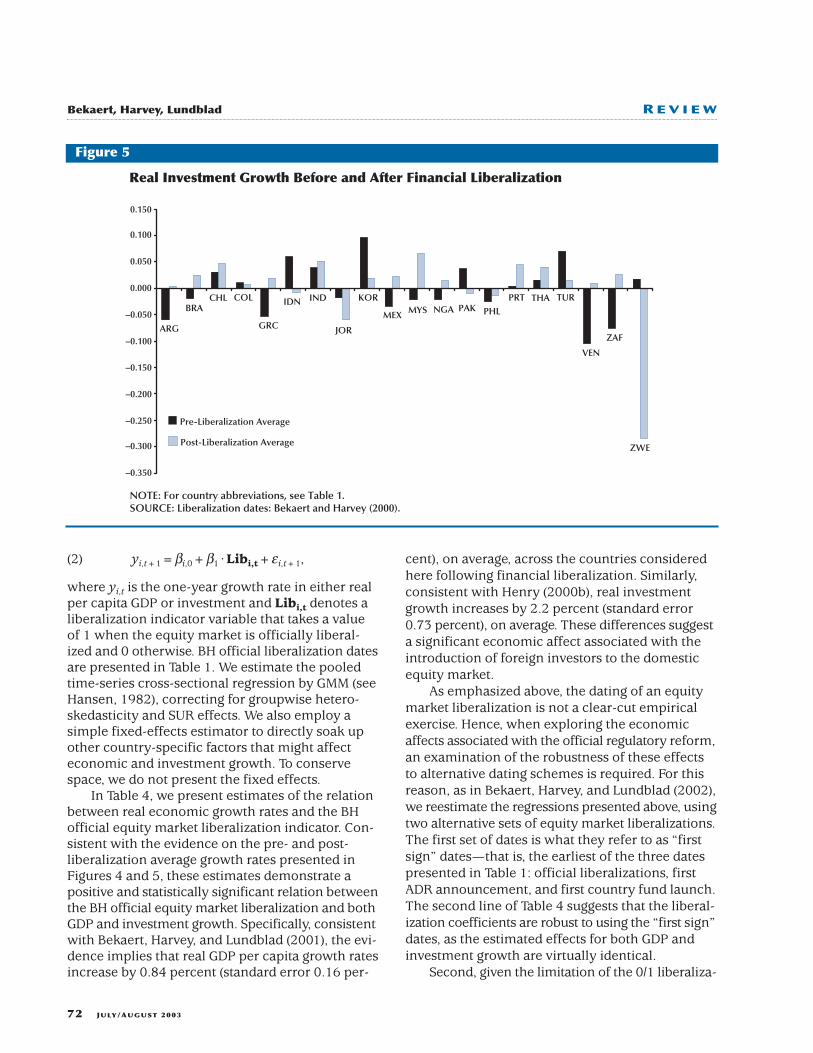
For the 30 emerging markets (excluding Taiwandue to World Bank data limitations) that we considerabove, we collect annual data on real per capita GDPand investment extending from 1980 to 2000 fromthe World Bank Development Indicators CD-ROM(<www.worldbank.org>). Figures 4 and 5 presentevidence on annually observed rates of economicand investment growth, respectively, both before
and after the BH official liberalization dates presentedin Table 1. As can be seen from the graphs, themajority of these countries exhibit larger averageeconomic growth after financial liberalization,even when the crisis years are included. With thatin mind, the observed average difference acrossliberalization regimes is a remarkably robust featureof the data. Investment growth is similarly larger,on average, for most countries; however, Zimbabwehas a very large negative average investment rateafter liberalization. This is due to an extremely largeinvestment contraction in 2000. (GDP also contracts,but by a considerably smaller margin.) This drop ininvestment is likely due to the extensive politicalturbulence in that country at the end of our sample.4Nevertheless, investment growth is, on average,higher for liberalized countries.
Emerging Economies and Liberalization
Following Bekaert, Harvey, and Lundblad (2001and 2002), we exploit the following regressionspecification:
JULY/AUGUST 2003 71
4 Zimbabwe faced its worst economic crisis since independence, withunemployment, interest rates, and inflation all soaring to recordhighs in 2000.
FEDERAL RESERVE BANK OF ST. LOUIS Bekaert, Harvey, Lundblad
–0.030
–0.010
0.010
0.030
0.050
0.070
ARG
BRACHL COL GRC IDN IND
JOR
KOR
MEX
MYS
NGA
PAKPHL
PRT THA TUR
VEN
ZAF
ZWE
Pre-Liberalization Average
Post-Liberalization Average
Real GDP Growth Before and After Financial Liberalization
NOTE: For country abbreviations, see Table 1.SOURCE: Liberalization dates: Bekaert and Harvey (2000).
Figure 4
(2) yi,t+1=βi,0+β1·Libi,t+εi,t+1,
where yi,t is the one-year growth rate in either realper capita GDP or investment and Libi,t denotes aliberalization indicator variable that takes a valueof 1 when the equity market is officially liberal-ized and 0 otherwise. BH official liberalization datesare presented in Table 1. We estimate the pooledtime-series cross-sectional regression by GMM (seeHansen, 1982), correcting for groupwise hetero-skedasticity and SUR effects. We also employ asimple fixed-effects estimator to directly soak upother country-specific factors that might affecteconomic and investment growth. To conservespace, we do not present the fixed effects.
In Table 4, we present estimates of the relationbetween real economic growth rates and the BHofficial equity market liberalization indicator. Con-sistent with the evidence on the pre- and post-liberalization average growth rates presented inFigures 4 and 5, these estimates demonstrate apositive and statistically significant relation betweenthe BH official equity market liberalization and bothGDP and investment growth. Specifically, consistentwith Bekaert, Harvey, and Lundblad (2001), the evi-dence implies that real GDP per capita growth ratesincrease by 0.84 percent (standard error 0.16 per-
cent), on average, across the countries consideredhere following financial liberalization. Similarly,consistent with Henry (2000b), real investmentgrowth increases by 2.2 percent (standard error0.73 percent), on average. These differences suggesta significant economic affect associated with theintroduction of foreign investors to the domesticequity market.
As emphasized above, the dating of an equitymarket liberalization is not a clear-cut empiricalexercise. Hence, when exploring the economicaffects associated with the official regulatory reform,an examination of the robustness of these effectsto alternative dating schemes is required. For thisreason, as in Bekaert, Harvey, and Lundblad (2002),we reestimate the regressions presented above, usingtwo alternative sets of equity market liberalizations.The first set of dates is what they refer to as “firstsign” dates—that is, the earliest of the three datespresented in Table 1: official liberalizations, firstADR announcement, and first country fund launch.The second line of Table 4 suggests that the liberal-ization coefficients are robust to using the “first sign”dates, as the estimated effects for both GDP andinvestment growth are virtually identical.
Second, given the limitation of the 0/1 liberaliza-
72 JULY/AUGUST 2003
Bekaert, Harvey, Lundblad R E V I E W
–0.350
–0.300
–0.250
–0.200
–0.150
–0.100
–0.050
0.000
0.050
0.100
0.150
Real Investment Growth Before and After Financial Liberalization
Pre-Liberalization Average
Post-Liberalization Average
NOTE: For country abbreviations, see Table 1.SOURCE: Liberalization dates: Bekaert and Harvey (2000).
ARG
BRACHL COL
GRC
IDN IND
JOR
KOR
MEX MYS NGA PAK PHL
PRT THA TUR
VEN
ZAF
ZWE
Figure 5
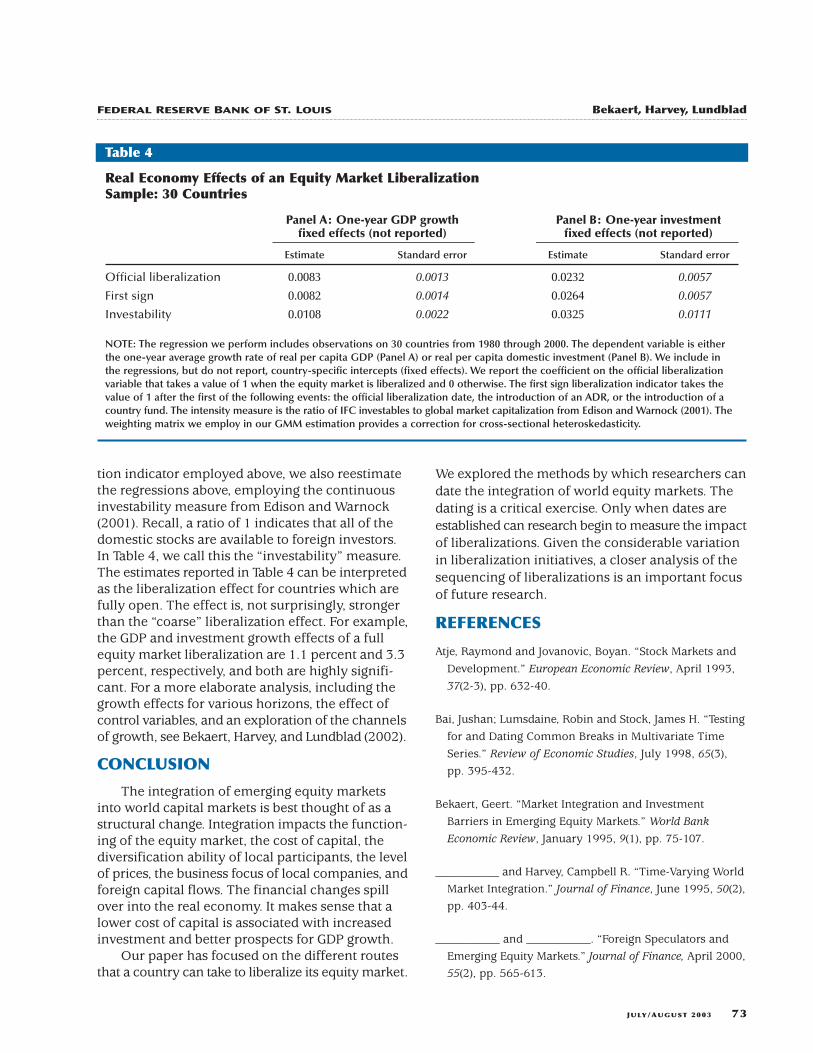
tion indicator employed above, we also reestimatethe regressions above, employing the continuousinvestability measure from Edison and Warnock(2001). Recall, a ratio of 1 indicates that all of thedomestic stocks are available to foreign investors.In Table 4, we call this the “investability” measure.The estimates reported in Table 4 can be interpretedas the liberalization effect for countries which arefully open. The effect is, not surprisingly, strongerthan the “coarse” liberalization effect. For example,the GDP and investment growth effects of a fullequity market liberalization are 1.1 percent and 3.3percent, respectively, and both are highly signifi-cant. For a more elaborate analysis, including thegrowth effects for various horizons, the effect ofcontrol variables, and an exploration of the channelsof growth, see Bekaert, Harvey, and Lundblad (2002).
CONCLUSION
The integration of emerging equity marketsinto world capital markets is best thought of as astructural change. Integration impacts the function-ing of the equity market, the cost of capital, thediversification ability of local participants, the levelof prices, the business focus of local companies, andforeign capital flows. The financial changes spillover into the real economy. It makes sense that alower cost of capital is associated with increasedinvestment and better prospects for GDP growth.
Our paper has focused on the different routesthat a country can take to liberalize its equity market.
We explored the methods by which researchers candate the integration of world equity markets. Thedating is a critical exercise. Only when dates areestablished can research begin to measure the impactof liberalizations. Given the considerable variationin liberalization initiatives, a closer analysis of thesequencing of liberalizations is an important focusof future research.
REFERENCES
Atje, Raymond and Jovanovic, Boyan. “Stock Markets andDevelopment.” European Economic Review, April 1993,37(2-3), pp. 632-40.
Bai, Jushan; Lumsdaine, Robin and Stock, James H. “Testingfor and Dating Common Breaks in Multivariate TimeSeries.” Review of Economic Studies, July 1998, 65(3),pp. 395-432.
Bekaert, Geert. “Market Integration and InvestmentBarriers in Emerging Equity Markets.” World Bank
Economic Review, January 1995, 9(1), pp. 75-107.
___________ and Harvey, Campbell R. “Time-Varying WorldMarket Integration.” Journal of Finance, June 1995, 50(2),pp. 403-44.
___________ and ___________. “Foreign Speculators andEmerging Equity Markets.” Journal of Finance, April 2000,55(2), pp. 565-613.
JULY/AUGUST 2003 73
FEDERAL RESERVE BANK OF ST. LOUIS Bekaert, Harvey, Lundblad
Real Economy Effects of an Equity Market LiberalizationSample: 30 Countries
Panel A: One-year GDP growth Panel B: One-year investment fixed effects (not reported) fixed effects (not reported)
Estimate Standard error Estimate Standard error
Official liberalization 0.0083 0.0013 0.0232 0.0057
First sign 0.0082 0.0014 0.0264 0.0057
Investability 0.0108 0.0022 0.0325 0.0111
NOTE: The regression we perform includes observations on 30 countries from 1980 through 2000. The dependent variable is eitherthe one-year average growth rate of real per capita GDP (Panel A) or real per capita domestic investment (Panel B). We include inthe regressions, but do not report, country-specific intercepts (fixed effects). We report the coefficient on the official liberalizationvariable that takes a value of 1 when the equity market is liberalized and 0 otherwise. The first sign liberalization indicator takes thevalue of 1 after the first of the following events: the official liberalization date, the introduction of an ADR, or the introduction of acountry fund. The intensity measure is the ratio of IFC investables to global market capitalization from Edison and Warnock (2001). Theweighting matrix we employ in our GMM estimation provides a correction for cross-sectional heteroskedasticity.
Table 4
___________; ___________ and Lumsdaine, Robin L. “Datingthe Integration of World Equity Markets.” Journal ofFinancial Economics, August 2002a, 65(2), pp. 203-247.
___________; ___________ and ___________. “The Dynamicsof Emerging Market Flows.” Journal of InternationalMoney and Finance, June 2002b, 21(3), pp. 295-350.
___________; ___________ and Lundblad, Christian.“Emerging Equity Markets and Economic Development.”Journal of Development Economics, December 2001,66(2), pp. 465-504.
___________; ___________ and ___________. “Does FinancialLiberalization Spur Growth?” Working paper, DukeUniversity, 2002.
Chuhan, Punam. “Are Institutional Investors an ImportantSource of Portfolio Investment in Emerging Markets?”Policy Research Working Paper No. WPS1243, WorldBank, 1994.
Edison, Hali J. and Warnock, Francis E. “A Simple Measureof the Intensity of Capital Controls.” Working Paper No.01/180, International Monetary Fund, 2001.
Hansen, Lars P. “Large Sample Properties of GeneralizedMethod of Moments Estimators.” Econometrica, July1982, 50(4), pp. 1029-54.
Henry, Peter Blair. “Stock Market Liberalization, EconomicReform, and Emerging Market Equity Prices.” Journal ofFinance, April 2000a, 55(2), pp. 529-64.
___________. “Do Stock Market Liberalizations CauseInvestment Booms?” Journal of Financial Economics,October/November 2000b, 58(1-2), pp. 301-34.
Kim, E. Han and Singal, Vijay. “Stock Market Openings:Experience of Emerging Economies.” Journal of Business,January 2000, 73(1), pp. 25-66.
King, Robert G. and Levine, Ross. “Finance, Entrepreneurship
and Growth: Theory and Evidence.” Journal of Monetary
Economics, December 1993, 32(3), pp. 513-542.
Levine, Ross and Zervos, Sara. “Stock Markets, Banks, and
Economic Growth.” American Economic Review, June
1998a, 88(3), pp. 537-58.
___________ and ___________. “Capital Control
Liberalization and Stock Market Development.” World
Development, July 1998b, 26(7), pp. 1169-83.
Love, Inessa. “Financial Development and Financing
Constraints: International Evidence from the Structural
Investment Model.” Unpublished manuscript, Columbia
University, 2000.
Miller, Darius. “The Market Reaction to International
Cross-Listings: Evidence from Depositary Receipts.”
Journal of Financial Economics, 1999, 51(1), pp. 103-23.
Morgan Stanley Capital International. MSCI Enhanced
Methodology, May 2001. <http://www.msci.com/
provisional/enhmeth_book.pdf>.
Standard and Poor’s. The S&P Emerging Market Indices:
Methodology, Definitions, and Practices. February 2000.
<www2.standardandpoors.com/spf/doc/index/
method.doc>.
Thomas, Charles and Warnock, Francis E. “International
Equity and Bond Portfolios.” Unpublished manuscript,
Board of Governors of the Federal Reserve System, 2002.
Warnock, Francis E. and Cleaver, Chad. “Financial Centers
and the Geography of Capital Flows.” International
Finance Discussion Paper No. 2002-722, Board of
Governors of the Federal Reserve System, 2002.
74 JULY/AUGUST 2003
Bekaert, Harvey, Lundblad R E V I E W