equal education opportunity
TRANSCRIPT

_________________________________
Equal Education Opportunity An Analysis of the Racial Achievement Gap
In Kentucky Urban Schools
________________________________________________________________________
The Kentucky Advisory Committee To the U.S. Commission on Civil Rights
This is the work of the Kentucky State Advisory Committee to the United States Commission on Civil Rights. The views expressed in this report and the findings and recommendations contained herein are those of a majority of the members of the State Advisory Committee and do not necessarily represent the views of the Commission, its individual members, or the policies of the United States Government.

Letter of Transmittal
Kentucky Advisory Committee to the U.S. Commission on Civil Rights
Members of the Commission: Gerald A. Reynolds, Chairman Abigail Thernstrom, Vice-chair Jennifer C. Braceras Peter N. Kirsanow Arlan D. Melendez Ashley Taylor Michael Yaki Kenneth L. Marcus, Staff Director
The Kentucky Advisory Committee submits this report, Equal Education
Opportunity: An Analysis of the Racial Achievement Gap in Kentucky Urban Schools, as
part of its responsibility to keep the public and the Commission informed on civil rights
issues deserving attention in the state. The Advisory Committee was first drawn to the
topic in the early 2000s, as it noted an increasing concern from many sectors about the
achievement gap between minority students, particularly African Americans, and their
peers. The Advisory Committee observed that this national phenomenon was also
occurring in Kentucky.
In 2000, the Kentucky Department of Education issued a task force report on
student achievement in the state and found a large and pervasive achievement gap
between white and African American students. In 2003 the Kentucky Human Rights
Commission reported that African American children in the state lagged significantly
behind their peers. Stemming in part from lobbying efforts by African American leaders
and civic organizations concerned about an achievement gap, education performance
accountability legislation was enacted by the state legislature in 2002. Essentially, low
performing schools are accountable for the performance of their students and students in
low performing schools have the choice to transfer to higher performing schools. Despite
the legislation, large numbers of schools still have not met the intended achievement
goals.
ii

Though the achievement gap is generally acknowledged, there is no consensus on
its cause or remedy, so in 2004 the Kentucky Advisory Committee decided to undertake
its own examination of the issue and try and learn of any factors related to the
achievement gap. A review of studies on academic achievement in other states provided a
framework for the design of this study, and in 2005 the Committee formally began its
effort to collect information that would allow an examination of the issue. This report is
a statement as to the findings of the Kentucky Advisory Committee of that examination,
and was unanimously approved by the entire Committee.
The Kentucky Advisory Committee undertook to examine a set of specific
school-related factors that may be related to the achievement gap between African
American students and their peers. It is acknowledged that there are a number of other
school-related factors that are likely related to the achievement gap, but could not be
considered in this study because of measurability problems. One such factor is teacher
quality, a factor that is specifically mandated under the federal No Child Left Behind Act
of 2001. Another likely contributing factor is the learning environment within the school.
Since this examination is a school-related study, the study is limited to the extent
that the achievement gap may be related to factors outside the school environment and
therefore outside school control. For example, there is a growing sentiment that children
from disadvantaged homes enter school already lagging behind their peers in academic
skills, and that observed differences in academic achievement are simply reflections of
that pre-existing condition. With limited available data in Kentucky to measure the
existence of such a pre-existing gap, this potential contributing cause could not be
rigorously examined as part of this study.
For this school-related study, an effort was made to include in the analysis
measurable variables commonly cited as related to the achievement gap. These included:
(1) low-income, (2) single-parent families, (3) concentration of African American
students in the school, and (4) student-teacher ratios. Originally, school choice was
planned to be included as a school-related variable, but the small number of choice
schools in the state precluded this factor from being a viable option for study as part of
the analysis.
iii

The measure used for the achievement gap in this study is the difference between
the school-wide average reading score of African American children and the state-wide
average reading score on the 4th grade CATS criterion-referenced reading assessment.
Low-income was measured by the percent of children at a school eligible for free or
reduced lunch. The percent of single-parent households at the school was measured by
the percentage of families with children under 18 headed by a single mother in the census
tract in which the school was located. The percentage of a school enrollment that is
African American was used to measure the concentration of African Americans at a
school.
Based upon this analysis only one factor, low-income, was found to be related to
the size of the achievement gap between African Americans and other students. The
percentage of single parent families at the school, the percent of the school that was
African American, and student teacher ratios at the school were neutral in their effect on
the achievement gap. Some may consider this finding supports alternative theories, but
this study does not necessarily support other alternative theories nor does it definitively
declaim that the specific factors considered in this study to be related or not related to the
achievement gap.
The achievement gap is a critical and complex social issue that is both contentious
and its foundations and solution are still not well understood. This study should be
understood in that context and considered as one of many necessary examinations of this
critical social and civil rights issue. These findings seem to suggest to the Kentucky
Advisory Committee that other than poverty, there are likely other underlying
influence(s) outside and separate from the school environment and/or possibly interacting
with poverty that prompt lower academic performance by African American children.
Respectfully, J. Blaine Hudson, Ph.D., Chairman Kentucky Advisory Committee
iv

Kentucky Advisory Committee to the U.S. Commission on Civil Rights J. Blaine Hudson, Ph.D., Chairman Louisville Troy Body Louisville Richard Clay, J.D. Louisville Betty Griffin, Ed.D. Frankfort Vickie Maley Paducah Linda McCray Bowling Green John McCarthy Louisville Osi Onyekwuluje, J.D. Bowling Green William Summers, V Louisville Phil Tom Louisville Jim Waters Bowling Green All 11 members of the Kentucky State Advisory Committee voted, and all 11 members
approved the report. It is a unanimous reporting by the Kentucky State Advisory
Committee, all members participating
v

Acknowledgements and U.S. Commission Contact __________________________________________________________________ USCCR Contact Peter Minarik, Ph.D.
Regional Director, Southern Regional Office U.S. Commission on Civil Rights (404) 562-7000 or [email protected]
__________________________________________________________________ Acknowledgements In addition to the person named above, the following
individuals made important contributions to this report. Angela Calloway and Marshell Clark did background research and conducted the analysis. Benjamin Istoc, Arlana Hardy, and Ian Jackson assisted in data collection and report preparation.
vi
Contents Background …………………………………………………………………….…. 1 African American Students in Kentucky Lag Behind Peers in Academic Achievement ……………………………..…………………………….. 4
African Americans More Than 15 Percent Behind Peers in Proficiency for Reading and Mathematics …………………………………………………… 5 Poverty, Single-Parent Households, Racial Isolation, and Large Class Size Offered as Explanations for Achievement Gap ……………………….…… 7
Family Environment, Pre-School Academic Preparation, and School Choice Also Offered as Explanations for Achievement Gap ……………….. 12
African Americans in Four Selected Urban School Districts Have Lower Reading Scores ………………………………………………………….. 16
Christian County School District…………………………………………… 17
Fayette County School District………………………………..…………….. 20
Hardin County School District ………………………………….……………23
Paducah Independent School District …………………………………….… 26
Low-Income Significantly Contributes to Achievement Gap …………………. 29 Achievement Gap Correlated with Single Parent Households, Low-Income And Percentage of African American Students …………………………….. 30 Regression Analysis Finds Low-Income Only Factor Related to Achievement Gap …………………………………………………………. 31 Finding and Recommendations ………………………………………………….. 35 Appendix I – Methodology and Limitations ………………………………….. 36 Appendix II – Agency Comments ………………………………..…………… 39
vii

Tables Table 1: Kentucky School Districts with the Largest Numbers of African American Students ……………………………………………………… 5 Table 2: Percent African American, Percent Free and Reduced Lunch Eligibility, Percent Single Parent Families, and Student-Teacher Ratio for Elementary Schools in the Christian County School District …………………….. 18 Table 3: Percent African American, Percent Free and Reduced Lunch Eligibility, Percent Single Parent Families, and Student-Teacher Ratio for Elementary Schools in the Fayette County School District ……………………… 22 Table 4: Percent African American, Percent Free and Reduced Lunch Eligibility, Percent Single Parent Families, and Student-Teacher Ratio for Elementary Schools in the Hardin County School District …………………….… 25 Table 5: Percent African American, Percent Free and Reduced Lunch Eligibility, Percent Single Parent Families, and Student-Teacher Ratio for Elementary Schools in the Paducah Independent School District ………………… 28 Table 6: Correlations for the Variables: Percent Low-Income Students, Percent African American Enrollment, Percent Single Parent Households, Achievement Gap ……………………………………………………………………. 30 Table 6: Regression Results For Reading Score Gap and Percent of Single Family Homes, Percent of Students Eligible For Free And Reduced Lunch, Percent of African American Students, and Student-Teacher Ratio ………………. 34 Figures Figure 1: Average School-Wide Elementary School 4th Grade Reading Scores of African American Students and White Students in the Christian County School District for 2004-05 School Year ………………………………….. 19 Figure 2: Average School-Wide Elementary School 4th Grade Reading Scores of African American Students and White Students in the Hardin County School District for 2004-05 School Year …………………………………………... 26 Figure 3: Average School-Wide Elementary School 4th Grade Reading Scores of African American Students and White Students in the Paducah Independent School District for 2004-05 School Year …………………………….. 29
viii

Figure 4: Scatterplot of Achievement Gap with Percent Free and Reduced Lunch ……………………………………………………………………. 32
ix

BackgroundFrom the founding of this nation, education has been considered an essential
ingredient for a prosperous and democratic society. Schools over time, both public and
private, have provided opportunities for children from varying social and economic
backgrounds to improve their lives and fully participate in the American experience. In
addition, over the course of centuries, not only have schools traditionally served diverse
communities, they have also functioned to accommodate diversity and promote a
common understanding of American culture. In recent years, as part of the established
doctrine of equal educational opportunity there has been a growing concern that the
achievement gap between minority children and other children is a civil rights issue and
deserves particular attention as part of equal educational opportunity.
In the United States, education is primarily a State and local function.1 Typically,
local school districts, governed by local school boards that are in turn regulated by state
education agencies, administer and deliver public elementary and secondary education.
Funding for public education comes largely from local and state sources, and these two
sources provide over 90 percent of all national education expenditures while federal
funding for public education is less than 10 percent.2
Under local control, inequities in educational opportunity on the basis of race
were an accepted part of the educational landscape in many parts of the country through
most of the nation’s history.3 In 1954, however, the obligation to afford equal educational
opportunity for all students on a non-segregated basis became law. In that year, the U.S.
Supreme Court in its landmark decision, Brown v. Board of Education,4 ruled that de jure
segregation of public education based on race deprived Black children of equal education
opportunity in violation of the equal protection clause of the 14th amendment. The Brown
decision advanced the concept of equal educational opportunity, and is widely
1 Richard W. Riley, “Redefining the Federal Role in Education: Toward A Framework for High Standards, Improved Schools, Broader Opportunities, and New Responsibilities for All,” Journal of Law and Education, vol. 23, no. 3 (summer 1994). 2 U.S. General Accountability Office, Title I Funding, Poor Children Benefit Though Funding Per Poor Child Differs, GAO-02-242, p. 1. 3 See, inter alia, Brown 50th Anniversary Commemoration. 4 Brown v. Board of Education, 347 U.S. 483 (1954).
1

acknowledged as the impetus for subsequent civil rights laws and policies to address the
educational rights of disenfranchised groups.
In the ensuing decades after the Brown decision, Congress became concerned
about the achievement gap between disadvantaged students, many of whom were
minorities, and their more advantaged peers and enacted legislation designed to improve
the performance of such children. A series of major legislative initiatives were passed to
improve educational opportunities for groups who had historically experienced
discrimination in American society, including minorities, children with disabilities,
students with limited English proficiency, and female students. Title VI of the Civil
Rights Act of 19645 was the first of these initiatives, and prohibits discrimination in
public schools and other federally assisted programs on the bases of race, color, or
national origin. Not only did Title VI create an unambiguous federal mandate to enforce
civil rights in the area of education, Title VI also represented an important extension of
the federal role in education by establishing the precedent of refusing federal financial
assistance as a means of influencing educational policies at the State and local level.
The Civil Rights Act of 1964 was followed by the Elementary and Secondary
Education Act of 19656 and the Equal Educational Opportunities Act of 1974,7 and with
these and other Acts federal aid to education increased markedly. The Elementary and
Secondary Act, enacted one year after the Civil Rights Act, created a number of financial
assistance programs benefiting the economically disadvantaged students primarily under
Title I of the Act. Title I is the largest federal program supporting education in
kindergarten through 12th grade (K-12), and an important source of funding for many
high-poverty school districts. Title I, Part A of the Elementary and Secondary Education
Act, allocated almost $12 billion in fiscal year 2003 to serve disadvantaged children in
approximately 90 percent of the nation’s school districts. Other parts of the Act provide
funding to local school districts to support educational opportunities for migrant children
and incentive grants to school districts to raise student achievement.
5 Pub. L. No. 88-352, 78 Stat. 252. 6 Pub. L. No. 89-10 (hereinafter cited as Elementary and Secondary Act). 7 Pub. L. No. 93-380, 88 Stat. 515 (codified as amended in scattered sections of 20 U.S.C. §§ 1701, 1720 (2006)).
2

In recent years, attention has concentrated on the persistence of an achievement
gap between various segments of the school age population. A series of studies showed a
persistent achievement gap between minorities, individuals from low-income households,
and children with disabilities and other students. In response, in 2001 Congress amended
and reauthorized the Elementary and Secondary Education Act with the No Child Left
Behind Act of 2001 (NCLBA).8 The No Child Left Behind Act of 2001 (NCLBA) was a
major shift in Federal policy regarding public schools, emphasizing accountability from
schools and districts for achieving minimum proficiency skills for all students regardless
of socio-economic status, race, family background, or disability. In particular, NCLBA
requires schools and districts to monitor and report on the annual yearly progress being
made by all students as well as students from demographic groups that traditionally
performed lower academically, i.e., minorities, students with disabilities, students from
low-income households, and students with limited-English proficiency. NCLBA also
established the requirement that all teachers be highly qualified for each core subject they
teach by the end of the 2005-06 school year.
Under NCLBA states are required to set annual performance goals for schools
that would result in all student being proficient in reading and math by school year 2013-
14, and students enrolled in schools not making annual yearly progress to that goal must
be afforded the choice to transfer to other schools or charter schools. In each of the first
two school years following the enactment of NCLBA, from 10 to 12 percent of schools
that received federal funds under Title I were identified for school choice, and about 1 in
20 public schools nationwide. Several million students enrolled in those schools
identified for choice were thus eligible to transfer, and about 31,000 students,
representing 1 percent of those eligible, transferred in the second school year 2003-04.9
8 Pub. L. No. 107, 115 Stat. 1425 (codified in scattered sections of 20 U.S.C.). 9 See U.S. General Accountability Office, No Child Left Behind Act: Education Needs to Provide Additional Technical Assistance and Conduct Implementation Studies for School Choice Provision, GAO-05-7 (2005).
3

African American Students in Kentucky Lag Behind Peers in Academic Achievement
The public school system in Kentucky is operated, managed, and monitored by
the Kentucky Department of Education. The department provides resources and guidance
to Kentucky’s 176 public school districts as they implement the State’s K-12 education
requirements. About two-thirds of the 176 school districts in the state are county-wide
school districts, the other third are independent city school districts that operate
independently within the boundaries of county school systems. The largest school district
in the State is the Jefferson County School District, which enrolls almost 90,000 students.
The largest city in the State, Louisville, is part of the Jefferson County School District,
and nearly half of all African American public school students in Kentucky attend school
in Jefferson County. The Fayette County School District is the second largest district in
the State, with about 30,000 students. This district includes the City of Lexington, the
state’s second largest city.
More than 90 percent of all African American students enrolled in Kentucky’s
public schools are concentrated in just ten (10) of the state’s 176 school districts.
According to a recent study by the Kentucky Commission on Human Rights, the ten
school districts with the largest number of African American students were, in order of
total enrollment: (1) Jefferson, (2) Fayette, (3) Hardin, (4) Christian, (5) Henderson, (6)
Shelby, (7) Covington, (8) Owensboro, (9) Bowling Green, and (10) Paducah.10 Three of
these districts, Covington, Bowling Green, and Paducah, are independent city-wide
school districts; the other seven are county-wide districts. (See Table 1.)
10 Kentucky Commission on Human Rights, “Ensuring Education Equality: Understanding the Achievement Gap in Kentucky’s Public School System,” September 2003.
4

Table 1: Kentucky School Districts with the Largest Numbers of African American Students
County Total
Enrollment White Percent White
African American
Percent African
American Jefferson 89,081 55,459 62.3 29,393 33.0 Fayette 31,725 22,402 70.6 7,336 23.1 Hardin 12,584 9,875 78.5 1,864 14.8 Christian 8,794 5,343 60.8 3,120 35.5 Henderson 6,913 6,144 88.9 652 9.4 Shelby 4,891 4,095 83.7 518 10.6 Covington 4,665 3,685 79.0 914 19.6 Owensboro 3,928 3,072 78.2 680 17.3 Bowling Green 3,413 2,324 68.1 790 23.1 Paducah 3,114 1,476 47.4 1,509 48.5 Bardstown 1,773 1,309 73.8 436 24.6 Hazard 1,016 855 84.2 121 11.9
Source: Kentucky Human Rights Commission.
African Americans More Than 15 Percent Behind Peers in Proficiency in
All Academic Subjects
In 2003, the Kentucky Commission on Human Rights released an independent
study on equal education in the state. The Commission reported that race continued to be
a major factor related to the achievement levels of Kentucky’s public school students.
Mean scores and the scale score indexes and gaps showed African American students
were more than 15 percent behind their white counterparts in all subjects in both
proficient and novice performance levels.11
“The gap faced by African American students for mathematics in the novice
category is almost 30 per cent. Hispanic students, similar to African American
students have about a 15 per cent gap in all subjects for proficient and novice
11 Kentucky Commission on Human Rights, Ensuring Education Equaltiy: Understanding the Achievement Gap in Kentucky’s Public School System, pp. 28-29.
5

(performance levels). Similarly there is a strong apparent correlation between
students in poverty and African American students.”12
Mean scores for mathematics, especially, showed high gaps, indicating the poor
analytical skills and training received by African American students. The data show that
while the gaps for African American students in proficient categories uniformly
decreased from elementary to middle to high school, the novice gaps increased from
elementary to middle to high school.13
In particular, the Commission noted that poverty and race affected educational
achievement. Students eligible for free and reduced lunches, the indicator of low income
levels at the school level, were more than 20 percent behind non-eligible students in
mean scores in the proficient category for reading, mathematics, and writing. In the
lowest category, novice, the mean score for low-income students exceeded 10 percent in
all three subjects, with mathematics and writing having steep gaps of 26 percent and 30
percent.14
Beverly Watts, former chair of the Kentucky Human Rights Commission, said
that “based on (the Commission’s) research…the KDE (Kentucky Department of
Education) needs to produce and maintain extensive data sets for analyzing the
performance scores and outcomes. Under Senate Bill 168, which was designed to reduce
achievement gaps, KDE has begun to maintain some data, but further sophistication is
needed….(And) while Senate Bill 168 focuses on reducing the achievement gap, it does
not insist on increasing the overall achievement levels. For instance, a school district that
has a low gap may also have a low overall achievement level….Before Senate Bill 168,
the Paducah Independent School District formed a bi-level task force, which has
developed measures that have produced slow but steady progress in reducing the
12 Ibid., pp. 3-4. For the Grade 4 Reading Assessment, the Kentucky Department of Education defines ‘novice’ as: “Student demonstrates minimal and/or incorrect knowledge of the text;” and the definition of proficient as: “Student demonstrates overall knowledge of the text, including some inferential as well as literal information.” (Kentucky Department of Education, Student Performance Standards, May 2005 located at http://www.education.gov/KDE). 13 Ibid., pp. 3-4. 14 Ibid., pp. 27-28.
6

gap….The recent collaboration by the Jefferson County school district and Louisville
business community is another example worthy of note.”15
Prior to the report by the Kentucky Human Rights Commission, the Kentucky
Department of Education (KDE) issued a task force report on student achievement in
2001 that similarly found a large and pervasive achievement gap between white and
African American students.16 Education performance legislation followed, and in 2002
the Kentucky Legislature required schools to specifically address the needs student sub-
populations of race, gender, poverty, English proficiency, and disability, by identifying
existing achievement gaps and setting biennial targets for improvement.17 In addition, the
legislation required school-based decision making councils in schools with substantial
achievement gaps to establish need-based plans to close the gap by 2014.18 These plans
must identify and address the issues that contribute to the existing achievement gaps
faced by each student sub-population. Schools failing to meet targets after two
consecutive two-year cycles are reported to the Commissioner on Education for review
and assistance.19
The achievement gap in Kentucky mirrors a national trend. Despite the 1954
Brown decision that ended de jure segregation in the schools and initiatives at the federal
level to increase academic performance for disadvantaged children, nationwide an
achievement gap persists between white students and African American students and the
gap has been increasing in recent years. From 1970 to the early 1990s the achievement
gap between the two groups declined, but beginning in the mid-1990s evidence showed
the achievement gap again widening.20 Results of the National Education Assessment
Program (NEAP) show that in 1998 white fourth grade students scored an average of 30
points higher than their African American peers. In addition, while 38 percent of whites
scored at the proficient level or above, only 9 percent of African Americans scored at this
15 Beverly Watts, “Report sheds light on state’s achievement gap,” Business First, Louisville, KY, Oct. 3, 2003, p. 67. 16 Kentucky Department of Education, All Means All, (2002). 17 Title XIII-Education, KRS § 158.6453(5) (2006). 18 Title XIII-Education, KRS § 158.649(4) (2006). 19 Title XIII-Education, KRS § 158.649(9) (2006). 20 Haycock, K, “Closing the Achievement Gap,” Educational Leadership, 58 (6); from http://www.ascd.org/readingroom/edlead/0103/haycock.htm.
7

level. Five years later, in 2003, among the nation’s eighth graders, 34 percent of white
students scored at the proficient level or above in mathematics, while only 5 percent of
African Americans scored at these levels.21
Poverty, Single-Parent Households, Racial Isolation, and Large Class Size Offered as
Explanations for Achievement Gap
A number of explanation have traditionally been advanced to explain differences
in student achievement. Prominent among these are household poverty, single-parent
homes, racial segregation, and large class size.
The disparity between low-income students’ performance on standardized tests
and the performance of their more affluent peers is well documented, and there is broad
consensus that poverty itself has an adverse affect on academic achievement.22 Research
has indicated the importance of socioeconomic status as a predictor of student
achievement.23 The General Accountability Office has reported that children from low-
income families are more likely than others to experience academic failure, and the
consequences of this failure follow them through their whole lives.24
On the National Assessment of Educational Progress (NAEP) reading assessment,
14 percent of fourth grade students who qualified for the free or reduced lunch program
(a measure of poverty) performed at or above the proficient level in comparison to 41
percent of those students who did not qualify for the program.25 Further, research
suggests that the impact of low-income on the achievement gap is more pronounced in
large urban areas—that is, students living in high-poverty, urban areas are even more
21 Education Trust, “Key Education Facts and Figures,” Education Watch, Winter 2003, from www.edtrust.org. 22 U.S. General Accountability Office, School Finance: Per-Pupil Differences between Selected Inner City and Suburban Schools Varied by Metropolitan Area, GAO-03-234 (2002), p.5. 23 See inter alia, U.S. General Accountability Office, School Finance: State and Federal Efforts to Target Poor Students, GAO/HEHS-98-36 (1998). 24 U.S. General Accountability Office, School-Age Children - Poverty And Diversity Challenge Schools Nationwide, GAO/HEHS-94-132 (1994). 25 U.S. Department of Education, National Center for Education Statistics, NAEP, The Nation’s Report Card: Fourth-Grade Reading 2000 (2001).
8

likely than other poor children to fall below basic performance levels.26 High
concentrations of poverty present additional problems for schools. Research has shown
that greater concentrations of poor children are associated with lower academic
performance, magnifying the risk of academic failure. These children are more likely to
drop out of school, and dropouts are more likely than high school graduates to be arrested
and to become unmarried parents. These negative consequences not only harm the
individual but also society through higher crime and unemployment rates and a lower
quality of life.27
Independent of a low-income household effect, some research suggests that
children from single-parent families are more likely to have lower academic achievement.
Although sometimes cited as a cause of low academic achievement, research on the effect
of single-parent families on academic achievement is conflicting and controversial. A
number of studies show a relation between single-parent households and lower academic
achievement. In contrast, a recent study evaluated the effects of socioeconomic status
paired with single and dual parent family structures to explain differences in achievement
between African American students and their white counterparts, and the results of the
study suggested that the academic achievement of African American students in either
family type was dependent on their socioeconomic status and not family status. The study
showed students from a lower socio-economic status and single parent homes scoring
higher than their dual parent home counterparts of equal socio-economic status, however
at median income levels there was no significant difference in achievement between
family types and at higher socio-economic status children of single parent family types
showed lower achievement scores than the dual family type children.28
Regarding the effect of racial segregation on the achievement gap, some research
shows that minority children in a highly segregated schools perform at a substantially
lower level than minority children in more integrated schools. It was the opinion of the
26 Educational Testing Service, unpublished tabulations from 1994 NAEP reading test. Cited in Education Week, Quality Counts, (1998). 27 Ibid. 28 Battle, Juan J., “What beats having two parents?: Educational Outcomes for African American students in single-versus dual-Parent families,” Journal of Black Studies, 28, (6), pp. 783-801.
9

NAACP in its argument to the Supreme Court in the 1954 Brown decision that equal
education opportunity could not be achieved under the guise of segregated schools. By
extension, some research theorizes that the racial isolation of African Americans from
their mainstream peers relates to lower academic achievement. In recent years, a number
of studies using more sophisticated statistical techniques have demonstrated that both
racial and socioeconomic composition have an affect on student achievement.29 In a
paper presented at a 2002 conference on school segregation, researchers reported that
socio-economic segregation does have an impact on school performance and that “with
whom children go to school rather than where they go to school matters.”30
Other research advances the theory that smaller class size reduces the adverse
effects of other factors on academic achievement by disadvantaged students. Research is
consistently showing a positive relationship between student achievement and smaller
class size. The Tennessee Student/Teacher Achievement Ratio (STAR) project was a 4-
year longitudinal study launched in the mid-1980s, where students were tracked from
enrollment through graduation. Though some have criticized the methodology, the study
found that those students in smaller classes generally had higher test scores, better
classroom participation and a greater likelihood of graduating and going to college. “This
research leaves no doubt that small classes have an advantage over large classes in
reading and math in early primary grades.”31
More recently, similar findings were reported in Wisconsin, particularly with
respect to poor and minority children. The Student Achievement Guarantee in Education
(SAGE) study concluded that poor, minority children benefit more from small classes
than children from more affluent families. In participating schools, classes in grades K
through 3 were reduced to 15 students, along with other strategies such as teacher
training, longer school hours, and a stronger curriculum. Minority and poor children in
the smaller classes performed significantly better than their peers in larger classes, and
29 See Caldas and Bankston, “Effect of School Population”; Caldas and Bankstom, “Inequality of Separation:; Rumberger and Williams, “Impact.” 30 Rumberger, Russell W. and Gregory J. Palardy, “Does Resegregation Matter?,” School Resegregation: Must the South Turn Back?, (Chapel Hill: University of North Carolina Press, 2005). 31 Project STAR, Tennessee’s K-3 Class Size Study, http://www.heros-inc.org.
10

the achievement gap of the minority students in smaller classes was substantially
curtailed.32
The Class Size Reduction (CSR) program in California also provides evidence for
higher test scores being related to students in smaller classes, though the researchers
acknowledged that it was uncertain how large a role the smaller classes had on improved
academic performance.33 That result is supported by a longitudinal study by Georgia
State University that was commissioned by the state’s Office of School Readiness. The
research reported that there is a long-term benefit associated with classes as small as 13
to 17 students in the primary grades and that smaller class sizes were particularly
significant in reducing the disadvantage effect of children coming from poor households.
That study found that about one-third of the children whose mothers did not complete
high school scored far lower on standardized tests and their low achievement resulted
from their little exposure in the home to the language and social skills essential for school
success. However, pre-K programs and smaller classes worked to overcome this
disadvantage so that these children had gained ground from the beginning of school to the
end of first grade.34
32 Smith, Phil, Alex Molnar, and John Zahorik, “Class Size Reduction in Wisconsin: A Fresh Look at the Data,” Education Policy Studies Laboratory, Arizona State University, http://edpolicylab.org. 33 California Department of Education, Class Size Reduction (CSR) Program, http://www.cde.ca.gov. 34 Henry, Gary, Georgia State University, http://www.gsu.edu/sps.
11

Family-Income
Single-Parent Homes
Racial Isolation
School Resources
Pre-School Experience
School Choice
Teacher Quality
Innate Abilities
?
Family Environment, Pre-School Academic Preparation, and School Choice
Also Offered as Explanations for Achievement Gap
In recent decades, factors other than household poverty, single-parent homes,
racial segregation, and class size, have been advanced to explain reasons for the
persistence of the achievement gap. These theories have included the effect of family
environment on learning, pre-existing disparities in academic preparation, and school
choice.
New research is suggesting that family environment affects academic
achievement as it provides the foundation for the development of the essential
psychological and emotional factors that account for academic success. One recent study
assessed a predominately minority-group sample on developmental traits, controlling for
socioeconomic status and family type, and children of single parent homes were
compared to children of traditional family, i.e., two-parent homes. Children were graded
on social development based on measurements of cooperation, assertion, self-control,
externalizing, internalizing and conflict management. No significant differences in
development were found to be related to family type, irrespective of the child’s gender.35
In a similar vein, there is a body of opinion that suggests that differences in social
norms among different cultures and racial groups may explain the achievement gap.
Abigail and Stephan Thernstrom assert that differences in social norms may play a role in
the underachievement of black students. The authors allude to the fact that African
35 Kesner, John E. & Patrick C. McKenry, “Single Parenthood and Social Competence in Children of Color,” Family in Society, 82, (2), pp.136-144.
12

Americans are particularly at risk for underachievement from birth due to factors such as
teen births, single parent homes and low birth weights as well as being behaviorally
unprepared for the educational environment. The authors also argue that the “process of
connecting black children to the world of academic achievement isn’t easy in the best of
educational settings” and must include issues of establishing “social norms” that will
counteract the negative aspect of various cultural attitudes, values and skills that are
shaped and reshaped by environment.36
Although the achievement gap is normally seen as a problem affecting school-age
children, experiences and environments outside the schools may play a pivotal role in
observed differences in academic achievement. If children enter school academically
behind their peers, subsequent testing of academic achievement may simply be reporting
pre-existing conditions independent of the school environment. Some of this research
suggests that observed differences in academic performance are simply a reflection of
pre-existing differences that children already bring with them to school, and proponents
of these theories argue that to the close the gap it is more important to deal with issues
that affect children prior to entering school and less important to deal with school issues,
Some proponents of this theory suggest that disadvantaged environments have
debilitating effects on school achievement and continue to linger throughout the child’s
educational experience.
The Early Childhood Education Longitudinal Study, Kindergarten Cohort (ECLS-
K), a nationally representative sample of nearly 23,000 kindergartners, showed that
African American and Hispanic children score substantially below white children at the
beginning of kindergarten on math and reading achievement,37 and a different study
showed that about 85 percent of African American three and four-year old children
scored lower on a vocabulary test than did the average white child.38
36 See Abigail & Stephan Thernstrom, No Excuses: Closing the Racial Gap in Learning, (New York: Simon & Schuster, 2003). 37 See Lee, Valerie E. and David T. Burkham, Inequality at the Starting Gate: Social Background Differences in Achievement as Children Begin Kindergarten, (Washington D.C.: Economic Policy Institute, 2002). 38 Jencks, Christopher and Meredith Phillips, eds., The Black-White Test Score Gap, (Washington D.C.: Brookings Inst., 1998).
13

In a South Carolina school equity lawsuit, the ruling judge spoke forcefully about
the critical role pre-school learning and preparation has on academic achievement. “The
child born to poverty whose cognitive abilities have been largely formed by the age of
six, in a setting devoid the printed word, the life blood of literacy and other stabilizing
influences necessary for normal development, is already behind… Early childhood
intervention at the pre-kindergarten level and continuing through at least grade three is
necessary to minimize, to the extent possible, the impact and the effect of poverty on the
educational abilities and achievements of those children.”39
In a similar vein, some research suggests that difference in children’s
socioeconomic background, parenting, brain development, and health contribute to racial
and ethnic disparities in school readiness. The Family and Child Experiences Survey
(FACES), an assessment administered to children entering Head Start, showed that the
program’s children, disproportionately minorities from low-income families, already are
up to a standard deviation points behind their peers in vocabulary, early reading, letter
recognition, and early math by ages three and four.40
The lack of school choice is now also cited by some researchers as a cause for the
achievement gap. Proponents of school choice argue that monopoly power in public
education reduces efficiency in the delivery of educational services. For example, the
Center for Education Reform argues that charter schools provide a higher level of
academic service to students who are under-served in the conventional public school
environment, including minority students and low-income students. In addition,
conventional public schools do not provide the specialized attention and tailored
programming that charter schools offer these students. "Year after year (our) survey
shows the depth of education charter schools provide to children most in need. They are
doing so with fewer resources, longer days and years, and through the use of more
39 Rick Noble, “Early Education Essential, Pays Off,” The State, Jan. 22, 2006, sec. D. 40 Cecilia Rouse, Jeanne Brooks-Gunn, and Sara McLanahan, eds, The Future of Children, School Readiness: Closing Racial and Ethnic Gaps, (Princeton University: Brookings Institute, 2005).
14

focused curricular approaches, such as college prep, math and science and core
knowledge programs."41
The Center also reports on studies that argue that the provision of school choice
improves academic achievement. For example, the Center cites a study by Caroline
Hoxby, Harvard University in September 2001, that examined the market effects of
increased competition on public schools in Arizona, Michigan, and Wisconsin. The
author found that public schools faced with more competition from charter schools and
vouchers had higher test score increases over time. The Center also reported that a study
by researchers of California Charter Schools in March 2002 finds that charter schools
serving low-income families had higher gains on student academic performance than
those in conventional public schools.42
Phillip Moffett, of School Choice Scholarships in Louisville Kentucky, expressed
similar sentiments. “The achievement gap is not about a performance gap between
African American children and other children, but really a gap between proficiency and
under-performance by poor children in general. Since such a large percent of African
American children are poor, it seems as though it is a racial issue. But focusing on the
racial aspect of the issue misses the essential problem. Low-income children in general
start behind their peers upon entering school. For example, a lower percentage of parents
in low-income families read to their children and studies show that children from low-
income households start school with a vocabulary of about 5,000 fewer words. And the
deficiency builds from there and perpetuates itself across generations. The lack of a
solution to this problem lies in improper incentives within the structure of the education
institution. Current incentives for public schools are attendance-driven, not performance
driven. If instead the focus for pay and rewards was performance based instead of
attendance based, there would be a paradigm shift that would focus on teaching and that
in turn would raise the performance of low-achieving children.”43
41 Jeanne Allen, Center for Education Reform, Press Release, Washington, DC February 27, 2006. 42 Center for Education Reform, Washington, DC, April 25, 2005, http://www.edreform.com.43 Phillip Moffett, School Choice Scholarships, interview, Louisville, KY, Aug. 11, 2006.
15

For this study of the achievement gap between African American students and
white students in urban areas, all school districts that had both a total district-wide
enrollment of at least 1,000 African Americans and a large central city were selected.
This included the five following urban school districts: (1) Christian County Public
Schools with the City of Hopkinsville; (2) Fayette County Public Schools with the City of
Lexington; (3) Hardin County Public Schools with the City of Elizabethtown; (4)
Jefferson County Schools with the City of Louisville; and (5) Paducah Independent
Schools. The State’s largest school system, Jefferson County, Louisville, was dropped
from the analysis because the attendance patterns of the elementary schools in the district
precluded an isolation of the factors at the school-level that were being examined in this
study as they relate to the achievement gap between African Americans and whites.
African Americans in Four Selected Kentucky Urban School Districts
Have Lower Reading Scores
In the four selected urban school districts selected, Christian, Fayette, Hardin, and
Paducah, an achievement gap between African Americans and whites exists as measured
by 4th grade CATS scores in the 2003-04 school year. The average reading scores of
African American children at schools in these districts generally lags behind that of all
students across the state.
Comparing scale scores, for the 56 schools examined as part of this study there
was a consistent pattern across all four selected school districts of the average school-
wide reading score of African American students being lower than both the state-wide
average. In Christian County average 4th grade reading scores of African Americans were
lower than the state average in 10 of the 11 schools. Similarly in the Fayette County
School District, average African American reading scores were lower than the average
state score at 27 of the 33 elementary schools. In the Hardin County School District, the
average African American reading score was lower than the state average in six of the
eight schools examined. Finally, in the Paducah Independent School District, the average
African American score was lower than both the state and district average in two of the
four elementary schools.
16

Christian County School District
Christian County is in the southwestern part of Kentucky along the border of
Tennessee and the Fort Campbell military reservation overlaps into the county.
According to the 2000 census, the county has a population of about 72,000 residents, and
Hopkinsville with a population of almost 31,000 residents is the largest city in the
county.44 The population in the county is about 70 percent white. African Americans are
the largest minority group, comprising about one-fourth of the county’s population, and
most live in the City of Hopkinsville. According to the 2000 census, almost 30 percent, or
3 in 10 persons, in the county were below the age of 18, and less than 3 percent of county
residents were foreign born.45
The Christian County School District is a county-wide district with 11 regular
elementary schools. African Americans are a sizeable proportion of the student body in
most of the schools, making up more than 30 percent of total enrollment in seven of the
elementary schools and being the majority racial group in two elementary schools,
Belmont Elementary and Highland Elementary. Crofton Elementary and Lacy
Elementary are the two schools with the lowest percentage of African American students,
13 and 15 percent respectively.46
Poverty, as measured by free and reduced lunch, is relatively high at most
elementary schools in the district. Eight of the 11 elementary schools have more than 60
percent of their students eligible for free and reduced lunch. Highland Elementary has the
highest poverty rate, 92 percent, and is also one of two elementary schools in the district
that is majority African American. Millbrooke Elementary has the lowest poverty count,
but eligibility for free and reduced lunch at that school still exceeds 30 percent.47
Generally speaking most children attending district schools live in two-parent
households. Census data estimates that in the neighborhoods around eight of the 11
44 2000 Census. 45 Ibid. 46 2004-05 School Report Card, Christian County Schools. 47 The source of this data is the free and reduced lunch eligibility count reported by the Christian County School District to the Kentucky Department of Education of students taking the 4th Grade Reading CATS in 2004-05 (obtained from Fayette County Schools).
17

elementary schools, less than one in four families are single-parent households. To obtain
an estimate of single parent households for the school, the census tract in which the
school was located was identified. The census count of the number for the “Female
Householder, No Husband Present with related children under 18 years” category. To
obtain the percentage, that number was divided by the number in the for the census tract
in the category, “Families with related children under 18 years,” and multiplied the
resulting decimal by 100 to give the percent.48
Table 2: Percent African American, Percent Free and Reduced Lunch Eligibility, Percent Single Parent Families, and Student-Teacher Ratio for Elementary Schools in the Christian County School District
School
Percent African
American
Percent Free and Reduced Lunch
Percent Single Parent
Families
Student Teacher
Ratio Belmont Elementary (1) 52 81 63 19 Crofton Elementary (2) 13 47 16 20 Highland Elementary (3) 58 92 47 17 Holiday Elementary (4) 34 51 17 18 Indian Hills Elementary (5) 47 76 31 16 Lacy Elementary (6) 15 66 15 19 Millbrooke Elementary (7) 29 38 23 19 Morningside Elementary (8) 39 72 24 18 Pembroke Elementary (9) 37 65 19 20 Sinking Fork Elementary (10) 29 60 15 17 South Christian Elementary (11) 31 63 9 20
Sources: Christian County School District, Kentucky Department of Education, and 2000 Census
An examination of these census data suggests a strong relationship between the
percent of estimated single-parent families and the percentage of African Americans at
the school. For example, the two schools with the highest estimated percentages of single
parent households, Belmont Elementary and Highland Elementary, are also the two
schools with the highest percentage of African American students. Table 2 lists for each
48 Census Table QT-P10 is the table from which the data was obtained.
18

school: the percent African American, percent free and reduced lunch eligibility, percent
single parent families by school, and the student-teacher ratio.49
The state-wide average 4th Grade Reading score on the CATS for the 2003-04
school year was 554, while the average score for students in the Christian County School
District was 544. The average 4th Grade school-wide reading score for African Americans
ranged from 520 to 554, and was lower than the state average at 10 of the 11 schools.
Figure 1: Average School-Wide Elementary School 4th Grade Reading Scores of White and African American Students in the Christian County School District for 2003-04 School Year
490500510520530540550560570580
1 2 3 4 5 6 7 8 9 10 11
Rea
ding
Sco
re
White Af.Am.
Note: For confidentiality purposes, the names of the individual schools are omitted and their order of presentation in the Figure is random. Source: Kentucky Advisory Committee from Christian County School District data.
49 The student-teacher ratio is from the school year, SY 2003-04, and was obtained from report cards posted by the Kentucky Department of Education.
19

Comparing the two groups of children within the district, the average school-wide
score for white children was 550 compared to 533 for African American children. In
addition, at each of the 11 elementary schools in the district, white children scored higher
than African American children. That is, at each elementary school the average school-
wide score for white children was higher than the average school-wide score for African
American children at the school. The greatest in-school difference between the two
groups was 26 scale points, and the smallest difference was 9 scale points. (Figure 1
shows school-wide average reading scores for African Americans and whites at the
eleven schools.)
Fayette County School District
Fayette County is in the central part of Kentucky and has a population of
approximately 260,000 residents and a land mass of about 2,000 square miles.50
According to the 2000 census, Lexington, with a population of over 200,000 persons, is
the largest city in the county and has nearly 80 percent of the county’s population. The
population in the county is predominantly white at 80 percent of the total population.
African Americans are the largest minority group in the county, comprising about 13
percent of the population and the majority of African Americans live in the City of
Lexington. According to census data, about 1 in 5 county residents were below the age
of 18, and about 6 percent of all county residents were foreign born.51
The Fayette County School District is a county-wide district with 34 regular
elementary schools. According to district officials, “During the 2004-2005 school year,
there were 34 kindergarten through 5th grade elementary schools in the county. Thirty-
one of these schools had an assigned attendance area, and residents of these areas made
up the majority of each school’s population. The remaining 3 schools had magnet
programs where the parents applied to have their child attend. Maxwell Elementary and
the Academy at Lexington were school-wide magnets with no attendance area. Dixie
elementary had both an attendance area and an in-school magnet program.”52
50 Ibid. 51 Ibid. 52 Dr. Kim Hooks, Fayette County School District, interview, Aug. 8, 2005.
20

The percent of African Americans at the individual schools in the district varies
widely, from a low of 4 percent at Clay Mills Elementary to a high of 70 percent at
Booker T. Washington Elementary. Only five schools in the district are majority African
American, Ashland (59 percent), Harrison (51 percent), Johnson (66 percent), Northern
(51 percent), and Booker T. Washington, and at two-thirds of the elementary schools in
the district African Americans are less than 30 percent of total enrollment.
Poverty, as measured by free and reduced lunch, is relatively high throughout the
school district.53 Fourteen (14) of the 33 elementary schools have 50 percent or more of
their students eligible for free and reduced lunch, and at all but five elementary schools at
least 20 percent of the children are from low-income families. Booker T. Washington
Elementary and Johnson Elementary are the two schools with the highest poverty rates in
the district, at 93 and 95 percent respectively.
There is a large number of schools in the district with an estimated high
percentage of single-parent households. At about two-thirds of the elementary schools in
the district, it is estimated that 1 out of every 4 households with children are single-parent
households. At three schools, Booker T. Washington, Johnson, and Tates Creek, it is
estimated that 1 out of every 2 households with children are headed by a single parent.
Notably, these three schools have relatively high percentages of African American
students. Table 3 lists for each school, the percent African American, percent free and
reduced lunch eligibility, percent single parent families by school, and the student-teacher
ratio.54
53 See Note 5. 54 The student-teacher ratio is from the previous school year, SY 2003-04, and was obtained from the Common Core of Data.
21

Table 3: Percent African American, Percent Free and Reduced Lunch Eligibility, Percent Single Parent Families, and Student-Teacher Ratio for Elementary Schools in the Fayette County School District
School
Percent African
American
Percent Free and Reduced Lunch
Percent Single
Mother Families
Student Teacher
Ratio Arlington 24 83 38 9 Ashland 59 81 29 11 Athens 11 25 8 12 Booker T. Washington 70 93 57 11 Cardinal Valley 16 90 36 10 Cassidy 17 27 25 13 Clays Mills 4 15 19 17 Deep Springs 39 63 31 14 Dixie Magnet 26 39 31 15 Garden Springs 5 24 24 16 Glendover 8 31 13 14 Harrison 51 96 43 8 James Lane Allen 24 52 25 12 Johnson 66 95 56 9 Julia R Ewan 22 54 25 12 Julius Marks 27 46 20 15 Lansdowne 19 44 42 14 Linlee 35 49 15 13 Madeline Breckinridge 44 77 25 13 Mary Todd 48 83 37 10 Maxwell 18 11 43 17 Meadowthorpe 22 29 31 14 Millcreek 26 50 39 13 Northern 51 67 31 10 Picadome 9 34 26 13 Rosa Parks 6 6 10 15 Russell Cave 28 83 14 10 Southern 21 40 30 15 Squires 18 38 23 14 Stonewall 5 12 8 16 Tates Creek 44 71 50 12 Veterans Park 5 5 10 17 Yates 14 45 31 10
Sources: Fayette County School District, 2000 census, and Common Core of Data.
22

The average district scale score in Fayette County on the reading assessment test
in the 2003-04 school year was 555, which was higher than the state-wide average of
554. 55 However, African American children in the district lagged behind their state-wide
peers. The average school-wide reading score for African Americans ranged from 511 to
576, but at only 6 of the 33 elementary schools did the average school-wide reading score
for African American children equal or exceed the state average.
Within the district, the average school-wide reading score for African American
children was lower than the district average score at 28 of the 33 elementary schools, and
some differences were very large. For example, at one school the difference between
average scores of African Americans and whites was 44 scale points, and at 17 other
schools the difference was more than 20 scale points. Notably, at three of the five schools
in the district where the average reading score of African American children was higher
than the district average the percentage of African American children attending the
school was less than 10 percent.
Not only did the average school-wide reading score of African American children
generally lag behind the state and district averages, but African American children
performed more poorly than white children in all but two elementary schools. The highest
difference in scores between the two groups was 48 points, whereas the highest
difference when African American children scored higher than white children was four
points.
Hardin County School District
Hardin County is in the north central part of the state just south of Jefferson
County and the city of Louisville. The Fort Knox military reservation is adjacent to the
county’s boundaries, and Elizabethtown is the largest city in the county. The county has a
population of almost 100,000 persons, and about one-quarter of those live in the City of
Elizabethtown.56 The population of the county is predominantly white, about 80 percent.
African Americans comprise about 12 percent of the county’s population and about 20
percent of the population of Elizabethtown. According to the 2000 census, about 3 in 10
55 Scores for the Lexington Academy for the 2003-04 school year were not available. 56 Ibid. 56
23

residents of the county were below the age of 18, and about 5 percent of county residents
were foreign born.57
The Hardin County School District is a county-wide district with 12 regular
elementary schools. Schools in the district are generally attendance zone schools, and
“the majority of the children in the school district attend a neighborhood school.”58 Test
data for African American children for the 2003-04 school year was only available from
8 of the 12 elementary schools.59 African Americans comprise 20 percent or more of total
enrollment at four of the eight schools, Meadow View, New Highland, Parkway, and
Woodland, where they are 34, 20, 22, and 30 percent of the student populations
respectively. At three of the eight schools examined, African Americans are less than 10
percent of all students.
Poverty, as measured by free and reduced lunch, is relatively high in the school
district. At five of the eight examined schools more than 40 percent of all children are
eligible for free or reduced lunch. Parkway Elementary has the highest free and reduced
lunch eligibility, 70 percent, and is also a school with one of the higher percentages of
African American students.
In contrast to the high poverty rate, the percent of single parent households in the
district is comparatively low to the other districts in the study. In only two elementary
schools is the rate of single-parent households estimated to be as high as 30 percent,
though notably these two schools also have relatively higher percentages of African
American students than other schools in the district. Table 4 lists the percent African
American, percent free and reduced lunch eligibility, percent single parent families, and
student-teacher ratios for each school.60
57 Ibid. 58 Rita Wasman, Hardin County School District, interview, Aug. 3, 2005. 59 Four elementary schools, Howe Valley, Rineville, Creekside Sonora, and Creekside Upton, were not included in the analysis because test scores were not available for African American students. 60 The student-teacher ratio is from the previous school year, SY 2003-04, and was obtained from the Common Core of Data.
24

Table 4: School Enrollment for the 2004-05 School Year, Percent African American, Percent Free and Reduced Lunch Eligibility, Percent Single Mother Families, and Student Teacher Ratio for Elementary Schools in Hardin County School District
School
Percent African
American
Percent Free and Reduced Lunch
Percent Single
Mother Families
Student Teacher
Ratio G.C. Burkhead Elementary (1) 14 38 25 16 Lakewood Elementary (2) 3 51 13 16 Lincoln Trail Elementary (3) 2 35 14 16 Meadow View Elementary (4) 34 53 29 16 New Highland Elementary (5) 22 47 20 14 Parkway Elementary (6) 23 70 30 12 Vine Grove Elementary (7) 6 39 21 15 Woodland Elementary (8) 30 53 30 16
Sources: Hardin County School District, 2000 census, and Common Core of Data. Howe Valley, Rineville, Creekside Sonora, and Creekside Upton Elementary are not included because no test scores were available for African American students.
The district average on the 4th grade CATS reading test was 548 in the 2003-04
school year, slightly lower than the state average of 554. The average school-wide score
of African Americans students was lower than the state average at six of the eight
schools, but the differences were generally very modest.
In contrast to the Christian and Fayette school districts, the average reading scores
of African American children did not in general lag behind that of white students at the
same school. Though white students outperformed African American children at four of
the eight elementary schools, African American children outperformed white children at
three schools and at one school there was no difference between the two groups. At the
four schools where African American children did lag behind their white peers, the
differences were modest ranging from 26 scale points to 3 scale points. Figure 3 shows
the reading scores of the two groups by school.
25

Figure 2: Average School-Wide Elementary School 4th Grade Reading Scores of African American Students and White Students in the Hardin County School District for 2003-04 School Year
500
510
520
530
540
550
560
570
1 2 3 4 5 6 7 8
Ave
rage
Rea
ding
Sco
re
White Af. Amer.
Note: For confidentiality purposes, the names of the individual schools are omitted and their order of presentation in the Figure is random.
Source: Kentucky Advisory Committee from Hardin County School District data.
Paducah Independent School District
The Paducah Independent School District is an independent, non-county-wide
school districts in the state. African Americans comprise about half of the district’s
enrollment, and two elementary schools, Cooper-Whiteside and McNabb, have a majority
African American enrollment. At the other two elementary schools in the district, Clark
Elementary and Morgan Elementary, African Americans are 31 and 38 percent of the
student body respectively.
Generally speaking, children attend schools from attendance zones around the
school, and there are no “choice” schools in the district. The district also enrolls a small
number of children from outside the district. “The majority of the children in the school
district attend a neighborhood school. Clark Elementary is the school in the district with
26

the most children from other districts and it has about 135 children from other districts.
McNair Elementary has five children from other districts, and Morgan Elementary 10.”61
Poverty, as measured by free and reduced lunch, is very high throughout the
district and at three of the four elementary schools the percentage of low-income students
exceeds 90 percent. At Cooper-Whiteside virtually every child at the school comes from
a low-income household, and at McNabb and Morgan more than 90 percent of the
children come from low-income households. Clark Elementary has the lowest percentage
of children eligible for free and reduced lunch in the district, and it still is about the half
of total enrollment at the school.
The estimates of the percentage of children living in single-parent households for
the four schools are also high. At three of the four elementary schools, more than 40
percent of children attending school are estimated to live in a single-parent households.
Clark Elementary, the school with the lowest percentage of both low-income children and
African American students is the school with the lowest estimated percentage of single-
parent households, about 13 percent. Table 5 lists the percentage of African American
students, the percentage of students eligible for free and reduced lunch, the estimate of
single parent families, and student teacher ratios for elementary schools in the Paducah
School District.62
61 Sheila Hensley, Paducah Independent School District, interview, Aug. 3, 2005. 62 The student-teacher ratio is from the previous school year, SY 2003-04, and was obtained from the Common Core of Data.
27

Table 5: School Enrollment for 2004-05 School Year, Percent African American, Percent Free and Reduced Lunch Eligibility, Percent Single Parent Families, and Student Teacher Ratio for Elementary Schools in Paducah Independent School District
School
Percent African
American
Percent Free and Reduced Lunch
Percent Single Parent
Families
Student Teacher Ratio*
Clark Elementary (1) 37 49 13 17 Cooper-Whiteside Elementary (2) 67 98 56 10 McNabb Elementary (3) 68 92 44 13 Morgan Elementary (4) 47 92 45 12
Note: Student-Teacher ratios are from published report card data by the Kentucky Department of Education, 2003-04 school year. The Superintendent of the Paducah District reports classroom Student-Teacher ratios for the schools to be: Clark (22-1); Cooper (17-1); McNabb (19-1); and Morgan (17-1).
Sources: Paducah Independent School District, 2000 census, and Common Core of Data.
For the 2003-04 school year, the average reading assessment score in the district
was 557, higher than the state average of 554 and the highest district average score
among the four studied. Though the average school-wide score of African American
students was lower than the state-wide average at three of the four schools, it had a very
low range. Moreover, the lowest school-wide average score for African Americans was
541, only 13 points below the state-wide average.
Within the district, the average school-wide score for African American was
below the district average at all four elementary schools. In addition, the average scores
for African American children also lagged the average scores of white children at each
elementary school. The range of these differences was from 22 points to13 points. Figure
4 shows the average scores for whites and African Americans by school.
28

Figure 3: Average School-Wide Elementary School 4th Grade Reading Scores of African American Students and White Students in the Paducah Independent School District for 2003-04 School Year
520
530
540
550
560
570
580
1 2 3 4
Ave
rage
Rea
ding
Sco
re
White Af. Amer.
Note: For confidentiality purposes, the names of the individual schools are omitted and their order of presentation in the Figure is random. Source: Kentucky Advisory Committee from Paducah Independent School District data.
Low-Income Significantly Contributes to Achievement Gap
Correlation analysis showed positive relationships between low-income students,
African American enrollment, and single parent households with the size of the
achievement gap. Regression analysis, analyzing the impact of all the variables
collectively, showed that only the percentage of low-income students at a school was
significantly related to the size of the achievement gap. The percentage of single parent
families and African American students at a school was not found to influence the size of
the achievement gap, nor were student-teacher ratios.
29

Achievement Gap Correlated with Single Parent Households, Low-Income, and
Percentage of African American Students
Correlation analysis showed school percentages of low-income students, African
American enrollment, and single parent households negatively correlated with the
achievement gap, with the percentage of low-income families exhibiting the strongest
correlation. That is, as the percentages of low-income students, African American
students, and children from single parent households increase at a school there is a
corresponding increase in the size of the achievement gap between African American
children at the school and the average state achievement.
Table 6: Correlations for the Variables: Percent Low-Income Students, Percent African American Enrollment, Percent Single Parent Households, Achievement Gap Percent Percent Percent Achievement Low-Income Af. Amer. Sing. Parent Gap
Percent Low-Income 1.0 0.81 0.61 0.41 Percent African American 1.0 0.68 0.24 Percent Single Parent 1.0 0.14 Achievement Gap 1.0
Source: Kentucky Advisory Committee.
30

The three independent variables were also found to be significantly correlated
with each other.63 The strongest correlation was the positive relationship exhibited
between the percentage of students at a school that were African American and the
percentage of single parent households at the school (p = 0.81). That is, schools with high
percentages of African American students also had high percentages of single parent
family households. Similarly, there was a strong and significant correlation between the
percentage of African American students at a school and the percentage of students
eligible for free and reduced lunch (p = 0.61). Additionally, the estimated percentage of
single parent households at a school was positively correlated with both the percentage of
African American students at a school as well as the percentage of students from low-
income families.
Regression Analysis Finds Low-Income Only Factor Related to Achievement Gap
Regression analysis analyzed the effect of four independent variables collectively
on the achievement gap, and only low-income was significantly related. Single parent
families, African American enrollment, and student-teacher ratios were not found to
influence the size of the achievement gap.
Regression analysis was employed to examine the relationship between the
difference in reading achievement and four school-related independent variables: (1) the
percent of single family homes at the school, (2) the percent of students eligible for free
and reduced lunch at the school, (3) the percent of African American students at the
school, and (4) student-teacher ratio at the school. The general purpose of multiple
regression is to analyze the relationship between several independent or predictor
variables and a dependent variable.64 The major conceptual limitation of all regression
techniques is that one can only ascertain relationships, but never be sure about underlying
causal mechanisms.
The regression in this analysis included data from all four school districts in one
collective analysis. The dependent variable of the regression, or variable explained by the
predictor variables, was the difference between the average school-wide African
63 Significance level of 0.05. 64 Statistica, General Conventions and Statistics, vol. I., (Tulsa, OK, 2000), p. 1643.
31

American reading score and the average state score. For example, the statewide average
scale score on the reading assessment in the 2003-04 school year was 554. If the average
reading score for African Americans at school A was 534 and at school B 544, the
differences were 20 and 10 respectively. These differences for each school were the
measure of the achievement gap.65
The analysis showed a significant and positive relationship to exist only between
the percentage of low-income students at a school and the size of the achievement gap
(p=0.009). That is, controlling for the effect of single parent households, the percent of
enrollment that is African American, and student-teacher ratios, as the percentage of low-
income children increased at a school the trend for the difference in reading scores
between African Americans and other children similarly increased.
Figure 4: Scatterplot of Achievement Gap with Percent Free and Reduced Lunch
0
20
40
60
80
100
120
-40 -20 0 20 40 60
Achievement Gap
Perc
ent F
ree
and
Red
uced
Lu
nch
Source: Kentucky Advisory Committee
65 For some schools, the average reading score of African American children was higher than the state average score. For these schools, the measure of the achievement gap is a negative number.
32

In contrast, the other three explanatory variables were not found to have a
significant relationship with the size of the achievement gap of African Americans. That
is, regression analysis showed that the difference between the average school-wide
African American reading score and the average state score was not related to the
percentage of African Americans at the school (p=0.501), nor to the percentage of single-
parent households at the school (p=0.415), nor to student-teacher ratios at the school
(p=0.829). The regression results are set out in Table 7.
Examining the estimated parameter of single-parent households with the
dependent variable, the datum showed a surprising neutrality. That is, the size of the
achievement gap observed at a particular school was virtually independent of the
percentage of children at the school from single parent families. The results come down
on the side of the single parent family, independent of itself, not being a contributing
factor to poorer academic achievement by minority students. Similarly with respect to
concentrations of African Americans, the results suggested that it was not the racial
isolation of African Americans that caused poorer performance, but rather the high
poverty often associated with schools with high percentages of African Americans.
Regarding the benefits of small class size, some researchers dispute its benefits
and this study ostensibly supported that position. But, given the previously cited research,
it is more likely that class size and its observed neutral effect in this study on reducing the
achievement gap has an explanation consistent with other research. The cited research
shows the effectiveness of small class size in early grades across socio-economic
spectrums. Coupled with the demonstrated effectiveness of small class size in early
grades and the results that such additional resources have failed to overcome the
achievement gap among poor and urban African Americans, these regression results may
more properly be a reflection of the formidable adversarial nature of poverty rather than
the ineffectiveness of smaller class size.
33

Table 7: Regression Results For Reading Score Gap and Percent of Single Family Homes, Percent of Students Eligible For Free And Reduced Lunch, Percent of African American Students, and Student-Teacher Ratio
Dependent variable: Reading Score Gap R² = 0.1917 F(4,51) = 3.0254 p<0.02583 N=56 Independent variable Beta B p-level Constant 5.578 .669 Percent Single Parent -0.1218 - 0.129 .501 Percent Low-Income* .6117 0.351 .009 Percent African American -0.1804 - 0.140 .451 Student-Teacher Ratio -0.0311 - 0.452 .829 * Significant at the 0.05 level.
Source: Kentucky Advisory Committee.
34

Finding and Recommendation
Finding. A large and persistent achievement gap between African American
students and their peers is a national phenomenon, and such a phenomenon is also present
in the Commonwealth of Kentucky. This situation has been part of the education
landscape for decades, and no real headway has been made to close this gap despite
legislation at both state and federal levels.
Though most likely the interplay of a number of factors, the Kentucky Advisory
Committee finds that regardless of other factors such as teacher quality, family structure,
class size, or racial isolation, poverty matters and acts to impede academic achievement.
This is not to say that “poor” children can not learn, but rather that they are not learning
at a satisfactory level in schools with high numbers of low-income children.
Recommendation. All of today’s children will be tomorrow’s adults, and the
education of each of them is critical to society’s well-being in the future. Public schools
reflect the social priorities of the culture in which they exist. The existence of both an
achievement gap between African American children and other children as well as
generally low academic performance among low-income children in the State is evidence
that education is not a serious priority in Kentucky.
This finding and the critical role of education for the future well-being of society
demands that the citizens of the Commonwealth, its government leaders, and its school
officials jointly address this issue. The pursuit of any and all efforts to improve the
academic performance of African American children and all children in the
Commonwealth should continue to be evaluated. Though a one-size-fits-all approach
rarely fits—especially in such a complex culture and on a complex issue—it is
nevertheless urgent that there be widespread and general support for efforts to effectively
confront and resolve this social problem.
35

Appendix I – Methodology and Limitations The scope of this project is the achievement gap between African American
students and other students in 4th grade reading achievement as measured by the
Commonwealth Accountability Testing System (CATS) in urban school districts in
Kentucky with a total African American student enrollment greater than 1,000 students.
Five school districts in the State met the minority student population criteria: (1)
Jefferson County Public Schools (Louisville); (2) Fayette County Public Schools
(Lexington); (3) Christian County Public Schools (Hopkinsville); (4) Hardin County
Public Schools (Elizabethtown); and (5) Paducah Independent Schools. Jefferson County
schools were eliminated from statistical analysis because, unlike the other four school
districts, the attendance patterns for the elementary schools did not allow for the
straightforward examination of neighborhood characteristics.
For each elementary school in the four selected school districts the following
information was obtained: (1) the average school-wide 4th grade CATS reading scores for
white and African American students for the 2003-04 school year, (2) total enrollment,
(3) number of white children, (4) number of African-American children, (5) the number
of children at the school eligible for free or reduced lunch, and (6) student-teacher ratios.
Student-teacher ratios were obtained from the publicly available report cards from the
Kentucky Department of Education. In some few cases, no African American children at
the school were reported to have taken the CATS test and these schools were not
included in the study.
From these data two additional variables were computed for each school, (1)
percent eligible for free or reduced lunch and (2) percent African American. The percent
of single parent families at the school was estimated using the percent of single parent
families in the same census tract as that in which the school was located. The measure of
the achievement gap was computed as the difference in the average school-wide CATS
reading score between African Americans at the school and the average 2003-04 state
score for all students.
Two other variables were included in the analysis, but were subsequently
dropped. School choice was originally included, with schools of choice within a district
identified and controlled for in the regression. Also, the percent of home ownership in the
36
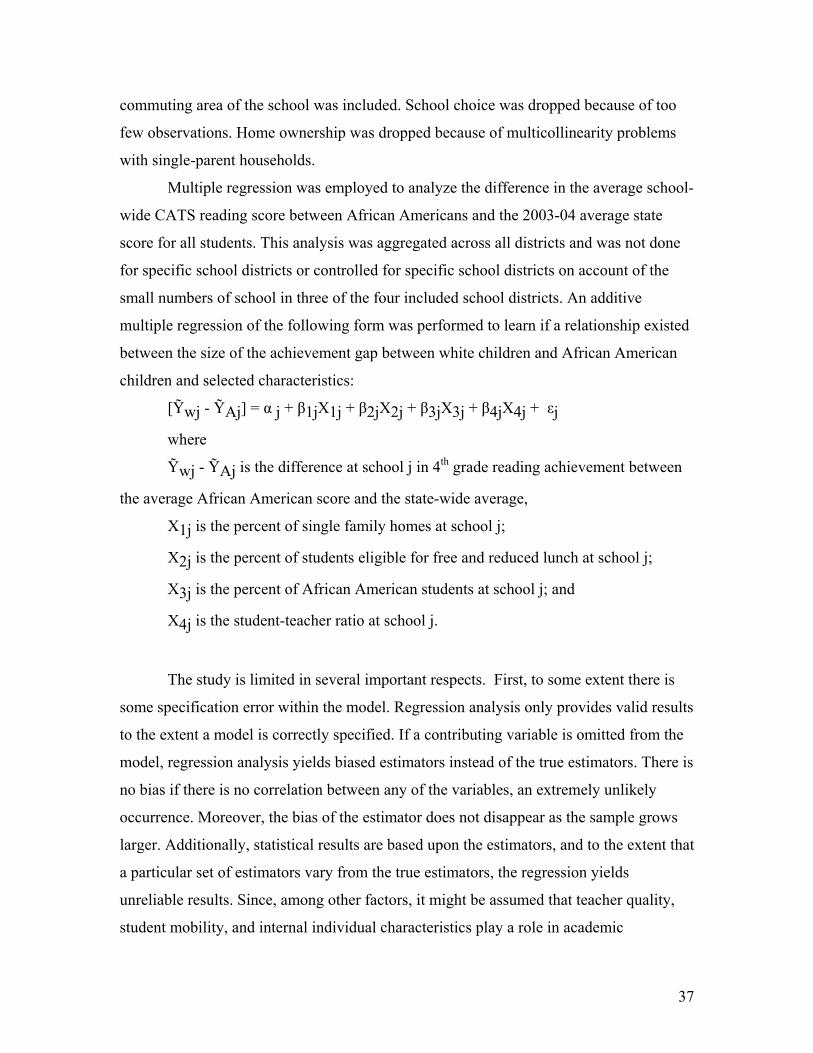
commuting area of the school was included. School choice was dropped because of too
few observations. Home ownership was dropped because of multicollinearity problems
with single-parent households.
Multiple regression was employed to analyze the difference in the average school-
wide CATS reading score between African Americans and the 2003-04 average state
score for all students. This analysis was aggregated across all districts and was not done
for specific school districts or controlled for specific school districts on account of the
small numbers of school in three of the four included school districts. An additive
multiple regression of the following form was performed to learn if a relationship existed
between the size of the achievement gap between white children and African American
children and selected characteristics:
[Ỹwj - ỸAj] = α j + β1jX1j + β2jX2j + β3jX3j + β4jX4j + εj
where
Ỹwj - ỸAj is the difference at school j in 4th grade reading achievement between
the average African American score and the state-wide average,
X1j is the percent of single family homes at school j;
X2j is the percent of students eligible for free and reduced lunch at school j;
X3j is the percent of African American students at school j; and
X4j is the student-teacher ratio at school j.
The study is limited in several important respects. First, to some extent there is
some specification error within the model. Regression analysis only provides valid results
to the extent a model is correctly specified. If a contributing variable is omitted from the
model, regression analysis yields biased estimators instead of the true estimators. There is
no bias if there is no correlation between any of the variables, an extremely unlikely
occurrence. Moreover, the bias of the estimator does not disappear as the sample grows
larger. Additionally, statistical results are based upon the estimators, and to the extent that
a particular set of estimators vary from the true estimators, the regression yields
unreliable results. Since, among other factors, it might be assumed that teacher quality,
student mobility, and internal individual characteristics play a role in academic
37

achievement and these are not quantitatively constructed into the model, the above model
would have a degree of internal misspecification and may yield unreliable results.
Second, statistical relationship does not indicate causation. The existence of a
relationship between two variables is a necessary condition for causation, but not a
sufficient condition. An observed and asserted relationship between an explanatory
variable and the difference in achievement scores could have a relationship that is
spurious and non-causal. Further, there is the possibility that two variables could be
coincidentally and causally moved by a distinct and unaccounted third variable. For
example, a higher percent of single parent minority families might be observed to be
related to a lower achievement scores, but a third and unaccounted factor could be the
true causal agent for the observed increases in the two variables and the two variables
themselves are not causally related.
Finally, the individual characteristics of the students are not considered in the
analysis. The considered variables in this study, percent African American, percent
single-parent households, percent low-income, and student-teacher ratios, are school level
aggregate measures. The lack of individual student information could yield different
results. For example, it is observed that a higher percentage of children from low-income
families at a school is related to a higher achievement gap, but an examination of
individual student data might reveal that individual students from low-income households
do not exhibit a relationship with a larger achievement gap and it is only at the school-
level aggregation of the data that such are observed to be related.
38

Appendix II – Agency Comments
The Kentucky Advisory Committee provided a draft of this report for review and
comment to the four school districts examined as part of this study, Christian County
Schools, Fayette County Schools, Hardin County Schools, and Paducah Independent
Schools. Two school districts, Fayette County Schools and Hardin County Schools,
provided extensive comments and the comments from both school districts are presented
in this appendix.66
In addition, after reviewing a draft of this report the Fayette County Schools and
Paducah Independent Schools provided new information to the Advisory Committee that
was incorporated, as appropriate, into the report. The Fayette County School District
provided more accurate numbers regarding the number of children at schools who were
eligible for free or reduced lunch. The Paducah Independent School District provided
guidance on student-teacher ratios and noted that the student-teacher ratios as used in the
report were correct, but that the numbers reported are from the Kentucky Department of
Education and these numbers include Title I teachers that are funded by the federal
government.
66 Sections of the letter from Stu Silberman, Superintendent, Fayette County Schools, that reported errors that were corrected in the final draft are not included in the comments presented in the appendix from the Fayette County Schools.
39

Comment from the Fayette County School District
Fayette County Public Schools
August 18, 2006
Dr. Peter Minarik Regional Director, Southern Regional Office U.S. Commission on Civil Rights Atlanta Federal Center, Suite 18T40 61 Forsyth St., SW Atlanta, GA 30303
Dear Dr. Minarik:
Thank you for the opportunity to provide feedback on the document Equal Education
Opportunity in which the Fayette County Public Schools are discussed. My belief is that
we can all be in agreement with the final conclusion of this report that “Poverty Matters”,
but that this conclusion may be discounted or overlooked because of errors with the
report.
The first of these is the issue of possibly incorrect data coming from different sources and
representing different years. Data seems to have come from the U.S. census of the year
2000, from state reporting of test results for 2003-2004…, while additional demographic
data comes from 2002-2003. While we appreciate the difficulty of being consistent when
gathering data from a variety of sources it would be a stronger report with more
consistency….
Another difficulty with the date reporting arises when the report discusses for African
American students from all of the Fayette County Elementary schools. The Kentucky
Department of Education does not report on this group of students at all of our
elementary schools because of issues of confidentiality when reporting on groups of
40

students of 10 or less. This becomes an issue at just a few of our schools but it calls into
question some of the statements on page 22 of the report….
The final data issue to be raised herein concerns how a regression analysis was applied to
these data. Although we would agree that regression is the appropriate technique to be
used, without reporting how the order of the independent variables was determined it is
not possible to understand the outcomes of the analysis. By predetermining the entry
order it is possible to shift the outcomes so that different conclusions could be
determined. This is especially true when looking at race and poverty and the relationships
to achievement….
Again, thank you for the opportunity to have the comments of the school districts
involved included in the publication of this report.
Stu Silberman
Superintendent
Fayette County Schools
41

Comment from the Hardin County School District
Equal Education Opportunity
An Analysis of the Racial Achievement Gap
In Kentucky Urban Schools
Hardin County Schools
August 15, 2006
This report by the Kentucky Advisory Committee to the U.S. Commission on
Civil Rights is positive testimony to the success of eight Hardin County elementary
schools in closing the achievement gap in reading between African American students
and white students….
Most notably is the fact that, in four of the eight elementary schools in Hardin
County, African American students either exceeded or equaled the achievement of white
students. This certainly is cause for celebration of the success of Hardin County
elementary schools in addressing the need of learners.
The researchers, however, do not attribute the achievement gap of African
American students to race. Rather, it is poverty (as measured by free/reduced lunch) that
they conclude is the determining factor. Their conclusion matches that of Rothstein in
Class and Schools: Using Social, Economic, and Educational Reform to Close the Black-
White Achievement Gap. Rothstein, after having completed a meta-analysis of a large
number of research studies, discovered that the success of many schools throughout the
nation that have closed achievement gaps was largely due to the social programs and
supports for children in poverty. The majority of the studies he addresses incorporated
extra supports for children of poverty, to include programs such as free health care, free
vision care and eyeglasses, greater social services and counseling support, etc.
The Civil Rights Advisory Committee report is also reminiscent of educator Ruby
Payne’s work with children in poverty. Ms. Payne, a practitioner and researcher, devotes
her work to the social mores of low income families, noting that social supports are
imperative to enhancing student success.
42

Our legislators need to take note of this and other studies that empirically verify
the need for more supports and interventions to foster success for our students.
Thus, a further focus for study might be the causative factors in the eight Hardin
County elementary schools that engendered such high achievement levels for African-
American students.
A word of caution: the researchers, in their conclusion list the limitations of the
study (a common occurrence in research design). As a result, they note that there is some
“…specification error within the model” and that “…statistical relationship does not
indicate causation.”
43