epri soil vapor intrusion field research program ...events.awma.org/education/final...
TRANSCRIPT
1
EPRI Soil Vapor Intrusion Field Research Program – Evaluation of Soil Vapor Attenuation above Residual MGP Impacts at a Site in Wisconsin Ian Hers1, Jim Lingle2, Frank Dombrowski3, Ed Murphy4, Todd Rees5, Parisa Jourabchi1,6
K. Ulrich Mayer6
1 Golder Associates Ltd., Burnaby, BC, Canada 2 Electric Power Research Institute, Brown Deer, WI, USA 3 We Energies, Milwaukee, Wisconsin, USA
4 Golder Associates Inc., Buffalo, NY, USA 5 Golder Associates Inc., Amherst, MA, USA 6 University of British Columbia, Vancouver, Canada Principal Contact: Ian Hers, Ph.D., P.Eng., Golder Associates Ltd., 4260 Still Creek Drive, Burnaby, British Columbia, Canada, V5C 6C6, phone 604-296-4233 fax 604-298-5253
ABSTRACT Soil vapor intrusion is a commonly evaluated exposure pathway at Manufactured Gas Plant (MGP) sites, but questions remain on assessment methods, fate and transport processes and generic factors or models for assessing this pathway. The Electric Power Research Institute (EPRI) has undertaken a multi-year, field focused study of soil vapor intrusion at MGP sites. A goal of the study has been to better understand key soil vapor processes and to develop better strategies and methods for soil vapor intrusion at sites with differing issues, particularly non-redeveloped sites requiring prospective assessment.
Research in Wisconsin was performed at an undeveloped former MGP site in an urban location where future redevelopment is planned. An initial passive soil vapor survey identified shallow but not deep (near water table) MGP constituent sources. A detailed groundwater and active soil vapor characterization program was then completed to assess vertical concentration source profiles in groundwater and soil vapor impacts. Ancillary data included continuous monitoring of soil moisture and temperature, soil physical property testing, and real-time polymerase chain reaction (PCR) analysis, a technique for quantifying specific hydrocarbon-degrading bacteria.
A capping study was implemented as a low-cost investigative method for simulating possible reduced soil aeration below a future building. Results from ongoing monitoring events indicated lower shallow oxygen concentrations and higher hydrocarbon concentrations beneath the barrier than those measured prior to installation. A modeling study is also on-going using a three-dimensional numerical model, MIN3P, which is being used to evaluate oxygen-limited hydrocarbon degradation and vapor transport for different capping boundary conditions. Summary results of this modeling indicate reasonable comparison between model predictions and measured data when both hydrocarbon (non-methane) and methane source concentrations were considered.

2
INTRODUCTION Soil vapor intrusion is a commonly evaluated exposure pathway at Manufactured Gas Plant (MGP) sites, but questions remain on assessment methods, fate and transport processes and models for assessing this pathway. To address these issues, the Electric Power Research Institute (EPRI) has undertaken a multi-year, field-focused study of soil vapor intrusion at MGP sites. A goal of the study has been to better understand key soil vapor processes and to develop better strategies and methods for soil vapor intrusion at sites with differing issues, particularly non-redeveloped sites requiring assessment.
The project research in Wisconsin was performed at an undeveloped former MGP site in an urban location where future development is planned. In the study area, original remedial activities included removal of MGP-impacted soil to about 12 feet depth (the approximate depth to the water table) and backfilling with compacted clean fill. The ground surface in this area is uncovered and vegetated with grass. Residual non-aqueous phase liquid (NAPL) remained at or below the water table in this area.
The initial site investigation for research purposes was completed in June-August 2008. The investigation began with a passive soil vapor survey (Gore ModuleTM), which was not successful in identifying the deep (near water table) MGP constituent sources in the study area because biodegradation reduced hydrocarbon vapors to negligible concentrations at the depth of the modules, but was successful in identifying shallow MGP constituent sources in an adjacent area. A detailed groundwater and active soil vapor characterization program was then completed to assess vertical profiles of concentrations in groundwater and soil vapor. For the soil vapor analysis, three different analytical methods, Modified 8260, TO-15 and TO-17, were compared, and for TO-15, both a standard and forensic PIANO (paraffins, isoparaffins, aromatics, naphthenes, and olefins) list of compounds were analyzed. Ancillary data included continuous monitoring of soil moisture and temperature, soil physical property testing, and real-time polymerase chain reaction (PCR) analysis, a technique for quantifying the abundance of specific hydrocarbon-degrading bacteria.
To further evaluate vapor attenuation under possible future development conditions, a capping study was conducted, designed as a low-cost investigative method for simulating possible reduced soil aeration below a future building. The capping study, conducted over the area with deep residual NAPL MGP impacts, involved construction of a geomembrane cap in July 2009 followed by monitoring of soil vapor concentrations for approximately one year. To further evaluate the transport of hydrocarbon vapors and the effect of oxygen-limitations on biodegradation, a modeling study was conducted for different capping boundary conditions using a three-dimensional numerical model, MIN3P (Mayer et al., 2002)1.
SITE CHARACTERIZATION METHODS
Soil physical property testing consisted of gravimetric moisture content, grain size distribution, and for selected samples, capillarity package tests for air/water drainage curve, air permeability, hydraulic conductivity, water-filled and total porosity and dry bulk density (ASTM D6836, API RP40).
Four soil moisture and temperature sensors (Stevens Hydra-Probe II) and a data logger were installed inAugust 2008 at two locations at 2 and 4 ft. depth. The moisture sensor is a capacitance type probe that directly measures the volumetric soil moisture (i.e., water-filled porosity).
Groundwater samples were obtained generally at 3 ft. intervals starting at water table using a GeoprobeTM Screen Point 15 (SP-15) sampling system. Soil samples were obtained using a GeoprobeTM DT22 continuous coring system.
3
Soil gas probes were generally installed at 3-feet, 6-feet, 8-feet and 10-feet below ground surface. The soil gas probes were constructed of 6-inch long GeoprobeTM Model AT-86 implants connected to ¼-inch outer diameter Teflon tubing, installed in accordance with manufacturer’s recommendations. All soil gas probes were tested for leakage using a helium leak tracer test and were generally found to have a leakage rate (ratio of helium concentration in soil gas relative to shroud) of less than 1%.
Soil gas probes were purged and sampled using a flow rate of 0.15 to 0.2 L/min. Soil gas samples were analyzed in the field for oxygen, carbon dioxide, methane (Landtec GEM-2000+) and organic vapors using a photoionization detector (MiniRae 2000™ PID). Soil gas samples were obtained consecutively for laboratory analysis in 250 ml mini-cans (Modified USEPA Method 8260, Air Toxics), active sorbent tubes (USEPA Method TO-17) and either 6-litre or 1-litre Summa canisters (TestAmerica or Air Toxics). For sorbent tubes, initially Tenax TA tubes were utilized, and in latter sampling rounds, a multisorbant SVITM tube by Perkin Elmer (as branded by Air Toxics) was used in duplicate to Tenax TA tubes for comparison. Standard quality control procedures were followed including collection of field duplicate samples, equipment and trip blanks (for tubes), and tubes in series to monitor potential breakthrough.
To assess biogeochemical and microbial processes within the vadose zone near these vapor probe clusters, soil samples (collected using the DT22 continuous coring system) from different depths were submitted for real-time polymerase chain reaction (PCR) molecular testing (Microbial Insights). The PCR technique quantifies the abundance of specific bacteria and is a potential additional line-of-evidence for hydrocarbon biodegradation.
SOIL AND GROUNDWATER CHARACTERIZATION RESULTS Selected results of the soil and groundwater characterization program are described below, with additional soil gas monitoring results described under the capping study.
The depth to the water table is approximately 10 feet, but is estimated to fluctuate by approximately 0.5 foot or less on a seasonal basis based on transducer data from a well near the study area. Based on monitoring between May 2009 and July 2010, the highest water table levels were measured in March 2010 and lowest in August 2009.
The soil physical property testing indicate a dense, well-graded and compact silty, clayey sand in the study area with relatively low total porosity (approximately 0.27 to 0.28), except at one location below the cap, where coarse fill possibly containing calcite minerals was encountered. Previous investigations have indicated natural organic matter in nearby in-filled areas, which may contribute to the methane encountered at the site. The relatively high saturation of the as-received samples (about 50%) and slightly lower field capacity are indicative of the high water-holding capacity of this soil, which is a result of the soil gradation and relatively high degree of compaction that soils were subjected to.
Groundwater monitoring in the study area involved collection of groundwater samples from 0-3 ft. depth. Below the future location of the cap (G3-A1), the concentrations of aromatic and other MGP-related hydrocarbons were elevated, for example, the benzene and naphthalene concentrations were 2300 μg/L and 940 μg/L, respectively. The presence of minor occurrences of non-aqueous phase liquid (NAPL) and sheens were noted during groundwater sampling. The PIANO TO-15 analysis indicated benzene levels in deep soil vapor were the highest measured of any of the VOCs, although concentrations of aliphatic hydrocarbons such as n-pentane and methylcyclohexane were also elevated. Examination of vadose zone attenuation factors (i.e., ratio of deep soil vapor to shallow soil vapor) indicated benzene attenuated more rapidly than most aliphatics.
Other compounds indicative of MGP residuals indentified as being of interest in soil vapor were either present only at low levels (naphthalene) or were non-detect (indane, indene). A forensic-type comparison
4
indicates that the hydrocarbon composition of MGP-related soil vapors is clearly different than that for other petroleum products such as gasoline or diesel.
As part of PCR testing, the enzyme genes for toluene dioxygenase, phenol monooxgenase and catechol were analyzed for to provide a line of evidence for hydrocarbon biodegradation. 2,3-dioxygenase genes were detected indicating the presence of aromatic-degrading microorganisms, but the results were sporadic and did not correlate well with soil zones where greatest biological activity was expected.
CAPPING AND MODELING STUDY The capping study involved construction of a cap, monitoring conducted over a 12 month period, and numerical modeling.
Construction of Cap
A 50 by 50 ft. geomembrane cap was constructed in an area with deep residual NAPL MGP constituents. The geomembrane consisted of 40-mil thick Low Density Polyethylene (LDPE). The installation procedure involved minor removal of topsoil and smoothing of the ground surface, and placement of a thin layer of sand. The geomembrane was placed on top of the sand, and in turn covered with 6 inches of imported sand, and seeded with grass. The soil gas probe tubing penetrations of the geomembrane were sealed with bentonite.
Soil Gas Monitoring Results
Two baseline monitoring events (August 2008, July 2009) were conducted prior to construction and seven monitoring events (August 2009, September 2009, October 2009, November 2009, April 2010 (2X), July 2010) were conducted after construction of the cap. During each event, field monitoring was completed, which consisted of measurement of hydrocarbon vapours using a PID and fixed gases (oxygen, carbon dioxide and methane). For selected sampling events, soil gas samples were analyzed for VOCs according to USEPA Method TO-15 and Method TO-17. Soil gas samples were analyzed from probe cluster G3-A1 (3, 6, 8 and 10 feet), which is located approximately below the center of the cap, and from probe cluster H2-A1 (3, 6, 8 and 10 feet) located approximately 30 feet from the edge of cap.
Soil vapor monitoring conducted in August 2008 and July 2009 indicated elevated hydrocarbon concentrations at 8-10 ft. bgs, low concentrations at 6 ft. bgs and non-detect concentrations at 3 ft. bgs with most degradation apparently occurring between 8 and 3 ft. bgs. The oxygen profile was consistent with aerobic biodegradation with a sharp concentration decline observed over this same interval. Methane and carbon dioxide concentrations were moderately elevated in deep soil vapor, indicating anaerobic degradation has occurred at depth.
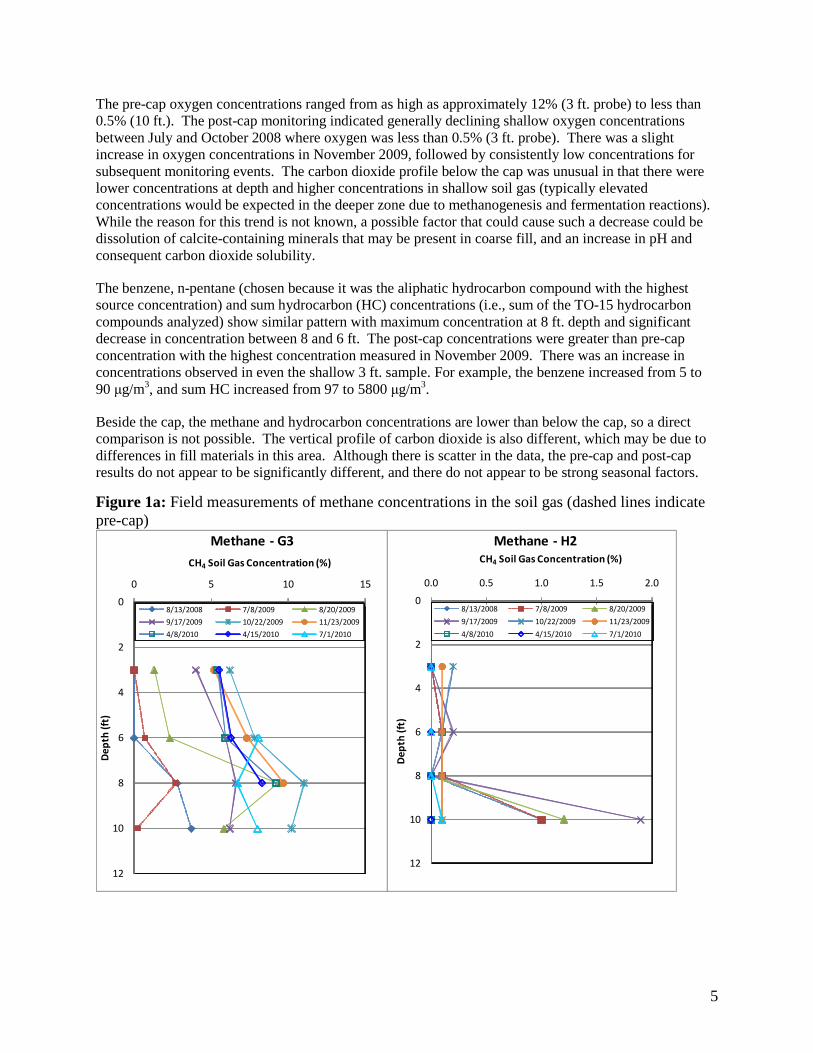
The results of the soil gas monitoring below (G3) and beside (H2) the cap are presented in Figure 1. Below the cap, the fixed gas data indicates that pre-cap methane concentrations ranged from less than 0.1% (3 ft. probe) to a maximum of about 3.5% (10 ft.). For some monitoring rounds, samples from the 8 ft. depth probe had the highest concentration. The reason for this is not known; however, there may be greater biological activity just above the NAPL zone, which is located close to the 10-ft. depth probe. The post-cap methane concentrations increased with time beneath the liner and construction of the cap. A possible reason for this increase is reduced access for oxygen due to the presence of the liner, allowing methane to persist. The transient model predictions presented below indicate it takes several months for methane concentrations to reach near steady state conditions once the area is capped (Figure 3).
5
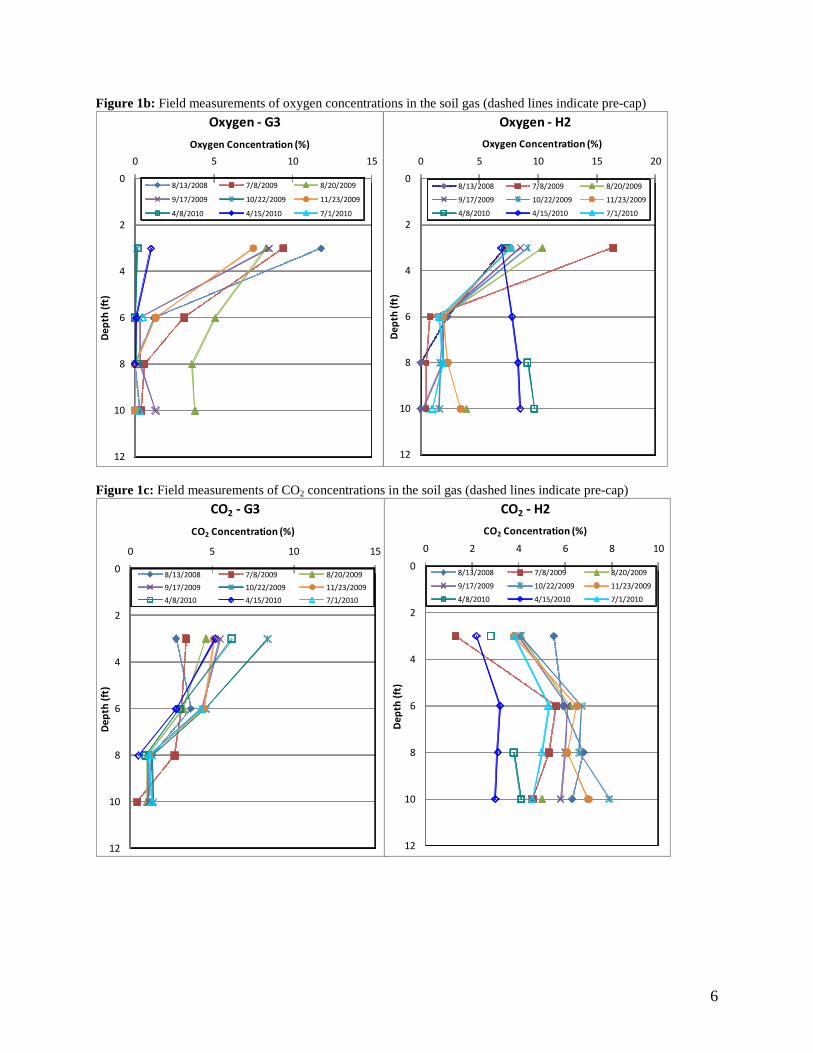
The pre-cap oxygen concentrations ranged from as high as approximately 12% (3 ft. probe) to less than 0.5% (10 ft.). The post-cap monitoring indicated generally declining shallow oxygen concentrations between July and October 2008 where oxygen was less than 0.5% (3 ft. probe). There was a slight increase in oxygen concentrations in November 2009, followed by consistently low concentrations for subsequent monitoring events. The carbon dioxide profile below the cap was unusual in that there were lower concentrations at depth and higher concentrations in shallow soil gas (typically elevated concentrations would be expected in the deeper zone due to methanogenesis and fermentation reactions). While the reason for this trend is not known, a possible factor that could cause such a decrease could be dissolution of calcite-containing minerals that may be present in coarse fill, and an increase in pH and consequent carbon dioxide solubility.
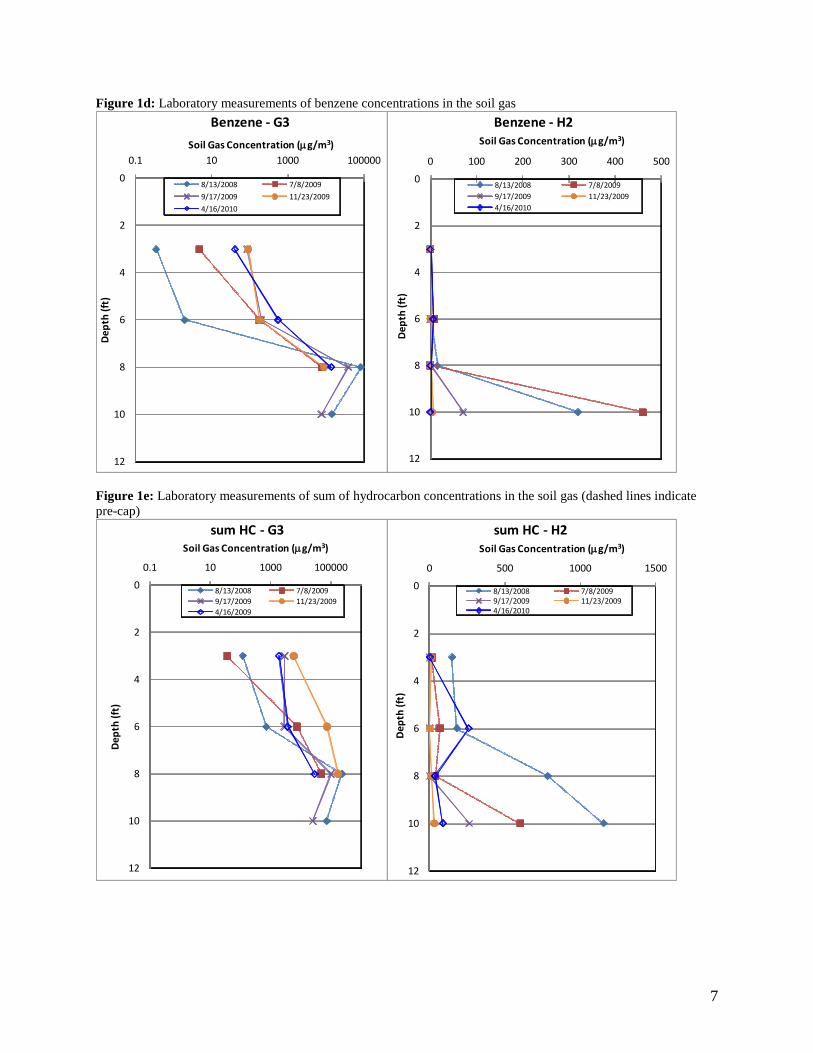
The benzene, n-pentane (chosen because it was the aliphatic hydrocarbon compound with the highest source concentration) and sum hydrocarbon (HC) concentrations (i.e., sum of the TO-15 hydrocarbon compounds analyzed) show similar pattern with maximum concentration at 8 ft. depth and significant decrease in concentration between 8 and 6 ft. The post-cap concentrations were greater than pre-cap concentration with the highest concentration measured in November 2009. There was an increase in concentrations observed in even the shallow 3 ft. sample. For example, the benzene increased from 5 to 90 μg/m3, and sum HC increased from 97 to 5800 μg/m3.
Beside the cap, the methane and hydrocarbon concentrations are lower than below the cap, so a direct comparison is not possible. The vertical profile of carbon dioxide is also different, which may be due to differences in fill materials in this area. Although there is scatter in the data, the pre-cap and post-cap results do not appear to be significantly different, and there do not appear to be strong seasonal factors.
Figure 1a: Field measurements of methane concentrations in the soil gas (dashed lines indicate pre-cap)
0
2
4
6
8
10
12
0 5 10 15
Dep
th (f
t)
CH4 Soil Gas Concentration (%)
Methane - G3
8/13/2008 7/8/2009 8/20/2009
9/17/2009 10/22/2009 11/23/2009
4/8/2010 4/15/2010 7/1/2010
0
2
4
6
8
10
12
0.0 0.5 1.0 1.5 2.0
Dep
th (f
t)
CH4 Soil Gas Concentration (%)
Methane - H2
8/13/2008 7/8/2009 8/20/2009
9/17/2009 10/22/2009 11/23/2009
4/8/2010 4/15/2010 7/1/2010
6
Figure 1b: Field measurements of oxygen concentrations in the soil gas (dashed lines indicate pre-cap)
0
2
4
6
8
10
12
0 5 10 15 20
Dep
th (f
t)
Oxygen Concentration (%)
Oxygen - H2
8/13/2008 7/8/2009 8/20/2009
9/17/2009 10/22/2009 11/23/2009
4/8/2010 4/15/2010 7/1/2010
0
2
4
6
8
10
12
0 5 10 15
Dep
th (f
t)
Oxygen Concentration (%)
Oxygen - G3
8/13/2008 7/8/2009 8/20/2009
9/17/2009 10/22/2009 11/23/2009
4/8/2010 4/15/2010 7/1/2010
Figure 1c: Field measurements of CO2 concentrations in the soil gas (dashed lines indicate pre-cap)
0
2
4
6
8
10
12
0 5 10 15
Dep
th (f
t)
CO2 Concentration (%)
CO2 - G3
8/13/2008 7/8/2009 8/20/2009
9/17/2009 10/22/2009 11/23/2009
4/8/2010 4/15/2010 7/1/2010
0
2
4
6
8
10
12
0 2 4 6 8 10
Dep
th (f
t)
CO2 Concentration (%)
CO2 - H2
8/13/2008 7/8/2009 8/20/2009
9/17/2009 10/22/2009 11/23/2009
4/8/2010 4/15/2010 7/1/2010
7
Figure 1d: Laboratory measurements of benzene concentrations in the soil gas
0
2
4
6
8
10
12
0.1 10 1000 100000
Dep
th (f
t)
Soil Gas Concentration (µg/m3)
Benzene - G3
8/13/2008 7/8/2009
9/17/2009 11/23/2009
4/16/2010
0
2
4
6
8
10
12
0 100 200 300 400 500
Dep
th (f
t)
Soil Gas Concentration (µg/m3)
Benzene - H2
8/13/2008 7/8/20099/17/2009 11/23/20094/16/2010
Figure 1e: Laboratory measurements of sum of hydrocarbon concentrations in the soil gas (dashed lines indicate pre-cap)
0
2
4
6
8
10
12
0.1 10 1000 100000
Dep
th (f
t)
Soil Gas Concentration (µg/m3)
sum HC - G3
8/13/2008 7/8/20099/17/2009 11/23/20094/16/2009
0
2
4
6
8
10
12
0 500 1000 1500
Dep
th (f
t)
Soil Gas Concentration (µg/m3)
sum HC - H2
8/13/2008 7/8/20099/17/2009 11/23/20094/16/2010
8
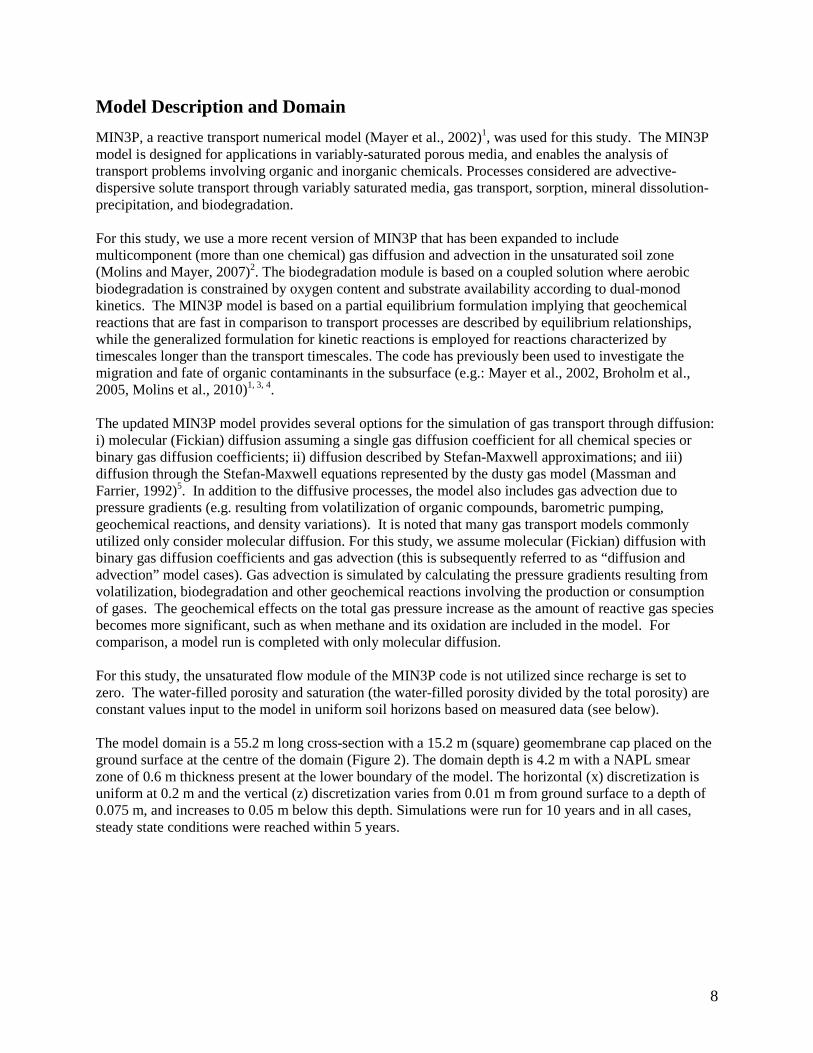
Model Description and Domain MIN3P, a reactive transport numerical model (Mayer et al., 2002)1, was used for this study. The MIN3P model is designed for applications in variably-saturated porous media, and enables the analysis of transport problems involving organic and inorganic chemicals. Processes considered are advective-dispersive solute transport through variably saturated media, gas transport, sorption, mineral dissolution-precipitation, and biodegradation. For this study, we use a more recent version of MIN3P that has been expanded to include multicomponent (more than one chemical) gas diffusion and advection in the unsaturated soil zone (Molins and Mayer, 2007)2. The biodegradation module is based on a coupled solution where aerobic biodegradation is constrained by oxygen content and substrate availability according to dual-monod kinetics. The MIN3P model is based on a partial equilibrium formulation implying that geochemical reactions that are fast in comparison to transport processes are described by equilibrium relationships, while the generalized formulation for kinetic reactions is employed for reactions characterized by timescales longer than the transport timescales. The code has previously been used to investigate the migration and fate of organic contaminants in the subsurface (e.g.: Mayer et al., 2002, Broholm et al., 2005, Molins et al., 2010)1, 3, 4. The updated MIN3P model provides several options for the simulation of gas transport through diffusion: i) molecular (Fickian) diffusion assuming a single gas diffusion coefficient for all chemical species or binary gas diffusion coefficients; ii) diffusion described by Stefan-Maxwell approximations; and iii) diffusion through the Stefan-Maxwell equations represented by the dusty gas model (Massman and Farrier, 1992)5. In addition to the diffusive processes, the model also includes gas advection due to pressure gradients (e.g. resulting from volatilization of organic compounds, barometric pumping, geochemical reactions, and density variations). It is noted that many gas transport models commonly utilized only consider molecular diffusion. For this study, we assume molecular (Fickian) diffusion with binary gas diffusion coefficients and gas advection (this is subsequently referred to as “diffusion and advection” model cases). Gas advection is simulated by calculating the pressure gradients resulting from volatilization, biodegradation and other geochemical reactions involving the production or consumption of gases. The geochemical effects on the total gas pressure increase as the amount of reactive gas species becomes more significant, such as when methane and its oxidation are included in the model. For comparison, a model run is completed with only molecular diffusion. For this study, the unsaturated flow module of the MIN3P code is not utilized since recharge is set to zero. The water-filled porosity and saturation (the water-filled porosity divided by the total porosity) are constant values input to the model in uniform soil horizons based on measured data (see below). The model domain is a 55.2 m long cross-section with a 15.2 m (square) geomembrane cap placed on the ground surface at the centre of the domain (Figure 2). The domain depth is 4.2 m with a NAPL smear zone of 0.6 m thickness present at the lower boundary of the model. The horizontal (x) discretization is uniform at 0.2 m and the vertical (z) discretization varies from 0.01 m from ground surface to a depth of 0.075 m, and increases to 0.05 m below this depth. Simulations were run for 10 years and in all cases, steady state conditions were reached within 5 years.
9
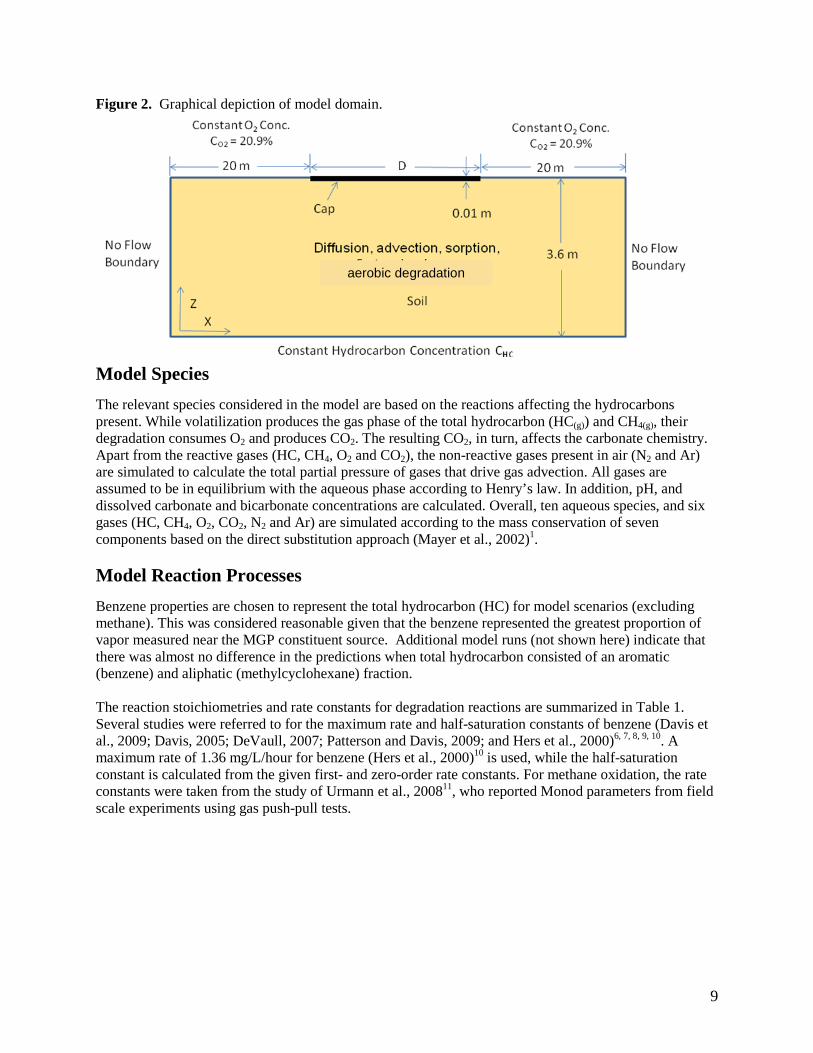
Figure 2. Graphical depiction of model domain.
Model Species The relevant species considered in the model are based on the reactions affecting the hydrocarbons present. While volatilization produces the gas phase of the total hydrocarbon (HC(g)) and CH4(g), their degradation consumes O2 and produces CO2. The resulting CO2, in turn, affects the carbonate chemistry. Apart from the reactive gases (HC, CH4, O2 and CO2), the non-reactive gases present in air (N2 and Ar) are simulated to calculate the total partial pressure of gases that drive gas advection. All gases are assumed to be in equilibrium with the aqueous phase according to Henry’s law. In addition, pH, and dissolved carbonate and bicarbonate concentrations are calculated. Overall, ten aqueous species, and six gases (HC, CH4, O2, CO2, N2 and Ar) are simulated according to the mass conservation of seven components based on the direct substitution approach (Mayer et al., 2002)1. Model Reaction Processes Benzene properties are chosen to represent the total hydrocarbon (HC) for model scenarios (excluding methane). This was considered reasonable given that the benzene represented the greatest proportion of vapor measured near the MGP constituent source. Additional model runs (not shown here) indicate that there was almost no difference in the predictions when total hydrocarbon consisted of an aromatic (benzene) and aliphatic (methylcyclohexane) fraction. The reaction stoichiometries and rate constants for degradation reactions are summarized in Table 1. Several studies were referred to for the maximum rate and half-saturation constants of benzene (Davis et al., 2009; Davis, 2005; DeVaull, 2007; Patterson and Davis, 2009; and Hers et al., 2000)6, 7, 8, 9, 10. A maximum rate of 1.36 mg/L/hour for benzene (Hers et al., 2000)10 is used, while the half-saturation constant is calculated from the given first- and zero-order rate constants. For methane oxidation, the rate constants were taken from the study of Urmann et al., 200811, who reported Monod parameters from field scale experiments using gas push-pull tests.
aerobic degradation
10
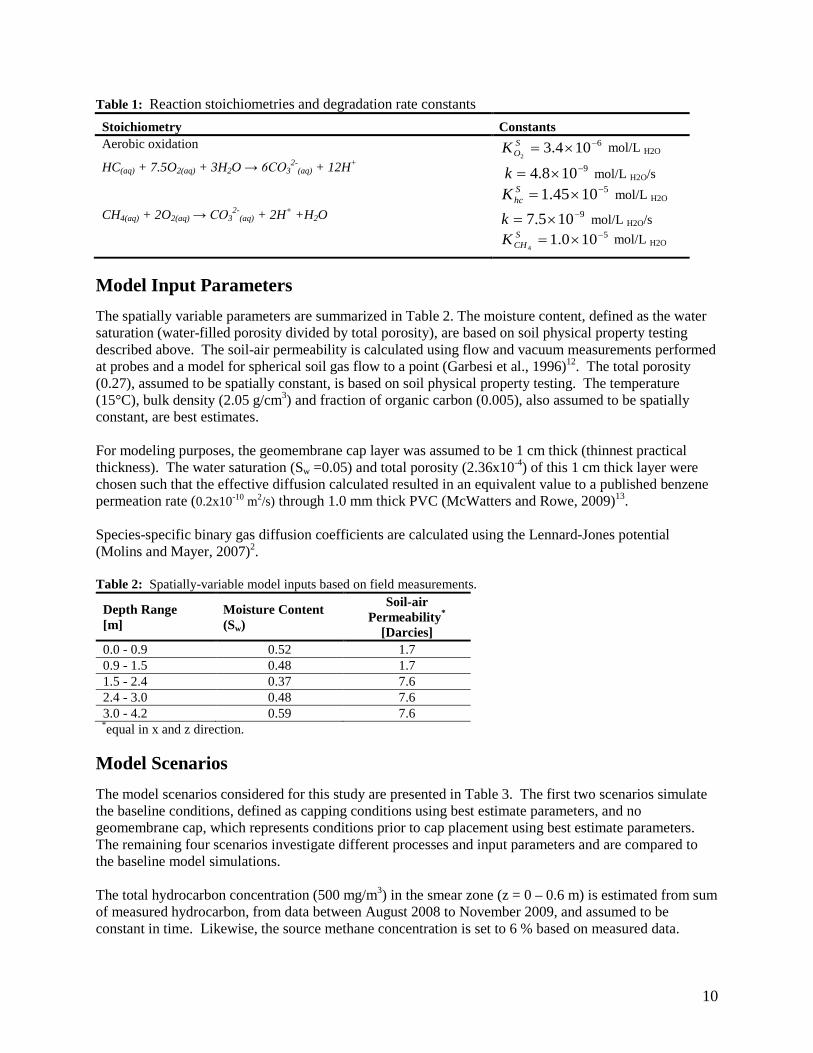
Table 1: Reaction stoichiometries and degradation rate constants
Stoichiometry Constants Aerobic oxidation
HC(aq) + 7.5O2(aq) + 3H2O → 6CO32-
(aq) + 12H+
6104.32
−×=SOK mol/L H2O
9108.4 −×=k mol/L H2O/s 51045.1 −×=S
hcK mol/L H2O CH4(aq) + 2O2(aq) → CO3
2-(aq) + 2H+ +H2O 9105.7 −×=k mol/L H2O/s
5100.14
−×=SCHK mol/L H2O
Model Input Parameters The spatially variable parameters are summarized in Table 2. The moisture content, defined as the water saturation (water-filled porosity divided by total porosity), are based on soil physical property testing described above. The soil-air permeability is calculated using flow and vacuum measurements performed at probes and a model for spherical soil gas flow to a point (Garbesi et al., 1996)12. The total porosity (0.27), assumed to be spatially constant, is based on soil physical property testing. The temperature (15°C), bulk density (2.05 g/cm3) and fraction of organic carbon (0.005), also assumed to be spatially constant, are best estimates.
For modeling purposes, the geomembrane cap layer was assumed to be 1 cm thick (thinnest practical thickness). The water saturation (Sw =0.05) and total porosity (2.36x10⁻⁴) of this 1 cm thick layer were chosen such that the effective diffusion calculated resulted in an equivalent value to a published benzene permeation rate (0.2x10⁻¹⁰ m2/s) through 1.0 mm thick PVC (McWatters and Rowe, 2009)13. Species-specific binary gas diffusion coefficients are calculated using the Lennard-Jones potential (Molins and Mayer, 2007)2. Table 2: Spatially-variable model inputs based on field measurements.
Depth Range [m]
Moisture Content (Sw)
Soil-air Permeability*
[Darcies] 0.0 - 0.9 0.52 1.7 0.9 - 1.5 0.48 1.7 1.5 - 2.4 0.37 7.6 2.4 - 3.0 0.48 7.6 3.0 - 4.2 0.59 7.6 *equal in x and z direction.
Model Scenarios
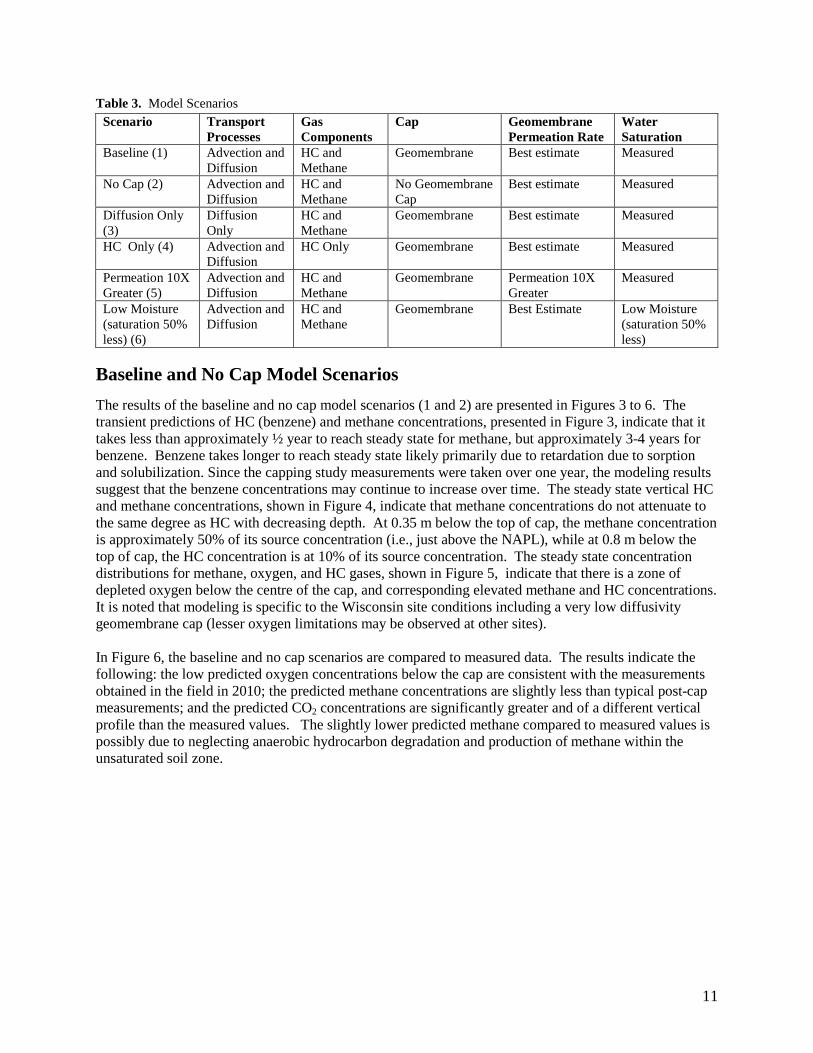
The model scenarios considered for this study are presented in Table 3. The first two scenarios simulate the baseline conditions, defined as capping conditions using best estimate parameters, and no geomembrane cap, which represents conditions prior to cap placement using best estimate parameters. The remaining four scenarios investigate different processes and input parameters and are compared to the baseline model simulations. The total hydrocarbon concentration (500 mg/m3) in the smear zone (z = 0 – 0.6 m) is estimated from sum of measured hydrocarbon, from data between August 2008 to November 2009, and assumed to be constant in time. Likewise, the source methane concentration is set to 6 % based on measured data.
11
Table 3. Model Scenarios Scenario Transport
Processes Gas Components
Cap Geomembrane Permeation Rate
Water Saturation
Baseline (1) Advection and Diffusion
HC and Methane
Geomembrane Best estimate Measured
No Cap (2) Advection and Diffusion
HC and Methane
No Geomembrane Cap
Best estimate Measured
Diffusion Only (3)
Diffusion Only
HC and Methane
Geomembrane Best estimate Measured
HC Only (4) Advection and Diffusion
HC Only Geomembrane Best estimate Measured
Permeation 10X Greater (5)
Advection and Diffusion
HC and Methane
Geomembrane Permeation 10X Greater
Measured
Low Moisture (saturation 50% less) (6)
Advection and Diffusion
HC and Methane
Geomembrane Best Estimate Low Moisture (saturation 50% less)
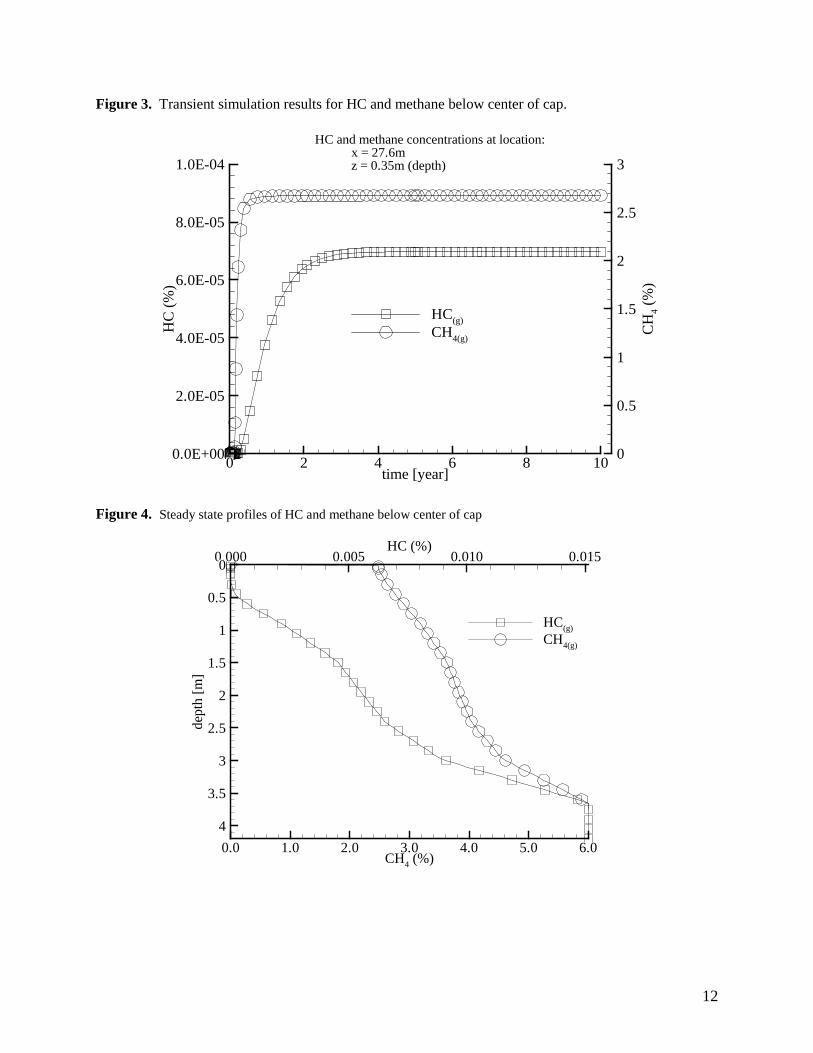
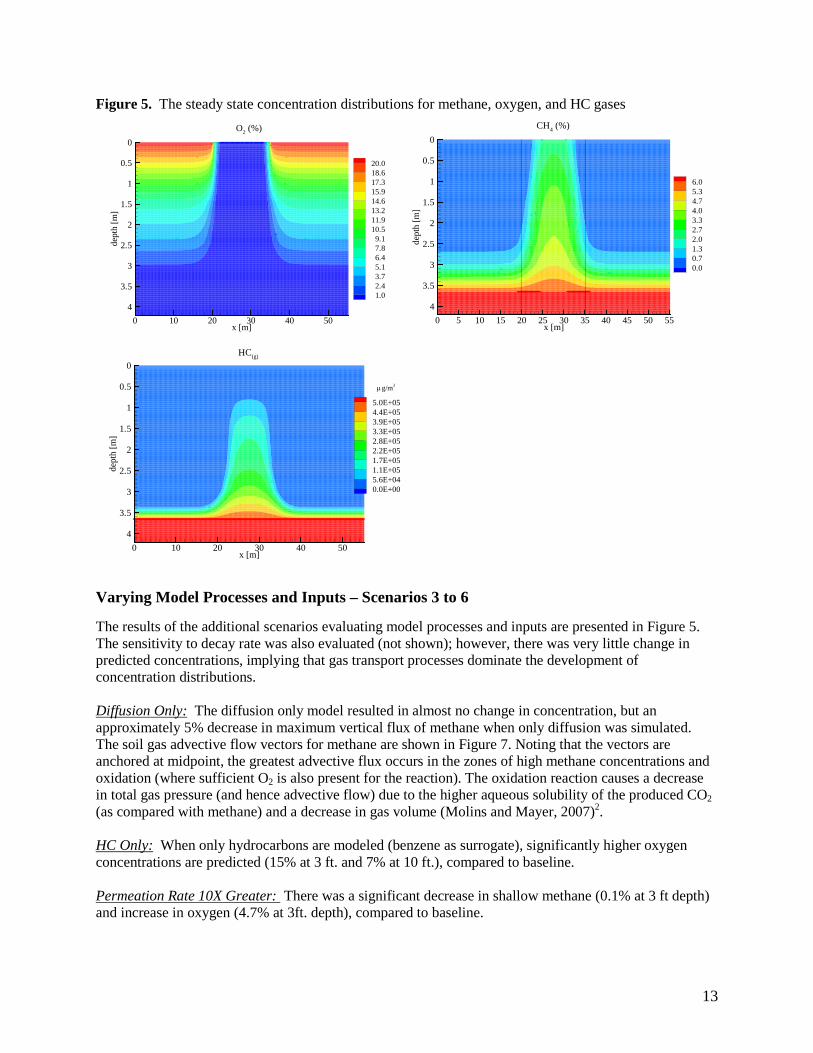
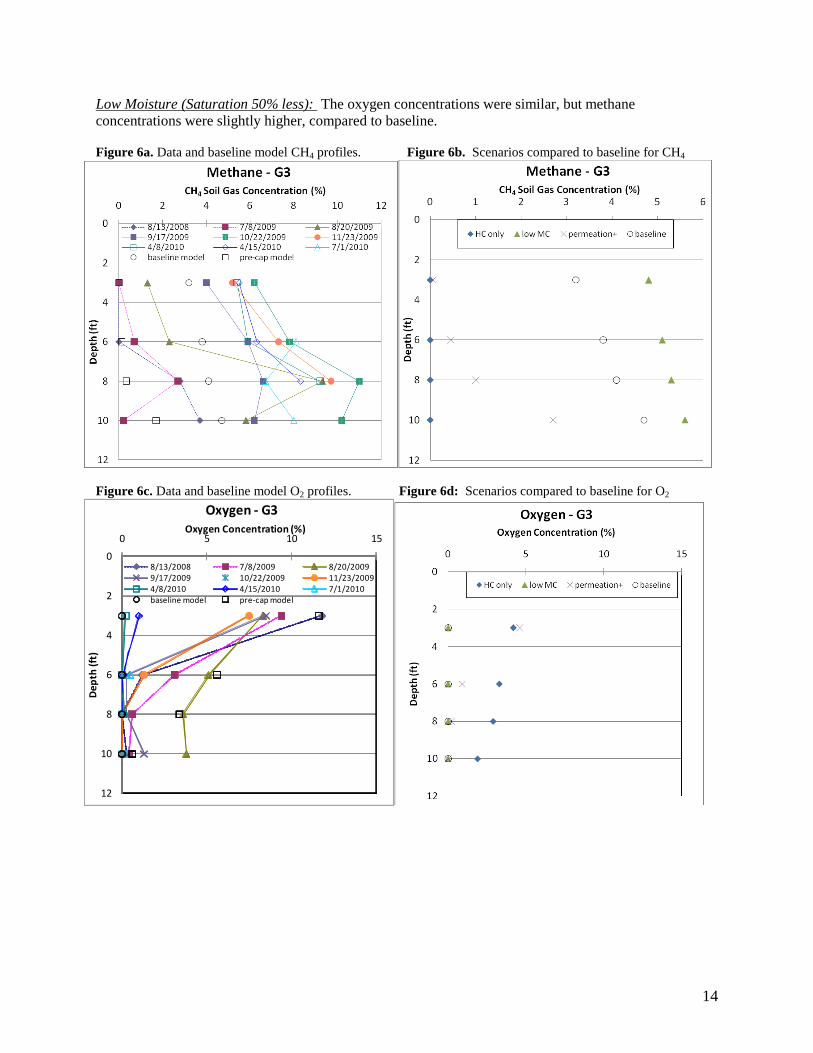
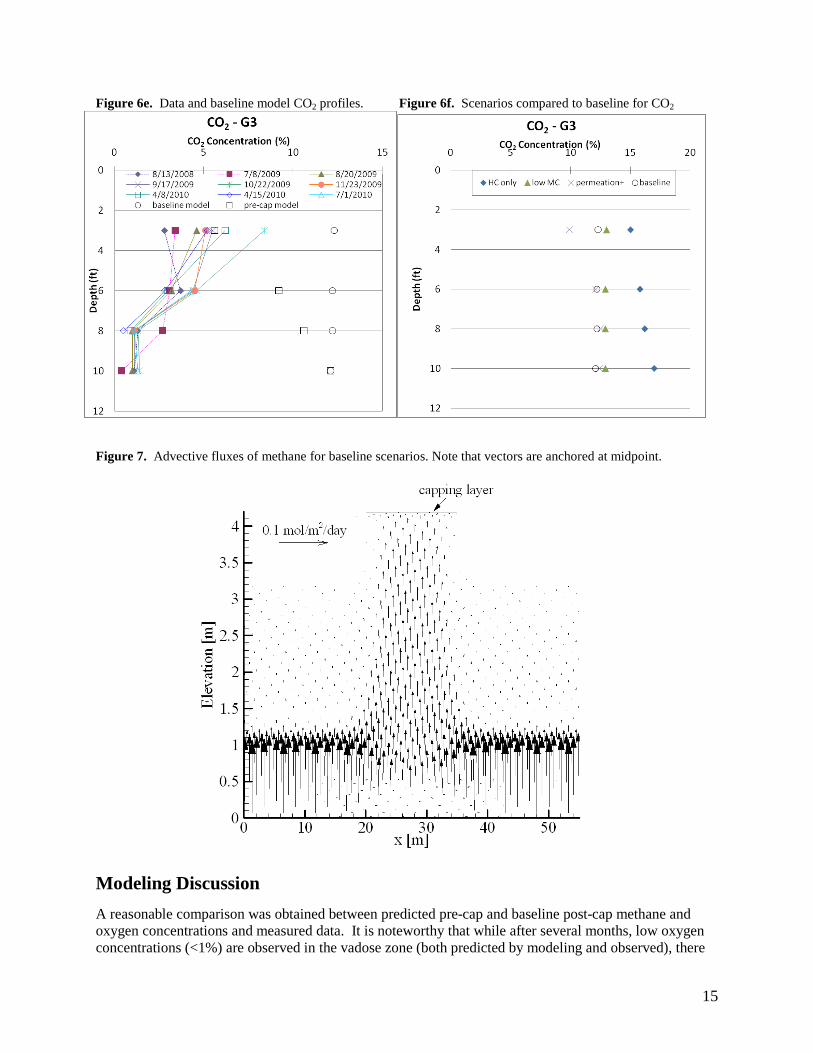
Baseline and No Cap Model Scenarios The results of the baseline and no cap model scenarios (1 and 2) are presented in Figures 3 to 6. The transient predictions of HC (benzene) and methane concentrations, presented in Figure 3, indicate that it takes less than approximately ½ year to reach steady state for methane, but approximately 3-4 years for benzene. Benzene takes longer to reach steady state likely primarily due to retardation due to sorption and solubilization. Since the capping study measurements were taken over one year, the modeling results suggest that the benzene concentrations may continue to increase over time. The steady state vertical HC and methane concentrations, shown in Figure 4, indicate that methane concentrations do not attenuate to the same degree as HC with decreasing depth. At 0.35 m below the top of cap, the methane concentration is approximately 50% of its source concentration (i.e., just above the NAPL), while at 0.8 m below the top of cap, the HC concentration is at 10% of its source concentration. The steady state concentration distributions for methane, oxygen, and HC gases, shown in Figure 5, indicate that there is a zone of depleted oxygen below the centre of the cap, and corresponding elevated methane and HC concentrations. It is noted that modeling is specific to the Wisconsin site conditions including a very low diffusivity geomembrane cap (lesser oxygen limitations may be observed at other sites). In Figure 6, the baseline and no cap scenarios are compared to measured data. The results indicate the following: the low predicted oxygen concentrations below the cap are consistent with the measurements obtained in the field in 2010; the predicted methane concentrations are slightly less than typical post-cap measurements; and the predicted CO2 concentrations are significantly greater and of a different vertical profile than the measured values. The slightly lower predicted methane compared to measured values is possibly due to neglecting anaerobic hydrocarbon degradation and production of methane within the unsaturated soil zone.
12
Figure 3. Transient simulation results for HC and methane below center of cap.
time [year]
HC
(%)
CH
4(%
)
0 2 4 6 8 100.0E+00
2.0E-05
4.0E-05
6.0E-05
8.0E-05
1.0E-04
0
0.5
1
1.5
2
2.5
3
HC(g)CH4(g)
HC and methane concentrations at location:x = 27.6mz = 0.35m (depth)
Figure 4. Steady state profiles of HC and methane below center of cap
CH4 (%)
HC (%)
dept
h[m
]
0.0 1.0 2.0 3.0 4.0 5.0 6.0
0.000 0.005 0.010 0.0150
0.5
1
1.5
2
2.5
3
3.5
4
HC(g)CH4(g)
13
Figure 5. The steady state concentration distributions for methane, oxygen, and HC gases
x [m]
dept
h[m
]
0 10 20 30 40 50
0
0.5
1
1.5
2
2.5
3
3.5
4
20.018.617.315.914.613.211.910.59.17.86.45.13.72.41.0
O2 (%)
x [m]
dept
h[m
]
0 5 10 15 20 25 30 35 40 45 50 55
0
0.5
1
1.5
2
2.5
3
3.5
4
6.05.34.74.03.32.72.01.30.70.0
CH4 (%)
x [m]
dept
h[m
]
0 10 20 30 40 50
0
0.5
1
1.5
2
2.5
3
3.5
4
5.0E+054.4E+053.9E+053.3E+052.8E+052.2E+051.7E+051.1E+055.6E+040.0E+00
HC(g)
g/m3µ
Varying Model Processes and Inputs – Scenarios 3 to 6
The results of the additional scenarios evaluating model processes and inputs are presented in Figure 5. The sensitivity to decay rate was also evaluated (not shown); however, there was very little change in predicted concentrations, implying that gas transport processes dominate the development of concentration distributions. Diffusion Only: The diffusion only model resulted in almost no change in concentration, but an approximately 5% decrease in maximum vertical flux of methane when only diffusion was simulated. The soil gas advective flow vectors for methane are shown in Figure 7. Noting that the vectors are anchored at midpoint, the greatest advective flux occurs in the zones of high methane concentrations and oxidation (where sufficient O2 is also present for the reaction). The oxidation reaction causes a decrease in total gas pressure (and hence advective flow) due to the higher aqueous solubility of the produced CO2 (as compared with methane) and a decrease in gas volume (Molins and Mayer, 2007)2. HC Only: When only hydrocarbons are modeled (benzene as surrogate), significantly higher oxygen concentrations are predicted (15% at 3 ft. and 7% at 10 ft.), compared to baseline. Permeation Rate 10X Greater: There was a significant decrease in shallow methane (0.1% at 3 ft depth) and increase in oxygen (4.7% at 3ft. depth), compared to baseline.
14
Low Moisture (Saturation 50% less): The oxygen concentrations were similar, but methane concentrations were slightly higher, compared to baseline. Figure 6a. Data and baseline model CH4 profiles. Figure 6b. Scenarios compared to baseline for CH4
Figure 6c. Data and baseline model O2 profiles. Figure 6d: Scenarios compared to baseline for O2
0
2
4
6
8
10
12
0 5 10 15
Dep
th (f
t)
Oxygen Concentration (%)
Oxygen - G3
8/13/2008 7/8/2009 8/20/20099/17/2009 10/22/2009 11/23/20094/8/2010 4/15/2010 7/1/2010baseline model pre-cap model
15
Figure 6e. Data and baseline model CO2 profiles. Figure 6f. Scenarios compared to baseline for CO2
Figure 7. Advective fluxes of methane for baseline scenarios. Note that vectors are anchored at midpoint.
Modeling Discussion A reasonable comparison was obtained between predicted pre-cap and baseline post-cap methane and oxygen concentrations and measured data. It is noteworthy that while after several months, low oxygen concentrations (<1%) are observed in the vadose zone (both predicted by modeling and observed), there
16
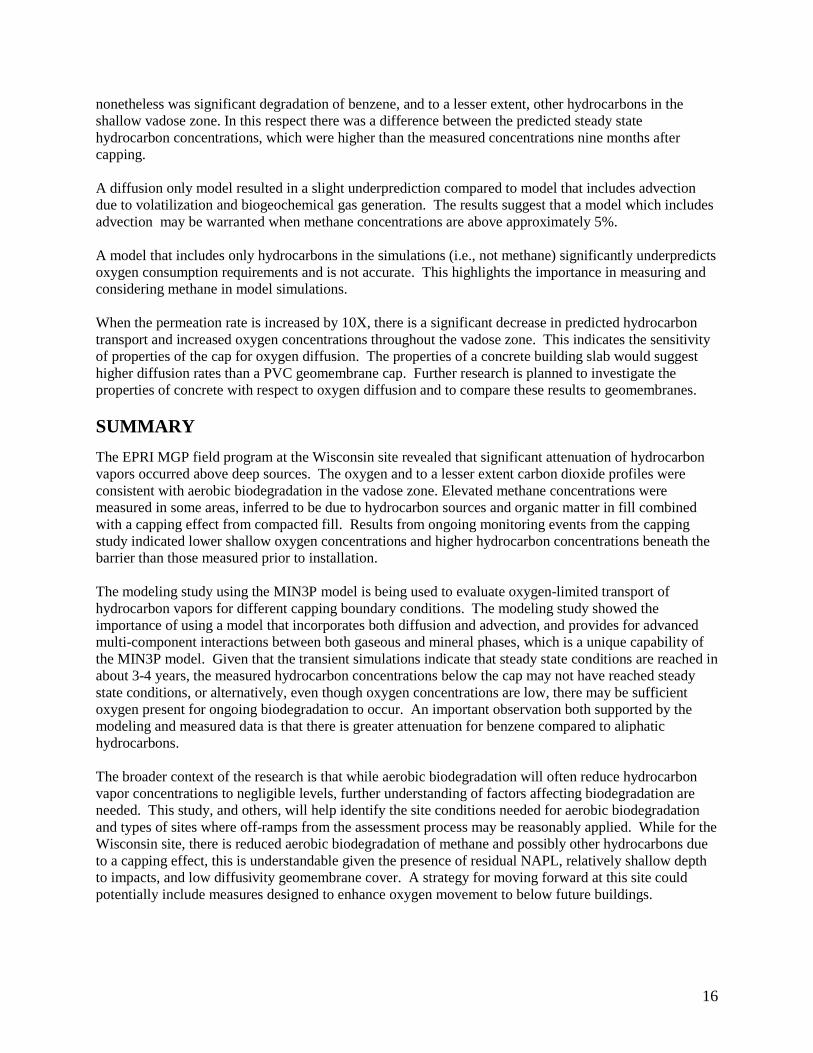
nonetheless was significant degradation of benzene, and to a lesser extent, other hydrocarbons in the shallow vadose zone. In this respect there was a difference between the predicted steady state hydrocarbon concentrations, which were higher than the measured concentrations nine months after capping. A diffusion only model resulted in a slight underprediction compared to model that includes advection due to volatilization and biogeochemical gas generation. The results suggest that a model which includes advection may be warranted when methane concentrations are above approximately 5%. A model that includes only hydrocarbons in the simulations (i.e., not methane) significantly underpredicts oxygen consumption requirements and is not accurate. This highlights the importance in measuring and considering methane in model simulations. When the permeation rate is increased by 10X, there is a significant decrease in predicted hydrocarbon transport and increased oxygen concentrations throughout the vadose zone. This indicates the sensitivity of properties of the cap for oxygen diffusion. The properties of a concrete building slab would suggest higher diffusion rates than a PVC geomembrane cap. Further research is planned to investigate the properties of concrete with respect to oxygen diffusion and to compare these results to geomembranes. SUMMARY The EPRI MGP field program at the Wisconsin site revealed that significant attenuation of hydrocarbon vapors occurred above deep sources. The oxygen and to a lesser extent carbon dioxide profiles were consistent with aerobic biodegradation in the vadose zone. Elevated methane concentrations were measured in some areas, inferred to be due to hydrocarbon sources and organic matter in fill combined with a capping effect from compacted fill. Results from ongoing monitoring events from the capping study indicated lower shallow oxygen concentrations and higher hydrocarbon concentrations beneath the barrier than those measured prior to installation. The modeling study using the MIN3P model is being used to evaluate oxygen-limited transport of hydrocarbon vapors for different capping boundary conditions. The modeling study showed the importance of using a model that incorporates both diffusion and advection, and provides for advanced multi-component interactions between both gaseous and mineral phases, which is a unique capability of the MIN3P model. Given that the transient simulations indicate that steady state conditions are reached in about 3-4 years, the measured hydrocarbon concentrations below the cap may not have reached steady state conditions, or alternatively, even though oxygen concentrations are low, there may be sufficient oxygen present for ongoing biodegradation to occur. An important observation both supported by the modeling and measured data is that there is greater attenuation for benzene compared to aliphatic hydrocarbons. The broader context of the research is that while aerobic biodegradation will often reduce hydrocarbon vapor concentrations to negligible levels, further understanding of factors affecting biodegradation are needed. This study, and others, will help identify the site conditions needed for aerobic biodegradation and types of sites where off-ramps from the assessment process may be reasonably applied. While for the Wisconsin site, there is reduced aerobic biodegradation of methane and possibly other hydrocarbons due to a capping effect, this is understandable given the presence of residual NAPL, relatively shallow depth to impacts, and low diffusivity geomembrane cover. A strategy for moving forward at this site could potentially include measures designed to enhance oxygen movement to below future buildings.
17
REFERENCES 1. Mayer, K. U., E. O. Frind, et al. (2002). "Multicomponent reactive transport modeling in variably
saturated porous media using a generalized formulation for kinetically controlled reactions." Water Resources Research
38: doi:10.1029/2001WR000862.
2. Molins, S. and K. U. Mayer (2007). "Coupling between geochemical reactions and multicomponent gas and solute transport in unsaturated media: A reactive transport modeling study." Water Resources Research
43: doi:10.1029/2006WR005206.
3. Broholm, M. M., M. Christophersen et al. 2005 Compositional evolution of the emplaced fuel source in the vadose zone field experiment at airbase Værløse, Denmark. Environmental Science & Technology 39:8251-8263.
4. Molins, S., K. U. Mayer, et al. (2010). "Vadose zone attenuation of organic compounds at a crude oil
spill site — Interactions between biogeochemical reactions and multicomponent gas transport." Journal of Contaminant Hydrology
112: 15-29.
5. Massman, J., and D.F. Farrier. (1992). Effects of atmospheric pressures on gas transport in the vadose zone. Water Resour. Res. 28:777–791.
6. Davis, G. B., B. M. Patterson, et al. (2009). "Evidence for instantaneous oxygen-limited
biodegradation of petroleum hydrocarbon vapors in the subsurface." Ground Water Monitoring & Remediation
29: 126–137.
7. Davis, G. B., J. L. Rayner, et al. (2005). "Measurement and modeling of temporal variations in hydrocarbon vapor behavior in a layered soil profile." Vadose Zone Journal
4: 225–239.
8. DeVaull, G. E. (2007). "Indoor vapor intrusion with oxygen-limited biodegradation for a subsurface gasoline source." Environmental Science & Technology
41: 3241-3248.
9. Patterson, B. M. and G. B. Davis (2009). "Quantification of vapor intrusion pathways into a slab-on-ground building under varying environmental conditions." Environmental Science & Technology
43: 650-656.
10. Hers, I., J. Atwater, et al. (2000). "Evaluation of vadose zone biodegradation of BTX vapours." Journal of Contaminant Hydrology
46: 233-264.
11. Urmann, K., M. H. Schroth, et al. (2008). "Assessment of microbial methane oxidation above a petroleum-contaminated aquifer using a combination of in situ techniques." Journal of Geophysical Research
113: doi:10.1029/2006JG000363.
12. Garbesi, K., R. G. Sextro, et al. (1996). "Scale dependence of soil permeability to air: Measurement method and field investigation." Water Resources Research
32: 547-560.
13. McWatters, R. S. and R. K. Rowe (2009). "Transport of volatile organic compounds through PVC and LLDPE geomembranes from both aqueous and vapour phases." Geosynthetics International
16: 468–481.

18
KEY WORDS Manufactured Gas Plant, Vapor Intrusion, Benzene, Cap Study, MIN3P ACKNOWLEDGEMENTS The funding by EPRI, We Energies and Integrys Energy Group, and partial support of research intern (Dr. Parisa Jourabchi) by MITACS Accelerate (Canadian government program) and Golder Associates is gratefully acknowledged.