epicenter 7.0 reference guide - extreme networks extreme networks logo, the alpine logo, the...
TRANSCRIPT

Extre3585Sant(888(408http:
EPICenter Reference Guide Version 7.0
me Networks, Inc. Monroe Street
a Clara, California 95051) 257-3000) 579-2800//www.extremenetworks.com
Published: December 2009Part number: 100297-00 Rev. 03

2
AccessAdapt, Alpine, Altitude, BlackDiamond, EPICenter, Essentials, Ethernet Everywhere, Extreme Enabled, Extreme Ethernet Everywhere, Extreme Networks, Extreme Standby Router Protocol, Extreme Turbodrive, Extreme Velocity, ExtremeWare, ExtremeWorks, ExtremeXOS, Go Purple Extreme Solution, ScreenPlay, Sentriant, ServiceWatch, Summit, SummitStack, Triumph, Unified Access Architecture, Unified Access RF Manager, UniStack, the Extreme Networks logo, the Alpine logo, the BlackDiamond logo, the Extreme Turbodrive logo, the Summit logos, and the Powered by ExtremeXOS logo are trademarks or registered trademarks of Extreme Networks, Inc. or its subsidiaries in the United States and/or other countries.
sFlow is a registered trademark of InMon Corporation.
Specifications are subject to change without notice.
All other registered trademarks, trademarks, and service marks are property of their respective owners.
© 2009 Extreme Networks, Inc. All Rights Reserved.
EPICenter Reference Guide

EPICent
Contents
Preface......................................................................................................................................... 11
Introduction .............................................................................................................................11Terminology........................................................................................................................11
Conventions..............................................................................................................................12Related Publications .................................................................................................................12
Chapter 1: EPICenter Overview....................................................................................................... 15
Introduction .............................................................................................................................15Summary of Features.................................................................................................................15Extreme Networks Device Support ..............................................................................................17Third-Party Device Support ........................................................................................................17
Chapter 2: Getting Started with EPICenter ....................................................................................... 19
The EPICenter Home Page .........................................................................................................19The Distributed Server Summary...........................................................................................20
EPICenter Windows ...................................................................................................................20Modifying Table Views .........................................................................................................22Moving Tabbed Windows in EPICenter...................................................................................23
Chapter 3: Managing Your Network Inventory ................................................................................ 25
Overview of EPICenter Device Inventory Management ...................................................................25Device Groups.....................................................................................................................25
Displaying the Network Device Inventory .....................................................................................26Viewing Device Status Information ..............................................................................................27Viewing Link Information ...........................................................................................................29Displaying Device Details ...........................................................................................................30
General Tab........................................................................................................................31VLANs Tab .........................................................................................................................32Links Tab ...........................................................................................................................33EAPS Domain Tab...............................................................................................................34
Displaying Link Details ..............................................................................................................36Displaying Port Details...............................................................................................................38Device Inventory .......................................................................................................................39Device Properties ......................................................................................................................39Discovering Network Devices ......................................................................................................44
Discovery Results ................................................................................................................46Adding Devices to EPICenter ......................................................................................................49Modifying Communications Settings ...........................................................................................52Deleting Devices .......................................................................................................................55Updating Device Information......................................................................................................56Configuring Default Access Parameters .......................................................................................56Opening a Telnet Session to a Device..........................................................................................58
er Reference Guide 3

4
Chapter 4: Organizing Devices and Ports Into Groups ...................................................................... 61
Overview of Device Groups and Port Groups .................................................................................61Displaying Groups in the Network Views Folder ......................................................................61Group Membership Guidelines..............................................................................................63
Managing Device Groups and Port Groups....................................................................................63Creating a Group .................................................................................................................63Adding a Device to a Device Group........................................................................................64Adding Ports to a Port Group ................................................................................................65Copying or Moving Groups....................................................................................................68Removing Devices or Ports from Groups.................................................................................69Modifying the Properties of a Group ......................................................................................69Displaying Group Details ......................................................................................................70Exporting Group Information ................................................................................................71
Chapter 5: Using Map Views .......................................................................................................... 73
Overview of Network Topology Maps............................................................................................73Displaying a Topology Map.........................................................................................................73
Map Elements.....................................................................................................................75Viewing Information in Topology Maps...................................................................................78Navigating Maps .................................................................................................................79
Creating Topology Maps .............................................................................................................80Creating a Topology Map for a Device Group ..........................................................................81Specifying Map Properties....................................................................................................81Laying Out the Map .............................................................................................................82Creating User-Defined Links.................................................................................................82Removing Inactive Links from the Map..................................................................................83Adding Graphic Elements to the Map ....................................................................................84Adding a Device Annotation .................................................................................................85Saving the Map...................................................................................................................85Exporting Maps ...................................................................................................................85Deleting Maps.....................................................................................................................86
Chapter 6: The EPICenter Alarm Manager ....................................................................................... 87
Overview of the EPICenter Alarm Manager ...................................................................................87Predefined Alarms...............................................................................................................88
The Alarm Log Browser ..............................................................................................................89The Alarm Log Browser Summary..........................................................................................89Acknowledging an Alarm......................................................................................................90Deleting Alarm Log Entries...................................................................................................91Deleting Groups of Log Entries .............................................................................................91Viewing Alarm Details ..........................................................................................................91Creating an Alarm Display Filter............................................................................................91Deleting Saved Alarm Log Filters ..........................................................................................92Pausing All Alarms ..............................................................................................................92
The Alarm Log Detailed View......................................................................................................92Defining an Alarm Log Display Filter ...........................................................................................94Deleting Alarm Records with Specified Conditions........................................................................96Defining Alarms ........................................................................................................................98
Creating a New Alarm Definition ...........................................................................................99Modifying an Alarm Definition ..............................................................................................99
EPICenter Reference Guide

Deleting an Alarm Definition ..............................................................................................100The Alarm Definition Window ...................................................................................................100
Defining the Basic Alarm Properties ....................................................................................101Defining the Alarm Scope ..................................................................................................103Defining Alarm Actions ......................................................................................................105Defining Messages ............................................................................................................110
Alarm Categories ....................................................................................................................113Creating a New Alarm Category...........................................................................................113Modifying an Alarm Category ..............................................................................................113Deleting an Alarm Category ................................................................................................114
Threshold Configuration...........................................................................................................114RMON Rule Display...........................................................................................................115CPU Utilization Rule Display ..............................................................................................116Creating an Event Rule ......................................................................................................117Modifying a Rule...............................................................................................................117Deleting a Rule .................................................................................................................117Synchronizing with Device RMON Rules ..............................................................................117
Configuring a New Rule or Modifying a Rule ..............................................................................118Configuring an RMON Rule ................................................................................................119Configuring CPU Utilization Rules.......................................................................................120Configuring Rules for the Predefined RMON Event Types ......................................................121Configuring the Rule Target................................................................................................122
Synchronizing EPICenter with Device RMON Rules.....................................................................124
Chapter 7: Configuration Manager................................................................................................ 125
Overview of the Configuration Manager......................................................................................125Configuration Manager Functions..............................................................................................125
The Config Menu...............................................................................................................126The Scripts Menu..............................................................................................................126Configuration File Locations ...............................................................................................126ExtremeXOS Script File Locations .......................................................................................127
Device Configuration Summary Status.......................................................................................127Uploading Configurations from Devices .....................................................................................130
Changing the Configuration Filename Format .......................................................................132Archiving Configuration Settings ...............................................................................................133
Scheduling Device Archive Uploads ....................................................................................133Scheduling Global Archive Uploads.....................................................................................135Setting Archive Limits .......................................................................................................136Archive/Baseline Differences Report....................................................................................137Configuring Email Notification of Archive/Baseline Differences ..............................................138
Downloading Configuration Information to a Device ....................................................................139Downloading an Incremental Configuration to Devices ................................................................141Creating a Baseline Configuration File .......................................................................................143
Removing a Baseline Configuration File...............................................................................144Scheduling a Baseline Upload ..................................................................................................144Restoring a Baseline Configuration to a Device...........................................................................146Viewing a Configuration File .....................................................................................................147Comparing Two Configuration Files—The Diff Command.............................................................148Configuring a Viewer................................................................................................................150
EPICenter Reference Guide 5

6
Configuring the TFTP Server.....................................................................................................151Configuring and Deploying ExtremeXOS Scripts..........................................................................152
Using the ExtremeXOS Script Editor....................................................................................152Creating a New ExtremeXOS Script .....................................................................................157Editing an Existing ExtremeXOS Script ................................................................................162Viewing the Differences Between Two ExtremeXOS Scripts....................................................162Deleting an ExtremeXOS Script...........................................................................................163Deploying ExtremeXOS Scripts ...........................................................................................163
Chapter 8: The Firmware Manager................................................................................................ 169
Overview of the Firmware Manager............................................................................................169Firmware Manager Functions....................................................................................................169
Firmware Manager Function Buttons ...................................................................................170The Firmware Menu...........................................................................................................170Software and BootROM Image Locations .............................................................................170The Firmware Manager Main Window ..................................................................................171
Obtaining Updated Software Images .........................................................................................174Obtaining New Software Images .........................................................................................174Acknowledging the Version Changes....................................................................................176Checking for Version Availability .........................................................................................177
Upgrading the Software or BootROM on Your Switches ...............................................................177Upgrading Your Switches Using the Upgrade Wizard.............................................................178Image Selection ................................................................................................................178Hardware Selection ...........................................................................................................180Operation Selection ...........................................................................................................183Upgrade Preview ...............................................................................................................185Performing a Multi-Step Upgrade........................................................................................185
Specifying the Current Software Versions...................................................................................188
Chapter 9: Creating and Executing EPICenter Scripts..................................................................... 191
EPICenter Script Overview .......................................................................................................191Bundled EPICenter Scripts.................................................................................................191
The EPICenter Script Interface .................................................................................................192Managing EPICenter Scripts.....................................................................................................193
Creating a New EPICenter Script ........................................................................................194Specifying Run-Time Settings for a Script ...........................................................................197Specifying Permissions and Launch Points for a Script .........................................................198Running a Script ...............................................................................................................198Importing Scripts into EPICenter ........................................................................................201Exporting a Script .............................................................................................................202Deleting a Script ...............................................................................................................203Categorizing Scripts...........................................................................................................203Specifying an EPICenter Script as an Alarm Action...............................................................204
EPICenter Script Reference......................................................................................................205Metadata Tags ..................................................................................................................205EPICenter-Specific Scripting Constructs ..............................................................................207Tcl Support in EPICenter Scripts ........................................................................................210Entering Special Characters ...............................................................................................210Line Continuation Character ...............................................................................................211Case Sensitivity in EPICenter Scripts ..................................................................................211Reserved Words in EPICenter Scripts ..................................................................................211
EPICenter Reference Guide

ExtremeXOS CLI Scripting Commands Supported in EPICenter Scripts...................................211EPICenter-Specific System Variables...................................................................................214
Chapter 10: Using the EPICenter Audit Log ................................................................................... 215
Audit Log Overview..................................................................................................................215Audit Log View........................................................................................................................215
Filtering the Audit Log View ...............................................................................................216Displaying Audit Log Details.....................................................................................................217Redeploying Profiles or Scripts .................................................................................................218
Chapter 11: Using the IP/MAC Address Finder............................................................................... 219
Overview of the IP/MAC Address Finder .....................................................................................219ExtremeWare Software Requirements ..................................................................................219Displaying the IP/MAC Address Finder.................................................................................220
Tasks List Summary Window ....................................................................................................220Creating a Search Task ............................................................................................................222Detailed Task View ..................................................................................................................225
Exporting Task Results to a Text File...................................................................................226
Chapter 12: Real-Time Statistics.................................................................................................. 229
Overview of Real-Time Statistics...............................................................................................229Real-Time Statistics Functions .................................................................................................230
Real-Time Statistics Function Buttons.................................................................................230Displaying Multi-Port Statistics.................................................................................................231Displaying Statistics for a Single Port........................................................................................233Changing the Display Mode ......................................................................................................235Setting Graph Preferences .......................................................................................................236Taking Graph Snapshots ..........................................................................................................238
Chapter 13: Managing and Monitoring VLANs ............................................................................... 241
Overview of Virtual LANs..........................................................................................................241Configuring VLANs ..................................................................................................................242
Running VLAN Configuration Scripts ...................................................................................242Categorizing VLANs With Network Names ............................................................................243
Viewing VLAN Information .......................................................................................................245Displaying VLAN Details ..........................................................................................................246
Device/Ports Tab ...............................................................................................................247Ports Tab..........................................................................................................................248Layer 3 Settings Tab .........................................................................................................248Links Tab .........................................................................................................................249Status Messages Tab .........................................................................................................250Viewing VLAN Services Information.....................................................................................250Displaying VLAN Details for a Selected Device .....................................................................253
Displaying VMAN Details .........................................................................................................253VMAN Device/Ports Tab .....................................................................................................253Ports Tab..........................................................................................................................253VMAN Links Tab ...............................................................................................................254VMAN Status Messages Tab ...............................................................................................254
EPICenter Reference Guide 7

8
Chapter 14: Using the Universal Port Manager.............................................................................. 255
Overview of the Universal Port Manager.....................................................................................255ExtremeXOS Software Requirements ...................................................................................255UPM Functions .................................................................................................................256Understanding UPM Terminology........................................................................................257
Network Profiles View ..............................................................................................................258Filters and Quick Filters.....................................................................................................260Viewing Details for a Profile................................................................................................263Viewing Differences Between Profiles ..................................................................................264Saving a Profile from the Network to EPICenter....................................................................265Exporting a Profile from the Network ...................................................................................265Running a Profile on a Device Manually...............................................................................266Updating UPM Information From the Network......................................................................269Using the Edit Profile Configuration Wizard .........................................................................269
Managed Profiles View.............................................................................................................273Managed Profiles Function Buttons.....................................................................................273Renaming Profiles or Saving Profiles as a New Version..........................................................275Importing a Profile from a Local Drive Into EPICenter ...........................................................277Exporting an EPICenter Profile to a Local Drive ....................................................................278
Creating and Editing UPM Profiles............................................................................................278Creating UPM Profiles .......................................................................................................278Modifying or Editing Profiles ..............................................................................................281EPICenter UPM Metadata ..................................................................................................282Profile Templates ..............................................................................................................282Profile Testing Wizard........................................................................................................283Using the Profile Deployment Wizard ..................................................................................283
Profile Trigger Events ..............................................................................................................290Universal Port Event Variables ..................................................................................................291
Common Variables.............................................................................................................292User Profile Variables ........................................................................................................292Device Profile Variables .....................................................................................................292
Chapter 15: Administering EPICenter............................................................................................ 295
Overview of User Administration ...............................................................................................295Administration Functions .........................................................................................................295
EPICenter Access Roles .....................................................................................................296EPICenter and RADIUS Authentication................................................................................297Setting EPICenter Server Properties ....................................................................................297
User Administration ................................................................................................................298Adding or Modifying User Accounts.....................................................................................299Deleting a User .................................................................................................................300
Changing Your Password ..........................................................................................................300Role Administration.................................................................................................................301
Adding or Modifying a Role ................................................................................................303Deleting a Role .................................................................................................................304
RADIUS Administration ...........................................................................................................304RADIUS Client Configuration..............................................................................................305RADIUS Server Configuration .............................................................................................306Disabling RADIUS for EPICenter.........................................................................................306
Server Properties Administration...............................................................................................307
EPICenter Reference Guide
Devices Properties.............................................................................................................308Features Properties ...........................................................................................................309Scalability Properties.........................................................................................................310SNMP Properties...............................................................................................................311External Connections Properties..........................................................................................312MAC Polling Properties ......................................................................................................312Other Properties................................................................................................................313
Distributed Server Administration .............................................................................................314Configuring a Server Group Member ....................................................................................315Configuring a Server Group Manager ...................................................................................316
Chapter 16: EPICenter Reports ..................................................................................................... 317
Reports Overview ....................................................................................................................317Accessing EPICenter Reports ...................................................................................................317
Reports Available in EPICenter ...........................................................................................318Selecting Predefined EPICenter Reports to View...................................................................320The Extreme Networks eSupport Export Report.....................................................................321Using Report Filtering........................................................................................................322Sorting Reports .................................................................................................................323Exiting Reports .................................................................................................................323EPICenter Report Structure ................................................................................................323
Network Status Summary Report ..............................................................................................324The Distributed Server Summary.........................................................................................325
Device Reports........................................................................................................................325Device Inventory Report .....................................................................................................325ReachNXT Devices ............................................................................................................333Device Status Report .........................................................................................................334
Slots, Stacks and Ports Reports ................................................................................................336Slot Inventory ...................................................................................................................336Stack Inventory Reports .....................................................................................................339Interface Report ................................................................................................................342Unused Ports Report .........................................................................................................344
EAPS Reports .........................................................................................................................346EAPS Summary.................................................................................................................346EAPS Log Report ..............................................................................................................347
Log Reports ............................................................................................................................348Alarm Log Report ..............................................................................................................349Event Log .........................................................................................................................350Syslog (System Log) ..........................................................................................................353The Configuration Management Activity Log.........................................................................354
Client Reports.........................................................................................................................356Network Login Report ........................................................................................................356Current Clients Report .......................................................................................................357Client History Report .........................................................................................................359Spoofed Wireless Client Report...........................................................................................361Unconnected Client Report ................................................................................................363
MIB Poller Tools .....................................................................................................................365EPICenter Server Reports.........................................................................................................365
Server State Summary Report.............................................................................................365Debug EPICenter...............................................................................................................368
EPICenter Reference Guide 9

10
Adding a User-Defined Report to the Reports Menu....................................................................368Printing and Exporting EPICenter Reports..................................................................................368
Printing Reports................................................................................................................368Exporting Reports..............................................................................................................368
Chapter 17: EAPS Protocol Monitoring and Verification................................................................. 371
EAPS Monitoring Overview .......................................................................................................371Viewing EAPS Information .......................................................................................................371
The EAPS Map View ..........................................................................................................373Displaying EAPS Domain Details ..............................................................................................375
Overview Tab ....................................................................................................................375Common Links Tab............................................................................................................376Displaying EAPS Details for a Selected Device .....................................................................378
Verifying EAPS Information ......................................................................................................378Running EAPS Reports ............................................................................................................380
EAPS Summary Report ......................................................................................................380EAPS Log Reports .............................................................................................................381
Appendix A: Event Types for Alarms ............................................................................................. 383SNMP Trap Events ..................................................................................................................383
Configuring SNMP Trap Events...........................................................................................390RMON Rising and Falling Trap Events.......................................................................................391EPICenter Events ....................................................................................................................392
Appendix B: EPICenter Backup..................................................................................................... 395EPICenter Log Backups ...........................................................................................................395Database Utilities....................................................................................................................395The Validation Utility...............................................................................................................396
Using the DBVALID Command-Line Utility...........................................................................396Database Connection Parameters ........................................................................................397
The Backup Utility ..................................................................................................................398Database Connection Parameters ........................................................................................398Installing a Backup Database .............................................................................................399
Index .......................................................................................................................................... 401
EPICenter Reference Guide

EPICent
Preface
This preface provides an overview of this guide, describes guide conventions, and lists other useful publications.
IntroductionThis guide provides the required information to use the EPICenter software. It is intended for use by network managers who are responsible for monitoring and managing Local Area Networks, and assumes a basic working knowledge of:
● Local Area Networks (LANs)
● Ethernet concepts
● Ethernet switching and bridging concepts
● Routing concepts
● The Simple Network Management Protocol (SNMP)
NOTE
If the information in the Release Notes shipped with your software differs from the information in this guide, follow the Release Note.
TerminologyWhen features, functionality, or operation is specific to the Summit, Alpine, or BlackDiamond switch family, the family name is used. Explanations about features and operations that are the same across all Extreme switch product families simply refer to the product as the “Extreme Networks device” or “Extreme Networks switch.” Explanations about features that are the same for all devices managed by EPICenter (both Extreme devices and others) are simply refered to “devices.”
er Reference Guide 11

Preface
12
ConventionsTable 1 and Table 2 list conventions that are used throughout this guide.
Related PublicationsThe EPICenter documentation set includes the following:
● EPICenter Reference Guide (this guide)
● EPICenter Concepts and Solutions Guide
● EPICenter Installation and Upgrade Guide
● EPICenter Release Notes
● EPICenter License Agreement
Table 1: Notice Icons
Icon Notice Type Alerts you to...Note Important features or instructions.
Caution Risk of unintended consequences or recoverable loss of data.
Warning Risk of permanent loss of data.
Table 2: Text Conventions
Convention DescriptionScreen displays This typeface represents information as it appears on the screen.
Screen displays bold
This typeface indicates how you would type a particular command.
The words “enter” and “type”
When you see the word “enter” in this guide, you must type something, and then press the Return or Enter key. Do not press the Return or Enter key when an instruction simply says “type.”
[Key] names Key names appear in text in one of two ways. They may be
• referred to by their labels, such as “the Return key” or “the Escape key.”
• written with brackets, such as [Return] or [Esc].
If you must press two or more keys simultaneously, the key names are linked with a plus sign (+). For example:
Press [Ctrl]+[Alt]+[Del].
Words in bold type Bold text indicates a button or field name.
Words in italic type Italics emphasize a point or denote new terms at the place where they are defined in the text.
EPICenter Reference Guide

Related Publications
Both the EPICenter Reference Guide and the EPICenter Concepts and Solutions Guide can be found online in Adobe Acrobat PDF format in the docs subdirectory of the EPICenter installation directory. They are also available in a Microsoft Windows environment from the EPICenter Start menu.
You must have Adobe Acrobat Reader version 5.0 or later (available from http://www.adobe.com free of charge) to view these manuals.
The EPICenter software also includes context-sensitive online Help, available from the Help menu in EPICenter windows.
Other manuals that you will find useful are:
● ExtremeWare Software User Guide
● ExtremeWare Command Reference Guide
● ExtremeXOS Concepts Guide
● ExtremeXOS Command Reference Guide
For documentation on Extreme Networks products, and for general information about Extreme Networks, see the Extreme Networks home page:
● http://www.extremenetworks.com
Customers with a support contract can access the Technical Support pages at:
● http://www.extremenetworks.com/services/eSupport.asp
The technical support pages provide the latest information on Extreme Networks software products, including the latest Release Notes, information on known problems, downloadable updates or patches as appropriate, and other useful information and resources.
Customers without contracts can access manuals at:
● http://www.extremenetworks.com/services/documentation/
EPICenter Reference Guide 13

Preface
14
EPICenter Reference Guide
1 EPICenter Overview
This chapter describes the features of the EPICenter™ software.
IntroductionEPICenter is a powerful yet easy-to-use application suite that facilitates the management of a network of Summit™, BlackDiamond™, and Alpine™ switches, as well as selected third-party switches. EPICenter makes it easy to perform configuration and status monitoring, create virtual LANs (VLANs), in enterprise LANs with Extreme Networks switches. EPICenter offers a comprehensive set of network management tools that are easy to use from a client workstation configured with a web browser and the Java plug-in.
EPICenter leverages the three-tier client/server architecture framework represented by Java applets. The EPICenter application and database support three of the most popular operating environments in the marketplace, Microsoft Windows Vista/XP/2003 Server, Red Hat Enterprise Linux, and Sun Microsystems’ Solaris.
Summary of FeaturesThe EPICenter software is a powerful, flexible, and easy-to-use application for centralizing the management of a network of Extreme switches and selected third-party devices, regardless of the network size. The EPICenter software provides the vital SNMP, HTML, and CLI-based tools you need for network-wide management of Extreme Networks Summit, Black Diamond, and Alpine switches.
● Operational Simplicity. Simplicity begins with a detailed real-time view of the entire network. EPICenter’s maps provide users with an overview of every element of the network and how they all connect at Layer 2 and Layer 3. Centralized configuration management and firmware management simplifies the configuration and maintenance of your network elements. These functions can be performed simultaneously on groups of devices anywhere on the network as well as on devices individually.
● Voice-Class Availability. EPICenter’s availability is greatly enhanced by granular health and status monitoring of the network. Ethernet Automatic Protection Switching (EAPS) protocol support within EPICenter enhances a highly available Extreme Networks switching environment. The Real Time Statistics feature provides a graphical representation of utilization and error statistics for multiple ports on a device, device slot, or within a port group.
● Comprehensive Security. EPICenter provides multiple features that control and monitor the security features on Extreme Networks’ products, including creation and management of VLANs easily throughout the network. The IP/MAC Address Finder tool can locate any MAC address on your network.
● Hierarchical grouping for devices and ports. EPICenter allows you to assemble the devices and ports in your network into groups and subgroups, and view information about them or manage them at a group level. You can organize your network into a hierarchy of groups, with subgroups for campuses, buildings, and individual rooms.
EPICenter Reference Guide 15

EPICenter Overview
16
● Integrated network topology maps. EPICenter’s network topology map feature is integrated with the device group functionality, so that when you create a device group, you have the option of selecting the Map view of the group, which causes EPICenter to generate a network topology map, populated with the devices in the group. EPICenter automatically adds any links that exist between the device nodes, and organizes them into submaps as appropriate. You can further customize your maps with background images, decorative nodes and clouds, and user-specified links.
● Overlay views of VLANs in network maps. Information about the VLANs configured on the devices in your network is readily accessible from Network View windows. VLAN services information (VMAN, VLAN aggregation, VLAN translation, and Private VLAN) is incorporated into network topology maps.
● Advanced scripting capabilities. EPICenter includes an interface for creating and executing scripts on your managed devices. Scripts created in EPICenter can include ExtremeXOS CLI commands, as well as commands and constructs in the Tcl scripting language. Scripts bundled with EPICenter ease common network configuration tasks.
● Multi-platform capability. The EPICenter server supports Sun SPARC and Intel platforms, and the Windows Vista, XP, or 2003 Server, Red Hat Enterprise Linux and Solaris operating environments. Clients on any of these platforms can connect to servers on any platform.
● Support for multiple users with security. Users must log in to the EPICenter application, and can be granted different levels of access to the application features based on their assigned role. Three basic predefined roles are provided, and additional user roles can be created. Telnet and SSH access to Extreme switches can also be controlled based on the user identity. To protect sensitive data from being intercepted or altered by unauthorized access, Secure Shell 2 (SSHv2) protocol and HTTPS protocols are provided. These protocols encrypt traffic between the switch management port and the EPICenter.
● Support for third-party devices. Any device running a MIB-2 compatible SNMP agent can be discovered by EPICenter and monitored at a basic level. These devices can appear on a topology map, with basic status and alarm handling based on MIB-2 functionality. Based on EPICenter’s Third Party Integration Framework, selected appliances from Extreme Networks partners can be integrated into EPICenter in a robust fashion that allows reporting, alarm management, and monitoring with graphical front and back panel views.
● Manage large numbers of devices. The EPICenter Gold Upgrade enables the EPICenter server to manage up to 2000 devices with a single installation of the EPICenter software. For even larger networks, you can split the management task among several EPICenter servers in a distributed server mode that lets you monitor the status of those servers from a single client.
Extreme Networks switches and many other MIB-2 compatible devices can be monitored and controlled from a central interface, without exiting EPICenter to run a separate program or Telnet session. Features such as SmartTraps and the EPICenter alarm system further maximize network monitoring capability while maintaining network usage efficiency.
You can organize your network resources into non-exclusive groups (including groups made up of selected ports from multiple switches) that you can manage as a single entity. Device groupings can be based on a variety of factors, such as physical location, logical grouping, devices that support SSH2, and so on. Using device groups, you can search for individual IP addresses and identify their connections into the network. You can monitor the status of your network devices either visually, through network topology maps, or by setting alarms that notify you about conditions or events on your network devices. You can display a high-level overview of the status of your network devices as a hierarchical topology map.
EPICenter Reference Guide

Extreme Networks Device Support
Extreme Networks Device SupportExtreme Networks devices running the ExtremeWare software version 6.2 or later, or ExtremeXOS software, are supported by most features in the EPICenter system.
Devices running versions of ExtremeWare that have reached the end of their support life may continue work with many features of the EPICenter system. However, continued support in the future cannot be guaranteed.
NOTE
See the EPICenter Release Notes or the Extreme Networks web site for the most current information on device support in the EPICenter software.
Third-Party Device SupportAny device running a MIB-2 compatible SNMP agent can be discovered by EPICenter, and saved in the Inventory database. All devices in the database can also appear on a topology map. The EPICenter alarm system can handle basic MIB-2 SNMP traps from any device in the inventory database, including RMON traps from devices with RMON enabled. The Real-Time Statistics module can display statistics for any device with RMON enabled.
EPICenter’s third-party integration framework allows selected devices to be integrated into EPICenter with a higher level of functionality. Devices integrated through this framework may include device-specific front and rear panel views, additional SNMP trap support, and the ability to launch external applications from within EPICenter, if appropriate.
EPICenter also provides support for Avaya Voice Network devices through an integration between EPICenter and Avaya Integrated Management software that co-reside on the same system.
EPICenter Reference Guide 17

EPICenter Overview
18
EPICenter Reference Guide
2 Getting Started with EPICenter
This manual assumes you have successfully installed or upgraded to the current EPICenter software version—version 7.0 or later. If you have not yet installed version 7.0, see the EPICenter Installation and Upgrade Guide for instructions.
The EPICenter Home PageThe EPICenter Home page displays the Network Status Summary Report—a simple HTML report with some basic statistics on the status of your network. Click on the description of the problem where it is underlined in the left-hand side of the page to display a detailed report about a specific status item.
The Network Summary Report can also be accessed from the Reports application. See Chapter 20, “EPICenter Reports” for a more detailed discussion of this report.
Figure 1: The Network Status Summary Report page
This summary shows the following statistics:
● The number of devices known to the EPICenter server that are not responding to EPICenter queries.
EPICenter Reference Guide 19

Getting Started with EPICenter
20
● The number of devices reported to be in marginal condition (such as a problem with the fan, temperature, or power).
● The number of devices that are offline for planned service.
● The number of critical alarms in the last 24 hours that have not been acknowledged.
● The number of Syslog messages with a priority of Critical or worse that occurred in the last 24 hours.
● The number of Invalid Login alarms that have occurred in the last 24 hours.
● The number of Authentication Failure alarms that have occurred in the last 24 hours.
For any of these items where the number is non-zero, the description becomes a link to a sub-report that gives you more information about the situation—a list of devices or alarms or messages.
The Network Status Summary Report also provides version information about the EPICenter software running on your machine.
For further discussion of the information shown on this page, see the section “Network Status Summary Report” on page 324 in Chapter 20 on Reports.
The Distributed Server SummaryIf you are running in a distributed server configuration, a Distributed Server summary appears below the Network Summary.
Each row in the summary provides the status of one of the EPICenter server group members. It provides the following information about each server:
● The server name. Clicking on the server name initiates the Dynamic Reports module for that server. You can then run any of the available HTML reports.
● A link that can launch a client connection to the server. Clicking on the Client link launches a client that attempts to connect to that server.
● The number of devices managed by the server that are up or down.
● The number of critical alarms that have occurred on devices managed by the server.
● The date and time of the last update of the server summary information for this server.
● The status of the server (whether it is responding to the periodic poll).
This report is also discussed in the section “The Distributed Server Summary” on page 325 in Chapter 20 on Reports.
EPICenter WindowsWindows in the EPICenter user interface are made up of a number of frames. Figure 2 shows the components that comprise a typical window in EPICenter.
EPICenter Reference Guide

EPICenter Windows
Figure 2: Components of the EPICenter User Interface (Network Views Window)
The main components of the EPICenter user interface are the following:
Menu Bar Options and commands available in EPICenter. The items shown in the menu bar vary based on the folder that is selected in the Navigation Frame.
Icon Bar Icons for functions available in EPICenter, based on the selected item. You can move your mouse over an icon to view text describing what the icon does.
Navigation Frame Tree view of the of folders and subfolders in EPICenter. You can click on items in the Navigation Frame to show items lower in the hierarchy.
EPICenter has four main folders: Home, Network Views, Network Administration, and Administering EPICenter. Clicking on a main folder reveals the subfolders below it. The subfolders contain links to device groups and EPICenter applications.
Tabbed Windows When you click one of the main folders or a device group folder, it opens a tabbed window for that folder above the Navigation Table. Tabbed windows are dockable, meaning that they can be moved around in the main EPICenter window. See “Moving Tabbed Windows in EPICenter” on page 23 for more information.
Navigation Table Table of information about the objects displayed in the selected folder. Selecting a device in the Navigation Table displays detailed information about the selected device in the Device Details Frame.
Menu Bar Icon Bar
NavigationFrame
Folders
Navigation Table Device Details Frame
Map View
Tabbed Windows
EPICenter Reference Guide 21

Getting Started with EPICenter
22
Modifying Table ViewsMuch of the information displayed in EPICenter is in tabular format. You can sort the rows in a table, modify the table column size, move columns around in a table, and remove columns from a table.
Sorting Table Rows
You can sort the rows of a columnar display according to the contents of any individual column. To sort the rows, click on the column heading you want to use as the sort criteria. Click once to sort in ascending order; click a second time to reverse the sort order.
The column that is currently being used as the sort criteria is indicated with a small triangle in the column heading cell. The direction of the triangle (facing up or facing down) indicates whether the sort is ascending or descending.
Resizing Table Columns
You can resize the widths of each column. To do this, follow these steps:
1 Place the cursor over the line separating the column you want to resize from the column to its right.
2 Click and hold the left mouse button to “grab” the column separator.
3 Drag the separator until the column is are the desired width.
Moving Table Columns
To move a column in a table, click and hold the left mouse button to “grab” the column heading, then drag the column to where you want it to be in the table.
Removing Columns From a Table
To remove one or more columns from a table, follow these steps:
Device Details Frame Detailed information about the object selected in the Navigation Table.
Map View For a selected device group, the graphical representation of the devices and links in the group. Selecting a device in the Map View causes the corresponding row in the Navigation Table to be selected.
EPICenter Reference Guide

EPICenter Windows
1 Click on the icon in the upper right corner of the table you want to modify. A window such as the following appears:
Figure 3: Selecting Columns to Display in a Table
2 Uncheck the columns you want to remove from the table and click OK. Columns that cannot be removed from the table are greyed out.
Moving Tabbed Windows in EPICenterTabbed windows in EPICenter are dockable, which means that you can move them to new locations in the main EPICenter window. To move a window to a new location, do the following:
1 Place the cursor over the tab of the window you want to move.
2 Click and hold the left mouse button to “grab” the window.
3 Drag the window to a new location.
4 Release the left mouse button.
5 At the prompt, indicate whether you want the window to be displayed horizontally or vertically.
EPICenter Reference Guide 23

Getting Started with EPICenter
24
EPICenter Reference Guide
3 Managing Your Network Inventory
This chapter describes how to use EPICenter for:
● Viewing the EPICenter device inventory
● Viewing status information about the devices in the EPICenter inventory
● Viewing detailed information about the devices in the EPICenter inventory
● Displaying device properties
● Discovering network devices
● Adding network devices to the EPICenter database
● Modifying device communications settings
● Deleting a device from the EPICenter database
● Updating device information in the database
● Creating default access parameters for network devices
● Opening a Telnet session to a device
Overview of EPICenter Device Inventory ManagementEPICenter keeps a database of all its managed network devices. EPICenter can discover any devices running MIB-2 compatible agents. It can manage Extreme Networks switches, and can provide information about third-party devices with compatible agents.
The EPICenter software also provides an automatic discovery function. This feature can discover Extreme and MIB-2 compatible devices by specific IP address or within a range of IP addresses.
You can also add network devices to the EPICenter database manually. Once a network device is known to the EPICenter database, you can assign it to one or more device groups, and configure it using EPICenter. You can receive alarms about faults on the device, and you can view a hierarchical topology layout of the devices known to EPICenter.
Any EPICenter user with read-only access to this feature can view status information about the network devices currently known to EPICenter. Users with Administrator or Manager roles, or other roles with write access to this feature, can run Discovery, and add devices to or delete devices from the list of managed devices in the database. These users can also explicitly refresh the information in the database related to the devices that the EPICenter is managing.
Device GroupsDevices in the EPICenter are organized into one or more device groups. A device group is a set of network devices that have something in common, and that can be managed as a group. For example, devices might be grouped by physical location (Building 1, Building 2, first floor, second floor) or by functional grouping (engineering, marketing, finance) or by any other criteria that make sense within the managed network environment.
EPICenter Reference Guide 25

Managing Your Network Inventory
26
An individual device can belong to multiple device groups. For example, a device could simultaneously be a member of Building 1, Marketing, and Edge Switches. Using device groups, you can monitor and maintain devices by group membership, instead of individually. All devices become members of a device group when they are added to the EPICenter database, either through Add Devices or as a part of the Discovery process. By default, devices are added to the device group All, if you do not specify otherwise. A device may then be copied or moved to another device group, as appropriate.
See “Organizing Devices and Ports Into Groups” on page 61 for more information on device groups.
Displaying the Network Device InventoryTo display the device inventory, expand the list of items in the Network Views folder, click the All group, and click All Devices. The device inventory, as shown in Figure 4. is displayed.
Figure 4: Network Device Inventory
NOTE
You must add network devices to the database using Discovery or the Add Devices function in order to make them “known” to EPICenter. Until this is done, no devices are displayed in EPICenter.
The first time you run EPICenter, there is only one device group, All. You cannot delete or change the name of the All device group.
Click on a Device Group name to display the list of switches that are members of that group.
● A red slash through a device indicates that the device is not reachable through SNMP.
EPICenter Reference Guide

Viewing Device Status Information
● A device shown in grey indicates the device has is no longer being managed. EPICenter does not attempt to communicate with a device in the unmanaged state, nor does it accept traps or syslog messages for the device.
● If unacknowledged alarms exist for the device, the alarm status is indicated by a small colored alarm on the device icon in the table. You can investigate these through the Alarm Manager.
Alarm Propagation to the Device Group. If alarm propagation is enabled, the highest severity unacknowledged alarm status among the devices in the Device Group is indicated by a small alarm bell to the left of the Device Group name under the Network Views folder. When a Device Group has been contracted so that its list of devices is hidden, the Device Group alarm icon indicates whether alarms have occurred on any of the devices within the group, and how serious those alarms are.
● Disabling alarm propagation for a device means that device’s alarm status will not be factored into the alarm status for the Device Group. This lets you base alarm propagation at the device group level on a subset of critical devices while ignoring less critical devices.
Devices with alarm propagation disabled show an “X” through the alarm icon. However, the color of the alarm icon still indicates the correct alarm status for the alarm.
● You can also disable alarm propagation for the Device Group, which results in an “X” over the alarm icon. However, there is no higher level for alarm status propagation, so this has no real meaning. The color of the alarm icon will still reflect the worst alarm status of those devices within the Device Group that have alarm propagation enabled.
Viewing Device Status InformationWhen you select a device group under the Network Views folder, the panel on the right displays a summary status of the devices in the selected device group (see Figure 5).
EPICenter Reference Guide 27

Managing Your Network Inventory
28
Figure 5: Device Group Table View
The columns show the following information:
Name The name of the device.
IP address The IP address of the device.
MAC address The device MAC address, if applicable.
Software version The firmware version running on the device.
SNMP version The SNMP version (version 1 or version 3) used on the device.
Log on username The device login name.
SSH The setting for SSH2. Enabled or Disabled.
Forwarding-database polling
The setting for FDB Polling. Enabled or Disabled.
Device manager protocol The protocol used to get access to a non-EPICenter device manager on the device (HTTP or HTTPS).
To use the browser-based management interface provided by the selected device, select Manager (HTML) from the EPICenter Device menu.
Member of The groups and subgroups that the device is a member of.
ReachNXT devices The number of Extreme ReachNXT 100-8t switches connected to the device.
Last updated When the device information was last updated from the switch.
Status The operational status of the device, SNMP Reachable, SNMP Unreachable, or Unmanaged
Type Whether the object is a device or device group.
Worst alarm The priority of the highest unacknowledged alarm currently on the device.
Alarm Propagation Whether alarm propagation is on or off for the device.
EPICenter Reference Guide

Viewing Link Information
Viewing Link InformationClicking on the Links tab displays information about the links between devices in the device group (see Figure 6).
Figure 6: Links Summary Status
The columns show the following information:
Status An icon indicating the status of the link. The link status icon can be one of the following colors:
Up
Last known up
Down
Last known down
At least one of the links in a shared link is down
Last known at least one of the links in a shared link is down
User-created link
Last known user-created link
Unknown
A device The name of the device on one end (the A side) of the link, along with an icon indicating the device status.
A IP address The IP address of the device on the A side of the link.
A port name The name of the port on the A side of the link, along with an icon indicating the port status.
A port number The number of the port on the A side of the link.
B device The name of the device on the other end (the B side) of the link, along with an icon indicating the device status.
EPICenter Reference Guide 29
Managing Your Network Inventory
30
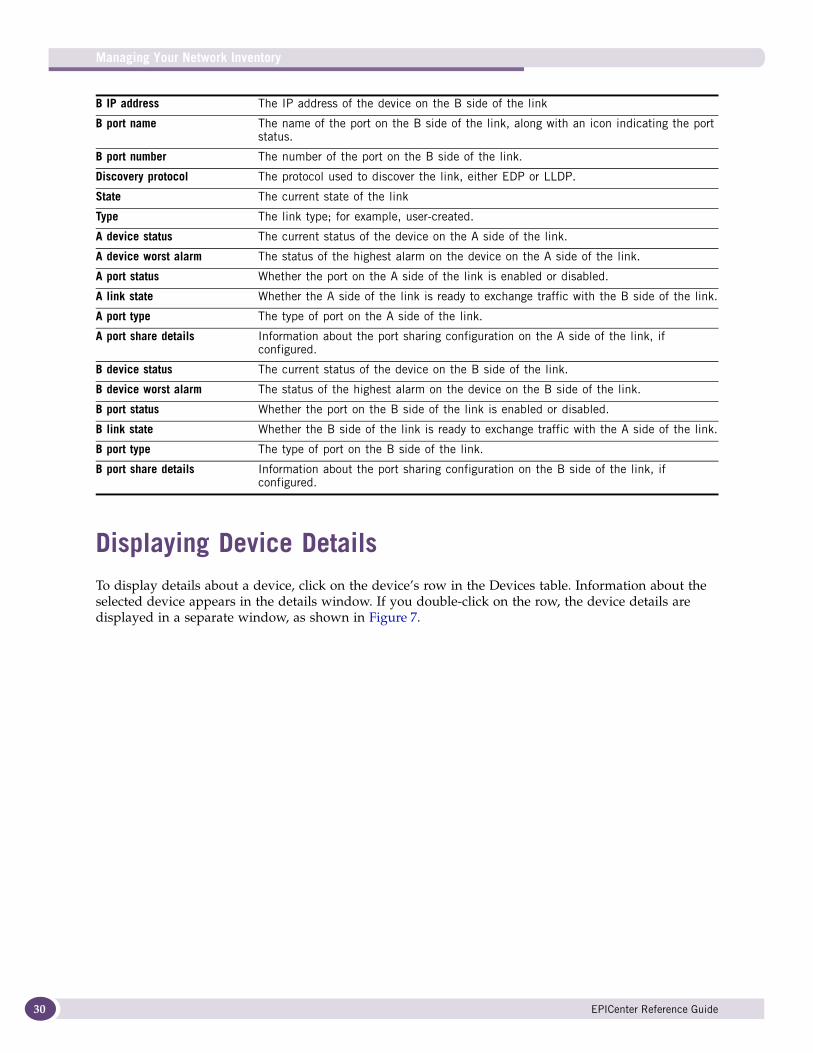
Displaying Device DetailsTo display details about a device, click on the device’s row in the Devices table. Information about the selected device appears in the details window. If you double-click on the row, the device details are displayed in a separate window, as shown in Figure 7.
B IP address The IP address of the device on the B side of the link
B port name The name of the port on the B side of the link, along with an icon indicating the port status.
B port number The number of the port on the B side of the link.
Discovery protocol The protocol used to discover the link, either EDP or LLDP.
State The current state of the link
Type The link type; for example, user-created.
A device status The current status of the device on the A side of the link.
A device worst alarm The status of the highest alarm on the device on the A side of the link.
A port status Whether the port on the A side of the link is enabled or disabled.
A link state Whether the A side of the link is ready to exchange traffic with the B side of the link.
A port type The type of port on the A side of the link.
A port share details Information about the port sharing configuration on the A side of the link, if configured.
B device status The current status of the device on the B side of the link.
B device worst alarm The status of the highest alarm on the device on the B side of the link.
B port status Whether the port on the B side of the link is enabled or disabled.
B link state Whether the B side of the link is ready to exchange traffic with the A side of the link.
B port type The type of port on the B side of the link.
B port share details Information about the port sharing configuration on the B side of the link, if configured.
EPICenter Reference Guide

Displaying Device Details
Figure 7: Device Details Window
The Device Details window has the following tabs:
● General tab
● VLANs tab
● Links tab
● EAPS Domain tab
General TabThe General tab lists information about the ports on the device. When you click the General tab, the following fields are displayed:
The table has the following columns:
Name The name of the device.
SNMP Status Whether the device is reachable using SNMP
IP address The IP address of the device.
EPICenter Reference Guide 31

Managing Your Network Inventory
32
VLANs TabThe VLANs tab contains information about the VLANs configured on the device.
Selecting a VLAN in the table causes information about the ports in the VLAN to be displayed in the Ports table in the lower part of the window. The Ports table contains the following information:
Number Port number. If the device is a chassis device, then the port number is displayed in slot:port format.
Port type The port type. Different icons are used to represent the port types:
• 10/100Mbps ( )
• 100Base-FX ( )
• 100Base-T/TX ( )
• 1000BASE-X ( )
• Tagged ports are shown with a small orange tag ( )
• Load-shared ports (for devices running ExtremeWare) are indicated with a small green S ( ).
Actual speed Speed of the port; Auto if the speed is auto-negotiated.
Configured speed The configured speed of the port
Actual duplex Duplex of the port, either full or half
Configured duplex The configured duplex setting of the port
Media The port media, if applicable.
Link state Whether the port is ready to exchange traffic with the port on the other side of the link.
Port state Whether the port is enabled or disabled.
Vlan tag The VLAN tag value (if any) or “Untagged”.
VLAN name The VLAN name. For VLANs with identical values for Tag and Protocol, but different values for Name, this refers to the same VLAN. In such cases, the multiple Names are displayed, separated by a comma.
Network name The network name category (if any) that this VLAN belongs to. See “Categorizing VLANs With Network Names” on page 243 for more information.
Protocol name The protocol filter(s) configured for the VLAN
QOS profile name QoS profile name configured for the VLAN on the device, if any.
IP forwarding enabled Whether IP forwarding is enabled for the VLAN.
VLAN IP address The IP address of the VLAN.
VLAN IP mask The subnet mask of the VLAN.
Virtual router The virtual router to which the VLAN is associated on the device
Type The VLAN type, either VLAN or VMAN.
Vlan services VLAN service type. Possible values are Translation, Translation-Member, EAPS-Protected, VMAN, Translation VMAN, Translation-Member VMAN, Private-Network, Isolated-Subscriber, Non-Isolated Subscriber, Super VLAN, and Sub VLAN.
See “Viewing VLAN Services Information” on page 250 for more information.
Admin State The administrative state of the VLAN, either Enabled or Disabled.
EPICenter Reference Guide

Displaying Device Details
Links TabThe Links tab displays information about links the selected device has to other devices.
Number Port number. If the device is a chassis device, then the port number is displayed in slot:port format.
Name The name of the port, if assigned.
Tagged Whether the port is tagged.
Media The port media, if applicable.
Type The port type. Different icons are used to represent the port types:
• 10/100Mbps ( )
• 100Base-FX ( )
• 100Base-T/TX ( )
• 1000BASE-X ( )
• Tagged ports are shown with a small orange tag ( )
• Load-shared ports (for devices running ExtremeWare) are indicated with a small green S ( ).
Actual speed Speed of the port; Auto if the speed is auto-negotiated.
Actual duplex The configured speed of the port
Configured speed Duplex of the port, either full or half
Configured duplex The configured duplex setting of the port
State Whether the port is enabled or disabled.
Status An icon indicating the status of the link. The link status icon can be one of the following colors:
Up
Last known up
Down
Last known down
At least one of the links in a shared link is down
Last known at least one of the links in a shared link is down
User-created link
Last known user-created link
Unknown
A device The name of the device on one end (the A side) of the link, along with an icon indicating the device status.
A IP address The IP address of the device on the A side of the link.
A port name The name of the port on the A side of the link, along with an icon indicating the port status.
A port number The number of the port on the A side of the link.
B device The name of the device on the other end (the B side) of the link, along with an icon indicating the device status.
B IP address The IP address of the device on the B side of the link
B port name The name of the port on the B side of the link, along with an icon indicating the port status.
EPICenter Reference Guide 33

Managing Your Network Inventory
34
EAPS Domain TabThe EAPS Domain tab displays EAPS information for an individual device. It contains the following sub-tabs:
● Domains
● Shared ports
● Domain ports
● Device settings
Domains TabThe upper part of the Domains tab shows information about the device in relation to each of the EAPS domains of which it is a member. The lower part shows information about a selected domain node. Select a node to display domain node details and protected VLAN information.
The upper part of the Domains tab window contains the following columns:
B port number The number of the port on the B side of the link.
Discovery protocol The protocol used to discover the link, either EDP or LLDP.
State The current state of the link
Type The link type; for example, user-created.
A device status The current status of the device on the A side of the link.
A device worst alarm The status of the highest alarm on the device on the A side of the link.
A port status Whether the port on the A side of the link is enabled or disabled.
A link state Whether the A side of the link is ready to exchange traffic with the B side of the link.
A port type The type of port on the A side of the link.
A port share details Information about the port sharing configuration on the A side of the link, if configured.
B device status The current status of the device on the B side of the link.
B device worst alarm The status of the highest alarm on the device on the B side of the link.
B port status Whether the port on the B side of the link is enabled or disabled.
B link state Whether the B side of the link is ready to exchange traffic with the A side of the link.
B port type The type of port on the B side of the link.
B port share details Information about the port sharing configuration on the B side of the link, if configured.
Name The name of the EAPS domain where this device is a member (node), and an icon indicating the domain status
• A green ring indicates that all domains in which this device participates are fully operational.
• A yellow ring indicates that one or more of the domains is not fully operational, but is in a transitional state or an unknown state (as when the device is SNMP unreachable).
• A red ring indicates that one or more of the domains is not operational—if the device has a master in a failed state or a Transit node in a “links down” state.
Domain-node name The name of the node given to the device as a member of the domain.
EPICenter Reference Guide

Displaying Device Details
The lower part of the Domains tab window has two additional tabs: Details of device in domain and Protected VLANs.
Details of Device in Domain Tab. When you click the Details of device in domain tab, the following columns are displayed:
Protected VLANs Tab. When you click the Protected VLANs tab, the following columns are displayed:
Shared Ports TabThe upper part of the Shared Ports tab shows information about the shared port(s) on this device. The lower part shows information about each of the domains that share the port. Select a shared port to display the sharing information for that port.
The upper part of the Shared Ports tab window contains the following columns:
The lower part of the Shared Ports tab window contains the following columns:
Domain status Status of the node in the domain. This can be Idle, Complete, Failed, Links Up, Links Down, Preforwarding, Init, Precomplete, PreInit, or Unknown.
Device mode Whether the node acts as a Master or Transit node for this domain.
Primary port The primary port number.
Secondary port The secondary port number.
Domain Node Name The name of the node given to the device as a member of a domain.
Enabled Whether this specific node is enabled as an EAPS node.
Control VLAN Name Name of the control VLAN
Control VLAN Tag VLAN tag (ID) of the EAPS control VLAN
Hello Timer The interval at which the EAPS master polls to check the status of its EAPS member nodes
Failed Timer The interval after a failure is detected before the Failed Timer expires
Failed Timer Action Action to be taken when Failed Timer expires
Primary Port Status Status of the primary port: Up, Down, Blocked, or Unknown
Secondary Port Status Status of the secondary port: Up, Down, Blocked, or Unknown
VLAN name The name of the protected VLAN
Tag The ID of the protected VLAN
Number The port number of the shared port.
Shared-port status Status of the shared port: Idle, Ready, Blocking, Preforwarding.
Shared-port mode Whether the node acts as a Controller or a Partner node for this shared link.
Shared-port link id An integer configured on the switch for the shared port
Neighbor-port status Status of the neighboring node: Down, Up, Error
Root-blocker status The port’s status as a root blocker (None or Active)
Shared-port expiry action Action to be taken when the Shared Port fail timer expires.
Name Name of the EAPS domain that includes the shared port.
EPICenter Reference Guide 35

Managing Your Network Inventory
36
Domain Ports TabThe upper part of the Domain Ports tab shows information about the ports on this device in relation to the EAPS domains to which the device belongs. The lower part shows information about the domains related to a selected port. Select a port to display the domain nodes that are configured on the selected port.
The upper part of the Domain Ports tab window contains the following columns:
The lower part of the Domain Ports tab window contains the following columns:
Device Settings TabThe Device Settings tab lists information about the EAPS configuration on the device. It contains the following columns:
Displaying Link DetailsTo display details about a link, click on the link’s row in the Links table. Information about the selected link appears in the details window. If you double-click on the row, the link details are displayed in a separate window, as shown in Figure 8.
Domain status Current status of the EAPS domain.
Other ports in domain The other port (besides the shared port) configured in the pair for this EAPS domain.
Number The number of a port configured for one of the domains sharing a link.
Shared-port link id An integer ID configured on the switch for the shared port only.
Shared-port mode Whether the node acts as a Controller or a Partner node or is unconfigured for the shared port.
Status of port in domain Status of the domain port in the EAPS domain. This can be Up, Down, Blocked, or Unknown.
Domain name The domain node name given to the device as a member of an EAPS domain.
Domain status Status of the node: Idle, Complete, Failed, Links Up, Links Down, Preforwarding, Init, Precomplete, PreInit, or Unknown.
Device mode Whether the node acts as a Master or Transit node for this domain.
Primary port Primary port number.
Secondary port Secondary port number.
EAPS Protocol Enabled Whether the EAPS protocol is enabled on this device (true or false).
Fast Convergence Enabled Whether fast convergence is enabled for this device (true or false).
Last Configuration Updated The date of the last configuration update.
Last Status Updated The date of the last status update.
EPICenter Reference Guide

Displaying Link Details
Figure 8: Link Details Window
The Link Details window has the following fields:
For each side of the link, the following fields are displayed:
Name The devices and ports on either side of the link.
State Current connection state of the link
Type Whether the link is user-created or a discovered physical link
Link Status Current link status
Discovery Protocol The protocol used to discover the link, either EDP or LLDP.
Device
Device The name of the device
IP address The IP address of the device
Offline Whether the device is offline
Device worst alarm The highest priority alarm on the device
Port
Number The port number
Name The port number, if configured
Type The port type
Status The status of the port, enabled or disabled
Link State Status of the port: Idle, Ready, Blocking, Preforwarding
Share details Information about the port sharing configuration for the port, if applicable
EPICenter Reference Guide 37

Managing Your Network Inventory
38
If you enable the Show VLANs box, the VLANs configured for the ports that make up the link are displayed in the table. See “VLANs Tab” on page 32 for a description of the columns that appear in the table.
Displaying Port DetailsIf a port is a member of a port group, you can display details about the port by clicking the port’s row in the Table view of the port group. Information about the selected port appears in the details window. If you double-click on the row, the device details are displayed in a separate window, as shown in Figure 7.
Figure 9: Port Details Window
The Port Details window has the following fields:
Number Port number. If the device is a chassis device, then the port number is displayed in slot:port format.
Name Port name, if configured
Device Name Name of the device where the port resides
IP address IP address of the device
Actual speed Speed of the port; Auto if the speed is auto-negotiated.
Configured speed The configured speed of the port
Actual duplex Duplex of the port, either full or half
Configured duplex The configured duplex setting of the port
Type The port type. Different icons are used to represent the port types
Link State Whether the port is ready to exchange traffic with the port on the other side of the link.
Port Status Whether the port is enabled or disabled.
Device Last Updated When information was last retreived from the device
Device status Whether the device is reachable through SNMP
Device Type The model of the device,
EPICenter Reference Guide

Device Inventory
Device InventoryThe Device Inventory shows an active graphical display of the switch front panel, as well as a panel of status information. For some devices, a back panel view may also be provided.
To display the Device Inventory for a device, click on the device’s row in the Devices table, then select Inventory from the Device menu. This display shows additional information that EPICenter has gathered from the switch agent.
Figure 10: Device Inventory
You can click on the slots and ports in the Panel View to display additional information about the selected item.
Device PropertiesYou can view the properties of a device in the EPICenter database. This section describes the information displayed in the various properties windows.
EPICenter Reference Guide 39

Managing Your Network Inventory
40
Most of the information in the various Properties displays is shown in columnar form. The columns can be resized by “grabbing” the separator between two column headings, and the display can be sorted by clicking on a column heading. The column heading shown in green indicates the column used to sort the display.
The Device Properties window shows several tabs of information about the selected device (see Figure 11). To display this window, select a device, then select Properties from the File menu, or from the right-click pop-up menu.
Figure 11: Device Properties window
The Device Properties window displays a set of tabs at the top of the window, depending on the type and configuration of the device. The following tabs may appear:
● Device
● Network Clients
● Syslog Messages
Each tab displays the name of the device and a status “light” which shows the status of the device as detected by the EPICenter software.
The Device TabThe Device tab displays a variety of configuration and status information about the device. At the top of the window it shows the basic identification information:
Device The name of the device and the status indicator “light”
IP Address The IP address of the device
Type/Version The type of device, and the version of the software currently running on the device
EPICenter Reference Guide

Device Properties
The main section of the window presents the values of attributes about the device. These vary depending on the type of device and the features it supports.
The Network Clients TabThe Network Clients tab lists information about the users connected through the device.
The Syslog Messages TabThe Syslog Messages tab lists information about the last 500 Syslog Message received from the device.
Syslog messages are stored along with traps in the event log. The Port Properties window shows several tabs of information about the selected port (see Figure 11). To display this window, select a port, then select Properties from the File menu, or from the right-click pop-up menu.
MAC Address The MAC address of the device
Boot Time The date and time of the last device reboot
Port The port on the device on which the user is logged in.
User Name The login name of the user.
IP Address The IP address of the user’s host.
Login Type The login type, either network login or 802.1x.
MAC Address The MAC address of the user’s host.
VLAN The VLAN to which the port belongs.
Time The time that the message was received.
Severity The severity level of the message. Severity levels include the following:
• 0—Emergency
• 1—Alert
• 2—Critical
• 3—Error
• 4—Warning
• 5—Notice
• 6—Information
• 7—Debug
Facility The Syslog facility reporting the message.
Message The text of the message.
EPICenter Reference Guide 41

Managing Your Network Inventory
42
Figure 12: Port Properties window
The Device Port Properties window may have up to three tabs:
● Port
● Operational FDB
● Network Clients
The Port Tab
The Port tab displays the following information:
Port Number The number of the port
Media The media for a redundant port (Primary or Redundant)
Configured Type The type of port
Link State The link status of the port (Uplink or Edge port)
Port Enabled Whether the port is enabled (yes) or not enabled (no)
Actual Speed The speed of the port
Actual Duplex The duplex setting of the port (Half, Full, or None)
Load Sharing The load sharing state of the port (On or Off)
FDB Polling Status Whether the port is being polled: Actively Polled (Edge Port) or Not Polled (Inactive Port)
EPICenter Reference Guide

Device Properties
The Operational FDB Tab
The top part of the Operational FDB tab display shows the following information for the entries in the FDB:
Select an entry in the table to display further information about the FDB entry at the bottom of the window:
The Network Clients Tab
The Network Clients tab displays the following information:
Port The port where the MAC address was discovered
MAC Address The MAC address that defines the entry
IP Address(es) IP addresses detected for the MAC address
Dynamic Shows a green check if the entry is dynamic; shows a red X if it is not.
Static Shows a green check if there is a static entry for the MAC in the permanent FDB; shows a red X if there is not.
Permanent Shows a green check if the entry is permanent; shows a red X if it is not.
Forwarding Type The forwarding type: MAC, IP, IPX, MAC/IP, MAC/IPX, or unknown
Discovered The date and time at which the MAC address was learned by EPICenter
Port The port on which the MAC address was learned
MAC Address The MAC address that defines the entry
Locked Down Whether the MAC is locked to this port due to a learning limit (Yes/No)
Secure Whether the MAC is locked to this port due to a permanent secure entry (Yes/No)
Blackhole Type Blackhole type (None, Ingress, Egress, both)
Mirrored Whether the MAC is mirrored (Yes/No)
Questionable Whether the MAC is questionable (Yes/No)
Remapped Whether the MAC has been remapped (Yes/No)
Translated Whether the MAC has been translated (Yes/No)
Port The port on the device on which the user is logged in.
User Name The login name of the user.
IP Address The IP address of the user’s host.
Login Type The login type, either network login or 802.1x.
MAC Address The MAC address of the user’s host.
VLAN The VLAN to which the port belongs.
EPICenter Reference Guide 43

Managing Your Network Inventory
44
Discovering Network DevicesEPICenter provides an automatic Discovery function that lets you discover network devices by IP address.
1 Select Discover device from the File > New menu to display the Discover Devices window, as shown in Figure 13.
Figure 13: Inventory Manager Discover Devices set up window
2 Enter your settings (Vendor Filters selection, IP address range, subnet mask, etc.) in the top portion of the window.
The fields and buttons in this window are defined as follows:
Extreme only Select this button to discover Extreme devices only.
All MIB-2 devices Select this button to discover all MIB-2 compatible devices.
IP Address with Wild Cards Specify the device address range using wild cards, such as 10.203.10.* or 10.203.?.??
Valid wildcard characters are *, ?, and - (dash):
* acts as a wildcard for the entire octet (0-255).
? is a wildcard for a single digit (0-9).
- lets you specify a range for any octet. You can use this in more than one octet. Note that you cannot combine the dash with another wildcard in the same octet.
You can also use the IP Address with Wild Cards field to specify a single IP address.
IP Address Range Specify the device address range, such as 10.203.10.20 to 10.203.10.45.
IP Address/Net Mask(CIDR) Specify the device address range, in Classless InterDomain Routing (CIDR) format. The value in the Subnet Mask field is the number of bits to be masked, starting from the high-order (left-hand) octet.
SNMP Read Community Specify (or verify) the SNMP Read Community string so that EPICenter can retrieve information from any SNMP version 1 devices it discovers.
EPICenter Reference Guide

Discovering Network Devices
Note that there are certain IP addresses that are reserved. You should not include these addresses in your discovery.
● Class A networks: 0 and 127 are reserved.
● Class D networks: 224 - 239 are reserved for multicasting.
● All addresses above 239 are reserved.
● 255 is reserved for broadcast datagrams for either the host or network portion of the IP address.
In addition, certain host addresses may be interpreted as broadcast addresses, depending on the subnetting of your network.
IP addresses are processed prior to starting the discovery, and IP addresses that contain 255’s in the host portion are eliminated. This is based on the IP address as well as the subnet mask.
The following examples show how the various wild-card specifications can be used to specify various IP address ranges:
3 Click the New button to add the range into the Device Discovery Criteria list.
4 Repeat steps 3 through 6 to specify any additional device addresses or ranges for the discovery.
5 When you have finished entering your discovery criteria, click the Discover button at the bottom of the window to initiate the discovery.
The buttons in the middle and at the bottom of the page have the following functions:
Enable SNMP V3 Discovery Select Enable SNMP V3 Discovery if devices on your network use SNMP version 3.
SNMP Timeout Specify the length of time to wait for an SNMP request to complete when attempting to contact the devices within the discovery range. Value can be between 100 and 300000 milliseconds, with 100 being the default. This setting affects only the current discovery criteria entry; you can set this value independently for each criteria setting in the Discovery Criteria list.
IP Address Specification Addresses Generated
10.203.0.* polls 10.203.0.0 through 10.203.0.255
10.203.?.?? polls 10.203.0.0 through 10.203.9.99
10.203.0.1? or 10.203.0.10-19 both specify the same range: 10.203.0.10 through 10.203.0.19
10.203.0-2.10-30 polls 10.203.0.10 through 10.203.0.3010.203.1.10 through 10.203.1.3010.203.2.10 through 10.203.2.30
New Adds the current Device Discovery Options specified in the top part of the dialogue box to the Device Criteria List
Remove Removes a selected row from the Device Discovery Criteria List.
Reset Clears the Device Discovery Criteria List.
Close Closes the Discover Devices Dialogue box.
Discover Initiates the discovery based on the specifications in the Device Discovery Criteria List.
EPICenter Reference Guide 45

Managing Your Network Inventory
46
Discovery ResultsA Discovery Results window is displayed as soon as the discovery process begins, as shown in Figure 14. The panel at the bottom of the window shows the progress of the discovery and displays status messages for each device it finds as it works through the set of IP addresses you have specified.
Figure 14: Results of a discovery, with details visible
When the discovery has completed, the set of discovered devices is listed in the top panel of the Discovery Results window.
NOTE
These devices are NOT automatically entered into the EPICenter database. You must explicitly select and add devices to the database.
To add devices to the EPICenter database:
1 Select individual devices or a range of devices in the Results list.
2 Click the Add button at the bottom of the device list to add these devices to the EPICenter Inventory database.
The buttons below the list of devices have the following functions:
Add Attempts to add selected devices to the EPICenter Inventory database.
Close Closes the Discovery Results window. If you close the Discovery Results window without adding devices, the results for devices not already in the EPICenter database are lost.
Hide Details Hides the Discovery status details that are displayed during the Discovery process.
View Details Re-displays the Discovery status details (appears only after Discovery details have been hidden)
Reset Clears your selections from the discovered devices list.
EPICenter Reference Guide
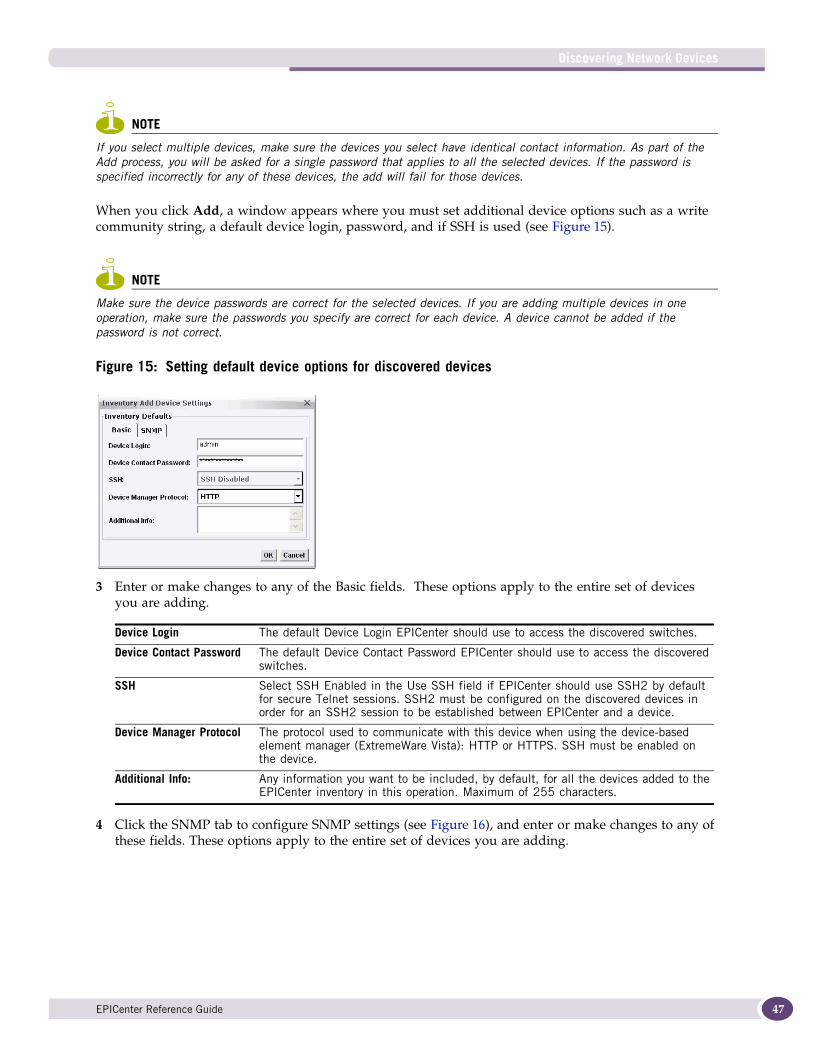
Discovering Network Devices
NOTE
If you select multiple devices, make sure the devices you select have identical contact information. As part of the Add process, you will be asked for a single password that applies to all the selected devices. If the password is specified incorrectly for any of these devices, the add will fail for those devices.
When you click Add, a window appears where you must set additional device options such as a write community string, a default device login, password, and if SSH is used (see Figure 15).
NOTE
Make sure the device passwords are correct for the selected devices. If you are adding multiple devices in one operation, make sure the passwords you specify are correct for each device. A device cannot be added if the password is not correct.
Figure 15: Setting default device options for discovered devices
3 Enter or make changes to any of the Basic fields. These options apply to the entire set of devices you are adding.
4 Click the SNMP tab to configure SNMP settings (see Figure 16), and enter or make changes to any of these fields. These options apply to the entire set of devices you are adding.
Device Login The default Device Login EPICenter should use to access the discovered switches.
Device Contact Password The default Device Contact Password EPICenter should use to access the discovered switches.
SSH Select SSH Enabled in the Use SSH field if EPICenter should use SSH2 by default for secure Telnet sessions. SSH2 must be configured on the discovered devices in order for an SSH2 session to be established between EPICenter and a device.
Device Manager Protocol The protocol used to communicate with this device when using the device-based element manager (ExtremeWare Vista): HTTP or HTTPS. SSH must be enabled on the device.
Additional Info: Any information you want to be included, by default, for all the devices added to the EPICenter inventory in this operation. Maximum of 255 characters.
EPICenter Reference Guide 47

Managing Your Network Inventory
48
Figure 16: Setting SNMP default device options for SNMP V3 discovered devices
The options that appear in this dialog depend on whether you have discovered devices that use SNMP V3.
5 Click OK when you have made the necessary changes.
A Progress and Results window (shown in Figure 17) appears to show you the progress of the Add command.
SNMP Write Community String
Specify (or verify) the SNMP Write Community string so that EPICenter can retrieve information from any SNMP version 1 devices it discovers. The default (for Extreme Networks devices) is private
The following options appear only if you have discovered SNMP v3 devices.
SNMP V3 User Name Specify the principal name used for SNMP V3 authentication and security. The default is initialmd5.
SNMP V3 Privacy Protocol Specify the SNMP V3 privacy protocol. Select either No Privacy or CBC DES Privacy. The default is No Privacy.
SNMP V3 Privacy Password If the devices use CBC DES Privacy, enter the privacy password. The default is and empty password (no password).
SNMP V3 Authentication Protocol
Specify the SNMP V3 authentication protocol. Select No Authentication, MD5 Authentication, or SHA Authentication. The default is MD5 Authentication.
SNMP V3 Authentication Password
If the devices use SNMP V3 Authentication, enter the authentication password. The default password is initialmd5.
EPICenter Reference Guide

Adding Devices to EPICenter
Figure 17: Progress and Results Window
The symbols that may appear in this window are the following:
The indicators just below the tree area of the window show the number of devices currently in each state.
To see the messages related to an Add function (either successful or unsuccessful), select a device in the list. The messages related to the device are displayed as lines under the device node.
CAUTION
If you close the Discovery Results window without adding devices, the results for devices not already in the EPICenter database are lost. You must perform a discovery again to regenerate information on those devices.
After the Add has finished, the Discovery Results window remains open. You can select more devices, specify a different set of Inventory Device Options, and add those devices to EPICenter.
Adding Devices to EPICenterTo add devices to the EPICenter database:
Purple rotating clock icon The add function is in progress.
Green check in the checkbox The device has been successfully added.
Red X in the checkbox The device cannot be added; the device name is displayed in red.
Plus and minus signs Click the plus sign at the left of the device name to display server messages related to adding the device.
Click the minus sign at the left of the device to hide the server messages.
Up and down arrows Move up and down the device tree, displaying the server messages associated with each device.
Errors only box If checked, the up and down arrow buttons expand only devices that had errors.
Collapse All button Collapses all the device nodes, hiding all the server messages.
EPICenter Reference Guide 49

Managing Your Network Inventory
50
1 From the File menu, select New > Device.
2 Select the appropriate tab to display the Basic information in the Add Device window, as shown in Figure 18.
Figure 18: Add Device Window
The fields under the Basic tab are as follows:
3 To configure SNMP information for the device, click the SNMP tab, as shown in Figure 19, and enter or change the information as necessary.
Device IP Address The Device IP Address that EPICenter uses to access the switch.
You may also enter a DNS-resolvable host name in place of the Switch IP address.
Device Login The Device Login that EPICenter should use to access the switch.
SSH If EPICenter is going to use SSH2 for secure Telnet sessions, select SSH Enabled. SSH2 must be configured on the device in order for an SSH2 session to be established between EPICenter and the device.
If SSH is not available (SSH enabling key not installed) this field is not selectable.
Device Manager Protocol The protocol used to communicate with this device when using the device-based element manager (ExtremeWare Vista): HTTP or HTTPS. SSH must be enabled on the device.
Device Poll Interval (minutes) The Device Poll Interval that controls how frequently EPICenter polls the device for detail status information. (Basic device status information is polled more frequently, and that interval is set as a server property in EPICenter Administration.)
The default setting for the device poll interval is 30 minutes for an Extreme modular chassis and 90 minutes for an Extreme stackable chassis.
Device Contact Password The Device Contact Password that EPICenter should use to access the switch.
Additional Info Any additional information you want to be included with this device. Maximum of 255 characters.
EPICenter Reference Guide

Adding Devices to EPICenter
Figure 19: SNMP tab for Add Device window
The fields under this tab are as follows:
4 To place the new device in the list of devices to be added to the EPICenter Inventory database, click the New button at the center of the page. The device specifications are added to the list.
To remove a device specification from the list, select the entry for the device and click the Remove button.
5 Click Add to initiate the Add process.
A message window appears showing the progress of the add request. EPICenter makes a set of SNMP requests to retrieve data from the device that is needed by various EPICenter applications. If the device is an Extreme switch, it also creates a set of SmartTraps rules that tell the switch what status and configuration changes are of interest to EPICenter.
If the device cannot be added, the window shows an error status. When the add request is complete, click OK to continue.
SNMP Version Select the SNMP version from the SNMP Version pull-down menu.
SNMP Read Community String If the device is using SNMP version 1, enter the SNMP Read Community string for the device. The default (for Extreme Networks devices) is public.
SNMP Write Community String If the device is using SNMP version 1, enter the SNMP Write Community string for the device. The default is private.
SNMP V3 User Name If the device is using SNMP version 3, enter the principal name used for SNMP V3 authentication and security. The default is initialmd5.
SNMP V3 Privacy Protocol If the device is using SNMP version 3, select SNMP V3 Privacy Protocol. Select either No Privacy or CBC DES Privacy. The default is No Privacy.
SNMP V3 Privacy Password If the device is using SNMP version 3, select SNMP V3 Privacy Password. If the device is using CBC DES Privacy, enter the privacy password. The default is no password (an empty string).
SNMP V3 Authentication Protocol
The SNMP V3 authentication protocol. Select No Authentication, MD5 Authentication, or SHA Authentication. The default is MD5 Authentication.
SNMP V3 Authentication Password
If the device is using SNMP V3 Authentication, enter the authentication password. The default password is initialmd5.
EPICenter Reference Guide 51

Managing Your Network Inventory
52
NOTE
After a device is added to EPICenter, it may take between 1 and 5 minutes for information about the VLANs configured on the device to appear in EPICenter displays.
Modifying Communications SettingsYou can modify the access parameters for an individual device, or to add and delete members of a device group. You must have read-write access to modify device contact information and device groups. If you have read access only, you cannot use this function.
To modify the communications settings information for one or more managed devices in the database, do the following:
1 Select one or more devices whose communications settings information you want to modify. You can modify multiple devices in the same operation if they all use the same settings.
2 From the Device menu, select Modify communication settings. The following window is displayed.
Figure 20: Devices tab of the Modify Communications Settings window
The fields on the Device tab, when the Basic tab is showing, are as follows:
Filter by Device Group To select a device from a specific device group, select the device group from the pull-down list in the Filter by Device Group field. Select All Devices to view the list of all devices from all device groups.
Device IP Address The IP address of the selected device.
Device Login The login needed to Telnet to the device or to use ExtremeWare Vista.
EPICenter Reference Guide

Modifying Communications Settings
NOTE
The Device Poll Interval set here is different from the global Poll Interval you can set in EPICenter Administration. The global poll interval controls the basic status polling needed to ensure SNMP reachability, and is typically done much more frequently than detailed device polling.
NOTE
To configure SSH2 on a device, the device must be running a version of the ExtremeWare software that supports SSH2. For more information on configuring a device to use SSH2, see the ExtremeWare Software Users Guide.
3 Enter the changed information in the appropriate fields of the SNMP tab, as shown in Figure 21.
SSH Selects whether EPICenter should use SSH2 for secure Telnet sessions. SSH2 must be configured on the device in order for an SSH2 session to be established between EPICenter and the device. If SSH is not available (SSH enabling key not installed) this field is not selectable.
Note: If you disable SSH on the device, you will no longer be able to change this setting in EPICenter. Be sure to disable SSH in EPICenter before you disable it on the device.
Device Manager Protocol The protocol used to communicate with this device when using the device-based element manager (ExtremeWare Vista): HTTP or HTTPS. SSH must be enabled on the device.
Device Poll Interval Specifies how frequently the EPICenter server should poll the for detailed device information, such as software version, BootROM version, and so on. This also includes EDP and ESRP information for non-”i” series devices. To avoid a potentially large amount of polling traffic, this detailed polling is only done every 30 minutes for core (chassis) devices and 90 minutes for edge devices. The default is 90 minutes for both the core and edge devices. You can change this detailed polling interval by entering a different value in this field.
Device Contact Password The password needed to Telnet to the device or to use ExtremeWare Vista.
Offline Sets the device to the offline state in the EPICenter database. The device state can either be offline or online.
Additional Info Any additional information you want to be included with this device. Maximum of 255 characters.
EPICenter Reference Guide 53

Managing Your Network Inventory
54
Figure 21: SNMP tab under the Modify Communications Settings window
The fields under the SNMP tab are as follows:
4 To implement the settings changes, click Modify.
If you have modified the Device Contact Password (under the Basic tab) or either of the SNMP Community strings, on Extreme Networks devices, EPICenter asks if you want to change those values on the switch as well as in the EPICenter database. This dialog appears only if you have changed one of these three values, and lists only those that you have changed. If you change any other values, such as the SNMPv3 settings, EPICenter does not warn you and does not make changes on the device.
This dialog does not appear if you have changed only third-party devices.
SNMP Version The version of SNMP (version 1 or version 3) that EPICenter uses to access the device.
SNMP Read Community String Can be modified if the device is using SNMP version 1. Default is public.
SNMP Write Community String Can be modified if the device is using SNMP version 1. Default is private.
SNMP V3 User Name The principal name used for SNMP V3 authentication and security. The default (for Extreme Networks devices) is initialmd5.
SNMP V3 Privacy Protocol Specifies the SNMP V3 privacy protocol. Select either No Privacy or CBC DES Privacy. The default is No Privacy.
SNMP V3 Privacy Password If the device is using CBC DES Privacy, enter the privacy password. The default is and empty password (no password).
SNMP V3 Authentication Protocol Specifies the SNMP V3 authentication protocol. Select No Authentication, MD5 Authentication, or SHA Authentication. The default is MD5 Authentication.
SNMP V3 Authentication Password If the devices is using SNMP V3 Authentication, enter the authentication password. The default password is initialmd5.
EPICenter Reference Guide

Deleting Devices
● To change the values in the EPICenter database and on the device itself, click Device and Database
● To change the values only in the EPICenter database, click Database only.
If you have already changed these values on the device, you should select Database only, as EPICenter will not be able to communicate with the device until after these settings have been changed in the database.
If you change the community string in the database for a device, and do not elect to change it on the device itself, EPICenter may no longer be able to communicate with the device.
For settings other than the device contact password and community strings, EPICenter does not make any changes on the device. In order to continue to communicate with the device, you must Telnet to the device to make changes. If you change the device contact password in both the database and the device, EPICenter will still be able to contact the device via Telnet to open a Telnet session on the device.
If you have modified both Extreme Networks and third-party devices, and you select the Device and Database setting, the device configuration will occur only on the Extreme Networks devices.
5 The window stays open after you perform a Modify operation. When you have finished all your changes, click Close. If you have made changes to any of the fields but not modified them, EPICenter will ask you to confirm that you want to exit without making the changes.
Deleting DevicesYou must have read-write access to delete devices from the EPICenter database or from device groups. If you have read-only access, you cannot use this function.
To delete a device in EPICenter:
1 Select one or more devices you want to delete.
2 From the Edit menu, select Delete.
EPICenter prompts you to confirm the deletion. If you are deleting the device from a device group, you are prompted whether you want to delete the device from only the currently selected group or from all groups.
Deleting an online device removes the information about the device from the EPICenter database; the device can no longer be monitored and managed from the EPICenter application. If the device is an Extreme switch, deleting it removes any SmartTraps rules, both from the database and the switch change table. It also removes all information about VLANs, QoS Policy, and Virtual Chassis connections associated with this switch from the EPICenter database.
If the device is unmanaged, the device is removed from EPICenter, but the Smart Trap entries on the device are not removed.
NOTE
Deleting a device from EPICenter has no effect on the configuration of the device itself, other than altering the trap receiver table.
EPICenter Reference Guide 55

Managing Your Network Inventory
56
Updating Device InformationOccasionally, you may want to update the configuration and status information for one or more devices in the EPICenter database. The Refresh operation is a manual update you can use if you believe that the device configuration is not correctly represented in EPICenter.
To refresh the configuration and status information, follow these steps:
1 Select one or more devices.
2 From the View menu, select Update Device.
EPICenter uses SNMP to retrieve configuration and status information from each selected switch, and updates the EPICenter database with that information.
NOTE
Offline devices display a warning and are not synchronized.
Configuring Default Access ParametersThe Default Device Communication Settings window allows you to configure a set of default access parameters for network devices you have not yet discovered. After you configure the default access parameters, the network devices you discover and add to the EPICenter database have these default parameters.
1 From the Tools menu, select Default communications settings.
The Configure Defaults window, shown in Figure 22, is displayed.
Figure 22: Default Device Communication Settings window, Basic tab
The fields on the Basic tab are:
Device Login The device login required for Telnet or to use ExtremeWare Vista. The default is admin.
Device Contact Password The device password. The default is an empty password (no password).
EPICenter Reference Guide

Configuring Default Access Parameters
2 Click the SNMP tab to enter or make changes to any of the SNMP fields, as shown in Figure 23. These options apply to future network devices that you add to the EPICenter database.
Figure 23: Default Device Communication Settings window, SNMP tab
The fields on the SNMP tab are:
Reset clears the contents of the fields and reset them to their default values.
3 Click Save to save your changes to the EPICenter database.
A message window appears showing you the progress of the Save command.
4 Click OK to return to the Configure Defaults window.
5 Click Close to exit the Configure Defaults window.
Use SSH Whether SSH2 should be used for secure Telnet sessions. Select SSH Enabled if EPICenter should use SSH2s. SSH2 must be configured on the device in order for an SSH2 session to be established between EPICenter and the device. The default is SSH Disabled.
Device Manager Protocol The protocol used to communicate with this device when using the device-based element manager (ExtremeWare Vista): HTTP or HTTPS. SSH must be enabled on the device. The default is HTTP.
Additional Info: Any information you want to be included, by default, for all devices added to the EPICenter inventory. Maximum of 255 characters.
SNMP Read Community String The SNMP community string for devices using SNMP version 1. The default is public.
SNMP Write Community String The SNMP community string for devices using SNMP version 1. The default is private.
SNMP V3 User Name The principal name used for SNMP V3 authentication and security. The default is initialmd5.
SNMP V3 Privacy Protocol Specifies the SNMP V3 privacy protocol. Select either No Privacy or CBC DES Privacy. The default is No Privacy.
SNMP V3 Privacy Password If the device is using CBC DES Privacy, enter the privacy password. The default is no password (an empty string).
SNMP V3 Authentication Protocol
Specifies the SNMP V3 authentication protocol. Select No Authentication, MD5 Authentication, or SHA Authentication. The default is MD5 Authentication.
SNMP V3 Authentication Password
If the devices is using SNMP V3 Authentication, enter the authentication password. The default password is initialmd5.
EPICenter Reference Guide 57

Managing Your Network Inventory
58
Opening a Telnet Session to a DeviceYou can open a Telnet session on an individual device, and execute commands just as you would from a standard Telnet interface. You can optionally record the commands and output from a Telnet session and save the results to a file.
For Extreme Networks devices, EPICenter will automatically log into the switch based on the device login name and contact password configured for the device in the Add Device window. For third-party devices, you will need to provide the login and password interactively.
To open a Telnet session to a device, click on the device’s row in the Devices table (or select it in the Map View, if available), then select Telnet into from the Device menu. An EPICenter Telnet window is opened, and a Telnet session to the device is started, as shown in Figure 24.
Figure 24: EPICenter Telnet Window
The EPICenter Telnet window is a two-tone window—the bottom of the window is white, the top is gray. The last 25 lines of Telnet commands and responses always appear in the white portion of the window. As output grows, the older lines scroll up into the gray portion of the screen. This makes it easy to tell whether you are viewing the most recent Telnet output.
To copy text in an EPICenter Telnet window, select the text, then right-click and select Copy from the pop-up menu.
To paste text from the clipboard to the command prompt in the EPICenter Telnet window, right-click and select Paste from the pop-up menu.
EPICenter Reference Guide

Opening a Telnet Session to a Device
To record the commands and output from a Telnet session, select Start Recording from the Tools menu in the EPICenter Telnet window. You can also start recording by clicking the icon, or by right-clicking and selecting Start Record from the pop-up menu.
To stop the recording, select Stop Recording from the Tools menu in the EPICenter Telnet window. You can also start recording by clicking the icon, or by right-clicking and selecting Stop Record from the pop-up menu. The recorded commands and output from the Telnet session are saved to a file on your local system.
On Windows systems, the file saved in the following directory:
C:\Documents and Settings\<user>\.epicenter\7.0\<server_ipaddr>\data\admin\telnet
The file name is in the format <device_ipaddr>-<date>-<time>.txt; for example: 10_210_12_4-20090113-120302.txt
EPICenter Reference Guide 59

Managing Your Network Inventory
60
EPICenter Reference Guide
4 Organizing Devices and Ports Into Groups
This chapter describes how you can use the EPICenter grouping feature to place devices and ports into logical, hierarchical groups.
Overview of Device Groups and Port GroupsEPICenter has a powerful grouping feature that allows you to assemble groups of devices and ports, and view information about them or manage them at a group level.
The EPICenter grouping feature allows you to do the following:
● Organize your devices and ports in a logical group structure
For example, you can create a device group, “Main Campus”, consisting of devices in that location. Within the “Main Campus” device group, you can create subgroups such as “Building 1”, “Building 2”, and so on, and administer and view status of devices within the individual groups.
You can create a port group consisting of the voice-over-IP (VoIP) ports on all switches in your network, and monitor status of the ports in the group.
● Establish the scope for performing operations in EPICenter
Device and port groups are used in conjunction with other EPICenter features, such as the Firmware Manager and Profile Manager, to limit the display to just those devices in a specific group. For example, if you want to use the Firmware Manager to upgrade the software images for just the devices in the “Building 1” device group, you can display the contents of the Building 1 device group in the Firmware Manager window, and select only the devices in the group for upgrade.
● View graphical representations of device groups
The EPICenter network map feature allows you to create diagrams of device groups in your network and display information about them graphically.
See “Using Map Views” on page 73 for more information.
Displaying Groups in the Network Views FolderTo display the device groups and port groups in EPICenter, expand the list of items in the Network Views folder. Figure 25 shows the display for a device group.
EPICenter Reference Guide 61

Organizing Devices and Ports Into Groups
62
Figure 25: Displaying a Device Group
The Network Views folder in the EPICenter Navigation Pane lists the device groups and port groups defined in EPICenter. By default, a single device group, All, contains all of the devices known to the EPICenter inventory database.
Within the Network Views folder, you can create groups and subgroups and populate them with devices from the All group. A top-level group can have multiple subgroups below it. The alarm status for the group is indicated on the folder icon next to the group name.
Clicking on a group in the Network Views folder shows information about the devices in the table view. In the table view are tabs for displaying information about links between the devices, VLANs, and EAPS configuration. Information in the table view can be exported to a Microsoft Excel spreadsheet.
The map view allows you to view a graphical representation of the devices in a top-level device group and its subgroups, as well as the status of links between the devices. See “Using Map Views” on page 73 for information about creating and using maps.
Network Views Folder
“All” Device Group
Top-level Group
Subgroup
PortGroup
GroupAlarmStatus
TableView of
Map
Group
View ofGroup
EPICenter Reference Guide

Managing Device Groups and Port Groups
Group Membership GuidelinesGroups can contain only one kind of object: ports cannot be members of device groups, and devices cannot be members of port groups.
A given device or port can reside in multiple groups in the Network Views folder, but not within the same top-level group hierarchy.
For example, you can create a top-level device group called “North America,” with a subgroup “Bay Area” that has a subgroup “Santa Clara Campus”. If you place a given switch in the “Santa Clara Campus” subgroup, you cannot also place the same switch in either of the “North America” or “Bay Area” groups.
However, if you create a second top-level group called “EXOS Switches”, which is not a subgroup of the “North America” group, you can place the switch in the “EXOS Switches” group, even though the switch also resides in the “Santa Clara Campus” subgroup of the “North America” group.
Managing Device Groups and Port GroupsThis section describes how to perform the following tasks:
● Create a group
● Add a device to a device group
● Add a port to a port group
● Copy or move groups
● Remove devices or ports from groups
● Modify the properties of a group
● Display detailed group information
● Export group information to a Microsoft Excel spreadsheet
Creating a GroupTo create a group, do the following:
EPICenter Reference Guide 63

Organizing Devices and Ports Into Groups
64
1 From the EPICenter File menu, select New > Group. The New Group window is displayed, as shown in Figure 26.
Figure 26: New Group Window
2 Enter the name and optional description for the new group
3 Click the appropriate radio button to specify whether this is a device or port group
4 Select the location in the Network Views hierarchy where the new group should be placed.
Highlight Network Views to make this a top-level group. If other top-level groups exist, highlight one of them to make the new group a subgroup of the highlighted group. To make the new group a subgroup of an existing subgroup, expand the list of groups and select a subgroup from the list.
5 Click OK to create the new group.
Adding a Device to a Device GroupTo add a device to a device group, do the following:
1 Display the device in a table of devices.
One way to do this is to select the All view, then click the All devices button to show all devices.
2 Click the device to select it in the table
3 From the File menu, select Group > Copy to Group.
The Copy to group window is displayed, as shown in Figure 27. This window lists the device groups that have been created in EPICenter. By default, just the top-level groups are displayed. To display the subgroups within a top-level group, click the plus sign next to the group name.
EPICenter Reference Guide

Managing Device Groups and Port Groups
Figure 27: Copy to Device Group Window
4 Select the group in which you want to place the device. Note that a device can be placed in a top-level group hierarchy only once. See “Group Membership Guidelines” on page 63 for more information.
5 Click OK to place the device in the selected group.
Adding Ports to a Port GroupThe ports that make up a port group can be either from a single device or from multiple devices.
Adding Ports from a Single Device to a Port Group
If the port group will contain ports from a single device, do the following:
1 Display the device in a table of devices.
One way to do this is to select the All view, then click the All devices button to show all devices.
2 Right-click the device and select Open from the pop-up menu to display the device details window for the selected device, as shown in Figure 28.
EPICenter Reference Guide 65

Organizing Devices and Ports Into Groups
66
Figure 28: Device Details Window
3 The Device Details window lists all of the ports on the selected device. Select the ports you want to add to the port group. Use Shift-Click to select a group of ports or Ctrl-Click to select individual ports.
4 After selecting the ports, right-click and select Copy to group from the pop-up menu.
The Copy to group window is displayed, as shown in Figure 29. This window lists the port groups that have been created in EPICenter. By default, just the top-level groups are displayed. To display the subgroups within a top-level group, click the plus sign next to the group name.
Figure 29: Copy to Port Group Window
5 Select the group in which you want to place the port(s). Note that a port can be placed in a top-level group hierarchy only once. See “Group Membership Guidelines” on page 63 for more information.
6 Click OK to place the port(s) in the selected group.
EPICenter Reference Guide

Managing Device Groups and Port Groups
Adding Ports from Multiple Devices to a Port Group
If the port group will contain ports from multiple devices, do the following:
1 From the File menu, select Group > Add Ports to Port Group
The Add to Port Group window is displayed, as shown in Figure 30.
Figure 30: Add to Port Group Window
2 The Add to Port Group window lists the devices in the EPICenter inventory. Click the All Devices button to display all of the devices in inventory, or click the Device group button and specify one or more device groups from the drop-down list.
3 Devices in the selected group (either all devices, or one or more device groups) are displayed in the left column of the window. From the left column, select the devices that contain the ports that you want to add to the port group, then double-click the device, or click the Right Arrow button, to move the device to the right column
4 When all of the devices with ports you want to add to the port group are in the right column, click the Next button to display the port selection window, as shown in Figure 31.
EPICenter Reference Guide 67

Organizing Devices and Ports Into Groups
68
Figure 31: Port Selection Window
5 The port selection window lists all of the ports on all of the devices you selected in the Add to port group window. Select the ports you want to add to the port group. You can use the Filter and Quick Filter boxes to limit the number of ports displayed in the table. Use Shift-Click to select a group of ports or Ctrl-Click to select individual ports.
6 After selecting the ports, click the Add Selected Port(s) to Group button.
The Copy to group window is displayed. This window lists the port groups that have been created in EPICenter. By default, just the top-level groups are displayed. To display the subgroups within a top-level group, click the plus sign next to the group name.
7 Select the group in which you want to place the port(s). Note that a port can be placed in a top-level group hierarchy only once. See “Group Membership Guidelines” on page 63 for more information.
8 Click OK to place the port(s) in the selected group.
Copying or Moving GroupsYou can copy or move a device group into another device group, and copy or move a port group into another port group. Note that device groups cannot be moved or copied into port groups, and port groups cannot be moved or copied into device groups. Groups cannot be copied or moved to the root (Network Views) group.
To copy or move a group to another group, do the following:
1 In the Network Views folder, select the group you want to copy or move.
2 Right-click and select either Copy to group or Move to group from the pop-up menu.
EPICenter Reference Guide

Managing Device Groups and Port Groups
A window is displayed listing the groups that have been created in EPICenter. By default, just the top-level groups are displayed. To display the subgroups within a top-level group, click the plus sign next to the group name.
3 Highlight the destination group in which you want to copy or move the selected group, then click the OK button.
The selected group is moved or copied to the destination group. If the copy or move operation would result in a device or port being placed in a top-level group hierarchy more than once, EPICenter displays an error message, and the operation is cancelled.
Removing Devices or Ports from GroupsTo remove a device or port from a group, do the following:
1 In the Network Views folder, select the group that contains the device or port you want to remove.
2 Select the device or port in the table.
3 From the Edit menu, select Delete.
EPICenter prompts you for confirmation to delete the selected devices or ports. For a device, you can elect to delete it from just the selected group or from all groups. If you delete a device from all groups, it is removed from the EPICenter inventory database.
Modifying the Properties of a GroupYou can change the properties for a device group or port group, including the group name or description.
To change the properties for a group, do the following:
1 In the Navigation Table, select the group whose properties you want to modify.
2 From the File menu, select Group > Properties to display the Properties window for the group, as shown in Figure 32.
EPICenter Reference Guide 69

Organizing Devices and Ports Into Groups
70
Figure 32: Properties Window for a Device Group
The fields in the Group Properties window are as follows:
3 Add or change information in the Name or Description fields, and click OK to save the changes.
Displaying Group DetailsTo display details about a group, click on the group’s row in the Table View. Information about the selected group appears in the details window. If you double-click on the row, the device details are displayed in a separate window, as shown in Figure 33.
Table 3: Fields in the Group Properties Window
Name The configured name of the group
Description The configured description for the group
Type Whether this is a device group or a port group
Location The location within the Network Views hierarchy where the group resides.
Groups and subgroups within the hierarchy are indicated by a vertical bar (|) character between device group names. For example, “North America | Bay Area” indicates a top-level group “North America” with a subgroup “Bay Area”.
Last Modified The date and time the group was last modified.
Contains The number of devices or ports and subgroups contained within the group.
View Port Inventory For device groups, provides a link to the Port Inventory window, listing information about the number of active ports for each device in the group.
EPICenter Reference Guide

Managing Device Groups and Port Groups
Figure 33: Group Details Window
The fields in the Group Details window are as follows:
In addition, the display lists information the contents of the group, either ports or devices. You can use the Filter and Quick Filter boxes to limit the contents of the table.
Exporting Group InformationYou can export a Microsoft Excel spreadsheet containing information about the contents of a device group or port group.
Table 4: Fields in the Group Details Window
Name The configured name of the group
Description The configured description for the group
Type Whether this is a device group or a port group
Location The location within the Network Views hierarchy where the group resides.
Groups and subgroups within the hierarchy are indicated by a vertical bar (|) character between device group names. For example, “North America | Bay Area” indicates a top-level group “North America” with a subgroup “Bay Area”.
Last Modified The date and time the group was last modified.
Contains The number of devices or ports and subgroups contained within the group.
View Port Inventory For device groups, provides a link to the Port Inventory window, listing information about the number of active ports for each device in the group.
EPICenter Reference Guide 71

Organizing Devices and Ports Into Groups
72
1 In the Network Views folder, select the group you want to export.
If necessary, use the Filter box to filter the list of devices or ports in the table.
2 Select Save as from the File menu.
Figure 34: Save As Window
3 Select whether to save the only the viewable data (that is, just the filtered data currently shown in the table), or all data for all devices/ports in the group.
4 Click Browse and specify the location and name for the exported file.
5 Click Save to export the group information to the specified location.
EPICenter Reference Guide

5 Using Map Views
This chapter describes EPICenter’s network topology map feature and how you can use it to create graphical representations of device groups in your network. It contains the following sections:
● “Overview of Network Topology Maps” on page 73
● “Displaying a Topology Map” on page 73
● “Creating Topology Maps” on page 80
Overview of Network Topology MapsEPICenter’s network topology map feature allows you to view your network (EPICenter-managed devices and the links between devices) graphically, as a set of maps. These maps can be organized into sets of submaps that allow you to represent your network as a hierarchical system of campuses, buildings, floors, closets, or whatever logical groupings you want. You can also create additional topology views (sets of maps) for different purposes.
In EPICenter, a network topology map is a graphical representation of a device group. When you create a device group, you have the option of selecting the Map view of the group, which causes EPICenter to generate a network topology map, populated with the devices in the group. EPICenter also adds any links that exist between the device nodes, and organizes them into submaps as appropriate. You can customize the resulting maps by moving elements, adding new elements, such as links, “decorative” (non-managed) nodes, and text, and customizing the device nodes themselves.
NOTE
Links can only be discovered and auto-populated between Extreme Networks devices that have the Extreme Discovery Protocol (EDP) or the Link Layer Discovery Protocol (LLDP) enabled, or on third-party devices with LLDP enabled. Links cannot be discovered on non-Extreme Networks devices that do not run LLDP, or on Extreme Networks devices with EDP and LLDP disabled.
In addition, from a managed device node on a map, you can invoke other EPICenter functions such as the alarm browser, Telnet, real-time statistics, or view the device details window.
You can customize the layouts of your maps into hierarchical views using copy and paste, or by deleting devices from one map and then adding them to a different map. You can also add and remove user-defined links between devices, as well as decorative nodes (nodes that aren’t discovered or managed by EPICenter).
Displaying a Topology MapTo display the topology map for a device group, select the device group in the Network Views folder and click the Map tab. (Topology maps are not available for port groups.) If a topology map exists for the group, then it appears in the Map view, as shown in Figure 35.
EPICenter Reference Guide 73

Using Map Views
74
Figure 35: Topology Map for a Device Group
The main components of an EPICenter Topology Map are the following:
Device Group A set of devices that have been placed in an EPICenter group hierarchy
In EPICenter, you can create groups of ports and devices, although topology maps are supported for device groups only. See “Organizing Devices and Ports Into Groups” on page 61 for information about creating device groups.
A device group hierarchy has one top-level group and can have multiple levels of subgroups below it. When a map is created, EPICenter creates separate maps for the top-level group, as well as for any subgroups.
Map View The graphical representation of the devices and links in the currently selected device group or subgroup. Selecting a device in the Map View causes the corresponding row in the Navigation Table to be selected.
Navigation Table Table of information about the objects displayed in the Map View. Selecting a device in the Navigation Table causes the corresponding icon in the Map View to be selected, and detailed information about the selected device to be displayed in the device details window.
You can click on the tabs in the Navigation Table to display information about the devices, links, VLANs, and EAPS rings in the device group.
Network Views Folder
Device GroupNavigation Table
Map View
DeviceNode
Link
NavigationBox
Zoom Bar
Group
Device Details
AlarmStatus
SubmapNode
EPICenter Reference Guide

Displaying a Topology Map
Map ElementsThe following elements can appear on a map:
Device Nodes. Device nodes represent the managed devices found in the device group.
A device node shows the following information:
● The name of the device as it is kept in the Inventory database.
● An optional, user-supplied annotation for the node.
● A small icon representing the specific device or device product line. If the device is of an “unknown” type, an unknown device icon (a circle with a question mark) is displayed.
● The device’s IP address.
● The device alarm status, indicated by the presence of an alarm icon (small bell). The alarm status shows the highest level alarm currently unacknowledged for the device. The color of the bell indicates the severity of the alarm.
If no icon appears, then either there are no unacknowledged alarms for the device, or the alarm status is below the alarm status threshold for the view. The alarm status threshold is set in the properties window for the map, and specifies the lowest severity level at which an alarm status icon should be displayed for a device node on the map.
If the alarm icon has an “X” through it, this means alarm propagation has been disabled for this device; the alarm status of this device does not influence the aggregate alarm status displayed for the map in which this node is located.
● The device status, indicated by the icon.
■ A red slash through the icon indicates that the device is down.
■ A gray icon indicates that the device is offline.
■ An icon without a red slash or gray color indicates that the device is up.
Submap Nodes. A submap node represents a child map of the current map. It resembles a folder icon.
Alarm Status The highest level alarm currently unacknowledged among the devices in the current map or any of its submaps. Devices and submaps within this map that have alarm propagation disabled do not contribute to this status.
If the alarm icon has an “X” through it, this means alarm propagation has been disabled for this map, and will not contribute to the alarm status of the next higher-level map.
Device Node Within the map view, an icon that represents a managed device in the device group.
Submap Node Within the map view, an icon that represents a subgroup of the currently displayed group.
Links Colored lines that represent connectivity between nodes in the map.
Navigation Box A box in the lower corner of the Map View that provides a thumbnail view of the topology map. Use the smaller box within the Navigation Box to move around a large map. Click the arrow icon to display or hide the Navigation Box in the Map View.
Zoom Bar Specifies the magnification level for the map. You can move the slider to zoom to one of six magnification levels.
Device Details Detailed information about the selected object.
You can click on the tabs to display information about the ports, operational status, links, VLANs, and EAPS rings for the selected device.
EPICenter Reference Guide 75

Using Map Views
76
The submap node icon shows the following information:
● The name of the node (submap), which can be edited.
● The submap alarm status, indicated by the presence of an alarm icon (small bell). The alarm status shows the highest level alarm currently unacknowledged for any device within the submap. If multiple devices within the submap have unacknowledged alarms, the icon indicates the most severe alarm among all those devices. The color of the bell indicates the severity of the alarm.
If the alarm icon has an “X” through it, this means alarm propagation has been disabled for this submap; the alarm status of this submap does not influence the aggregate alarm status displayed for higher level maps.
A submap node does not provide any additional status information.
Hyper Nodes. A hyper node represents a link termination where the terminating node is present in a higher-level map or device group. A hyper node shows the same information as the device group it represents. A hyper node can have links only between itself and other devices on the displayed map. A hyper node does not link to other hyper nodes.
You can double-click on a hyper node icon to navigate directly to the map and the device group represented by the hyper node.
A hyper node icon shows the following information:
● The name of the device group that this hyper node represents.
● An optional, user-supplied annotation for a the hyper node.
● The device alarm status, indicated by the presence of an alarm icon (small bell). The alarm status shows the highest level alarm currently unacknowledged for the devices in the group. The color of the bell indicates the severity of the alarm.
If no icon appears, then either there are no unacknowledged alarms for the device group, or the alarm status is below the alarm status threshold for the view.
NOTE
You cannot add, cut, or delete hyper nodes; they are placed and removed automatically by EPICenter as required by device connectivity.
Decorative Nodes. A decorative map node can be created by the user to represent any other type of node that is not discovered or managed by EPICenter, such as a server or workstation. A decorative node shows the name, description, and optional annotation of the node, which can be edited.
Text Nodes. A text map node is a single-line text field that can be placed anywhere in a network map. It can be used to create a title for the map, additional annotations for other map elements, comments, and so on.
Clouds. A cloud can be added to a map to represent a network. As with decorative nodes, you can add name, description, and optional annotation to a cloud.
Links. A link represents connectivity between nodes in the map. Links are automatically detected on Extreme Networks devices when EDP or LLDP is enabled on either device. Links can also be detected on third-party devices that support LLDP. Links can also be user-created.
EPICenter Reference Guide

Displaying a Topology Map
NOTE
For devices with EDP and/or LLDP disabled or not supported, you can manually add user-defined links to the map to represent connectivity between devices. They are not updated when the map topology changes. The behavior of the system-discovered links described in the following paragraphs does not apply to user-defined links.
When a discovered link connects two devices on the same map, the link will be annotated with the port number, or slot and port number for each of the endpoints.
When one of the endpoints is within a higher-level device group, a hyper node is used to represent the higher-level device group that contains the endpoint.
If there are multiple links running between two devices, each link is shown individually as long as there are 24 links or fewer. If 25 or more links connect two devices, they are represented as a composite link. For a composite link, the link annotation provides the total number of links in the composite and the number of links in each applicable status category (up, down, partially up, or unknown).
The appearance of a link shows a variety of information about the link.
The width of the link line indicates the link type:
● A thin line indicates a 10/100 link.
● A medium line indicates a gigabit link.
● A thick line indicates a 10 gigabit link.
● A very thick line indicates a composite link.
The color of the link line indicates the link status:
● A green line indicates that the link is up (both device ports are up).
● A red line indicates that the link is down (both device ports are down).
● A yellow line may be displayed for composite or load-shared links:
■ For a composite link, yellow indicates that some of the links in the composite are up, and some are down or unknown.
■ For links that are members of a load shared group, yellow indicates that one or more load-shared links are down. All links in the group will be displayed as yellow if one or more of the links in the group is down.
● A blue line indicates a user-created link.
● A broken line indicates a down link.
The format of the link annotation indicates whether the link was created (discovered) automatically by EPICenter, or is a user-created link:
● If the endpoints in the link annotation are separated by a dash (p1:2 - p24) the link was created automatically.
● If the endpoints in the annotation are separated by an “x” (p1:2 x p24) the link is a user-created link. A user-created link may also have a “?” as the port, indicating an unknown port.
● If the ports on a device running ExtremeWare are load-shared, the endpoint is followed by an “s” (p17s - p24s) in the annotation.
● The management port is indicated by an “m” (p17 - p2m).
EPICenter Reference Guide 77

Using Map Views
78
NOTE
EPICenter does not support load sharing on devices running ExtremeXOS.
Viewing Information in Topology MapsThe navigation table in the Map view lists information about all of the objects in the device group. It includes separate tabs with information about the devices, links, VLANs, and EAPS domains in the device group. Clicking on any of the tabs in the navigation table displays a table of all the objects of that type that exist in the device group.
Selecting one or more objects within the navigation table displays additional information about the selected object(s) in the device details window, and also causes the applicable devices to be selected in the map.
Figure 36: Displaying Information in a Topology Map
Click a row in the Navigation Table Information about the selected object
The devices where the object is
appears in the Details window
configured are highlighted on the map
EPICenter Reference Guide

Displaying a Topology Map
The Navigation table has the following tabs:
Navigating MapsTo move around in the map, you can do the following:
● Use the Zoom bar to zoom in or out of an area of the map
● Use the Navigation box to move to a section of a map
● Click in the Map view and drag so that the section appears in the display
Zooming In and Out on a MapTo zoom in the current map, do one of the following:
● Select Zoom in from the Map menu.
● Click the icon at the top of the zoom bar.
● Move the slider on the zoom bar upward.
To zoom out the current map, do one of the following:
● Select Zoom out from the Map menu.
● Click the icon at the bottom of the zoom bar.
● Move the slider on the zoom bar downward.
Devices Displays information about the devices in the device group, as well as any decorative nodes or clouds. Clicking on a device in the table displays additional information about the selected device in the details window, and also highlights the device’s icon in the map.
See “Displaying Device Details” on page 30 for information about the tabs that appear in the details window when a device is selected.
Links Displays information about all of the links between the devices in the device group, including automatically detected and user-defined links. Clicking on a link highlights the link in the map. You can display information about the selected link by selecting Properties from the File menu.
VLANs Displays information about the VLANs configured on the devices in the device group. Clicking on a VLAN in the table displays additional information about the selected VLAN in the details window, and also displays an overlay view highlighting all of the devices and links in the map where the selected VLAN is configured.
Depending on the type of VLAN selected, additional information may be displayed on the map and in the details window for the VLAN. See “Displaying VLAN Details” on page 246 for information about the tabs that appear in the details window when a VLAN is selected.
Enable the “Show Full Path” checkbox to display the path a packet would take across the various VLANs in the network, taking into consideration VLAN services configured on the managed devices, such as subscriber VLANs, Private VLANs, and VMANs.
EAPS Displays information about all of the EAPS domains configured on the devices in the device group. Clicking on a row in the table displays additional information about the selected EAPS domain in the details window, and also provides an overlay view of the status of the devices and links in the EAPS domain.
See “Displaying EAPS Domain Details” on page 375 for information about the tabs that appear in the details window when an EAPS domain is selected.
EPICenter Reference Guide 79

Using Map Views
80
Using the Navigation Box
The navigation box is in the lower corner of the Map View, and provides a thumbnail view of the entire map.
Figure 37: Navigation Box in a Topology Map
Use the smaller box within the Navigation Box to move around a large map. Click the arrow icon to display or hide the Navigation Box in the Map View.
Creating Topology MapsThis section describes how to perform the following tasks:
● Creating a topology map for a device group
● Specifying properties for the topology map
● Laying out the topology map
● Creating user-defined links between devices
● Removing inactive links
● Adding graphic elements, such as decorative nodes, network clouds, and text boxes
● Adding an annotation to a device icon in a map
● Saving the map
● Exporting a map to an SVG file
NavigationBox
Arrow Icon
Drag the smallerbox to move aroundthe map
EPICenter Reference Guide

Creating Topology Maps
● Deleting the maps for a device group and subgroups
Creating a Topology Map for a Device GroupSince a topology map is a graphical representation of a device group, the first step in creating a topology map is to create a device group. See “Organizing Devices and Ports Into Groups” on page 61 for information about creating device groups.
To create a topology map for a device group, do the following:
1 In the Network Views folder, select a device group. (Topology maps are not available for port groups or the All group.)
2 Click the Map tab below the Table View of the device group. EPICenter displays a blank map with a prompt asking whether to create a map for the group.
3 Click Yes to create the map. Depending on the number of devices and links in the device group, it may take a few minutes for EPICenter to generate the map.
When generating the map, EPICenter creates an icon for each device, and automatically detects links between Extreme Networks devices when EDP or LLDP is enabled on either device. Links can also be detected on third-party devices that support LLDP.
Specifying Map PropertiesMap properties include the alarm status that is displayed on the map, background image, the content of the labels describing links, and the sizing of objects on the map.
● To specify properties for the currently displayed map, select Properties from the Map menu.
● To specify global properties for all maps, select Options from the Tools menu.
The following window is displayed:
Figure 38: Map Properties Window
EPICenter Reference Guide 81

Using Map Views
82
In the Information section of the window, you can specify the lowest severity level at which an alarm status icon is displayed for a device node. In the map, the device’s alarm status is represented by an alarm icon (small bell). The alarm status shows the highest level alarm currently unacknowledged for the device. The color of the bell indicates the severity of the alarm.
You can also specify how information is displayed for the devices on the map. Each kind of device information (alarm status, device name, IP address, device annotation) can be shown with the device icon at all zoom levels, not at all, or at relevant zoom levels. Showing the information at relevant zoom levels (the default) means that each type of device information is shown at some zoom levels of the map, and not at others. For example, by default a device’s IP address or alarm status is shown at zoom level 4 and below; a device’s name and annotation is shown at zoom level 2 or below.
In the Background Image section, you can specify the filename of a graphic to be used as a background image on the map. EPICenter includes a number of sample background images, and you can add your own. To add an image to the list of available background images, place it in the <EPICenter_install_dir>/extreme.war/gifs/topologyBackgroundImages directory.
In the Link Label section, you can indicate the text caption that appears on links. This can be either the port numbers (for example, p1-p2), or the port number with the port name in parentheses.
In the Appearance section, you can specify the size of the text used in the captions for the map title, objects, and links, as well as the background color of the map.
After specifying properties for the map, click Save changes to apply the new properties and close the window. Click Restore global map settings to reset the map properties to the globally set values.
Laying Out the MapYou can drag map nodes around on the map yourself, or you can have EPICenter lay out the map nodes for you. To have EPICenter do the map layout, select Auto layout from the Map menu.
The Auto layout function calculates a default map layout, optimizing for node and link placement to minimize overlap. If necessary, EPICenter may create a layout that is larger than the visible window area. In this case, scroll bars allow you to view different parts of the map.
Creating User-Defined LinksLinks represent connectivity between nodes in the map. When a map is created, links are automatically detected on Extreme Networks devices when EDP or LLDP is enabled on either device. Links can also be detected on third-party devices that support LLDP.
In addition to the automatically detected links, you can manually define your own links. This can be useful in situations where you want to represent a link between devices when a “real” link cannot be detected by EPICenter. This may be the case if EDP and LLDP are disabled on an Extreme Networks device, if a non-Extreme Networks device does not support LLDP, or if neither EDP or LLDP are supported by the version of software running on the device.
On the map display, the endpoints of a user-defined link are separated by an “x” rather than by a dash “-”. For example, the link annotation “p1:1 - p24“indicates an automatically detected link; the annotation “p1:1 x p24” indicates a user-defined link.
To create a user-defined link, do the following:
EPICenter Reference Guide

Creating Topology Maps
1 Display the map for the device group by clicking on the Map tab at the bottom of the EPICenter window.
2 From the File or the Map menu, select New > Link, or select two devices and right-click in the map view and select New > Link from the pop-up menu. The New Link window is displayed, as shown in Figure 39.
Figure 39: New Link Window
3 The New Link window is divided into two sections, Side A and Side B, representing a device on either end of the link. For each side of the link, do the following:
a From the Name list, select the device for this side of the link. The Name list contains the name and IP address of each object in the device group.
b Optionally, from the Port number list, select a port on the device for the endpoint of the link. If you enable the Show VLANs box, the VLANs that the selected port is a member of are displayed.
c As an alternative to selecting a port, you can specify a text annotation to describe this side of the link on the map. To do this, click the Annotation button, and enter the text in the box.
4 When you have finished specifying both ends of the link, click OK to create the link on the map.
Removing Inactive Links from the MapOn a topology map, the color of the link line indicates the link status. A red line indicates that the link is inactive (at least one of the ports that make up the link is down). You can remove the inactive links from the map.
To remove the inactive links between two devices:
1 Select the two devices in the map view.
2 From the Map menu, select Clear inactive links from > Selected two devices.
Removing inactive links clears links that exist between the selected two devices in the currently displayed map, as well as in any other device maps with inactive links between the two devices.
To remove the inactive links in the top-level group and subgroups of a device group:
1 Display the map view of the device group.
2 From the Map menu, select Clear inactive links from > Selected primary group and its subgroups.
To remove the inactive links for all the devices in all device groups:
EPICenter Reference Guide 83

Using Map Views
84
● From the Map menu, select Clear inactive links from > All devices.
Adding Graphic Elements to the MapIn addition to devices, links, and background images, you can add other graphic elements to the map to represent objects not managed by EPICenter. These elements include:
● Decorative Nodes. Decorative nodes represent any type of node that is not discovered or managed by EPICenter, such as a server or workstation.
To add a decorative node to your map, select New > Node from the File or the Map menu. The following window is displayed:
Figure 40: New Node Window
In the New Node window, enter the name and optional description and annotation for the node, and click Create node.
● Text Boxes. Text boxes can be used to create a title for the map, additional annotations for other map elements, comments, and so on.
To add a text box to your map, select New > Text box from the File or the Map menu. A new text box with the words “Type here” is placed on the map. Double-click the text box and replace the “Type here” text with your own text.
● Clouds. Clouds can be added to a map to represent a network.
To add a cloud to your map, select New > Cloud from the File or the Map menu. The following window is displayed:
Figure 41: New Cloud Window
In the New Cloud window, enter the name and optional description and annotation for the cloud, and click Create cloud.
To delete any of these graphic elements, select the object you want to delete, then select Delete from the Edit menu, or right-click in the map view and select Delete from the pop-up menu.
EPICenter Reference Guide

Creating Topology Maps
Adding a Device AnnotationA device annotation is a single line of text that can be placed with a device icon enhance its description. The device annotation, if configured, appears only with the device icon on the map; it does not appear in any other view.
To add a device annotation, do the following:
1 Select the device in the map view.
2 From the Map menu, select Device annotation, or right-click the device in the map view and select Device annotation from the pop-up menu. The Device annotation window is displayed, as shown in Figure 39.
Figure 42: Device Annotation Window
3 In the text box, enter the annotation for the device.
4 Click Save changes to apply the annotation to the device and close the window.
Saving the MapTo save the map on the EPICenter server, select Save from the File menu, or click the Save icon on the EPICenter icon bar.
If you make changes to the map for a device group, then close the device group’s tab, EPICenter prompts you to save changes to the map. For example:
Figure 43: Save changes to map prompt
Click Yes to save the changes, or No to close the device group’s tab without saving the changes to the map.
Exporting MapsYou can export a Map view to a Scalable Vector Graphics (SVG) file that can be opened in a browser or other application that supports the SVG format. Note that Microsoft Internet Explorer requires installation of a plug-in to display SVG files.
To export a map to SVG format, do the following:
EPICenter Reference Guide 85

Using Map Views
86
1 Display the map view that you want to export.
2 On the EPICenter icon bar, click the Save as icon, or select Save As from the File menu.
3 In the Save map as window, specify a name and location for the SVG file, then click Save.
Deleting MapsTo delete the topology maps for a device group, do the following:
1 In the EPICenter Administration folder, click Optimization. EPICenter displays a table of the top-level device groups that have topology maps defined, as shown in Figure 44.
Figure 44: Selecting Maps to Delete from the Optimization Folder
The table displays the name of each top-level group, the description (if one is configured), and the number of maps in the group and subgroups.
2 Select a top-level group from the list and select Delete from the Edit menu.
EPICenter prompts you for confirmation to delete the map.
3 Click Yes to delete the map. When you do this, all of the maps for the selected top-level groups and subgroups are deleted.
EPICenter Reference Guide

6 The EPICenter Alarm Manager
This chapter describes how to use the EPICenter Alarm Manager for:
● Viewing the alarms that have occurred
● Defining new alarms and modifying current alarm definitions
● Configuring threshold-based alarms
Overview of the EPICenter Alarm ManagerThe EPICenter Alarm Manager provides fault detection and alarm handling for the network devices monitored by EPICenter. This includes Extreme Networks devices and some third-party devices. The Alarm Manager provides a set of predefined, enabled alarms that immediately report conditions such as authentication or login failures, device problems such as power supply or fan failures, reachability problems, or device reboots (see “Predefined Alarms” on page 88).
The Alarm Manager also lets you define your own alarms that report errors under conditions you specify, such as repeated occurrences or exceeding threshold values. You can enable and disable individual alarms, and you can specify the actions to be taken when an alarm occurs, such as sending e-mail, running a program, running an EPICenter script, or sounding an audible alert.
Fault detection is based on Simple Network Management Protocol (SNMP) traps, syslog messages, and some limited polling. The Alarm Manager supports SNMP Management Information Base-2 (MIB-2), the Extreme Networks private MIB, Remote Monitoring (RMON) traps, and selected traps from other MIBs.
For selected third-party devices that have been integrated into EPICenter through its device integration framework, EPICenter can support the full set of traps provided by the device. For other MIB-2 compatible devices, assuming they can be successfully added to EPICenter’s inventory database, EPIcenter supports just the basic MIB-2 traps.
NOTE
EPICenter automatically configures Extreme Networks devices to send traps to the EPICenter server when those devices are added to the EPICenter Inventory database; this is not true for non-Extreme Networks devices—you must manually configure those devices to send traps to the EPICenter server.
To receive syslog messages from a device, the device must be configured to use EPICenter as a syslog receiver. This is true for both Extreme devices and non-Extreme devices. See the EPICenter Concepts and Solutions Guide for instructions on configuring devices to use EPICenter as a trap receiver or syslog receiver.
Not all trap events are supported in older versions of the ExtremeWare software. Please refer to Appendix A, “Event Types for Alarms” for information on the switch software required for specific traps.
EPICenter Reference Guide 87

The EPICenter Alarm Manager
88
Predefined AlarmsFor convenience, the EPICenter Alarm Manager provides a number of predefined alarms. These alarms are enabled by default and are active as soon as the EPICenter server starts up. These include the following alarms:
● Authentication failure (SNMP MIB-2 trap): This alarm indicates that an attempt has been made to access the device using an invalid community string or SNMPv3 credentials.
● Config Download Failed (EPICenter event, indicates failure in an download initiated by EPICenter): This alarm indicates that a configuration download from EPICenter to the device has failed to complete.
● Config Upload Failed (EPICenter event, indicates failure in an upload initiated by EPICenter): This alarm indicates that a configuration upload from the device to EPICenter has failed to complete.
● Device reboot (EPICenter event): This alarm indicates the device has rebooted.
● Device Warning from EPICenter (EPICenter event): This alarm indicates that EPICenter has detected a problem.
● EAPS State Change-Error (EPICenter event): EPICenter has detected that an EAPS Master node status has changed from Complete to Failed.
● EAPS State Change-Warning (EPICenter event): EPICenter has detected that an EAPS Master node status has changed from Failed to Complete.
● ESRP State Changed (Extreme proprietary trap): This alarm indicates that an ESRP state change has occurred on the device.
● Fan failure (EPICenter event): This alarm indicates a cooling fan in the device has failed. This alarm occurs only once, when the fan status transitions from OK to failed. For continuous notification of this problem (until resolved) use the Extreme proprietary trap for fan failure, rather than the EPICenter trap.
● Health Check Failed (Extreme proprietary trap): This alarm indicates that the health check has failed for the device.
● Invalid login (Extreme proprietary trap): This alarm indicates that a login to the device has been attempted with an invalid user name or password.
● Overheat (EPICenter event): This alarm indicates that EPICenter has detected an overheat condition in the device. This alarm occurs only once, when the temperature reaches the overheat threshold. For continuous notification of this problem (until resolved) use the Extreme proprietary trap for overheat, rather than the EPICenter trap.
● Power Supply Failed (EPICenter event): This alarm indicates a power supply in the device has failed. This alarm occurs only once, when the power supply status transitions from OK to failed. For continuous notification of this problem (until resolved) use the Extreme proprietary SNMP trap for power supply failure, rather than the EPICenter trap.
● Rogue Access Point Found (EPICenter event): This alarm indicates that an access point has been detected that is not in the Safe list.
● Redundant Power Supply (RPS) alarm condition (Extreme proprietary trap): This alarm indicates that an attached redundant power supply is transmitting an alarm.
● SNMP unreachable (EPICenter event): This alarm indicates that EPICenter is unable to communicate with a device using SNMP.
● Stack Member down (EPICenter event): EPICenter has detected that a stack member is down.
● Stacking Link down (EPICenter event): EPICenter has detected that a stack link is down.
EPICenter Reference Guide

The Alarm Log Browser
The Alarm Log BrowserClick Alarm manager in the Navigation frame to run the Alarm Manager and view the Alarm Log Browser. To view alarms for a specific device, select the device in Network Views, and select Alarms from the Device menu.
The Alarm Log Browser appears, as shown in Figure 45.
Figure 45: The Alarm Log Browser page
The Alarm manager (icon) in the Navigation frame acts as an alarm indicator—if it is displayed in red instead of black, it indicates that at least one new alarm has occurred.
The Alarm Log Browser page displays a summary of the alarms that have occurred, optionally filtered based on criteria you can specify.
By default, if you have a device selected in another EPICenter application when you run the Alarm Browser, EPICenter filters the display for the selected device. The filter EPICenter created appears in the Current Filter field; you can save it if you want to be able to reuse it later. Otherwise, the default filter displays the last 300 alarms.
An alarm can be generated due to an SNMP or RMON trap, a syslog message, or based on the results of a poll. By default, all the predefined alarms are enabled; therefore, you may see alarm log entries the first time you run the Alarm Manager, even if you have not defined any alarms of your own.
The Alarm Log Browser SummaryThe Alarm Log Browser summary displays all the alarms that match the selected filter.
● The Current Filter field at the top of the display shows the current filter definition.
● The Alarms indicator to the right of the Current Filter field shows the number of Alarm instances that matched the filter.
EPICenter standard menus
Alarm summaryAlarm Manager module tabs
Current filter definitionAcknowledged alarms
Number of alarms displayed (per filter)Predefined filters
Alarm managerbutton
EPICenter Reference Guide 89
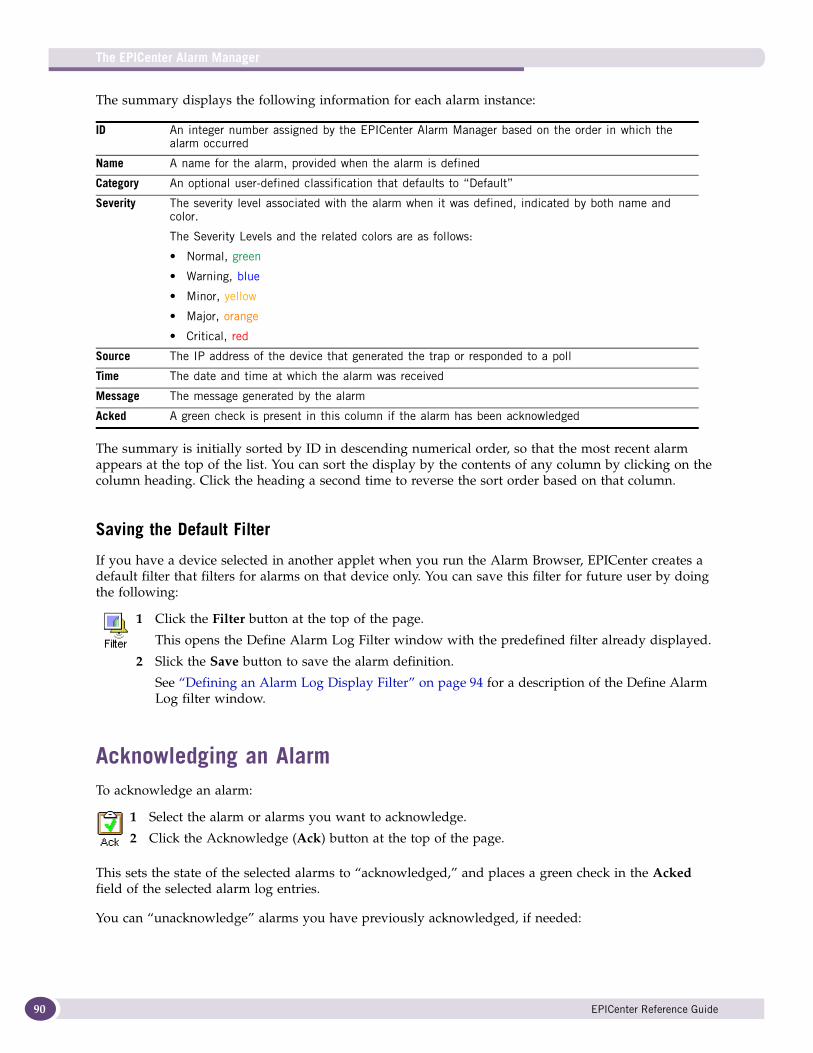
The EPICenter Alarm Manager
90
The summary displays the following information for each alarm instance:
The summary is initially sorted by ID in descending numerical order, so that the most recent alarm appears at the top of the list. You can sort the display by the contents of any column by clicking on the column heading. Click the heading a second time to reverse the sort order based on that column.
Saving the Default Filter
If you have a device selected in another applet when you run the Alarm Browser, EPICenter creates a default filter that filters for alarms on that device only. You can save this filter for future user by doing the following:
Acknowledging an AlarmTo acknowledge an alarm:
This sets the state of the selected alarms to “acknowledged,” and places a green check in the Acked field of the selected alarm log entries.
You can “unacknowledge” alarms you have previously acknowledged, if needed:
ID An integer number assigned by the EPICenter Alarm Manager based on the order in which the alarm occurred
Name A name for the alarm, provided when the alarm is defined
Category An optional user-defined classification that defaults to “Default”
Severity The severity level associated with the alarm when it was defined, indicated by both name and color.
The Severity Levels and the related colors are as follows:
• Normal, green
• Warning, blue
• Minor, yellow
• Major, orange
• Critical, red
Source The IP address of the device that generated the trap or responded to a poll
Time The date and time at which the alarm was received
Message The message generated by the alarm
Acked A green check is present in this column if the alarm has been acknowledged
1 Click the Filter button at the top of the page.
This opens the Define Alarm Log Filter window with the predefined filter already displayed.
2 Slick the Save button to save the alarm definition.
See “Defining an Alarm Log Display Filter” on page 94 for a description of the Define Alarm Log filter window.
1 Select the alarm or alarms you want to acknowledge.
2 Click the Acknowledge (Ack) button at the top of the page.
EPICenter Reference Guide

The Alarm Log Browser
The Ack or Unack operation may take a few seconds to update the database. When the update is complete, the rows are deselected.
Deleting Alarm Log EntriesTo delete an alarm log entry:
This removes the selected alarm log entries entirely from the EPICenter database.
Deleting Groups of Log EntriesRather than deleting alarm log entries one by one, you can delete groups of related log entries in a single operation, based on specific filtering criteria that you set, such as all entries in a certain time frame, all entries for selected devices, and so on.
See “Deleting Alarm Records with Specified Conditions” on page 96 for a description of this window, and for instructions about filtering for and deleting groups of log entries.
Viewing Alarm DetailsTo view the details of an individual alarm:
Creating an Alarm Display FilterAlarm entries are displayed in the Alarm Log Browser based on a set of filtering criteria. There are four predefined filters:
1 Select the alarm or alarms.
2 Click the Unacknowledge (Unack) button at the top of the page.
1 Select the alarm entry or entries you want to delete.
2 Click the Delete button at the top of the page.
To delete a group of alarm entries, click the Del ... button at the top of the page. This opens a window where you can define the set of conditions that EPICenter should use to filter and identify alarm entries that should be deleted.
1 Select the alarm you want to view.
2 Click the Detail button at the top of the page, or double-click on the alarm entry in the log.
This opens the Alarm Log Detail View window, showing detailed information about the selected alarm. See “The Alarm Log Detailed View” on page 92 for a description of this window and the information it displays.
7 days ago View alarms that occurred one week ago
Default View the most recent 300 entries
EPICenter Reference Guide 91

The EPICenter Alarm Manager
92
In addition to these, you can create your own filters based on criteria such as Source IP, Severity, Alarm Name, LogID, and a number of others. Your filter can combine multiple criteria.
This opens the Define Alarm Log Filter window. See “Defining an Alarm Log Display Filter” on page 94 for a description of this window, and information about creating your own filters.
Deleting Saved Alarm Log FiltersYou can delete any saved alarm log display filters except for the default filter. To delete a filter, do the following:
Pausing All AlarmsYou can temporarily stop the processing of all enabled alarms using the Pause/Resume feature.
The Alarm Log Detailed ViewTo view the details of an individual alarm:
The Alarm Log Detailed View displays detailed information about the selected alarm.
Last 24 hours View alarms that occurred within the last 24 hours
Yesterday View alarms that occurred yesterday (the 24 hours from starting at 12:01 am yesterday)
To specify your own filter, click the Filter button at the top of the page.
1 Click the Del Filter button.
This opens the Delete Filters window.
2 Select the filter you want to delete, and click OK.
To stop processing enabled alarms, click the Pause button at the top of the page. EPICenter ignores all traps when the alarms are paused.
To resume processing traps, click Resume.
1 Select the alarm you want to view.
2 Click the Detail button at the top of the page, or double-click on the alarm entry in the log.
This opens the Alarm Log Detailed View window, as shown in Figure 46.
EPICenter Reference Guide

The Alarm Log Detailed View
Figure 46: Detailed view of an Alarm Log entry
The fields in this view show the following information about the alarm:
Log ID The ID number assigned to this event by EPICenter
Alarm Name The name of the alarm
Category The category to which this alarm belongs
Severity The severity level of the alarm
Repeat times The number of times the event occurred to trigger the alarm. If the alarm does require repeated events, this value is 1.
Repeat Period The time period within which the repeated events occurred, for alarms with a repetitive occurrence specification. Displays N/A if the alarm does not require repeated events.
Device Name The name of the device on which the alarm generating event(s) occurred
Alarm Source The IP address where the alarm event(s) originated
Acked Whether this alarm has been acknowledged
Alarm Time The time of day at which the alarm occurred
Alarm Message The message associated with the alarm
Actions taken The list of actions defined for this alarm, if any
Name of events The name of the event that triggered the alarm
Pattern matching The pattern matched by the event data, if a pattern is defined for this alarm
Alarm Events Details of the events that triggered the alarm. If the alarm required repeated events in order to trigger the alarm, all those events are shown. For each event the following is displayed:
• Event Time: The time of day that the event occurred
• Event Source: The IP address of the event source
• Data: The data included with the event
• Count: The event count, with 1 being the first (oldest) event occurrence
EPICenter Reference Guide 93

The EPICenter Alarm Manager
94
From the Alarm Log Detailed View window you can display details for other alarms without having to return to the Alarm Browser summary page.
● Enter or select an alarm Log ID in the Go to alarm field. Selecting the ID immediately displays that alarm entry.
● Click the Next button to view the alarm entry in the row below the currently displayed entry in the Alarm Browser summary list.
● Click the Previous button to view the alarm entry in the row above the currently displayed entry in the list.
● Click Close to close the display window.
Defining an Alarm Log Display FilterYou can filter the alarms to be displayed in the Alarm Log Browser summary list based on criteria such as Source IP, Severity, Alarm Name, LogID, and a number of others.
The Define Alarm Log Filter window opens displaying either the last filter definition you created, or the Default filter (View last 300 alarms).
Figure 47: Alarm Log filter definition window
To specify your own filter, click the Filter button at the top of the Alarm Log Browser summary page.
EPICenter Reference Guide

Defining an Alarm Log Display Filter
To create your own filter, do the following:
1 Click the New button to clear the previous filter definition. This unchecks the View last 300 alarms checkbox, if it was checked, and enables the other fields in the window (except for the name field—you can provide a name for your filter when you name it).
2 Define a filter criteria by selecting or filling in the Field, Operator, and Value fields as follows:
3 Click the Add/Modify Condition button to add this specification to the filter definition.
You can create a filter that uses more than one condition, as long as each condition uses a different parameter. Multiple conditions are combined using a logical AND function—all conditions must be matched for an alarm entry to be included in the filter results.
You cannot filter using multiple specifications of the same parameter. For example, in order to find and view alarms for IP addresses 10.205.0.55 and 10.205.0.61, you must use the Between operator to
Field The parameter you want to use as a filter criterion. Select one from the pull-down menu. The choices are:
• Log ID: Filter on Log ID
• Alarm Name: Filter on Alarm name
• Category: Filter on category name
• Severity: Filter on severity level
• Source IP: Filter on alarm source IP address
• Port IfIndex: Filter on a port (for alarms that use Port as the source type)
• Time: Filter on the entry date and time stamp
• Acked: Filter on whether alarms have been acknowledged or not
Operator A comparison operator used to test the parameter against the specified value. Select one from the pull-down menu. Only choices relevant to the selected parameter type are available—in some cases only one choice is allowed.
Value The value against which the parameter (specified in the Field field) should be tested. The type, format and range of the values you can specify depend on the parameter you selected in the Field field. Values may be entered as follows:
• Log ID: An integer. You can test equality relationships (equal, not equal, greater than, less than, greater than or equal, less than or equal) or for a range (Between). If you choose Between as the operator, you are asked to enter two values.
• Alarm Name: Text string. You can select an alarm name from the drop-down list in the Value field, or enter a text string. You can test for an exact match or non-match, or a substring (Contains). The Contains operator lets you match against a substring (portion of text) that should be contained in the parameter value.
• Category: Text string. You can select a category from the drop-down list in the Value field, or enter a text string. You can test for an exact match or non-match, or a substring (Contains).
• Severity: An alarm severity level. You must select a severity level from the drop-down list in the Value field. You can test for a match or non-match.
• Source IP: IP address. Can test for exact match or non-match, or for a range (Between). If you choose Between you are asked to enter two values. You cannot match on a subnet.
• Port IfIndex: An integer. Can test equality relationships (equal, not equal, greater than. less than, greater than or equal, less than or equal) or for a range (Between). If you choose Between you are asked to enter two values.
• Time: Select a time period from the drop down list. Choices include periods such as Last 1 Hour, Yesterday, 2 Days Ago, etc. The filter matches all alarms within the time period.
• Acked: Can select Yes (matches all Acknowledged alarms) or No (matches all unacknowledged alarms).
EPICenter Reference Guide 95

The EPICenter Alarm Manager
96
test for all Source IP addresses between these two IP addresses. You cannot create a filter that includes separate condition specifications for Source IP = 10.205.0.55 and Source IP = 10.205.0.61.
4 To remove an individual condition specification, select it in the current filter list and click the Remove Condition(s) button. You can select and remove multiple filter criteria.
5 When your filter definition is complete, you can save it as a named filter, or you can just apply it to the Alarm Log without saving it.
● To save it, click Save, and enter a name into the dialog box that appears.
● To apply the filter to the Alarm Log summary without saving it, click OK. This filters the display based on the criteria you defined. You do not need to save the filter before you do this.
If you do not save the filter definition before you apply it to the Alarm Log, you can re-open the Define Alarm Log Filter window and save it later. The filter definition is retained in the Define Alarm Log Filter window until you either create another filter definition, or exit the Alarm Manager.
To restore the default filter definition, click the View last 300 alarms check box and click OK.
Deleting Alarm Records with Specified Conditions
The Delete alarm records with specified conditions window opens, as shown in Figure 48.
Figure 48: Delete alarm records with specified conditions window
In this window you can define a filter—a set of conditions—that EPICenter can use to determine whether an alarm record should be deleted.
To delete a group of alarm entries, click the Del ... button at the top of the page.
EPICenter Reference Guide

Deleting Alarm Records with Specified Conditions
To create a delete condition filter, do the following:
1 If the “View last 300 alarms” check box is checked, the remaining fields are grayed-out. Uncheck the check box to enable the other fields.
2 Define a filter criteria by selecting or filling in the Field, Operator, and Value fields as follows:
3 Click the Add/Modify Condition button to add this specification to the filter definition.
You can create a multi-criteria specification using more than one parameter as long as each parameter is different. You cannot filter using multiple specifications of the same parameter.
For example, in order to delete alarms for IP addresses 10.205.0.55 and 10.205.0.61, you must do this in two operations.
4 To remove an individual criteria, select it in the current filter list and click the Remove Condition(s) button. You can select and remove multiple filter criteria.
5 When your filter definition is complete, click Delete.
Field The parameter you want to use as a filter criterion. Select one from the pull-down menu. The choices are:
• Log ID: Filter on Log ID
• Alarm Name: Filter on Alarm name
• Category: Filter on category name
• Severity: Filter on severity level
• Source IP: Filter on alarm source IP address
• Port IfIndex: Filter on a port (for alarms that use Port as the source type)
• Time: Filter on the entry date and time stamp
• Acked: Filter on whether alarms have been acknowledged or not
Operator A comparison operator used to test the parameter against the specified value. Select one from the pull-down menu. Only choices relevant to the selected parameter type are available—in some cases only one choice is allowed.
Value The value against which the parameter (specified in the Field field) should be tested. The type, format and range of the values you can specify depend on the parameter you selected in the Field field. Values may be entered as follows:
• Log ID: An integer. You can test equality relationships (equal, not equal, greater than, less than, greater than or equal, less than or equal) or for a range (Between). If you choose Between as the operator, you are asked to enter two values.
• Alarm Name: Text string. You can select an alarm name from the drop-down list in the Value field, or enter a text string. You can test for an exact match or non-match, or a substring (Contains). The Contains operator lets you match against a substring (portion of text) that should be contained in the parameter value.
• Category: Text string. You can select a category from the drop-down list in the Value field, or enter a text string. You can test for an exact match or non-match, or a substring (Contains).
• Severity: An alarm severity level. You must select a severity level from the drop-down list in the Value field. You can test for a match or non-match.
• Source IP: IP address. Can test for exact match or non-match, or for a range (Between). If you choose Between you are asked to enter two values. You cannot match on a subnet.
• Port IfIndex: An integer. Can test equality relationships (equal, not equal, greater than. less than, greater than or equal, less than or equal) or for a range (Between). If you choose Between you are asked to enter two values.
• Time: Select a time period from the drop down list. Choices include periods such as Last 1 Hour, Yesterday, 2 Days Ago, etc. The filter matches all alarms within the time period.
• Acked: Can select Yes (matches all Acknowledged alarms) or No (matches all unacknowledged alarms).
EPICenter Reference Guide 97

The EPICenter Alarm Manager
98
All alarm records that meet the conditions defined by the filter are deleted.
If you simply want to delete the last 300 alarms, leave the “View last 300 alarms” box checked, and click Delete.
Defining AlarmsFor convenience, the EPICenter Alarm Manager provides a number of predefined alarms (see “Predefined Alarms” on page 88). These alarms are all enabled by default, and become active immediately when the EPICenter server starts up. The predefined alarms generate alarm log entries, but no other actions are specified.
You can modify the predefined alarms or define your own custom alarms to report errors based on a number of event types under conditions you specify, such as repeated occurrences or exceeding threshold values. You can also specify the actions to be taken when an alarm occurs, such as sending e-mail, running a program, running an EPICenter script, or sounding an audible alert.
To view a current alarm definition, to create a new definition, or to modify an existing definition, click the Alarm Definition tab at the top of the page. The Alarm Manager: Alarm Definition page is displayed, as shown in Figure 49.
Figure 49: Alarm Manager: Alarm Definition page
The Alarm Definition List shows all the current alarm definitions. This list shows the following information about each alarm:
Name The name of the alarm
Category The category to which the alarm belongs.
EPICenter Reference Guide

Defining Alarms
To view the settings for an individual alarm, select the alarm.
The detailed definition of the selected alarm appears in the fields below the alarm list. In addition to the basic properties shown in the Alarm Definition list, these fields show additional properties such as whether pattern matching should be used on event data, or whether the event must occur more than once before the alarm is triggered. These basic properties are defined in detail in “Defining the Basic Alarm Properties” on page 101.
Below the basic properties, two text fields show the alarm actions (if any) defined for the alarm, and scope of alarm.
Alarm Actions are functions that the alarm manager executes when an alarm occurs, in addition to logging the occurrence of the alarm. By default the predefined alarms have no actions defined for them (other than logging). Alarm actions can include sending e-mail, sounding an audible alert, running a program or running an EPICenter script. For the predefined alarms, an alarm event creates an entry in the Alarm Log, but no other actions occur. You can define additional actions for any of these alarms. Alarm Actions are discussed in more detail in “Defining Alarm Actions” on page 105.
The Alarm Scope defines which devices can trigger an alarm. The predefined alarms are scoped by default for all devices and ports. Thus, a trap received from any port or any device triggers the corresponding alarm. You can modify the scope of any of these alarms. Alarm Scope is discussed in more detail in “Defining the Alarm Scope” on page 103.
Creating a New Alarm Definition
Modifying an Alarm Definition
Event The event that triggers this alarm (see “Defining the Basic Alarm Properties” on page 101 for more details)
Severity The severity level of the alarm (normal, warning, minor, major, critical)
Enabled Whether the alarm is enabled or disabled
To create a new alarm, click the Add button at the top of the page.
This opens the New Alarm Definition window, where you can define a custom alarm. See “The Alarm Definition Window” on page 100 for a description of the window, with instructions for creating an alarm definition.
To modify an alarm, select the alarm in the Alarm Definition List, and click the Modify button at the top of the page.
This opens the Modify Alarm Definition window. This window is identical to the New Alarm Definition window, except that the settings for the selected alarm are filled in. See “The Alarm Definition Window” on page 100 for a description of the window, with instructions for modifying an alarm definition.
EPICenter Reference Guide 99

The EPICenter Alarm Manager
100
Deleting an Alarm Definition
You must remove alarm definitions one at a time.
The Alarm Definition WindowThere are three parts to an alarm definition: the Basic properties definition, the Scope definition, and the Action definition. Each is represented on its own tab in the New Alarm Definition window or the Modify Alarm Definition Window.
The New Alarm Definition window, as shown in Figure 50, initially displays the Basic tab of the three-page alarm definition, with most of the fields blank. If you are modifying an existing Alarm definition, the Modify Alarm Definition window is identical except that the settings for the selected alarm are shown in the appropriate fields.
Figure 50: The New Alarm Definition window, Basic definition tab
Use the tabs at the top of the window to move between the three pages. When you are finished with your alarm definition, click OK. A new alarm definition is added to the Alarm Definition List; the existing alarm definition is updated for an alarm that has been modified.
To delete an alarm definition, select the alarm in the Alarm Definition List, and click the Delete button at the top of the page.
After you verify that you want to delete the alarm, the definition is removed from the Alarm Definition List and from EPICenter’s database.
EPICenter Reference Guide

The Alarm Definition Window
See the EPICenter Concepts and Solutions Guide for a more extensive discussion about EPICenter alarms, including examples of alarm definitions for common network events.
Defining the Basic Alarm PropertiesOn the Basic page, you define the event-related parameters of the alarm: its name, severity, the event that triggers it, and so on. The fields in this window are defined as follows:
Name The name of the alarm as it will appear in the alarm log and (optionally) elsewhere. This defines the variable alarmName.
Enabled Indicates whether the alarm is “turned on” or not. If you uncheck this box, the alarm remains defined but is not operational.
Category The category assigned to this alarm. Select the category using the pull-down menu at the end of the field (see “Creating a New Alarm Category” on page 113 for more information). This defines the variable alarmCategory.
Severity The severity of the alarm. Select one of the five severity levels from the pull-down menu (normal, warning, minor, major, critical). This defines the variable alarmSeverity. The severity level also determines the sound that is played as an audible alert.
Event Type The type of event (SNMP trap, RMON Trap Rising Alarm, RMON Trap Falling Alarm, EPICenter, or Syslog message). This determines the list of events you can select in the Event Name field. The event type is concatenated with the event name to define the variable eventTypeName.
Event Name The specific event (trap) that should trigger this alarm. Select the event from the pull-down list provided. The event name is concatenated with the event type to define the variable eventTypeName.
For RMON Rising or RMON Falling trap types, pull-down list includes the configured RMON rule names. RMON events (rules) must be configured under the Threshold Configuration tab before they appear in the Event Name list. See “Threshold Configuration” on page 114 for information on defining RMON events.
See Appendix A, “Event Types for Alarms” for a description of the EPICenter and SNMP events from which you can choose.
Pattern Matching on Event Data
You can specify that the alarm should be triggered only if the data provided with the event matches a specific pattern. If you leave this unchecked, the default is “Don’t Care.” Pattern matching is done on the contents of the eventData variable.
The pattern matching syntax uses regular expressions.
• You can use “*” or “%” (asterisk or percent) to match any sequence of zero or more characters.
• “?” or “_” (question mark or underscore) can be used to match any one character.
• To match one of a set of characters, enclose the characters in brackets. For example, [abcd] matches one of a, b, c, or d.
For example, the following regular expressions can be used for monitoring MPLS removals and insertions using alarm pattern matching:
• For removals: *ConfiguredType: 104?*InsertedType: 1?*State: 1*
• For insertions: *ConfiguredType: 104?*InsertedType: 104?*State: 5*
Repetitive occurrence specification(Issue an alarm...)
The required number of times an event must occur before an alarm is generated. You can specify both the number of times the event must occur, and the time frame within which these events must occur. This lets you filter out short-lived or non-repeatable events, and define an alarm that will take action only if the triggering event occurs repeatedly within a defined time frame.
EPICenter Reference Guide 101
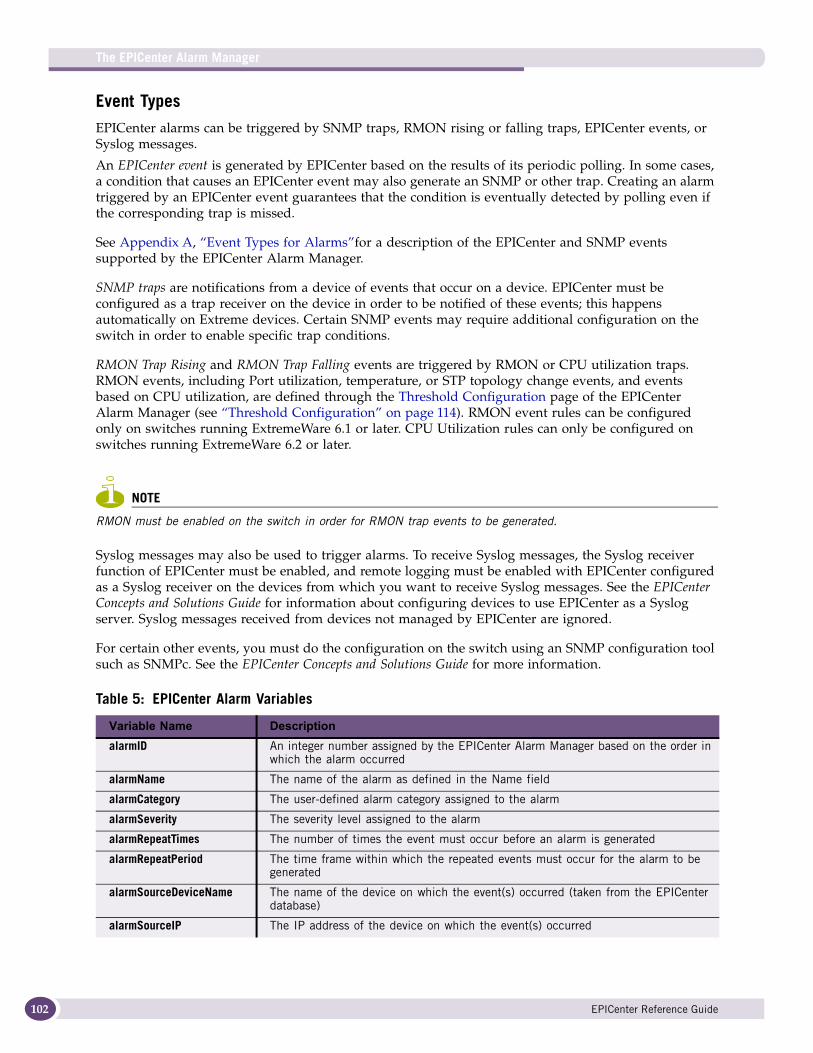
The EPICenter Alarm Manager
102
Event TypesEPICenter alarms can be triggered by SNMP traps, RMON rising or falling traps, EPICenter events, or Syslog messages.
An EPICenter event is generated by EPICenter based on the results of its periodic polling. In some cases, a condition that causes an EPICenter event may also generate an SNMP or other trap. Creating an alarm triggered by an EPICenter event guarantees that the condition is eventually detected by polling even if the corresponding trap is missed.
See Appendix A, “Event Types for Alarms”for a description of the EPICenter and SNMP events supported by the EPICenter Alarm Manager.
SNMP traps are notifications from a device of events that occur on a device. EPICenter must be configured as a trap receiver on the device in order to be notified of these events; this happens automatically on Extreme devices. Certain SNMP events may require additional configuration on the switch in order to enable specific trap conditions.
RMON Trap Rising and RMON Trap Falling events are triggered by RMON or CPU utilization traps. RMON events, including Port utilization, temperature, or STP topology change events, and events based on CPU utilization, are defined through the Threshold Configuration page of the EPICenter Alarm Manager (see “Threshold Configuration” on page 114). RMON event rules can be configured only on switches running ExtremeWare 6.1 or later. CPU Utilization rules can only be configured on switches running ExtremeWare 6.2 or later.
NOTE
RMON must be enabled on the switch in order for RMON trap events to be generated.
Syslog messages may also be used to trigger alarms. To receive Syslog messages, the Syslog receiver function of EPICenter must be enabled, and remote logging must be enabled with EPICenter configured as a Syslog receiver on the devices from which you want to receive Syslog messages. See the EPICenter Concepts and Solutions Guide for information about configuring devices to use EPICenter as a Syslog server. Syslog messages received from devices not managed by EPICenter are ignored.
For certain other events, you must do the configuration on the switch using an SNMP configuration tool such as SNMPc. See the EPICenter Concepts and Solutions Guide for more information.
Table 5: EPICenter Alarm Variables
Variable Name DescriptionalarmID An integer number assigned by the EPICenter Alarm Manager based on the order in
which the alarm occurred
alarmName The name of the alarm as defined in the Name field
alarmCategory The user-defined alarm category assigned to the alarm
alarmSeverity The severity level assigned to the alarm
alarmRepeatTimes The number of times the event must occur before an alarm is generated
alarmRepeatPeriod The time frame within which the repeated events must occur for the alarm to be generated
alarmSourceDeviceName The name of the device on which the event(s) occurred (taken from the EPICenter database)
alarmSourceIP The IP address of the device on which the event(s) occurred
EPICenter Reference Guide

The Alarm Definition Window
Defining the Alarm ScopeTo define a scope for the alarm, click the Scope tab. The Scope definition page is displayed, as shown in Figure 51.
Figure 51: The New Alarm Definition window, Scope definition
alarmSourceIfIndex The interface on the device on which the event(s) occurred
alarmGMTTime The time at which the alarm occurred, in Greenwich Mean Time
alarmLocalTime The time at which the alarm occurred, in local time
alarmMessage The message defined for the alarm (for use by an external program executed as an alarm action)
alarmActions The list of actions defined for the alarm
eventLogID The ID of the event in EPICenter’s event log
eventTypeName The type of event (SNMP Trap, RMON Rising Trap, RMON Falling Trap, or EPICenter event) concatenated with the Event Name (the SNMP trap name, RMON rule name, or EPICenter event name)
eventGenericType The SNMP Generic Type number of the trap
eventSpecificType The SNMP Specific Type number for an enterprise-specific trap
eventSpecificTypeStr The event description
eventEnterprise The Enterprise portion of the Object ID (OID) of the event
eventData The data associated with the trap, or the Syslog message content
trap The trap varbinds from SNMP trap.
Table 5: EPICenter Alarm Variables (continued)
Variable Name Description
EPICenter Reference Guide 103

The EPICenter Alarm Manager
104
In this window you define the scope of the alarm—the set of devices that can trigger the alarm. You can define the scope as a set of individual devices, one or more device groups, as a set of individual ports, or as one or more port groups.
For events that originate from a device port (such as link down) the scope determines whether the alarm is generated based on an event from a single port, on events from any port on a device, or from any port on any device in a device group.
For example, to define an alarm that is fired for any port on device A, you can scope the alarm as “Device,” select the appropriate device group, and select Device A. To define the alarm only to be fired on selected ports on Device A, you would scope the alarm as “Port,” select Device A, and select the individual ports. You could also define a port group for the specific ports of interest, the scope the alarm as Port Group and select the appropriate group.
To define the alarm scope, select a Source Type (and Device Group, if appropriate), select individual devices, ports, device groups, or port groups, and add them to the Selections list. The scope can contain a combination of source types.
The fields and buttons in this window are defined as follows:
The buttons in the middle of the page let you move selected devices, ports, or groups between the source list and the Selection list:
● Add->—Adds the selected Device(s), Port(s), Device Groups or Port Groups to the Selection list, for inclusion in the scope of this alarm.
● Add All->—Adds all the components in the source list to the Selection list.
● <-Remove—Removes the selected components from the Selection list.
● <-Remove All—Removes all the components from the Selection list.
Scope on all devices and ports
When this is checked, an event received from any device or device port will trigger the alarm. In addition, as new devices are added to the EPICenter inventory database, those devices and ports will also be included in the device scope.
Uncheck the checkbox to enable scoping by specific devices, device groups, ports or port groups.
Source Type The source of the scoping definition (Device, Device Group, Port, or Port Group). Select the type you want from the pull-down list.
Select Device Group or Port Group to scope the alarm on all members of the selected group. Group membership is evaluated every time a trap is received. Therefore, changes to the group membership (adding or removing devices or ports) have an immediate effect on alarm processing.
To scope the alarm on individual devices or ports, select Device or Port.
Select Group If you select Device or Port as the Source Type, you must select a Device Group to indicate the set of devices (and ports) you want to see in the Source List.
Source list (Device/Device Group/Port Group)
The list of components of the specified type. The field label changes based on the Source Type. It is labeled Device when you select either Device or Port as the Source Type.
ifIndex The list of ports available on the device selected in the Device source list. This list appears only if you have selected Port as the Source Type. Select a device from the Device source list, and the appropriate set of ports for the device appears.
Selection The devices, ports, device groups, or port groups that are currently included in the scope.
EPICenter Reference Guide

The Alarm Definition Window
Defining Alarm ActionsTo define actions for the alarm, click the Actions tab. The Action definition page is displayed, as shown in Figure 52.
Figure 52: The New Alarm Definition window, Action definition
In this window you define the actions for the alarm—the functions that should be performed when the alarm occurs. You can have the alarm perform any or all of the actions defined here.
NOTE
In order to use an e-mail action, you must first configure your e-mail settings. You will not be able to select an e-mail action until this has been done. See “Setting Up E-mail for the Alarm Manager” on page 108.
EPICenter Reference Guide 105

The EPICenter Alarm Manager
106
The fields and buttons in this window are defined as follows:
Sound Alert Click the check box to have the alarm manager play an audible alert on the client computer when the alarm occurs. The alarm will sound on all EPICenter clients currently connected to the EPICenter server. The sound that is played depends on the severity level of the alarm.
The alert sound files are kept on the EPICenter server in the \extreme subdirectory of the EPICenter installation directory, and are named according to the severity level they represent (normal.wav, warning.wav and so on).
Send an e-mail Click this check box to indicate that e-mail should be sent, then enter the e-mail address(es) of the recipients for the e-mail. E-mail addresses in a list can be separated by commas, semicolons, or spaces.
For details on how to preview the messages, see “Defining Messages” on page 110.
Note: If the e-mail check boxes are grayed out, you must first configure your e-mail settings.
Send a long mail to—Select this check box to indicate that a long e-mail should be sent. Then enter the e-mail address(es) of the recipients for the e-mail. E-mail addresses in a list can be separated by commas, semicolons, or spaces.
Send a text message (short version) to—Select this check box to indicate that a short e-mail (appropriate for text paging) should be sent. Then enter the e-mail address(es) of the recipients for the e-mail. E-mail addresses in a list can be separated by commas, semicolons, or spaces.
Short email provides the alarm number, name and the IP address of the source of the alarm in the subject header. The message body provides alarm name, source of alarm, severity and the alarm message.
E-mail Settings... Click the Edit E-mail Settings to display the Email Settings window, where you can configure your e-mail settings. You will need to do this if the Email to and Short email to checkboxes are not accessible. See “Setting Up E-mail for the Alarm Manager” on page 108 for details on setting up e-mail for use with alarm actions.
By default this button is disabled. This button is enabled, after you select Send an e-mail option.
Run program Click the check box to specify a program that should be run when this alarm occurs. Enter the command string for the program in the field provided. To include Alarm Manager variables as arguments in the command string, click the Variables... button and select the variables you want to include.
You can also include trap varbinds as arguments in the command string, if the SNMP event that triggers this alarm provides varbinds.
Note: If you are running EPICenter on a Windows system, see “Running a Program as an Alarm Action Under Windows” on page 107
Variables... Click this to display a list of the variables you can select for inclusion as arguments in the command string of the program you have specified in the Run program field.
See Table 5 “EPICenter Alarm Variables” on page 102 for a definition of the Alarm Manager variables you can use in the message field.
Forward Trap to Click this check box to forward the trap event that caused this alarm. The forwarding instructions currently in force are shown to the right of the check box:
• Host: The host name or host IP address of the system to which the trap is forwarded.
• Port: The port on which the specified host receives traps.
• Community String: The community string for the specified host.
• Version: The version of SNMP to which traps will be converted. This can specify No conversion, Convert trap to SNMPv1 or Convert trap to SNMPv2c.
Note: To change any of these settings, click the Settings... button to the right of this field.
Edit Trap Forwarding Settings...
Click this to display the Trap Forwarding Settings window, where you can configure the trap forwarding instructions. See “Configuring the Trap Forwarding Settings” on page 109 for details on configuring trap forwarding settings.
EPICenter Reference Guide

The Alarm Definition Window
Running a Program as an Alarm Action Under Windows
On a Windows system, if you want to run a program that does output to the desktop, you must specify that output to the desktop is allowed when you start the EPICenter server service. Otherwise, the program will not run. See the Alarm Manager section in Appendix A of the EPICenter Concepts and Solutions Guide for instructions on restarting the EPICenter server service with this option enabled.
If you want to specify a batch file that does output to the desktop, you must specify the “.bat” file within a DOS “cmd” command, as follows:cmd /c start <file.bat>
where <file.bat> is the batch file you want to run.
Using Trap Varbinds in a Command StringIf the event that defines this alarm is an SNMP trap that includes varbinds, you can use the varbinds as arguments in a command string you run as an alarm action. EPICenter will substitute the value of the variables from the trap into the command string.
In the Basic tab of the Alarm Definition window, the Event Type must be set to SNMP Trap, and the selected trap event (Event Name) must be one that includes variables.
In the Actions tab, clicking Details>> shows the list of variables associated with the trap event, and their indexes.
You specify the variable by including the trap variable $trap followed by the varbind index: e.g. $trap(0) etc. You do not need to include all the variables, and they can be in any order. You can insert the $trap variable by selecting from the list of system variables displayed when you click the Variables... button; however, you must still add the index, enclosed in parentheses.
The example in Figure 53 shows a command taking the extremeEapsPrimaryStatus and extremeEapsSecondaryStatus as arguments.
Run Macro Click this checkbox to specify an EPICenter script that should run when this alarm occurs. Enter the macro name or click the Macros... button to select a macro from a list of saved macros.
Note: When a script is executed as an alarm action, the script results are not saved. In order to have the results saved, EPICenter debug must be enabled. Results are then saved in a file named alarmMacro.txt, saved in the <EPICenter_install_dir>/user.war/telnet directory. EPICenter debug can be enabled through the Reports feature, but will increase the time required for processing alarms and alarm actions. See “EPICenter Server Reports” on page 366 for more information on enabling EPICenter debug mode.
Select A Macro... Click this to display the Select Macro window, where you can select a EPICenter script from a list of saved scripts.
EPICenter Reference Guide 107

The EPICenter Alarm Manager
108
Figure 53: Using trap varbinds as arguments to a command as an alarm action
Because the variables may return values in a form that is not usable in a CLI command, two functions are provided to convert values to CLI-readable formats. These are:
● $ToCliPort() — converts a port IfIndex to the slot:port format
● $ToCliVlanName() — converts a VLANID to a VLAN name.
For example, for the trap extremeEdpNeighborAdded, the variable extremeEdpPortIfIndex is returned as the second varbind (index=1).
So upon an EDP Neighbor Added trap, to run a program “testprog” and pass it the port number, you could use the command
cmd c:/testprog $ToCliPort($trap(1))
For example, if the trap returns an IfIndex of 1009, the $ToCliPort function will convert it to 1:9, so that the resulting run command is:
cmd c:/testprog 1:9
Setting Up E-mail for the Alarm ManagerOnce you select the Send an email option, the e-mail capability is enabled. You can configure the e-mail settings now.
To configure the e-mail capability, do the following:
1 Select Send an e-mail check box on the Action page.
2 If you are configuring the e-mail settings for the first time, select Send a long version to or Send a text message to option.
3 Click the Edit E-mail Settings button.
EPICenter Reference Guide

The Alarm Definition Window
This displays the Alarm Definition Email Settings window, as shown in Figure 54.
Figure 54: Setting up Email for alarm actions
4 Type the information required to configure the mail server in the fields provided, then click OK.
NOTE
If you have e-mail configured as an alarm action and the mail server is not reachable and times out when an alarm occurs, the Alarm Manager will stall waiting for the action to complete. The Alarm Manager may also stall if a program configured as alarm action never completes.
Configuring the Trap Forwarding SettingsYou can change the settings for trap forwarding as follows:
1 Click the Edit Trap Forwarding Settings button on the Action page.
This displays the Trap Forwarding Settings window, as shown in Figure 55. The window initially shows the global trap receiver settings configured in EPICenter Administration, as part of the Server Properties configuration for SNMP (see “SNMP Properties” on page 311 for how to set these global settings).
SMTP Host The outgoing mail server name (or IP address).
Sent By The e-mail address that should be used as the sender of the e-mail.
My server requires authentication
Check this if your mail server authenticates the user before sending out e-mail and enter the user name and password of an account that the SMTP server will accept. Usually this is the account you use to log into your network.
If you don’t know whether your server requires authentication, you can go ahead and enter the authentication information—it is ignored if it is not actually needed.
User Name The user name for mail server authentication
Password The password for mail server authentication
EPICenter Reference Guide 109

The EPICenter Alarm Manager
110
Figure 55: Trap Forwarding Settings window
2 Uncheck the Use Global Settings checkbox to enable the following fields. Type the information needed to configure the receiver for the forwarded traps, then click OK.
The new settings are shown on the Action page of the New or Modified Alarm Definition window.
To return to the default (global) settings, just check the Use Global Settings checkbox.
Defining MessagesTo define messages for the alarm, click the Message tab. The Action definition page is displayed, as shown in Figure 56.
Host Type the host name or host IP address of the system to which the trap will be forwarded.
Port Type the port on which the specified host receives traps.
Community String Type he community string for the specified host.
Version
Select the version of SNMP to which traps will be converted:
• No conversion: No conversion is done.
• Convert trap to SNMPv1: All traps are converted to SNMPv1.
• Convert trap to SNMPv2c: All traps are converted to SNMPv2.
EPICenter Reference Guide

The Alarm Definition Window
Figure 56: The New Alarm Definition window, Message definition
In this window, you can add the messages that will be sent when the alarm occurs.
A message you specify that will be transmitted whenever the alarm occurs. By default, the compose field contains the variable eventTypeName. You can delete this variable, add other variables as provided in the system variables list, and add your own text. For Syslog messages, use the eventData variable to display the Syslog message.
The email header provides the alarm number, alarm name, source IP address, the device name, and ifIndex, severity.
The body of the email provides the alarm time, alarm name, alarm category, severity, source IP address and ifIndex, alarm message, the event name that triggered the alarm, the result of the alarm action, and a URL link to the EPICenter server.
The preview pane provides three previews; EPICenter, Email, and Text Message. The preview shows the message as it will appear when the alarm is triggered. The values of variables that are known are displayed. Variables that are unknown until the alarm is triggered will appear as variable names, surrounded by carets (<>).
System variables A list that provides a list of variables you can select to include in the Message field. See Table 5 “EPICenter Alarm Variables” on page 102 for a definition of the Alarm Manager variables you can use in the message field.
EPICenter Reference Guide 111

The EPICenter Alarm Manager
112
Figure 57: The New Alarm Definition window, Message definition: EPICenter Preview
Figure 58: The New Alarm Definition window, Message definition: E-mail Preview
EPICenter Reference Guide

Alarm Categories
Figure 59: The New Alarm Definition window, Message definition: Text Message Preview
Alarm Categories Alarm categories are arbitrary collections of alarms that you can define as appropriate to your needs, and then assign to specific alarm definitions. For example, you might use categories to designate alarms from individual buildings, floors, or workgroups. An ISP might define categories for alarms from a specific customer’s equipment.
By default, all alarms are assigned to the category named Default. This category can be renamed, but it cannot be deleted.
Creating a New Alarm Category
A small pop-up window appears into which you can enter the name of the new category. Click OK to enter the new category into the Category List.
Modifying an Alarm Category
A small pop-up window appears and displays the current name of the category. Modify the name and click OK to enter the revised category into the Category List.
To create a new alarm category, click the Add button at the top of the window.
To rename an alarm category, click the Modify button at the top of the window.
EPICenter Reference Guide 113

The EPICenter Alarm Manager
114
When an alarm category is renamed, all alarms assigned to that category are updated to use the new category name.
Deleting an Alarm Category
CAUTION
Deleting a category also deletes all the alarm definitions that are assigned to that category. If you do not want to delete those alarm definitions, you must first modify the alarm definitions to use a different alarm category before you delete the category.
A warning message appears to let confirm that you want to delete the category and the alarm definitions that are assigned to it. Click OK to delete the category and the alarms from the EPICenter database.
The Default category cannot be deleted.
Threshold ConfigurationCreating alarm definitions based on threshold events such as RMON utilization is a two-step process. First you must define the rules that control trap (event) generation. Then, you use these rules to define alarms for Rising or Falling threshold conditions.
The Threshold Configuration page lets you define the conditions or rules that will cause certain trap events to occur, and specify the devices on which these rules should be configured. You can use this page to define thresholds for RMON utilization or CPU utilization. You can configure RMON threshold traps for a wide range of variables, but several (specifically port utilization, temperature, and STP topology change) have been partially predefined to make the rule definition process easier.
In these types of events, traps are generated based on comparing the value of the sample variable with a threshold value. The rules you set up specify the threshold values. Once these rules are in place, you can use them in your EPICenter alarm definitions for alarms that respond when a sample value crosses one of the thresholds you’ve defined. You must defined EPICenter alarms based on the threshold rules you create; the trap events generated by threshold conditions will be ignored by the Alarm Manager until you define alarms that take actions on those events. See “Defining Alarms” on page 98 for more information on creating alarms (known as RMON Trap Rising Alarms and RMON Trap Falling Alarms) using threshold event rules.
NOTE
RMON must be enabled on the switch in order for RMON trap events to be generated.
To delete an alarm category, select the category from the Category List, then click the Delete button at the top of the window.
EPICenter Reference Guide

Threshold Configuration
NOTE
There are other SNMP traps supported by the EPICenter Alarm Manager, but not included in EPICenter’s threshold configuration function, that may require conditions to be set on the switch to define when a trap should occur. See “Configuring Other SNMP Trap Events” in the EPICenter Concepts and Solutions Guide for additional information.
In addition to specifying the conditions under which trap events should be generated, you also use the Threshold Configuration page to define the target devices on which the event rules should be configured.
To view the current threshold configuration rules, and to create new rules or modify existing rules, click the Threshold configuration tab at the top of the page. The Alarm Manager Configuration page is displayed, as shown in Figure 60.
Figure 60: The Threshold configuration window
The Configurations tree shows the existing RMON rule definitions as nodes in the tree, with the devices to which they are applied shown as subnodes. The main panel shows the definition for the selected rule on each target device.
CPU Utilization is a predefined node in the Configurations tree. Devices on which a CPU utilization rule is configured are shown as subnodes of the CPU Utilization node. There can be only one CPU utilization rule per device.
Click the small plus next to a rule node to display in the tree the devices associated with that rule.
To display the definition of a rule, click the rule node.
RMON Rule DisplayFor RMON rules, the display shows the following for each device targeted by that rule:
Device The name of the device
Port The port to which the rule applies
Variable The MIB variable being monitored
Sample Type Absolute or Delta
Sample Interval The time between samples, in seconds.
Rising Threshold A threshold value that triggers an event when the value of the variable increments past this value.
EPICenter Reference Guide 115

The EPICenter Alarm Manager
116
For a detailed definition of these parameters, see “Configuring an RMON Rule” on page 119.
CPU Utilization Rule DisplayTo display the CPU Utilization rules, click the CPU Utilization node in the Configurations tree.
Figure 61 shows the Alarm Manager Configuration page as it appears when displaying CPU Configuration rules for a selected device.
Figure 61: The Threshold Configuration window showing CPU Configuration rules
For each device targeted by that rule, the CPU Utilization rule display shows the following:
For a detailed definition of these parameters, see “Configuring CPU Utilization Rules” on page 120.
Falling Threshold A threshold value that triggers an event when the value of the variable decreases past this value.
Startup The condition that causes the initial event (Rising, Falling, or RisingOrFalling).
Index The rule’s row index in the SNMP tables as obtained from the device’s SNMP agent.
Device The name of the device
Port The port to which the rule applies
Variable The MIB variable being monitored (always extremeCpuUtilRisingThreshold.0)
Sample Type The method used to compare the variable to the threshold (shown as N/A, always compares the actual sample value).
Sample Interval The time between samples, in seconds.
Rising Threshold The threshold value that triggers an event when the CPU Utilization value (a percentage) increments past this value.
Falling Threshold Shown as zero, predefined to be 90% of the Rising Threshold value.
Startup The condition that causes the initial occurrence of this event (shown as N/A, predefined to be Rising).
Index The rule’s row index as returned by the device’s SNMP agent.
EPICenter Reference Guide

Threshold Configuration
Creating an Event Rule
Modifying a RuleOnce a set of rules have been created, they must be modified individually. To modify a rule do the following:
Deleting a RuleTo delete a rule, do the following:
Synchronizing with Device RMON Rules
To create a new event rule, click the Add button at the top of the page. This displays the New Rule configuration page, where you can configure a new event rule.
See “Configuring a New Rule or Modifying a Rule” on page 118 for details about the fields in this window.
1 Select the rule folder or the individual rule name in the Configurations tree to display the rule details in the main panel of the window.
2 Select the individual rule you want to modify.
3 Click the Modify button at the top of the page.
This opens the Modify Configuration window, showing the rule definition for the target you selected. The Modify Configuration window shows the same information as the New Configuration window, but with the information for the current target filled in.
See “Configuring a New Rule or Modifying a Rule” on page 118 for details about the fields in this window.
1 Select the rule folder or the individual rule name in the Configurations tree to display the rule details in the main panel of the window.
2 Select the individual rule or rules you want to delete.
3 Click the Delete button at the top of the window.
4 A warning is displayed asking you to confirm that you want to delete these rules. Click Yes to delete the rule(s) or No to cancel the action.
To synchronize the EPICenter database with the RMON rules in place on a switch, click the Sync button at the top of the window.
This opens the Synchronize RMON Rules window, where you can select devices for synchronization. See “Synchronizing EPICenter with Device RMON Rules” on page 124 for a description of the Synchronize RMON Rules window, with instructions on performing the sync operation.
EPICenter Reference Guide 117

The EPICenter Alarm Manager
118
Configuring a New Rule or Modifying a RuleCreating a new rule and modifying an existing rule use the same window fields. The New Configuration and Modify Configuration windows look identical except that Modify Configuration displays the current settings for an existing rule. The definitions below apply to both operations.
There are two parts to an event rule; the rule configuration itself, and the association of the rule to its target devices.
The New Configuration window opens with the Configuration page displayed, as shown in Figure 62. The Modify Configuration window also opens showing the Configuration page, with the configuration settings for the selected rule displayed.
Figure 62: New Configuration window for an RMON Rule
To create or modify a rule, do the following:
1 In the Configuration Type field, select the type of rule you want to create (RMON Event, CPU Utilization, Port Utilization, Temperature, or Topology change) from the drop-down list.
NOTE
CPU Utilization is only supported on switches running ExtremeWare 6.2 or later. STP Topology change traps are only supported on switches running ExtremeWare 6.2.2 or later.
2 Type or select the configuration information in the appropriate fields. The information you can enter differs depending on the selection you made in the Configuration Type field.
See “Configuring an RMON Rule” on page 119 for details about the information required for an RMON rule. See “Configuring CPU Utilization Rules” on page 120 for how to configure CPU Utilization Rules. See “Configuring Rules for the Predefined RMON Event Types” on page 121 for configuring other predefined RMON event types.
3 Specify the devices that should be configured to generate the event you have defined; see “Configuring the Rule Target” on page 122 for details.
4 Click Apply to add the new rule to the Configurations tree.
EPICenter Reference Guide

Configuring a New Rule or Modifying a Rule
For RMON rules, the rule name is included as a “folder” and each target device for the rule appears as a separate component under that rule. The rule name also appears in the Event Name list.
For CPU Utilization rules, each target device for a CPU utilization rule appears as a separate component under the CPU Utilization “folder” in the Configurations tree.
Configuring an RMON RuleIf you select RMON Event as the Configuration Type, the fields and buttons in this window are defined as follows:
Name The name for this rule.
MIB Variable The MIB variable that the rule monitors. Type in the complete OID in its numeric form, or click the Look Up... button to bring up a list of variables that are available.
• Type the beginning of a variable name into the MIB Variable field, then type a space, and the Alarm Manager attempts to match your typing to the variable list and auto-complete your entry.
MIB variables that apply to the entire device have the suffix “.0” appended to them to create the complete OID. MIB variables that apply per port are combined with the port ifIndex to generate the OID.
If the MIB variable you want to monitor does not appear in the MIB Variable lookup list, you can still use the variable by typing its complete OID. Enter the OID in its numeric form, ending in .0 if it is a per device variable, or in the specific index if it is a per-port variable. If it is a table variable, you may need to enter each index and apply it to each target device one by one.
Look Up... Click this to display a list of the MIB variables that may be used in an RMON rule. The list is organized by MIB group. Within the MIB variable list:
• Click on a variable group to display the individual variables within the group.
• Use the up and down arrow keys to scroll the list.
Note: The MIB variable list displays only the MIBs that were shipped with the EPICenter software, and indexed by ifIndex. It does not display table variables in tables indexed by an index other than (or in addition to) ifIndex.
Description The description of the MIB variable. This description should specify the units of measure for the variable, needed in order to correctly specify the Rising Threshold and Falling Threshold values.
Rising Threshold A threshold value that triggers an event when the value of the variable increments past this value. An event is generated when the sample value meets the following conditions:
• When the sample value becomes greater than or equal to the Rising Threshold for the first time after the alarm is enabled, if the Startup Alarm condition is set to Rising or RisingOrFalling
• The first time the sample value becomes greater than or equal to the Rising Threshold, after having become less than or equal to the Falling Threshold
Falling Threshold A threshold value that triggers an event when the value of the variable decreases past this value. An event is generated when the sample value meets the following conditions:
• When the sample value becomes less than or equal to the Falling Threshold for the first time after the alarm is enabled, if the Startup Alarm condition is set to Falling or RisingOrFalling
• The first time the sample value becomes less than or equal to the Falling Threshold, after having become greater than or equal to the Rising Threshold
Sample Type The method used to compare the variable to the threshold. Specify the type as follows:
• Absolute to use the actual sample value of the variable
• Delta to calculate the difference between the current sample value and the previous sample value of the variable, and use the difference in the comparison
EPICenter Reference Guide 119

The EPICenter Alarm Manager
120
It is important to understand that, except for the initial occurrence of the alarm, an RMON alarm event is generated only the when the sample value of the variable crosses one of the thresholds for the first time after having crossed the other threshold.
NOTE
To configure an alarm using an RMON threshold event, select RMON Rising or RMON Falling as the Event Type.
Configuring CPU Utilization Rules
NOTE
CPU Utilization is only supported on switches running ExtremeWare 6.2 or later.
If you select CPU Utilization as the Configuration Type, only the Rising Threshold field allows input, as shown in Figure 63. The other fields and buttons in this window are predefined.
Figure 63: New Configuration window for a CPU Utilization Rule
Sample Interval (seconds)
The interval, in seconds, over which the data is sampled and compared to the rising and falling thresholds.
Startup Alarm The condition that should be met to cause the initial occurrence of this event. Select from the following:
• Rising: An event is generated the first time the sample value becomes greater than or equal to the Rising Threshold value. No events are generated related to the Falling threshold until after this has occurred.
• Falling: An event is generated the first time the sample value becomes less than or equal to the Falling Threshold value. No events are generated related to the Rising threshold until after this has occurred.
• RisingOrFalling: An event is generated the first time the sample value becomes either greater than or equal to the Rising Threshold value, or less than or equal to the Falling Threshold value.
EPICenter Reference Guide

Configuring a New Rule or Modifying a Rule
The fields displayed are defined as follows:
For a CPU Utilization event, the other parameters, such as the MIB variable, threshold, etc., are predefined by the Extreme switch agent to be the following:
NOTE
To define an alarm for a CPU Utilization threshold event, select SNMP Trap as the Event Type, then select CPU Utilization Rising Threshold or CPU Utilization Falling Threshold as the Event Name.
If you define an alarm for a CPU Utilization Rising Threshold event, an alarm is generated each time the sample value meets the following conditions:
● The sample value becomes greater than or equal to the Rising Threshold for the first time (including the initial sample) after the alarm is enabled. (This is the startup condition.)
● The sample value becomes greater than or equal to the Rising Threshold, after having become less than or equal to the Falling Threshold (80% of the Rising threshold).
If you define an alarm for CPU Utilization Falling Threshold events, an event is generated each time the sample value becomes less than or equal to 80% of the Rising Threshold, after having become greater than or equal to the Rising Threshold.
It is important to understand that, except for the initial occurrence of a Rising Threshold alarm, a CPU Utilization alarm is generated only the when the sample value of the variable crosses the target threshold for the first time after having crossed the other threshold.
The startup condition for a CPU Utilization event is always predefined to be Rising.
See the EPICenter Concepts and Solutions Guide for a more detailed explanation of Threshold-based alarms, including examples of CPU Utilization events.
Configuring Rules for the Predefined RMON Event Types
NOTE
When you modify a Port Utilization, Temperature or Topology Change rule, you can modify all the fields available for general RMON Rules. See “Configuring an RMON Rule” on page 119 for the details on the fields you can change.
Rule Name For CPU Utilization, the name is predefined because there can only be one rule of this type on a device.
Rising Threshold A threshold value, in percent, that triggers an event when the CPU utilization rises past this value. This value is also used to compute a falling threshold, which is defined as 80% of the rising threshold.
Description The description of the extremeCpuUtilRisingThreshold MIB variable.
MIB Variable The MIB variable is predefined to be extremeCpuUtilRisingThreshold.0.
Falling Threshold This is predefined as 80% of the rising threshold.
Sample Interval The sample interval for a CPU Utilization alarm is also predefined, and is set to 3 seconds.
Sample Type The sample value (a percentage) is always an absolute value.
Startup Alarm The Startup condition is predefined to be Rising.
EPICenter Reference Guide 121

The EPICenter Alarm Manager
122
The Port Utilization, Temperature, and Topology Change configuration types are actually RMON utilization rules with a predefined configuration interface. The New Configuration and Modify Configuration windows are the same of the Configuration windows for a CPU Utilization event, (see Figure 63), except that you must provide a name for the rule.
NOTE
STP Topology Change traps are only supported on switches running ExtremeWare 6.2.2 or later.
The fields in this window are defined as follows:
The Falling Threshold is automatically defined as 90% of the rising threshold value.
The other parameters that you can set when you configure an RMON event are predefined in the Extreme switch agent for these three events. These are:
NOTE
To define an alarm using one of these predefined threshold events, select RMON Trap Rising Alarm or RMON Trap Falling Alarm as the Event Type in the Alarm Definition window.
Configuring the Rule TargetClick the Target tab to display the New Configuration Target page, as shown in Figure 64.
This page lets you specify which devices should be configured to generate the event you have defined.
Rule Name The name for this rule. For these events, this is user-defined.
Rising Threshold A threshold value that triggers a trap event when the value of relevant variable rises past this value. The thresholds are specified based on the configuration type as follows:
• Port Utilization—A threshold value, in 100ths of a percent, that triggers an event when the port utilization rises past this value.
• Temperature—A threshold value, in degrees celsius, that triggers an Overheat event when the temperature rises past this value.
• Topology Change—An integer threshold value that triggers a topology change event when the total number of topology changes seen by this device since the management entity was last reset or initialized, rises past this value.
Description The description of the relevant MIB variable for the selected rule type.
MIB Variable The MIB variable is predefined to be one of the following:
• For Port utilization: extremeRtStatsUtilization.0
• For Temperature: extremeCurrentTemperature.0
• For Topology Change: dot1dStpTopChanges.0
Falling Threshold This is predefined as 90% of the rising threshold.
Startup Alarm The Startup condition is predefined to be RisingOrFalling.
Sample Interval The sample interval is also predefined, and is set to 15 seconds.
Sample Type The sample value is an absolute value.
EPICenter Reference Guide

Configuring a New Rule or Modifying a Rule
Figure 64: RMON target selection window
The fields and buttons in this window are defined as follows:
The buttons in the middle of the page let you move selected devices, ports, or groups between the source list and the Selection list:
Source Type The source of the RMON rule targets (Device, Device Group, Port, or Port Group). Select the type you want from the pull-down list. The choices you have are determined by the variable you selected for the rule. For example, if the variable you have selected to monitor is applied per port, you will be able to select by Port or Port Group.
Select Group The device group whose members are displayed in the Device list. This choice is not available if you have selected Device Group or Port Group as the Source Type.
Device/Device Group/Port Group
The list of components (devices or groups) of the specified type. The field label changes based on the Source Type. It is labeled Device when you select either Device or Ports (a second field is provided for port selection if needed).
If you leave your cursor over a device name for a moment, a pop-up displays the IP address of the device.
IfIndex The list of ports available on the device selected in the Device Source list. This list appears only if you’ve selected Port as the Source Type. Select a device from the Device list, and the appropriate set of ports for the device appears.
Selection The devices, ports, device groups, or port groups that are currently targets for the RMON rule.
Add -> Adds the selected device(s), port(s), device Groups or Port Groups to the Selection list for inclusion in the scope of this alarm.
Add All -> Adds all the components in the source list to the Selection list.
<- Remove Removes the selected components from the Selection list.
<- Remove All Removes all the components from the Selection list.
EPICenter Reference Guide 123

The EPICenter Alarm Manager
124
Synchronizing EPICenter with Device RMON Rules
Figure 65: The Synchronize RMON Rules window
You can synchronize individual devices or all devices in a device group.
1 To select a device group, select Device Group from the pull-down list in the Source Type field. A list of device groups is displayed.
To select individual devices, select Devices in the Source Type field. A list is displayed showing all the Extreme Networks devices managed by EPICenter.
2 To add a device or device group to the Selection list, select the device or device group and click Add ->. To add all devices or device groups in the list, click Add All ->.
3 To remove a device or device group from Selection list, select the item and click <- Remove. To remove all devices or device groups, click <- Remove All.
4 Click Synchronize to initiate the synchronization process.
The Alarm Manager uses SNMP to retrieve configuration and status information from each selected switch, and updates the database with that information.
5 The Synchronize function displays a dialog box with status or error information. Click OK to continue.
6 Click Close to exit the Synchronize RMON Rules window.
1 To synchronize EPICenter’s database with the RMON rules in place on a switch, click the Sync button at the top of the window.
The Synchronize RMON Rules window opens, as shown in Figure 65.
EPICenter Reference Guide

7 Configuration Manager
This chapter describes how to use the EPICenter Configuration Manager feature for:
● Uploading and archiving configuration settings from one or more devices to EPICenter, on demand or at a predefined (scheduled) time.
● Creating Baseline Configurations for one or more devices.
● Downloading configuration settings from EPICenter to a device.
● Downloading an incremental configuration to one or more devices.
● Specifying and configuring the TFTP server to be used for uploading and downloading configuration settings and software images.
Overview of the Configuration ManagerThe EPICenter Configuration Manager provides a graphical interface for uploading and downloading files to and from managed devices. It provides a framework for storing the configuration files to allow tracking of multiple versions, including baseline configuration files. Configuration file uploads can be performed on demand, or can be scheduled to occur at regular times—once a day or once a week. The Configuration Manager supports Extreme Networks devices only.
For devices running ExtremeXOS, both the current configuration file and any Policy files saved on the switch are uploaded, and saved in .zip format. The individual elements of the zip file (configuration file and policy files) can be inspected individually.
The Configuration Manager also provides the ability to view the differences between configuration files, or between Policy files (for ExtremeXOS). If a baseline file exists, the Configuration Manager will automatically check for differences whenever a scheduled archive upload is performed.
Additionally, the Configuration Manager provides an interface for creating and editing ExtremeXOS scripts, and deploying them to managed devices.
To start the Configuration Manager, expand the Network Administration folder and click Configuration Manager.
Configuration Manager FunctionsThere are multiple ways to invoke the functions provided by the Configuration Manager:
● Selecting an option from the Configuration > Tasks menu on the EPICenter Tools menu from Network Views
● Selecting Configuration manager from the Network Administration folder
● Selecting a device in Network Views, then selecting Configuration files from the Device menu
● Using the menus at the top of the main Configuration Manager frame
EPICenter Reference Guide 125

Configuration Manager
126
The Config MenuThe Config menu contains the following items:
The Scripts MenuThe Scripts menu in Configuration Manager contains commands used with the ExtremeXOS scripting feature. The Scripts menu contains the following item:
Configuration File LocationsConfiguration and baseline files are saved in different directories depending on how they were uploaded (manually, as a scheduled archive, or as a baseline). The default locations are as follows:
● Configuration files that are uploaded manually (not as a scheduled operation) are stored as text files (for ExtremeWare) or as Zip archive files (for ExtremeXOS) in the <tftp_root>\configs directory, in a subdirectory hierarchy organized by year, month, and day. The file names by default are formed
Table 6: The Config Menu
Upload from device Upload configuration from one or more devices. See “Uploading Configurations from Devices” on page 130 for details on using this feature.
Schedule archive Create a schedule for archiving configuration information from one or more devices. See “Scheduling Device Archive Uploads” on page 133 for details on using this feature.
Download to device Download a saved configuration to a selected device. See “Downloading Configuration Information to a Device” on page 139 for details on using this feature.
Download increment to device
Download an incremental configuration to one or more selected device. See “Downloading an Incremental Configuration to Devices” on page 141 for details on using this feature.
Baseline (valid only for devices running ExtremeWare or ExtremeXOS 11.4 or higher)
Create for group Designate the selected saved configuration as the baseline configuration. If a device group is selected, designates the most recent uploaded configuration file for each device as the baseline configuration for that device. See “Creating a Baseline Configuration File” on page 143.
Remove from group Remove the saved baseline configuration file, and reset the baseline time and baseline filename in the status display. If a device group is selected, removes the saved baseline files for all devices in the group, and resets the baseline status for those devices. See “Removing a Baseline Configuration File” on page 144.
Schedule Create a schedule for uploading configuration information that will be saved as the baseline configuration for the device, or for all devices in a device group. See “Scheduling a Baseline Upload” on page 144.
Restore Restores the baseline configuration to the selected device. See “Restoring a Baseline Configuration to a Device” on page 146.
Scheduled configurations Displays the status and results of the configuration upload/download activities for all devices and device groups, as well as information about the next scheduled configuration upload.
Table 7: The Scripts Menu
Managed Scripts Open the Managed Scripts window, which allows you to create, view, edit and deploy ExtremeXOS scripts using EPICenter. See “Uploading Configurations from Devices” on page 130” for details on using this feature.
EPICenter Reference Guide

Device Configuration Summary Status
from the IP address of the device with a timestamp appended. The default form of the file name for a manually uploaded configuration file is:
<tftp_root>\configs\<year>\<month>\<day>\<device_address>_<time>.txt for devices running ExtremeWare<tftp_root>\configs\<year>\<month>\<day>\<device_address>_<time>.zip for devices running ExtremeXOS.
● Configuration files that are uploaded through a scheduled archive upload are stored in the <tftp_root>\configs\archive directory, also in a subdirectory hierarchy organized by year, month, and day. The form of the file name for an archived configuration file is:
<tftp_root>\configs\archive\<year>\<month>\<day>\<device_address>_<time>.txt for devices running ExtremeWare<tftp_root>\configs\archive\<year>\<month>\<day>\<device_address>_<time>.zip for devices running ExtremeXOS.
● Baseline configuration files for ExtremeWare are stored in the <tftp_root>\baselines subdirectory. Since there can only be one baseline configuration per device, baseline configuration files are saved with filenames created just from the device IP address. The form of the file name for a baseline configuration file is:
<tftp_root>\baselines\<device_address>.txt for devices running ExtremeWare or ExtremeXOS 11.4 or higher.
NOTE
Baselining is not supported for devices running versions of ExtremeXOS lower than 11.4.
<tftp_root> is the location of the TFTP server. By default, <tftp_root> is <EPICenter_install_dir>\user.war\tftp.
In the Windows operating environment, <EPICenter_install_dir> is c:\Program Files\Extreme Networks\EPICenter 7.0. In a Linux or Solaris environment, <EPICenter_install_dir> is /opt/ExtremeNetworks/EPICenter7.0.
ExtremeXOS Script File LocationsThe ExtremeXOS script scripts that have been deployed on the device are stored on the EPICenter server in the following directory:
<tftp-server-root>\scripts\<device-ip-address>
The <tftp-server-root> is by default <EPICenter_install_dir>\user.war\tftp where <EPICenter_install_dir> is the directory where the EPICenter server is installed. Note that if you specified an alternate name for the script using the “Save script on device with this filename” option on the script customization screen, the script is stored on the EPICenter server under its original name, not the name that you specified.
Device Configuration Summary StatusWhen the Configuration Manager opens, a blank table is displayed. Click All devices or specify a device group name in the Device group box to display the summary status for the devices in the group, as shown in Figure 66.
EPICenter Reference Guide 127

Configuration Manager
128
Figure 66: Configuration Manager showing summary device status
This display shows a summary of the upload and download activity for each managed device, as follows:
You can display the upload and download status of the configuration information for an individual device by selecting the device, then selecting Configuration files from the right-click menu. This displays a status window for the device similar to the one shown in Figure 67.
Name The device name
IP Address The device IP address.
Last Upload Status The status of the most recent configuration activity; Successful, Failed or None.
Last Successful Upload The date and time of the last successful upload for the device
Next Upload The date and time for the next Archival upload, if one is scheduled.
Last Successful Download The last configuration download that has taken place through the EPICenter Configuration Manager for this device.
Baseline Time The date and time that a baseline configuration upload occurred.
Different Indicates whether the last uploaded device configuration is the same as the baseline configuration. A green check indicates that configurations are the same. A red X
indicates that the current configuration is not the same as the baseline configuration.
EPICenter Reference Guide

Device Configuration Summary Status
Figure 67: Configuration and software status for an individual device (ExtremeWare)
The top section of the device status window displays the currently archived configuration files, with the following information about each file:
The bottom section of the device status window shows status information about the device. The first lines show basic identification information for the device. The remaining lines show the following information about the device configuration files.
Filename The filename of the archived configuration (.txt extension for ExtremeWare devices, .zip extension for ExtremeXOS devices).
For ExtremeXOS devices, the .zip file itself can be expanded to display its component parts—the configuration file and the policy files.
• If the ExtremeXOS device is running version 11.4 or higher, the configuration file is in plain ASCII text format.
• If the ExtremeXOS device is running a version of ExtremeXOS earlier than 11.4, the configuration file is a text file in XML format.
Directory The directory where the archived configuration file is stored
Upload Time The date and time at which the configuration was uploaded from the device.
Baseline Whether the configuration is the baseline configuration. A green check indicates that this file has been designated as the baseline configuration. A red X indicates that this is not the baseline configuration.
Baseline File Filename (with path) of the baseline configuration, if there is one.
Baseline Time The date and time at which the baseline configuration was uploaded from the device.
EPICenter Reference Guide 129

Configuration Manager
130
Any of the files within the ExtremeXOS zip file can be selected and then viewed with the View command (see “Viewing a Configuration File” on page 147). If multiple configuration zip files have been uploaded from a device running ExtremeXOS, you can select and view the differences between like elements from within the files (i.e. the configuration files or policy files). See “Comparing Two Configuration Files—The Diff Command” on page 148 for more information.
The Configuration Scripts tab lists all of the ExtremeXOS scripts that have been deployed on this device using EPICenter, and when the scripts were last modified. If you modified a script’s parameters for the device before deploying the script, the device-specific version of the script is listed here.
When the Configuration Scripts tab is selected, columns in the top section show the following information about each script file:
To view the differences between two ExtremeXOS scripts deployed on the device, select the two scripts in the list and click the Diff button. The differences between the scripts are shown in the configured Diff viewer for EPICenter.
The bottom section of the device status window shows information about the last script that was deployed to the device.
Uploading Configurations from DevicesTo upload the configuration information from one or more devices, click the Upload button at the top of the window, or select Upload from device from the Config menu.
For ExtremeXOS devices, this command uploads the configuration information and any policy files saved on the device, and saves them into a compressed archive file (zip file).
The Upload Configuration from Devices window appears, as shown in Figure 68.
Scheduled Baseline The date and time for the next scheduled baseline configuration upload, if one is scheduled.
Last Upload Status Whether the last upload was successful or not, and if successful, whether it is different from the saved baseline configuration.
Last Upload Filename Filename (with path) of the last successful archive upload for the device
Next Upload Time The date and time for the next archival upload, if one is scheduled.
Last Download Time The date and time of the last time a configuration file was downloaded to the device.
Last Download Status The status of the download (In progress..., successful, failure, or none).
Last Download Filename Filename (with path) of the configuration file that was last downloaded to the device.
Script Name The name of the deployed script. To view the contents of the script, select the script from the list and click the View button (or select View from the Scripts menu). The script is opened in a read-only window.
Modified On When the script was last modified on the server.
Last Deployed Script The name of the last script deployed on the device
Last Deployment Status The result of the deployment (success or failure)
Last Deploy Time The date and time of the deployment
EPICenter Reference Guide

Uploading Configurations from Devices
Figure 68: The Upload Configuration from Devices window
The fields in this window are as follows:
Device Group: Device group from which to select devices for upload. Determines the devices shown in the Available Devices list. Select All Devices from the drop-down menu to include all devices in the Available Devices list.
Available Devices: The devices from which you can upload configuration information. Shows devices in the Device Group selected in the Device Group field.
Devices for Upload: The devices you have selected from which to upload configuration files.
Upload File Options
Archive to Default Location
Select this option to create files for each upload under the EPICenter configs directory, in a subdirectory hierarchy organized by year, month, and day. The form of the fully qualified file names for these files is:
<tftp_root>\configs\<year>\<month>\<day>\<IP_address>_<time>.txt or<tftp_root>\configs\<year>\<month>\<day>\<IP_address>_<time>.zip
where <tftp_root> is the location of your TFTP server. (By default, <tftp_root> is <EPICenter_install_dir>\user.war\tftp.)
Baseline Check this option to designate the uploaded Configuration files as the baseline files for the selected devices. If this option is checked, the file is placed in a baseline subdirectory:
<tftp_root>\baseline\<IP_address>.txt
Archive to: Select this to specify your own directory structure and file naming convention relative to the TFTP root’s configs subdirectory. The structure will be of the form:
<tftp_root>\configs\<File_Location>\<IP_address>_<FileName_Trailer>.txtor<tftp_root>\configs\<File_Location>\<IP_address>_<FileName_Trailer>.zip
where <File_Location> is the subdirectory you specify in the File Location field, and <FileName_Trailer> is the string you specify in the FileName Trailer field.
File Location: Specify the <File_Location> path where the files should be stored, starting from the configs subdirectory. This field is available only when the Archive To option is selected.
• Do not include <tftp_root>\configs\ as part of the path; just include the remaining path.
EPICenter Reference Guide 131
Configuration Manager
132
To upload device configurations to EPICenter, do the following:
1 Select a device group or All Devices from the drop-down menu in the Device Group field.
2 From the Available Devices list, select the devices from which you want to set an upload schedule, and click Add to add them to the Devices for Upload list. Click Add All to add all the devices in the Available Devices list.
3 Specify where the uploaded information should be stored.
To store the files in the EPICenter default configs directory, select Archive to Default Location. To specify your own location, select Archive to.
In either case, you can designate these configuration files as the baseline files for the selected devices by checking the Baseline checkbox.
NOTE
If you have reconfigured your TFTP root directory (see “Configuring the TFTP Server” on page 151), the configs subdirectory will be found directly below your TFTP root directory.
4 You can change the location (relative to the TFTP root’s configs subdirectory) and file naming convention used to store your uploaded files. The location and naming structure will be of the form:
<tftp_root>\configs\<File_Location>\<File Name>_<FileName_Trailer>.txt (or .zip)
● To change the File Location, type the path you want EPICenter to create under the <tftp_root>\configs\
● To have EPICenter append a text trailer to the file names it creates, enter the trailer string in the FileName Trailer field.
● By default, EPICenter saves configuration files using file names created from the device name, IP address, and the time at which the upload was performed: <IP Address>_<Time>.txt.
In addition to appending some trailer text, you can change the format of the file name. The IP Address and Time elements are required, but you can change the order, and include other elements as well as adding text of your own. See “Changing the Configuration Filename Format” on page 132.
5 Click Apply to start the upload process.
Changing the Configuration Filename FormatTo change the filename format:
1 Click the Configure Upload Filename Format button to open the Configure Upload Filename Format window.
2 Create your filename format in the field provided as follows:
FileName Trailer: Specify a string to be appended to the regular file name format to create a file name. This field is available only when the Archive To option is selected.
For example, if you specify a file name trailer of “week_8_backup” then the filename for the device, assuming the default file name format, would be <IP Address>_<Timestamp>_week_8_backup.txt.
Configuration information saved at:
Shows the directory path where configuration information will be saved, and the current file name format, as specified using the Configure Upload File Name Format dialog. See “Changing the Configuration Filename Format” on page 132 for details.
EPICenter Reference Guide

Archiving Configuration Settings
● Type a space to invoke a list of elements you can include. These include the system name (SysName), IP address, Date, and Time. The default is <IPAddress>_<Time>, which you can specify as a unit by choosing DEFAULT from the list. You can select these in any order, but you must include both the IP address and the Time somewhere in your filename format. Each element you choose is separated from its neighboring elements by an underscore.
● You can include text of your own in the filename format; it will then appear in every file name EPICenter creates (until you change the format).
3 Click Apply when you have finished.
When you change the filename format, it becomes the default format for any upload operations you perform within this Configuration Upload session—when you close the Configuration Upload window, the filename format reverts to the default.
You can change the default configuration filename format from within EPICenter Administration, Server Properties, under the Other category. See “Server Properties Administration” on page 307 for more information.
Archiving Configuration SettingsYou can schedule the uploading (archiving) of configuration information so that it is done automatically, either once a day or once a week. You can set up a global archive schedule, as well as schedule archiving for individual devices. All new devices added to the EPICenter database use the global upload schedule, if one has been set up, until they are configured with an individual archiving schedule. By default, no global archiving is scheduled.
When a scheduled upload occurs for a device, if a baseline configuration has been designated for the device, EPICenter automatically compares the new archive configuration with the baseline configuration, and sends an email report if differences are found. This requires configuration of the email notification feature (see “Configuring Email Notification of Archive/Baseline Differences” on page 138). These reports are saved in the <tftp_root>\configs\reports directory.
Since archiving files on a regular basis for a large number of devices could eventually use too much disk space, you can set limits on the number of archive files that are kept, or set a time limit for how long they are kept.
In addition, in EPICenter Administration you can specify whether the device configurations are always uploaded at the scheduled archive time, or are uploaded only when the device configuration has changed. The default is to perform a scheduled upload only when the configuration has changed. See “Server Properties Administration” on page 307 for more information about how to set the uploading configuration settings.
Scheduling Device Archive UploadsA device, a set of devices, or one or more device groups can be scheduled for archive individually and independently of other device upload schedules. To schedule device configuration archive uploads, click the Archive button at the top of the window, or select Schedule archive from the Config menu.
The Schedule Upload window appears, as shown in Figure 69, with the Device Schedule tab displayed.
EPICenter Reference Guide 133

Configuration Manager
134
Figure 69: Schedule Upload window
The fields in the Device Schedule window are as follows:
Device Group The device group from which to select devices for upload. Determines the devices shown in the Available Devices list. Select All Devices from the drop-down menu to include all devices in the Inventory database in he Available Devices list.
Available Devices: The devices from which you can upload configuration information. Shows devices in the Device Group selected in the Device Group field.
Devices for Scheduling: The devices you have selected from which to upload configuration files.
Set Schedule Specify the schedule you want:
• No Schedule Removes any schedule associated with the device(s) in the Devices for Scheduling list.
• Repeat Every Day The upload should be done every day at the specified time for the devices in the Devices for Scheduling list. When you select this option, you can specify the time of day (the hour and minutes) at which the upload should be done.
• Repeat Every Week The upload should be done every week at the specified day and time for the devices in the Devices for Scheduling list. When you select this option, you can specify the time of day (the hour and minutes), and the day of the week at which the upload should be done.
At: Hours (0-23): Specify the hour at which the upload should be done.
Minutes (0-60): Specify the minute within the hour at which the upload should be done
Days of Week: For a weekly schedule, specify the day of the week on which to perform the upload.
Configuration information saved at:
Shows the directory path where archived configuration files are saved, and the current file name format.
By default, archived file information will be stored in the form:
<tftp_root>\configs\archive\<year>\<month>\<day>\<device_address>_<time>.txt
where <tftp_root> is the location of your TFTP server.
(By default, <tftp_root> is <EPICenter_install_dir>\user.war\tftp.)
You can change the filename format using the Configure Upload File Name Format dialog. See “Changing the Configuration Filename Format” on page 132 for details.
EPICenter Reference Guide

Archiving Configuration Settings
To schedule the upload of device configurations, do the following:
1 Select a device group or All Devices from the drop-down menu in the Device Group field.
2 From the Available Devices list, select the devices from which you want to set an upload schedule, and click Add to add them to the Devices for Upload list. Click Add All to add all the devices in the Available Devices list.
3 Specify the schedule you want.
4 Click Apply to have the upload schedule set for these devices.
Scheduling Global Archive UploadsWhen you add devices to the EPICenter database, configurations on those devices are automatically saved according to the global schedule for configuration uploads, if one has been set. If you have a device or series of devices that require a configuration upload schedule that differs from the global schedule, see “Scheduling Device Archive Uploads” on page 133 for information on how to create an individual configuration schedule.
To set or modify the Global Upload schedule, select the Global Schedule tab in the Schedule Upload window (as shown in Figure 70).
Figure 70: Global Schedule Upload window
The fields in this window are as follows:
Current Global Schedule Indicates the current schedule.
Change Current Global Schedule
Specify the global schedule using one of the options below.
• No Schedule Removes any schedule associated with the device(s) that use the global schedule.
• Repeat Every Day The upload should be done every day at the specified time for devices that use the global schedule. When you select this option, you can specify the time of day (the hour and minutes) at which the upload should be done on.
EPICenter Reference Guide 135

Configuration Manager
136
Click Apply to set the global upload schedule for devices that do not have an individually set configuration schedule.
Setting Archive LimitsYou can limit the number of archived configuration files EPICenter keeps for a device to prevent accumulated files from using too much disk space on the EPICenter server. You can set a limit either by specifying the number of files kept for each device, or by specifying how long to keep files.
NOTE
Archive limits apply only to files created automatically through a scheduled upload.
To set archive limits, select the Archive Limit tab in the Schedule Upload window (as shown in Figure 71).
• Repeat Every Week The upload should be done every week at the specified day and time for devices that use the global schedule. When you select this option, you can specify the time of day (the hour and minutes), and the day of the week at which the upload should be done.
At: Hours (0-23): Specify the hour at which the upload should be done.
Minutes (0-60): Specify the minute within the hour at which the upload should be done
Days of Week: For a weekly schedule, specify the day of the week on which to perform the upload.
Configuration information saved at:
Shows the directory path where archived configuration files are saved.
Archived file information will be stored in the form:
<tftp_root>\configs\<year>\<month>\<day>\<device_address>_<time>.txt
where <tftp_root> is the location of your TFTP server.
By default, <tftp_root> is <EPICenter_install_dir>\user.war\tftp.
You can change the filename format using the Configure Upload File Name Format dialog. See “Changing the Configuration Filename Format” on page 132 for details.
EPICenter Reference Guide

Archiving Configuration Settings
Figure 71: Archive Limits window
The archive limit settings you can select are:
Click Apply to set the archive limit.
Archive/Baseline Differences ReportWhen EPICenter uploads a scheduled archive configuration, it automatically compares the new configuration with the baseline configuration for the device, if a baseline configuration exists. If differences are found, it generates a report that can be emailed (see “Configuring Email Notification of Archive/Baseline Differences” on page 138). The report is created as an Adobe Acrobat PDF file, and is saved in the <tftp_root>\configs\reports directory, named with the date at which the report was created (for example, 2008_10_11.pdf). Figure 72 shows an example of this report. The one report contains information about configuration changes detected for all devices included in the scheduled archive operation.
No Limit An unlimited number of files can be saved for each device. This is the default.
Number of copies per device to keep
Specifies the number of files to keep for each device. When the limit is reached, the oldest files for the device are deleted.
Days to keep the configuration files Specifies that EPICenter should not keep configuration files that are older than the time limit. When a configuration file exceeds the age limit, it is deleted.
EPICenter Reference Guide 137

Configuration Manager
138
Figure 72: Configuration Change Report
For each device, the report shows the information about each configuration change it has detected:
If either the baseline configuration or the archived configuration file for a device is too large, EPICenter does not attempt to analyze the differences.
Configuring Email Notification of Archive/Baseline DifferencesIf differences are found between the newly archived configuration and the baseline configuration, EPICenter can send a report via email. You must configure the email notification part of this feature before it can function properly.
To configure email notification, select E-mail settings from the main EPICenter Tools menu.
Type The type of change that occurred (add, modify, or delete)
Configuration Change The changed lines in the configuration file
Switch Log Event The switch log event entries (if any) that are related to the configuration change.
EPICenter Reference Guide

Downloading Configuration Information to a Device
Figure 73: The Email Settings window
Fill in the fields as follows:
Downloading Configuration Information to a DeviceDownloading a configuration does a complete configuration download, resetting the current switch configuration and replacing it entirely with the new downloaded configuration. The switch is rebooted automatically after the download has completed. On Extreme devices, you can have the switch save the configuration after reboot as the Primary, Secondary or Current configuration. You can only download to one device at a time.
To download saved configuration information to a device, click the Download button at the top of the window, or select Download to device from the Config menu.
The Download Configuration window appears, as shown in Figure 74.
Email to The email address(es) of the recipient(s) of the email. E-mail addresses in a list can be separated by commas, semicolons, or spaces.
SMTP Host The outgoing mail server name (or IP address).
Sent By The e-mail address that should be used as the sender of the e-mail.
My server requires authentication
Check this if your mail server authenticates the user before sending out e-mail and enter the user name and password of an account that the SMTP server accepts. Usually this is the account you use to log into your network.
If you don’t know whether your server requires authentication, you can go ahead and enter the authentication information—it is ignored if it is not actually needed.
User Name The user name for mail server authentication.
Password The password for mail server authentication.
EPICenter Reference Guide 139

Configuration Manager
140
Figure 74: Download configuration window
The fields in this window are as follows:
Device Group: Device group from which to select the device for a configuration download. Determines the devices shown in the Device list. Select All Devices from the drop-down menu to include all devices in the Available Devices list.
Device The devices for which you can download configuration information. Shows devices in the Device Group selected in the Device Group field.
Last Uploaded Configuration If configuration information has been uploaded from the device, the file where it was saved.
File Location: The location and name of the file to download. When you select a device, the file displayed as the Last Uploaded Configuration appears here.
To select a different file, you can type a filename into this field, or click the Show Uploaded Configs button and select the file to be downloaded.
Show Uploaded Configs Click to display a pop-up list of configuration files available for the selected device.
Select a configuration the file to be downloaded from the list and click OK, or Close to close the pop-up list.
Download configuration to: Select the location on the device to which the configuration should be downloaded:
• Current: Downloads to the current partition (ExtremeWare devices only).
• Primary: Downloads to the Primary partition.
• Secondary: Downloads to the secondary partition.
Save configuration to: For devices running ExtremeWare, check to automatically save the configuration file on the device after the device reboots.
Select the location on the device where the configuration should be saved:
• Current: Saves as the current configuration.
• Primary: Saves as the Primary configuration.
• Secondary: Saves as the secondary configuration.
EPICenter Reference Guide

Downloading an Incremental Configuration to Devices
To download a configuration to a device, do the following:
1 Select a device group or All Devices from the drop-down menu in the Device Group field.
2 Select the device from the device list presented. You can only download to one device at a time.
3 Select the file you want to download. The default is the Last Uploaded Configuration, if there is one. You can also enter a file name or select from a list of files saved for this device.
4 For ExtremeWare devices, specify the target location for the configuration, and whether EPICenter should save the file on the device after reboot.
5 To start the download, click the Apply button. The Message from Server dialog box appears.
You can monitor the download status using this dialog box. You can close this dialog box anytime during the download. The download will continue in the background and the Last Download Status field in the Configuration and software status for an individual device page displays the status as In Progress.
Downloading an Incremental Configuration to DevicesThe Incremental download feature lets you download only selected configuration settings to a device, instead of replacing the entire device configuration file.
An incremental configuration download executes only the commands specified in the incremental download file. It does not reset the switch configuration or replace any other configuration settings that may exist in the device. No reboot is necessary. The EPICenter incremental download does not save the configuration; you must do so manually.
Within EPICenter, you can create or designate a set of configuration information as a baseline configuration for devices running ExtremeWare 6.0 or later or ExtremeXOS 11.4 or later (see “Creating a Baseline Configuration File” on page 143). Using an incremental download to execute a baseline configuration provides a known, “standard” configuration that you can use to ensure that devices are configured into a known state. For example, if you want to set a group of devices to the same basic configuration, you can first set individual IP addresses on each device, and then use the incremental configuration download feature to set all other configuration settings on all devices to a common state.
Incremental downloads are supported on Extreme Networks devices running ExtremeWare 6.0 or later.
To download an incremental configuration to a device, click the Increment button at the top of the window, or select Download incremental to device from the Config menu.
EPICenter Reference Guide 141

Configuration Manager
142
The Download Incremental Configuration to Devices window appears, as shown in Figure 75.
Figure 75: Download Incremental Configuration window
The fields in this window are as follows:
From this window, do the following:
1 Select a device group or All Devices from the drop-down menu in the Device Group field.
2 From the Supported Devices list, select the devices for which you want to download the baseline configuration.
The buttons in the center of this window function as follows:
3 Select the configuration file you want to download from the pull-down list in the Available Incremental Configs field.
4 Click Apply to start the baseline download to the selected device.
Device Group: Select a device group or All Devices from the drop-down menu.
Supported Devices Select the devices for which you want to download the baseline configuration, then click the Add-> button.
If you want to download the baseline configuration to all the devices in the device group, click the Add All-> button.
Download Incremental config to list
When you select devices from the Supported Devices list and click Add-> or Add All->, the devices are moved to the Download Incremental Config to list.
To remove devices from the Download Incremental config to list, select the devices and click the <-Remove button. This moves the selected devices back to the Supported Devices list. Click <-Remove All to move all the devices in the Download Incremental Config to list back to the Supported Devices list.
Available Incremental Configs
Select the baseline configuration you want to download from the pull-down list in the Available Incremental Configs field.
Add -> Adds the selected device(s) to the Devices for Upload list.
Add All -> Adds all the devices in the Available Devices list to the Devices for Upload list.
<- Remove Removes the selected device(s) from the Devices for Upload list.
<- Remove All Removes all the devices from the Devices for Upload list.
EPICenter Reference Guide
Creating a Baseline Configuration File
NOTE
The EPICenter software does not reboot the device or save the configuration on the device after the download. You can use Telnet to open a Telnet session on the affected devices and execute a save configuration command.
NOTE
The Configuration Manager displays an error if you attempt an incremental download on a switch running a version of ExtremeWare prior to 6.0.
Creating a Baseline Configuration File
NOTE
Baseline configuration files are not supported for devices running ExtremeXOS versions lower than 11.4.
The purpose of a baseline configuration is to provide a set of known, standard configuration settings you can download to a device to restore it or initialize it to a known software state.
There are several ways to create a baseline configuration:
● You can start with a configuration file you have previously uploaded, and designate it as a baseline using the Baseline > Create command from the Config menu.
a Select the device for which you want to create a baseline.
b Select the configuration file that should be designated as the baseline.
c Select Baseline, then Create from the Config menu.
You are asked to confirm that this configuration file should be used as the baseline.
● You can upload a configuration as a baseline. You do this by using the Upload command, and checking the Baseline checkbox under Upload File Options. See “Uploading Configurations from Devices” on page 130 for more information.
● You can schedule a baseline upload. See “Scheduling a Baseline Upload” on page 144 for details.
Baseline configuration files are stored in the <tftp_root>\baselines directory, where <tftp_root> is the location of your TFTP server. By default, <tftp_root> is <EPICenter_install_dir>\user.war\tftp.
Baseline files are always named in the form <device_address>.txt. So, the baseline file for the device with IP address 10.205.2.39 will be 10_205_2_39.txt in the directory <tftp_root>\baselines.
<EPICenter_install_dir> is the EPICenter installation directory. Thus, if you installed the EPICenter server under Microsoft Windows using the default installation path, the baseline configuration for device 10.205.2.39 would be saved in c:\Program Files\Extreme Networks\EPICenter 7.0\user.war\tftp\baselines\10_205_2_39.txt, unless you have reconfigured your TFTP root directory.
EPICenter Reference Guide 143

Configuration Manager
144
NOTE
If you have reconfigured your TFTP root directory (see “Configuring the TFTP Server” on page 151), the baselines subdirectory will be found directly below (as a child of) your TFTP server root directory.
Removing a Baseline Configuration FileYou can remove baseline configuration files using the Baseline > Remove command from the Config menu.
● If you have an individual device selected when you execute this command, EPICenter deletes the baseline file for the selected device, and resets the device status so the Baseline Time is set to None and the Baseline filename is cleared.
● If you have a device group selected, EPICenter deletes any baseline files for all devices in the device group, and resets the baseline status of those devices.
Scheduling a Baseline UploadYou can schedule the upload of a baseline configuration for one or more devices. Unlike the Archive feature, this is a one-time event; you cannot schedule repeating baseline uploads. This feature allows you to schedule the upload up to a week ahead at a convenient time (when network activity is low, for example) without requiring administrator attendance.
NOTE
Baseline configuration files are not supported for devices running ExtremeXOS versions lower than 11.4.
To schedule baseline configuration uploads, select Baseline, then Schedule from the Config. The Schedule Baseline window appears, as shown in Figure 76.
EPICenter Reference Guide

Scheduling a Baseline Upload
Figure 76: The Schedule Baseline window
The fields in the Schedule Baseline window are as follows:
To schedule the upload of device configurations, do the following:
1 Select a device group or All Devices from the drop-down menu in the Device Group field.
2 From the Available Devices list, select the devices from which you want to set an upload schedule.
The buttons in the center of this window function as follows:
Device Group The device group from which to select devices for upload. Determines the devices that appear in the Available Devices list. Select All Devices from the drop-down menu to include all devices in the Inventory database in the Available Devices list.
Groups and subgroups within a device group hierarchy are indicated by a vertical bar (|) character between device group names. For example, “North America | Bay Area” indicates a top-level device group “North America” with a subgroup “Bay Area”.
Available Devices: The devices from which you can upload a baseline configuration. Shows devices in the Device Group selected in the Device Group field.
Devices for Scheduling: The devices you have selected from which to upload baseline configuration files.
Set Schedule Specify the schedule you want:
• No Schedule Removes any schedule associated with the device(s) in the Devices for Scheduling list.
• Schedule Baseline The upload should be done at the specified day and time for the devices in the Devices for Scheduling list. When you select this option, you can specify the day and the time of day (the hour and minutes) at which the upload should be done.
At: Hours (0-23): Specify the hour at which the upload should be done.
Minutes (0-60): Specify the minute within the hour at which the upload should be done
Days of Week: For a weekly schedule, specify the day of the week on which to perform the upload.
Configuration information saved at:
Shows the directory path where the baseline configuration files are saved.
By default, baseline file information will be stored in the form:
<tftp_root>\baseline\<device_address>_<timestamp>.txt
where <tftp_root> is the location of your TFTP server.
By default, <tftp_root> is <EPICenter_install_dir>\user.war\tftp.
EPICenter Reference Guide 145

Configuration Manager
146
3 Specify the schedule you want.
4 Click Apply to have the upload schedule set for these devices.
Restoring a Baseline Configuration to a DeviceThis feature lets you download a baseline configuration to a device, completely replacing the current configuration in the device. This feature functions like the regular Configuration Download feature, except that you do not need to select the file to download—the baseline configuration is preselected. Like a regular configuration download, EPICenter reboots the device after the download, and you can specify whether the configuration should be saved on the device after the reboot.
If you want to download a baseline configuration to replace only part of a device’s configuration, you can use the Incremental download feature instead of the Baseline > Restore feature. See “Downloading an Incremental Configuration to Devices” on page 141 for more information on using the Incremental download feature.
NOTE
Baseline configuration files are not supported for devices running ExtremeXOS versions lower than 11.4.
Figure 77: The Restore Baseline Configuration window
Add -> Adds the selected device(s) to the Devices for Upload list.
Add All -> Adds all the devices in the Available Devices list to the Devices for Upload list.
<- Remove Removes the selected device(s) from the Devices for Upload list.
<- Remove All Removes all the devices from the Devices for Upload list.
EPICenter Reference Guide

Viewing a Configuration File
The fields in this window are as follows:
To restore (download) a baseline configuration to a device, do the following:
1 Select a device group or All Devices from the drop-down menu in the Device Group field.
2 Select the device from the device list presented. You can only restore to one device at a time. You do not need to select a configuration file as the baseline file is used.
3 For ExtremeWare devices, specify the target location for the configuration, and whether EPICenter should save the file on the device after reboot.
4 To start the download, click the Apply button.
Viewing a Configuration FileThe view feature allows you to look at the contents of a saved configuration or baseline file using either a built-in viewer, or a file viewer of your choice. See “Configuring a Viewer” on page 150 for information on configuring a different file viewer.
To view a configuration file:
1 In the main Configuration Manager window, select the device with the configuration file you want to view, then select Configuration files from the right-click pop-up menu.
2 Select the configuration file you want to view.
For ExtremeXOS devices, you must expand the contents of the .zip file and select the configuration file or a policy file from within the .zip file to view. You cannot use the View function by selecting the .zip file.
3 Click the View button at the top of the window, or select View from the Config menu.
If you have not selected a configuration file, if you select more than one file, or if you select a .zip file (for devices running ExtremeXOS), the View button and View command are not available.
Device Group: Device group from which to select the device for a configuration download. Determines the devices shown in the Device list. Select All Devices from the drop-down menu to include all devices in the Available Devices list.
Device The devices to which you can download a baseline configuration. Shows devices in the Device Group selected in the Device Group field.
Baseline Configuration If a baseline configuration has been uploaded from the device, the file where it was saved.
Download configuration to: Select the location on the device to which the configuration should be downloaded:
• Current: Downloads to the current partition.
• Primary: Downloads to the Primary partition.
• Secondary: Downloads to the secondary partition.
Save configuration to: Check to automatically save the configuration file on the device after the device reboots.
Select the location on the device where the configuration should be saved:
• Current: Saves as the current configuration.
• Primary: Saves as the Primary configuration.
• Secondary: Saves as the secondary configuration.
EPICenter Reference Guide 147

Configuration Manager
148
To view a baseline configuration file:
1 In the main Configuration Manager window, select the device whose baseline you want to view, then select Configuration files from the right-click pop-up menu.
2 Select Baseline > View from the Config menu. If the device does not have a saved baseline configuration, the Baseline > View command is not available.
The View Configuration window appears with the baseline file you selected displayed.
Figure 78 shows an example of the default configuration viewer.
Figure 78: The View Configuration window (EPICenter default viewer)
When you have finished, click Close to close the viewer window.
The Save button is always disabled; you cannot save a configuration file you are viewing using the View feature.
Comparing Two Configuration Files—The Diff CommandThe Diff feature allows you to contents of two saved configuration files for a device, or a configuration file and the baseline file using a difference viewer of your choice (see “Configuring a Viewer” on page 150 for information on configuring a difference viewer). You can only compare files on a single device.
To view differences between two configuration files for a device:
1 In the main Configuration Manager window, select the device for which you want to compare configuration files then select Configuration files from the right-click pop-up menu.
2 Select the two configuration files you want to compare (using Ctrl-click or Shift-click).
For ExtremeXOS devices, you must expand the contents of two .zip files; then you can select and compare the configuration files or policy files from within the two zip files. You cannot use the Diff function to compare the two .zip files themselves.
EPICenter Reference Guide

Comparing Two Configuration Files—The Diff Command
3 Click the Diff button at the top of the window, or select Diff from the Config menu.
If you have not selected two configuration or policy files, the Diff button and Diff commands are not available. See Figure 79 for an example of selecting files for a device running ExtremeXOS.
Figure 79: Comparing policy files for an ExtremeXOS device
To view differences between the baseline file and a configuration file for a device:
1 In the main Configuration Manager window, select the device for which you want to compare a baseline and a configuration file, then select Configuration files from the right-click pop-up menu.
2 Select the one configuration file you want to compare to the baseline.
3 Select Baseline > Diff from the Configuration menu. If you have not selected a configuration file to compare, the Baseline > Diff command is not available.
EPICenter invokes the Difference viewer in a separate window, with the two files you selected displayed. Figure 78 shows an example of a differences comparison using WinMerge in Windows.
EPICenter Reference Guide 149

Configuration Manager
150
Figure 80: The Diff Results window (using WinMerge)
The functions within the Diff viewer depend on the viewer you elect to install. See the documentation for the product you have selected for information about using the Diff viewer.
Configuring a ViewerThe Configuration Manager View and Diff functions each require a viewer application; View uses a simple text editor to show the contents of a configuration file, while the Diff function uses a Diff viewer to compare and display the differences between two configuration files.
● The View function by default uses a built-in viewer, but you can configure EPICenter to use an alternate application. You can use a viewer such as Notepad or WordPad in Windows, or vi in Linux or Solaris.
● The Diff function requires an external Difference viewer. A difference viewer displays the two configuration files simultaneously and indicate the places where they differ. You cannot use the Diff function until you have configured a viewer. You can use any Difference viewer you have installed:
■ For Windows, WinMerge, an open source viewer, is assumed as the default.
■ For Linux or Solaris, sdiff (in /usr/bin/sdiff) is assumed as the default.
To configure either of these viewers, select Difference viewer from the main EPICenter Tools menu. The Setup Viewers dialog box appears, as shown in Figure 81.
Figure 81: The Setup Viewers window
● To set up a Configuration Viewer:
EPICenter Reference Guide

Configuring the TFTP Server
a Uncheck the Use Default Configuration Viewer checkbox
b Type the path and filename of the viewer you want to use, or use the browse button (three dots) to select a viewer executable file.
● To set up a Difference Viewer, type the path and filename of the Difference Viewer, or use the browse button (three dots) to select a viewer executable file.
Configuring the TFTP ServerIf you already have a TFTP server installed on the system where the EPICenter server is running, you may choose to use that TFTP server instead of the one provided with EPICenter. The TFTP server configured through EPICenter is the one that is used for downloading and uploading from the devices.
NOTE
The Configuration Manager may cause multiple devices to contact the TFTP server at once to perform upload or download operations. Some third party TFTP servers have problems accepting multiple TFTP requests. If you are running a third party TFTP server and this happens, disable the TFTP server and use the EPICenter TFTP server.
The Configure TFTP Server function lets you enable or disable the embedded EPICenter TFTP server. Disable the embedded EPICenter TFTP server if you want EPICenter to use a different TFTP server when downloading and uploading from the devices. If you disable the embedded EPICenter TFTP server, you can also specify the root path for your TFTP server.
To configure the TFTP server, select TFTP server configuration from the main EPICenter Tools menu.
Figure 82: Configure TFTP Server window
By default, the embedded TFTP server is enabled.
● Click the Disable EPICenter TFTP Server button to disable the server.
● Click the Enable EPICenter TFTP Server button to enable the server.
The EPICenter TFTP server root is <EPICenter_install_dir>\user.war\tftp where <EPICenter_install_dir> is the directory where the EPICenter server is installed. If you are using the EPICenter TFTP server, the TFTP root directory cannot be changed.
If you want to use a TFTP server other than the EPICenter TFTP server, click the Disable EPICenter TFTP Server button, and enter the root directory of your TFTP server in the the Set TFTP Root field.
EPICenter Reference Guide 151

Configuration Manager
152
EPICenter creates six subdirectories (baselines, bootrom, configs, images, slotImages, and slotBootRom) as children of the directory you specify as the TFTP server root.
NOTE
If you change the location of the TFTP root directory after you have saved any configuration image files in any of these directories, EPICenter will no longer be able to find those files. You must copy the files from the old TFTP root location into the new directories at the new location.
NOTE
If you plan to use this TFTP server with other software, such as the ExtremeWare CLI or for any other purpose, be aware of possible differences in the expected locations of the TFTP server and other components such as ExtremeWare software images or configuration files. See the EPICenter Release Notes for information on any known issues.
Configuring and Deploying ExtremeXOS ScriptsExtremeXOS scripts are files containing CLI commands and scripting structures to be executed on Extreme devices. Any ExtremeXOS CLI command can be used in an ExtremeXOS script. ExtremeXOS scripts are supported on devices running ExtremeXOS 11.4 or later.
In an ExtremeXOS script, values for some parameters in the CLI commands are automatically substituted by the system, while other CLI command parameters can be defined within the script itself. ExtremeXOS scripting also provides control structures such as IF/THEN/ELSE and data manipulation functions. See the “CLI Scripting” chapter in the ExtremeXOS Concepts Guide for more information on ExtremeXOS script functionality and syntax.
The EPICenter Configuration Manager provides an interface for editing, managing, and deploying ExtremeXOS scripts. Using EPICenter, you can create an ExtremeXOS script, either from scratch or using a pre-configured script template, then deploy the script to selected devices. You can also view information about scripts that have been executed on Extreme devices.
Using the ExtremeXOS Script EditorTo get to the ExtremeXOS script editor, select Managed Scripts from the Scripts menu in the Configuration Manager. The Managed configuration scripts window appears, as shown in Figure 83.
EPICenter Reference Guide

Configuring and Deploying ExtremeXOS Scripts
Figure 83: Managed configuration scripts window
This window displays a table of the existing ExtremeXOS scripts on the EPICenter server. The fields in this window are as follows:
The buttons at the bottom of the window function as follows:
Search: The currently selected search filter. By default this is set to All, meaning that all of the scripts are displayed in the Filtered Scripts list below.
For: Limits the list of displayed scripts to those that match the text entered in the box.
For example, if you enter VoIP in the box, only scripts that have VoIP in their names are displayed in the Filtered Scripts table. Filtering scripts in this way is useful if you have a lot of ExtremeXOS scripts on the server.
You can further limit the list of scripts clicking the icon and selecting one or more of the following search filters:
All: Looks for the search text in all columns (the default)
Script Name: Looks for the search text in the Script Name column
Modified On: Looks for the search text in the Modified On column
Case sensitive: Performs a case-sensitive search for the text
Case insensitive: Performs a non-case-sensitive search for the text (the default)
Match from start: Specifies that the search text must start at the beginning of the column
Match anywhere: Specifies that the search text can start anywhere within the column (the default)
Script Name The filename of the ExtremeXOS script.
Modified On The modification date of the ExtremeXOS script.
EPICenter Reference Guide 153

Configuration Manager
154
The Script Editor Window
The Script Editor window is shown in Figure 84. The Script Editor window has three tabs, Purpose, Overview, and Script View.
The buttons at the bottom of the Script Editor window function as follows:
The Purpose tab contains descriptive information about the script.
Figure 84: ExtremeXOS Script Editor window (Purpose tab)
The Overview tab contains fields to enter script variables, if any are defined.
New Opens the Script Editor window with default content, allowing you to create and edit a new ExtremeXOS script. See “Creating a New ExtremeXOS Script” on page 157.
View Opens the selected ExtremeXOS script in the Script Editor window.
Diff Displays the differences between two selected ExtremeXOS scripts. See “Viewing the Differences Between Two ExtremeXOS Scripts” on page 162.
Delete Deletes the selected ExtremeXOS script from the server. See “Deleting an ExtremeXOS Script” on page 163.
Deploy Deploys (download and execute) the selected script to managed devices.
Close Closes the window.
Save Changes Saves changes to the current ExtremeXOS script.
Save As Saves the current ExtremeXOS script under a new name.
Deploy Deploys (downloads and executes) the selected script to managed devices.
Close Closes the window.
EPICenter Reference Guide

Configuring and Deploying ExtremeXOS Scripts
Figure 85: ExtremeXOS Script Editor window (Overview tab)
The Script View tab displays the script in a text editor window, where you can modify it directly.
EPICenter Reference Guide 155

Configuration Manager
156
Figure 86: ExtremeXOS Script Editor window (Script View tab)
ExtremeXOS scripts created in EPICenter contain two sections that you can edit: a metadata section and a command section. The metadata section (starting with the #@MetaDataStart line and ending with the #@MetaDataEnd line) appears at the beginning of the script, and the command section follows it.
In the metadata section, you can specify a brief and detailed description of the script and define script variables. The detailed description information appears in the Purpose tab for the script, and the variable definitions appear as input fields in the Overview tab. You can enter values for the variables in the appropriate fields in the Overview tab. The brief description appears at the top of the Overview tab.
metadata section
command section
variable definition section
EPICenter Reference Guide

Configuring and Deploying ExtremeXOS Scripts
In the command section, you enter the ExtremeXOS CLI commands and scripting structures to be executed on the device where the script is deployed. See the “CLI Scripting” chapter in the ExtremeXOS Concepts Guide for information on how to develop ExtremeXOS scripts.
Creating a New ExtremeXOS ScriptWhen you click the New... button in the Managed configuration scripts window, a Script Editor window appears, displaying a script with default content.
Figure 87: ExtremeXOS Script Editor window
By default, an ExtremeXOS script created in EPICenter contains the following items:
● A metadata section where you can enter a description of the script and define variables.
● Commands to enable and disable CLI scripting on a device.
● Commands to create a log entry when the script starts and when it finishes running.
EPICenter Reference Guide 157

Configuration Manager
158
● An error handling section consisting of ExtremeXOS scripting commands that allow you to specify what happens if the script encounters an error when it is executed. You can specify that script stop running (abort) when an error is encountered (the default), or you can specify that the script continue running and ignore errors.
● Blank space in the metadata and command sections where you can enter ExtremeXOS script code.
In the metadata section, you can edit the #@ScriptDescription line and the area between the #@DetailDescriptionStart and #@DetailDescriptionEnd lines to supply a description for the script. This description will appear in the Purpose tab. (Note the # character that begins each line in the script description area.) For example:
Figure 88: Specifying a description for an ExtremeXOS script
You can place variable definition statements in the metadata section, so that variables can be defined by entering values in the Overview tab window. For example:
EPICenter Reference Guide

Configuring and Deploying ExtremeXOS Scripts
Figure 89: Defining variables in the metadata section of an ExtremeXOS script
When you do this, the variable definition field appears on the Overview tab, as shown in Figure 90.
EPICenter Reference Guide 159

Configuration Manager
160
Figure 90: Overview tab with a variable definition field
In the command section, you can place ExtremeXOS scripting commands. The following example shows the commands for a script that creates a specified number of VLANs on a switch, with IP addresses ranging from 10.1.1.1/16 to 10.100.1.1/16.
EPICenter Reference Guide

Configuring and Deploying ExtremeXOS Scripts
Figure 91: Sample ExtremeXOS script in the Script View tab
To save the script, click the Save As... button. EPICenter prompts you for the name of the script. The extension .xsf is automatically appended to the name you specify.
EPICenter Reference Guide 161

Configuration Manager
162
Figure 92: Save Script As dialog
Editing an Existing ExtremeXOS ScriptAfter you save a script, it is added to the Filtered Scripts table. You can open the script, edit it, and save it with a new name.
To open the script, select it in the Filtered Scripts table and click the View... button (or double-click on the script name). The script is opened in the Script Editor window. To edit the script, you can either change the values for variables in the Overview tab, or you can edit the text in the Script View tab directly.
Figure 93: Editing an ExtremeXOS script from the Overview tab
When you have finished editing the script, you can save the changes to the current version of the script by clicking the Save Changes button, or you can save a copy of the script with a new name by clicking the Save As... button. When you save the script with a new name, both versions appear in the Filtered Scripts table.
Viewing the Differences Between Two ExtremeXOS ScriptsYou can view the differences between two ExtremeXOS scripts. To do this, select the scripts you want to compare in the Filtered Scripts table, then click the Diff... button. The differences between the scripts are shown in the configured Diff viewer for EPICenter.
EPICenter Reference Guide

Configuring and Deploying ExtremeXOS Scripts
EPICenter invokes the Diff viewer in a separate window, with the two files you selected displayed. Figure 94 shows an example of a differences comparison using WinMerge in Windows.
Figure 94: Viewing differences between two ExtremeXOS scripts
Viewing differences between scripts requires that you specify an external Diff viewer in EPICenter. See “Configuring a Viewer” on page 150 for information on how to set up a Diff viewer on your system and make it available to EPICenter.
Deleting an ExtremeXOS ScriptTo delete an ExtremeXOS script, select the script (or scripts) you want to delete in the Filtered Scripts table, and click the Delete button. EPICenter prompts you for confirmation before deleting the selected script(s).
Deploying ExtremeXOS ScriptsDeploying ExtremeXOS scripts to devices managed by EPICenter consists of the following tasks:
1 Select the devices where you want to execute the script.
2 Optionally customize the script parameter settings, or set script parameters for each individual device.
3 Download the script to the device(s).
4 Execute the script commands on the device(s).
EPICenter Reference Guide 163

Configuration Manager
164
NOTE
The devices to which you deploy the scripts must be running a software image that supports ExtremeXOS CLI scripting. ExtremeXOS CLI scripting is supported on devices running ExtremeXOS version 11.4 or higher. If you want to use secure communication (SSH and SFTP) to deploy scripts, ExtremeXOS version 12.0 SR1 is required. ExtremeXOS CLI scripting is not supported on ExtremeWare devices.
To deploy a script, do one of the following:
● Select the script in the Filtered Scripts table and click the Deploy button.
● View the script in the Script Editor window and click the Deploy button.
Device Selection Screen of the Deploy Script Wizard
Clicking the Deploy button starts the Deploy Script wizard. You are prompted to select the devices to which you want to deploy the script.
Figure 95: Selecting devices in the Deploy Script wizard
EPICenter Reference Guide

Configuring and Deploying ExtremeXOS Scripts
The fields in this window are as follows:
From this window, do the following:
1 Select a device group or All Devices from the drop-down menu in the Device Groups field.
2 Select one or more devices device from the Device list presented.
3 Click the Next button to continue to the next screen.
Script Customization Screen of the Deploy Script Wizard
After you select the devices where you want to deploy the script, the script customization screen is displayed. The script customization screen shows the contents of the script in the Profile, Overview, and Script View tabs. On this screen, you can optionally make changes to the script parameters before the script is deployed.
Figure 96: Script customization screen in the Deploy Script wizard
Device Groups: Device group from which to select the device for ExtremeXOS script deployment. Determines the devices shown in the Device list. Select All Devices from the drop-down menu to include all devices in the Device list.
Choose Specifies the device(s) in the Device list where the ExtremeXOS script is to be deployed. If the managed device is running a software image that does not support ExtremeXOS CLI scripting, then the device is grayed-out in the list and cannot be selected.
Name The name of the managed device
IP Address The IP address of the managed device
EPICenter Reference Guide 165

Configuration Manager
166
The fields in this window are as follows:
When you have finished making changes on the script customization screen, click the Deploy button to deploy the script to the selected devices.
Deployment Results Screen
The deployment results screen shows the progress of the script as it is deployed on each device, and reports the result of the deployment process.
Script Parameters Allows you to specify whether the ExtremeXOS script should be applied identically on all of the selected devices (the default), or if the script should use custom parameter settings when run on each device.
For example, you can configure the script to create 255 VLANs on all of the selected devices, or you can configure the script to create 50 VLANs on one device, 100 VLANs on another device, and so on.
To do this, select the “Customize parameter per device” option, select a device from the Device list, and modify parameter settings in the Overview tab of the Configuration Script section.
Configuration Script Shows the script in the Script Editor interface. Here you can optionally make changes to the script parameters before the script is deployed.
You can modify the parameter settings in the Overview tab only; you cannot modify the text in the Profile or Script View tabs.
Other options Contains optional settings for the ExtremeXOS script:
• A filename under which the script is saved on the device where it is deployed.
• Whether the script is executed after it is downloaded to the selected devices. By default, the script is executed after it is downloaded to a device.
• If the script is executed after it is downloaded, you can also select whether to save the configuration and/or delete the script from the device after execution. The previous configuration file is saved as snapshot.cfg.
• The number of seconds allotted for execution of the script on the device. If the script has not completed after this number of seconds, it is halted.
EPICenter Reference Guide

Configuring and Deploying ExtremeXOS Scripts
Figure 97: Deployment results screen in the Deploy Script wizard
The fields in this window are as follows:
After the script deployment is completed, click Finish to exit the Deploy Script wizard.
Script Deployment Results Log File
A log of the script deployment results for the device is stored on the EPICenter server in the following location:
<tftp-server-root>\scripts\<device-ip-address>\<script-name>.log
The <tftp-server-root> is by default <EPICenter_install_dir>\user.war\tftp where <EPICenter_install_dir> is the directory where the EPICenter server is installed. If the script could not be downloaded to the device, no script deployment results log is generated.
Name The name of the device(s) where the script was deployed. To view script deployment details for a device, select the device name in the list.
IP Address The name of the device(s) where the script was deployed.
Deployment Result Whether the script was deployed on the device successfully or unsuccessfully
Details Information about the script deployment on the selected device. The last 2,000 lines of the deployment results are displayed in the Details box.
You can save the text in the Details box to file by clicking the Save button and specifying a filename
EPICenter Reference Guide 167

Configuration Manager
168
EPICenter Reference Guide
8 The Firmware Manager
This chapter describes how to use the EPICenter Firmware Manager feature for:
● Downloading a new software image to one or more Extreme Networks devices.
● Downloading a BootROM image to one or more Extreme Networks devices.
● Downloading a new Slot software image to one or more modules on an Extreme Networks device.
● Downloading a BootROM image to one or more modules on an Extreme Networks device.
● Specifying a software image as the “recommended” image. The Firmware Manager compares the image currently running in a switch to determine if the switch is running the recommended or most current image.
● Retrieving the latest software images from Extreme Networks.
● Performing a multi-step upgrade to upgrade software and BootROM images on Extreme i-series devices.
Overview of the Firmware ManagerThe EPICenter Firmware Manager feature provides a graphical interface for managing versions of ExtremeWare and ExtremeXOS software images and BootROM images, and upgrading Extreme devices as appropriate. The Firmware Manager provides a framework for storing image and BootROM files, and allows tracking of multiple versions. It also provides an automated function that can check the Extreme web site and indicate when newer versions of these files are available.
Firmware Manager FunctionsThere are multiple ways to invoke the functions provided by the Firmware Manager:
● Selecting an option from the Firmware > Tasks menu on the main EPICenter Tools menu
● Selecting a device in Network Views, then selecting Firmware from the Device menu
● Using the menus at the top of the main Firmware Manager frame
● Selecting Firmware manager from the Network Administration folder
For simplicity, most of the instructions in this chapter only specify one method of invoking a function (usually the function button).
EPICenter Reference Guide 169
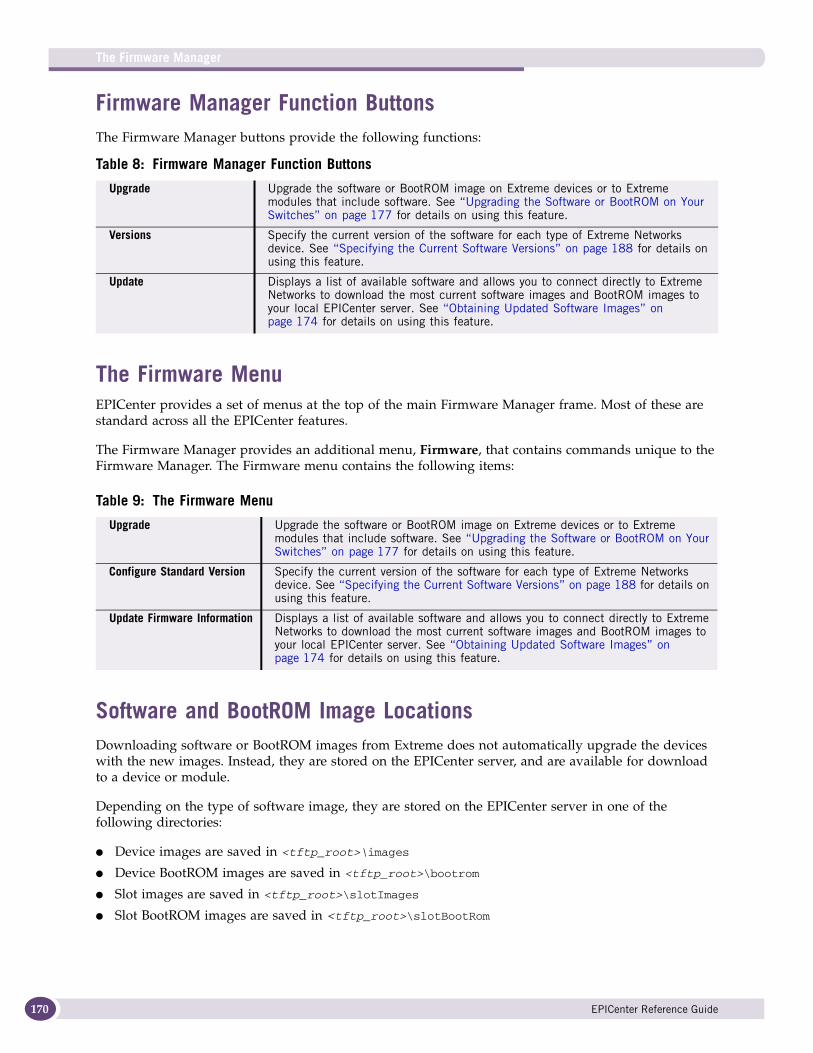
The Firmware Manager
170
Firmware Manager Function ButtonsThe Firmware Manager buttons provide the following functions:
The Firmware MenuEPICenter provides a set of menus at the top of the main Firmware Manager frame. Most of these are standard across all the EPICenter features.
The Firmware Manager provides an additional menu, Firmware, that contains commands unique to the Firmware Manager. The Firmware menu contains the following items:
Software and BootROM Image LocationsDownloading software or BootROM images from Extreme does not automatically upgrade the devices with the new images. Instead, they are stored on the EPICenter server, and are available for download to a device or module.
Depending on the type of software image, they are stored on the EPICenter server in one of the following directories:
● Device images are saved in <tftp_root>\images
● Device BootROM images are saved in <tftp_root>\bootrom
● Slot images are saved in <tftp_root>\slotImages
● Slot BootROM images are saved in <tftp_root>\slotBootRom
Table 8: Firmware Manager Function Buttons
Upgrade Upgrade the software or BootROM image on Extreme devices or to Extreme modules that include software. See “Upgrading the Software or BootROM on Your Switches” on page 177 for details on using this feature.
Versions Specify the current version of the software for each type of Extreme Networks device. See “Specifying the Current Software Versions” on page 188 for details on using this feature.
Update Displays a list of available software and allows you to connect directly to Extreme Networks to download the most current software images and BootROM images to your local EPICenter server. See “Obtaining Updated Software Images” on page 174 for details on using this feature.
Table 9: The Firmware Menu
Upgrade Upgrade the software or BootROM image on Extreme devices or to Extreme modules that include software. See “Upgrading the Software or BootROM on Your Switches” on page 177 for details on using this feature.
Configure Standard Version Specify the current version of the software for each type of Extreme Networks device. See “Specifying the Current Software Versions” on page 188 for details on using this feature.
Update Firmware Information Displays a list of available software and allows you to connect directly to Extreme Networks to download the most current software images and BootROM images to your local EPICenter server. See “Obtaining Updated Software Images” on page 174 for details on using this feature.
EPICenter Reference Guide

Firmware Manager Functions
<tftp_root> is the location of the TFTP server. By default, <tftp_root> is <EPICenter_install_dir>\user.war\tftp.
In the Windows operating environment, <EPICenter_install_dir> is c:\Program Files\Extreme Networks\EPICenter 7.0. In the Solaris environment, <EPICenter_install_dir> is /opt/ExtremeNetworks/EPICenter7.0.
NOTE
Only software and BootROM images stored locally on the EPICenter server can be used to upgrade a device or module through the EPICenter Firmware Manager.
The Firmware Manager Main WindowTo start the Firmware Manager feature, expand the Network Administration folder and click Firmware Manager. (see Figure 98)
Figure 98: Firmware Manager showing summary status for a device group
● Click All devices to display Summary Status for all devices, or click Device group and specify a device group in the box to see Summary Status for the devices in the group. The table displays the following information:
EPICenter Reference Guide 171

The Firmware Manager
172
● Select a device, then select Firmware from the right-click menu to see status for the individual device (see Figure 99).
The main area of the window displays information about any modules installed in the device that include a version of ExtremeWare or ExtremeXOS. If a device does not contain any modules, or the modules do not require an OS, then this area will be empty.
Stacking Device SupportStacking devices running ExtremeWare 7.4 or later and ExtremeXOS 12.0 or later are handled as if they are slots; displaying status for the stack master shows the stack members as if they are modules.
Name The name of the device
IP Address The IP address of the device
Software Versions The version number of the software image on the device.
• If the software on the device matches the version you have designated as the standard version for this device type, the column also displays a green check.
• If the version does not match the standard version, the column displays a red X.
• If no standard version has been specified, no indicator is shown. See “Specifying the Current Software Versions” on page 188 for more information on specifying standard versions.
Software Obsolete A red X indicates that this software version is considered “obsolete,” meaning it has been superseded by a newer General Availability release. If you have Automatic Information Updates enabled, EPICenter checks the Extreme Networks web site once every 24 hours for the newest version information.
BootROM Versions The version number of the BootROM software
BootROM Obsolete A red X indicates that this BootROM version is considered “obsolete,” meaning it has been superseded by a newer General Availability release.
EPICenter Reference Guide

Firmware Manager Functions
Figure 99: Firmware Manager showing summary status for a stacking device
In the bottom portion of the window, basic information about the device is shown: the device status, IP address, device type, and the current software and BootROM versions.
The device summary table displays the following information about slots in the device:
Slot The slot number of the module or stack member (ExtremeWare 7.4 or later, ExtremeXOS 12.0 or later).
Type The type of module or stack member (ExtremeWare 7.4 or later, ExtremeXOS 12.0 or later).
Software Versions The version number of the software image on the module, and whether it is an SSH-capable release.
Obsolete A red X indicates that this software version is considered “obsolete,” meaning it has been superseded by a newer General Availability release. If you have Automatic Information Updates enabled, EPICenter checks the Extreme Networks web site once every 24 hours for the newest version information.
BootROM Versions The version number of the BootROM software on the module
Obsolete A red X indicates that this BootROM version is considered “obsolete,” meaning it has been superseded by a newer General Availability release.
EPICenter Reference Guide 173
The Firmware Manager
174
Obtaining Updated Software ImagesIn order to upgrade your devices, you must have the new software or BootROM image stored locally on the EPICenter server. If you have a support contract with Extreme, you can download software and BootROM images from Extreme to your local EPICenter server.
The Display Software Images Updates window displays a list of the available software on the Extreme server, and allows you to connect directly to Extreme Networks to download the most current software images and BootROM images to your local EPICenter server. After you download the new images, you can use the images to upgrade your managed devices and modules.
NOTE
Before you can download the software images, you must have a current support contract as well as a user name and password to obtain access to the Extreme Networks server.
NOTE
You cannot download SSH-capable versions of the software images using the Firmware Manager’s image update feature. You must obtain SSH-capable images outside of EPICenter, and place them in the images or slotImages subdirectories (see “Software and BootROM Image Locations” on page 170). SSH-capable images are subject to export restrictions, and require a special license. To request SSH code, contact Technical Support.
For ExtremeXOS, modular software packages also cannot be downloaded using the Firmware Manager’s image update feature. You must also obtain those images outside of EPICenter, and place them in the images or slotImages subdirectories
Downloading the software or BootROM images from Extreme Networks does not automatically upgrade the devices with the new images—it just stores them with the EPICenter server.
Obtaining New Software ImagesTo obtain a current software image select the Update command from the Firmware menu. This opens the Display Software Images Updates window, as shown in Figure 100.
You can also access the Display Software Images Updates window by clicking the Display Updates... button from the Upgrade Wizard window, or from the Select Software Image window as described in the section, “Specifying the Current Software Versions” on page 188.
NOTE
If you declined to enable Automatic Information Updates when you installed the EPICenter server, the list of images in this display may not reflect the most current versions available from Extreme Networks. You can enable information updates in EPICenter Administration, through the External Connections server properties.
EPICenter Reference Guide

Obtaining Updated Software Images
Figure 100: Display Software Images Update window
The columns in this window show the following information:
Change Whether this image has changed since the last time the software information was updated. A green check indicates there is a new version available. A red X indicates there have been no changes. When you display image updates for the first time, all images are marked as changed.
Version The version number of the software.
Type Whether the image is a version of device or slot software or a version of device or slot BootROM software.
Name The name of the software build.
Status The release status of the software: whether the software is a General Availability software release or Obsolete (meaning it has been superseded by a newer General Availability release). If you have Automatic Information Updates enabled, EPICenter checks the Extreme Networks web site once every 24 hours for the newest version information.
Present Whether this version of software is available on your local system.
• A red check indicates that the software has not been downloaded from Extreme Networks.
• A green check indicates the software is available on the EPICenter server in on of the directories: <tftp_root>\images, <tftp_root>\bootrom, <tftp_root>\SlotImages, or <tftp_root>\slotBootRom.
<tftp_root> is the location of your TFTP server; by default this is <EPICenter_install_dir>\user.war\tftp
Description Provides a description of the software. Use the description information to determine the type of device or module the software is intended for.
Supported Hardware When an image is selected, the column shows the hardware types (device or slot type) on which the image can be installed.
EPICenter Reference Guide 175

The Firmware Manager
176
To download new images to the EPICenter server:
1 Select the device or slot images you want to update. You can select more than one image.
2 Click Download.
A Login window for the Extreme download web site appears, as shown in Figure 101.
Figure 101: Login to Remote Server window
3 Type your Extreme Support user name in the User Name field and password in the Password field to access the Extreme server, and click OK.
NOTE
You must have a current support contract and an e-Support user name and password to obtain access to the Extreme Networks server.
A message window appears showing the progress of the downloads you have requested to the EPICenter server. Figure 102 shows an example of this window. Click OK when the downloads have completed.
Figure 102: Messages from Server window showing image update progress
Acknowledging the Version ChangesOnce you have downloaded the software versions of interest to you, you can accept and acknowledge the list of software image updates: this changes any green checks in the Change column to red X’s. A red X indicates that the version shown in the Software Image list has not changed since the last time you viewed and acknowledged the list. Thereafter, green checks will appear only when you update the software information list and changes in the list are detected—the changed images will be indicated with a green check.
EPICenter Reference Guide

Upgrading the Software or BootROM on Your Switches
Checking for Version AvailabilityTo check for the availability of new software versions and update the list, click Update Software Information. This queries the Extreme server and updates the list in the Software Image field. Any versions that have changed since you last acknowledged the update list now show a green check to indicate the change.
Upgrading the Software or BootROM on Your SwitchesExtreme Networks software images contains the executable code that runs on the switch and on certain Extreme modules that include software. An image comes pre-installed from the factory on every switch and on certain modules. You can upgrade this image by downloading a new version to the switch through the Firmware Manager. You can download the image into either the primary or secondary image, and specify whether the switch should be rebooted to immediately use the new image.
The BootROM software initializes certain important switch variables during the switch or module boot process.
CAUTION
If a BootROM upgrade does not complete successfully, it could prevent the switch from booting.
EPICenter provides an Upgrade Wizard to help you select and download a new software image or BootROM image to a device or a module.
When you perform a software image upgrade, EPICenter automatically creates a backup of your existing switch configuration. Switch configuration files for ExtremeWare are saved as text files in the <tftp_root>\configs directory and configuration files for ExtremeXOS (along with Policy files, if any) are stored as zip files in the same location. <tftp_root> is the location of the TFTP server, by default <EPICenter_install_dir>\user.war\tftp. See Chapter 7 “Configuration Manager” for more information on where and how configuration files are stored, and how to restore them to a device if necessary.
If you specify an upgrade to an image that is several revisions newer than the image running on the switch, you may need to perform a multi-step upgrade; upgrade to an intermediate version before you can upgrade to the more recent version. For “i-series” switches, the Upgrade Wizard evaluates the switch and images you have specified, and will inform you if a multi-step upgrade is required. If a multi-step upgrade is needed, EPICenter will inform you of the BootROM and image upgrades you must perform to bring the switch to the version you have specified, and will proceed to perform the first of those steps.
EPICenter evaluates your image and switch selections after the Upgrade Wizard’s Hardware Selection step. Even if you know you need to perform a multi-step upgrade, you should proceed through the Image Selection and Hardware Selection steps described in the following sections.
EPICenter also supports the Hitless upgrade feature on a BlackDiamond chassis under certain conditions. Hitless upgrade allows an ExtremeWare software upgrade on a BlackDiamond 6800 series chassis, or an ExtremeXOS upgrade on a BlackDiamond 10K without taking it out of service or losing traffic. The
EPICenter Reference Guide 177

The Firmware Manager
178
Upgrade Wizard presents the Hitless upgrade as an option when you specify an upgrade on a BlackDiamond that meets the following conditions:
● A BlackDiamond running ExtremeWare 7.1.1 or later, with BootROM 8.1 or later and 2 MSMs installed.
● A BlackDiamond 10K running ExtremeXOS 11.1 or later with 2 MSMs installed.
Hitless upgrade is supported for BootROM images as well. You can perform a hitless BootROM upgrade for BlackDiamond 10K switches running ExtremeXOS 11.1 or later that have 2 MSMs installed.
Upgrading a Stacking Device
For Extreme Networks devices that support stacking, the Upgrade Wizard allows you to upgrade the images for the stack master and for individual stack members, as needed. The stack master must be upgraded in a separate operation, using the appropriate device image for the stack master device type. Stack members can be upgraded individually or in groups, using the slot image version of the current device image.
Upgrading Your Switches Using the Upgrade WizardThe Upgrade Wizard helps manage the upgrade process for both software images and BootROM images, for either devices or modules. The Wizard will check to ensure that the requested software or BootROM image is appropriate and compatible with the devices or modules selected for the upgrade.
To download a new software or BootROM image to an Extreme device or module, select Upgrade from the Firmware menu.
Image SelectionThe Image Selection page of the Upgrade Wizard appears, as shown in Figure 103.
EPICenter Reference Guide

Upgrading the Software or BootROM on Your Switches
Figure 103: Upgrade Wizard, Image Selection page
The Software Image table shows you the images that are available on the EPICenter server to be used to upgrade your managed devices.
The fields in the Software Image table show the following:
When you select an image in the Software Image table, the Supported Hardware column to the right displays the hardware models on which the selected image is supported.
● If the software image you need is not listed in the Software Images table, you can click Display Updates... to open the Display Software Images Updates window, where you can download a software image or determine if newer versions of the images are available. See “Obtaining Updated Software Images” on page 174 for more information.
To begin the upgrade process, do the following:
1 Select an image in the Software Images table. You can only upgrade using one image at a time.
2 Click Next>> to go to the next page of the Upgrade Wizard.
NOTE
For stacking devices running ExtremeWare 7.4, ExtremeWare 7.5, or ExtremeWare 7.6, stack members are treated as if they are modules, and therefore are updated using the appropriate Slot Image. To upgrade the stack master, select the Device Image for that switch type; to upgrade a stack member, select the Slot Image for that switch type. From
Type Whether the image is a version of device or slot software or a version of device or slot BootROM software.
Name The name of the software build.
Version The version number of the software.
Status The release status of the software: whether the software is a General Availability software release.
Description Provides a description of the software. Use the description information to determine the type of device or module the software is intended for.
EPICenter Reference Guide 179

The Firmware Manager
180
ExtremeWare 7.7, to upgrade the images of all devices in the stack, select the Device Image for the stack master. The stack members will also be upgraded.
From ExtremeXOS 12.0, you can upgrade the images of all devices in the stack from the stack master. To upgrade all devices, select the Device Image for the stack master. The image upgrade is allowed only for non-current partition. The image upgrade on individual slots can be on current partition.
Hardware Selection Normally, the next page to appear is the Hardware Selection page of the Upgrade Wizard, as shown in Figure 105. This is the normal case for images and BootROM releases that have General Availability status, as EPICenter knows which devices are supported. You will then be able to select among the devices supported by the image.
If, however, EPICenter does not recognize the image, a Supported Hardware Selection page may appear, as shown in Figure 104. This may occur if you have obtained a Beta or Controlled Ramp release image, or if the image has been newly released as a General Availability release, and EPICenter does not yet recognize the release.
If the image you selected is one that EPICenter recognizes as associated with a set of supported device types, the Supported Hardware page does not appear. The next page you see is the Hardware Selection page.
NOTE
If the Supported Hardware Selection page appears when you do not expect it, go back to the Image Selection page and verify that you have selected the image you intended. Refer to the latest EPICenter Release Note for information on images that may require special handling.
The Supported Hardware Selection page
If the Supported Hardware Selection page appears, it means that EPICenter does not recognize the image you have selected, and does not know what type of hardware is supported by that image. This can occur if you have obtained a Beta or Controlled Ramp release image, or if the image has been newly released as a General Availability release.
On the Supported Hardware page, EPICenter presents a list of all the hardware types it thinks may be appropriate, and you can either select a hardware type from the list, or you can simply click Next>> to move to the Hardware Selection page of the Upgrade Wizard.
CAUTION
EPICenter will not prevent you from proceeding with the upgrade, even if you select an image and a hardware type that are incompatible. If the Supported Hardware Selection page appears when you did not expect it, you should go back to the image selection page and verify that you have selected the correct image for the hardware you want to upgrade.
EPICenter Reference Guide

Upgrading the Software or BootROM on Your Switches
Figure 104: Upgrade Wizard, Supported Hardware Selection page
● If you select an item from the hardware list, EPICenter will assume the hardware type is supported by the image, and will display only devices of that type as being eligible for upgrade.
● If you simply select Next>>, you will be able to select and upgrade any device shown in the component tree.
NOTE
If you want to have EPICenter recognize a non-standard image, contact Extreme Networks Technical Support. They can help you create or obtain a supplemental software image list file.
The Hardware Selection Page
This page lets you select the devices you want to upgrade with the image you selected on the first page of the Upgrade Wizard.
EPICenter Reference Guide 181

The Firmware Manager
182
Figure 105: Upgrade Wizard, Hardware Selection page
The two fields at the top of the page show the name of the image you selected, and the type of the image (Device Image, Device BootROM, Slot Image, or Slot BootROM).
If you have selected a Device Image or Device BootROM, the Select devices to be upgraded list shows devices that can be upgraded to the image you selected. As long as EPICenter recognizes the image, only devices that are supported by that image are shown in this list. You can select a device group in the Component Tree to the left to display devices from specific device groups.
If you selected a Slot Image or Slot BootROM, then you must select a device in the Component Tree on the left in order to see a list of slots that can be upgraded.
The Select devices to be upgraded list shows the following information:
Category The device category, used to indicate devices that can be upgraded at the same time. Categories are indicated by letter: A, B, C etc. Devices in the same category can be upgraded together; for example, multiple devices in category A can be selected for upgrade together, but devices in category B cannot be upgraded in the same operation as devices in category A.
Device The name and/or IP address of the device
Device Type The type of the device
Slot The slot number of the module (shown if the image is a slot image).
Image The image currently running on the device or module
BootROM The version of the BootROM running on the device or module
Standard Image The version you have specified as the standard version in the Versions list for devices or modules of this type. If you have not specified a software version in the Versions window, this is blank.
EPICenter Reference Guide

Upgrading the Software or BootROM on Your Switches
1 Select the Device Group in the Component Tree to display a list of devices you can upgrade. If you are upgrading a module, select a device in the Component Tree to display the modules on that device that you can upgrade.
NOTE
If the list is empty, it means there are no devices present in the Device Group that can be upgraded to the image you have selected. If this happens, click <<Back and make sure you have selected the correct image for the device you intended to upgrade.
2 Select the devices or modules you want to upgrade, then click the Add-> button.
If you want to upgrade the images on all the displayed devices or modules, click the Add All-> button.
The devices or modules you select are moved to the Upgrade image on the following devices list.
To remove devices from the Upgrade image on the following devices list, use the <-Remove or <-Remove All buttons.
3 If a device you select is currently running a BootROM that may be incompatible with the Device Image you have selected to upgrade to, a warning pops up.
Click Yes to proceed with the upgrade anyway, or No to cancel it.
NOTE
Some upgrades, such as the upgrade from ExtremeWare 6.1e or 7.1e to 7.3e for the Summit 200 24/48, require a special image and steps. If the upgrade is one that requires special operations, an error message is displayed stating that the upgrade will not be performed.
4 Click Next>> to go to the next page of the Upgrade Wizard.
If you want to select a different software or BootROM image, click <<Back to return to the Image Selection page.
NOTE
If you specify an upgrade to an image that is several revisions newer than the image running on the switch, you may need to first upgrade to an intermediate version before you can go to the more recent version. If the device you are upgrading is an “i-series” switch, EPICenter evaluates the switch to determine if it can perform a multi-step upgrade. In this case, a message pop-up informs you that a multi-step upgrade is required, and the upgrade wizard displays a Multi-step Upgrade page instead of going directly to the Operation Selection page.
If a multi-step upgrade is indicated, see “Performing a Multi-Step Upgrade” on page 185 for a discussion of the information provided in the multi-step upgrade page.
Operation Selection If you are performing a device or slot image upgrade, the Operation Selection page of the Upgrade Wizard appears. Figure 106 shows one version of this page. The options that you see on this page may differ depending on the details of the upgrade you have requested.
If you have requested a BootROM upgrade, you can specify whether it should be hitless or non-hitless.
If a multi-step upgrade is required, this page appears after the Multi-Step Upgrade page.
EPICenter Reference Guide 183

The Firmware Manager
184
Figure 106: Upgrade Wizard, Operation Selection page
On this page you specify where the image should be placed, and whether the device should be rebooted. In some cases you can specify a delay before the reboot occurs. The options you are presented depends on the type of upgrade you are performing. The options are:
1 Select the destination and reboot options you want.
2 Click Next>> to go to the next page of the Upgrade Wizard.
If you want to select different hardware for the upgrade, click <<Back to return to the Hardware Selection page.
Upgrade Options (Appears only if the selected device supports the Hitless upgrade feature)
Upgrade Select if you want to do a standard (not Hitless) upgrade
Hitless Upgrade Select whether this should be a Standard or Conservative upgrade
Destination
Download to: Select whether the download should be to the Current, Non-Current, Primary or Secondary image.
For ExtremeXOS based SummitStack switches in a stack, the value will always be Non-Current.
Reboot Options
Do not Reboot after download
No reboot should be done on the device
Reboot immediately after download
The device should be rebooted immediately after the download has completed
Reboot after Type a number between 1-72 to specify the reboot should be delayed for the specified number of hours. This option is not available for all upgrade types.
Download configuration after upgrade
Download the saved configuration after the image download and reboot has completed. This option is not available for all upgrade types.
EPICenter Reference Guide

Upgrading the Software or BootROM on Your Switches
Upgrade Preview This page displays the choices you have made for the upgrade.
Figure 107: Upgrade Wizard, Upgrade Preview page
The top portion of the page shows the selected image (device or slot image) or BootROM, the destination and reboot options, and whether the configuration file should be downloaded after the image upgrade.
The Partition to use after reboot field shows the partition that will be used upon reboot—this will always be the same partition as the destination of the image. For ExtremeWare devices, this will be the partition you selected as the image destination. For ExtremeXOS devices, the image always goes to the non-current partition. (However, for a modular upgrade, you can specify the location).
The Upgrade on the following devices list shows the devices you have selected for upgrade.
You cannot make changes to these choices on this page, but you can use the <<Back button to return to the previous pages of the wizard to change your selections.
If the settings are correct, click Finish to proceed with the upgrade.
If the images do not require a multi-step upgrade, the upgrade proceeds without any additional prompts. A Messages From Server window shows the progress of the upgrade on the selected devices. This is the original behavior. When finished, the devices reboot according to the setting of the Reboot Options.
Performing a Multi-Step UpgradeEPICenter allows you to perform a procedure called a multi-step upgrade. Using the multi-step upgrade EPICenter automatically determines the appropriate upgrade path for both the device BootROM and image. EPICenter compares the desired (destination) image and BootROM versions to the existing
EPICenter Reference Guide 185

The Firmware Manager
186
(source) image and BootROM versions loaded on the switch to determine what intermediate steps, if any, are required.
Only Extreme Networks “i-series” switches are evaluated for a multi-step upgrade. Extreme devices that are not part of the “i-series” can be upgrade only using a single step method.
NOTE
For more information on upgrading your Extreme switch, see the Release Notes for the software.
Upgrade Logic
The multi-step upgrade feature uses the following logic:
● If the destination image version is greater than or equal to ExtremeWare version 6.1.9, first check the BootROM version. The BootROM version must be at least Boot 7.6, if not, upgrade the BootROM to Boot 7.6.
● If the source software image version is less than ExtremeWare version 6.1.9 and the destination image is greater than ExtremeWare version 6.1.9, upgrade the software image version to ExtremeWare version 6.1.9.
● If the source software image version is less than ExtremeWare version 6.2.2 and the destination image version is greater than ExtremeWare version 6.2.2, upgrade the device to ExtremeWare version 6.2.2.
● If the destination software version is greater than or equal to ExtremeWare version 7.0.0, first check the BootROM version. The BootROM version must be at least Boot 7.8, if not, upgrade to Boot 7.8.
● The final step is to upgrade to the destination software image version. This fulfills the requirement to upgrade the software image version to ExtremeWare version 6.1.9, ExtremeWare version 7.0.0, or other version range.
Obtaining the Image and BootROM VersionsBefore you perform a multi-step upgrade, make sure that you have all of the required image and BootROM versions available on your EPICenter server. To get the image and BootROM versions, use the Live Update feature, as described in “Obtaining Updated Software Images” on page 174.
The Multi-Step Upgrade ProcedureFor “i-series” switches, EPICenter will automatically evaluate the selected images and devices to determine if multiple upgrade steps are required. Therefore, in the Image Selection page, you should select the image you want to have installed at the end of the entire multi-step process.
A multi-step upgrade involves upgrading the switch multiple times in order to get from the source software image version to the destination software image version. EPICenter performs the upgrade procedure for each iterative step along the way.
For each iterative upgrade to the device during a multi-step upgrade, the Upgrade Wizard performs the following tasks:
● Backs up the current device configuration.
● Performs the current upgrade (downloads the appropriate image).
● Reboots the device.
EPICenter Reference Guide

Upgrading the Software or BootROM on Your Switches
● If this was a software image upgrade, restores the device configuration and reboots the device again.
● Synchronizes the device and the EPICenter database.
NOTE
When the device reboots, the EPICenter server waits until the device reboot is complete and the device has loaded its configuration file. If the device reboot time is longer than the EPICenter server time-out period, the EPICenter server sync operation may time out. If this occurs, you should do another sync.
At the end of a successful iteration, you must restart the Upgrade Wizard to initiate the next upgrade step. Again at the Image Selection page you select the final image you want installed so that EPICenter can calculate the remaining upgrade steps needed.
If a multi-step upgrade is required, the EPICenter Upgrade Wizard displays a Multi-Step Upgrade page, similar to that shown in Figure 108, after the Hardware Selection step.
Figure 108: The Multi-step Upgrade step
This page shows you the steps EPICenter has determined are necessary to upgrade the device(s) from the current image to the image you have selected for download. It also indicates the upgrade that the Upgrade Wizard will perform during this iteration of the multi-step upgrade.
In the right-hand panel, the wizard provides more details about the set of steps that must be performed to accomplish the complete upgrade.
EPICenter Reference Guide 187

The Firmware Manager
188
NOTE
EPICenter performs only one upgrade at a time; if multiple steps are needed, you must initiate the upgrade process again after each successful iteration, until the final image has been installed.
To proceed with the upgrade EPICenter has proposed for this step, click Next>>.
The Operation Selection page of the Upgrade Wizard will appear, with the appropriate options selected (a device reboot, and a configuration download if this is a software image upgrade).
If you do not want to use the multi-step upgrade procedure and, instead, want to force EPICenter to perform a single-step upgrade from your current software image version to your desired software image version, click Skip Multi-Step Upgrade. Skipping the multi-step upgrade will upgrade directly to the specified version.
CAUTION
If you select Skip Multi-Step Upgrade, be sure that you fully understand all upgrade procedures. Skipping the multi-step upgrade procedure may cause an error on the device and can cause the upgrade to fail.
After you upgrade the device(s), you should check each device configuration to be sure that the new image has been properly loaded. You should also make any config
For more information on verifying the device, see the ExtremeWare Release Notes.
Specifying the Current Software VersionsThe Versions window lets you specify the current version of the software for each type of Extreme Networks device.
This information is used by the EPICenter software to determine whether an individual device is running the version you have specified as the “standard version.” This is the version that appears in the Standard Image column in the Hardware Selection page of the Upgrade Wizard. It is also used to determine whether the image on a device matches the standard version as indicated by a check or an X in the Software Versions and BootROM Versions column in the main Firmware Manager display.
Click the Versions button at the top of the Firmware Manager window to display the Configure Standard version window, as shown in Figure 109.
EPICenter Reference Guide

Specifying the Current Software Versions
Figure 109: Configure Standard version window
To select a software version for a particular device type, type in the software version or click the Configure Version... button to display the Select Software Image window, as shown in Figure 110.
Figure 110: Select Software Image window
Select the version that you want to be standard for the selected device type across your network and click OK.
If the software image you want is not shown in the Software Images list, you can click Display Updates... to open the Display Software Images Updates window, where you can download a software
EPICenter Reference Guide 189

The Firmware Manager
190
image or determine if newer versions of the images are available. See “Obtaining Updated Software Images” on page 174 for more information.
EPICenter Reference Guide

9 Creating and Executing EPICenter Scripts
This chapter describes the scripting functionality built in to EPICenter, and how you can use EPICenter to create scripts and execute them on managed devices.
EPICenter Script OverviewEPICenter scripts are files containing CLI commands, control structures, and data manipulation functions. EPICenter scripts can be executed on one or more devices: simultaneously on multiple devices, or on one device at a time.
EPICenter scripts are similar to ExtremeXOS scripts in that they are collections of ExtremeXOS CLI commands and control structures. EPICenter scripts add some additional commands that are specific to EPICenter.
In general, EPICenter scripts support syntax and constructs from the following sources:
● ExtremeXOS 12.1 CLI commands
ExtremeXOS CLI commands in an EPICenter script are sent to the device, and the response can be used by the script.
● ExtremeXOS 12.1 CLI scripts
Control structures such as IF..ELSE and DO..WHILE can be used in EPICenter scripts. See the “CLI Scripting” chapter in the ExtremeXOS Concepts Guide for more information on ExtremeXOS script functionality and syntax.
● The Tcl scripting language version 8.1
See http://www.tcl.tk for a list of Tcl commands supported in EPICenter scripts. Some Tcl commands are not supported in EPICenter scripts. See “Tcl Support in EPICenter Scripts” on page 210 for a list of blocked Tcl commands.
Syntax and constructs from these sources work seamlessly within EPICenter scripts. For example, the response from a switch to an ExtremeXOS CLI command issued from a script can be processed using Tcl functions.
Bundled EPICenter ScriptsEPICenter includes a number of sample scripts that you can use as templates for your own EPICenter scripts. These scripts perform such tasks as downloading firmware, uploading/downloading configuration files, and configuring VLANs.
The sample scripts included with EPICenter are available to users with an Administrator role. The XML source files for the scripts are located in the <EPICenter_install_dir>/user/scripting/bundled_scripts/xml directory.
EPICenter Reference Guide 191

Creating and Executing EPICenter Scripts
192
The EPICenter Script InterfaceTo display the scripts configured in EPICenter, expand the list of items in the Network Administration folder, and click Scripts. Figure 111 shows the Scripts View.
Figure 111: EPICenter Scripts View
The table of scripts in the Scripts View contains the following columns:
The Scripts table lists all of the scripts configured in EPICenter. To the right of the Scripts table is a view of the selected script. You can double click a script to open it in the Script Editor window, which is shown in Figure 112.
Category The script category, if configured. See “Categorizing Scripts” on page 203.
Name The name of the script.
Comments Comments or a description of the script.
Modified by Who last modified the script.
Date Modified When the script was last modified.
Associated with an alarm Whether the script is associated with an alarm action.
EPICenter Reference Guide

Managing EPICenter Scripts
Figure 112: EPICenter Script Editor Window
The EPICenter Script Editor is where you can add content to a script, set values for parameters, specify runtime settings, and indicate which EPICenter users can run the script.
The following tabs appear in the EPICenter Script Editor window:
Managing EPICenter ScriptsThis section explains how to do the following tasks:
● Create an EPICenter script
● Specify run-time settings for a script
● Specify permissions and menu locations within EPICenter for a script
● Run a script on one or more managed devices, with device-specific parameters
Overview Displays fields to enter script parameters. The contents of this tab is derived from the metadata specified in the script.
Content Displays the script in a text editor window, where you can modify it directly.
Description Contains descriptive information about the script. The script description is specified in the metadata section of the script.
Run-time Settings Specifies script settings that are applied when the script is run.
Permissions and Menus Specifies which kind of EPICenter users can run the script, and whether an option to run the script should appear in the Network Views menu or in a shortcut menu.
EPICenter Reference Guide 193

Creating and Executing EPICenter Scripts
194
Creating a New EPICenter ScriptTo create a new EPICenter script, select New > Script from the EPICenter File menu. A Script Editor window appears, displaying a script with default content.
Figure 113: EPICenter Script Editor Window
By default, a new script created in EPICenter contains a metadata section where you can enter a script description and define script sections and metadata that appears on the Overview tab. See “Metadata
EPICenter Reference Guide

Managing EPICenter Scripts
Tags” on page 205 and “EPICenter-Specific System Variables” on page 214 for more information. For example:
Figure 114: Specifying a description for an EPICenter script
A detailed script description can be placed between the metadata tags #@DetailDescriptionStart and #@DetailDescriptionEnd. This appears on the Description tab.
You can place variable definition statements in the metadata section, so that variables can be defined by entering values in the Overview tab. For example:
EPICenter Reference Guide 195

Creating and Executing EPICenter Scripts
196
Figure 115: Defining variables in the metadata section of an EPICenter script
When you do this, the variables appear on the Overview tab as script parameters, as shown in Figure 116.
Figure 116: Overview tab with a variable definition field
You can enter ExtremeXOS 12.1 CLI scripting commands and Tcl commands and constructs after the metadata section of the script. See “EPICenter Script Reference” on page 205 for information about what can appear in an EPICenter script.
EPICenter Reference Guide

Managing EPICenter Scripts
To save the script, select Save As... from the File menu. EPICenter prompts you for the name of the script and for an optional script comment. You can save the script on the EPICenter server, or you can click Export to and specify a directory on your local system. The script is saved in XML format.
Figure 117: Save Script As dialog
Specifying Run-Time Settings for a ScriptTo specify the run-time settings for a script, click the Run-time Settings tab.
Figure 118: Run-time Settings Tab
On this tab you can specify the following settings:
● Whether the configuration on the device is saved after the script is run successfully.
● Script run timeout in seconds. This timeout value applies to each device independently.
● Whether to create an entry in the EPICenter Audit Log when this script is run.
EPICenter Reference Guide 197

Creating and Executing EPICenter Scripts
198
The first two settings apply to all users; the third is available to EPICenter users with read/write access.
Specifying Permissions and Launch Points for a ScriptYou can specify which EPICenter user roles have permission to run the script, and whether an option to run the script should appear in the Network Views menu or in a shortcut menu.
To set permissions and menu locations for the script, click the Permissions and menus tab.
Figure 119: Permissions and Menus Tab
● In the Permissions section of the window, you can specify the EPICenter user roles that are able to see and run the script.
● In the Availability in Network View menus section, you can create a menu item to run the script.
Select an option under Show in Menu Bar to list the script in the EPICenter menu bar, either in the Services menu, or in the Tools menu, under Run Script. When you do this, the script is visible as a option in these menus when one of the folders under Network Views is selected.
Select an option under Show in shortcut menus to list the script in the Run Script window, which is available from the right-click menu for a device, port, or group. For example, if you select the Device option, you can run the script by selecting a device, right-clicking, and selecting Run Script from the pop-up menu.
Running a ScriptTo run a script, do one of the following:
● Select a device, port, or group in a Network Views folder, and select Run script from the Device menu, or right-click the item and select Run script. If the script has been configured to be shown in the shortcut menu for the selected item, then the script is listed in the Run Script window, as shown in Figure 120.
EPICenter Reference Guide

Managing EPICenter Scripts
Figure 120: Run Script Window
● Select the script in the Script view, then select Run from the Action menu. A window appears prompting you for the Device or Device group where the script should be run. Follow the prompts to select the devices.
After the devices have been selected, a window appears prompting you for the sequence in which to execute the script on the devices. You can specify an order, or leave the default order.
Figure 121: Selecting the Order for Executing a Script
After the sequence for script execution has been selected, the following window appears, which allows you to make device-specific changes to the parameters in the script.
EPICenter Reference Guide 199

Creating and Executing EPICenter Scripts
200
Figure 122: Changing Parameters in a Script
To modify the script parameters for a device, select the device in the table, then click on the parameter you want to modify, and change it in the text box. The modified parameter applies only when the script is run on the selected device.
After you have made device-specific parameter changes, the following window appears, which allows you to modify the run-time settings for the script.
Figure 123: Specifying Run-time Settings
In this window, you can specify the following:
● Whether the configuration on the device is saved after the script is run successfully.
● Script run timeout in seconds. This timeout value applies to each device independently.
● Whether to create an entry in the EPICenter Audit Log when this script is run (read/write users only).
EPICenter Reference Guide

Managing EPICenter Scripts
Click Run Script to execute the script on the selected devices. A window appears indicating the progress and results of the script execution.
Figure 124: Progress and Results of Script Execution
You can display the script execution results (and any errors) for each device where the script was executed. The results can be saved to a file. You can also elect to run the script again.
The EPICenter Audit Log feature provides a way to view information about scripts that have been run on managed devices. If you encounter errors during script execution, you can use the Audit Log to correct the errors and rerun the scripts. See “Using the EPICenter Audit Log” on page 215 for more information.
Importing Scripts into EPICenterYou can import XML-formatted scripts into EPICenter. To import a script, do the following:
1 Expand the list of items in the Network Administration folder, and click Scripts.
2 From the File menu, select Import script. The following window is displayed:
EPICenter Reference Guide 201

Creating and Executing EPICenter Scripts
202
Figure 125: Import Script Window
3 In the From field, specify the location on your local system where the script file in XML format resides.
4 In the Script name field, enter the name of the script file to import.
5 Click Import to import the script into EPICenter.
NOTE
Exported EPICenter 6.0 Telnet macros cannot be imported as XML scripts.
Exporting a ScriptTo save a script, select Save As... from the File menu. EPICenter prompts you for the name of the script and for an optional script comment. You can save the script on the EPICenter server, or you can click Export to and specify a directory on your local system. The script is saved in XML format.
EPICenter Reference Guide

Managing EPICenter Scripts
Figure 126: Save Script As dialog
Deleting a Script To delete a script, do the following:
1 Expand the list of items in the Network Administration folder, and click Scripts.
2 In the script table, select one or more scripts you want to delete.
3 From the Edit menu, select Delete.
4 Click Yes to confirm the script deletion.
Categorizing ScriptsYou can optionally assign scripts to categories, such as “VLAN Scripts”, “Port Scripts”, and so on. Placing scripts into logical groups in this way can aid in filtering the information displayed in the Scripts table. This can be useful if you have a large number of scripts to manage. The category you create also becomes a menu option in the Tools > Run Script menu.
To assign a script to a category, do the following:
1 Expand the list of items in the Network Administration folder, and click Scripts.
2 In the script table, select the script you want to categorize.
3 From the Action menu, select Categorize. The following window is displayed:
EPICenter Reference Guide 203

Creating and Executing EPICenter Scripts
204
Figure 127: Categorize Script Window
4 To create a new category, click New, and specify a category name.
5 To assign the script to a category, click the button next to the category and click Save.
After a script has been assigned to a category, you can filter the scripts table using the category name. For example:
Figure 128: Filtering the Scripts Table by Category Name
Specifying an EPICenter Script as an Alarm ActionYou can define an alarm to execute a script when the alarm is triggered. See “Defining Alarm Actions” on page 105 for information about how to do this.
EPICenter Reference Guide

EPICenter Script Reference
EPICenter Script ReferenceThis section contains reference information for EPICenter scripts. It contains the following topics:
● “Metadata Tags” on page 205
● “EPICenter-Specific Scripting Constructs” on page 207
● “Tcl Support in EPICenter Scripts” on page 210
● “Entering Special Characters” on page 210
● “Line Continuation Character” on page 211
● “Case Sensitivity in EPICenter Scripts” on page 211
● “Reserved Words in EPICenter Scripts” on page 211
● “ExtremeXOS CLI Scripting Commands Supported in EPICenter Scripts” on page 211
● “EPICenter-Specific System Variables” on page 214
Metadata TagsAn EPICenter script may contain a metadata section, which can serve as a usability aid in the script interface. The metadata section, if present, is the first section of an EPICenter script, followed by the script logic section, which contains the CLI commands and control structures in the script. The metadata section is delimited between #@MetaDataStart and #@MetaDataEnd tags. A metadata section is optional in an EPICenter script.
You can use metadata tags to specify the description of the script, as well as parameters that the script user can input. The information specified by the metadata tags appears in the Overview tab for the script.
NOTE
EPICenter script metadata tags are backwards-compatible with EPICenter UPM profile metadata tags.
#@MetaDataStart and #@MetaDataEndIndicates the beginning and end of the metadata section of the script. In order for description information and variable input fields to appear in the Overview tab for a script, the corresponding metadata tags must appear in the metadata section.
Example
#@MetaDataStart # @SectionStart (description = “Protocal Configuration Section”) Set var protocolSelection eaps # @SectionEnd # @SectionStart (description = “vlan tag section”) Set var vlanTag 100#@MetaDataEnd
EPICenter Reference Guide 205

Creating and Executing EPICenter Scripts
206
#@ScriptDescriptionSpecifies a one-line description of the script. The description specified with this tag cannot contain a newline character.
Example
#@ScriptDescription “This is a VLAN configuration script.”
#@DetailDescriptionStart and #@DetailDescriptionEndSpecifies the beginning and end of the detailed description of the script. The detailed description can be multiple lines or multiple paragraphs. Each line in the description should be commented. The detailed description is shown in the Script View tab in the script editor window.
Example
#@DetailDescriptionStart #This script performs configuration upload from epicenter to the switch. #The script only supports tftp. #This script does not support third party devices. #@DetailDescriptionEnd
#@SectionStart and #@SectionEnd
Specifies the beginning and end of a section within the metadata part of a script. If this is the last section of the metadata, ending with a #@MetaDataEnd tag, then the #@SectionEnd tag is not required. Once a section starts with the #@SectionStart tag, the previous section is automatically ended.
Example
# @SectionStart (description = “Protocol Configuration Section”) Set var protocolSelection eaps# @SectionEnd
#@VariableFieldLabel
Defines user-input variables for the script. For each variable defined with the #@VariableFieldLabel tag, you specify the variable’s description, scope, type, and whether it is required.
Description Label that appears as the prompt for this parameter in the Overview tab
Scope Whether the parameter is device-specific or global (uses the same value for all devices) Valid values: global, device. Default value is global.
Type Parameter data type. This determines how the parameter input field is shown in the overview tab.
readonly Whether the parameter is read-only and cannot be modified by the user. Valid values: Yes, No. Default value is No.
validValues Lists all possible values a parameter can take. All values should be seperated by command and put into square bracket.
Required Whether specifying the parameter is required to run the script. Valid values: Yes, No.
EPICenter Reference Guide

EPICenter Script Reference
Example
#@VariableFieldLabel (description = “Partition:”, scope = global, #required = yes, validValue = [Primary,Secondary], readOnly=false) set var partition “”
EPICenter-Specific Scripting ConstructsThis section describes the scripting constructs that are specific to EPICenter.
Specifying the Wait Time Between Commands
After the script executes a command, the sleep command causes the script to wait a specified number of seconds before executing the next statement.
Syntax
sleep <seconds>
Example
# sleep for 5 seconds after executing a commandsleep 5
Printing System Variables
The printSystemVariables command prints the current values of the system variables. Specifically, values for the following variables are printed:
● deviceIP
● deviceName
● serverName
● deviceSoftwareVer
● serverIP
● serverPort
● date
● time
● abort_on_error
● CLI.OUT
● runMode
Syntax
printSystemVariables
Example
# Display values for system variablesprintSystemVariables
EPICenter Reference Guide 207

Creating and Executing EPICenter Scripts
208
Configuring a Carriage Return Prompt Response
A special string within the script, <cr>, indicates a carriage return in response to a prompt for a command.
Syntax
<cr>
Example
download image 10.22.22.22 t.txt<cr> //cancel download
Synchronizing the Device with EPICenterThe PerformSync command manually initiates a synchronization for specified EPICenter feature areas and scope.
Syntax
PerformSync [-device <ALL | deviceIp>] [-scope <INVENTORY | TOPOLOGY | UPM | VLAN> ] [-vlan <vlan1,vlan2>]
If -device is not specified, the current device (indicated by the $deviceIP system variable) is assumed. if -scope is not specified, INVENTORY scope is assumed. The -vlan option is only applicable if VLAN scope if chosen.
The PerformSync command is executed in an asynchronous manner. That is, when the command is executed, EPICenter moves on to the next command in the script without waiting for the synchronization to complete.
Examples
# Perform sync for TopologyPerformSync -scope TOPOLOGY
If there are multiple VLANs in the -vlan argument, enclose them in double quotes. For example:
PerformSync -scope VLAN -vlan "foo,bar"
Saving the Configuration on the Device Automatically
The run time settings for script may include the option to issue the save command in the background after the script is run successfully on the device. If an error is encountered as a result of the save command, a “Save command failed” alarm is issued in EPICenter against the device.
Sending Events to EPICenter
You can configure a script to send events to EPICenter from the device where it is run. The events are displayed in the EPICenter alarm browser.
EPICenter Reference Guide

EPICenter Script Reference
In order for an event to be displayed in the alarm browser, the corresponding event should be added to the alarm definition (if not already present), and the target device should be included in the scope of the alarm (in the alarm definition) prior to sending events.
Syntax
SendEvent [-subtype <subtype>] message
Where <subtype> can be one of the following:
Example
#Send Configuration Download Failed event if error occursdownload image 10.210.14.4 image.txt if ($STATUS != 0) then
Subtype Name
1 Ping failed
2 Ping OK
3 SNMP Reachable
4 SNMP Unreachable
5 Reachability unknown
6 Configuration Upload Failed
7 Configuration Upload OK
8 Custom Event
9 Device Reboot
10 Overheat
11 Fan Failed
13 High Trap Count
14 Policy Configuration Start
15 Policy Configuration End
16 Device Policy Configuration
17 Power Supply Failed
18 Device Warning From EPICenter
19 Syslog Flood
20 One-Shot Event No Longer Valid
21 Rogue Access Point Found
22 Stacking Link Down
23 Stack Member Down
73 Configuration Download Failed
74 Configuration Download OK
100 EAPS Domain State Changed - ERROR
101 EAPS Domain State Changed - WARNING
102 Telnet Macro, save operation failed
103 A background script execution failed
104 Script event
EPICenter Reference Guide 209

Creating and Executing EPICenter Scripts
210
SendEvent -subtype=73 ${CLI.OUT} endif
Printing a String to a File
The ECHO command prints a specified string to a file.
Syntax
ECHO "string"
Example
# Write Device IP address to fileECHO "device ip is $deviceIP"
NOTE
The Tcl puts and ECHO commands have the same function. However, the ECHO command is not case-sensitive, while the puts command is case-sensitive.
Tcl Support in EPICenter ScriptsThe Tcl commands and constructs listed in http://www.tcl.tk/man/tcl8.2.3/TclCmd/contents.htm can be used in EPICenter scripts.
The following Tcl commands are not supported in EPICenter scripts:
● beep
● cd
● encoding
● exec
● exit
● fconfigure
● file
● glob
● load
● ls
● pwd
● resource
● socket
● source
Entering Special CharactersIn an EPICenter script, you can use the backslash character as the Escape character if you need to enter special characters, such as “ ” (quotation marks) : (colon), or $ (dollar sign).
EPICenter Reference Guide

EPICenter Script Reference
Example
set var value 100 set var dollar \$value show var dollar >>> $value
NOTE
Do not place the backslash character at the end of a line in an EPICenter script.
Line Continuation CharacterThe line continuation character is not supported in EPICenter scripts. Each command statement should be placed on a single line.
Case Sensitivity in EPICenter ScriptsThe commands and constructs in an EPICenter script are not case-sensitive. However, if a command is referenced inside another command, the inner command is case-sensitive. In this instance, the inner command case should match how it appears in the EPICenter documentation.
Example (Usage of the EPICenter command ECHO)
echo hi (valid)echo [echo hi] (error)echo [ECHO hi] (valid)
Reserved Words in EPICenter ScriptsThe following words cannot be used as variable names in an EPICenter script. They are reserved by EPICenter.
● Names of system variables (see “EPICenter-Specific System Variables” on page 214)
● Names of EPICenter command extensions (see “EPICenter-Specific Scripting Constructs” on page 207)
● Names of ExtremeXOS CLI commands
● epic_responseFileId
● Names of Tcl functions
In addition, you should not use a period (.) within a variable name. Use an underscore instead.
ExtremeXOS CLI Scripting Commands Supported in EPICenter ScriptsThe CLI commands in this section are supported in EPICenter scripts.
EPICenter Reference Guide 211

Creating and Executing EPICenter Scripts
212
$VAREXISTS
Checks if a given variable has been initialized.
Switch Compatibility
This command is supported on devices running ExtremeXOS 12.1 and higher.
Example
if ($VAREXISTS(foo)) then show var foo endif
$TCL
Evaluates a given Tcl command.
The $TCL command is supported within following constructs:
● set var
● if
● while
See http://www.tcl.tk for a list of Tcl commands supported in EPICenter scripts.
Switch Compatibility
This command is supported on devices running ExtremeXOS 11.6 and higher.
Example
set var foo $TCL(expr 3+4) if ($TCL(expr 2+2) == 4) then
$UPPERCASE
Converts a given string to upper case.
The $UPPERCASE command is supported within following constructs:
● set var
● if
● while
Switch Compatibility
This command is supported on devices running ExtremeXOS 11.6 and higher.
NOTE
The $UPPERCASE command is deprecated in ExtremeXOS 12.1 CLI scripting. The $TCL(string toupper <string>) command should be used instead.
EPICenter Reference Guide

EPICenter Script Reference
Example
set var foo $UPPERCASE("foo")
show var
Prints the current value of a specified variable.
Switch Compatibility
This command is supported on devices running ExtremeXOS 11.6 and higher.
Example
show var foo
delete var
Deletes a given variable. Only local variables can be deleted; system variables cannot be deleted.
Switch Compatibility
This command is supported on devices running ExtremeXOS 11.6 and higher.
Example
set var foo bar delete var foo if ($VAREXISTS(foo)) then ECHO "this should NOT be printed" else ECHO "Variable deleted." endif
configure cli mode scripting abort-on-error
Configures the script to halt when an error is encountered.
If there is a syntax error in the script constructs (set var / if ..then / do..while ), execution stops even if the abort_on_error flag is not configured.
Switch Compatibility
This command is supported on devices running ExtremeXOS 11.6 and higher.
Example
enable cli scripting \$UPPERCASE uppercase # should not print show var abort_on_error
EPICenter Reference Guide 213

Creating and Executing EPICenter Scripts
214
EPICenter-Specific System VariablesThe following system variables can be set in EPICenter scripts:
$abort_on_error Whether the script terminates if a CLI error is encountered; 0 aborts on error, 1 continues on error.
$CLI.OUT The output of the last CLI command
$CLI.SESSION_TYPE The type of session for the connection to the device, either Telnet of SSH
$date The current date on the EPICenter server
$deviceIP The IP address of the selected device
$deviceLogin The name of the login user for the selected device
$deviceName The DNS name of the selected device
$deviceSoftwareVer The version of ExtremeXOS running on the selected device
$deviceType The product type of the selected device
$epicenterUser The name of the EPICenter user running the script
$isExos Whether the device is an ExtremeXOS device. Possible values are True or False
$port Selected port numbers, represented as a string. If the script is not associated with a port, thissystem variable is not supported.
$serverIP The hostname of the EPICenter server
$serverName The hostname of the EPICenter server
$serverPort The port number used by the EPICenter web server; for example, 8080
$STATUS The execution status of the previously executed ExtremeXOS command, 0 if the command wasexecuted successfully, non-zero otherwise
$time The current date on the EPICenter server
$vendor Vendor name of the device; for example, Extreme
EPICenter Reference Guide

10 Using the EPICenter Audit Log
This chapter describes how to use the EPICenter Audit Log for:
● Displaying information about UPM profiles and EPICenter scripts that have been deployed on managed devices
● Viewing details about deployed UPM profiles and EPICenter scripts
● Correcting and redeploying UPM profiles and EPICenter scripts
Audit Log OverviewThe EPICenter Audit Log is a means for viewing information about the UPM profiles and EPICenter scripts that have been deployed in your network.
You can use the Audit Log as a troubleshooting aid to reveal errors when UPM profiles and EPICenter scripts are deployed unsuccessfully. Using the Audit Log, you can correct the errors and redeploy the profiles or scripts.
Audit Log ViewTo display the Audit Log, click on Audit Log under the Network Administration folder. The Audit Log view is displayed, as shown in Figure 129.
EPICenter Reference Guide 215

Using the EPICenter Audit Log
216
Figure 129: Audit Log View
The Audit Log View has separate tabs to display information about the deployed UPM profiles and EPICenter scripts.
Within each tab are filters that allow you to limit the information in the display based on the time period deployed, log table contents, or details table contents. The log table contains information about each deployed profile or script. The details table contains information about the deployment results of a selected profile or script on each device where it was run.
Filtering the Audit Log ViewThe log table displays all of the profiles or scripts that meet the filter criteria defined in the Time Period and Log Items filter. For example, you can specify for the Time Period filter to display all scripts deployed over the past 24 hours. When you do this, the filtered list of scripts appears in the log table.
You can further filter the log table by entering text in the Log Items filter. For example, if you enter VLAN in the Log Items filter, the log table shows only rows that contain the text VLAN. Using the drop-down search menu, you can specify additional filter criteria, including column name, case-sensitivity, and wildcard matching.
Time Period Filter
Log Table
Log Items Filter Details Filter
Details Table
EPICenter Reference Guide

Displaying Audit Log Details
Displaying Audit Log DetailsTo display details about a deployed UPM profile or EPICenter script, click on a row in the log table. Information about the profile or script appears in the details table. If you double-click on the row, the details are displayed in a separate window, as shown in Figure 130.
Figure 130: Audit Log Details Window
The Audit Log Details window displays the name of the deployed profile or script, user-defined comments, and who created it.
The following columns are displayed:
You can display additional information about how a script was deployed on a specific device by selecting Open from the File menu, or double-clicking a row in the table. When you do this, the Response Detail window is displayed, as shown in Figure 131.
Name The name of the device where the profile or script was deployed
IP address IP address of the device.
Result Result of the deployment, successful or unsuccessful.
EPICenter Reference Guide 217

Using the EPICenter Audit Log
218
Figure 131: Response Detail Window for a Script
The response detail window displays messages generated when the script was run. As a troubleshooting aid, you can review the contents of the window for error messages.
Redeploying Profiles or ScriptsIf the deployment result for a profile or script was unsuccessful, you can open it from EPICenter, make corrections, and redeploy it on the device.
To open a profile or script, select it in the Audit Log Details window and then select Open script or Open profile from the File menu. The script or profile is opened in an editor window. You can then make changes to the profile or script, and redeploy it.
● For information on editing UPM profiles, see “Using the Universal Port Manager” on page 255.
● For information on editing EPICenter scripts, see “Creating and Executing EPICenter Scripts” on page 191.
To redeploy a script or profile from the Audit Log, select Rerun from the Action menu. This starts the deployment wizard for the profile or script.
EPICenter Reference Guide

11 Using the IP/MAC Address Finder
This chapter describes how to use the IP/MAC Address Finder for:
● Creating search requests for locating specific MAC or IP addresses, and determining the devices and ports where they are located.
● Creating search requests to identify the MAC and IP addresses on specific devices and ports.
Overview of the IP/MAC Address FinderUsing the IP/MAC Address Finder you can specify a set of Media Access Control (MAC) or Internet Protocol (IP) network addresses, and a set of network devices to query for those addresses. The applet returns a list of the devices and ports associated with those addresses. You can also specify a set of devices and ports, and search for all MAC and IP addresses that appear on those devices and ports.
The Search Tool lets you configure and start a search task, view the status of the task, view the task results, and export the results either to your local system or to the EPICenter server system. The task specification and results are kept in the task list until you delete them, or until you end your EPICenter session by logging out.
The IP/MAC Address Finder supports two types of searches: a Database search, that looks for a MAC or IP address among edge port information maintained in the EPICenter database, and a Network search, that searches switches on the network for the specified MAC or IP addresses.
If you have configured EPICenter to do MAC polling, EPICenter maintains in its own database the information it learns about edge ports from the switches it polls. (See Chapter 15 “Administering EPICenter” for information on setting MAC Poller properties to enable MAC polling). In this case, the IP/MAC Address Finder can search for addresses within the database rather than searching over the network. If you do not have MAC polling enabled, the IP/MAC Address Finder will always do a network search.
In a network search the IP/MAC Address Finder searches the IP Address Translation Table (the ipNetToMediaTable) in each device agent for IP addresses, and the Forwarding Database (FDB) for MAC addresses of the switches in your search domain to find address information. If you specify a search for a specific IP address, the IP/MAC Address Finder will attempt to ping that address from the switches you have included in the search domain.
ExtremeWare Software RequirementsThe IP/MAC Address Finder requires certain versions of ExtremeWare to be running on your Extreme switch in order to retrieve data from an IP address or MAC address search task.
Table 10 lists versions of ExtremeWare and whether or not they are currently supported by the IP/MAC Address Finder.
EPICenter Reference Guide 219

Using the IP/MAC Address Finder
220
Displaying the IP/MAC Address FinderTo display the IP/MAC Address Finder in EPICenter, click on Network Views. From the Tools menu, select Find IP and/or MAC address. The IP/MAC Address Finder window displays, as shown in Figure 132. Initially no search requests display.
Figure 132: IP/MAC Address Finder Window
Tasks List Summary WindowAs search tasks are initiated, they are placed in the Find Address Tasks List in the Component Tree. Selecting the Find Address Tasks folder in the Component Tree displays a summary of the status of the tasks in the Task List (see Figure 133).
Table 10: ExtremeWare Requirements for Using the IP/MAC Address Finder
ExtremeWare Version Requirements6.1.5 Not supported.
6.1.6 through 6.1.9 Supported using the using the dot1dTpFdbTable. Use the enable snmp dot1dTpFdbTable command to enable the dot1dTpFdbTable on the switch.
6.2 and later Fully supported using a private MIB.
EPICenter Reference Guide

Tasks List Summary Window
Figure 133: Tasks List Summary
The Tasks List shows you basic information about the tasks you set up:
From the Tasks List you can perform the following functions:
NOTE
The specified tasks and their search results persist as long as you logged in to EPICenter, even if you leave the IP/MAC Address Finder and go to another EPICenter feature. However, when you exit EPICenter, all the task specifications and search results are deleted.
ID Automatically assigned by the EPICenter server.
Name The name you gave the task when you created it. Giving a task a unique name is important to distinguish it from other tasks in the Tasks List.
Search Type The type of search this will perform (Database of Network).
Status Shows the status of the request.
Date Submitted Shows the date and time the task was submitted.
Date Completed Shows the date and time the task was finished.
Cancel Select a Pending task and click Cancel to cancel the task before it has completed.
Delete Select a task and click Delete to delete an individual task. This deletes the task specification as well as the task results. Once a task has completed, it cannot be rerun unless it is the most recent task completed.
ReRun Select a task and click ReRun to execute the task again
Clone Select a task and click Clone to bring up the Find Addresses window with the specifications of the selected task already displayed.
Export Select a task and click Export to export the task details to a text file. See “Exporting Task Results to a Text File” on page 226 for more information.
Export Local Select a task and click Export Local to export the task details locally to a text file on your local system. See “Exporting Task Results to a Text File” on page 226 for more information.
EPICenter Reference Guide 221

Using the IP/MAC Address Finder
222
Creating a Search TaskTo create a search task, click the Find button in the Tool bar at the top of the IP/MAC Address Finder page. This displays the Find IP and MAC Addresses window (Figure 134).
NOTE
If you have already submitted a task, the most recent task with its specifications is displayed in the Find Addresses window.
Figure 134: Find IP and MAC Addresses window
The fields in this window are as follows:
Task Name A user-defined name for the task. The name helps you identify the task in the Find Address Tasks List. Names of the form, such as Task 1, Task 2, and so on, are provided by default.
Search Targets The search criteria for addresses to find.
Enter an Address area The addresses to be located:
• IP lets you enter an IP address (as four octets).
• MAC lets you enter a MAC address (as six hexadecimal tuples).
• All specifies that the IP/MAC Address Finder should find all addresses in the Target Domain.
• WildCard enables a search for a MAC address defined only by the first three hexadecimal tuples.
Add Adds the specified address to the Addresses to Find list.
Remove Address Removes selected addresses from the Addresses to Find list.
Addresses to Find Lists the addresses to find based on search criteria specified in the Enter an Address area.
EPICenter Reference Guide

Creating a Search Task
To create a search task to do a Database search:
1 Provide a name in the Task Name field.
2 Define the search targets.
You can paste a MAC address or IP address into the address field; place the cursor into the first cell of the address and paste an address you have copied, using your system’s keyboard paste command (Ctrl-V in Windows). For example, you might copy an address from a report or a syslog entry to paste into the IP/MAC Address Finder.
Search Type Define the search type: Database or Network.
Database Database performs a search from the EPICenter database using the collected edge port information. EPICenter does not report unreachable devices with this type of search. This option results in a much faster search.
A database search will not be available if MAC Polling is disabled; see “MAC Polling Properties” on page 312 for information on enabling or disabling MAC Polling.
Network Network performs a search from the network by searching the devices in the search domain. This option may take longer to complete, but can provide more current results.
If you perform a network search, EPICenter reports unreachable devices.
Search Domains Define the search domain criteria (the devices to be searched) for a Network search.
Note: No search domain can be specified if you are doing a Database search.
Source Type Specifies the type of elements that will appear in the search domains list, from which you can select to add to the Target Domain.
Devices: Displays a list of individual devices from the device group specified in the Select Group field.
Device Groups: Displays a list of device groups (domains).
Ports: Displays devices and ports from the device group specified in the Select Group field.
Port Groups: Displays a list of Port Groups.
If you select Devices or Ports as the Source Type, you must also select a Device Group from the Select Group field to define the list of devices that will appear in the Devices list. If you select Device Groups or Port Groups, this field will be inactive.
Select Group Select a device group, to display the devices in that group in the search domains list.
Devices/Domains/Ports/Port Groups
Displays a list of components from which you can select to include in the Target Domains list. The types of components available in this list is determined by your selection in the Source Type field.
Add Moves the selected component to the Target Domains list.
Remove Removes the selected component from the Target Domains list.
Remove All Removes all components from the Target Domains list.
Target Domains Lists the devices, device groups (domains), ports, or port groups to be included in the search. Devices not included in the Target Domain will not be searched.
Select the Device, Port, Device Group, or Port Group that you want to search and click the Add button to move it into the Target Domains list.
For each item you have added to the Target list, the following is displayed:
Type: The type of target—Devices, Device Groups, Ports, Port Groups
Value: The name, IP address, or port number of the selected target
Device Status: If the target is a device or port, shows the status of the device: Online or Offline/Down
To remove a member from the Target Domains list, select the item in the list and click Remove. To clear the Target Domains list, click Remove All.
EPICenter Reference Guide 223

Using the IP/MAC Address Finder
224
3 Select Database as the search type.
4 Click the Submit button at the bottom of the window to initiate the search.
NOTE
A Database search is only available if you have MAC Polling Enabled. If you specify a database search, you cannot specify a search domain; the entire EPICenter database will be searched.
To create a search task to do a Network search:
1 Provide a name in the Task Name field.
2 Define the search targets.
3 Select Network as the search type.
4 Define the search domain. The Target Domains list specifies the scope of the devices to be included in the search. Devices not included in this domain are not searched.
Select the devices, ports, Device Groups, or Port Groups that you want to search and click the Add button to move them into the Target Domains list.
You can create a target domain that includes a combination of these specifications.
NOTE
The IP/MAC Address Finder does not support hierarchical port groups. If you have created port groups in EPICenter that include subgroups as members, those subgroups will not appear in the Target Domains list. Instead, any ports that are members of subgroups will be displayed directly under the top-level port group, as if they are members of the top-level group.
5 When you have completed your search specification, click the Submit button at the bottom of the window to initiate the search.
The IP/MAC Address Finder searches the IP Address Translation Table (the ipNetToMediaTable) in each device agent for IP addresses, and the Forwarding Database (FDB) for MAC addresses.
NOTE
The IP/MAC Address Finder will not identify a device’s own IP address when you search for IP addresses on that device. In other words, it will not find IP address 10.2.3.4 on the switch whose address is 10.2.3.4. It can only find addresses that are in the agent’s IP Address Translation table, and a device’s own address is not included in the table. The IP/MAC Address Finder will find the address on the other switches that have connectivity to the switch with the target IP address, however.
NOTE
Each search task can return a maximum of 2,000 MAC address entries. If a search returns more than 2,000 entries, a warning message is displayed in the status window. If you see a warning message, add additional search constraints to reduce the number of returned MAC addresses to less than 2,000.
EPICenter Reference Guide

Detailed Task View
Detailed Task ViewWhen you initiate a search, the task is placed in the Find Address Tasks list in the Component Tree. The main panel displays the Detailed Task View for the current search task.
While the task is in progress, the window shows the status as Pending. When the search is complete, the Detailed Task View shows the results for the search (Figure 135).
Figure 135: Address Search Results in the Detailed Task View
The Detailed Task View shows the following information about your search:
The Search Criteria areas shows:
Task Name The name you gave the task when you created it. Giving a task a unique name is important to distinguish it from other tasks in the Tasks List.
Status Shows the status of the request.
Search Type The type of search (Database or Network).
Submitted Shows the date and time the task was submitted.
Ended Shows the date and time the task was finished.
Addresses to Find The list of IP or MAC addresses that were the object of the search
Search Domains For a Network search only, the Search Domains where the search took place. This will be empty when the search type is Database.
For a Network search, the Search Domains lists shows:
Type: The type (Devices, Device Groups, Ports, Port Groups) of the components in the domain specification
Value: The name of the component (group or device name)
Device Status: If the target is a device or port, shows the status of the device: Online or Offline/Down
EPICenter Reference Guide 225
Using the IP/MAC Address Finder
226
The Search Results list shows the results of the search. For every address successfully located, this list shows:
Once the search is complete, the search results will stay in the Tasks List until you explicitly delete them using the Delete Function from the Tasks List Summary View, or until you exit EPICenter.
From the Task Detail window you can do the following:
The text field located above the action buttons (Delete, ReRun, Clone) provides search status details, such as a list of devices that are offline or not reachable.
Exporting Task Results to a Text FileYou can export a task’s detail results or search results to a text file. You can do this from the Tasks List.
To export the detail or search results to a file, do the following:
1 From the Detailed Task View, click the Export button to save the file on the EPICenter server. Click the Export Local button to save the file locally.
If you select Export, the Export pop-up dialog is displayed.
If you select Export Local, a Save File dialog is displayed.
2 Enter a file name and subdirectory name in the fields provided.
If you select Export:
■ Detail and search result files for a task are saved in the EPICenter user.war/AddressFinderResults directory, which is a subdirectory of the EPICenter installation directory. You can optionally specify a subdirectory within the AddressFinderResults directory by entering the subdirectory name into the Directory field.
■ By default, a search result exported file will be given a name created from the current date, time, and task name. For example, the results for task “Task 2” run on April 25, 2006 at 3:52 pm will be saved in a file named 2006_4_25_1552_Task 2.txt. You can change the file name by replacing the name in the File Name field.
If you select Export Local:
■ Select the location where you want the file to be saved.
MAC Address The MAC address
IP Address The corresponding IP address
Switch The switch to which the address is connected
Port The port to which the address is connected
User The User (name) currently logged in at that address
Cancel Cancel a running task.
Delete Delete this task. This deletes the task specification as well as the task results.
ReRun Execute the task again.
Clone Bring up the Find Addresses window with the specifications of the selected task already displayed.
Export Export task search results to a text file on the server machine. See “Exporting Task Results to a Text File” on page 226 for more information.
Export Local Export task search results locally to a text file on your local system. See “Exporting Task Results to a Text File” on page 226 for more information.
EPICenter Reference Guide

Detailed Task View
■ You must provide a file name, it is not predefined for this option.
3 Click the Apply button to save the results.
Click Reset to clear all the fields.
Click Close to close the dialog without saving the file.
EPICenter Reference Guide 227

Using the IP/MAC Address Finder
228
EPICenter Reference Guide
12 Real-Time Statistics
This chapter describes how to use the Real-Time Statistics applet for:
● Viewing percentage utilization or total errors data for multiple ports in an Extreme Networks switch, a switch slot, or a port group.
● Viewing historical utilization, total errors, or individual errors data for a specific port on an Extreme Networks switch.
Overview of Real-Time StatisticsThe Real-Time Statistics feature of the EPICenter software enables you to view a graphical presentation of utilization and error statistics for Extreme Networks switches in real time. The data is taken from Management Information Base (MIB) objects in the etherHistory table of the Remote Monitoring (RMON) MIB. The Real-Time Statistics function is supported only for Extreme Networks switches.
NOTE
You must have RMON enabled on the switch in order to collect real-time statistics for the switch. You can enable RMON for a switch using the enable rmon CLI command.
You can view data for multiple ports on a device, device slot, or within a port group, and optionally limit the display to the “top N” ports (where N is a number you can configure). If you choose to view multiple ports, the display shows data for the most recent sampling interval for the selected set of ports. The display is updated every sampling interval.
You can also view historical statistics for a single port. If you choose to view a single port, the display shows the value of the selected variable(s) over time, based on the number of datapoints the MIB maintains in the etherHistory table.
You can choose from a variety of styles of charts and graphs as well as a tabular display.
You can view the following types of data:
Percent Utilization The percent of utilization for each port in the set (device, port group, or single port). This percent reports the value of the etherHistoryUtilization MIB object. The MIB defines this variable as the best estimate of the mean physical layer network utilization on this interface during this sampling interval, graphed in percents.
Note that Extreme devices use only the ingress utilization (Rx) value when determining the utilization percentage and populating it in the etherHistoryUtilization MIB object.
Total Errors Total number or errors for each port in the set (device, port group, or single port). Total Errors is the sum of the six error variables shown below.
The total errors number takes into account both ingress (Rx) and egress (Tx) traffic.
Individual Errors The number of individual errors for a single port. An individual errors display shows the six error variables shown below.
Error Variables RMON etherHistory error variables for port error displays.
EPICenter Reference Guide 229

Real-Time Statistics
230
Real-Time Statistics FunctionsTo display statistics for a device, click on the device and select Statistics from the Tools menu.
Real-Time Statistics Function ButtonsThe buttons at the top of the main Real-Time Statistics applet provide the following functions:
• etherHistoryCRCAlignErrors The number of packets received during this sampling interval that had a length between 64 and 1518 octets, inclusive (excluding framing bits but including Frame Check Sequence (FCS) octets), but that had either a bad FCS with an integral number of octets (FCS Error) or a bad FCS with a non-integral number of octets (Alignment Error).
• etherHistoryUndersizePkts The number of packets received during this sampling interval that were less than 64 octets long (excluding framing bits but including FCS octets) and were otherwise well formed.
• etherHistoryOversizePkts The number of packets received during this sampling interval that were longer than 1518 octets (excluding framing bits but including FCS octets) but were otherwise well formed.
• etherHistoryFragments The total number of packets received during this sampling interval that were less than 64 octets in length (excluding framing bits but including FCS octets) had either a bad Frame Check Sequence (FCS) with an integral number of octets (FCS Error) or a bad FCS with a non-integral number of octets (Alignment Error).
• etherHistoryJabbers The number of packets received during this sampling interval that were longer than 1518 octets (excluding framing bits but including FCS octets), and had either a bad Frame Check Sequence (FCS) with an integral number of octets (FCS Error) or a bad FCS with a non-integral number of octets (Alignment Error).
• etherHistoryCollisions The best estimate of the total number of collisions on this Ethernet segment during this sampling interval.
Table 11: Real-Time Statistics Function Buttons
Select this to determine whether the display for a device or port group will include all ports, or only the top N ports (where N is initially fifteen). Click the icon to toggle between the red X, which indicates the top N limitation is not in effect, and a green check, which indicates that the top N ports are being displayed. The top N ports are displayed in order from highest (largest percent utilization or largest total errors) to lowest. The number of ports (N) is a user-configurable setting. This option is available only for multi-port displays.
Select this to display the data as a line graph. This chart type is especially useful when displaying individual errors for a single port.
Select this to display the data as a pie chart. This chart type is available only when you are displaying statistics for multiple ports on a device, device slot, or in a port group. The maximum number of slices in the pie is a user-configurable setting. It is initially set to display 10 slices.
Select this to display the data as a bar chart. A 3D bar chart is the default for all chart displays. The 3D setting is also a user-configurable option.
Select this to display the data as a horizontal bar chart. This chart type by default displays in 3D. The 3D setting is also a user-configurable option.
EPICenter Reference Guide

Displaying Multi-Port Statistics
Displaying Multi-Port StatisticsYou can select a device, slot, or port group to display statistics on all the ports in that item, or you can select an individual port to display statistics for the port.
NOTE
The Real-Time Statistics applet does not support hierarchical port groups. If you have created port groups that include subgroups as members, the subgroups will not appear in the Component Tree of the Real-Time statistics applet. Instead, any ports that are members of subgroups will be displayed directly under the top-level port group, as if they are members of the top-level group.
For a port, you can display individual errors in addition to utilization and total errors.
● Select a network device to display data for some or all ports on the device.
● Select a port group to display data for all ports in the port group.
You will first see a message saying “Please wait, loading statistics data.” If the EPICenter server is successful in accessing the data, utilization data is displayed as shown in Figure 136.
Select this to display the data as a stacked bar chart. This chart type is only available when you are displaying individual errors for a single port.
Select this to display the data as an area chart. This chart type by default displays in 3D. The 3D setting is also a user-configurable option.
Select this to display the data as a table.
Select this to zoom in on (magnify) the size of the display. You can select this repeatedly to zoom up to three times the screen size.
Select this to zoom out (shrink) the size of the display. You can select this repeatedly until the chart is the desired size.
Select this to display grid lines on the background of the chart.
Determines whether the graph data is updated automatically at every sampling interval. Click on the icon to toggle between continuous updates, and suspended updates.
Select this to take a “snapshot” of the graph or table view of the current real-time statistics data.
Select this to bring up the graph preferences pop-up window. You can change a variety of settings, such as graph and data colors, the sampling interval, or the number of ports in a top N display.
Table 11: Real-Time Statistics Function Buttons (continued)
EPICenter Reference Guide 231

Real-Time Statistics
232
Figure 136: Bar chart showing port statistics for a group of ports
If you place the cursor near a bar in the chart, a pop-up window shows the port number and device, actual data value, and the time stamp on the data sample.
You can use the mouse to change the depth and rotation of a three-dimensional chart:
● Hold down the [Shift] key, press the left mouse button, and drag the cursor left or right to rotate the graph.
● Hold down the [Ctrl] key, press the left mouse button, and drag the cursor up or down to set the depth of the three-dimensional view.
For any of the bar graphs, move the cursor and then wait to see the change take effect, which may take a few seconds.
There are cases where you may not see data for every port you expect in a multi-port display:
● You have selected the “top N” feature (top 15 by default), so only the “N” ports with the highest utilization or the highest total number of errors are displayed.
● RMON is disabled for some ports on the switch. If the switch as a whole can be reached and is reporting data, then individual ports that do not report data will be ignored. No error message appears in this case.
EPICenter Reference Guide

Displaying Statistics for a Single Port
If the EPICenter server is not successful in loading data from the device, it displays a message similar to that shown in Figure 137.
Figure 137: Warning displayed when the EPICenter server cannot retrieve data
There are several reasons why the EPICenter server may not be able to display any device data:
● The EPICenter server cannot communicate with the device (indicated by an “S” in a red circle next to the device name).
● The device does not have RMON enabled, or RMON was just recently enabled and no data samples exist yet.
● The device is marked offline.
Displaying Statistics for a Single PortIn addition to displaying data for a set of ports, you can display historical data for an individual port. You can select a port in one of two ways:
● Double-click on the data point for an individual port in the device or port group statistics display (bar, data point, or pie slice in the respective chart, or row in a tabular display).
● Click on a device, device slot, or port group to list the ports it contains, then select a port.
EPICenter Reference Guide 233

Real-Time Statistics
234
A set of utilization statistics for the selected port is displayed, as shown in Figure 138.
Figure 138: Utilization data over time for an individual port on a device
The number of data points displayed, and the sampling interval are user-configurable parameters, within the limitations of the device’s RMON configuration. The defaults are:
● A 30-second sampling interval
● 50 data points displayed
NOTE
For BlackDiamond switches, only 25 data points are displayed because that is the maximum number of values the switch stores as historical data.
For an individual port, you can display individual errors in addition to utilization and total errors. Select the tab at the bottom of the page to generate one of these displays. Figure 139 is an example.
EPICenter Reference Guide

Changing the Display Mode
Figure 139: Individual errors in a single-port chart
Changing the Display ModeThe buttons at the top of the page let you select the format of the statistical display, and control several other aspects of the display. The commands on the Statistics menu perform the same functions. You can change the display mode in the following ways:
● Apply a top 15 limitation, which means only the top 15 ports should be displayed. The top 15 ports are displayed in order from highest (largest percent utilization or largest total errors) to lowest. The number of ports is a user-configurable setting and is 15 by default. This option is available only for multi-port displays.
● Display the data as a line graph, pie chart, bar chart, horizontal bar chart, stacked bar chart, or an area chart.
● Display the data as a table.
● Zoom in (magnify) or Zoom out (shrink) the display.
● Display grid lines on the background of the chart.
● Take a “snapshot” of the graph or table view of the current real-time statistics data.
● Open the graph preferences pop-up window where you can change a variety of settings, such as graph and data colors, the sampling interval, or the number of ports in a top N display.
See Table 11 for a more complete description of the display functions.
EPICenter Reference Guide 235

Real-Time Statistics
236
Setting Graph PreferencesTo change the graph settings used in this applet, click the Prefs function button.
The Graph Preferences window is displayed, as shown in Figure 140.
Use the tabs across the top of the window to select the type of setting you want to change. Each tab displays a page with a group of related settings. When you have changed any setting you want on a given page:
● Click Apply to put the changes into effect, but keep the Graph Preferences window open so you can make changes on another page.
● Click OK to put the changes into effect and close the Graph Preferences window.
NOTE
The Graph preferences settings are not persistent—if you log out of EPICenter, the settings will return to the defaults.
Graph View (Figure 140) lets you change from 3D to 2D displays, and change the values for the 3D depth, elevation and rotation.
Figure 140: Setting 3D graph preferences
The fields in this window are as follows:
The Graph Colors tab (Figure 141) lets you set the colors for the graph background and text (data and axis labels).
Set 3D Graph View box To change to a 2D graph view, click the Set 3D Graph View box to remove the check mark.
View Depth Controls the depth of a bar. The default is 10, maximum is 1000.
View Elevation Controls the elevation (rise) from the front of the bar to the back, in degrees. The default is 10°, range is ±45°.
View Rotation Controls the angle of rotation of the bar, in degrees. The default is 12°, range is ±45°.
Minimum Graphed Utilization
Specifies the minimum scale for the Y axis for utilization graphs. The default is 1.0 (1%), meaning that the Y axis will not show less than 1% as the top value of the Y axis.
Minimum Graphed Errors Specifies the minimum scale for the Y axis for error graphs. The default is 25, meaning that the Y axis will not show less than 25 errors as the top value of the Y axis.
EPICenter Reference Guide

Setting Graph Preferences
Figure 141: Setting graph color preferences
To change a color, click on a button with the color bar icon. This displays a color selection window where you can select the color you want. You can select a color using color swatches, or by specifying HSB or RGB values.
The fields in this window are as follows:
The Data Colors tab (Figure 142) lets you set the colors used for the various data sets in your graph.
Figure 142: Setting data color preferences
To change a color, click on a button with the color bar icon. This displays a color selection window where you can select the color you want. You can select a color using color swatches, or by specifying HSB or RGB values.
The fields in this window are as follows:
Data colors in order starting from 1 are used in a pie chart, for as many slices as you’ve specified. (If you specify more than 12 slices, the colors will repeat, with slice 13 using the same color as slice 1.)
Set Graph Background Color Sets the color of the background surrounding the graph.
Set Graph Foreground Color Sets the color of the text and bar outlines.
Set Plot Background Color Sets the color of the background behind the graph data.
Set Data Color 1 The color used for Utilization and Total Error graphs.
Set Data Color 1 through 12 The colors used for the different errors in a individual errors chart.
EPICenter Reference Guide 237

Real-Time Statistics
238
The Graph Data tab (Figure 143) lets you set several miscellaneous graph parameters.
Figure 143: Setting other graph preferences
The fields in this window are as follows:
Taking Graph SnapshotsThe Real-Time Statistics Snapshot feature lets you take a static image of a graph or table view of the current real-time statistics data. The snapshot generates a persistent HTML page that is displayed in a separate window (see Figure 144).
Top N Display Count Specifies the number of ports to include in a Top N display. The default is 15, maximum is 100.
Pie Slice Display Count Specifies the number of slices to display in a pie chart. The default is 10, maximum is 50.
Historical Data Display Count
Specifies the number of historical data points to display in a graph for an individual port. The default is 50, the maximum value you can set is 100. However, the actual maximum number of data points you can get is determined by the SNMP agent running in the device from which you are getting data.
Historical Data Sampling Interval
The sampling interval to use when displaying historical data. Select a choice from the pull-down list. The choices in the list are determined by the configuration of the device from which you are getting data.
EPICenter Reference Guide
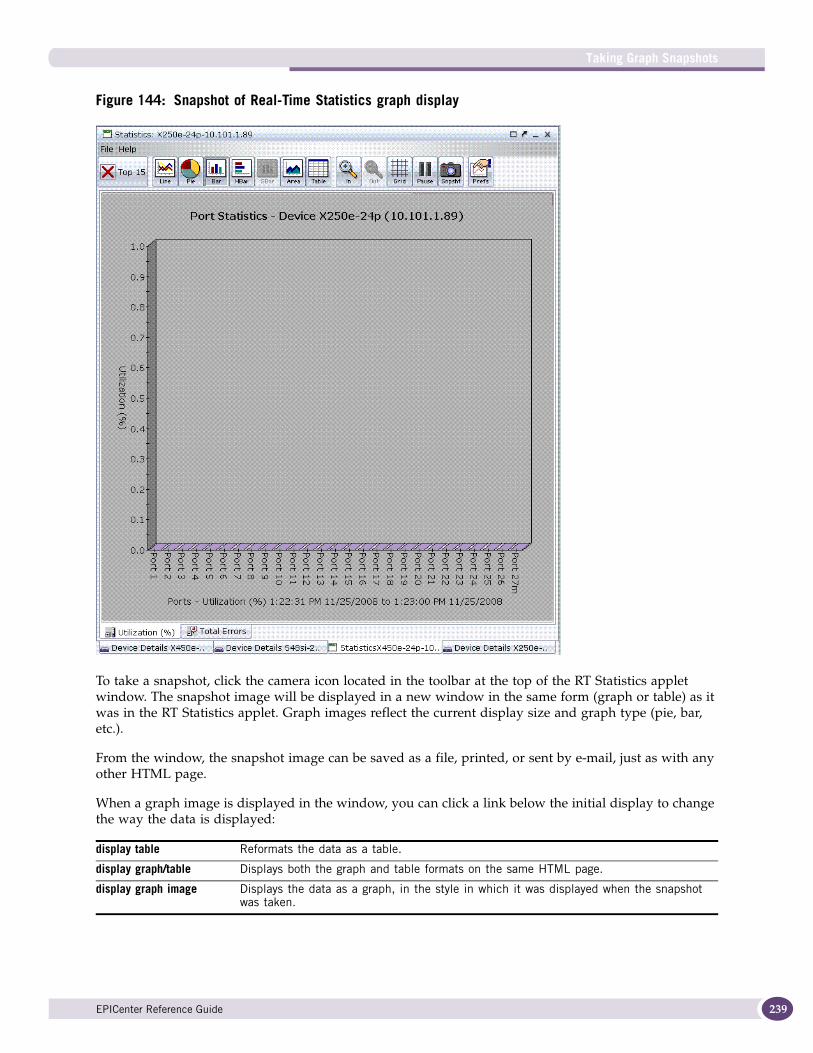
Taking Graph Snapshots
Figure 144: Snapshot of Real-Time Statistics graph display
To take a snapshot, click the camera icon located in the toolbar at the top of the RT Statistics applet window. The snapshot image will be displayed in a new window in the same form (graph or table) as it was in the RT Statistics applet. Graph images reflect the current display size and graph type (pie, bar, etc.).
From the window, the snapshot image can be saved as a file, printed, or sent by e-mail, just as with any other HTML page.
When a graph image is displayed in the window, you can click a link below the initial display to change the way the data is displayed:
display table Reformats the data as a table.
display graph/table Displays both the graph and table formats on the same HTML page.
display graph image Displays the data as a graph, in the style in which it was displayed when the snapshot was taken.
EPICenter Reference Guide 239

Real-Time Statistics
240
NOTE
Once you select “display graph image” you can no longer change the display format to a table or to a dual display. However, you can use the browser “Back” button to go to the previously displayed page.
When you snapshot a table, you cannot change to a graph from within the snapshot image window.
The HTML page persists in a snapshot image cache until the EPICenter server is restarted, or until the image cache becomes full. When the image cache reaches its limit, older snapshot images will be deleted as needed to make room for new snapshot images.
EPICenter Reference Guide

13 Managing and Monitoring VLANs
This chapter describes how to use EPICenter for:
● Configuring VLANs using EPICenter scripts
● Categorizing VLANs by network name
● Viewing VLAN details
● Viewing details about services configured on VLANs
● Viewing VMAN details
Overview of Virtual LANsA virtual local area network (VLAN) is a group of location- and topology-independent devices that communicate as if they were on the same physical LAN. Extreme Networks switches have a VLAN feature that enables you to construct broadcast domains without being restricted by physical connections.
EPICenter creates and manages VLANs for Extreme Networks devices only. It does not handle other third-party devices, even though third-party devices can be managed through EPICenter.
Extreme Networks devices can support a maximum of 4095 VLANs per switch. VLANs on Extreme Networks switches can be created according to the following criteria:
● Physical port
● 802.1Q tag
● Protocol sensitivity using Ethernet, LLC SAP, or LLC/SNAP Ethernet protocol filters
● A combination of these criteria
In the EPICenter system, a VLAN is defined uniquely by the following:
● Name
● 802.1Q tag (if defined)
● Protocol filters applied to the VLAN
● Network name
As a result, multiple switches are shown as members of the same VLAN whenever all the above are the same.
VMANs (Virtual Metropolitan Area Networks) enable a service provider to offer the equivalent of separate and independent virtual bridged LANs to multiple customers over the provider’s bridged network. EPICenter can display detailed information about the VMANs configured in your network.
For a more detailed explanation of VLANs and VMANs, see the ExtremeXOS Concepts and Solutions Guide.
EPICenter Reference Guide 241

Managing and Monitoring VLANs
242
Configuring VLANsUsing EPICenter, you can perform common VLAN configuration tasks, including creating, modifying, and deleting VLANs, as well as configuring VLAN protocol settings. VLAN configuration tasks are performed using EPICenter’s scripting feature.
Additionally, you can optionally assign VLANs to a network name, which is a means for categorizing VLANs into logical groups. After assigning one or more VLANs a network name, you can filter the information displayed in the VLAN table based on the network name. This can be useful if you have a large number of VLANs to manage.
Running VLAN Configuration ScriptsEPICenter includes a number of bundled scripts that allow you to specify VLAN configuration settings and deploy them on managed Extreme devices. Using EPICenter scripts, you can perform the following tasks:
● Create and configure a new VLAN
● Modify an existing VLAN
● Configure protocol settings for a VLAN
● Delete a VLAN and related configuration settings
To run an EPICenter script, go to the Services menu and select a script from the VLAN menu. Figure 145 shows the parameter configuration screen for the Create VLAN script.
Figure 145: Configuration Screen for the Create VLAN Script
EPICenter Reference Guide

Configuring VLANs
For information on how to use EPICenter scripts, see “Creating and Executing EPICenter Scripts” on page 191.
NOTE
After a VLAN is created, it may take between 1 and 5 minutes for the new VLAN to appear in EPICenter displays.
Categorizing VLANs With Network NamesA network name is a means for categorizing VLANs into logical groups, which can aid in filtering the information displayed in the VLAN table. This can be useful if you have a large number of VLANs to manage.
For example, you can assign VLANs to a category (a network name), such as “Building 1”, then use the quick filter function on the VLAN tab to limit the information displayed in the VLAN table to VLANs with the network name “Building 1”.
Creating a Network Name
To create a network name, do the following:
1 Under the Network Views folder, select a device group or the All group.
2 From the Tools menu, select VLAN network name. The Modify Network Name window is displayed, as shown in Figure 146.
Figure 146: Modify Network Name Window
3 Click New to open the New network name window.
4 Enter the network name and click create.
Assigning VLANs to a Network Name
To assign VLANs to a network name:
EPICenter Reference Guide 243

Managing and Monitoring VLANs
244
1 Under the Network Views folder, select the device group that contains the VLANs you want to categorize, or select the All group.
2 Do one of the following:
● Click the VLANs tab in the table view to display the VLANs in the device group.
● Click the Devices tab, then click the VLANs tab for the device to display the VLANs configured on the device.
3 In the table, select the VLANs that you want to assign to the network name. Use Ctrl-click or Shift-click if you want to select multiple entries in the table.
4 From the Tools menu, select VLAN network name. The Modify Network Name window is displayed, as shown in Figure 146.
5 Click the radio button next to the network name to which you want to assign the VLANs, and click Save.
Filtering the VLANs Table Based on Network Name
To use the network name to filter the list of VLANs in the VLAN table, do the following:
1 Under the Network Views folder, select a device group or the All group.
2 Click the VLANs tab in the table view to display the VLANs in the device group.
3 Expand the Quick Filter box to display the available quick filters. One of the quick filters is Network, as shown in Figure 147.
Figure 147: Filtering the VLAN Table Using the Network Name Quick Filter
Network NameQuick Filter
EPICenter Reference Guide

Viewing VLAN Information
4 In the Network quick filter box, select the network name to be used as the filter. Use Ctrl-click or Shift-click to select multiple network names. The VLAN table then displays only VLANs with the selected network name(s).
Viewing VLAN InformationTo view information about VLANs in EPICenter, click a device group or the All group under the Network Views folder, then click the VLANs tab. A table listing the VLANs in the group is displayed.
If you also have enabled the map view of the device group, you can select a VLAN and display an overlay view highlighting all of the devices and links in the map where the selected VLAN is configured, as shown in Figure 148.
Figure 148: VLANs in a Network Topology Map
The VLANs table has the following columns. You can filter the contents of the table by expanding the Filter box, and entering text and search criteria, or by expanding the Quick Filter box and selecting aan available quick filter.
EPICenter Reference Guide 245

Managing and Monitoring VLANs
246
You can enable the “Show Full Path” checkbox to display the path a packet would take across the various VLANs in the network, taking into consideration VLAN services configured on the managed devices, such as subscriber VLANs, Private VLANs, and VMANs.
Displaying VLAN DetailsTo display details about a VLAN, click on the VLAN’s row in the VLAN table. Information about the VLAN appears in the details window. If you double-click on the row, the VLAN details are displayed in a separate window, as shown in Figure 149.
Vlan Tag The VLAN tag value (if any) or “Untagged”, and an icon indicating the status of the VLAN. The icon can be one of the following:
The status of the VLAN is OK.
The VLAN has an Informational message associated with it, such as when there are no ports in the VLAN.
The VLAN has an Alert message associated with it, such as when one or more ports in the VLAN are disabled or down.
The VLAN has a Warning message associated with it, such as when the device where the VLAN is configured is down or SNMP unreachable.
Name The VLAN name.
Network The network name category (if any) that this VLAN belongs to. See “Categorizing VLANs With Network Names” on page 243 for more information.
Services List of the type of services configured for the network VLAN.
Protocol filter The protocol filter(s) configured for the VLAN
IP forwarding Whether IP forwarding is enabled for the VLAN.
Last updated from database
Date and time that the information about the VLAN was last retrieved from the EPICenter database.
Protected VLAN Whether any EAPS protected VLAN is present in the list of available VLANs.
Type The VLAN type, either VLAN or VMAN.
Status The level of the highest-priority status message associated with the VLAN.
EPICenter Reference Guide

Displaying VLAN Details
Figure 149: VLAN Details Window
The VLAN details window has the following fields:
Device/Ports TabWhen you click the Device/Ports tab, the following columns are displayed:
Tag The VLAN tag value (if any) or “Untagged”.
Network The network name category (if any) that this VLAN belongs to. See “Categorizing VLANs With Network Names” on page 243 for more information.
Name The VLAN name.
Services List of the type of services configured for the network VLAN.
Protocol filter The protocol filter(s) configured for the VLAN
IP forwarding Whether IP forwarding is enabled for the VLAN.
Control VLAN Whether any EAPS control VLAN is present in the list of available VLANs.
Protected VLAN Whether any EAPS protected VLAN is present in the list of available VLANs.
Type The VLAN type, either VLAN or VMAN.
Last updated from database Date and time that the information about the VLAN was last retrieved from the EPICenter database.
Device name The name of the device, and an icon indicating the status of the device.
IP address The IP address of the device.
Virtual router The virtual router to which the VLAN is associated on the device
EPICenter Reference Guide 247

Managing and Monitoring VLANs
248
Ports TabSelecting a device in the Device/Ports table displays the ports on the selected device that are part of the VLAN. The following columns are displayed:
Layer 3 Settings TabThe Layer 3 Settings tab includes the following columns:
QOS profile name QoS profile name configured for the VLAN on the device, if any.
Control VLAN Whether this VLAN is configured as an EAPS control VLAN.
Protected VLAN Whether this VLAN is protected by an EAPS domain.
Domain Name Set EAPS domains to which the VLANs on the device belong.
Vlan services VLAN service type. Possible values are Translation, Translation-Member, EAPS-Protected, VMAN, Translation VMAN, Translation-Member VMAN, Private-VLAN, Isolated-Subscriber, Non-Isolated Subscriber, Super VLAN, and Sub VLAN.
Software version The ExtremeXOS software version running on the device.
SNMP version The SNMP version configured on the device.
Log on username The username used to log on to the device
Forwarding-database polling Whether FDB polling is enabled on the device.
Device manager protocol The protocol used for accessing management functions on the device.
Device type The type of device.
Admin State The administrative state of the VLAN, either Enabled or Disabled.
Number Port number. If the device is a chassis device, then the port number is displayed in slot:port format.
Name The name of the port, if configured
Tagged Whether the port is tagged
Media The port media, if applicable
Type The port type. Different icons are used to represent the port types:
• 10/100Mbps ( )
• 100Base-FX ( )
• 100Base-T/TX ( )
• 1000BASE-X ( )
• Tagged ports are shown with a small orange tag ( )
• Load-shared ports (for devices running ExtremeWare) are indicated with a small green S ( ).
Actual speed Speed of the port; Auto if the speed is auto-negotiated.
Actual duplex Duplex of the port, either full or half
Configured speed The configured speed of the port
Configured duplex The configured duplex setting of the port
State The port state (Enabled or Disabled)
Device name The name of the device, and an icon indicating the status of the device.
IP address The IP address of the device.
EPICenter Reference Guide

Displaying VLAN Details
Links TabThe Links tab contains information about the links that are part of the selected VLAN
VLAN IP address The IP address of the VLAN.
VLAN IP mask The subnet mask of the VLAN.
IP forwarding enabled Whether IP forwarding is enabled for the VLAN.
Status An icon indicating the status of the link. The link status icon can be one of the following colors:
Up
Last known up
Down
Last known down
At least one of the links in a shared link is down
Last known at least one of the links in a shared link is down
User-created link
Last known user-created link
Unknown
A device The name of the device on one end (the A side) of the link, along with an icon indicating the device status.
A IP address The IP address of the device on the A side of the link.
A port name The name of the port on the A side of the link, along with an icon indicating the port status.
A port number The number of the port on the A side of the link.
B device The name of the device on the other end (the B side) of the link, along with an icon indicating the device status.
B IP address The IP address of the device on the B side of the link
B port name The name of the port on the B side of the link, along with an icon indicating the port status.
B port number The number of the port on the B side of the link.
Discovery protocol The protocol used to discover the link, either EDP or LLDP.
State The current state of the link
Type The link type; for example, user-created.
A device status The current status of the device on the A side of the link.
A device worst alarm The status of the highest alarm on the device on the A side of the link.
A port status Whether the port on the A side of the link is enabled or disabled.
A link state Whether the A side of the link is ready to exchange traffic with the B side of the link.
A port type The type of port on the A side of the link.
A port share details Information about the port sharing configuration on the A side of the link, if configured.
B device status The current status of the device on the B side of the link.
B device worst alarm The status of the highest alarm on the device on the B side of the link.
B port status Whether the port on the B side of the link is enabled or disabled.
B link state Whether the B side of the link is ready to exchange traffic with the A side of the link.
EPICenter Reference Guide 249

Managing and Monitoring VLANs
250
Status Messages TabIf there are status messages associated with the selected VLAN, they are displayed in the Status Messages tab. The Status Messages tab includes the following columns:
Viewing VLAN Services InformationIf the VLAN service type column for the VLAN indicates that a service is configured for the VLAN, additional information is displayed in the VLAN details window, next to the Ports tab. Depending on the type of service configured, one of the following tabs may be displayed:
● Translation VLAN tab
● Translation-Member VLAN tab
● Private VLAN tab
● Isolated-Subscriber VLAN tab
● Non-Isolated Subscriber VLAN tab
● Super VLAN tab
● Sub VLAN tab
Translation VLAN TabIf you select a device in the Device/Ports table that has a Translation VLAN configured (indicated by “Translation” in the VLAN service type column) the Translation VLAN tab appears. The Translation VLAN tab contains the following information:
● The name of the Translation VLAN
● The name of the network to which the Translation VLAN belongs
● The tagged and untagged ports in the Translation VLAN
In addition, a table listing the information about the members of the Translation VLAN is displayed. This table contains the following columns:
B port type The type of port on the B side of the link.
B port share details Information about the port sharing configuration on the B side of the link, if configured.
Status An icon indicating the status of the VLAN for each device where the VLAN is configured. The icon can be one of the following:
The VLAN has an Informational message associated with it.
The VLAN has an Alert message associated with it.
The VLAN has a Warning message associated with it.
Message The text of the status message.
Device The device to which the status message applies.
IP address The IP address of the device.
Port Number(s) The port numbers to which the status message applies, if applicable.
EPICenter Reference Guide

Displaying VLAN Details
Translation-Member VLAN TabIf you select a device in the Device/Ports table that is a member of a Translation VLAN (indicated by “Translation-Member” in the VLAN service type column) the Translation-Member VLAN tab appears. The Translation-Member VLAN tab contains the following information:
● Tag value of the Translation VLAN to which the member belongs
● The name of the network to which the Translation VLAN belongs
● The name of the Translation VLAN to which the member belongs
● The tagged and untagged ports configured in the Translation VLAN
Private VLAN TabIf you select a device in the Device/Ports table that has a Private VLAN configured (indicated by “Private” in the VLAN service type column) the Private VLAN tab appears. The Private-Network VLAN tab contains the following information:
● Name of the Private VLAN
● Network name of the Private VLAN
● List of Tagged, Untagged, and Translated Ports in the Private-Network VLAN
In addition, a table listing information about the Isolated and Non-Isolated Subscriber VLANs is displayed. This table contains the following columns:
Isolated-Subscriber VLAN TabIf you select a device in the Device/Ports table that is an isolated subscriber member of a Private VLAN (indicated by “Isolated-Subscriber” in the VLAN service type column) the Isolated-Subscriber VLAN tab appears. The Isolated-Subscriber VLAN tab contains the following information:
● Tag value of the Private-Network VLAN
● Network name of the Private-Network VLAN
● Name of the Private-Network VLAN
● Name of the Private VLAN
● List of Tagged, Untagged, and Translated ports associated with the Private-Network VLAN
Tag Tag value of the Translation VLAN member
Network Name of the network to which the Translation VLAN member belongs
Name VLAN name of the Translation VLAN member
Ports List of the tagged and untagged ports in the Translation VLAN member
Tag Tag value of the subscriber VLAN
Type Whether the subscriber VLAN is isolated or non-isolated
Network Network name of the Private VLAN
Name Name of the subscriber VLAN
Ports List of the tagged and untagged ports in the subscriber VLAN
EPICenter Reference Guide 251

Managing and Monitoring VLANs
252
Non-Isolated Subscriber VLAN TabIf you select a device in the Device/Ports table that is a non-isolated subscriber member of a Private VLAN (indicated by “Non-Isolated Subscriber” in the VLAN service type column) the Non-Isolated Subscriber VLAN tab appears. The Non-Isolated Subscriber VLAN tab contains the following information:
● Tag value of the Private-Network VLAN
● Network name of the Private-Network VLAN
● Name of the Private-Network VLAN
● Name of the Private VLAN
● List of Tagged, Untagged, and Translated ports associated with the Private-Network VLAN
Super VLAN TabIf you select a device in the Device/Ports table that has a Super VLAN configured (indicated by “Super VLAN” in the VLAN service type column) the Super VLAN tab appears. The Super VLAN tab contains the following information:
● The name of the Super VLAN
● Network name of the Super VLAN
● The tagged and untagged ports in the Super VLAN
In addition, a table listing the information about the Sub VLANs of this Super VLAN is displayed. This table contains the following columns:
Sub VLAN TabIf you select a device in the Device/Ports table that has a Sub VLAN configured (indicated by “Sub VLAN” in the VLAN service type column) the Sub VLAN tab appears. The Sub VLAN tab contains the following information:
Sub VLAN information:
● IP address range of the Sub VLAN
● VLAN proxy status of Sub VLAN, either Enabled or Disabled
Super VLAN information:
● The name of the Super VLAN
● Tag value of the Super VLAN
● Network name of the Super VLAN
● The tagged and untagged ports in the Super VLAN
Tag Tag value of the Sub VLAN
Network Name of the network to which the Translation VLAN member belongs
Sub Range Range of IP addresses in the Sub VLAN
Proxy Status of the VLAN proxy, either Enabled or Disabled
Name Name of the Sub VLAN
Ports List of the tagged and untagged ports in the Sub VLAN
EPICenter Reference Guide

Displaying VMAN Details
Displaying VLAN Details for a Selected DeviceSee “Displaying Device Details” on page 30 for information about displaying VLAN information for an individual device.
Displaying VMAN DetailsTo display details about a VMAN, click on its row in the VLAN table. VMANs are indicated by “VMAN” in the Type column in the VLAN table. When you do this, information about the VMAN appears in the details window. If you double-click on the row, the VMAN details are displayed in a separate window.
The VMAN details window has the following fields:
VMAN Device/Ports TabWhen you click the Device/Ports tab in the VMAN details window, the following columns are displayed:
Ports TabSelecting a device in the Device/Ports table displays the ports on the selected device that are part of the VLAN. The following columns are displayed:
Tag The VMAN tag value.
Name The name of the VMAN.
Status The status of the VMAN, indicated by the highest priority status message on the devices where the VMAN is configured.
Type The VLAN type, in this case VMAN.
Last updated from database Date and time that the information about the VMAN was last retrieved from the EPICenter database.
Status of VMAN on device An icon indicating the status of the VMAN for each device where the VMAN is configured. The icon can be one of the following:
The status of the VMAN is OK.
The VMAN has an Informational message associated with it.
The VMAN has an Alert message associated with it.
The VMAN has a Warning message associated with it.
Device name The name of the device, and an icon indicating the status of the device.
IP address The IP address of the device.
Ports The ports that are associated with the VMAN, along with the port status, and whether the ports are tagged or untagged.
VMAN Name The VMAN name.
EPICenter Reference Guide 253
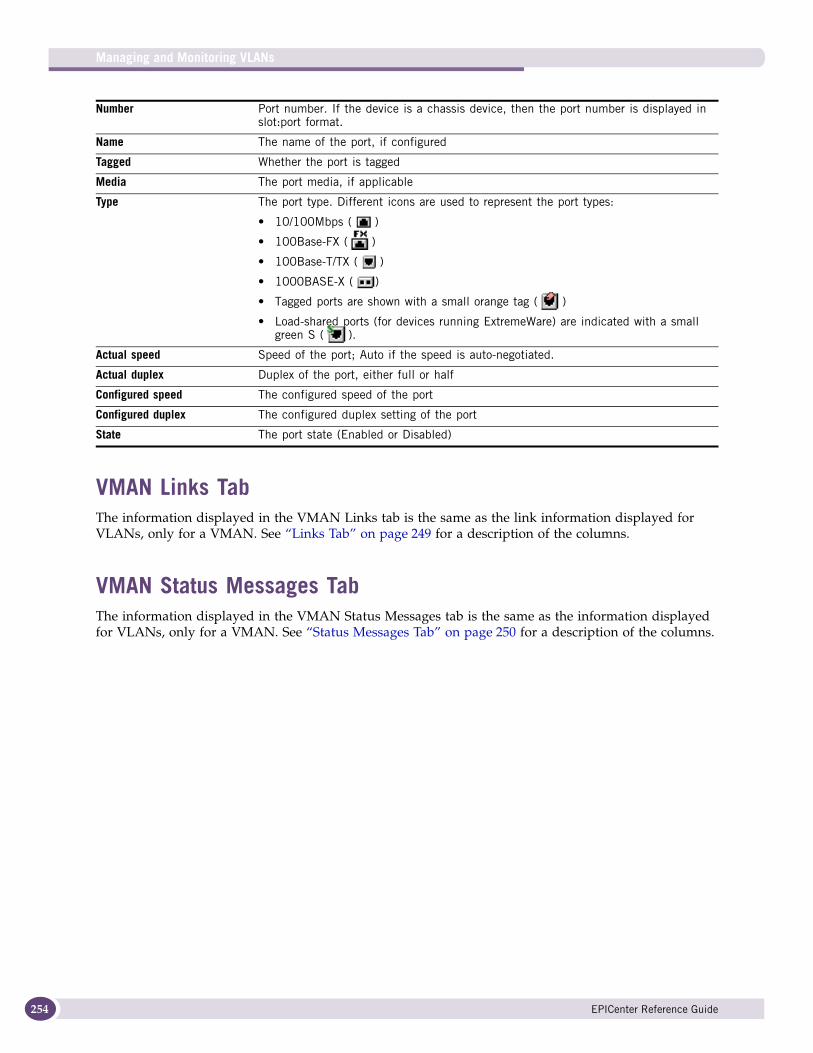
Managing and Monitoring VLANs
254
VMAN Links TabThe information displayed in the VMAN Links tab is the same as the link information displayed for VLANs, only for a VMAN. See “Links Tab” on page 249 for a description of the columns.
VMAN Status Messages TabThe information displayed in the VMAN Status Messages tab is the same as the information displayed for VLANs, only for a VMAN. See “Status Messages Tab” on page 250 for a description of the columns.
Number Port number. If the device is a chassis device, then the port number is displayed in slot:port format.
Name The name of the port, if configured
Tagged Whether the port is tagged
Media The port media, if applicable
Type The port type. Different icons are used to represent the port types:
• 10/100Mbps ( )
• 100Base-FX ( )
• 100Base-T/TX ( )
• 1000BASE-X ( )
• Tagged ports are shown with a small orange tag ( )
• Load-shared ports (for devices running ExtremeWare) are indicated with a small green S ( ).
Actual speed Speed of the port; Auto if the speed is auto-negotiated.
Actual duplex Duplex of the port, either full or half
Configured speed The configured speed of the port
Configured duplex The configured duplex setting of the port
State The port state (Enabled or Disabled)
EPICenter Reference Guide

14 Using the Universal Port Manager
This chapter describes how to use the Universal Port Manager. In EPICenter, the Universal Port Manager is known as the Profile Manager. This chapter contains the following sections:
● Overview of the Universal Port Manager on page 255
● Network Profiles View on page 258
● Managed Profiles View on page 273
● Creating and Editing UPM Profiles on page 278
● Profile Trigger Events on page 290
● Universal Port Event Variables on page 291
Overview of the Universal Port ManagerThe EPICenter Universal Port Manager (UPM) provides tools for managing and creating ExtremeXOS Profiles in EPICenter and deploying them on the network.
EPICenter UPM provides:
● A user-friendly profile editor for rapid profile authoring
● Centralized monitoring and management of network-wide profiles
● A repository for storing your profiles and templates
● Prepackaged profile templates and the ability to easily import external profiles
● Ability to deploy profile scripts onto multiple devices in a single deployment
● Interactive, real-time profile testing and debugging by event simulation
● Manual and/or periodic network synchronization to track profile changes on the network
● Detailed audit log for all profile change activities done by this EPICenter server to the network
● Import profiles from your local machine
● Diff tool to find out the network profile changes carried out by users manually or using 3rd party tools
To start UPM, expand the Network Administration folder and click Profile Manager.
Users with Admin privileges can create, modify, and deploy profiles. All other users can view the profiles and details but cannot modify, run, or test them.
ExtremeXOS Software RequirementsThe Universal Port Manager manages profiles from switches with ExtremeXOS version 12.0 or later.
Before you start using EPICenter UPM:
EPICenter Reference Guide 255

Using the Universal Port Manager
256
● Make sure that SNMP is enabled on switches, so that you can add devices into EPICenter's inventory.
● Enable HTTP or HTTPS on the devices to be managed by the UPM.
● To enable HTTP on the device use the command: enable web http
● To enable HTTPS on the device use the command: enable web https
UPM FunctionsEPICenter UPM is organized into two functional areas:
● The Network Profiles view, where you can view, enable, disable, edit configuration, run, and delete the profiles deployed on the Extreme devices. You can also change the profile event binding or port binding configuration on switches.
● The Managed Profiles view, where you can import, export, create, view, edit, save, delete, test, and deploy profiles.
In addition, you can use the EPICenter Audit Log to view the profile actions done on the network devices by EPICenter, and redeploy profiles to devices where you had deployed them earlier.
You can access the views using the related tabs at the top of the UPM window.
For ease of profile management with a large network of devices, use device groups and port groups whenever possible to facilitate the profile deployment.
There are several methods to invoke the functions provided by EPICenter UPM:
● Using the menus at the top of each tabbed window. The available menu items depend on whether you have read-only access or read/write access in EPICenter. Certain menu items are enabled or disabled depending on what you select in the profiles table in the selected view.
● Using the function buttons shown directly below the menus in each tabbed window.
● Using the table cell links displayed in blue with an underline and activated by a single mouse click.
● Double clicking a table row to open an item.
The menu for each functional area changes according to the task you can perform using that view.
You can collapse and expand the Filter and Quick Filter panes using the chevron buttons, or by clicking the title bar of the pane.
You can sort the contents in the table by clicking the table column header. An arrow is displayed for the sort direction and a number with the relative sort order. If no arrow is displayed, the table column is unsorted. Click the table column header with the Ctrl key pressed down to perform extended sorting on multiple columns.
EPICenter Reference Guide

Overview of the Universal Port Manager
Figure 150: Universal Port Manager Window
Understanding UPM TerminologyThe following table describes the terminology used by EPICenter UPM.
Table 12: UPM Terminology
Term Description
Profiles Files with commands or scripts that can be run on a switch.
Static profile A profile that is bound to a USER-REQUEST event. A static profile is an ExtremeXOS term for a profile not bound to any ExtremeXOS event.
The changes made to a switch using a static-profile or USER-REQUEST triggered profile is persistent. If you execute the save config command, the configuration changes remain even if you reboot the switch.
Dynamic profile A profile that is bound to events other than a USER-REQUEST event. The scripts are run only when an event occurs, or when a timer triggers; for example, when a new IP phone is detected on the network.
The changes made to a switch by a dynamic profile are not persistent. The changes are lost if you restart the switch.
Device profile A profile that can be triggered by an LLDP DEVICE-DETECT or DEVICE-UNDETECT event.
User Profile A profile that can be triggered by a USER-AUTHENTICATED or USER-UNAUTHENTICATED event.
EPICenter profile A switch profile that is saved in EPICenter.
Non-EPICenter profile A switch profile that is not saved in EPICenter.
EPICenter Reference Guide 257

Using the Universal Port Manager
258
Network Profiles ViewThe Network Profiles view provides you details on the profiles deployed on your network.
Deployed profile A profile saved in EPICenter locally and that is deployed on a device on the network. EPICenter allows you to create a profile and deploy it to devices or to import profiles already existing on a device into EPIcenter.
EPICenter Profile Status Status of the EPICenter Profile on a switch. The status can be:
• Same as Deployed – The profile on the switch is the same as the one in EPICenter.
• Missing – A profile managed by EPICenter that was deployed to a device is missing from the device.
• Different than Deployed – The profile on the switch is different from the one in EPICenter records.
• N/A – The profile is not saved in EPICenter. This is a non-EPICenter profile, so EPICenter status is not applicable.
Trigger Event Event that causes a profile to run. For example, when a user is authenticated, a device is detected, or a timer is triggered.
Event Binding The link between an event and what needs to be executed.
Port Binding The link between the port and the profile execution on the port.
Profile environment variables
Variables (or parameters) used in the profile commands, such as $VLAN or $ports
System variables Variables that ExtremeXOS provides during runtime. Profiles can use them without defining them first.
Scripting A capability of the ExtremeXOS CLI to execute a set of commands, with values for certain command parameters being automatically substituted by the system, others being user-defined (system and user-defined variables). Scripting also provides control structures such as IF/THEN/ELSE and data manipulation functions. Any CLI command can be used in a script.
In addition, a script may have extensions that are needed for and only relevant to the Universal Port and its profiles, such as persistent/non-persistent mode.
Device Groups A set of network devices that have something in common, and that can be managed in EPICenter as a group. For example, devices might be grouped by physical location (Building 1, Building 2, first floor, second floor) or by functional grouping (Engineering, Marketing, Finance) or by any other criteria that make sense within the managed network environment.
Port Groups You can also organize ports into groups. The ports in a group can be a mix of port types and can come from many different devices. For example, a port group that can be used to connect VoIP phones might contain one port from each of many different devices.
Table 12: UPM Terminology
Term Description
EPICenter Reference Guide

Network Profiles View
Figure 151: Universal Port Manager Network Profiles View
The buttons on the Network Profiles view provide the following functions:
NOTE
All icons, except the View icon, are active only when the device is HTTP-reachable.
Table 13: UPM Network Profiles View Function Buttons
View Views a selected profile.
Select a profile from the Filtered Profiles on HTTP-Reachable Devices table, and click this button to view the profile.
This button is not active when the profile is unknown.
View Diff Invokes the difference viewer to view the differences between profiles.
This button is active only if you have selected only one profile, the profile you have selected is saved in EPICenter, and the profile on the device is different from the one you have saved in EPICenter.
Save As Saves a selected profile under a new name
Select one profile from the Filtered Profiles on HTTP-Reachable Devices table, then click this button to save the profile with a different name. The Save Profile As window appears.
This button is active only when you select one profile.
Delete Profile Deletes a selected profile
Select one or more profiles from the Filtered Profiles on HTTP-Reachable Devices table, then click this button to delete the selected profile.
EPICenter Reference Guide 259

Using the Universal Port Manager
260
Filters and Quick FiltersYou can search for profiles deployed to a specific device in a specific device group. The device groups defined in EPICenter are displayed in the Device group drop-down list. Select All to display the profiles in all devices in all device groups. The device group list does not include device groups that have no devices in them.
You can refine the search for a specific profile using the Filtered Profiles drop-down list.
The following definitions are available for Filtered Profiles drop-down list:
Enable Profile Enables a profile on a device.
Select one or more profiles from the Filtered Profiles on HTTP-Reachable Devices table, then click this button to enable the profile on the device.
This button is active only if one or more disabled profiles are selected.
Disable Profile Disables a profile on a device.
Select one or more profile from the Filtered Profiles on HTTP-Reachable Devices table, then click this button to disable the profile on the device.
This button is enabled only if one or more enabled profiles are selected.
Edit Configuration on the device
Allows you to change settings for the profile.
Select a profile from the Filtered Profiles on HTTP-Reachable Devices table, then click this button to edit the profile configuration, such as, event-port bindings.
This button is active only if you select one enabled or disabled profile. The profile should not be missing from the device.
Run Runs a profile on a device.
Select one profile from the Filtered Profiles on HTTP-Reachable Devices table, then click this button to run the profile manually by event simulation.
This button is active only when one enabled profile is selected from the table.
Update Device View Synchronizes profiles between the network and EPICenter.
Select one or more profiles from the Filtered Profiles on HTTP-Reachable Devices table, then click this button to synchronize the profile details between EPICenter and the network.
Display Update Results Display the results of the last Update Device View or Update All Devices action.
This icon is visible only after you run the Update Device View after you login. The results are saved until you logout.
Table 14: Filtered Profiles Search Definitions
Search Parameter Description
All Searches the entire database.
Device Name Lists profiles for a specific device name.
IP Address Lists profiles for a specific IP address.
Table 13: UPM Network Profiles View Function Buttons
EPICenter Reference Guide

Network Profiles View
The following columns appears in the Quick Filter section of the window:
The Filtered Profiles On HTTP-Reachable Devices table displays the following information about the profile on the network:
NOTE
An HTTP-reachable device that does not have any profile will not be shown in this table. A device that is not HTTP reachable, and EPICenter is not sure about any profile existing on the device or not, is shown in this table with profile “Unknown”.
Profile Name Lists profiles with a specific name.
Profile State Lists profiles with a specific profile state.
Trigger Event Lists profiles with a specific Trigger Event.
Device Last Reached Lists profiles with a specific Device Last Reached time.
Last Attempt to Reach Device
Lists profiles with a specific Last Attempt to Reach Devices time.
Profile Type Lists profiles with a specific profile type.
EPICenter Profile Status Lists profiles with a specific EPICenter Profile Status.
Ability to Reach Device Lists profiles with a specific Ability to Reach Devices status.
Case Sensitive Specifies a case-sensitive search.
Case Insensitive Specifies a case-insensitive search.
Use wild cards Allows you to use * in place of a string of characters or ? in place of a single character in the search
Match from start Searches from the start of the keyword.
Match anywhere Searches anywhere in the keyword.
Search Parameter Description
Device Name Searches for profiles on the selected device
IP Address Searches for profiles on devices that have the selected IP address
Profile Name Searches for the selected profile name
Trigger Event Searches for the selected trigger event associated with the profiles.
Table 15: Filtered Profiles On HTTP-Reachable Devices Table
Column Description
Profile Name Name of the profile on the device. Click on the profile name link to open the profile details.
A profile on a switch may show up multiple times in the table. For example, if a profile is bound to a DEVICE-DETECT and DEVICE-UNDETECT event on a switch, the profile will appear twice.
Profile State In ExtremeXOS, the state of the profile. Enabled or Disabled.
Trigger Event Event that triggers the profile to run.
Table 14: Filtered Profiles Search Definitions (continued)
Search Parameter Description
EPICenter Reference Guide 261

Using the Universal Port Manager
262
The following icons are used in the Filtered Profiles On HTTP-Reachable Devices table:
EMS Filter Name The EMS filter associated with the profile, if the Trigger Event for the profile is a log message. If the profile is not triggered by a log message, then N/A is displayed in this column.
Ports Ports on which the profile was configured to run on or is bound to.
Device Name Name of the device to which the profile was deployed.
IP Address IP Address of the device to which the profile was deployed.
Device Last Reached The time at which the UPM information was last updated.
Last Attempt to Reach Device The time at which the UPM last attempted to update information.
Profile Type The type of profile.
• Non-EPICenter—The profile was not deployed by EPICenter.
• EPICenter—The profile was deployed by EPICenter or imported to EPICenter.
EPICenter Profile Status Status of the EPICenter profile on the device.
• Missing—The profile deployed by EPICenter is missing from the device.
• Same as Deployed—The profile in the device is same as the one deployed by EPICenter.
• Different—The profile in the device is different from the one deployed by EPICenter.
• N/A—The profile is not saved in the EPICenter.
Ability to Reach Device Indicates whether the device can be reached using HTTP.
• Down or HTTP unreachable—The device is not operational or EPICenter is not able to reach the device using HTTP. To find out why EPICenter can not reach the device, select a profile on this device and then click Update Device View. Verify the update device view results to see whether any error message is displayed.
• HTTP reachable—EPICenter is able to reach the device using HTTP.
Profile Validity State
Upm Switch Validity State
Table 16: Icons in the Filtered Profiles on HTTP-Reachable Devices Table
The profile was deployed by EPICenter and is same as the one in EPICenter.
The profile is different from what was deployed by EPICenter.
The profile that was deployed by EPICenter is missing.
The status of the profile deployed by EPICenter is unknown because the device is unreachable or has been put offline.
The profile is not an EPICenter profile.
Table 15: Filtered Profiles On HTTP-Reachable Devices Table (continued)
Column Description
EPICenter Reference Guide

Network Profiles View
Viewing Details for a ProfileFrom the Network Profiles tab, you can view the details of a profile. The details of any timer event bound to profiles can only be viewed from the profile detail dialog.
If a profile is managed by EPICenter and is missing from the deployed device, profile content will also be missing in the Profile details dialog. But you can find the last deployed profile content in the Managed Profiles View. The profile details are read-only.
The Profile Name in the Filtered Profiles On HTTP-Reachable Devices table acts as a link to the profile details. Click on a profile name in the table to open the Profile details window.
Figure 152: Profile Details Dialog
The Profile Details dialog provides the following details:
Table 17: Information in the Profile Details dialog
Section/Field Description
Profile
Name Name of the profile.
State State of the profile on the device. Shows whether the profile is enabled or disabled.
Profile Type Indicates whether the profile is an EPICenter profile or not.
Last Modified on device Shows the time on which the profile was last modified on the device.
EPICenter Status Shows the EPICenter status of the profile.
Description This is the description you have added in the script for this profile.
Device
Name Name of the device to which the profile was deployed.
EPICenter Reference Guide 263
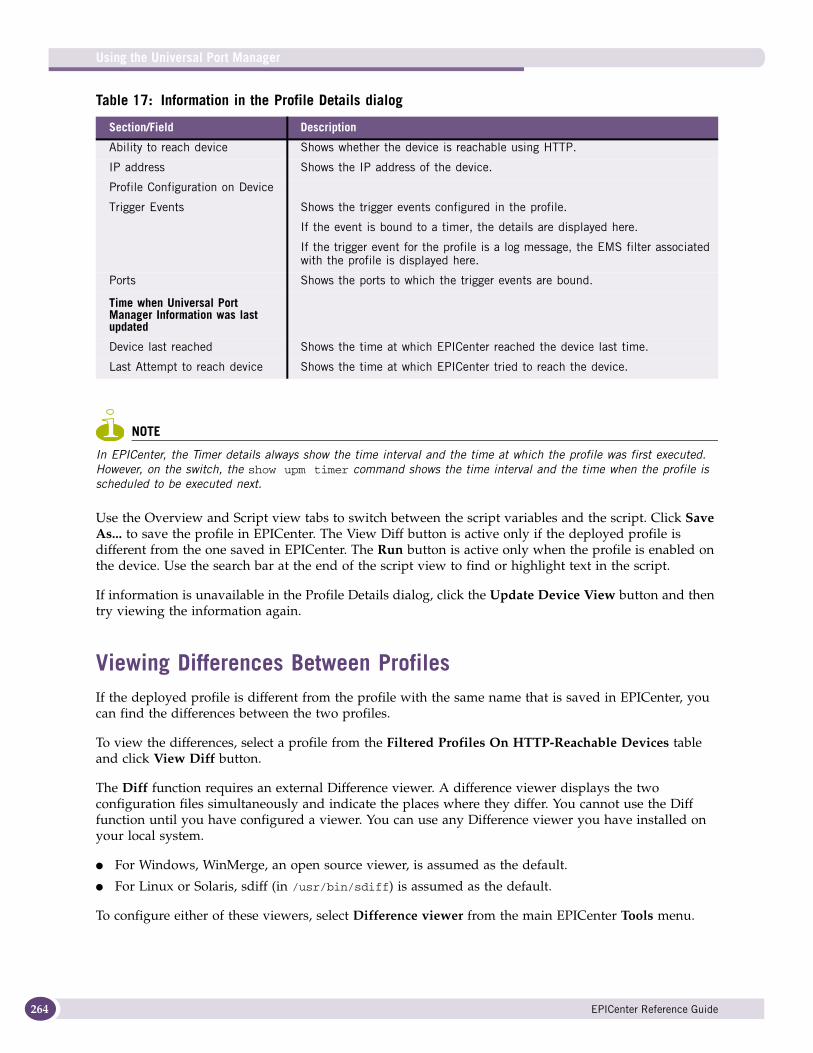
Using the Universal Port Manager
264
NOTE
In EPICenter, the Timer details always show the time interval and the time at which the profile was first executed. However, on the switch, the show upm timer command shows the time interval and the time when the profile is scheduled to be executed next.
Use the Overview and Script view tabs to switch between the script variables and the script. Click Save As... to save the profile in EPICenter. The View Diff button is active only if the deployed profile is different from the one saved in EPICenter. The Run button is active only when the profile is enabled on the device. Use the search bar at the end of the script view to find or highlight text in the script.
If information is unavailable in the Profile Details dialog, click the Update Device View button and then try viewing the information again.
Viewing Differences Between ProfilesIf the deployed profile is different from the profile with the same name that is saved in EPICenter, you can find the differences between the two profiles.
To view the differences, select a profile from the Filtered Profiles On HTTP-Reachable Devices table and click View Diff button.
The Diff function requires an external Difference viewer. A difference viewer displays the two configuration files simultaneously and indicate the places where they differ. You cannot use the Diff function until you have configured a viewer. You can use any Difference viewer you have installed on your local system.
● For Windows, WinMerge, an open source viewer, is assumed as the default.
● For Linux or Solaris, sdiff (in /usr/bin/sdiff) is assumed as the default.
To configure either of these viewers, select Difference viewer from the main EPICenter Tools menu.
Ability to reach device Shows whether the device is reachable using HTTP.
IP address Shows the IP address of the device.
Profile Configuration on Device
Trigger Events Shows the trigger events configured in the profile.
If the event is bound to a timer, the details are displayed here.
If the trigger event for the profile is a log message, the EMS filter associated with the profile is displayed here.
Ports Shows the ports to which the trigger events are bound.
Time when Universal Port Manager Information was last updated
Device last reached Shows the time at which EPICenter reached the device last time.
Last Attempt to reach device Shows the time at which EPICenter tried to reach the device.
Table 17: Information in the Profile Details dialog
Section/Field Description
EPICenter Reference Guide
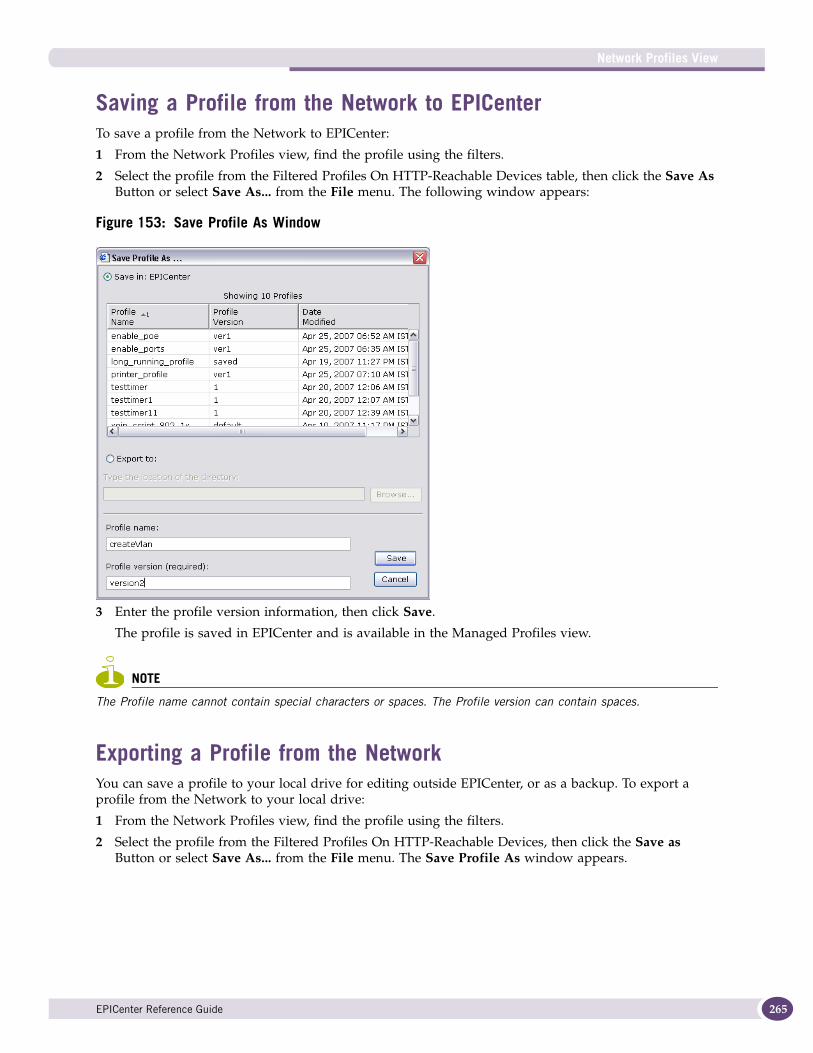
Network Profiles View
Saving a Profile from the Network to EPICenterTo save a profile from the Network to EPICenter:
1 From the Network Profiles view, find the profile using the filters.
2 Select the profile from the Filtered Profiles On HTTP-Reachable Devices table, then click the Save As Button or select Save As... from the File menu. The following window appears:
Figure 153: Save Profile As Window
3 Enter the profile version information, then click Save.
The profile is saved in EPICenter and is available in the Managed Profiles view.
NOTE
The Profile name cannot contain special characters or spaces. The Profile version can contain spaces.
Exporting a Profile from the NetworkYou can save a profile to your local drive for editing outside EPICenter, or as a backup. To export a profile from the Network to your local drive:
1 From the Network Profiles view, find the profile using the filters.
2 Select the profile from the Filtered Profiles On HTTP-Reachable Devices, then click the Save as Button or select Save As... from the File menu. The Save Profile As window appears.
EPICenter Reference Guide 265

Using the Universal Port Manager
266
Figure 154: Exporting a Profile
3 Click the Export to: button.
4 Enter the location of the directory or browse to the directory in which you wish to save the profile, then click Save.
The profile is saved to the directory you have selected.
Running a Profile on a Device ManuallyYou can manually run a profile that is deployed and enabled on a device.
NOTE
The running time of a profile cannot exceed the switch run profile timeout value (30 seconds).
To run a profile:
1 From the Network Profiles view, find the profile using the filters.
2 Select the profile from the Filtered Profiles On HTTP-Reachable Devices, then click the Run Button or select Run from the Tools menu. The Run Profile window appears.
You can use the Overview and ScriptView tabs to review the profile, but you cannot edit the profile.
EPICenter Reference Guide

Network Profiles View
Figure 155: Run Profile Window
3 In the Testing Events pane, Select the Trigger Events from the Trigger Events list. You can review the profile using the Overview and ScriptView tabs.
4 If needed, enter the Values for the variables. EPICenter will list any variables that are used in the profile and are meaningful for the selected event.
5 Click Run.
The Test Results section displays the result.
NOTE
When a profile is run on the selected device, all operations in the profile script are executed on the test device. No rollback is performed at the end of the session or when the Run Profile dialog is closed.
EPICenter Reference Guide 267

Using the Universal Port Manager
268
The following figure shows the results of a successful run:
Figure 156: Run Profile Window with a Successful Run
The following figure shows the results of a failed run attempt:
Figure 157: Run Profile Window with a Failed Run Attempt
EPICenter Reference Guide

Network Profiles View
Updating UPM Information From the NetworkThe Network Profiles view is usually kept up-to-date automatically without user intervention using the response to network events and a periodic poll. If you suspect that the Network Profiles view is out of date, you can manually update the view for all devices or for a specific device.
To manually update the UPM with the network, from the Network Profiles view select a row in the Filtered Profiles table, then click the Update Device View button. The EPICenter server obtains the profiles on the network to update the EPICenter database. After you start the manual update, browsing to other functions in EPICenter will not stop the update action. You can see the update result from the Update View Results dialog, even if you browse elsewhere and then return to the Profile Manager. The results are stored until you log off from EPICenter or overwritten by another update device action.
Click the Display Update Results button to view the Update View Results.
Figure 158: The Update View Results window
The Update View Results window contains the following details:
Using the Edit Profile Configuration WizardYou can edit the configuration details of a profile deployed on the network, unbind previous events, and bind new events using this wizard.
To edit the profile configuration:
1 Find the profile using the filters in Network Profiles View.
2 Select the profile from the Filtered Profiles on HTTP Reachable Devices table, then click the Edit Configuration button or select Edit Profile Configuration from the Tools menu. The Edit Profile Configuration wizard appears with the select trigger events page.
Table 18: Columns in the Update View Results window
Column Description
Type The type of message (Alert, Warning, Informational).
Date The date and time at which the update occurred.
Device The name of the device being updated.
IP Address The IP Address of the device being updated.
Message Details and results of the update.
EPICenter Reference Guide 269

Using the Universal Port Manager
270
Figure 159: Edit Profile Configuration: Select Trigger Events Page
The trigger events configured for the profile are preselected.
If you bind a profile to a USER-REQUEST event:
● If the profile is disabled, the profile is not executed at the time of deployment.
● If the profile is enabled, the profile will be executed at the time of deployment.
NOTE
If a profile is bound to a user request event, and the profile is disabled, you should enable the profile from the Network Profiles view and then click the Run button to run the script. The button is active only if the switch is HTTP reachable, and the profile is available on the switch.
If you select User Request or a timer event as the trigger event, the Deployment Information page appears.
See “Profile Trigger Events” on page 291 for critical details on timer events.
3 If needed, modify the trigger events, then click Next. The Select Port Page appears with the ports on which the profile is already deployed.
EPICenter Reference Guide

Network Profiles View
Figure 160: Edit Profile Configuration: Select Ports page
4 If needed, select new ports on which you want to deploy the profile. The Selected Ports table displays the updated ports list.
5 Click Next. The Deployment Information page appears.
Figure 161: Edit Profile Configuration: Deployment Information Page
6 Review the deployment details and click Validate. The profile validation page appears with the validation results. See the “Using the Profile Deployment Wizard” validation page for the details on profile validation.
EPICenter Reference Guide 271

Using the Universal Port Manager
272
Figure 162: Edit Profile Configuration: Profile Validation Page
7 Review the validation results, then click Deploy to change the profile bindings. The Deploy Profiles page appears with the results.
Figure 163: Edit Profile Configuration: Deploy Profiles Page
8 Click Finish to close the Edit Profile Configuration wizard.
EPICenter Reference Guide

Managed Profiles View
Managed Profiles ViewClick the Managed Profiles tab to open the Managed Profiles window. The Managed Profiles window provides details of the profiles saved in EPICenter.
Figure 164: Universal Port Manager Managed Profiles View
Managed Profiles Function ButtonsThe buttons at the top of the Managed Profiles view provide the following functions.
Table 19: UPM Managed Profiles Function Buttons
New Creates a new profile in EPICenter.
Open Opens a profile. By default, the button is disabled until you select a profile from the Filtered Profiles table.
Save As Saves a profile in EPICenter with a different name, a different version, or exports the profile to your hard disk. By default, the button is disabled until you select a profile from the Filtered Profiles table.
Import Imports a profile from the local drive.
Delete Deletes a profile saved in EPICenter. By default, the button is disabled until you select a profile from the Filtered Profiles table.
You cannot delete a profile that has already been deployed. To delete a deployed profile, you need to delete the profile from the switch using the network profile view, then return to this view and then delete the profile.
EPICenter Reference Guide 273

Using the Universal Port Manager
274
These functions can also be accessed through the File and Tools menu above the function buttons.
The Managed Profiles View
The Managed Profile view displays all the profiles saved in EPICenter. The Filtered Profiles table displays all the profiles that match the selected filter.
The Filtered Profiles table displays the following information based on the search criteria you entered:
Test Tests the profile on a device.
Deploy Initiates deployment of the profile. By default, the button is disabled until you select a profile from the Filtered Profiles table.
Table 20: Filter Definitions in Managed Profiles Window
Search Parameter Description
All Searches the entire database.
Profile Name Lists profiles with a specific name.
Profile Version Lists profiles with a specific profile version.
Date Modified Lists profiles with a specific modification date.
Modified By Lists profiles modified by a specific EPICenter user.
Deployed Lists profiles with a specified deployment status: Deployed or Not Deployed
Case Sensitive Specifies a case-sensitive search.
Case Insensitive Specifies a case-insensitive search.
Use wild cards Allows you to use * in place of a string of characters or ? in place of a single character in the search
Match from start Searches from the start of the keyword.
Match anywhere Searches anywhere in the keyword.
Table 21: Columns in the Filtered Profiles Table
Column Description
Profile Name Name of the profile as saved in EPICenter. Click on the profile name to open the profile.
Profile Version Version of the profile; for example, default or version12.
Date Modified Date on which the profile was last modified.
Modified By The last EPICenter user who modified the profile.
Deployed Whether the profile is deployed.
EPICenter Reference Guide

Managed Profiles View
Click a profile name from the Filtered Profiles Table. The Devices Deployed to table displays the following details:
Icons indicate the status of the profiles.
Table 23: Icons in Filtered Profiles Table
Renaming Profiles or Saving Profiles as a New VersionYou can rename a managed profile or save a profile as a new version. To do this:
1 From the Managed Profile view, filter the managed profiles and find the profile you want to rename.
2 Select the profile from the Filtered Profiles table.
3 Click the Save As button or select Save As from the File menu. The Save Profile As window appears.
Table 22: Columns in the Devices Deployed To table
Column Description
Device Name Name of the device to which the profile was deployed.
IP Address IP address of the device to which the profile was deployed.
Profile Name Name of the profile. The icon indicates the EPICenter status of the profile on the device.
EPICenter Profile Status Status of the EPICenter profile on the device.
• Different than deployed—The profile on the device is different from the one deployed by EPICenter.
• Same as deployed—The profile on the device is same as the one deployed by EPICenter.
• Missing—The profile deployed by EPICenter is missing from the device.
Ability to Reach Device Indicates whether the device is reachable using HTTP.
Last Attempt to Reach Device The time at which EPICenter tried to reach the device. For example: Mar 12, 2007 03:24 PM PDT.
Device Last Reached The time at which the device was last reached. For example: Mar 12, 2007 03:24 PM PDT.
This may be different from the Last Attempt to Reach Device.
The EPICenter Profile is not deployed.
The EPICenter Profile is deployed to one or more devices.
EPICenter Reference Guide 275

Using the Universal Port Manager
276
Figure 165: Renaming a Profile Using the Save Profile As Window
4 To rename the profile, change the Profile Name.
To save the profile as a new version, change the version details.
5 Click the Save button.
The profile is saved with the new name or version.
NOTE
The Profile name should not contain special characters or spaces. The Profile version may contain spaces.
EPICenter Reference Guide

Managed Profiles View
Importing a Profile from a Local Drive Into EPICenterTo import a profile from a local drive into EPICenter:
1 From the Managed Profiles view, click the Import button or select Import. from the File menu. The Import Profile window appears.
Figure 166: Import Profile Window
The profiles imported from the local drive will be managed by EPICenter. You can display information about the imported profile using the Managed Profiles view.
NOTE
The Profile name should not contain special characters or spaces. The Profile version may contain spaces.
EPICenter Reference Guide 277

Using the Universal Port Manager
278
Exporting an EPICenter Profile to a Local DriveTo export a profile from EPICenter to a local drive:
1 From the Managed Profiles view, click the Save As button or select Save As from the File menu. The Save Profile As window appears.
Figure 167: Save Profile As Window with Export To selected
2 Select Export To check box, then enter the location of the directory, or browse to the directory in which you wish to save the profile.
3 Click Save. The Profile is exported from EPICenter and saved in the directory you specified.
Creating and Editing UPM ProfilesEPICenter users with admin privileges can create and modify profiles, while other users can view them.
A UPM profile contains ExtremeXOS Script and UPM metadata. You can use any of the CLI commands available in ExtremeXOS in the script. By adding UPM metadata, you can create a convenient dialog for updating variables.
For details on ExtremeXOS Universal Port and CLI Scripting, see the ExtremeXOS Concepts Guide.
Creating UPM ProfilesThe following example illustrates how to create a UPM profile:
EPICenter Reference Guide

Creating and Editing UPM Profiles
1 In the Profile Manager, click the Managed Profiles tab.
2 Click New. The New profile dialog appears.
3 Click the Script View tab to open the script editor. By default, the script editor contains the following metadata content:
# @MetaDataStart# @ScriptDescription Default profile description.# @MetaDataEnd
4 Enter the ExtremeXOS commands after the metadata. A simple profile can even contain a single ExtremeXOS command, such as:
create vlan voice
When a new profile is created, it does not have any name or version. Click Save Changes to assign a name and version to the new profile.
5 Define a variable and use it to make the command easier to use. For example:
set var vlanName voice-avayacreate vlan $vlanName
NOTE
The vlanName variable in the set variable line does not contain “$”. But, when you use the variable, you need to add “$” before it.
The script has become more usable now. Because, if you use the vlanName elsewhere in the script, and you refer to your newly defined variable $vlanName, the same script can be used for creating other VLANs by simply changing the variable value voice-avaya to your new VLAN, like voice-avaya2; for example, if you also add ports to VLAN voice-avaya.
set var vlanName voice-avayacreate vlan $vlanNameconf vlan $vlanName tag $vlanTagconf vlan $vlanName ipaddress $vlanIPconf vlan $vlanName add ports $portsValue
If you want to change the VLAN voice-avaya to voice-avaya2, you only need to change the line set var vlanName voice-avaya to set var vlanName voice-avaya2, without changing it anywhere else.
6 Move the vlanName variable definition to EPICenter UPM metadata section and provide a user friendly description. This section starts with # @ MetaDataStart and ends with # @MetaDataEnd. By default, this section is created when you open a new profile dialog.
# @MetaDataStart# @ScriptDescription "Creation of VLAN for VOIP Installation"# @VariableFieldLabel "The VLAN name to create"set var vlanName voice-avaya# @MetaDataEndcreate vlan $vlanNameconf vlan $vlanName tag $vlanTagconf vlan $vlanName ipaddress $vlanIPconf vlan $vlanName add ports $portsValue
UPM metadata provides a dialog to make the script useful for those who are not familiar with the script.
EPICenter Reference Guide 279

Using the Universal Port Manager
280
The following profile contains the full content of the profile that can be used to create VLAN for provisioning switches for using the VoIP script pre-packaged with EPICenter.
NOTE
Since this profile is intended to be run on a switch only once, it should be bound to a USER-REQUEST event.
You can copy and paste the above script to the profile editor script view.
Click the Overview tab to see the user interface for the variables defined in the script.
# @MetaDataStart# @ScriptDescription "Creation of VLAN for VOIP Installation"# @VariableFieldLabel "The VLAN name to create"set var vlanName voice-avaya# @VariableFieldLabel "IP Address of the VLAN/NetMask"set var vlanIP xxx.xxx.xxx.xxx/xx# @VariableFieldLabel "The Ports to add to this vlan. Use 1, 2, 3, 5-6 format"set var portsValue xx# @VariableFieldLabel "VLAN Tag"set var vlanTag xx# @VariableFieldLabel "DHCP Address Range - Starting IP to allocate"set var dhcpStartAddr xxx.xxx.xxx.xxx# @VariableFieldLabel "DHCP Address Range - Ending IP to allocate"set var dhcpEndAddr xxx.xxx.xxx.xxx# @VariableFieldLabel "Lease Timer (secs) - Default 7200 seconds"set var dhcpLeaseTimer 7200# @VariableFieldLabel "DHCP Gateway"set var gateway xxx.xxx.xxx.xxx# @MetaDataEnd
enable lldp ports $portsValue
create vlan $vlanNameconf vlan $vlanName tag $vlanTagconf vlan $vlanName ipaddress $vlanIPconf vlan $vlanName add ports $portsValue
conf vlan $vlanName dhcp-address-range $dhcpStartAddr - $dhcpEndAddrconf vlan $vlanName dhcp-lease-timer $dhcpLeaseTimerconf vlan $vlanName dhcp-options default-gateway $gateway
enable dhcp ports $portsValue vlan $vlanname
EPICenter Reference Guide

Creating and Editing UPM Profiles
You can also save the script as a text file to your hard disk and import it into EPICenter. Use the Save Changes button to save the profile.
You can change the parameters in the Overview tab; the parameters are updated in the script automatically.
Modifying or Editing ProfilesYou can edit deployed and undeployed profiles using EPICenter. To edit a profile deployed to one or more devices, you need to save the profile in EPICenter with a different name or version and then edit the saved copy of the profile.
NOTE
If two users edit the same profile at the same time, the last saved version of the profile will be saved in EPICenter. The changes will not be merged.
To modify or edit a profile:
1 From the Managed Profiles view, select the profile from the Filtered Profiles table and click Open button. The Profile Edit window appears.
You can update the variables using the Overview. To edit the script or add metadata, use the Script View.
2 Click Save Changes to save the modifications. Click the Save As button to save the profile with a different name or version.
EPICenter Reference Guide 281

Using the Universal Port Manager
282
EPICenter UPM MetadataThe EPICenter UPM editor uses metadata to present the profile in a more usable way. The following table describes the metadata tokens.
The metadata is case insensitive. You can use # @MetaDataStart or # @METADATASTART. Do not leave space between @ and the metadata tags.
NOTE
The metadata information is commented out using # mark and will not be recognized by the ExtremeXOS.
EPICenter can manage a profile without metadata. If you do not use the metadata, UPM will not create the page where you can modify the variables.
Profile TemplatesEPICenter includes some pre-defined profile templates. You can use the profile templates as baseline for creating new profiles. You can find the pre-defined profiles in EPICenter in <EPICenter_install_directory>/user.war/upm_profiles.
Table 24: EPICenter UPM metadata
Metadata Token Description
# @MetaDataStart Indicates the beginning of the metadata section. This should be the first line in the profile
# @MetaDataEnd Indicates the end of the metadata section.
# @ScriptDescription Description or the purpose of the profile. The description should not contain new line character.
# @VariableFieldLabel Long description of the variables. This will be the title for the field. Should not contain new line character
# @SeparatorLine Indicates a section divide.
EPICenter Reference Guide

Creating and Editing UPM Profiles
Profile Testing WizardThe profile testing wizard helps you test a profile on a device before actually deploying it on the network. The wizard allows you to edit and run the profile onto a test device.
As a part of profile testing, the profile is deployed onto the selected device and run. When you close Test Profile dialog, the profile is not removed (undeployed) from the device. If you wish to delete profile from the device, select the profile from the profiles from the Network Profile View, then click the Delete button.
To test a profile, select the profile from the Filtered Profiles table in the Managed Profiles view and then click the Test button.
NOTE
When the profile is run onto the selected device, all operations in the profile script are executed against the test device. No rollback is performed at the end of the test session or when Test Profile dialog is closed.
Using the Profile Deployment WizardTo deploy the profile, select the profile from the Filtered Profiles table in the Managed Profiles view and then click the Deploy button.
You can also open the deployment wizard from the New Profile Create window.
The deployment wizard opens with the Select Trigger Events page. Use this page to configure the trigger events that would run the profile after it is deployed to the devices.
EPICenter Reference Guide 283

Using the Universal Port Manager
284
Figure 168: Trigger Events Page
This page contains the following configuration items:
● User request—Select this to deploy the profile now. The User-request will not allow you bind the event to a port and the port selection page will not be displayed.
If you bind a profile to a USER-REQUEST event, the profile is executed at the time of deployment, even if the profile is disabled in EPICenter.
If a network profile is bound to a user request event and the profile is disabled, if you want to run the profile again, you should enable the profile from the Network Profiles view and then click the Run button to run the script.
● Scheduled time—Select this to set the time at which the profile should be run. This is the time for ExtremeXOS Timer-AT event. See “Profile Trigger Events” on page 291 for critical details on timer events. The scheduled time event does not allow port binding. If you select this event, the port selection page will not be displayed.
● Other trigger events—Select the other trigger events you want to configure for the profile.
NOTE
If (required) is shown next to a trigger event, it indicates that this event is referred in the profile script. The event selection is, however, not enforced.
Click Next to open the search devices page.
EPICenter Reference Guide

Creating and Editing UPM Profiles
Figure 169: Search for Devices Page
The search devices page helps you to find the devices based on:
● Devices—Select this to search individual devices on the network.
● Device groups—Select this to search the devices based on the device groups you have defined in EPICenter.
● Port groups—Select this to search the devices based on the port groups you have defined in EPICenter.
Click Next to open the Device Selection page.
The device selection page:
● Lists devices, if you have selected Devices in the previous page.
● Lists device groups and devices, if you have selected Device groups in the previous page.
● Lists port groups and devices, if you have selected Port Groups in the previous page. All ports in the selected port group will be preselected.
Incompatible devices are grayed out. Incompatible devices are devices that are running ExtremeWare or ExtremeXOS versions earlier than 12.0
You can select the devices that are down, offline, or unreachable at the time of device selection. But you will not be able to deploy to these devices at the time of validation; unless these devices are online and reachable.
EPICenter Reference Guide 285

Using the Universal Port Manager
286
Figure 170: Device Selection Page
Select the devices and click Next to open the Ports Selection page.
The ports selection page contains two tables. The Deploy to Ports lists the devices and ports. After you select the ports from this table, it is displayed in the Selected Ports table. You can select all ports in the device by selecting the check box near the device. To select individual ports, select the device checkbox, expand the port list tree and then select individual ports from the tree. You can also use the Select All button to select all ports on the devices.
EPICenter Reference Guide

Creating and Editing UPM Profiles
Figure 171: Ports Selection Page
If you select port groups, the ports in the selected ports groups will be preselected. For the USER-REQUEST event and timer event, the ports as shown as N/A.
After you select the ports, click Next to review the deployment information. The Deployment Information review page appears.
Figure 172: Deployment Information Review Page
The page provides details of the Devices, IP address of the devices and the ports you have selected to deploy the profile.
EPICenter Reference Guide 287

Using the Universal Port Manager
288
If the information is correct, click Validate to validate the profile on the selected ports. The validation results page appears.
During validation:
● EPICenter will update the details with selected device.
● EPICenter checks whether a profile with the same name is already on the switch. If the profile is already on the switch, EPICenter gives you an option to proceed with the selection. If you choose to proceed, EPICenter will delete the profile on the switch first, then push the profile to the switch with the new bindings.
● EPICenter will make sure that no two profiles are bound to the same device events on the same port. For example: If Profile A is bound to port 1 for the event DEVICE-DETECTED, then you cannot bind Profile B to port 1 for the event DEVICE-DETECTED. But you can bind profile B to port 1 for another event DEVICE-UNDETECTED.
Figure 173: Validation Results Page
The results page displays the validation status and validation results. The following details appears in the Validation Results Table:
Name Name of the device on which the profile was validated.
IP Address IP Address of the device on which the profile was validated.
Ports Ports on which the profile was validated.
Validation Results Displays the result of the validation.
Replace Existing Profile If the device already contains a profile with the same name, a check box appears in this column. Select the check box if you want to replace the profile.
EPICenter Reference Guide

Creating and Editing UPM Profiles
If Validation have issues, you can see the details in the Details field. Select a row in the table to view the details of the validation.
If validation have issues, and you need to replace profile in the device, checkbox will appear in the Replace Existing Profiles column. Use Select All to select all the checkbox and use clear all to clear all the checkbox.
Deployment Information section allows you to configure whether the profile should be enabled or disabled after the deployment. Select Enable profile on all devices to enable the profile on all the devices on which the profile is being deployed.
You can also enter comments that appear in the Audit Log.
Click Deploy to deploy the profile to the selected devices. The deployment results page appears with the status and result of the deployment.
Figure 174: Deployment Results
This page provides the following details:
Name Name of the device on which the profile was deployed.
IP Address IP address of the device on which the profile was deployed.
Ports Ports on which the profile was deployed.
Deployment Results Displays the status and result of the deployment.
EPICenter Reference Guide 289

Using the Universal Port Manager
290
Click the Finish button to complete deploying the profile.
If you have issues with the deployment, select the devices using the check boxes in the Deploy Again column and then click Deploy Again. If you need to deploy to more than one device, use Select All button to select all the check boxes. You will be taken to the Deployment Information Review Page.
The following image shows the validation results page with errors:
Figure 175: Validation Results Page with Error
In this example, two devices contain profiles with the same name. Select the check boxes using the Select All button, then click the Deploy button to continue. The Details field shows the reason for the validation failure on the two devices.
Profile Trigger EventsThe following table shows the system triggers that can lead to the execution of a particular profile.
Deploy Again If the deployment fails on a device, a check box appears in this column. To deploy again, select the check box and click the deploy again button.
You can use the Select All and Clear All buttons to select multiple devices to deploy the profile again.
Details Select the device from the table to view the details of the deployment.
If you have issues with the deployment, you can see the details in this field.
EPICenter Reference Guide

Universal Port Event Variables
Universal Port Event VariablesThis section describes the information available to any profile on execution, based on the event that triggered the profile.
Table 25: Profile Trigger Events
Trigger Condition
DEVICE-DETECT A specific device was detected by the system.
You can use this event to automatically configure the LLDP settings when an LLDP enabled device, such as an Avaya 4620 SW IP phone, is connected to an LLDP enabled port on an Extreme switch. UPM executes the profile that has been configured for that event on that port.
DEVICE-UNDETECT A specific device is no longer present. This could also be triggered by a timeout. This allows the restoration of port properties to a known state.
You can use this event to trigger a profile when an LLDP device that was previously detected on the port is removed from the port.This event help to return a port back to its original configuration and ready to accept another UPM event.
USER-AUTHENTICATED A specified user was authenticated.
Authentication can be configured on the port for security with Extreme’s netlogin feature. Netlogin enabled ports can authenticate devices in two ways:
MAC address based authentication—requires no interaction from the user.
802.1x authentication—requires the user to login through an 802.1x client on a PC.
A user-authenticated event is triggered when a device or user authenticates successfully through Netlogin and RADIUS.
USER-UNAUTHENTICATED
A specified authenticated user has been unauthenticated.
This event is triggered when a previously authenticated device or user disconnects from the switch either by logging off the PC or disconnected the device from the port.
TIMER-AT The specified time for a profile to be triggered has arrived.
If EPICenter client and the switch are not in the same time zone, then the time that you schedule from the EPICenter client for a profile to be executed will be different from the time that will be configured on the switch. For example, if the client machine is set to PDT time zone and if the switch is set to use default GMT time zone, an event create to be executed at 12:00:00 p.m. PDT will be scheduled to be executed at 19:00:00 p.m. GMT.
In EPICenter, Timer details will always show the time interval and the time at which the profile was first executed. But on the switch, show upm timer command will show time interval and the time when profile is scheduled to be executed next.
USER-REQUEST The profile is bound to a USER-REQUEST event.
Static profile is an ExtremeXOS concept for any profile not bound to any EXOS event. The USER-REQUEST event is an EPICenter concept, for a static profile in EXOS.
LOG-MESSAGE The profile is triggered by a specific EMS message encountered on the device.
In the current release, profiles triggered by LOG-MESSAGE events can only be viewed in EPICenter. You cannot run or edit these kinds of profiles in EPICenter, nor can you save them as managed profiles.
EPICenter Reference Guide 291

Using the Universal Port Manager
292
Common VariablesTable 26 shows the variables that are always available for use by any script. These variables are set up for use before a script or profile is executed.
User Profile VariablesTable 27 shows the variables available to user profiles.
Device Profile VariablesTable 28 shows the variables available to Device Profiles.
Table 26: Common Variables
Variable Syntax Definition
$STATUS Status of last command execution.
$CLI.USER UserName who is executing this CLI.
$CLI.SESSION_TYPE Type of session of the user.
$EVENT.NAME This is the event that triggered this profile. See Table 25 for a list of triggers.
$EVENT.TIME Time this event occurred. The time will be in seconds since epoch.
$EVENT.TIMER_TYPE PERIODIC or NON_PERIODIC.
$EVENT.TIMER_NAME Name of the timer that the Universal Port is invoking.
$EVENT.TIMER_DELTA Time difference when the timer fired and when the actual shell was run in seconds.
$EVENT.PROFILE Name of the profile that is being run currently.
Table 27: User Profile Variables
Variable Syntax Definition
$EVENT.USERNAME Name of user authenticated. This would be a string with the MAC address for MAC-based user-login
$EVENT.NUMUSERS Authenticated supplicants on this port after this event occurred
$EVENT.USER_MAC MAC address of the user
$EVENT.USER_PORT Port associated with this event
$EVENT.USER_VLAN VLAN associated with this event
$EVENT.USER_IP IP address of the user if applicable, else blank
Table 28: Device Profile Variables
Variable Syntax Definition
$EVENT.DEVICE Device identification string
Possible values for EVENT.DEVICE are: AVAYA_PHONE, GEN_TEL_PHONE, ROUTER, BRIDGE, REPEATER, WLAN_ACCESS_PT, DOCSIS_CABLE_SER, STATION_ONLY and OTHER.These strings correspond to the devices that the LLDP application recognizes and reports to the Universal Port management application.
$EVENT.DEVICE_IP The IP address of the device (if available). Blank if not available.
$EVENT.DEVICE_MAC The MAC address of the device (if available). Blank if not available.
EPICenter Reference Guide

Universal Port Event Variables
$EVENT.DEVICE_POWER The power of the device in watts (if available). Blank if not available.
$EVENT.DEVICE_MANUFACTURER_NAME
The manufacturer of the device.
$EVENT.DEVICE_MODEL_NAME
Model name of the device
Table 28: Device Profile Variables
Variable Syntax Definition
EPICenter Reference Guide 293

Using the Universal Port Manager
294
EPICenter Reference Guide
15 Administering EPICenter
This chapter describes how to use the EPICenter Administration functions for the following:
● Changing your own user password, for users without Administration access
● Adding and deleting EPICenter users
● Setting and modifying user permissions EPICenter
● Configuring the EPICenter server as a RADIUS client or a RADIUS server for user authentication
● Enabling or disabling EPICenter Syslog receiver functionality
● Modifying EPICenter server properties to change settings such as polling rates, time-outs, port assignments and other similar settings
● Configuring EPICenter for a distributed server configuration
Overview of User AdministrationIn order to log in to the EPICenter server and use its management features, you must have a user name and password. An EPICenter administrator can create and modify user accounts, passwords, and account permissions through the EPICenter Administration window. Individual users, regardless of their roles, can change their own password using the EPICenter Administration window.
By default, EPICenter provides its own authentication and authorization for EPICenter users. However, through the EPICenter Administration window, you can configure EPICenter to act as a Remote Authentication Dial In User Service (RADIUS) client, allowing it to use an external RADIUS server to authenticate EPICenter users. Alternatively, you can configure an external RADIUS server to return user role information as well as user authentication. Or you can configure EPICenter to act as a RADIUS server; however, the RADIUS server built into EPICenter should only be used for demonstration or testing purposes. It should not be used to provide primary authentication services in a production environment.
Finally, the EPICenter Administration window provides an interface that allows an EPICenter administrator to modify a number of properties that affect the performance and configuration of the EPICenter server. These properties are stored in the EPICenter database along with other EPICenter data.
Administration FunctionsUnlike many of the other EPICenter functions, the Administrator function does not provide access to its features through menus. Instead, functional areas are accessed through tabs in the EPICenter Administration window.
The EPICenter Administration window provides the standard EPICenter menus (File, Tools, and Help). Right-click pop-up menus are not available in this feature.
EPICenter Reference Guide 295
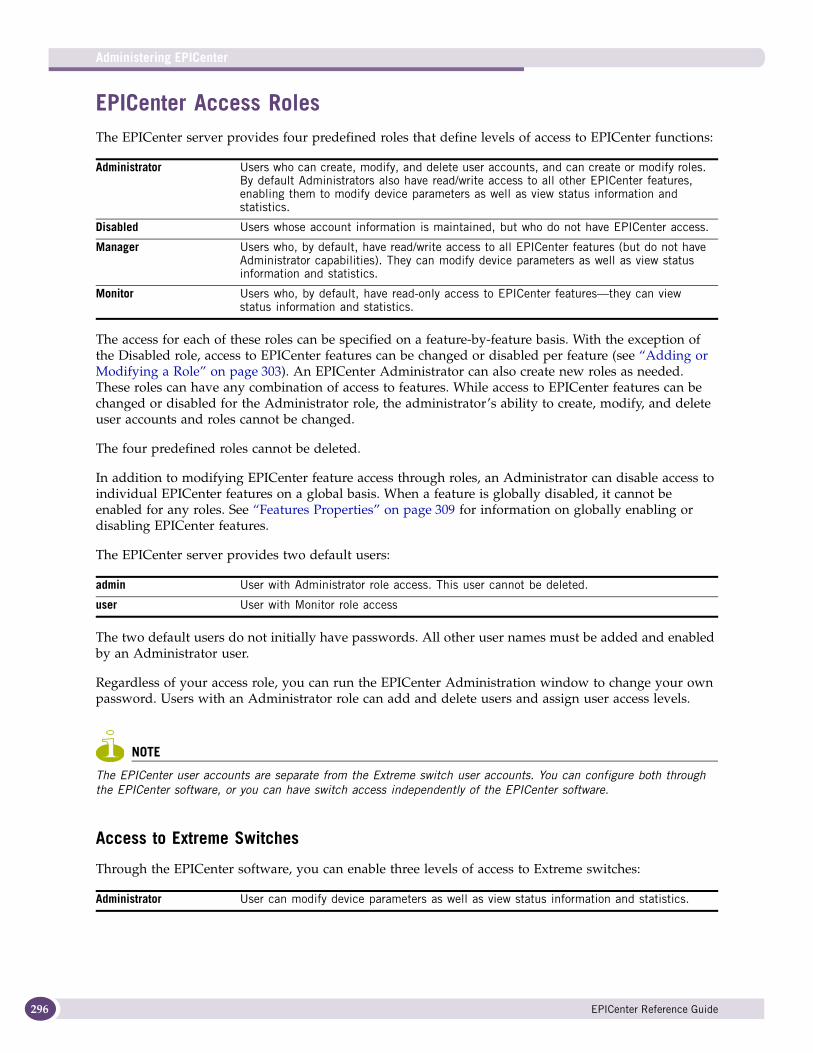
Administering EPICenter
296
EPICenter Access RolesThe EPICenter server provides four predefined roles that define levels of access to EPICenter functions:
The access for each of these roles can be specified on a feature-by-feature basis. With the exception of the Disabled role, access to EPICenter features can be changed or disabled per feature (see “Adding or Modifying a Role” on page 303). An EPICenter Administrator can also create new roles as needed. These roles can have any combination of access to features. While access to EPICenter features can be changed or disabled for the Administrator role, the administrator’s ability to create, modify, and delete user accounts and roles cannot be changed.
The four predefined roles cannot be deleted.
In addition to modifying EPICenter feature access through roles, an Administrator can disable access to individual EPICenter features on a global basis. When a feature is globally disabled, it cannot be enabled for any roles. See “Features Properties” on page 309 for information on globally enabling or disabling EPICenter features.
The EPICenter server provides two default users:
The two default users do not initially have passwords. All other user names must be added and enabled by an Administrator user.
Regardless of your access role, you can run the EPICenter Administration window to change your own password. Users with an Administrator role can add and delete users and assign user access levels.
NOTE
The EPICenter user accounts are separate from the Extreme switch user accounts. You can configure both through the EPICenter software, or you can have switch access independently of the EPICenter software.
Access to Extreme Switches
Through the EPICenter software, you can enable three levels of access to Extreme switches:
Administrator Users who can create, modify, and delete user accounts, and can create or modify roles. By default Administrators also have read/write access to all other EPICenter features, enabling them to modify device parameters as well as view status information and statistics.
Disabled Users whose account information is maintained, but who do not have EPICenter access.
Manager Users who, by default, have read/write access to all EPICenter features (but do not have Administrator capabilities). They can modify device parameters as well as view status information and statistics.
Monitor Users who, by default, have read-only access to EPICenter features—they can view status information and statistics.
admin User with Administrator role access. This user cannot be deleted.
user User with Monitor role access
Administrator User can modify device parameters as well as view status information and statistics.
EPICenter Reference Guide

Administration Functions
These permissions enable access to Extreme Networks switches through Telnet.
The use of the RADIUS server avoids the need to maintain user names, passwords, and access permissions in each switch, and instead centralizes the configuration in one location in the EPICenter server.
EPICenter and RADIUS AuthenticationBy default EPICenter provides its own authentication and authorization for EPICenter users. However, EPICenter can be configured to act as a client to an external RADIUS server, or as a RADIUS server.
RADIUS provides a standard way for the EPICenter software and Extreme Networks switches to handle user authentication, permitting the unification of the ExtremeXOS CLI, and EPICenter user authentication.
When EPICenter acts as a RADIUS client, the external RADIUS server can be configured using a Vendor Specific Attribute (VSA) to provide user role information to EPICenter along with the login and password authentication.
The EPICenter software incorporates a basic RADIUS server that may be useful for demonstration or testing purposes. However, the built-in RADIUS server should not be used in a production environment. It is not sufficiently robust for use as an authentication service in a production environment.
Setting EPICenter Server PropertiesThe Server Properties tab of the EPICenter Administration window allows an EPICenter administrator to modify a number of parameters that affect server performance and function. These include communication parameters such as polling intervals, time-outs, port usage, number of retries, and a number of other parameters.
No Access User does not have switch access (cannot login, cannot obtain device status information, cannot change device settings or configuration.
User User can view device status information and statistics, but cannot modify any parameters.
EPICenter Reference Guide 297

Administering EPICenter
298
User AdministrationYou must be logged in as a user with the Administrator role to administer EPICenter users.
On the User Administration page you can create and delete users, and modify user account settings: passwords, roles and ExtremeWare RADIUS access.
To access the EPICenter Administrator window, click Users, Roles, and Servers under the EPICenter Administration folder.
The User Administration page appears, as shown in Figure 176. Initially, the only users are “admin” and “user.”
Figure 176: User Administration window
NOTE
If you have not done so already, you should add a password for the “admin” user account. By default neither the “admin” or “user” accounts have a password when EPICenter is first installed. See “Adding or Modifying User Accounts” on page 299 for further information.
When you select a user in the Users list, the EPICenter Feature Access list at the bottom of the page displays that user’s access on a feature-by feature basis, as determined by his current Role. To change this list, you can either assign a different role to the user, or modify the feature access defined for the current Role (which will affect all users with that Role).
EPICenter Reference Guide

User Administration
Adding or Modifying User AccountsTo add users to the EPICenter database, or to modify EPICenter user account access, follow these steps:
1 Click Add to add a new user.
Select a user name and click Modify to change a user’s password, EPICenter access role, or ExtremeWare access.
A New User window or Edit User window appears (Figure 177).
Figure 177: New User and Edit User windows
The fields in these windows are:
2 For a new user, enter the appropriate information. For an existing user, make the necessary changes to the password, role or ExtremeWare access. Note the for the user “admin” you cannot change the role. (The user “admin” cannot be deleted, either.)
3 Click OK.
The new user information is stored in the EPICenter database.
NOTE
A change to a user account does not take effect until the next time the user logs in.
User Name The EPICenter login name for the user. This is filled in and cannot be modified if you are editing an existing user.
Password The password for this user.
Verify Password The password typed a second time for verification.
Role The EPICenter Role for this user. The four basic roles (Administrator, Disabled, Manager, and Monitor) are presented, along with any additional roles an EPICenter administrator may have defined.
ExtremeWare RADIUS Account Access
Thee ExtremeWare RADIUS Access level for this user:
• Administrator access allows the user to modify device parameters as well as view status information and statistics.
• User access allows the user to view device status information and statistics, but not modify any parameters.
• No Access provides no access privileges, but keeps the user’s account information in the EPICenter database.
EPICenter Reference Guide 299

Administering EPICenter
300
Deleting a UserYou must be logged in as a user with the Administrator role to delete users.
To delete a user, follow these steps:
1 From within the EPICenter Administration window, click the User tab to show the User Administration page.
2 Select the user name you want to delete and click Delete.
NOTE
You cannot delete the “admin” user.
A confirmation window appears.
3 Click Yes.
This removes all information about this user account from the EPICenter database.
NOTE
To remove all access privileges for a user without removing the user account from the EPICenter database, use the Modify User function and change the Role to Disabled.
Changing Your PasswordTo change your password, follow these steps:
1 Click Users, Roles, and Servers under the EPICenter Administration folder.
The User Administration window appears, as shown in Figure 178.
EPICenter Reference Guide
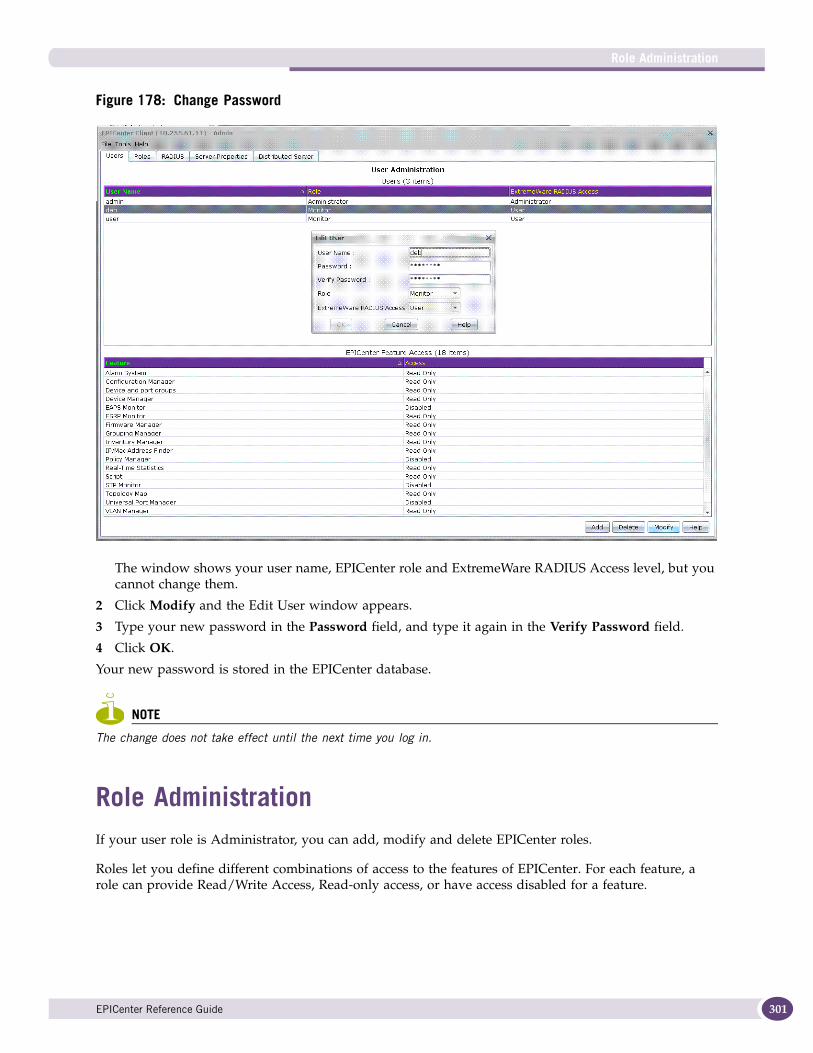
Role Administration
Figure 178: Change Password
The window shows your user name, EPICenter role and ExtremeWare RADIUS Access level, but you cannot change them.
2 Click Modify and the Edit User window appears.
3 Type your new password in the Password field, and type it again in the Verify Password field.
4 Click OK.
Your new password is stored in the EPICenter database.
NOTE
The change does not take effect until the next time you log in.
Role AdministrationIf your user role is Administrator, you can add, modify and delete EPICenter roles.
Roles let you define different combinations of access to the features of EPICenter. For each feature, a role can provide Read/Write Access, Read-only access, or have access disabled for a feature.
EPICenter Reference Guide 301

Administering EPICenter
302
The EPICenter server provides four predefined roles:
Except for the Disabled role, you can modify the feature access for each of these roles, but you cannot delete them. You can also create new roles with a combination of access to various EPICenter features.
NOTE
Feature access can be globally disabled through Server Properties administration. If a feature is globally disabled you cannot provide access to the feature through any role. See “Features Properties” on page 309 for details.
To administer roles, click the Roles tab from within the EPICenter Administration window.
The Roles Administration page opens, as shown in Figure 179.
Figure 179: The Roles Administration window
Administrator Users who can create, modify, and delete user accounts, and can create or modify roles. By default Administrators also have read/write access to all other EPICenter features, enabling them to modify device parameters as well as view status information and statistics.
Manager Users who, by default, have read/write access to all EPICenter features (but do not have Administrator capabilities). They can modify device parameters as well as view status information and statistics.
Monitor Users who, by default, have read-only access to EPICenter features—they can view status information and statistics.
Disabled Users whose account information is maintained, but who do not have EPICenter access.
EPICenter Reference Guide

Role Administration
When you select a role, the feature setting for the role are displayed in the EPICenter Feature Access list at the bottom of the page.
Adding or Modifying a Role1 To add a role, click Add.
To modify a role, select the role and click Modify. (You cannot modify the Disabled role).
A Role: New or Role: Modify window opens (see Figure 180).
Figure 180: The Role: New and Role: Modify windows
2 For a new role, enter the role name and an optional description.
For an existing role, you can change the description and feature access, but not the role name.
3 Select the level of access the role should allow for each feature. The levels of access are:
NOTE
For the predefined roles (Administrator, Manager, and Monitor) you can disable access to EPICenter features, but you cannot change a feature from Read/Write to Read Only or vice-versa. The Administrator and Manager roles
Disabled A user with this role cannot access this feature. The icon will not appear in the Navigation Toolbar when a user with the role logs into EPICenter.
Read Only A user with this role has read only access to this feature. This means the user can see any status or statistics displays, but cannot make any changes (such as discovering or adding devices, creating Topology maps, and so on).
Read/Write A user with this role has full access to this feature.
EPICenter Reference Guide 303

Administering EPICenter
304
always provide full access to any features for which access is enabled, and the Monitor role provides only Read Only access to any features for which access is enabled.
4 Click Apply to create or modify the role.
If features are globally disabled through the Features Properties settings under the Server Properties Configuration tab, you will not be able to select those features when you add or modify a role. The Access column will show Globally Disabled instead of access options. The STP and VoIP features are globally disabled by default, and this is shown in Figure 180.
Deleting a RoleTo delete a role, follow these steps:
1 From within the EPICenter Administration window, click the Roles tab to show the Role Administration page.
2 Select the role you want to delete and click Delete.
NOTE
You cannot delete any of the predefined roles. You also cannot delete a role that is currently assigned to a user.
A confirmation window appears.
3 Click Yes.
This removes the role from the EPICenter database.
RADIUS AdministrationIf your user role is Administrator, you can enable EPICenter as a RADIUS client or RADIUS server, and change its port or the RADIUS secret. By default RADIUS authentication is disabled.
Enabling EPICenter as a RADIUS client means that when a user attempts to login to the EPICenter server, EPICenter will request authentication from an external RADIUS server. The external RADIUS server can also be configured to return role information to EPICenter along with a successful authentication. If this feature is enabled, you must create corresponding roles in EPICenter for every role that the RADIUS server may return. If a user is authenticated with a role that EPICenter does not recognize, the user will be given the Monitor role by default. See the EPICenter Concepts and Solutions Guide for information on configuring this in the RADIUS server.
Enabling EPICenter as a RADIUS server means that Extreme switches can act as RADIUS clients, authenticating users against the RADIUS server’s database of users, as administered through EPICenter. Thus, even if a user accesses the switch directly through Telnet or a browser, the RADIUS server will provide the authentication service. This may be useful for demonstration or testing purposes. However, EPICenter should not be used to provide authentication services in a production environment.
If you have enabled the EPICenter RADIUS server, authentication activity is logged to the file radius_log.txt, found in the EPICenter root install directory.
Disabling RADIUS in EPICenter means that EPICenter’s RADIUS server will not be available for authenticating users, and it will not request user authentication from an external RADIUS server.
EPICenter Reference Guide

RADIUS Administration
To change the EPICenter server RADIUS configuration, click the RADIUS tab at the top of the page. The RADIUS Administration page appears, as shown in Figure 181.
Figure 181: RADIUS Administration page
RADIUS Client ConfigurationTo enable EPICenter as a RADIUS client, do the following:
1 Click the Enable EPICenter as a RADIUS Client button at the top of the page.
This enables the fields in the Client Configuration panel.
It is recommended, but not required, that both a primary and a secondary RADIUS server be available for authentication.
2 Fill in the name or IP address of the primary and secondary RADIUS servers.
3 The default port used for the RADIUS server is 1812. If either RADIUS server uses a different port, enter that port number in the appropriate RADIUS Port field.
NOTE
The port you enter must match the port configured for the RADIUS server or EPICenter will not be able to access the RADIUS server.
4 Enter the RADIUS server’s shared secret in the RADIUS Secret field for both the primary and secondary RADIUS servers.
EPICenter Reference Guide 305

Administering EPICenter
306
This shared secret is a shared key by which the RADIUS server and its clients recognize each other, and which they use for secure transmission of user passwords.
NOTE
If the shared secret is changed in either of the RADIUS servers, you must change it in EPICenter as well, or else EPICenter will no longer be able to access the RADIUS server.
5 Click Apply to have the configuration changes take effect.
NOTE
Some configuration may be required on the external RADIUS server to allow EPICenter to authenticate users with various roles. See the EPICenter Concepts and Solutions Guide for a full explanation of how to configure an external RADIUS server to perform EPICenter user authentication.
RADIUS Server ConfigurationTo configure EPICenter as a RADIUS server, follow these steps:
1 Click the Enable EPICenter as a RADIUS Server button in the RADIUS Configuration panel at the top of the page.
This enables the fields in the Server Configuration panel.
2 Enter the RADIUS server’s shared secret in the RADIUS Secret field.
NOTE
If you change the secret in the RADIUS server, you must also change it in any of the RADIUS clients (Extreme switches) that use the RADIUS server for user authentication.
3 The default port used for the RADIUS server is 1812. To change the server port, enter the port number in the RADIUS Port field.
NOTE
If you change the RADIUS server port, you must make sure that the port used by any RADIUS clients (Extreme switches that use this RADIUS server for user authentication) match the port you enter for the server.
4 To disable RADIUS response messages, uncheck the Enable RADIUS Response Messages checkbox. This prevents the RADIUS server from sending a response message when authentication fails. Check the box to enable these messages. This is enabled by default.
5 Click Apply to have the configuration changes take effect.
Disabling RADIUS for EPICenterTo disable the use of RADIUS authentication, do the following:
1 Click the Disable RADIUS button at the top of the page.
2 Click Apply to have the configuration changes take effect.
EPICenter Reference Guide

Server Properties Administration
Server Properties AdministrationIf your user role is Administrator, you can modify the values of a number of properties that affect the function and performance of the EPICenter server.
1 Click the Server Properties tab at the top of the page.
The Server Properties Configuration page appears, as shown in Figure 182.
Figure 182: Server Properties Configuration page, initial properties list (Devices)
2 Select a set of properties from the drop-down menu field at the top of the central panel. You can select from these sets of properties:
■ Devices
■ Features
■ Scalability
■ SNMP
■ External Connections
■ MAC Polling
■ Other
The Server Properties Configuration page displays the properties in that set.
3 Type a new value into the field for the property you want to change, or click a check-box to turn on or off an option. The specific properties and their meanings are discussed in the following sections.
4 Click the Apply button to cause your changes to take effect.
EPICenter Reference Guide 307

Administering EPICenter
308
You can undo your changes in one of two ways:
■ Click the Reset button to restore the values that the displayed properties held when you first entered this page.
■ Click the Reset to Defaults button to restore the values to the EPICenter server default values (the values in effect immediately after installation).
5 For some changes, you will need to restart the EPICenter server for the changes to take effect. A pop-up dialog will inform you that this is necessary.
Click OK to dismiss the dialog box, and then shut down and restart the EPICenter server.
See the EPICenter Installation and Upgrade Note for information on how to shut down and restart the EPICenter server.
Devices PropertiesWhen you select Devices from the drop-down menu field at the top of the properties panel, you can set the following properties:
Telnet Login Timeout Period (sec)
The length of time, in seconds, after which a CLI/Telnet login request to a switch should time out. The default is 10 seconds, the range is 1 to 30 seconds.
Device HTTP Port The port that the EPICenter server will use to communicate with an Extreme switch’s web server to run ExtremeWare Vista. Default is port 80.
Device Telnet Port The port that the EPICenter server will use to Telnet to a switch. Default is port 23.
Device SSH Port The TCP port number that EPICenter uses to connect with the switch using the SSH protocol. The default is port 22.
Upload/Download Timeout Period (sec)
The length of time, in seconds, after which a configuration upload or download operation should time out. If some devices have a large number of VLANs, the timeout may need to be increased to allow an upload or download operation to complete successfully without timing out.
Reboot Timeout Period (min)
The length of time, in minutes, to wait for a device to reboot after an image/bootrom upgrade in the Firmware Manager. Default is 5 minutes. some devices may require more time for a device to reboot.
Syslog Server settings:
Enable Syslog Server A check specifies that the EPICenter server can function as a Syslog receiver to receive Syslog messages. Uncheck the checkbox to disable syslog server functionality. The default is enabled.
Note: For Solaris, you must stop the Solaris Syslog server before you can enable EPICenter’s syslog server. To stop the server in Solaris, enter the command /etc/init.d/syslog stop. In EPICenter, you can restart the Syslog server by disabling and then re-enabling it.
On the device side, remote logging must be enabled, and the switch must be configured to log to the EPICenter server. The default on Extreme switches is for logging to be disabled. You can use the EPICenter Telnet feature or the ExtremeWare CLI to configure your switches appropriately. See the EPICenter Concepts and Solutions Guide for more information on setting up Syslog access.
Syslog Server Port The port used for remote syslog communication from a switch. Default is port 514.
Accept SysLog Messages with min Severity
The minimum severity level of messages to be logged in a switch Syslog file. All messages with Severity equal to or higher than the setting you select will be logged. For example, if you select 2: Critical, then messages of severity 2 (Critical), 1 (Alert), and 0 (Emergency) will be logged. The default is 6: Information.
EPICenter Reference Guide

Server Properties Administration
Features PropertiesThis feature enables the EPICenter Administrator to globally control which EPICenter features appear in the Navigation menu. Disabling a feature through the Features Properties menu disables it for all EPICenter users, regardless of their role. Features may also be enabled and disabled on a role-by-role basis, so that only users with access based on the role will be affected. See “Role Administration” on page 301 for more information on Roles.
To globally disable a feature, uncheck the checkbox for that feature, then click Apply. Check the checkbox to enable a feature.
Disabling a feature has the following effects:
● Removes the associated feature from the Navigation menu for all EPICenter users.
● Removes the entries, if appropriate, from the Device submenu available from a right-click pop-up menu, from the EPICenter Tools menu
● Makes the feature unavailable when creating or modifying roles.
In some cases, disabling a feature has additional effects:
● Disabling the Alarm Manager disables the generation and processing of alarms. However, traps and events are still logged, and traps are still forwarded if required.
● Disabling the Alarm Manager or the Configuration Manager removes the associated report links from the main Reports page.
Enabling a feature restores it to the Navigation menu and restores the appropriate EPICenter menus and pop-up menus.
By default, all features are globally enabled.
Save Changed Configurations Only
A check specifies that device configurations should be uploaded by the Configuration Manager Archive feature only when the device configuration has changed (the default). Uncheck the checkbox to specify that switch configurations should always be uploaded at the scheduled archive time.
Automatically save configuration on device
A check indicates that EPICenter automatically saves the configuration to a switch whenever configuration changes are made. This is the default setting. If this checkbox is not checked, you must use the Save command to save changes to a switch configuration.
Poll Devices using Telnet Uncheck the checkbox to disable CLI/Telnet polling. This disables ESRP polling as well as EDP polling. It also disables polling for Netlogin information, and disables FDB polling for edge port MAC address information.
Save Switch Password for Vista Login
A check specifies that EPICenter should save the switch password in the database for use when logging into a switch using ExtremeWare Vista
(accessible from the Devices sub-menu). If you disable (uncheck) this property, you will be required to login to each switch in order to view Configuration and Statistics information through the Web interface. The default is enabled (passwords will be saved).
Use EPICenter login/password for Telnet/SSH
A check indicates that the EPICenter login name and password should be used for establishing user-initiated Telnet or SSH2 sessions with the switch. Background functions, including trap handling, polling, and scheduled operations continue to use the Telnet/SSH login and password configured for the switch using the Inventory Manager.
EPICenter Reference Guide 309

Administering EPICenter
310
NOTE
In some cases, the change takes effect as soon as you click Apply. In other cases, such as the enabling the Configuration Manager, the EPICenter server must be restarted. A notification is displayed if a restart is required.
Scalability PropertiesSelect Scalability from the drop-down menu field at the top of the properties panel to modify the settings for server resources to provide better performance when managing a large number of devices.
Manipulating the thread pool size, default thread allocation size, number of SNMP sessions, and the number of traps and syslog messages EPICenter processes per minute lets you configure the EPICenter server to provide better performance based on the amount of server resources (number and speed of processors, amount of memory) available. Changing these values should not normally be necessary unless you are managing a very large number of devices (more than 1000 devices).
If you are managing more than 1000 devices, it is recommended that you run the EPICenter server on a system with a 1 GHz or faster processor, and at least 1 GB of physical memory. For such a configuration, you may also be able to improve the performance of the EPICenter server by changing the parameters below.
NOTE
Changing the scalability properties on a system without suitable hardware could actually decrease the performance of the EPICenter server.
To see the effects of the current scalability settings, run the Server State Summary Report under Reports.
You can set the following properties to affect the scalability of EPICenter:
Thread Pool Size This specifies the maximum number of threads available. The default is 40.
Thread Default Alloc Size This specifies the default number of threads allocated for a process request. The default is 20.
Traps per Device in 1/2 Minute
This specifies the maximum number of traps that can be received from an individual device in 28 seconds. If more than this number of traps are received from an individual device within a 28 second interval, the excess traps are dropped.
Total Traps Accepted per Minute
This specifies the maximum total number of traps that EPICenter can receive from all managed devices in 55 seconds. If more than this number of traps are received within a 55 second interval, the excess traps are dropped. The default is 275, the maximum you can set is 500.
Syslog Messages per Device in 1/2 Minute
This specifies the maximum number of syslog messages that can be received from an individual device in 28 seconds. If more than this number of traps are received within a 28 second interval, the excess messages are ignored.
Total Syslog Messages Accepted per Minute
This specifies the maximum number of syslog messages that EPICenter can receive in one minute from all managed devices. If more than this number of messages are received within a one-minute interval, the excess messages are ignored. The default is 275, the maximum you can set is 500.
Number of Interactive Telnet Sessions
This specifies the maximum number of interactive Telnet sessions allowed.
EPICenter Reference Guide

Server Properties Administration
NOTE
You should not change the values for traps and syslog messages accepted unless the EPICenter Server reports dropping lots of traps. Run the Server State Summary Report under Reports to view the current performance metrics.
SNMP PropertiesWhen you select SNMP from the drop-down menu field at the top of the properties panel, you can set the following properties:
Poll Interval The interval, in minutes, between SNMP polls of a switch to fetch basic device status information. The default is five minutes. The range is one minute to one hour. You can disable all SNMP polling by setting this property to zero.
Note: This Poll Interval is not the same as the Device Polling Interval you can set through the Inventory Manager. The Device Polling Interval controls the frequency of polling for detailed device information such as software version, BootROM version, and so on. The polling interval set here in the EPICenter Administration window controls only the basic SNMP status information necessary to ensure SNMP reachability, and is typically performed relatively frequently.
Timeout Period The length of time, in seconds, to wait for an SNMP poll request to complete before timing out. The default is five seconds. The range is one to 60 seconds.
This setting determines the time-out interval only for the first unsuccessful SNMP request; once a request times out, subsequent requests will time out more slowly, based on an exponential time-out back-off algorithm, until it reaches the maximum number of retries.
Number of Retries The number of SNMP requests that should be attempted before giving up, for a request that has timed out. The default is one.
EPICenter Trap Receiver Port
The port on which EPICenter expects to receive traps. Default is port 10550.
Trap Fowarding:These provide the default settings for the Trap Forwarding alarm action.
Host The host name or IP address of the system to which traps should be forwarded
Port The port on which the specified host receives traps (by default, port 162)
Community The community string for the specified host
Trap Conversion The version of SNMP to which traps should be converted:
• No conversion: Trap will be sent as is.
• Convert trap to SNMPv1
• Convert trap to SNMPv2c
EPICenter Reference Guide 311

Administering EPICenter
312
External Connections PropertiesWhen you select External Connections from the drop-down menu field at the top of the properties panel, you can set the following properties:
MAC Polling PropertiesMAC Address polling is used to identify edge ports and get the status of the devices on those ports. MAC Polling must be enabled in order to see the Edge Port FDB display in the Inventory Manager and Device Properties displays, and to enable a database-only search in the IP/MAC Address Finder window.
EPICenter implements MAC Address polling using Telnet to retrieve FDB and ARP table data from the affected devices (devices that support FDB polling and for which FDB polling has been enabled in the Inventory Manager). Telnet requests are initiated in sets—requests are sent to groups devices simultaneously. A MAC address polling cycle is complete when these multiple sets of requests have resulted in the retrieval of FDB table data from all eligible devices. Once a polling cycle is complete, a new polling cycle is started.
Individual devices are polled once in each MAC address polling cycle. The interval between polls of the FDB on a given device (the length of time before FDB data is refreshed) is a function of the number of devices being polled per cycle, and the interval between the sets of Telnet polls in a complete polling cycle.
EPICenter calculates the interval between sets of Telnet requests dynamically, based on the length of time it took for the previous set of Telnet requests to complete. EPICenter assumes that if a set of Telnet requests takes a long time to complete, it means the EPICenter server is more heavily loaded than if the requests complete quickly.
The System Load setting tells EPICenter whether the calculated interval between sets of Telnet requests should be relatively longer or shorter compared to the perceived EPICenter server load. EPICenter uses the System Load setting, in conjunction with the time it took for the last set of Telnet requests to complete, to determine how long to wait before issuing the next set of Telnet requests.
Load Information from http://www.extremenetworks.com
A check in this box specifies that EPICenter can automatically connect to the Extreme Networks web site to update image information using an external (web) connection.
The external connection is used by EPICenter to query the Extreme Networks web site for the latest versions of ExtremeWare software images and BootROM images. It uses this information to determine if the versions running in your switches are current, or are obsolete. This information is shown in the Firmware Manager.
This also determines the latest version and patch level of the EPICenter software, and compare the information to the version currently running. If a newer version is available, it is noted on the basic status page, displayed when you first launch EPICenter.
If you selected Yes to the Automatic Information Updates question when you installed the EPICenter server, this property will be enabled.
HTTP Proxy Device The IP address or hostname of an HTTP proxy device used to connect to the Extreme Networks web site if your network uses a firewall. When an HTTP proxy is configured, all HTTP connections are made through the proxy server rather than directly to Extreme Networks.
HTTP Proxy Port The port number for the HTTP Proxy, used to connect to the Extreme Networks web site if your network uses a firewall.
EPICenter Reference Guide

Server Properties Administration
The Server State Summary Report includes Poller Statistics showing the status of the polling activity (see “Server State Summary Report” on page 366).
When you select MAC Polling Properties from the drop-down menu field at the top of the properties panel, you can set the following properties:
Other PropertiesWhen you select Other from the drop-down menu field at the top of the properties panel, you can set the following properties:
Enable MAC Polling A check in this box enables MAC address polling. Polling is disabled by default.
System Load Tells EPICenter how much impact on EPICenter server performance is acceptable due to the MAC address polling cycle. EPICenter uses the System Load setting, in conjunction with the length of time it took for the most recent set of Telnet requests to complete, to calculate how long to wait before issuing the next set of Telnet requests.
A setting of Light (recommended) means EPICenter will calculate a relatively longer interval before the next set of Telnet requests, to place a lighter load on the EPICenter server. This in turn means it will take longer for the server to accomplish a complete MAC Address polling cycle.
Moving the load indicator towards Heavy will result in shorter elapsed times between sets of Telnet requests, at the cost of a heavier load on the EPICenter server due to MAC address polling. However, if your polling data is frequently out of date, moving this setting towards Heavy may result in more timely data.
DNS Lookup Timeout Period
The time-out period, in seconds, when performing DNS lookup operations for hosts found through DLCS or when importing from an NT Domain Controller. The default is one second.
Session Timeout Period The non-activity time-out period, in minutes, after which the user is required to re-login to the EPICenter server. The default is 30 minutes. You can disable the time-out by setting the property to -1.
ServiceWatch URL The URL for accessing ServiceWatch, to allow it to be launched from the EPICenter Navigation Toolbar, and to run in the main EPICenter window.
For example, if ServiceWatch is running on a system named “tampico” at port 2000, you would enter http://tampico:2000 as the ServiceWatch URL. You must then restart the EPICenter server to activate the ServiceWatch integration.
IP QoS Rule Precedence The starting value that the EPICenter server will use for setting precedence for IP QoS rules. This is an integer between 1 and 25,000. The default value is 10,000.
Client Port The TCP port number that a client will use to connect to the EPICenter server. The default is 0, meaning that the server will use any available port. You can use this setting to specify a fixed port number that the EPICenter server will use. For example, if the EPICenter server is behind a firewall, you may need to provide a fixed port number to allow clients to connect thought the firewall.
Update Type Library on Server
This function updates the EPICenter type library, which is a repository of information about devices (primarily from Extreme Networks) that are supported by EPICenter.
Note: If you are adding a third-party device that had been listed as “unknown” in Inventory Manager, then after updating the type library, you must log out of EPICenter, then log back in again, in order for the device to be shown correctly in Inventory Manager.
Device Tree UI A setting that specifies how devices are identified in the Component Trees and in selected other locations. You can choose to have the component tree show the device name only, the device name followed by the IP address in parentheses, or the device IP address followed by the device name in parentheses. The default is device name followed by the device IP address.
EPICenter Reference Guide 313

Administering EPICenter
314
Distributed Server Administration
NOTE
The Distributed Server functionality is part of the Gold Upgrade, a separately licensed feature of the EPICenter software. If you do not have a Distributed Server license, only Single Server mode and Distributed Group Member modes are enabled.
If your user role is Administrator, if you have a Distributed Server license, and you have multiple EPICenter servers installed on your network, you can configure these servers to operate in a distributed server mode.
Distributed Server mode allows multiple EPICenter servers, each managing their own sets of devices, to be designated as a server group, and to communicate status between the servers in the group. One server acts as a Server Group Manager, and the other servers act as server group members.
Each server in the server group is updated at regular intervals with a list of other servers, and with network summary and status information from the other servers in the group. In distributed server mode, the EPICenter home page contains a status information from the other servers in the group in addition to the standard Network Summary report.
1 Click the Distributed Server tab at the top of the page.
The Distributed Server Administration page appears, as shown in Figure 183.
Port Tree UI A setting that specifies how ports are identified in the component trees and in selected other locations. You can choose to have the component tree show the port number only, or the port number followed by the port name in parentheses (if a name or display string has been associated with the port). The default is port number only.
DHCP Temporary Lease A setting that informs the server how long to wait before querying a switch for a netlogin or a permanent IP address from an 802.1x client. The default is 20 seconds.
Enable Link Up/Link Down Correlation
Enables correlation between link up and link down traps on a port. When this is enabled, a Link Down trap that is followed quickly (within 20 seconds) by a Link Up trap on the same port, will be marked in the Alarm Manager to be ignored. This feature is disabled by default.
Telnet Screen Width The number of columns available on the screen for the Telnet application. The default number of columns is 80. The range is between 40 and 180 columns.
Configure Upload File Name
The default file name format for files used to store your uploaded configuration files. This setting changes the global default name format.
Type a space to invoke a list of elements you can include. These include the system name (SysName), IP address, Date, and Time. You can specify the system default format (<IPAddress>_<Time>) by choosing DEFAULT from the list. You can select these elements in any order, but you must include both the IP address and the Time somewhere in your filename format. Each element you choose is separated from its neighboring elements by an underscore.
You can also include text of your own in the filename format; it will then appear in every file name EPICenter creates (until you change the format).
Show device-image navigation by default
EPICenter Reference Guide

Distributed Server Administration
Figure 183: Distributed Server Administration page
Initially, the EPICenter server is configured as a single server. In single server mode, the server does not communicate with any other EPICenter servers. If you have a Distributed Server license, you can change its configuration to act as a server group member or as the server group master.
Configuring a Server Group MemberTo configure your EPICenter server as a server group member:
1 Click the Server Group Member button in the Server Group Type panel at the top of the page.
This enables the fields in the Server Group Member panel.
2 Enter the host name or IP address of the server that acts as the group manager in the Server Group Manager field.
3 Enter the port number to be used to communicate with the Server Group Manager. This port should match the HTTP port configured for the EPICenter server acting as the server group manager. The default is port 8080.
4 Enter the shared secret in the Secret field.
This string is a shared key by which the cooperating EPICenter servers recognize each other, and which they use for secure transmission of server data. The default shared secret is the string secret.
EPICenter Reference Guide 315

Administering EPICenter
316
NOTE
If you change the secret for one EPICenter server, you must also change it for all of the other servers in the group.
5 Click Apply to have the configuration changes take effect.
Configuring a Server Group ManagerTo function as the EPICenter Server Group Manager, the server must have a host name that is configured through DNS.
To enable this EPICenter server as a server Group Manager, do the following:
1 Click the Server Group Manager button in the Server Group Type panel at the top of the page.
This enables the fields in the Server Group Manager panel.
2 Enter the shared secret in the Secret field.
This string is a shared key by which the cooperating EPICenter servers recognize each other, and which they use for secure transmission of server data. The default shared secret is the string secret.
NOTE
If you change the secret in one EPICenter server, you must also change it in all of the other servers in the group.
3 Enter the Poll Interval in minutes. This determines the frequency with which the Server Manager communicates information to the other server members of the EPICenter server group. The default is 10 minutes.
4 Add the other members of the server group to the server list:
a Click Add to open the Add Server dialog box.
b Enter the host name or IP address of the member server in the server field. A server member does not need to have a DNS-translatable host name.
c Enter the port used to communicate with the server member. This must match the HTTP port configured for the member server
d Click OK to add this server to the list, or Cancel to cancel the operation.
Servers added to this list must be configured as server group members with this server as the Server Group Manager.
5 To delete a member server from the list, select the server and click Delete.
6 Click Apply to have the configuration changes take effect.
EPICenter Reference Guide

16 EPICenter Reports
This chapter describes the predefined reports provided by the EPICenter Reports feature. This chapter covers the following topics:
● Accessing Reports from EPICenter or from a browser
● The Network Summary Report, which is also displayed on the EPICenter Home page
● Exporting EPICenter data for use by Extreme Technical Assistance Center
● Viewing predefined EPICenter status reports from a browser
Reports OverviewThe EPICenter software provides a series of HTML-based reports that present a wide variety of information about your network and the devices EPICenter is managing. These reports can be accessed from the Network Adminstration folder in EPICenter, or they can be accessed separately from a standard web browser.
The EPICenter reports do not require Java capability, and thus can be accessed from browsers that cannot run the full EPICenter user interface.
These reports can be loaded quickly, even over a dial-up connection, and can also be printed. Some of these “reports” are actually tools to help you access information helpful for debugging problems with EPICenter or the devices it is managing.
With the exception of the Network Summary Report, EPICenter’s HTML reports are always displayed in a browser window, even if you are logged into EPICenter. See “Browser Requirements for Reports” in the EPICenter Installation and Upgrade Guide or the EPICenter Release Notes for a list of supported browsers. The browser configured as the default for your system is the one that is launched.
The Network Summary Report is also displayed on the EPICenter Home page.
Accessing EPICenter ReportsYou can access the EPICenter reporting capability in either of two ways:
● From EPICenter, by clicking the Reports in the Network Administration folder; the Dynamic Reports Main page appears, as shown in Figure 185 on page 321.
● Directly from a browser, without logging into EPICenter.
EPICenter Reference Guide 317

EPICenter Reports
318
To access the EPICenter reporting capability directly from a browser:
1 Launch your Web browser, and enter the following URL:
http://<host>:<port>/
In the URL, replace <host> with the name of the system where the EPICenter server is running. Replace <port> with the TCP port number that you assigned to the EPICenter Web Server during installation (by default this is port 8080).
2 When the EPICenter Welcome page appears, as shown in Figure 184, click Log on to Reports only in the left-hand panel.
Figure 184: EPICenter Welcome Page
You will be asked to log in; use the same user name and password as you use to log in to the EPICenter server.
Reports Available in EPICenterThe EPICenter software provides the following reports and tools:
Table 29: EPICenter Reports
Report Category
Report Name Description
Main • Extreme eSupport Export Exports EPICenter data for use by Extreme technical support. Accessible from the Main reports page.
EPICenter Reference Guide

Accessing EPICenter Reports
Network Summary
• Network Summary Report Summary status of the network, as well as version and patch information about the EPICenter server. Shows status of distributed servers if applicable.
Devices • Device Inventory Reportby Device Group and Device Type
By DeviceDevice Details
Power Over EthernetPower Over Ethernet Details
Overview of devices known to EPICenter, by Device Group. From this report you can access the Device Details report, and additional subreports such as PoE information for devices that support those features.
• ReachNXT Devices Report Status of ReachNXT devices connected to switches known to EPICenter.
• Device Status Reportby Device Group
By DeviceAlarm Details
Status of devices by device group. From here you can access status of individual devices (alarms, not responding etc.) and can drill down to Alarm Details
Slots, Stacks and Ports
• Slot Inventory, by Card TypeCard Summary (by Card or All Cards)
Device DetailsSlot Details
Empty Slots Report
Inventory of cards (by type) installed in devices in the EPICenter database. The Card Summary Report shows details about cards of a given type. From there you can view details about the device hosting the card. The Empty Slots report shows empty slots by device.
• Stack InventoryStack Summary
Device DetailsStack Details
Inventory of stacking devices. From this report you can access Device Details for the stacking device, or Stack Details.
• Interface Report Inventory of all ports on devices in the database
• Unused Port ReportBy Device
Summary of inactive ports by device including location, with subreports (by device) showing length of inactivity, VLAN membership etc.
EAPS • EAPS Summary Summary of EAPS domains known to EPICenter
• EAPS Log EAPS-related Trap and Syslog entries for devices configured for EAPS
Logs • Alarm EPICenter alarm log (more information available through Alarm Log Browser feature)
• Event EPICenter event log entries
• Syslog Syslog entries
• Config Mgmt Log of configuration management actions (config file uploads/downloads) and results
Table 29: EPICenter Reports (continued)
Report Category
Report Name Description
EPICenter Reference Guide 319

EPICenter Reports
320
Selecting Predefined EPICenter Reports to ViewThe Reports browser interface initially shows the EPICenter Reports Main page, as shown in Figure 185.
Client Reports
• Network Login List of network login activity by device
• Current ClientsWireless Client History Report
List of all current wireless clients detected, regardless of client state.
• Client History Historical presentation of activity by wireless client
• Spoofed ClientsDevice DetailsWireless Port Details
List of clients with the same MAC address detected on different wireless interfaces. From here you can view details on the device or interface reporting the client.
• Unconnected Clients List of wireless clients not in the data forwarding state
MIB Poller Tools
• MIB Poller Summary Displays data in a MIB collection. Users with an Administrator role can start or stop a collection.
• MIB Query Provides an interface to query for the value of specific MIB variables. This is available only to users with an Administrator role.
See the chapter on “Tuning and Debugging EPICenter” in the EPICenter Concepts and Solutions Guide for more information.
EPICenter Server
• Server State Summary Shows a variety of status information about the EPICenter server.
• Debug EPICenter Tools to aid in analyzing EPICenter performance. These are available only to users with an Administrator role.
See the chapter on “Tuning and Debugging EPICenter” in the EPICenter Concepts and Solutions Guide for more information.
Table 29: EPICenter Reports (continued)
Report Category
Report Name Description
EPICenter Reference Guide

Accessing EPICenter Reports
Figure 185: EPICenter Reports menu
The Main page includes a brief description of the predefined reports that are available; scroll down in the page to see the complete list.
If you have started the Reports feature from within EPICenter, you can use the Close Window button to exit the Reports feature.
If you have logged in to the Reports feature directly from a browser, the Close Window button is replaced by a Logout button, which returns you to the EPICenter Start-up page.
From the menu at the left on the Reports Main page, you can choose a report to view. Click a category (Devices, Slots and Ports, Logs, etc.) to see the reports in that category.
NOTE
You can access Online Help for reports by clicking the Help link shown at the top of the EPICenter Reports Welcome page. You can also access Help for Reports by selecting EPICenter Help from the Help menu in any EPICenter feature, and then finding the Report you want in the Table of Contents.
The Extreme Networks eSupport Export ReportThis report is generated by EPICenter on request, for use by Extreme technical support. It exports detailed information to a file is csv format. You can then send this report to Extreme.
To create a eSupport report, select a Device Group from the pull-down menu, then click Export. You are asked to provide a filename for the file, and will be able to specify a location on your local system where the file should be saved.
EPICenter Reference Guide 321
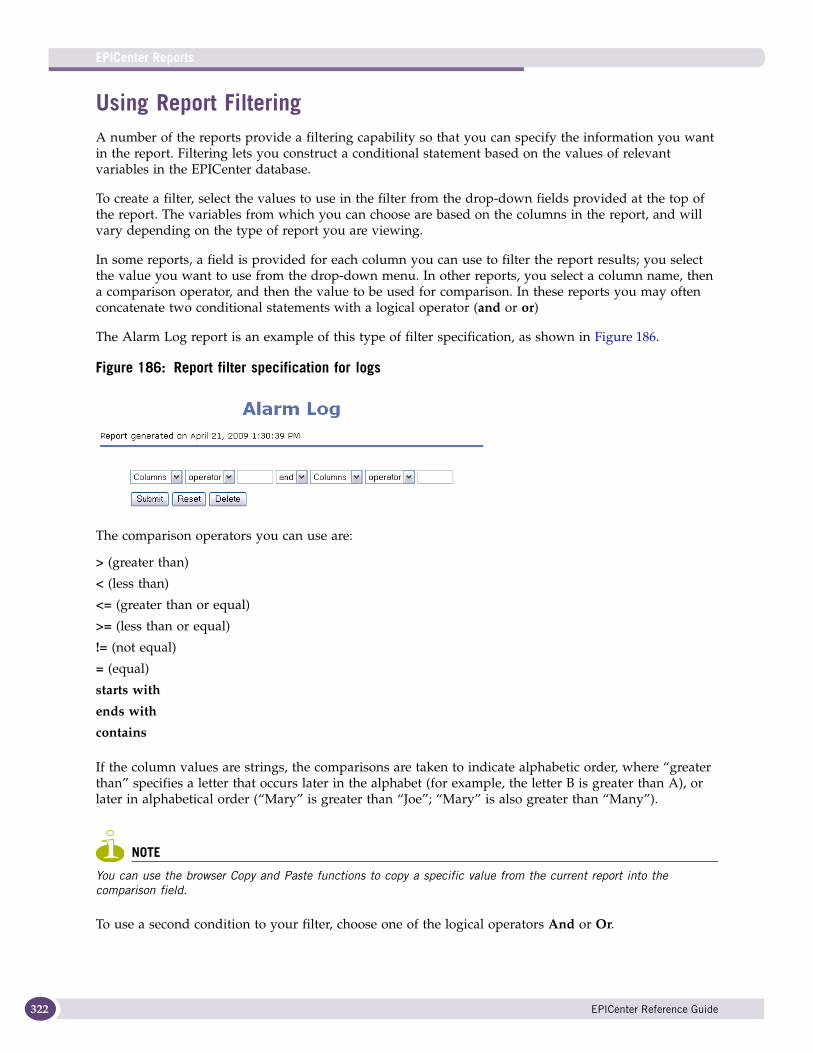
EPICenter Reports
322
Using Report FilteringA number of the reports provide a filtering capability so that you can specify the information you want in the report. Filtering lets you construct a conditional statement based on the values of relevant variables in the EPICenter database.
To create a filter, select the values to use in the filter from the drop-down fields provided at the top of the report. The variables from which you can choose are based on the columns in the report, and will vary depending on the type of report you are viewing.
In some reports, a field is provided for each column you can use to filter the report results; you select the value you want to use from the drop-down menu. In other reports, you select a column name, then a comparison operator, and then the value to be used for comparison. In these reports you may often concatenate two conditional statements with a logical operator (and or or)
The Alarm Log report is an example of this type of filter specification, as shown in Figure 186.
Figure 186: Report filter specification for logs
The comparison operators you can use are:
If the column values are strings, the comparisons are taken to indicate alphabetic order, where “greater than” specifies a letter that occurs later in the alphabet (for example, the letter B is greater than A), or later in alphabetical order (“Mary” is greater than “Joe”; “Mary” is also greater than “Many”).
NOTE
You can use the browser Copy and Paste functions to copy a specific value from the current report into the comparison field.
To use a second condition to your filter, choose one of the logical operators And or Or.
> (greater than)
< (less than)
<= (greater than or equal)
>= (less than or equal)
!= (not equal)
= (equal)
starts with
ends with
contains
EPICenter Reference Guide

Accessing EPICenter Reports
If you do not want to include a second condition, do not select any values for those fields.
With either type of filter specification, click Submit to run the filter. Click Reset to return the filter to its default values.
Sorting ReportsIf a column heading in a report is shown in purple and underlined, you can click on the heading to sort the report based on the contents of the column. Clicking once sorts the report in ascending alphabetic or numeric order; clicking a second time reverses the sort order.
Exiting Reports To exit the Reports feature, close the browser, or click the Close Window link in the left-hand panel. If you logged in directly from a browser rather than through EPICenter, click the Logout link to return to the EPICenter start-up page.
If you launched the Reports feature directly from the browser, the browser may time out if there is no activity for a period of time. To access Reports after the browser times out, log in again.
EPICenter Report StructureEPICenter reports are either generated by Tcl scripts or are Java-based. The Tcl-based reports can be customized, and can serve as models for new reports. The Java-based reports cannot be customized.
The Tcl-based reports are:
● Device Inventory
● Device Status
● Unused Ports
● EAPS reports
● Network login
● Client History
● Spoofed Clients
● Unconnected Clients
● Server State Summary
● Resource to Attribute
● User to Host
And Include a row in the report only if both conditions are true.
Or Include the row if either one (or both) of the conditions are true.
EPICenter Reference Guide 323

EPICenter Reports
324
Network Status Summary ReportThe Network Status Summary Report is an at-a-glance summary of the status of the devices that the EPICenter server is monitoring. The main report page, as shown in Figure 187, appears when you first log into EPICenter, and when you click the Home button at the top of the Navigation Toolbar.
Figure 187: Network Status Summary Report
The Network Status Summary Report displays information about the overall health of the network. It also displays information on the current version of the EPICenter software running on the EPICenter service and compares the current version to the latest available version.
This summary shows the following statistics:
● The number of devices known to the EPICenter server that are not responding to EPICenter queries.
● The number of devices reported to be in marginal condition (such as a problem with the fan, temperature, or power).
● The number of devices that are offline for planned service.
● The number of critical alarms in the last 24 hours that have not been acknowledged.
● The number of Syslog messages with a priority of Critical or worse that occurred in the last 24 hours.
● The number of Invalid Login alarms that have occurred in the last 24 hours.
● The number off Authentication Failure alarms that have occurred in the last 24 hours.
For any of these items where the number is non-zero, the description becomes a link to a sub-report that gives you more information about the situation—a list of devices or alarms or messages.
EPICenter Reference Guide

Device Reports
The Network Status Summary Report also provides version information about the EPICenter software running on your machine. The information reported includes:
In order for your machine to verify the latest EPICenter software version, it must access the Extreme Networks web site at http://www.extremenetworks.com. If your network uses a firewall, you can configure HTTP proxy properties using the Server Properties, External Connections option of the Admin feature.
To configure an HTTP proxy device and port, see “External Connections Properties” on page 312.
The Distributed Server SummaryIf you are running in a Distributed server configuration, a Distributed Server summary appears below the Network Summary.
Each row in the summary provides the status of one of the EPICenter server group members. It provides the following information about each server:
Device ReportsClick the Devices link to display links to the Device Reports. These reports provide a variety of status information about the devices being managed by EPICenter.
Device Inventory ReportTo view a list of device groups and devices known to the EPICenter software, click the Device Inventory link in the left-hand panel. Figure 188 shows example output.
Software The EPICenter software. The name is a link to the Extreme support site where you can access more information about the software release or service pack.
Current Version The version of software currently running.
Available Version The number of the most recently available version of the software.
Status The status of the software running on this machine—whether it is up to date or is not up to the most current version available from Extreme.
Server The server name.
Clicking on the server name initiates the Dynamic Reports feature for that server. You can then run any of the available HTML reports.
Launch Client A link that can launch a client connection to the server.
Clicking on the Client link launches a client that attempts to connect to that server.
Devices Up The number of devices managed by the server that are up.
Devices Down The number of devices managed by the server that are down.
Critical Alarms The number of critical alarms that have occurred on devices managed by the server.
Last Update The date and time of the last update of the server summary information for this server.
Server Status The status of the server (whether it is responding to the periodic poll).
EPICenter Reference Guide 325

EPICenter Reports
326
Figure 188: Device Inventory Reports
The initial display presents summaries at the Device Group and the device type level.
A drill-down report, called Device Details, contains the same information you can view in the EPICenter Inventory. Information on this report is on page 328.
Devices by Group Table
The Devices by Group table displays the following information:
Device Group Name of the device group
Description Description of the group as kept in the EPICenter device inventory
Quantity Number of devices in the group
EPICenter Reference Guide

Device Reports
Devices by Type Table
The Devices by Type table displays the following information:
Select a Device Group, a device type, or All Devices (at the bottom of either table) to display the All Devices Device Summary. Figure 189 shows the Device Summary report for All Devices.
Figure 189: All Devices Device Summary
The All Devices Device Summary displays the following information about each device:
Device Type Type of device
Quantity Number of devices of this type known to EPICenter
Device Group(s) All EPICenter Device groups to which it belongs (this is displayed only if you select All Devices)
Name Name of the device from the sysName variable
IP Address IP address of the device
Click the IP address to display a table with detailed configuration and status information. This is the same information you can view in the EPICenter Inventory.
Type Type of device
Location Device location from the sysLocation variable
MAC Media access control address of the device
Serial Number Device serial number
Current Image Software version currently running on the device, if known
EPICenter Reference Guide 327

EPICenter Reports
328
Click on the IP Address of a device to show a Device Details Report for the device.
Device Details Report
The Device Details report shows information about an individual device. If the device includes a PoE blade, you will be able to link to reports about that feature (the Additional Switch Information links at the bottom of the details report). If the device does not support that feature, the Additional Switch Information links do not appear.
Figure 190: Device Details
This report shows the following information:
Serial Number Device serial number
IP Address IP address of the device
Device Group(s) Device Groups to which this device belongs
Device Type The device type
Name The name given to the device
EPICenter Reference Guide

Device Reports
If the device supports Power over Ethernet (PoE), you can view reports on PoE status.
Click Power Over Ethernet to view the Power over Ethernet Report.
Power over Ethernet ReportThe Power Over Ethernet report shows information about the PoE configuration of the device. Figure 191 shows an example of this report.
Description The description provided for the device
Location The location information for the device
Contact The contact information for the device
Boot Time (Pacific Daylight Time) Time of the most recent boot.
Software Version The version of software currently running on the device
Primary Image The version of software saved as the Primary Image
Secondary Image The version of software saved as the Secondary Image
Status Device Status: OK, marginal, or
Fan Status Status of fans: OK, marginal, or If there are multiple fans, each is listed (fan 1, fan 2 etc.)
Power Status Status of power supply modules: OK, marginal, or If there are multiple modules, each is listed (power 1, power 2 etc.)
EPICenter Reference Guide 329

EPICenter Reports
330
Figure 191: Power over Ethernet Report
The report shows the following information about the PoE configuration:
Device-level information:
PoE Power Source:
Configuration Whether PoE is enabled for the switch. (Enabled or Disabled)
Power Supply Mode The configured power-supply mode: Redundant, Load-Sharing, or N/A (if only one power supply is installed).
Disconnect Precedence The method used to determine which port to disconnect when power drain exceeds the power budget:
• lowest-priority (next port connected causes a shutdown of the lowest priority port)
• deny-port (next port that attempts to connect is denied power, regardless of priority)
Usage Threshold (%) The threshold for power utilization compared to the configured maximum for either the allocated power budget per slot, or for system level allocation.
Group Index The index for the specific power source
Maximum Power (Watts) The maximum power available from the source
Measured Power (Watts) The current measured power from the source
Operational Status Operational Status of the power supply (on, off, faulty)
EPICenter Reference Guide

Device Reports
PoE Slot Information:
At the bottom of the page is a link to a detailed report on PoE ports. Click the link to access the Power over Ethernet Details report.
Power Over Ethernet Details Report
This report shows power details for each port on the device. Figure 192 shows an example of this report.
Figure 192: Power over Ethernet Details Report (partial)
Slot Number The slot number where this module resides
Group Index The index of the power source supplying inline power to this slot
Max Available Power (Watts) The maximum power available to this slot
Measured Power (Watts) The current measured power on the slot
Configured Power Limit (Watts) The configured maximum amount of inline power available to this slot
Configuration Indicates whether PoE is enabled or not
Status Status of the slot: (initializing, operational, download fail, calibration required, invalid firmware, mismatch version, updating, invalid device, not operational, or other)
Power Source PoE supply source: external, internal, or none
Backup Power Source PoE backup power source: External, internal, none, or not applicable
EPICenter Reference Guide 331

EPICenter Reports
332
This report shows the following information:
To view device status information, click the Device Status link in the left-hand panel. You can use this report and its sub-reports to determine status and failure log information for the devices known to EPICenter.
Initially, this report displays summary status at the Device Group level. Figure 195 shows example output.
Figure 193: Device Status
The information displayed at Device Group level includes the following:
Port Num Port number
Measured Power (mW) Measured power on this port
Operational Max Power (mW) Maximum power limit on this port
Reserved Power (mW) Reserved power limit on this port
Port Type The user-defined port type
PoE status Whether power is enabled on this port (Enabled or Disabled)
Operation Status Status of the port (disabled, searching, delivering power, fault, test, other fault)
Classification Class association for this port (0,1,2,3,4)
Priority Port priority for purposes of power management
Violation Precedence The limit used to determine power level violation (advertised class, operator limit, max advertised operator, or none)
Group Name of the device group
Description Description of the group as kept in the EPICenter device inventory
EPICenter Reference Guide

Device Reports
Click a Device Group name in the Group column to display the Device Status Report for the devices in the group. Figure 196 shows example output.
ReachNXT DevicesThe ReachNXT Devices report provides information about the ReachNXT devices connected to ports on switches managed by EPICenter.
Figure 194: ReachNXT Devices Report
he ReachNXT report displays the following information:
Alarms in last 24 hours Total alarms for all devices in the device group
Devices Not Responding Number of devices in the group that are not responding
Devices Marginal Number of devices in the group whose operation is marginal
Devices Offline Number of devices in the group that are offline
Devices Up Number of devices in the group that are up
Device name The name of the switch where the ReachNXT device is connected.
Device IP address The IP address of the switch where the ReachNXT device is connected.
Port Number The number of the port connected to the ReachNXT device.
Model number The model number of the ReachNXT device.
Serial number The serial number of the ReachNXT device.
MAC address The MAC address of the ReachNXT device.
EPICenter Reference Guide 333

EPICenter Reports
334
Device Status ReportTo view device status information, click the Device Status link in the left-hand panel. You can use this report and its sub-reports to determine status and failure log information for the devices known to EPICenter.
Initially, this report displays summary status at the Device Group level. Figure 195 shows example output.
Figure 195: Device Status
The information displayed at Device Group level includes the following:
Click a Device Group name in the Group column to display the Device Status Report for the devices in the group. Figure 196 shows example output.
Software version The version of software the ReachNXT device is running.
Description Description of the ReachNXT device, if configured.
Uplink Port The uplink port used by the ReachNXT device to connect to the switch
Group Name of the device group
Description Description of the group as kept in the EPICenter device inventory
Alarms in last 24 hours Total alarms for all devices in the device group
Devices Not Responding Number of devices in the group that are not responding
Devices Marginal Number of devices in the group whose operation is marginal
Devices Offline Number of devices in the group that are offline
Devices Up Number of devices in the group that are up
EPICenter Reference Guide

Device Reports
Figure 196: Device Status (Group detail)
The information shown is as follows:
If the number of alarms is greater than zero, you can click on the number in that field to display a summary of the alarms. This displays the Alarm Details sub-report.
Alarm Details Report
The Alarm Details report shows a summary of the alarms for the specific device. Figure 197 shows example output.
Device Group Name of the device group
Device Name Name of the device from the sysName variable
IP IP address of the device
Status The status of the device: operational, offline, marginal, and not responding
Last Failure (Local Time Zone)
Time at which the most recent device failure occurred, expressed in the local time zone of the EPICenter server
Down Period (d:h:m:s) Length of time the device was unreachable, reported in days:hours:minutes:seconds
Boot Time (Local Time Zone)
Time when the device was last booted, expressed in the local time zone of the EPICenter server
Alarms in last 24 hours Number of alarms in the last 24 hours from this device
EPICenter Reference Guide 335

EPICenter Reports
336
Figure 197: Device Status: Alarm Details
The information presented in this report is as follows:
Slots, Stacks and Ports ReportsThe following reports show information about the slots (module cards) installed in the Extreme devices managed by EPICenter, or about stacking devices known to EPICenter. These reports also provide information about the ports on those devices or modules.
Slot InventoryClick the Slot Inventory link in the left-hand panel to view the Slot Inventory Reports list showing an inventory of the slots and module cards known to EPICenter. Figure 198 shows example output. Click a
Name Name of the device from the sysName variable
Category The device group
Time (Local Time Zone) Time at which the most recent device failure occurred, expressed in the local time zone of the EPICenter server
Severity Severity level of the failure
Message Error message displayed in the Alarm Log
EPICenter Reference Guide

Slots, Stacks and Ports Reports
Card Type link to view a Card Summary Report for an individual card type. Click All Cards (at the bottom of the list) to view a Card Summary Report showing all cards known to EPICenter. Click Empty Slots (also at the bottom of the list) to view a report on the empty slots detected by EPICenter.
Figure 198: Slot Inventory Report
The initial display summarizes module card types and empty slots:
Card Summary ReportSelect a Card Type or All Cards to display the Card Summary report for the modules known to EPICenter. Figure 199 shows an example of output that appears if you select All Cards. The information shown for an individual card type is the same, except that the Card Type column is not included.
Card Types Type of module cards and empty slots known to EPICenter
Quantity Number of modules of a given type. For All Cards, this is the total number of cards in all modular devices known to EPICenter. For Empty Slots, this is the total number of empty slots detected among the modular devices known to EPICenter.
EPICenter Reference Guide 337

EPICenter Reports
338
Figure 199: All Cards Card Summary
Each Card Summary displays the following information about each module:
Click the heading of a column to sort on the contents of that column.
If you have selected an individual card type, this report shows only modules of the selected type. If you have selected All Cards, the report shows all cards in any of the devices known to EPICenter.
Empty Slots ReportSelect Empty Slots to display the Empty Slots summary report for the empty slots known to EPICenter.
Device Group(s) Name of all the device groups of which the device is a member
Device Name Name of the device (where the card resides) from the sysName variable
Device Address IP address of the device
Device Location Device location from the sysLocation variable
Card Type Type of module card (this is displayed only if you select All Cards)
Slot Name Number or letter of the slot where the module card is installed
Card Serial Number Module card serial number
EPICenter Reference Guide

Slots, Stacks and Ports Reports
Figure 200: Empty Slots Summary
The Empty Slots summary report displays the following information about the empty slots:
Stack Inventory ReportsClick the Stack Inventory link in the left-hand panel to view the basic Stack Inventory Reports list showing an inventory of the stacking devices known to EPICenter. Figure 201 shows example output. Click a Stack Device link to view a Stack Summary Report for an individual stack device. Click All Stacks (at the bottom of the list) to view a Stack Summary Report showing all stack devices known to EPICenter.
Device Group Name of the device group
Device Name Name of the device from the sysName variable
Device Address IP address of the device
Device Location Device location from the sysLocation variable
Empty Slots Number or letter of the empty slot(s) on the device
EPICenter Reference Guide 339

EPICenter Reports
340
Figure 201: Stack Inventory
The initial display summarizes module card types and empty slots:
Stack Summary ReportSelect a Stack Device type or All Stacks to display the Stack Summary report for the stack devices known to EPICenter. Figure 199 shows an example of output that appears if you select All Stacks. The information shown for an individual stack device type is the same, except that the Card Type column is not displayed.
Stack Devices Type of stacking device
Quantity Number of devices of a certain type. All Stacks shows total number of stacking devices known to EPICenter.
EPICenter Reference Guide

Slots, Stacks and Ports Reports
Figure 202: All Stacks Card Summary
Each Stack Summary displays the following information about the device:
Click the heading of a column to sort on the contents of that column.
If you have selected an individual stack device type, this report shows only modules of the selected type. If you have selected All Stacks, the report shows all stacking devices known to EPICenter.
Stack Details ReportClick on a slot name to display the Stack Details report for the selected device. Figure 203 shows an example of output.
Device Group(s) Name of all the device groups of which the device (stack master) is a member.
Device Name Name of the device from the sysName variable
Device Address IP address of the device (link to the Device Details report)
Device Location Device location from the sysLocation variable
Card Type Type of stack device (this is displayed only if you select All Stacks)
Slot Name Name of the stacking device, linked to the Stack Details report for the device
Card Serial Number Stack Device serial number
EPICenter Reference Guide 341

EPICenter Reports
342
Figure 203: Stack Details Report
Each Stack Details report displays the following information about the stack device:
Interface ReportTo view a report on the status of every port known to the EPICenter software, click the Interface Report link in the left-hand panel. Figure 204 shows a portion of an example output.
Device Group(s) Name of all the device groups of which the device (stack master) is a member.
Device Name Name of the device from the sysName variable
Device Address IP address of the stack master device
Device Location Device location from the sysLocation variable
Device Current Image Version of image running on the master device
Slot Type Type of module card (this is displayed only if you select All Cards)
Slot Name Name of the stacking device, linked to the Stack Details report for the device
Slot Serial Number Stack Device serial number
Slot Primary Image The version of software saved as the Primary Image in the stack device
Slot Secondary Image The version of software saved as the Secondary Image in the stack device
Slot Current Image The version of software currently running in the stack device
Slot BootROM The BootROM version in the stack device.
EPICenter Reference Guide

Slots, Stacks and Ports Reports
Figure 204: Interface Report
The information reported for each interface includes:
Because the EPICenter server may be aware of many hundreds of ports, the interface information is displayed in groups of 25 ports per page. You can navigate among the pages using any of the following methods:
● Clicking the Previous and Next links
● Selecting a page number from the at the top of the report
● Clicking the First or Last links to display the first or last page in the report
The list of ports is sorted initially by IP address. Click the heading of a column to sort the report based on the contents of that column; for example, to sort by operational status, click on the OperStatus heading.
IP Address IP address of the interface
Port Port number of the interface
Port Name Port name of the interface
AdminStatus Interface administrative status (enabled/disabled)
OperStatus Operational status of the interface (ready/active)
Configured Speed/Type Nominal (configured) speed of the interface
Actual Speed/Type Actual speed of the interface
FDB Polling Whether the port is being actively polled as an edge port, or is not being polled. If the port is not polled, the reason is included (Device Not Supported, Inactive Port, Not Supported, Polling Disabled For Port, or Uplink Port)
EPICenter Reference Guide 343

EPICenter Reports
344
You can filter the ports that are displayed by constructing a conditional filter using the fields at the top of the page. This lets you construct a two-clause filter statement; Figure 205 shows an example.
Figure 205: Device Ports filter specification
For more information on the filtering choices, see “Using Report Filtering” on page 322 and following pages.
Unused Ports ReportTo see inactive ports for a particular device, click the Unused Ports link in the left-hand panel. Figure 206 shows example output.
EPICenter Reference Guide

Slots, Stacks and Ports Reports
Figure 206: Unused Ports Report
You can filter the report by selecting the following:
When you complete your selections, click Submit. The report can be saved in csv or xml format, or shown in a single page. It displays the following:
Click on an entry in the Inactive Ports column to open the Unused Port Reports detail; Figure 207 shows a portion of example output.
VLAN Select all VLANs or the name of a particular VLAN
Device Group Select all groups or the name of a particular device group
Inactive Days Enter the number of days of inactivity for the requested port(s)
Inactive Hours Enter the number of hours of inactivity for the requested port(s)
Device Name Name of the device on which the port resides
IP Address IP Address of the device on which the port resides
Inactive Ports Inactive ports on the device
Total Inactive Ports The total number of inactive ports on the device. The total number of inactive ports for all devices in the report is displayed at the bottom of the report.
Groups Device groups to which this device belongs
EPICenter Reference Guide 345

EPICenter Reports
346
Figure 207: Unused Ports Report: detail
Again, you can filter the report by specifying the VLAN, the device group, and the time frame (inactive days, inactive hours). The Unused Port Reports detail displays the following:
EAPS ReportsThere are two reports available under EAPS: the EAPS Summary report, and the EAPS Log report. Both of these reports are also accessible from within the EAPS Monitor.
EAPS SummaryThe EAPS Summary report provides a brief overview of the status of the EAPS domains known to EPICenter. This report can also be viewed from the Tools menu in the EAPS Monitor.
The report shows:
● The total number of EAPS domains known to EPICenter
● The number of Domains currently in an error state
Port Number Number of the unused port
Port Name An optional name (text string) configured for the port
Inactive Time Length of time this port has been inactive
Vlan Name Name of the VLAN to which this port belongs
Physical Type Type of port
EPICenter Reference Guide

EAPS Reports
● The number of domain failures that have occurred in the last 24 hours.
Figure 208: The EAPS Summary Report
EAPS Log ReportThe EAPS log report shows the EAPS traps or EAPS-related syslog entries that have occurred for devices that meet the specified filter criteria. By default, all devices, traps and syslog entries are shown. You can filter for:
● A specific device by IP address (must be exact, wildcards are not supported).
● The type of event (trap or syslog entries): you can enter any keywords that may appear under the Type column as part of the description of the trap or syslog entry.
● Specific varbinds (enter a keyword that matches the varbind you want to find, such as extremeEapsLastStatusChange.)
● Events that occurred within a certain timeframe.
EPICenter Reference Guide 347

EPICenter Reports
348
Figure 209: EAPS Log Report
The EAPS Log report displays the following information:
Log ReportsFour reports are provided under Logs: the Alarm, Event, Syslog, and Configuration Management Activity reports.
Time Time the event occurred, expressed in the local time zone of the EPICenter server
Source IP address of the device and port number (if applicable) that generated the event
Type Event type (for example, SNMP Trap)
Varbinds Variable data transmitted with a trap
EPICenter Reference Guide

Log Reports
Alarm Log ReportTo see all the entries in the EPICenter Alarm Log, click the Alarm Log link in the left-hand panel. Figure 210 shows a portion of an example output.
Figure 210: Alarm Log Report
The log can be saved in csv or xml format, or the entire report can be shown in a new page by clicking the show all link.
NOTE
If the EPICenter database has a large number of alarms, the show all option can take a very long time to complete.
The Alarm Log report displays the following information:
Time Time the alarm occurred, expressed in the local time zone of the EPICenter server)
Name Name of the alarm
Severity Severity level of the alarm
Source IP address of the device that generated the alarm
Category Category that the alarm is classified under
Ack’ed Whether the alarm has been acknowledged (0 is acknowledged, 1 is not acknowledged)
Event # Event ID of the alarm (assigned by the EPICenter server when the alarm is received)
Message Message associated with the alarm
EPICenter Reference Guide 349

EPICenter Reports
350
The alarm information is displayed in groups of 20 alarm events per page. You can navigate among the pages using any of the following methods:
● Clicking the Previous and Next links.
● Selecting a page number from the at the top of the report.
● Clicking on the First or Last links to display the first or last page in the report.
The report is sorted initially by the Time that the alarm occurred. Click the heading of a column to sort on the contents of that column.
You can filter the alarms that are displayed by constructing a conditional filter using the fields at the top of the page. You can construct a two-clause filter statement as shown in Figure 211.
Figure 211: Alarm Log filter specification
For further information on filtering, see “Using Report Filtering” on page 322. You can filter on any of the variables shown in the report.
Event LogTo view all the entries in the EPICenter Event Log, click the Event Log link in the left-hand panel. Figure 212 shows a portion of example output.
EPICenter Reference Guide

Log Reports
Figure 212: Event Log Report
The log can be saved in csv or xml format, or shown in a new page.
The information reported includes:
The event information is displayed in groups of 20 events per page. You can navigate among the pages using any of the following methods:
● Clicking the Previous and Next links
● Selecting a page number from the at the top of the report
● Clicking the First or Last links to display the first or last page in the report
You can filter the events that are displayed by constructing a conditional filter using the fields at the top of the page, as shown in Figure 213. You can construct a two-clause filter statement.
Event # Event ID of the event (assigned by the EPICenter server when the event is received)
Time Time the event occurred, expressed in the local time zone of the EPICenter server
Source IP address of the device and port number (if applicable) that generated the event
Type Event type (for example, SNMP Trap)
Varbinds Variable data transmitted with a trap
Count Number of consecutive events (if the same trap occurs at the same time and is received multiple times, only one event is created and the count displays the number of traps)
EPICenter Reference Guide 351

EPICenter Reports
352
Figure 213: Event Log filter specification
For further information on filtering, see “Using Report Filtering” on page 322. You can filter on any of the variables shown in the report.
You can use the browser’s Copy and Paste functions to copy a specific value from the current report into the comparison field. This technique is particularly useful if you want to filter on a specific Varbinds value.
EPICenter Reference Guide

Log Reports
Syslog (System Log)To see all the entries in the system log, click the Syslog link in the left-hand panel. Figure 214 shows a portion of example output.
Figure 214: Syslog (portion)
The log can be saved in csv or xml format, or shown in a new page.
EPICenter Reference Guide 353

EPICenter Reports
354
The information displayed includes the following:
The event information is displayed in groups of 25 events per page. You can navigate among the pages using any of the following methods:
● Clicking the Previous and Next links
● Selecting a page number from the at the top of the report
● Clicking the First or Last links to display the first or last page in the report
You can filter the events that are displayed by constructing a conditional filter using the fields at the top of the page, as shown in Figure 215. You can construct a two-clause filter statement.
Figure 215: System Log filter specification
For further information on filtering, see “Using Report Filtering” on page 322.
The Configuration Management Activity LogThis log tracks all the configuration operations performed through EPICenter — uploading and downloading of configuration files. To see all the entries in the Configuration Management Activity log, click the Config Mgmt link in the left-hand panel. Figure 214 shows a portion of example output.
Event # Event ID of the syslog entry (assigned by the EPICenter server when the syslog is received)
Time Time the syslog is received by EPICenter, expressed in the local time zone of the EPICenter server
Source IP address of the device that generated the syslog entry
Facility Syslog facility
Severity Syslog severity level
Message Error message text
EPICenter Reference Guide

Log Reports
Figure 216: Configuration Management Activity Log (portion)
The log can be saved in csv or xml format, or shown in a new page.
The information displayed includes the following:
The event information is displayed in groups of 25 events per page. You can navigate among the pages using any of the following methods:
● Clicking the Previous and Next links
● Selecting a page number from the at the top of the report
● Clicking the First or Last links to display the first or last page in the report
You can filter the events that are displayed by constructing a conditional filter using the fields at the top of the page, as shown in Figure 215. You can construct a two-clause filter statement.
Time Time at which the configuration activity occurred, expressed in the local time zone of the EPICenter server
Device IP address of the device on which the action was taken
Activity The action that was attempted
Status Whether the action was successful or not
Descr A message describing the reason for the status (the error message if the action could not be completed
File The configuration file involved in the action, if appropriate.
EPICenter Reference Guide 355
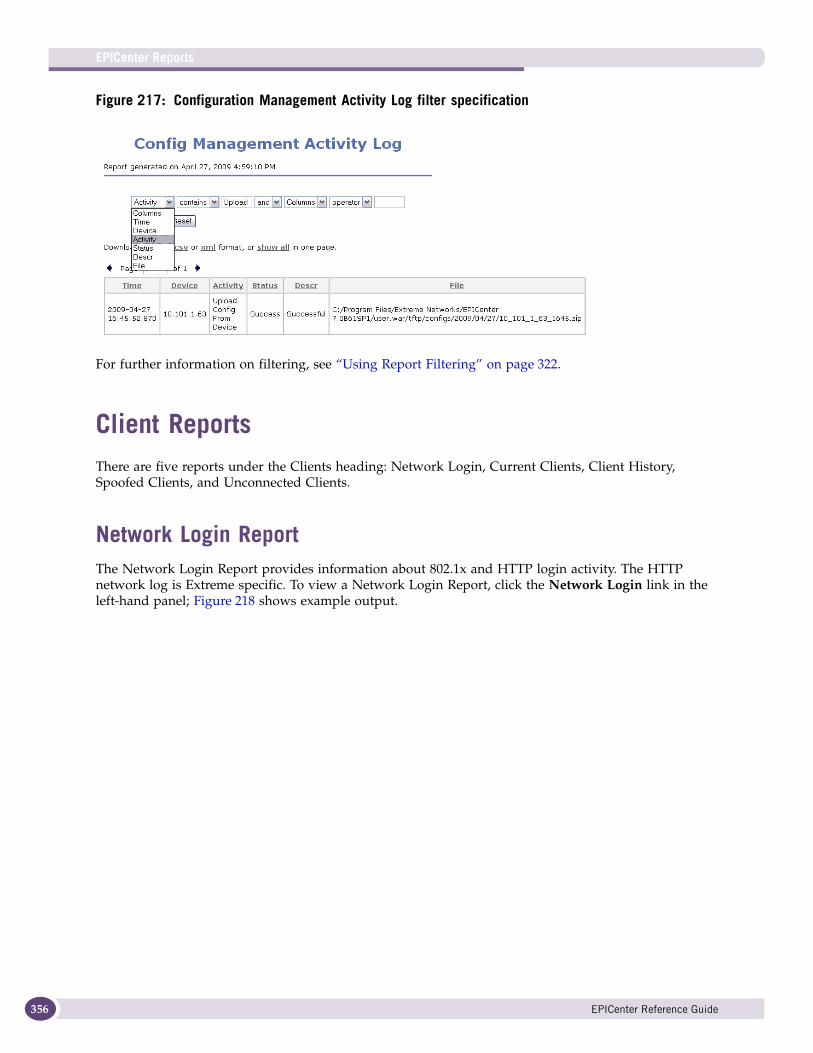
EPICenter Reports
356
Figure 217: Configuration Management Activity Log filter specification
For further information on filtering, see “Using Report Filtering” on page 322.
Client ReportsThere are five reports under the Clients heading: Network Login, Current Clients, Client History, Spoofed Clients, and Unconnected Clients.
Network Login ReportThe Network Login Report provides information about 802.1x and HTTP login activity. The HTTP network log is Extreme specific. To view a Network Login Report, click the Network Login link in the left-hand panel; Figure 218 shows example output.
EPICenter Reference Guide

Client Reports
Figure 218: Network Login Report
In this version of the Reports software, this report does not display wireless clients. You can filter this report by specifying a device name, a number of hours, or any combination of these.
The report displays the following information:
Click the heading of a column to sort on the contents of that column.
Current Clients ReportThe Current Clients report lists all wireless clients, regardless of their states, that are currently in the network as seen by the wireless ports. To view a summary of wireless clients, click the Client Reports link in the left-hand panel, and then click the Current Clients link. Figure 219 shows a portion of an example output (reduced here because of its width).
Device Name Name of the device
IP Address IP address of the device
Network Login Activity 802.1x network login activity that has occurred on this device
EPICenter Reference Guide 357

EPICenter Reports
358
Figure 219: Current Clients Report
You can set filters in this report for authentication method, encryption method, client state, device IP address, in any combination, along with an additional choice from the drop-down list (device interface, interface mode, interface channel, client SSID, client MAC address, or user name).
The information displayed is as follows:
Client MAC MAC address of the client. Click the link in this cell to display the Wireless Client History report for this client.
User Name User name associated with this client; appears only if the authentication method is 802.1x
Client State Current state of the client:
• Detected: The client is detected by the wireless interface, but has not yet been authenticated
• Authenticated: The client is authenticated on this wireless interface by the method shown in the Client Auth Method column
• Associated: The client is associated with the wireless interface, but cannot communicate with the network
• Data forwarding: The client can communicate with the network
Note: A client state changes from detected, authenticated, associated, and data forwarding, in that order. For interfaces using the WEP authentication method, a client in the authenticated state means the client has been authenticated. However, for interfaces using 802.1x authentication method, a client in the authenticated or the associated state only means that the client has gone through open authentication. When a client goes through the 802.1x authentication, the client will be in the data forwarding state. (The 802.1x authentication happens between the associated state and the data forwarding state.)
Client Auth Method Authentication method that client is using to access the network: Open, WEP, MAC, 802.1x, PSK, none, or all authentications
EPICenter Reference Guide

Client Reports
You can access drill-down reports as follows:
● Click on an entry in the Client MAC column to open the Wireless Client History Report for that client; see “Client History Report” on page 359.
Client History Report The Client History Report displays the history of all client logins, logouts, authentication failures, and age-out activity. You can use this report to track users roaming from one interface to another.
Wireless client history is based on traps that the EPICenter software receives; thus the history contains entries recorded only when the EPICenter software is running.
When the database becomes full, earlier history entries are truncated, and do not appear in the display.
To view the history of a wireless client, click the Client Reports link in the left-hand panel, and then click the Client History link. Figure 220 shows a portion of example output.
Client Encrypt Method Encryption method used by this client: WEP64, WEP128, TKIP, AES, None, or unknown
Client SSID Service set ID for the client
Device Name and IP address of device reporting this client
Interface Wireless interface (radio) reporting this client
RF Mode Wireless LAN RF mode: 802.11a, 802.11b, 802.11g, or 802.11b/g
RF Channel Radio frequency channel used by the interface
Last State Change Date and time of this client’s last state change, expressed in the EPICenter server’s local time zone
EPICenter Reference Guide 359

EPICenter Reports
360
Figure 220: Client History Report
Specify the client action, client MAC address, user name, and reporting period to filter this report. If you access this report by clicking the Client History link in the menu, the latest hour of history for all clients on all wireless ports is shown. If no time period is specified, the report displays the entire history in the database since the EPICenter software was last started.
The information displayed is as follows:
Time Time of this client’s action as noted in the Action column
Client MAC MAC address of the client
User Name User name that the client is using to connect to interface; a value appears here only if the authentication method is 802.1x
Auth Method Authentication method that client is using to access the network: Open, WEP, MAC, 802.1x, PSK, none, or all authentications
Session Status Success or Authentication Failure
Action Action performed by the client at the time shown: Log in, Log out, Auth failure, and Age out
Device IP Name and IP address of the device reporting this client
Interface Slot, port, and interface (radio) reporting this client
Current Wireless Port Location
Wireless port current physical location
The software does not save the location that was recorded for the reporting period, but records the current location. (These locations rarely differ.)
EPICenter Reference Guide

Client Reports
Spoofed Wireless Client Report When the network detects two or more client stations with the same MAC address that are all in the data forwarding state on different wireless interfaces, the client might be using another client’s MAC address in an unauthorized way; such a client is known as a spoofing wireless client. The Spoofing Wireless Client Report displays information on these clients.
However, a client can also appear on two or more wireless interfaces at the same time because it is roaming and thus changing from one interface to another. To exclude these cases from the report, you can specify a wireless client time-out length (minimum connection time) to correspond to the client age-out setting on the switch.
To view a summary of clients in the data forwarding state on more than one wireless interface, click the Client Reports link in the left-hand panel, and then click the Spoofed Clients link. Figure 221 shows MAC addresses of wireless clients in the data forwarding state that are appearing on more than one interface for at least 10 seconds.
Figure 221: Spoofed Wireless Client Report
You can use the Wireless client time-out length (seconds) field to specify a minimum connection time, to exclude cases in which a roaming client might be changing from one interface to another. Normally, this time is the same as the client age-out setting on the switch.
This report displays the following information:
Client MAC MAC address of the client
User Name User name that the client is using to connect to interface; a value appears here only if the authentication method is 802.1x
Authentication Method Authentication method that client is using to access the network: Open, WEP, MAC, 802.1x, PSK, none, or all authentications
EPICenter Reference Guide 361

EPICenter Reports
362
Click on an entry in the Device column to open the Device Details report; see the “Device Details Report” on page 328. Click on an entry in the Interface column to open the Wireless Port Details report; Figure 222 shows an example of this report.
Figure 222: Wireless Port Details Report
This report shows the following information for the slot and port:
Encryption Method Encryption method used by this client: WEP64, WEP128, TKIP, AES, None, or unknown
Device Name and IP address of the device reporting this client
Interface Wireless interface reporting this client
WP Location Physical location of the wireless port
Product Name Name of the AP
Manufacturer Manufacturer of the AP
Serial Number Serial number of the AP
MAC Address MAC address of the AP
Country Code Country code, which determines country-dependent frequency and other regulatory settings on the wireless port, shared by all wireless ports on the switch
RF Modes Supported RF modes: one or more of 802.11a, 802.11b, 802.11g, or 802.11b/g
EPICenter Reference Guide
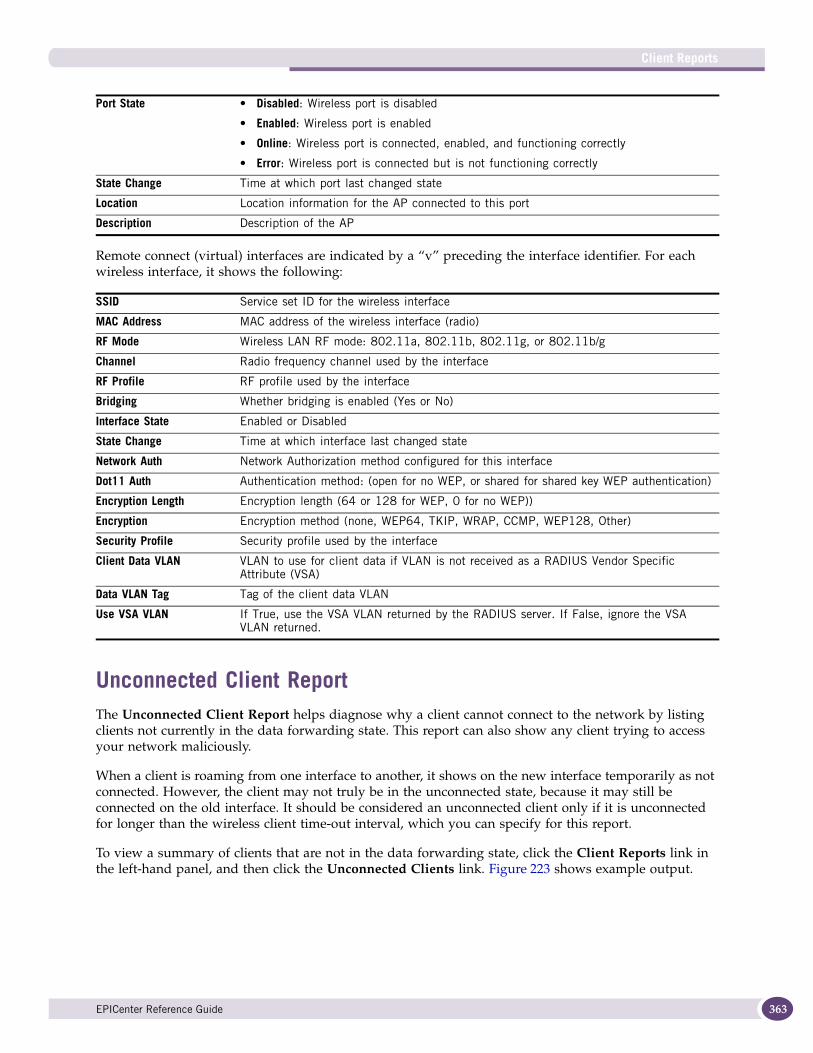
Client Reports
Remote connect (virtual) interfaces are indicated by a “v” preceding the interface identifier. For each wireless interface, it shows the following:
Unconnected Client Report The Unconnected Client Report helps diagnose why a client cannot connect to the network by listing clients not currently in the data forwarding state. This report can also show any client trying to access your network maliciously.
When a client is roaming from one interface to another, it shows on the new interface temporarily as not connected. However, the client may not truly be in the unconnected state, because it may still be connected on the old interface. It should be considered an unconnected client only if it is unconnected for longer than the wireless client time-out interval, which you can specify for this report.
To view a summary of clients that are not in the data forwarding state, click the Client Reports link in the left-hand panel, and then click the Unconnected Clients link. Figure 223 shows example output.
Port State • Disabled: Wireless port is disabled
• Enabled: Wireless port is enabled
• Online: Wireless port is connected, enabled, and functioning correctly
• Error: Wireless port is connected but is not functioning correctly
State Change Time at which port last changed state
Location Location information for the AP connected to this port
Description Description of the AP
SSID Service set ID for the wireless interface
MAC Address MAC address of the wireless interface (radio)
RF Mode Wireless LAN RF mode: 802.11a, 802.11b, 802.11g, or 802.11b/g
Channel Radio frequency channel used by the interface
RF Profile RF profile used by the interface
Bridging Whether bridging is enabled (Yes or No)
Interface State Enabled or Disabled
State Change Time at which interface last changed state
Network Auth Network Authorization method configured for this interface
Dot11 Auth Authentication method: (open for no WEP, or shared for shared key WEP authentication)
Encryption Length Encryption length (64 or 128 for WEP, 0 for no WEP))
Encryption Encryption method (none, WEP64, TKIP, WRAP, CCMP, WEP128, Other)
Security Profile Security profile used by the interface
Client Data VLAN VLAN to use for client data if VLAN is not received as a RADIUS Vendor Specific Attribute (VSA)
Data VLAN Tag Tag of the client data VLAN
Use VSA VLAN If True, use the VSA VLAN returned by the RADIUS server. If False, ignore the VSA VLAN returned.
EPICenter Reference Guide 363

EPICenter Reports
364
Figure 223: Unconnected Client Report
You can use the Wireless client time-out length (seconds) field to specify a minimum connection time, to exclude cases in which a roaming client might be changing from one interface to another. Normally, this time is the same as the client age-out setting on the switch.
This report displays the following information:
Client MAC MAC address of the client
Client State • Detected: The client is detected by the wireless interface, but has not yet been authenticated
• Authenticated: The client is authenticated on this wireless interface by the method shown in the Client Auth Method column
• Associated: The client is associated with the wireless interface, but cannot communicate with the network
• Data forwarding: The client can communicate with the network
Auth Method Authentication method that client is using to access the network: Open, WEP, MAC, 802.1x, PSK, none, or all authentications
Encrypt Method Encryption method used by this client: WEP64, WEP128, TKIP, AES, None, or unknown
Reporting Device Name and IP address of the device reporting the client.
Click the link in this cell to view the Device Details report for this client.
Reporting Interface Wireless interface (radio) reporting the client.
Click the link in this cell to display the Wireless Port Details Report for this interface.
WP Location Physical location of the wireless port reporting the unconnected client
RSS Client’s received signal strength in dBm (minidecibels)
Last State Change Date and time of this client’s last state change, expressed in the EPICenter server’s local time zone
EPICenter Reference Guide

MIB Poller Tools
MIB Poller ToolsThe MIB Poller Tools are advanced Administrator Tools you can use to collect history for MIB variables of interest, or to do a one-time “get” of specific MIB variables. The MIB Poller can be used to collect MIB variable data periodically. That data can later be exported to a text file that can be imported into programs like Microsoft Excel for historical trending analysis.
Users who do not have an Administrator role can view the MIB Collection Poller Summary, and can view detailed information about any MIB collections which have been implemented by an EPICenter Administrator. However, only users with an Administrator role can Start or Stop the Collection process, or can load an XML file to define a Collection.
The MIB Poller Tools are described in the chapter “Tuning and Debugging EPICenter” in the EPICenter Concepts and Solutions Guide.
EPICenter Server ReportsThis category includes both the Server State Summary report, which provides a large amount of information about the EPICenter server and its activity, and a set of administrator tools, available only to users with an Administrator role, that may be useful in analyzing EPICenter performance or activity questions.
If you do not have an Administrator role, the EPICenter debugging tools will not be available.
Server State Summary ReportThe Server State Summary Report displays statistics about configured servers, SNMP activity, thread and SNMP session pools, database activity, the ports used by the EPICenter server, and EPICenter licenses. Figure 224 shows an example.
EPICenter Reference Guide 365

EPICenter Reports
366
Figure 224: Server State Summary Report (top half)
The report presents information in multiple tables.
The first table in the report shows the status of the various EPICenter subsystems:
The second table shows statistics about the MAC/FDB Poller:
The third table in the report provides the number of operations that have occurred in the last minute, the last hour, and the last day (24 hours) for the following operations:
EPICenter Subsystem The name of the subsystem (TFTP Server, Internal Syslog Server, Internal RADIUS Server, MAC Poller)
Configuration Whether the subsystem is enabled or disabled
Current Status Whether the subsystem is running or stopped
Last Poll Completed The time at which the last complete polling cycle finished
Last Poll Duration The length of time it took to perform the last complete FDB polling cycle
Average Duration The average length of time it has taken to perform a complete FDB polling cycle
SNMP Queries Number of SNMP queries performed by the EPICenter server
Database Commits Number of database commits performed by the EPICenter server
Client Requests Number of data requests to the EPICenter server by all connected clients
Trap Requests Number of trap PDUs received by the EPICenter server
Syslog Messages Number of syslog messages received by the EPICenter server
EPICenter Reference Guide

EPICenter Server Reports
The fourth table in the report shows scalability statistics for the thread pool and the SNMP session pool:
The fifth table in the report shows the ports currently in use by the EPICenter server:
The last table shows the EPICenter licenses currently installed, along with their Access Keys (which can be used to obtain a license key from Extreme):
If you have administrator-level access to EPICenter, you can use EPICenter Administration to change the Web Server, Trap Receiver, RADIUS and Telnet ports used by EPICenter. See Chapter 15 “Administering EPICenter” for more information.
If you are running under Windows, you can use the Port Configuration Utility, accessible from the Programs menu, to change the database port. See Appendix B for details on the utility.
Thread Pool Statistics column
• Pool Size Thread pool size for the threads that are used to perform server operations (for example, reading data from a device or configuring the devices)
• Default Allocation Size Number of threads used to perform a single operation (for example, running an EPICenter script across a number of devices)
• Currently In Use Number of threads currently in use
• Maximum In Use at Once Maximum number of threads that are in use at one time
• Total # of Requests Total number of times a thread is requested to perform an operation in the server
• Total # of Wait For Thread Total number of times the server has to wait for a thread to become available
• Percentage Wait per Request
Percentage of total wait versus total request for threads
SNMP Session Pool Statistics column
• Pool Size Maximum number of allowed SNMP access sessions to the devices
• Default Allocation Size Not applicable
• Currently In Use Number of SNMP access sessions currently in use
• Maximum In Use at Once Not applicable
• Total # of Requests Total number of times an SNMP object is requested to perform an operation in the server
• Total # of Wait For Thread Total number of times the server has to wait for an SNMP object to become available
• Percentage Wait per Request
Percentage of total wait versus total number of requests for SNMP objects
Web Server Port currently used by the EPICenter web server
Trap Receiver Port currently used by the EPICenter server to receive traps
Radius Server Port currently used by the RADIUS server
Telnet Port currently used for Telnet
Database Port currently used for EPICenter database communication
License The type of license (EPICenter Base license, Gold Upgrade, or SSH)
Status Whether this license category is enabled or disabled.
Access Key The access key for the license (used to obtain a license key from Extreme).
See the EPICenter Release Notes or the EPICenter Installation and Upgrade Note for instructions on requesting and installing a license key.
EPICenter Reference Guide 367

EPICenter Reports
368
Debug EPICenterThese are not reports, but rather tools to allow a user with an Administrator role to set certain options for the purpose of analyzing EPICenter performance.
If you do not have an Administrator role, you will not see this link in the left-hand panel of the Reports feature.
The tools for debugging EPICenter are described in the chapter on “Tuning and Debugging EPICenter” in the EPICenter Concepts and Solutions Guide.
Adding a User-Defined Report to the Reports MenuTo add a new user-defined report to the report menu, simply place the HTML file into the <epicenter_install_dir>/user/reports/html/userdefined directory. The EPICenter server automatically creates a link on the Reports menu for files in the userdefined directory. It will use the report file names as the report names. They will appear below the heading User Defined Reports at the bottom of the left-hand panel of the Reports page.
The file names must conform to two restrictions:
• They must use .html as the extension. .htm is not supported.
• The file name may not contain spaces.
If you want to create a set of hierarchical reports, you can create a subdirectory under the userdefined directory to contain subordinate HTML files that should not have a direct link from the Reports menu.
If you put files into the userdefined directory that were originally in the <epicenter_install_dir>/user/reports/html directory, be sure you also copy the report stylesheet (reportstylesheet.css) into the userdefined directory.
Printing and Exporting EPICenter ReportsThis section explains how to print or export reports.
Printing ReportsUnlike the other EPICenter features, EPICenter reports can be printed with your browser’s print function. To print a report, place the cursor in the pane where the report is displayed, and use the browser’s Print button, or the Print command from the File menu, to initiate the print.
You can also use the show all link to print all data from a large .html page.
Exporting ReportsYou can export certain EPICenter reports to either .csv or .xml format. Exporting reports allows you to use various software applications to manipulate the data. The following reports can be exported:
EPICenter Reference Guide
Printing and Exporting EPICenter Reports
● Device Reports (Device Inventory)
● Card Report (Slot Inventory)
● EAPS Log Report
● Report on Device Ports (Interface Reports)
● Unused Ports
● Network Login Report
● Alarm Log
● Event Log Report
● Syslog Report
● Config Management Log Report
From the Reports Main page, you can generate a report to be used by Extreme Networks eSupport using by selecting the Device Group and clicking Export.
EPICenter Reference Guide 369

EPICenter Reports
370
EPICenter Reference Guide
17 EAPS Protocol Monitoring and Verification
This chapter describes how to use EPICenter for:
● Viewing table and map views of EAPS domain information
● Displaying detailed information about individual EAPS domains
● Verify the EAPS configurations in your network
● Running reports about the EAPS domains in your network
EAPS Monitoring OverviewThe Ethernet Automatic Protection Switching (EAPS) monitoring function in EPICenter provides a visual way to view the status of your EAPS configurations (EAPS domains) and to verify the configuration of your EAPS-enabled devices. With its multiple status displays and the ability to focus on individual EAPS domains, it can also help you debug EAPS problems on your network.
NOTE
Your devices must be running ExtremeWare 7.7 or later, or ExtremeXOS 11.3 or later in order to be recognized by EPICenter as EAPS nodes. ExtremeXOS 11.6 is required for full EAPS functionality within EPICenter.
Viewing EAPS InformationTo view information about your EAPS domains, select a device group or the All group in the Network Views folder, then click the EAPS tab. A table listing the EAPS domains in the group is displayed.
If you have also enabled the topology map view of a device group, you can select an EAPS domain in the table and display a graphical depiction of the EAPS domain, as shown in Figure 225. (A map view is not available for the All group).
EPICenter Reference Guide 371

EAPS Protocol Monitoring and Verification
372
Figure 225: EAPS Domain in a Network Topology Map
The EAPS domain table has the following columns. You can filter the contents of the table by expanding the Filter box, and entering text and search criteria.
Name The name of the EAPS domain, and an icon indicating the domain status
• A green ring indicates that all domains in which this device participates are fully operational.
• A yellow ring indicates that one or more of the domains is not fully operational, but is in a transitional state or an unknown state (as when the device is SNMP unreachable).
• A red ring indicates that one or more of the domains is not operational—if the device has a master in a failed state or a Transit node in a “links down” state.
Control VLAN Tag VLAN tag (ID) of the EAPS control VLAN
Last updated When the EAPS domain information was last updated from the EPICenter database.
EPICenter Reference Guide

Viewing EAPS Information
The EAPS Map ViewThe EAPS map view shows the devices in a device group with respect to their EAPS implementation, including the EAPS-related links between devices and a summary status for each device and for each EAPS ring. Figure 225 above shows an example of the EAPS map view for a device group.
NOTE
If some of the devices in an EAPS domain are missing from EPICenter’s inventory database, those devices will not appear in the EAPS map view, and the EAPS domain status may not correctly reflect the status of the entire domain Additionally, it may be difficult to troubleshoot domain operational problems that occur within nodes or links that are not shown on the map.
Therefore, it is strongly recommended that you add all the nodes in your EAPS configuration to your EPICenter inventory database.
EAPS domains are identified by their Control VLAN tags: all EAPS-enabled devices that share the same Control VLAN, as identified by the VLAN tag, are determined to be members of the same domain. Thus, if two independent EAPS domains in your network use the same Control VLAN tag, EPICenter will consider them to be a single EAPS domain.
EAPS Node Icons
EAPS status is shown on the map through icons displayed for each device node. Figure 226 shows the kinds of icons that can appear on an EAPS node.
Figure 226: Icons on an EAPS Node
An EAPS node on a map has the following icons:
● EAPS Node Status:
For an EAPS node the status display shows whether the device is a Master node (M) or Transit node (T) within the EAPS domain.
Note that if a node is unreachable, the EAPS node status will reflect the last known node status—thus a node that is unreachable may still display Master or Transit node status as green.
For a Master node:
● A Green M indicates the domain is complete (all links are up and forwarding).
● A Yellow M indicates the domain is in a transient or startup state, or in an unknown state (as when the device is SNMP unreachable).
● A Red M indicates the status is failed.
For a Transit node:
Node Alarm Status
EAPS Node Status
EAPS Domain Status
EPICenter Reference Guide 373
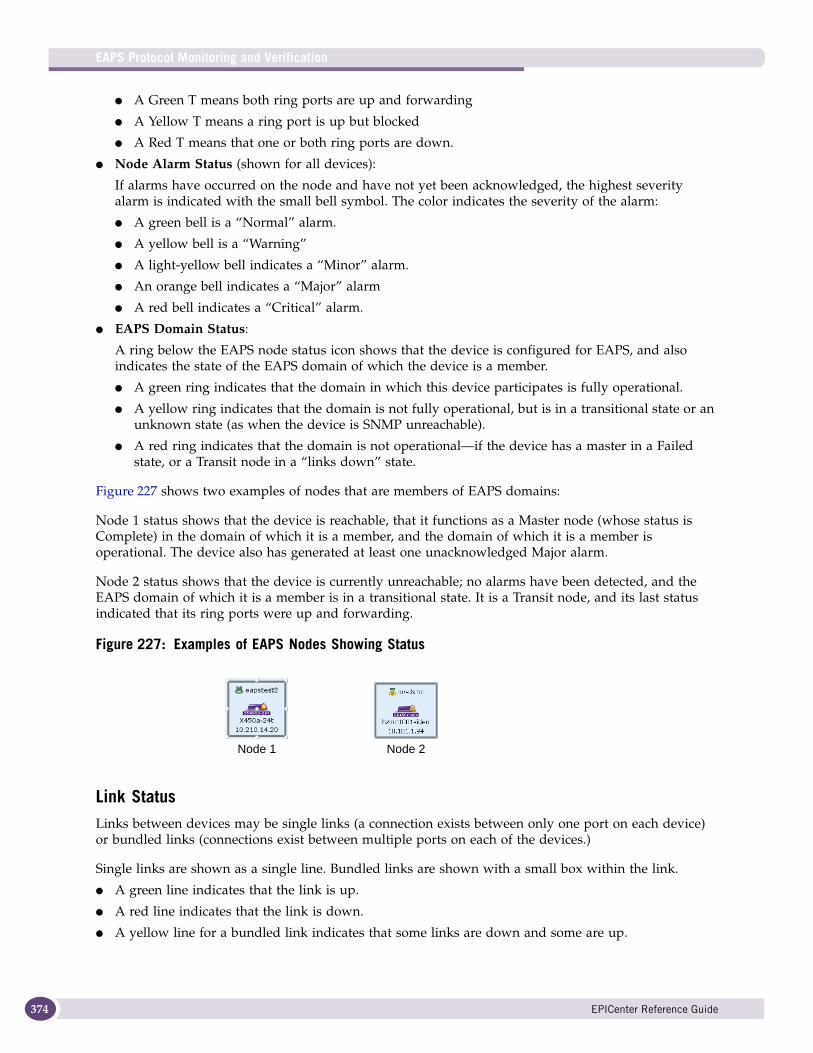
EAPS Protocol Monitoring and Verification
374
● A Green T means both ring ports are up and forwarding
● A Yellow T means a ring port is up but blocked
● A Red T means that one or both ring ports are down.
● Node Alarm Status (shown for all devices):
If alarms have occurred on the node and have not yet been acknowledged, the highest severity alarm is indicated with the small bell symbol. The color indicates the severity of the alarm:
● A green bell is a “Normal” alarm.
● A yellow bell is a “Warning”
● A light-yellow bell indicates a “Minor” alarm.
● An orange bell indicates a “Major” alarm
● A red bell indicates a “Critical” alarm.
● EAPS Domain Status:
A ring below the EAPS node status icon shows that the device is configured for EAPS, and also indicates the state of the EAPS domain of which the device is a member.
● A green ring indicates that the domain in which this device participates is fully operational.
● A yellow ring indicates that the domain is not fully operational, but is in a transitional state or an unknown state (as when the device is SNMP unreachable).
● A red ring indicates that the domain is not operational—if the device has a master in a Failed state, or a Transit node in a “links down” state.
Figure 227 shows two examples of nodes that are members of EAPS domains:
Node 1 status shows that the device is reachable, that it functions as a Master node (whose status is Complete) in the domain of which it is a member, and the domain of which it is a member is operational. The device also has generated at least one unacknowledged Major alarm.
Node 2 status shows that the device is currently unreachable; no alarms have been detected, and the EAPS domain of which it is a member is in a transitional state. It is a Transit node, and its last status indicated that its ring ports were up and forwarding.
Figure 227: Examples of EAPS Nodes Showing Status
Link StatusLinks between devices may be single links (a connection exists between only one port on each device) or bundled links (connections exist between multiple ports on each of the devices.)
Single links are shown as a single line. Bundled links are shown with a small box within the link.
● A green line indicates that the link is up.
● A red line indicates that the link is down.
● A yellow line for a bundled link indicates that some links are down and some are up.
Node 1 Node 2
EPICenter Reference Guide

Displaying EAPS Domain Details
● A grey line indicates that the link status is unknown.
● A blue line indicates the link is user-created rather than automatically discovered by EPICenter
When the map is zoomed in sufficiently, the port endpoints are automatically displayed for each link.
Displaying EAPS Domain DetailsTo display details about an EAPS domain, click on the domain’s row in the EAPS table. Information about the EAPS domain appears in the details window. If you double-click on the row, the EAPS domain details are displayed in a separate window, as shown in Figure 228.
Figure 228: EAPS Domain Details Window
Overview TabWhen you click the Overview tab, the following columns are displayed:
Name The name of the node given to the device as a member of a domain.
DNS name DNS Name of the device
Domain status Status of the node: Can be Idle, Complete, Failed, Links Up, Links Down, Preforwarding, Init, Precomplete, PreInit, or Unknown.
Device mode Whether the node acts as a Master or Transit node for this domain.
EPICenter Reference Guide 375

EAPS Protocol Monitoring and Verification
376
The lower part of the window in the Overview tab has two additional tabs: Details of device in domain and Protected VLANs.
Details of Device in Domain TabWhen you click the Details of device in domain tab, the following columns are displayed:
Protected VLANs TabWhen you click the Protected VLANs tab, the following columns are displayed:
Common Links TabWhen you click the Common Links tab, the following columns are displayed:
Primary port Primary port number
Secondary port Secondary port number
Device enabled Whether this node is enabled as an EAPS node.
Fast convergence Whether the device is enabled for fast convergence
Domain Node Name The name of the node given to the device as a member of a domain.
Enabled Whether this specific node is enabled as an EAPS node.
Control VLAN Name Name of the control VLAN
Control VLAN Tag VLAN tag (ID) of the EAPS control VLAN
Hello Timer The interval at which the EAPS master polls to check the status of its EAPS member nodes
Failed Timer The interval after a failure is detected before the Failed Timer expires
Failed Timer Action Action to be taken when Failed Timer expires
Primary Port Status Status of the primary port: Up, Down, Blocked, or Unknown
Secondary Port Status Status of the secondary port: Up, Down, Blocked, or Unknown
VLAN name The name of the protected VLAN
Tag The ID of the protected VLAN
EPICenter Reference Guide

Displaying EAPS Domain Details
The lower part of the window in the Common Links tab has an additional section: Shared ports.
Status An icon indicating the status of the link. The link status icon can be one of the following colors:
Up
Last known up
Down
Last known down
At least one of the links in a shared link is down
Last known at least one of the links in a shared link is down
User-created link
Last known user-created link
Unknown
A device The name of the device on one end (the A side) of the link, along with an icon indicating the device status.
A IP address The IP address of the device on the A side of the link.
A port name The name of the port on the A side of the link, along with an icon indicating the port status.
A port number The number of the port on the A side of the link.
B device The name of the device on the other end (the B side) of the link, along with an icon indicating the device status.
B IP address The IP address of the device on the B side of the link
B port name The name of the port on the B side of the link, along with an icon indicating the port status.
B port number The number of the port on the B side of the link.
Discovery protocol The protocol used to discover the link, either EDP or LLDP.
State The current state of the link
Type The link type; for example, user-created.
A device status The current status of the device on the A side of the link.
A device worst alarm The status of the highest alarm on the device on the A side of the link.
A port status Whether the port on the A side of the link is enabled or disabled.
A link state Whether the A side of the link is ready to exchange traffic with the B side of the link.
A port type The type of port on the A side of the link.
A port share details Information about the port sharing configuration on the A side of the link, if configured.
B device status The current status of the device on the B side of the link.
B device worst alarm The status of the highest alarm on the device on the B side of the link.
B port status Whether the port on the B side of the link is enabled or disabled.
B link state Whether the B side of the link is ready to exchange traffic with the A side of the link.
B port type The type of port on the B side of the link.
B port share details Information about the port sharing configuration on the B side of the link, if configured.
EPICenter Reference Guide 377

EAPS Protocol Monitoring and Verification
378
Shared Ports The Shared Ports section displays detailed information about the shared ports that belong to a selected common link. For the shared ports on either device, the following information is displayed:
Displaying EAPS Details for a Selected DeviceSee “Displaying Device Details” on page 30 for information about displaying EAPS information for an individual device.
Verifying EAPS InformationEPICenter lets you verify the EAPS configurations in your network, and provides a report that shows where configuration errors are found.
To run the verification procedure on your EAPS domains, select Verify EAPS domains from the Protocol menu. Depending on the size of your network and your EAPS configurations, this can take as long as 15 minutes.
The results of the verification are shown in the EAPS Verification Results window.
Shared-port link id An integer configured on the switch for the shared port
Shared-port mode Whether the node acts as a Controller or a Partner node for this shared link.
Shared-port status Status of the shared port: Idle, Ready, Blocking, Preforwarding.
Expiry action Action to be taken when the Shared Port fail timer expires.
Neighbor-port status Status of the neighboring node: Down, Up, Error
Number The port number of the shared port.
Root-blocker status The port’s status as a root blocker (None or Active)
Root-blocker id The ID of the root blocker. If the value is none, there are fewer than two common link failures.
EPICenter Reference Guide

Verifying EAPS Information
Figure 229: EAPS Verification Results Window
The information shown in this window is as follows:
If errors are reported, you can log into the affected device(s) to correct the problems. Once you have corrected any reported errors, you should run the verification again to ensure that the configuration is correct.
● Click the Refresh button to re-run the verification process.
● Click Save results... to save the verification results to a file.
The following table lists the error types that may be reported by the EAPS verification process:
Type The type of error. See Table 30 for a list of errors that the EAPS verification process may report.
Severity The severity level of the error: Error, Warning, or Information
Source The element that was the source of the error.
Description An more detailed description of the error.
Table 30: EAPS Verification Error Types
• No Master Node • Inconsistent EAPS Node Naming • No Physical Link
• Multiple Master Nodes • Control VLAN not in QP3 • Domain List Mismatch
• Disabled EAPS Node • Unprotected Shared Link • Link ID Not Configured
• Missing Control VLAN • Duplicate Link ID • Control VLAN Misconfigured
• Missing Primary Domain Port • Missing Link ID • Protected VLAN Misconfigured
• Missing Secondary Domain Port
• Mismatched Link ID • Shared Port Misconfigured
• Mismatched Domain Ports • Misconfigured Shared Port Mode • Controller Misconfigured
• Incomplete VLAN Protection • Shared Port Not Created
EPICenter Reference Guide 379

EAPS Protocol Monitoring and Verification
380
Running EAPS ReportsYou can run the following reports to produce information about the EAPS domains known to EPICenter:
● EAPS Summary Report, which provides a brief overview of the status of the EAPS domains
● EAPS log report, which shows the EAPS traps and EAPS-related syslog entries that have occurred for a specified device.
EAPS Summary ReportThe EAPS Summary Report provides a brief overview of the status of the EAPS domains known to EPICenter.
To run the EAPS Summary Report, select EAPS summary report from the Protocol menu.
The report shows:
● The total number of EAPS domains known to EPICenter
● The number of Domains currently in an error state
● The number of domain failures that have occurred in the last 24 hours.
Figure 230: The EAPS Summary Report
• Inconsistent Control VLAN Naming
• Shared Port Not Configured
Table 30: EAPS Verification Error Types (continued)
EPICenter Reference Guide
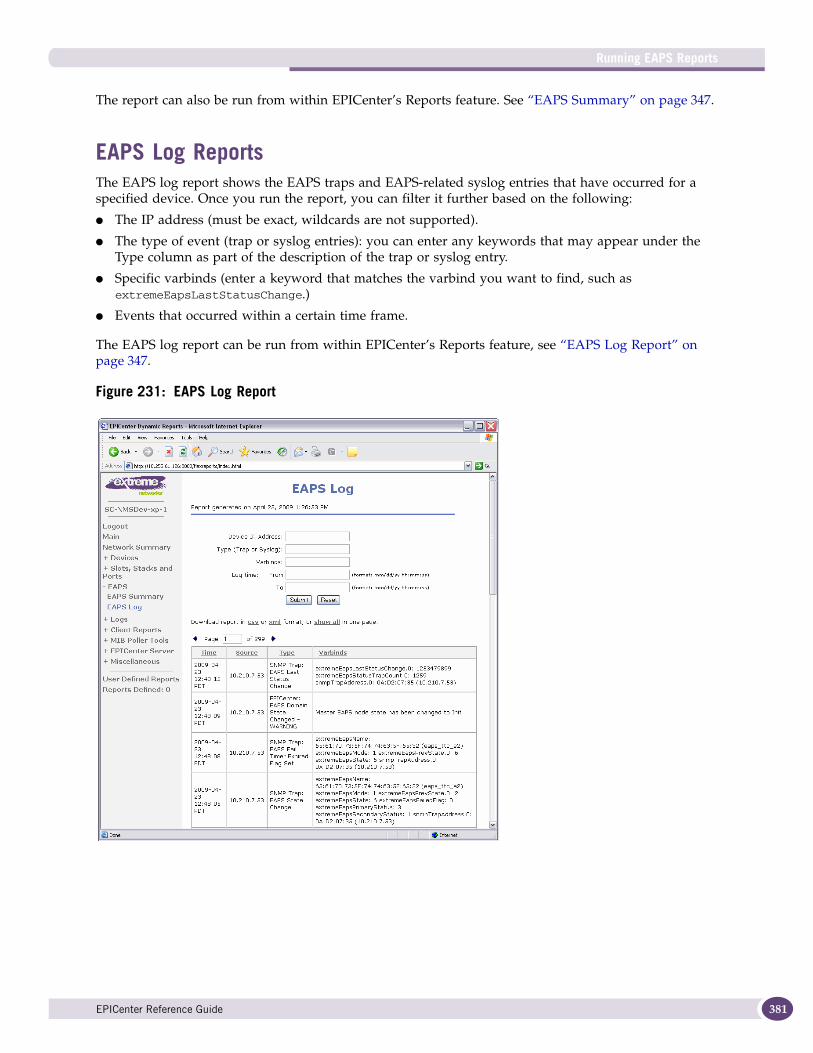
Running EAPS Reports
The report can also be run from within EPICenter’s Reports feature. See “EAPS Summary” on page 347.
EAPS Log ReportsThe EAPS log report shows the EAPS traps and EAPS-related syslog entries that have occurred for a specified device. Once you run the report, you can filter it further based on the following:
● The IP address (must be exact, wildcards are not supported).
● The type of event (trap or syslog entries): you can enter any keywords that may appear under the Type column as part of the description of the trap or syslog entry.
● Specific varbinds (enter a keyword that matches the varbind you want to find, such as extremeEapsLastStatusChange.)
● Events that occurred within a certain time frame.
The EAPS log report can be run from within EPICenter’s Reports feature, see “EAPS Log Report” on page 347.
Figure 231: EAPS Log Report
EPICenter Reference Guide 381

EAPS Protocol Monitoring and Verification
382
The EAPS Log report displays the following information:
Time Time the event occurred, expressed in the local time zone of the EPICenter server.
Source IP address of the device and port number (if applicable) that generated the event
Type Event type (SNMP trap or syslog, including description)
Varbinds Variable data transmitted with a trap, as appropriate
EPICenter Reference Guide

A Event Types for Alarms
This appendix describes the events that can be detected through the EPICenter Alarm System:
● SNMP Trap Events on page 383
● Configuring SNMP Trap Events on page 390
● RMON Rising and Falling Trap Events on page 391
● EPICenter Events on page 392
Many of the events defined below are standard traps applicable to all MIB-2 devices managed by the EPICenter server. Extreme Networks proprietary traps are identified as such. For Extreme Networks devices, the level of support in ExtremeWare and ExtremeXOS is also indicated.
SNMP Trap Events
Table 31: SNMP Trap Events
Event Definition
ExtremeWare/ ExtremeXOS Version
Authentication Failed This trap indicates that a SNMP request with an invalid community string is issued to the device.
ExtremeWare All/ExtremeXOS 11.2
BGP Backward Transition
This event is generated when the BGP FSM moves from a higher numbered state to a lower numbered state.
ExtremeWare 6.1.5 Not supported in EXOS
BGP Established This event is generated when the BGP FSM enters the ESTABLISHED state.
ExtremeWare 6.1.5 Not supported in EXOS
BGP M2 Max Exceeded
Extreme Networks proprietary trap. Indicates that the number of prefixes received over this peer session has reached the maximum configured limit. (BGP4-V2)
EXOS 10.1
BGP M2 Threshold Reached
Extreme Networks proprietary trap. Indicates that the number of prefixes received over this peer session has reached the threshold limit. (BGP4-V2)
EXOS 10.1
BGP Prefix Max Exceeded
Extreme Networks proprietary trap. Indicates that the number of prefixes received over this peer session has reached the maximum configured limit.
ExtremeWare 6.2.2 Not supported in EXOS
BGP Prefix Reached Threshold
Extreme Networks proprietary trap. Indicates that the number of prefixes received over this peer session has reached the threshold limit.
ExtremeWare 6.2.2 Not supported in EXOS
CPU Health Check Failed
Extreme Networks proprietary trap. Indicates that the CPU Health Check has failed.
CPU Utilization Falling Threshold
Extreme Networks proprietary trap. CPU Utilization Falling Trap is generated when the extremeCpuAggregateUtilization falls below 80% of the extremeCpuUtilRisingThreshold.
ExtremeWare 6.2 Not supported in EXOS
CPU Utilization Rising Threshold
Extreme Networks proprietary trap. CPU Utilizations Rising trap is generated when the value of extremeCpuAggregateUtilization touches/crosses extremeCpuUtilRisingThreshold.
ExtremeWare 6.2 Not supported in EXOS
EPICenter Reference Guide 383

Event Types for Alarms
384
Cold Start This trap indicates that the device is rebooted by power recycling. Extreme switches always send out this trap after a reboot. <
ExtremeWare All/ Not supported in ExtremeXOS
DOS Threshold Cleared Extreme Networks proprietary trap. Generated with the DOS threshold is cleared.
ExtremeWare 7.3Not supported in ExtremeXOS
DOS Threshold Reached
Extreme Networks proprietary trap. Generated when the DOS threshold is crossed for any of the ports.
ExtremeWare 7.3Not supported in ExtremeXOS
Dsx1 Line Status Change
Extreme Networks proprietary trap. Indicates that the DS1 line status change for the specified interface has been detected.
ExtremeWare 6.1.8b66/Not supported in ExtremeXOS
Dsx1 Loss of Master Clock
Extreme Networks proprietary trap. Indicates that the wanDsx1LossOfMasterClock event for the specified interface has been detected.
ExtremeWare 6.1.8b66Not supported in ExtremeXOS
Dsx1 No Loss of Master Clock
Extreme Networks proprietary trap. Indicates that the wanDsx1NoLossOfMasterClock event for the specified interface has been detected.
ExtremeWare 6.1.8b66Not supported in ExtremeXOS
Dsx3 Line Status Change
Extreme Networks proprietary trap. Indicates that the T3 line status change for the specified interface has been detected.
ExtremeWare 6.1.8b66Not supported in ExtremeXOS
Dsx3 Loss of Master Clock
Extreme Networks proprietary trap. Indicates that the wanDsx3LossOfMasterClock event for the specified interface has been detected.
ExtremeWare 6.1.8b66Not supported in ExtremeXOS
Dsx3 No Loss of Master Clock
Extreme Networks proprietary trap. Indicates that the wanDsx3NoLossOfMasterClock event for the specified interface has been detected.
ExtremeWare 6.1.8b66Not supported in ExtremeXOS
EAPS Configuration change
Extreme Networks proprietary trap. Indicates that a change to the EAPS configuration has been detected.
ExtremeXOS
EAPS Last status change
Extreme Networks proprietary trap. Indicates that the last EAPS update included a status change.
ExtremeXOS
EAPS Primary or secondary port status change
Extreme Networks proprietary trap. Indicates that the status of the primary or secondary ring port in an EAPS domain has changed.
ExtremeXOS
EAPS Root blocker status change
Extreme Networks proprietary trap. Indicates that the EAPS root blocker state has changed.
ExtremeXOS
EAPS Fail Timer Expired Flag Cleared
Extreme Networks proprietary trap. Generated when the EAPS domain’s fail timer is cleared.
ExtremeXOS 10.1
EAPS Fail Timer Expired Flag Set
Extreme Networks proprietary trap. Generated when the EAPS domain’s fail timer expires for the first time, while its state is NOT the failed state.
ExtremeXOS 10.1
EAPS Link Down Ring Complete
Extreme Networks proprietary trap. Indicates that a transit that is in a Link Down state has received a Health-Check-Pdu from the Master indicating that the link is complete. This indicates a problem with the transit switch that has issued this trap.
ExtremeXOS 10.1
Table 31: SNMP Trap Events (continued)
Event Definition
ExtremeWare/ ExtremeXOS Version
EPICenter Reference Guide

SNMP Trap Events
EAPS State Change Extreme Networks proprietary trap. Generated when an EAPS domain has a state change.
ExtremeXOS 10.1
EDP Neighbor Added Extreme Networks proprietary trap. A new neighbor has been discovered through the Extreme Discovery Protocol (EDP).
ExtremeWare 6.1ExtremeXOS 10.1
EDP Neighbor Removed
Extreme Networks proprietary trap. No EDP updates have been received from this neighbor within the configured time-out period, and this neighbor entry has been aged out by the device.
ExtremeWare 6.1ExtremeXOS 10.1
EGPNbrLoss An EGP neighbor, for which the device is an EGP peer, is down and the peer relationship no longer exists. An Extreme Networks switch never sends out this trap.
None
ELRP VLAN Loop Detected
Extreme Networks proprietary trap. Generated when the ELRP client detects a loop in the VLAN.
ExtremeWare 7.3Not supported in ExtremeXOS
ESRP Master Re-election After MSM Failover
Extreme Networks proprietary trap. Indicates this device was elected master when the previous master node failed to resume normal operation within the reelect timeout after performing a hitless MSM failover.
Not supported in ExtremeXOS
ESRP State Change Extreme Networks proprietary trap. Indicates that the ESRP state (master or slave) of a VLAN has changed on the device.
ExtremeWare 6.0 Not supported in ExtremeXOS
ESRP State Change for ExtremeXOS
Extreme Networks proprietary trap. Indicates that the ESRP state (master or slave) of a VLAN has changed on the device.
ExtremeXOS
Enhanced DOS Threshold Cleared
Extreme Networks proprietary trap. Generated when the DOS threshold is cleared (if enhanced DOS protection is enabled).
ExtremeWare 7.3Not supported in ExtremeXOS
Enhanced DOS Threshold Reached
Extreme Networks proprietary trap. Generated when the DOS threshold is crossed for any of the ports (if enhanced DOS protection is enabled).
ExtremeWare 7.3Not supported in ExtremeXOS
Entity MIB Changed Indicates a change has been made to a row in a table in the Entity MIB (a row has been added, deleted, or modified).
ExtremeWare 7.3
Extreme SentriantAG alarm
Extreme Networks proprietary trap. Indicates that a SentriantAG Network Access Control (NAC) device generated an alarm.
ExtremeXOS
Extreme SentriantNG alarm
Extreme Networks proprietary trap. Indicates that a SentriantNG network security device generated an alarm.
ExtremeXOS
Fan Failed Extreme Networks proprietary trap. This trap indicates one or more of the cooling fans inside the device has failed. A fan OK trap will be sent once the fan has attained normal operation. This trap is sent repetitively every 30 seconds until all the fans are back to normal condition.
All
Fan OK Extreme Networks proprietary trap. This trap indicates that a fan has transitioned out of a failure state and is now operating correctly.
All
Health Check Failed Extreme Networks proprietary trap. The CPU HealthCheck has failed.
ExtremeWare 6.1.9 ExtremeXOS 10.1
Invalid Login Extreme Networks proprietary trap. This trap indicates that a user attempted to login to console or by Telnet but was refused access due to incorrect user name or password. The trap is issued after three consecutive failure of log in.
All
Table 31: SNMP Trap Events (continued)
Event Definition
ExtremeWare/ ExtremeXOS Version
EPICenter Reference Guide 385

Event Types for Alarms
386
Link Down Indicates that a link is transitioning to the down state from a previous active state.
All
Link Up Indicates that a port is transitioning from the down state to another (active) state.
All
MAC Address Detected On Locked Port
Extreme Networks proprietary trap. Generated on a port for which lock-learning has been configured, when a new MAC address is learned on that port.
ExtremeWare 7.0 SR1Not supported in ExtremeXOS
MAC Address Detected On Unauthorized Port
Extreme Networks proprietary trap. Generated when a MAC address is learned on a port on which it is not authorized. This happens when the MAC address is statically configured as a 'secure mac' on some other port(s).
ExtremeWare 7.0 SR1Not supported in ExtremeXOS
MAC Address Learning Limit Exceeded
Extreme Networks proprietary trap. Generated when a new MAC address exceeding the limit is learned on a port on which limit-learning has been configured.
ExtremeWare 7.0 SR1Not supported in ExtremeXOS
MSM Failover Occurred Extreme Networks proprietary trap. An MSM Failover occurred. ExtremeXOS 10.1
Main Power Usage Off Indicates the PSE Threshold usage indication off, the usage power is below the threshold. At least 500 msec must elapse between notifications being emitted by the same object instance.
ExtremeXOS 11.1
Main Power Usage On Indicates the PSE threshold usage indication is on, and the usage power is above the threshold. At least 500 msec must elapse between notifications being emitted by the same object instance.
ExtremeXOS 11.1
Netlogin Authentication Failure
Extreme Networks proprietary trap. Generated upon authentication failure for a netlogin supplicant.
Not supported in ExtremeXOS
Netlogin User Login Extreme Networks proprietary trap. Generated when a netlogin supplicant passes authentication and logs in successfully into the network.
Not supported in ExtremeXOS
Netlogin User Logout Extreme Networks proprietary trap. Generated when an authenticated and logged in netlogin supplicant logs out.
Not supported in ExtremeXOS
OSPF Interface Authentication Failure
An ospfIfAuthFailure trap signifies that a packet has been received on a non-virtual interface from a router whose authentication key or authentication type conflicts with this router’s authentication key or authentication type.
ExtremeWare 6.1.9 ExtremeXOS 10.1
OSPF Interface Config Error
An ospfIfConfigError trap signifies that a packet has been received on a non-virtual interface from a router whose configuration parameters conflict with this router’s configuration parameters. Note that the event optionMismatch should cause a trap only if it prevents an adjacency from forming.
ExtremeWare 6.1.9 ExtremeXOS 10.1
OSPF Interface Receive Bad Packet
An ospfIfRxBadPacket trap signifies that an OSPF packet has been received on a non-virtual interface that cannot be parsed.
ExtremeWare 6.1.9 ExtremeXOS 10.1
OSPF Interface State Change
An ospfIfStateChange trap signifies that there has been a change in the state of a non-virtual OSPF interface. This trap should be generated when the interface state regresses (e.g., goes from Dr to Down) or progresses to a terminal state (i.e., Point-to-Point, DR Other, Dr, or Backup).
ExtremeWare 6.1.9 ExtremeXOS 10.1
OSPF LSDB Approaching Overflow
An ospfLsdbApproachingOverflow trap signifies that the number of LSAs in the router’s link-state database has exceeded ninety percent of ospfExtLsdbLimit.
ExtremeWare 6.1.9 ExtremeXOS 10.1
Table 31: SNMP Trap Events (continued)
Event Definition
ExtremeWare/ ExtremeXOS Version
EPICenter Reference Guide

SNMP Trap Events
OSPF LSDB Overflow An ospfLsdbOverflow trap signifies that the number of LSAs in the router’s link-state database has exceeded ospfExtLsdbLimit.
ExtremeWare 6.1.9 ExtremeXOS 10.1
OSPF Max_Age LSA An ospfMaxAgeLsa trap signifies that one of the LSA in the router’s link-state database has aged to MaxAge.
ExtremeWare 6.1.9 ExtremeXOS 10.1
OSPF Neighbor State Change
An ospfNbrStateChange trap signifies that there has been a change in the state of a non- virtual OSPF neighbor. This trap should be generated when the neighbor state regresses (e.g., goes from Attempt or Full to 1-Way or Down) or progresses to a terminal state (e.g., 2-Way or Full). When an neighbor transitions from or to Full on non-broadcast multi-access and broadcast networks, the trap should be generated by the designated router. A designated router transitioned to Down will be noted by ospfIfStateChange.
ExtremeWare 6.1.9 ExtremeXOS 10.1
OSPF Originate LSA An ospfOriginateLsa trap signifies that a new LSA has been originated by this router. This trap should not be invoked for simple refreshes of LSAs (which happens every 30 minutes), but instead will only be invoked when an LSA is (re)originated due to a topology change. Additionally, this trap does not include LSAs that are being flushed because they have reached MaxAge.
ExtremeWare 6.1.9 ExtremeXOS 10.1
OSPF TX_Retransmit An ospfTxRetransmit trap signifies than an OSPF packet has been retransmitted on a non- virtual interface. All packets that may be retransmitted are associated with an LSDB entry. The LS type, LS ID, and Router ID are used to identify the LSDB entry.
ExtremeWare 6.1.9 ExtremeXOS 10.1
OSPF Virtual Interface Authentication Failure
An ospfVirtIfAuthFailure trap signifies that a packet has been received on a virtual interface from a router whose authentication key or authentication type conflicts with this router’s authentication key or authentication type.
ExtremeWare 6.1.9 ExtremeXOS 10.1
OSPF Virtual Interface Config Error
An ospfVirtIfConfigError trap signifies that a packet has been received on a virtual interface from a router whose configuration parameters conflict with this router’s configuration parameters. Note that the event optionMismatch should cause a trap only if it prevents an adjacency from forming.
ExtremeWare 6.1.9 ExtremeXOS 10.1
OSPF Virtual Interface Receive Bad Packet
An ospfVirtIfRxBadPacket trap signifies that an OSPF packet has been received on a virtual interface that cannot be parsed.
ExtremeWare 6.1.9 ExtremeXOS 10.1
OSPF Virtual Interface State Change
An ospfVirtIfStateChange trap signifies that there has been a change in the state of an OSPF virtual interface. This trap should be generated when the interface state regresses (e.g., goes from Point- to-Point to Down) or progresses to a terminal state (i.e., Point-to-Point).
ExtremeWare 6.1.9 ExtremeXOS 10.1
OSPF Virtual Interface TX Retransmit
An ospfVirtIfTxRetransmit trap signifies than an OSPF packet has been retransmitted on a virtual interface. All packets that may be retransmitted are associated with an LSDB entry. The LS type, LS ID, and Router ID are used to identify the LSDB entry.
ExtremeWare 6.1.9 ExtremeXOS 10.1
OSPF Virtual Neighbor State Change
An ospfVirtNbrStateChange trap signifies that there has been a change in the state of an OSPF virtual neighbor. This trap should be generated when the neighbor state regresses (e.g., goes from Attempt or Full to 1-Way or Down) or progresses to a terminal state (e.g., Full).
ExtremeWare 6.1.9 ExtremeXOS 10.1
Table 31: SNMP Trap Events (continued)
Event Definition
ExtremeWare/ ExtremeXOS Version
EPICenter Reference Guide 387

Event Types for Alarms
388
Overheat Extreme Networks proprietary trap. Indicates the on board temperature sensor has reported an overheat condition. This indicates the temperature has reached the Overheat threshold. The switch will continue to function until it reaches its shutdown threshold. The system will then shutdown until the unit has sufficiently cooled such that operation may begin again. A cold start trap will be issued when the unit has come back on line. This trap is sent repetitively every 30 seconds until the temperature goes back to normal.
All
Ping Probe Failed Generated when a probe failure is detected when the corresponding pingCtlTrapGeneration object is set to probeFailure(0) subject to the value of pingCtlTrapProbeFailureFilter. The object pingCtlTrapProbeFailureFilter can be used to specify the number of successive probe failures that are required before this notification can be generated.
ExtremeWare 6.1.9 Not supported in ExtremeXOS
Ping Test Completed Generated at the completion of a ping test when the corresponding pingCtlTrapGeneration object is set to testCompletion(4).
ExtremeWare 6.1.9 Not supported in ExtremeXOS
Ping Test Failed Generated when a ping test is determined to have failed when the corresponding pingCtlTrapGeneration object is set to testFailure(1). In this instance pingCtlTrapTestFailureFilter should specify the number of probes in a test required to have failed in order to consider the test as failed.
ExtremeWare 6.1.9 Not supported in ExtremeXOS
PoE PSU Status Changed
Extreme Networks proprietary trap. Indicates a change in the PoE PSU for the slot.
Not supported in ExtremeXOS
Port Diagnostics Extreme Networks proprietary trap. Indicates the status of Diagnostics for a port. The status indicates whether Diagnostics for a particular port failed.
ExtremeWare 7.3 Not supported in ExtremeXOS
Power Supply Failed Extreme Networks proprietary trap. This trap indicates that one or more sources of power have failed. Presumably a redundant power-supply has taken over. This trap is sent repetitively every 30 seconds until all the power supplies are back to normal condition.
All
Power Supply OK Extreme Networks proprietary trap. This trap indicates that one or more previously bad sources of power have come back to life without causing the device to restart.
All
Processor State Change Trap
Extreme Networks proprietary trap. This trap indicated a failed processor on a module is detected.
Pse Port On/Off Indicates a change in the power delivery status of the PSE port (whether the port is delivering power or not. This notification should be sent on every status change except in the searching mode. At least 500 msec must elapse between notifications emitted by the same object instance.
ExtremeXOS 11.1
Redundant Power Supply Failed
Extreme Networks proprietary trap. This trap indicates that the attached redundant power supply device is indicating an alarm condition. This trap is sent repetitively every 30 seconds until the redundant power supply is back to normal condition.
ExtremeWare All/Not supported in EXOS
Redundant Power Supply OK
Extreme Networks proprietary trap. This trap indicates that the attached redundant power supply device is no longer indicating an alarm condition.
ExtremeWare All/Not supported in EXOS
Table 31: SNMP Trap Events (continued)
Event Definition
ExtremeWare/ ExtremeXOS Version
EPICenter Reference Guide

SNMP Trap Events
SLB Unit Added Extreme Networks proprietary trap. Indicates that the server load balancer has activated a group of virtual servers that it normally would not activate. This may be due to the failure of another server load balancer.
ExtremeWare 6.1Not supported in EXOS
SLB Unit Removed Extreme Networks proprietary trap. Indicates that the server load balancer has deactivated a group of virtual servers that it normally has active. This indicates that something is wrong in the server load balancer; for example, its ping check may be failing.
ExtremeWare 6.1Not supported in EXOS
STP New Root Extreme Networks proprietary trap. Indicates that the sending agent has become the new root of the Spanning Tree; the trap is sent by a bridge soon after its election as the new root, e.g., upon expiration of the Topology Change Timer immediately subsequent to its election.
ExtremeWare 6.2.2ExtremeXOS 10.1
STP Topology Change Extreme Networks proprietary trap. A topologyChange trap is sent by a bridge when any of its configured ports transitions from the Learning state to the Forwarding state, or from the Forwarding state to the Blocking state. The trap is not sent if a newRoot trap is sent for the same transition.
ExtremeWare 6.2.2 ExtremeXOS 10.1
Slot Change Extreme Networks proprietary trap. This trap indicates that the value of the extremeSlotModuleState for the specified extremeSlotNumber has changed.
ExtremeWare All/ExtremeXOS 11.1
Smarttrap Extreme Networks proprietary trap. This trap indicates that the value of one of the object identifiers (or the value of an object below that in the MIB tree) defined in the extremeSmartTrapRulesTable has changed, and hence a new entry has been created in the extremeSmartTrapInstanceTable. Such a trap is sent at most once every thirty seconds if one or more entry was created in the last thirty seconds.
All
Stack Member Overheat
Extreme Networks proprietary trap. Indicates the on board temperature sensor for a stacking member has reported an overheat condition. This indicates the temperature has reached the Overheat threshold.
ExtremeWare 7.4ExtremeXOS
Stack Member Status Changed
Extreme Networks proprietary trap. Generated when the operational status of the stacking member changes.
ExtremeWare 7.4ExtremeXOS
Stacking Port Status Changed
Extreme Networks proprietary trap. Generated when the operational status of the stacking port changes.
ExtremeWare 7.4 ExtremeXOS
SummitWM Altitude Tunnel Alarm
Extreme Networks proprietary trap. Indicates that an alarm was generated based on the state of the tunnel connection between a SummitWM device and an Altitude AP.
ExtremeXOS
SummitWM Log Change
Extreme Networks proprietary trap. Indicates that the log file on a SummitWM device has changed.
ExtremeXOS
UPM Profile Execution Extreme Networks proprietary trap. Generated when a UPM profile is executed on an Extreme Networks device.
ExtremeXOS
Warm Start Trap indicates that the device has been rebooted without power recycling. An Extreme switch never sends out this trap.
All
Wireless AP Added Extreme Networks proprietary trap. Generated when a new AP is added to the scan results table. Generated only if the value of extremeWirelessScanSendAPAddedTrap is true.
ExtremeWare 7.3Not supported in ExtremeXOS
Table 31: SNMP Trap Events (continued)
Event Definition
ExtremeWare/ ExtremeXOS Version
EPICenter Reference Guide 389

Event Types for Alarms
390
Configuring SNMP Trap EventsThere are a number of SNMP events that require configuration on the switch before they can be used in EPICenter alarm definitions. If the configuration is not done on the switch, no trap events are generated, and no EPICenter alarms for those events can occur. The Ping and OSPF traps fall into this category.
Wireless AP Removed Extreme Networks proprietary trap. Generated when an AP is removed from the scan results table. Generated only if the value of extremeWirelessScanSendAPRemovededTrap is true.
ExtremeWare 7.3Not supported in ExtremeXOS
Wireless AP Updated Extreme Networks proprietary trap. Generated when the IEs recorded for an AP in the scan results table change. Generated only if the value of extremeWirelessScanSendAPUpdatedTrap is true.
ExtremeWare 7.3Not supported in ExtremeXOS
Wireless Client Netlogin Client Associated
Extreme Networks proprietary trap. Generated when a client associates to an interface that is web based network login enabled.
ExtremeWare 7.3Not supported in ExtremeXOS
Wireless Client Station Aged Out
Extreme Networks proprietary trap. Generated when a client is aged out of the table.
ExtremeWare 7.3Not supported in ExtremeXOS
Wireless Counter Measure Started
Extreme Networks proprietary trap. Generated when counter measures are started on a wireless interface.
ExtremeWare 7.3Not supported in ExtremeXOS
Wireless Counter Measure Stopped
Extreme Networks proprietary trap. Generated when counter measures are stopped on a wireless interface.
ExtremeWare 7.3Not supported in ExtremeXOS
Wireless Off Channel Scan Finished
Extreme Networks proprietary trap. Generated when an off-channel scan finishes running.
ExtremeWare 7.3Not supported in ExtremeXOS
Wireless Off Channel Scan Started
Extreme Networks proprietary trap. Generated when an off-channel scan starts running.
ExtremeWare 7.3Not supported in ExtremeXOS
Wireless Port Boot Failed
Extreme Networks proprietary trap. Sent by the platform if a wireless port fails to boot too many times.
ExtremeWare 7.3Not supported in ExtremeXOS
Wireless Port State Changed
Extreme Networks proprietary trap. Generated when a wireless port moves into enabled, disabled, or online state.
ExtremeWare 7.3Not supported in ExtremeXOS
Wireless Probe Info Added
Extreme Networks proprietary trap. Generated when a new station is added to the probe info table. Generated only if the value of extremeWirelessProbeInfoSendAddedTrap is true.
ExtremeWare 7.3Not supported in ExtremeXOS
Wireless Probe Info Removed
Extreme Networks proprietary trap. Generated when a station is removed from the probe info table. Generated only if the value of extremeWirelessProbeInfoSendRemovedTrap is true.
ExtremeWare 7.3Not supported in ExtremeXOS
lldp Remote Table Changed
A lldpRemTablesChange notification is sent when the value of lldpStatsRemTableLastChangeTime changes. It can be utilized by an NMS to trigger LLDP remote systems table maintenance polls.
Note that transmission of lldpRemTablesChange notifications are throttled by the agent, as specified by the 'lldpNotificationInterval' object.
ExtremeXOS 11.4/Supported by Avaya devices
Table 31: SNMP Trap Events (continued)
Event Definition
ExtremeWare/ ExtremeXOS Version
EPICenter Reference Guide

RMON Rising and Falling Trap Events
To configure the switch to send one of these traps, you must use a tool that allows you to set the value of the appropriate SNMP variable. Tools such as SNMPc can be used to perform this function. The following information assumes that you have a thorough understanding of SNMP and an appropriate SNMP utility.
Refer to the appropriate MIBs for details of the variable settings:
● Ping MIB: pingmib.mib (RFC 2925)
● OSPF v2 MIB: RFC 1850 or RFC 1850t
RMON Rising and Falling Trap EventsAn RMON rising trap indicates that the value of the monitored variable has risen to or above the rising threshold value. RMON rules need to be configured on a device for it to send out this trap. See “Threshold Configuration” on page 114” for more information.
Table 32: Trap Variable Configuration
Trap VariablesPing Probe Failed set pingCtlTrapGeneration bit 0 ON to enable trap.
set pingCtlTrapProbeFailureFilter to specify the number of successive probe failures that must occur to generate a Probe Failed trap.
Ping Test Failed set pingCtlTrapGeneration bit 1 ON to enable trap.
set pingCtlTrapTestFailureFilter to specify the number of successive test failures that must occur to generate a Test Failed trap.
Ping Test Completed set pingCtlTrapGeneration bit 2 ON to enable the trap.
OSPF Virtual Interface State Change set ospfSetTrap bit 1 ON
OSPF Neighbor State Change set ospfSetTrap bit 2 ON
OSPF Virtual Neighbor State Change set ospfSetTrap bit 3 ON
OSPF Interface Config Error set ospfSetTrap bit 4 ON
OSPF Virtual Interface Config Error set ospfSetTrap bit 5 ON
OSPF Interface Authentication Failure set ospfSetTrap bit 6 ON
OSPF Virtual Interface Authentication Failure
set ospfSetTrap bit 7 ON
OSPF Interface Receive Bad Packet set ospfSetTrap bit 8 ON
OSPF Virtual Interface Receive Bad Packet set ospfSetTrap bit 9 ON
OSPF TX_Retransmit set ospfSetTrap bit 10 ON
OSPF Virtual Interface TX Retransmit set ospfSetTrap bit 11 ON
OSPF Originate LSA set ospfSetTrap bit 12 ON
OSPF Max_Age LSA set ospfSetTrap bit 13 ON
OSPF LSDB Overflow set ospfSetTrap bit 14 ON
OSPF LSDB Approaching Overflow set ospfSetTrap bit 15 ON
OSPF Interface State Change set ospfSetTrap bit 16 ON
EPICenter Reference Guide 391

Event Types for Alarms
392
An RMON falling trap indicates that the value of the monitored variable has fallen to or below the falling threshold value. RMON rules need to be configured on a device for it to send out this trap. See “Threshold Configuration” on page 114” for more information.
EPICenter EventsAn EPICenter event is generated by the EPICenter server based on the results of its periodic polling. In some cases, an EPICenter event may result from the same condition that could generate an SNMP or other trap. An EPICenter event has the advantage that it guarantees that the condition will be detected (by polling) even if the corresponding trap is missed.
Table 33: EPICenter Events, Detected Through Polling
Event DefinitionConfiguration Upload Failed The EPICenter server generates this event when it fails to upload
configuration information from a device. This event occurs ONLY when the upload is attempted from EPICenter, not if it was attempted from Telnet, ExtremeWare Vista or any other method.
Configuration Upload OK The EPICenter server generates this event when it successfully uploads configuration from a device. This event occurs ONLY when the upload is done from EPICenter, not from Telnet, ExtremeWare Vista or any other method.
Device Policy Configuration The EPICenter server generates this event when it encounters a problem configuring policies on a device using ACL and QoS.
Device Reboot The EPICenter server generates this event for a device when it detects a device reboot (cold start or warm start). Unlike the cold start or warm start SNMP trap, EPICenter generates this event by polling the device.
Device Warning from EPICenter For Extreme Networks devices only. The EPICenter server generates this event in one of two situations:
• If the server detects an infinite loop while walking the device’s SNMP MIB (may occur with ExtremeWare 4.1.19b2).
• If the device has a bad serial number reported through SNMP (may occur with ExtremeWare 6.2.1 on the BlackDiamond 6816).
Fan Failed For Extreme Networks devices only. The EPICenter server generates this event for an Extreme device when it detects, via polling, a transition from fan OK to fan failed condition on the device. Unlike the SNMP Fan Failed trap event, this event is generated only once, based on a state transition. As an alternative, you can detect a Fan Failed condition by using the SNMP Fan Failed trap, which will be generated every 30 seconds until the condition is corrected.
High Trap Count
One-Shot Event No Longer Valid
Overheat For Extreme Networks devices only. The EPICenter server generates this event for an Extreme device when it detects a transition from normal temperature to overheat condition on the device. Unlike the SNMP overheat trap event, this event is based on a state transition, and will be generated only once. As an alternative, you can detect an Overheat condition by using the SNMP Overheat trap, which will be generated every 30 seconds until the condition is corrected.
Power Supply Failed For Extreme Networks devices only. The EPICenter server generates this event if the device reports a power supply failure.
Rogue Access Point Found
EPICenter Reference Guide

EPICenter Events
SNMP Reachable The EPICenter server generates this event when the state of communication with the device transitions from unreachable to reachable.
SNMP Unreachable The EPICenter server generates this event when it fails to communicate with a device following a previously successful communication. In other words, this event is generated when the state of communication with the device transitions from reachable to unreachable.
Stack Member Down
Stacking Link Down
Syslog Flood The EPICenter server generates this event if the server receives syslog messages at a rate that exceeds the user-defined limit set in EPICenter Administration via the Scalability Properties. See “Server Properties Administration” on page 307 for more information.
Table 33: EPICenter Events, Detected Through Polling (continued)
Event Definition
EPICenter Reference Guide 393

Event Types for Alarms
394
EPICenter Reference Guide
B EPICenter Backup
This appendix describes the following:
● The EPICenter Alarm Log and Event Log backup files
● The DBVALID command-line database validation utility
● The DBBACKUP command-line database backup utility
EPICenter Log BackupsBoth the EPICenter Event Log and Alarm Log files are kept in tables in the EPICenter database. These tables can contain approximately 50,000 and 12,000 entries, respectively.
When the EPICenter server starts, it checks once an hour to determine if either of these logs has reached its maximum size. When one reaches 115% of its maximum, EPICenter moves the oldest 10% of the entries to a backup file, and clears those entries from the table.
For Windows, the backup files are created in the directory <install_dir>/user, where <install_dir> is the root directory of the EPICenter install, by default c:\Program Files\Extreme Networks\EPICenter 7.0. For Solaris, the backup files are created in the directory /opt/ExtremeNetworks/EPICenter7.0/user.war, where /opt/ExtremeNetworks/EPICenter7.0 is the <install_dir>.
● The Alarm Log is backed up to the file Alarm_Log.txt
● The Event Log is backed up to the file Event_Log.txt
Each primary backup file is in turn backed up to a secondary file when it reaches its maximum size of approximately 30 MB for Event_Log.txt and 6 MB for Alarm_Log.txt.
● Alarm_Log.txt is backed up to the file Alarm_Log.old
● Event_Log.txt is backed up to the file Event_Log.old
The primary file is then emptied.
When the primary file becomes full for the second time, the secondary backup file will be overwritten with the new contents of the primary backup file.
If you want to maintain a complete set of log file backups over time, you should save the *_Log.txt and *_Log.old files periodically.
Database UtilitiesSybase database validation and backup utilities are shipped with the EPICenter software.
The Validation utility validates all indexes and keys on some or all of the tables in the database. The Validation utility scans the entire table and looks up each record in every index and key defined in the
EPICenter Reference Guide 395

EPICenter Backup
396
table. This utility can be used in combination with regular backups to give you confidence in the security of the data in your database.
The Backup utility makes a backup copy of all data in the database. Backing up your database regularly ensures that you will not need to re-enter or recreate all the switch, VLAN, Topology, and Alarm information in the event that the database is corrupted or destroyed.
Database utilities are found in the <install_dir>\database\bin directory. <install_dir> is the directory where you installed the EPICenter software. Substitute the name of the actual directory for <install_dir> when you run these commands.
NOTE
In the Solaris operating system, you must ensure that the EPICenter database path is set in the LD_LIBRARY_PATH environment variable. This should be set to <install_dir>/database/bin where <install_dir> is the root directory of the EPICenter install, for example /opt/ExtremeNetworks/EPICenter7.0.
The Validation UtilityThe Validation utility validates all indexes and keys on some or all of the tables in the database. Access the Validation utility from the MS DOS or Solaris command line using the dbvalid command. This convention also allows incorporation into batch or command files.
Sample batch and command files are included with EPICenter, as follows:
To back up the EPICenter database running under Windows, use the command:
<install_dir>\database\bin\dbvalid.bat
Under Solaris and Linux, use the command:
<install_dir>/database/bin/dbvalid.sh
The sample batch and command files assume a database user ID of dba, with password sql. These are the defaults used when the database server is installed through the EPICenter installation process. If you have changed your database user ID and password, substitute your actual user ID and password by editing dbvalid.bat and dbvalid.sh.
<install_dir> is the directory where the EPICenter software is installed. Substitute the actual directory name in the command.
Using the DBVALID Command-Line UtilityTo validate the EPICenter database running under Windows, use the command:
<install_dir>\database\bin\dbvalid -c“uid=dba;pwd=sql;eng=EPIC70;dbf=<install_dir>\database\data\basecamp.db”
<install_dir>\database\bin\dbvalid -c“uid=dba;pwd=sql;eng=EPIC70;dbf=<install_dir>\database\data\epicenter.db”
Under Solaris, use the command:
<install_dir>/database/bin/dbvalid -c
EPICenter Reference Guide

The Validation Utility
“uid=dba;pwd=sql;eng=EPIC70;dbf=<install_dir>/database/data/basecamp.db”
<install_dir>/database/bin/dbvalid -c“uid=dba;pwd=sql;eng=EPIC70;dbf=<install_dir>/database/data/epicenter.db”
This example assumes a database user ID of dba, with password sql. These are the defaults used when the database server is installed through the EPICenter installation process. If you have changed your database user ID and password, substitute your actual user ID and password in the command.
<install_dir> is the directory where the EPICenter software is installed. Substitute the actual directory name in the command.
This operation should report no errors. If there are errors, the system should be stopped and a backup database copied into place. See “Installing a Backup Database” on page 399. If there are no backups, the EPICenter software must be re-installed.
Syntax: dbvalid [switches]
Database Connection ParametersThese are the parameters for the -c command-line switch. If the connection parameters are not specified, connection parameters from the SQLCONNECT environment variable are used, if set.
The connection parameters are separated by semicolons, and the entire set must be quoted. For example, under Windows, the following validates the EPICenter, connecting as user ID dba with password sql:
<install_dir>\database\dbvalid -c “uid=dba;pwd=sql;eng=EPIC70;dbf=<install_dir>\basecamp.db”
<install_dir>\database\bin\dbvalid -c“uid=dba;pwd=sql;eng=EPIC70;dbf=<install_dir>\database\data\epicenter.db”
Table 34: dbvalid Command Switches
Switch Description-c “keyword=value; ...” Supply database connection parameters
Table 35: Database Connection Parameters for dbvalid Utility
uid=<user name> The user name used to login to the database. Default is dba. The user ID must have DBA authority.
pwd=<password> The password used to login to the database. Default is sql.
dbf=<database_file> The name of the file that stores the data. This is the file to be validated.
eng=EPIC70 The name of the database engine. This value must be EPIC70 for EPICenter 7.0.
EPICenter Reference Guide 397

EPICenter Backup
398
The Backup UtilityThe Backup utility makes a backup copy of all data in the database. Access the Backup utility from the MS-DOS or Solaris/Linux command line using dbbackup.bat or dbbackup.sh respectively. This convention also allows incorporation into batch or command files.
To back up the EPICenter database running under Windows, use the command:
<install_dir>\database\bin\dbbackup.bat <backup_dir>
Under Solaris and Linux, use the command:
<install_dir>/database/bin/dbbackup.sh <backup_dir>
This example assumes a database user ID of dba, with password sql. These are the defaults used when the database server is installed through the EPICenter installation process. If you have changed your database user ID and password, substitute your actual user ID and password by editing dbbackup.bat and dbbackup.sh.
<install_dir> is the directory where the EPICenter software is installed. Substitute the actual directory name in the command.
<backup_dir> is the directory where the backup copy of the database should be stored. The <backup_dir> can be specified as a directory and one or more subdirectories (for example, C:\EPICenter70backups\Jan12\1340hrs). If you specify a <backup_dir> with more than one subdirectory, then make sure the directories above the last subdirectory already exist prior to running the Backup utility.
For example, to back up the database to C:\EPICenter70backups\Jan12\1340hrs, you must have already created a C:\EPICenter70backups\Jan12 directory. When you run the Backup utility, it creates a 1340hrs subdirectory under C:\EPICenter70backups\Jan12 and places the database backup files there.
This command generates a backup of the database in the specified backup directory. The database backup consists of four files; basecamp.db, basecamp.log, epicenter.db, and epicenter.log. All database files are backed up. These files should be saved so they can be used to replace the original files in the event of a problem.
NOTE
Do not stop the EPICenter server to perform daily backups of the database. This action is not necessary and will prevent the alarm and event logs from truncating.
Syntax: dbbackup [switches] directory
Database Connection ParametersThese are the parameters for the -c command-line switch. If the connection parameters are not specified, connection parameters from the SQLCONNECT environment variable are used, if set.
Table 36: dbbackup Command Switches
Switch Description-c “keyword=value; ...” Supply database connection parameters
-y Replace files without confirmation
EPICenter Reference Guide

The Backup Utility
The connection parameters are separated by semicolons, and the entire set must be quoted. For example, under Windows, the following backs up the EPICenter database basecamp.db, connecting as user ID dba with password sql:
<install_dir>\database\bin\dbbackup -c uid=dba;pwd=sql;eng=EPIC70;dbf=<install_dir>\database\data\basecamp.db c:\tmp
Installing a Backup DatabaseThe backup database is named basecamp.db and epicenter.db, and is kept in the directory you specified when you ran the dbbackup.bat or dbbackup.sh script file.
To replace a damaged database with the backup copy, follow these steps:
1 Shut down the EPICenter software following the instructions for your operating system in the EPICenter Installation and Upgrade Guide.
2 Move or delete the old copy of basecamp.db, basecamp.log, epicenter.db,and epicenter.log found in the EPICenter installation directory.
3 Copy the backup copy of basecamp.db, basecamp.log, epicenter.db,and epicenter.log to the EPICenter installation directory.
4 Restart the EPICenter software following the instructions in the EPICenter Installation and Upgrade Guide for your operating system.
Table 37: Database Connection Parameters for dbbackup Utility
uid=<user name> The user name used to login to the database. Default is dba. The user ID must have DBA authority.
pwd=<password> The password used to login to the database. Default is sql.
dbf=<database_file> The name of the file that stores the data. This is the file to be backed up.
eng=EPIC70 The name of the database engine. This value must be EPIC70 for EPICenter 7.0.
EPICenter Reference Guide 399

EPICenter Backup
400
EPICenter Reference Guide
EPICent
Index
Numerics802.1Q tag, 241
Aaccess roles, 296, 302
Administrator, 296, 302Disabled, 296, 302Manager, 296, 302Monitor, 296, 302
Ack button, 90Actions tab, 105Add button
in Alarm Category, 113in Alarm Definition, 99in Discovery, 46in IP/MAC Address Finder, 223, 224in Threshold Configuration, 117
Add/Modify Condition button, 95Add/Modify Filter button, 97adding
alarm category, 113alarm definition, 99CPU Utilization rule, 117devices, 50RMON rule, 117user accounts, 299
address rangein IP/MAC Address Finder, 222
adminpredefined administrator user, 296
Administration page, 298Administrator
adding users, 299deleting a user account, 300, 304distributed server configuration, 314ExtremeWare access, 296modifying users, 299server properties configuration, 307
Administrator accessEPICenter, 296, 302ExtremeWare, 296
alarm actionsE-mail, 106forward trap, 106run program, 106sound alert, 106
Alarm Browser, 89Alarm button, 89Alarm Definition tab, 98alarm events
Extreme proprietary traps, 88from EPICenter, 88, 102RMON falling threshold, 102RMON rising threshold, 102SNMP traps, 88, 101Syslog messages, 102
Alarm Log Browser, 89Alarm Log Detail View, 91, 92Alarm Log report, 319, 349alarm propagation, 27alarms
acknowledging, 90categories, 113CPU utilization rule display, 116CPU utilization threshold configuration, 115creating a display filter, 92, 94creating a filter, 95, 97current filter, 89Default category, 113defining, 98defining scope, 104delete saved display filters, 92deleting, 91detail view, 91, 92E-mail alarm action, 106EPICenter event type, 102Event Type definition, 101falling threshold configuration, 116, 119falling threshold for CPU utilization rules, 121falling threshold, predefined RMON rules, 122filtering, 91forward trap action, 106pause processing, 92Port Utilization rule, 122predefined, 88, 98predefined RMON event configuration, 122resume processing, 92rising threshold configuration, 115, 116, 119rising threshold for CPU utilization rules, 121rising threshold, predefined RMON rules, 122RMON event types, 102RMON rule definition, 119RMON rule display, 115RMON threshold configuration, 115
er Reference Guide 401

402
run program action, 106saving a default filter, 90scope, 103setting up e-mail, 108sound alert action, 106startup condition for CPU utilization, 121startup condition for RMON alarms, 120startup condition for threshold alarms, 116Syslog messages, 102Temperature threshold rule, 122threshold rule target configuration, 122Topology Change rule, 122unacknowledging, 90variables, 102
Archive button (Configuration Manager), 133Archive/Baseline differences report, 137archiving configuration settings, 133Audit Log, 197, 200
Bbaseline configuration
restoring, 146scheduled upload, 144uploading, 144
BootROM imagesfile locations, 170hitless upgrade, 178updating, 177version checking, 186
BootROM upgradeHitless upgrade, 178
buttonsAck, 90Add (Alarm Category), 113Add (Alarm Definition), 99Add (Discovery), 46Add (IP/MAC Address Finder), 223, 224Add (Threshold Configuration), 117Add/Modify Condition, 95Add/Modify Filter, 97Alarm, 89Archive (Configuration Manager), 133Clone (IP/MAC Address Finder), 221, 226Close Window (Reports), 321Delete (Alarm Category), 114Delete (Alarm Definition), 100Delete (Alarm System), 91Delete (IP/MAC Address Finder), 221, 226Delete (RMON Configuration), 117Delete alarms with specified conditions, 91,
96Detail, 91, 92Discover (Device Discovery dialog), 45
Download (Configuration Manager), 139Export (IP/MAC Address Finder), 221, 226Export Local (IP/MAC Address Finder), 226Export Local (IP/MAC Finder), 221Find (IP/MAC Address Finder), 222Increment (Configuration Manager), 141Logout (Reports), 321Modify (Alarm Category), 113Modify (Alarm Definition), 99Modify (RMON Configuration), 117New (Discovery), 45Remove (Discovery), 45Remove (IP/MAC Address Finder), 223Remove All (IP/MAC Address Finder), 223Remove Condition(s), 96Remove Filter(s), 97ReRun (IP/MAC Address Finder), 221, 226Settings... (Alarm Definition), 108Submit (IP/MAC Address Finder), 224Sync (RMON Configuration), 117, 124Unack, 91Upload (Configuration Manager), 130Variables... (Alarm Definition), 106Versions (Firmware Manager), 188WildCard (IP/MAC Address Finder), 222
Ccategories for alarms, 113Clone button, 221Clone button (IP/MAC Address Finder), 226Close Window button, 321composite link (topology), 77Config Mgmt Log report, 319configuration archiving, 133configuration file
scheduled upload, 133configuration files
archiving, 133comparing, 148download incremental, 141downloading, 139restoring baseline, 146uploading baseline, 144viewing, 147
Configuration Manager, 125Archive button, 133archive/baseline differences report, 137archiving configuration files, 133baseline file upload, 144comparing configuration files, 148configuring file viewers, 150Download button, 139download incremental configuration, 141
EPICenter Reference Guide

download saved configuration, 139email notification, 138Increment button, 141restoring a baseline configuration, 146scheduled baseline upload, 144scheduled device upload, 133scheduling global archive uploads, 135setting archive limits, 136software version specification, 188Upload button, 130uploading device configuration, 130viewing configuration files, 147
conventionsnotice icons, About This Guide, 12text, About This Guide, 12
CPU Utilizationevent configuration rules, 115falling threshold configuration, 121Rising Threshold configuration, 116rising threshold configuration, 121rule definition, 120rule display, 116rule target configuration, 122Sample Type, 121Startup Alarm, 121
creating, 278alarm definitions, 98alarm threshold event rules, 117incremental configuration file, 143search task (IP/MAC Address Finder), 222Universal Port Manager, 278
Ddatabase backup utility, 398database validation utility, 395dbbackup utility, 398dbvalid utility, 395Debug EPICenter, 320decorative node, 76Default alarm category, 113Default device group, 26Delete alarms with specified conditions button,91, 96Delete button
in Alarm Category, 114in Alarm Definition, 100in Alarm System, 91in IP/MAC Address Finder, 221, 226in RMON Configuration, 117
deletinga user account, 300, 304alarm category, 114alarm definition, 100
alarms, 91RMON configuration, 117
deployed, 258deployment wizard, 283Detail button, 91, 92Detailed Task View (IP/MAC Address Finder), 225device, 257
download incremental configuration, 141download saved configuration, 139modifying information, 52uploading configuration from, 130
Device Details report, 328Device Discovery set up window, 44device group, 258device groups, 25
default, 26Device Inventory report, 319, 325device nodes (topology), 75device properties, 40Device reports, 325Device Status report, 319, 334Device tab, 40diff viewer, 264Disabled access, 296, 302Discover button (Device Discovery dialog), 45Discovery, 44
Add button, 46Discovery Results window, 46display mode, real-time statistics, 235distributed server administration, 314
configuring server group manager, 316configuring server group member, 315
Distributed Server summary report, 20, 325dockable windows, 23download
ExtremeWare software image, device, 178incremental configuration, 141saved device configuration, 139
Download button (Configuration Manager), 139dynamic, 257
EEAPS configuration
validate, 378EAPS Monitor
ExtremeWare version support, 371ExtremeXOS version support, 371
edit profile configurationUniversal Port Manager, 269
editing, 278Universal Port Manager, 281
E-mailalarm action, 106
EPICenter Reference Guide 403

404
setting up for alarms, 108email notification (Config Mgr), 138enable, http
Universal Port Manager, 256enable,https, 256EPICenter, 257
feature summary, 15eSupport Export report, 318, 321event binding, 258event configuration, 115
CPU utilization rule display, 116CPU utilization rules, 115RMON rules, 115rule target, 122
Event Log report, 319, 350event variables, 291Export button, 221, 226Export Local button, 221, 226exporting, 278exporting profile, 265Extreme switch
support in EPICenter, 17ExtremeWare images
file locations, 170ExtremeWare requirements
for IP/MAC Address Finder, 219, 255ExtremeWare software image
downloading to device, 178specifying current version, 170, 188upgrading device, 177
ExtremeXOS scriptsdeploying, 163
Ffalling threshold
CPU utilization, 121for predefined RMON events, 122RMON events, 119
filter definitions, network profile view, 260Filtered Profiles table, 261filtering
in reports, 322filtering alarms, 89, 91, 92, 94filters, network profiles, 260Find Address Tasks List window, 220Find button
in IP/MAC Address Finder, 222Firmware Manager, 169
download image to device, 178software version specification, 170summary status, 171Upgrade command, 170upgrade device image, 177
Versions button, 188Forward trap alarm action, 106functions, 256
Gglobal archive uploads, scheduling, 135
HHitless upgrade, 177Home page, 19hyper node, 76
Iimage files
BootROM files location, 170file locations, 170
image upgradeBootROM update, 177ExtremeWare software image, device, 177Hitless upgrade, 177multi-step upgrade, 177
Increment button (Configuration Manager), 141incremental configuration file, 143individual errors graph, 229Interface, 319Interface report, 319, 342Inventory Manager
adding devices, 50Discovery, 44
IP addressfinding with IP/MAC Address Finder, 219
IP/MAC Address FinderAdd button, 223, 224creating a search task, 222Delete button, 221ExtremeWare requirements, 219, 255Remove All button, 223Remove button, 223Search Domains list, 223search results, 225Search Type, 223Submit button, 224Target Domains list, 223, 224Task List, 222tasks list, 221Tasks List Summary, 220WildCard button, 222
Llink (topology), 76
composite link, 77
EPICenter Reference Guide

Logout button, 321
MMain page, Reports, 320Manager access, 296, 302map elements (Topology), 75
composite link, 77decorative node, 76device node, 75hyper node, 76link, 76submap node, 75text node, 76
map nodeslaying out, 82
Messages tab, 110meta data, UPM, 282MIB Poller Summary report, 320MIB Query report, 320MIB variables
in RMON rules, 119in RMON threshold configuration, 119
Modify buttonin Alarm Category, 113in Alarm Definition, 99in RMON Configuration, 117
modifying, 281alarm category, 113alarm definition, 99device information, 52RMON configuration, 117user accounts, 299
Monitor access, 296, 302multi-step upgrade, 177, 185
NNetwork Clients tab, 41Network Status Summary report, 19, 324Network Summary Report, 319Network Summary report, 319New button
in Discovery, 45Non-EPICenter, 257
OOverview, 255
PPanel View, 39pause alarm processing, 92port binding, 258
port group, 258port properties, 41predefined alarms, 88, 98profile, 257, 258, 278, 281, 283, 290profile templates, 282profile, edit configuration, 269profile, exporting to harddisk
Universal Port Manager, 265profile, importing, 277profile, manually running, 266profile, saving to EPICenter
Universal Port Manager, 265profile, updating information
Universal Port Manager, 269profiles, managed profiles view
Universal Port Manager, 273profiles, renaming
Universal Port Manager, 275profiles, saving new version, 275profiles, viewing details
Universal Port Manager, 263Properties
Device tab, 40Network Clients tab, 41Syslog Messages tab, 41
RRADIUS, 295
client configuration, 305configuring shared secret, 305, 306disabling, 306enabling server, 306enabling server response messages, 306server, 297server administration, 304server port configuration, 305, 306
RADIUS Administration tab, 305Real-Time Statistics, 229
graph preferences, 235, 236individual errors graph, 229total errors graph, 229
related publications, About This Guide, 12Release Notes, 11Remote Authentication Dial In User Service. SeeRADIUSRemove All button
in IP/MAC Address Finder, 223Remove button
in Discovery, 45in IP/MAC Address Finder, 223
Remove Condition(s) button, 96Remove Filter(s) button, 97Reports
Network Summary Report, 319
EPICenter Reference Guide 405

406
reports, 319, 323Alarm Log, 319Alarm Log report, 349Config Mgmt Log, 319Debug EPICenter, 320Device Details, 328Device Inventory, 325Device Inventory report, 319, 325Device reports, 325Device Status report, 319, 334Distributed Server summary, 20, 325eSupport Export, 318, 321Event Log, 319Event Log report, 350exiting, 323exporting, 368filtering, 322Interface report, 342Main page, 320MIB Poller Summary, 320MIB Query, 320Network Status Summary, 19Network Status Summary report, 324Network Summary report, 319printing, 368Server State Summary, 320Slot Inventory report, 319, 336sorting, 323Syslog, 319System Log report, 353Unused Port, 319
requirements, software, 255ReRun button, 221, 226resume alarm processing, 92rising threshold
CPU utilization, 121for predefined RMON events, 122RMON events, 119
RMONconfiguration, 115event configuration rules, 115Falling Threshold configuration, 116, 119falling threshold, predefined events, 122MIB variables for rules, 119Port Utilization predefined rule, 122predefined rule definition, 122Rising Threshold configuration, 115, 119rising threshold for predefined events, 122rule definition, 119rule display, 115rule target configuration, 122Sample Type, 119Sample Type (predefined rule), 122Startup Alarm, 120
Startup Alarm for predefined rule, 122synchronize with device rules, 124Temperature predefined rule, 122Topology change predefined rule, 122traps, 87, 89
rolesAdministrator, 296, 302Manager, 296, 302Monitor, 296, 302
ruleCPU utilization event configuration, 120display, CPU utilization, 116display, RMON, 115predefined RMON event configuration, 122RMON threshold configuration, 119threshold target configuration, 122
Run program alarm action, 106
SSample Type
Absolute (for CPU Utilization, 121Absolute (predefined RMON), 122Absolute (RMON), 119Delta (for CPU Utilization), 121Delta (RMON), 119
saving profiles, 265scheduled baseline upload, 144scheduled configuration upload, 133scope for alarms, 103Scope tab, 103Search Domains list, 223search results
Discovery, 46IP/MAC Address Finder, 225
Search Target, IP/MAC Address Finder, 222search task (IP/MAC Address Finder), 222Search Type, IP/MAC Address Finder, 223server properties, 297
administration of, 307Automatically Save Configuration, 309Client Port, 313Device HTTP Port, 308Device Telnet Port, 308Device Tree UI, 313Devices properties, 308DHCP Temporary Lease, 314DNS Lookup Timeout Period, 313Enable MAC Polling, 313Enable Syslog Server, 308EPICenter Trap Receiver Port, 311External Connections Properties, 312Features Properties, 309HTTP Proxy Device, 312
EPICenter Reference Guide

HTTP Proxy Port, 312IP QoS Rule Precedence, 313Load Information from http
//www.extremenetworks.com, 312MAC Polling Properties, 313Number of Retries, 311Other properties, 313Poll Devices Using Telnet, 309Poll Interval, 311Save Changed Configurations, 309Save Switch Password for Vista Login, 309Scalability properties, 310ServiceWatch URL, 313Session Timeout Period, 313setting, 307SNMP properties, 311SysLog Message Min Severity, 308Syslog Message per Device, 310Syslog Message per Minute, 310System Load, 313Telnet Login Timeout Period, 308Telnet Screen Width, 314Thread Default Alloc Size, 310Thread Pool Size, 310Timeout Period, 311Traps per device, 310Traps per Minute, 310Update Type Library on Server, 313Upload/Download Timeout Period, 308Use EPICenter Login for Telnet, 309
Server Properties tab, 307Server State Summary report, 320setting
graph preferences (RT Stats), 236server properties, 297, 307
setting archive limits, 136Settings... button (Alarms), 108Show Full Path checkbox, 79, 246Slot Inventory report, 319, 336SNMP
alarm event type, 101total traps rate limit, 310traps, 87, 89traps per device rate limit, 310
software imagechecking for version availability, 177obtaining updates, 174
software imagesfile locations, 170
sortingreports, 323
sound alert alarm action, 106SSH2 (Inventory Manager), 53, 57Stacking device
in Firmware Manager, 172upgrading software, 178
Startup Alarmfor CPU Utilization, 121for predefined RMON rule, 122RMON, 120
static, 257statistics
display mode, real-time, 235graph preferences (RT Stats), 236individual port real-time, 233multi-port real-time, 231real-time, 229
submap node, 75Submit button, 224Sync button
in RMON configuration, 117, 124synchronize (RMON), 124Syslog
alarm event type, 102enabling EPICenter Syslog server, 308message storage, 41messages in alarms, 102restarting the server, 308setting minimum severity for message
acceptance, 308Syslog Messages tab, 41total messages rate limit, 310
Syslog Messages tab, 41Syslog report, 319System Log report, 353
TTarget Domains list, 223, 224Target tab, 122Task Name, IP/MAC Address Finder, 222Tasks List Summary window, 220Tcl-based, 323templates, profile
Universal Port Manager, 282terminology, 257terminology, About This Guide, 11test wizard, 283text node, 76TFTP server
enabling/disabling, 151setting root directory path, 151
third-party device support, 17Threshold Configuration page, 115Threshold Configuration tab, 115topology
composite link, 77decorative node, 76
EPICenter Reference Guide 407

408
device node, 75hyper node, 76link, 76map elements, 75submap node, 75text node, 76
total errors graph, 229traps
Extreme proprietary, 88RMON, 87, 89SNMP, 87, 89total traps rate limit, 310traps per device rate limit, 310
trigger events, 290
UUnack button, 91Universal Port Manager, 255, 256, 257, 258,260, 261, 263, 264, 265, 266, 269, 273, 275,277, 278, 281, 282, 283, 290, 291Universal Port Manager,, 255Unused Port report, 319Unviersal Port Manager, 255updating, upm information, 269upgrade
multi-step, 185upload
baseline, scheduled, 144device configuration, 130scheduled archive, 133
Upload button (Configuration Manager), 130UPM, meta data, 282UPM, terminology, 257user, 257
ExtremeWare access, 297predefined user, 296
User Administration page, 298users, adding, 299users, modifying, 299utilities
database backup, 398database validation, 395
VValidate EAPS, 378Variables... button (Alarms), 106Versions button (Firmware Manager), 188view diff, profiles
Universal Port Manager, 264view, managed profiles, 273view, network profiles, 258viewing, profile details, 263
Virtual LANs. See VLANsVLAN Services, 250VLANs
802.1Q tag, 241definition of, 241protocol filters, 241
WWildCard button, 222wildcards
in IP/MAC Address Finder, 222
ZZoom In menu selection, 79Zoom Map Out menu selection, 79
EPICenter Reference Guide