epi-fluorescence imaging of colloid transport in porous media at decimeter scales
TRANSCRIPT
Epi-Fluorescence Imaging ofColloid Transport in Porous Mediaat Decimeter ScalesP E N G F E I Z H A N G * . † . ‡ A N DY O N G G A N G W A N G † , ‡
Department of Earth & Atmospheric Sciences, City College ofNew York, 138th Street and Convent Avenue, New York,New York 10031, and Department of Earth andEnvironmental Sciences, Graduate School & University Center,City University of New York, 365 Fifth Avenue, New York,New York 10016
A noninvasive epi-fluorescence imaging technique wasdeveloped for real-time observation of colloid transport inporous media at decimeter scales. Fluorescent latexmicrospheres and translucent quartz sand were used asa model colloid-porous medium system. Various calibrationswere performed for accurate conversion of fluorescenceintensities to microsphere concentrations. Fluorescenceintensities were found to linearly increase with microsphereconcentrations (5 × 10⁵-5 × 10⁸ spheres/mL in saturatedsand) and with camera exposure time. Fluorescenceintensities also increased with sand thickness (saturatedwith microsphere solution), indicating that the fluorescencesignals detected by the imaging system were integratedsignals from the entire thickness (10 mm) of the sand. A setof microsphere transport experiments was conducted todemonstrate the versatility of the imaging system. Excellentmass recoveries (93-103%) were achieved in all transportexperiments, demonstrating the robustness of the imagingsystem for quantitative study of colloid transport. The systemallowed the change of flow velocity, ionic strength, andflow direction within one transport experiment and the real-time, quantitative monitoring of the movement of micro-spheres in packed sand, greatly reducing the time and effortneeded for similar work with traditional column experiments.
IntroductionColloid transport in porous media has been traditionallystudied via column experiments, where colloids are injectedand eluted, and colloid breakthrough-elution curves and/orcolloid distributions within the media are obtained andanalyzed (e.g., refs 1-3). Data obtained from column experi-ments are restricted to one dimension (1D), and colloiddistribution profiles are limited to the end of the columnexperiments due to destructive sampling. Such column exper-iments are clearly inadequate for studying colloid transportin heterogeneous media, where direct and continuous obser-vation of the two-dimensional (2D) movement of colloidswithin the media at macroscopic scales is essential.
Recently, a light transmission technique was used todirectly observe the reactive transport of solutes and colloids
in translucent porous media at decimeter scales (4-9). Inthis technique, a light source was placed on one side of aflow chamber, and bioluminescence or fluorescence fromthe flow chamber was captured by a charge-coupled device(CCD) camera placed on the opposite side of the flowchamber. Fluorescent (4, 7-9) or ultraviolet (UV) (5, 6) tubeswere employed as a diffuse light source, and a large gel filtersheet (decimeters in one dimension) was typically placed infront of the flow chamber to restrict excitation wavelengths.Large gel filter sheets tend to have defects and allow somesource light to leak through (8), leading to increased lightbackground and decreased sensitivity.
A large distance between the flow chamber and the cameralens (0.9-4 m, depending on the size of the imaging area (6,8)) was required for a typical light transmission imagingsystem. As such, a darkroom was necessary to house theentire imaging system for reduced light background. Theflow chamber was often fixed at a vertical direction (camerain horizontal) due to the space needed to lay out the entiresystem, making it difficult to pack porous media with varioustypes and levels of heterogeneity when such heterogeneityis desired (9).
Image intensities recorded by the CCD camera must beconverted to real solute or colloid concentrations for quan-titative analyses of solute/colloid transport. The applicationof Beer-Lambert law (10) to a system with quartz sand andfluorescent colloids (e.g., ref 8 and current study) is notstraightforward, due to light refraction, light reflection, andthe lack of information on fluorescence quantum yield.Therefore, empirical relationships between image intensitiesand colloid concentrations (i.e., calibrations) must be devel-oped. Calibrations are particularly important for porousmedia with physical heterogeneity (e.g., hydraulic conduc-tivity contrasts), since light transmission through areas ofdifferent hydraulic conductivity may be different (9) and lightintensity is no longer conserved during transport. As such,calculating colloid concentrations based on the principle oflight conservation (8) is no longer valid.
The objective of this study was to explore an alternativeimaging technique that would provide a compact, easy tocalibrate, and highly sensitive imaging system for quantitativestudy of colloid transport in porous media at decimeter scales.A light reflection imaging technique (both the light sourceand the CCD camera were placed on the same side of thesample) was used for a compact configuration. A relativelysmall flow cell was employed for easy calibrations. Opticalemission and excitation filters of common sizes were usedfor a large selection of filter pairs that may reduce lightbackground and enhance sensitivity. Thorough calibrationprocesses were performed, including intensity vs concentra-tion in porous medium, intensity vs camera exposure time,intensity vs medium thickness, intensity vs irradiation dura-tion, and intensity vs aqueous concentration. A few transportexperiments were carried out to demonstrate the utility ofthe epi-fluorescence imaging system for quantitative moni-toring of the movement of fluorescent microspheres intranslucent sand under changing ionic strengths, flow rates,and flow directions. A small subset of the transport data ispresented in this paper for illustration purposes. The paperdoes not purport to present new models of colloid transportbased on real-time imaging data.
Materials and MethodsImaging System. The imaging system consists of four majorcomponents: (1) an illuminator, (2) a closed optical pathimage (COPI) chamber, (3) a capture system chamber, and
* Corresponding author phone: (212)650-5609; fax: (212)650-6482;e-mail: [email protected]. Corresponding author address:Department of Earth & Atmospheric Sciences, City College of NewYork, 138th Street and Convent Avenue, New York, NY 10031.
† City College of New York.‡ City University of New York.
Environ. Sci. Technol. 2006, 40, 6064-6069
6064 9 ENVIRONMENTAL SCIENCE & TECHNOLOGY / VOL. 40, NO. 19, 2006 10.1021/es061104y CCC: $33.50 2006 American Chemical SocietyPublished on Web 08/24/2006
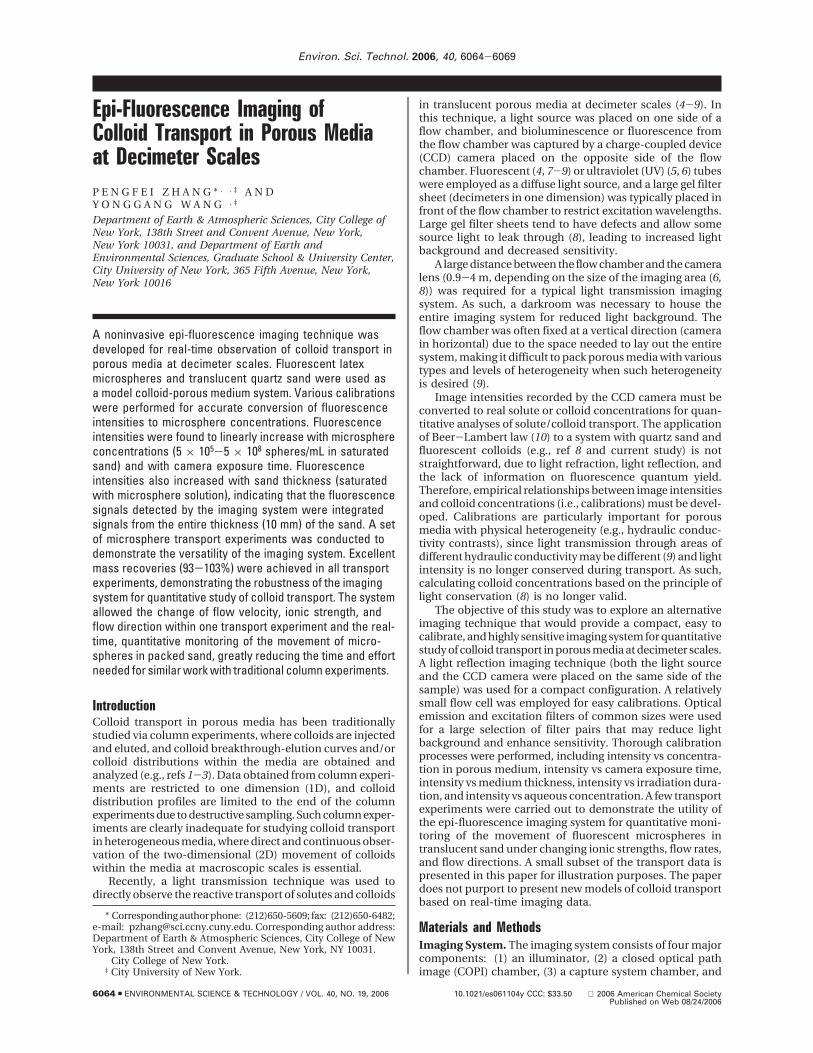
(4) a sample chamber (Figure 1). The illuminator uses a 150 Whalogen lamp as the light source and is interfaced with theCOPI chamber by a filter slider that holds up to four opticalexcitation filters (18 mm diameter). The COPI chamber hasa set of fiber optics and small mirrors that distribute thefiltered light from the light source evenly onto a platen (a 20× 20 cm viewing window made of optical grade UV trans-mittable acrylic), where a sample is excited and fluorescenceis emitted. A large mirror in the COPI chamber, positioned45° from the platen and the camera, reflects the downwardfraction of the emitted fluorescence to the capture systemchamber (i.e., epi-fluorescence) (Figure 1). The capturesystem chamber is composed of a filter wheel that holds upto four emission filters (72 mm diameter), a 10× zoom lensthat is capable of capturing images from 20 × 20 cm (200µm/pixel) to 2 × 2 cm (20 µm/pixel), and a cooled 14-bitCCD camera with a chip size of 1024 × 1024 pixels. Thesample chamber (working area underneath the lid) has fittingsthat connect the flow cell inside to the pump and fractioncollector outside (Figure 1).
The optical arrangement of epi-fluorescence (light reflec-tion) made it possible to place all necessary components ofthe imaging system into a compact (91 cm long by 48 cmwide by 43 cm high), light-tight box, eliminating the need fora darkroom. The entire imaging system (Figure 1) can beeasily rotated so the orientation of the flow chamber can bechanged (horizontal or vertical) as desired.
Raw images were processed using the Kodak 1D ImageAnalysis Software (Eastman Kodak, Rochester, NY). Thesoftware provides the intensity information on each pixeland gives the total and mean intensity of a selected regionof interest. Illumination nonuniformity is highly reproduciblewith this imaging system and can be corrected by dividinga sample image by an illumination reference image usingthe reference correction function in the Software.
Flow Cell. The flow cell has internal dimensions of 180mm (length) by 100 mm (width) by 10 mm (depth), withthree inlets and three outlets evenly spaced across the widthof the cell (Figure 1). The bottom acrylic sheet is glued to anacrylic frame to form the base, and the top acrylic sheet isfastened to the base with a set of screws. A rubber gasket isplaced between the top sheet and the frame to prevent fluidleaking. The flow cell was fully packed with sand (10 mmthick) in subsequent experiments, except as noted otherwise.
Sand and Microspheres. Translucent pure quartz sand(Accusand, 40-60 mesh, Le Sueur, MN) was used in thisstudy. The sand was thoroughly cleaned according to theprocedures of Litton and Olson (11). Briefly, the sand wassoaked in concentrated hydrochloric acid (Trace Metal Grade,Fisher Scientific, Pittsburgh, PA) for 24 h, rinsed thoroughlywith ultrapure Milli-Q water (Millipore Co., Billerica, MA),
dried in an oven at 100 °C overnight, roasted in a furnace at810 °C for 8 h, then cooled, and stored in precleaned glassjars under argon atmosphere.
Carboxylate-modified latex fluorescent microspheres(FluoSpheres, Molecular Probes, Eugene, OR) with 1.0 µmdiameter and red fluorescence (excitation/emission wave-lengths of 580/605 nm) were used in this study. The micro-sphere stock solution (3.0 × 10¹⁰ spheres/mL) was sonicatedfor 30 s and was diluted to desired concentrations. A fewexcitation/emission filter combinations were tried, and thepair with excitation/emission wavelengths of 535/600 nmgave the best result and therefore was selected for observingthe red fluorescent microspheres.
Calibrations. In order to convert fluorescence intensityto the actual number of microspheres in saturated quartzsand, two types of calibrations were carried out: (1) intensityvs concentration for a given camera exposure time and (2)intensity vs camera exposure time for a given concentration.The second calibration was intended to increase the dynamicrange of the imaging system (limited to 214 or 16,384 intensitylevels for a given exposure time) by reducing the exposuretime for high concentration samples, if a linear relationshipexists between intensity and exposure time. A third test,fluorescence intensity vs the thickness of sand (saturatedwith a given concentration of microspheres), was performedto confirm that the fluorescence signals detected were inte-grated signals across the whole depth (10 mm) of the flowcell, not just from the bottom of the flow cell. A fourth test,intensity vs irradiation duration for a given concentrationand camera exposure time, was also carried out to examinewhether fluorescence from microspheres would decay underconstant irradiation (e.g., a few hours during transport experi-ments). Such decay, if occurs, will lead to artifacts in concen-tration measurements and poor mass balances, limiting theapplication of this imaging technique to colloid transportstudies.
To obtain the first calibration, microsphere solution (5.0× 10⁵, 1.0 × 10⁶, 1.0 × 10⁷, 2.0 × 10⁷, or 5.0 × 10⁸ spheres/mL)and clean quartz sand were gradually added to the flow cell(all inlets and outlets sealed) and gently mixed using a glassrod until the flow cell was full. The flow cell was then cappedand imaged with a 30-s camera exposure time (2 s for the5 × 108 spheres/mL concentration). The volume (67 mL) ofthe microsphere solution and the mass (328 g) of sand addedto the flow cell were predetermined to ensure full saturationand consistency between different experiments. The flowcell was cleaned and repacked for each microsphere con-centration to avoid cross contamination. The packed flowcell with the 107 spheres/mL concentration was also imagedwith various camera exposure times (5-60 s) to obtain thesecond calibration. After that, the flow cell was irradiated by
FIGURE 1. Schematic diagram of the epi-fluorescence imaging system: (1) illuminator, (2) closed optical path image (COPI) chamber,(3) capture system chamber, and (4) sample chamber.
VOL. 40, NO. 19, 2006 / ENVIRONMENTAL SCIENCE & TECHNOLOGY 9 6065
the filtered light (535 nm) constantly and imaged with a 30-scamera exposure time every 15 min for up to 7 h for thefourth test (intensity vs irradiation duration). The proceduresfor the third test (intensity vs thickness) were similar to thoseof the first calibration except that the flow cell was packedwith different amounts of microsphere solution and sand toyield layers (quartz sand saturated with 107 spheres/mLmicrosphere suspension) of different thickness (2.0 mm,4.0 mm, 7.0 mm, and 10.0 mm).
An additional calibration of fluorescence intensity vsaqueous microsphere concentration (no sand) was alsocarried out for measuring influent and effluent microsphereconcentrations in transport experiments. To obtain thiscalibration, 0.5 mL of microsphere solution (105-107 spheres/mL) was pipetted into a 24-well culture plate, the plate wasimaged with a 30 s exposure time, and the fluorescenceintensity in each well was determined.
Transport Experiments. A series of microsphere transportexperiments was conducted to demonstrate the versatilityof the imaging system for studying colloid transport. A syringepump (Harvard Apparatus, Holliston, MA) with 50-mL gas-tight glass syringes was used to inject microsphere solution,and a peristaltic pump (Cole Parmer, Vernon Hills, IL) wasused to inject microsphere-free solution. A three-way valvewas used to connect the two pumps and the flow cell.
In this series of experiments, only the center inlet andoutlet of the flow cell were used in an attempt to obtain 2Dtracer plumes. To better observe the deposition and transportof microspheres around the injection point, we extendedthe inlet horizontally about 15 mm into the flow cell byinserting a 1/16′′ (inner diameter) Teflon tubing into theoriginal center inlet. The flow cell was then wet packed withthe clean quartz sand (porosity ) 0.37) and conditioned withdegassed microsphere-free solution for 3 PVs at an averagelinear velocity of 16.0 m/d. The ionic strength of the condi-tioning solution was the same as the ionic strength of themicrosphere solution (Milli-Q water, 0.1, 1.0, or 10.0 mMNaCl) that would follow. The microsphere concentration was107 spheres/mL, and the pH was 6.5 for all four ionic strengths.
After conditioning the packed flow cell, microsphere solu-tion with a particular ionic strength was injected into theflow cell at a linear velocity of 8.0 m/d for 3 PVs. Microsphere-free solution of the same ionic strength was then injected atthe same velocity for 3 PVs to elute unattached microspheres.The flow rate was then doubled to examine the impact ofincreased velocity (increased hydrodynamic shear) on micro-sphere re-entrainment. After that, Milli-Q water was injected(3 PVs at 8.0 m/d) to examine the re-entrainment ofmicrospheres due to decreased ionic strength. Three morePVs of Milli-Q water were injected at an increased flow rate(16.0 m/d). Finally, the flow direction was reversed (16.0 m/dfor 1 PV) to examine the impact of flow direction onmicrosphere re-entrainment. Effluent samples were collectedwith a fraction collector for the entire duration of eachexperiment except for the reversed flow part of the experi-ment. The flow cell was thoroughly cleaned and repackedfor a different ionic strength microsphere solution.
The flow cell was imaged at a frequency of 20 pictures perPV for the entire experiment. The camera exposure time was30 s for most images and was reduced whenever saturationof the CCD-chip was noticed. Effluent microsphere con-centrations were determined to yield breakthrough-elutioncurves. Mass balance of microspheres in each transportexperiment at a particular stage was calculated by summa-rizing the total number of microspheres in the entire flowcell and in the effluent.
Results and DiscussionCalibrations. Fluorescence intensity was uniform across theflow cell after illumination reference correction (a flow cell
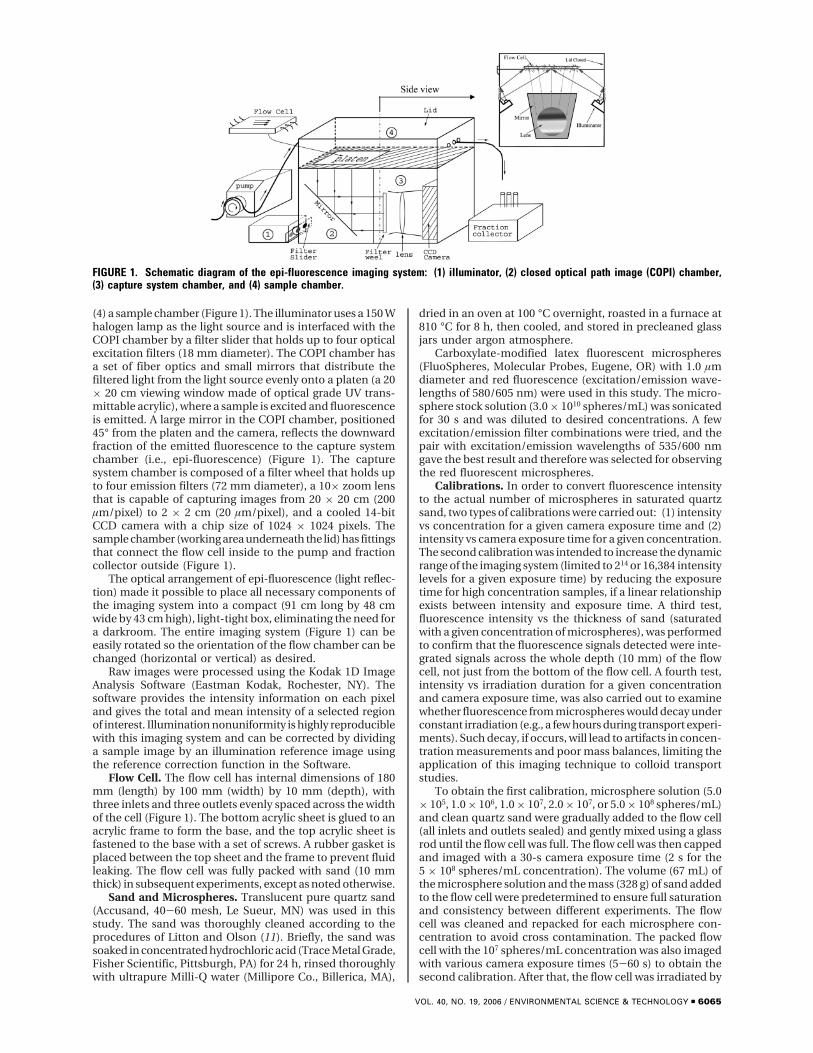
packed with clean sand and saturated with Milli-Q waterwas used as the reference). Therefore, the mean intensity(per pixel) of the entire flow cell was used to construct thecalibration curves. Fluorescence intensities and microsphereconcentrations (in saturated sand) showed excellent positivelinear relationship (r2 ) 1.00, Figure 2). The detection limitwas about 2.5 × 10⁵ spheres/mL in pore water for the 1 µmred fluorescent microspheres. The low detection limit allowedthe use of relatively low concentrations (e.g., 107 spheres/mL) of microspheres in transport experiments for realisticrepresentation of natural colloid concentrations (105-1014
particles/mL with microbial concentrations close to 105
particles/mL (12)) and for reduced cost for microspheres.
As expected, fluorescence intensity linearly increased withcamera exposure time for a given microsphere concentration(r2 ) 1.00, Figure 3). The second linear relationship allowedus to quantify high microsphere concentrations usingreduced exposure time, thereby increasing the dynamic rangeof the imaging system. For instance, an exposure time of 2 s(as opposed to 30 s) was used for the 5.0 × 10⁸ spheres/mLconcentration to avoid saturation of the CCD chip. The fluo-rescence intensity was then normalized to the 30 s exposuretime (i.e., raw intensity multiplied by a factor of 15) andplotted together with the rest data. The extended calibrationcurve (Figure 2) was still perfectly linear (r 2 ) 1.00), and theslope only changed slightly (<2%).
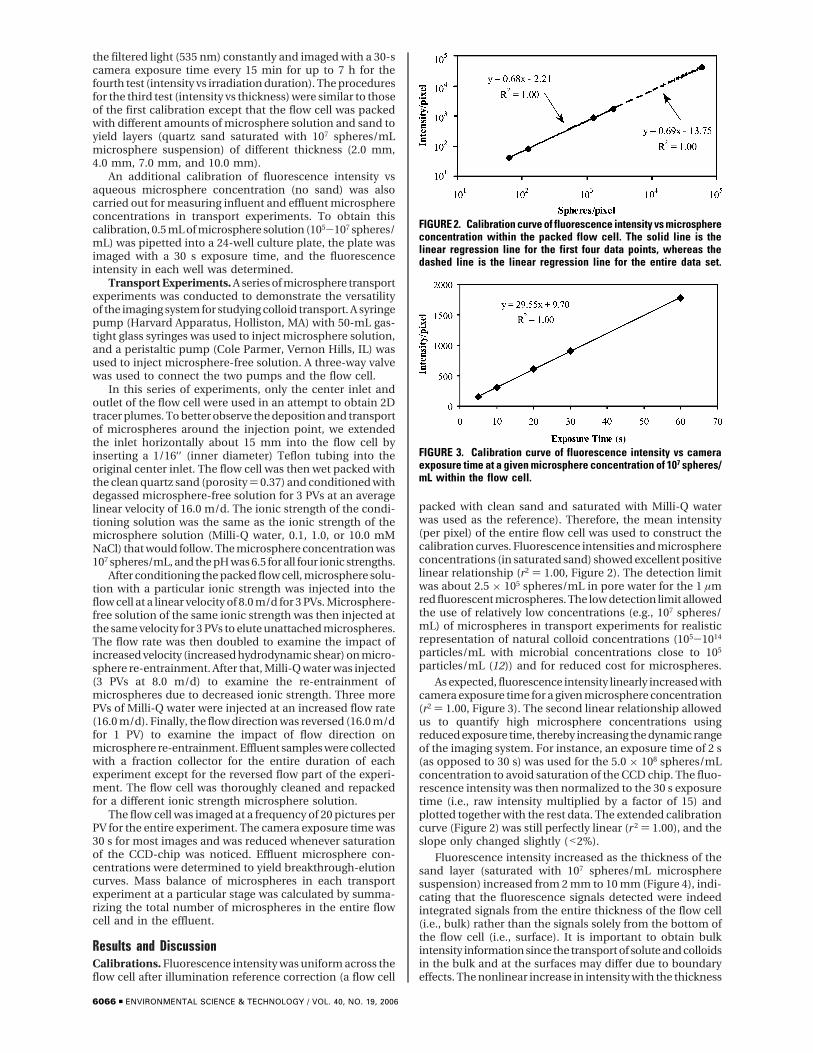
Fluorescence intensity increased as the thickness of thesand layer (saturated with 107 spheres/mL microspheresuspension) increased from 2 mm to 10 mm (Figure 4), indi-cating that the fluorescence signals detected were indeedintegrated signals from the entire thickness of the flow cell(i.e., bulk) rather than the signals solely from the bottom ofthe flow cell (i.e., surface). It is important to obtain bulkintensity information since the transport of solute and colloidsin the bulk and at the surfaces may differ due to boundaryeffects. The nonlinear increase in intensity with the thickness
FIGURE 2. Calibration curve of fluorescence intensity vs microsphereconcentration within the packed flow cell. The solid line is thelinear regression line for the first four data points, whereas thedashed line is the linear regression line for the entire data set.
FIGURE 3. Calibration curve of fluorescence intensity vs cameraexposure time at a given microsphere concentration of 107 spheres/mL within the flow cell.
6066 9 ENVIRONMENTAL SCIENCE & TECHNOLOGY / VOL. 40, NO. 19, 2006
of sand layer (saturated with microsphere suspension) waslikely caused by the decrease of incident (excitation) lightintensity (and subsequent fluorescence yield) with thicknessdue to incident light absorption, reflection, and refractionwithin the saturated sand layer. In addition, the emittedfluorescence continued to decay (again, due to absorption,reflection, refraction, and possibly inner filter effects (13)within the sand layer) as it traveled back to the bottom of theflow cell to reach the camera. The relationship betweenintensity and thickness (Figure 4) was not used to determinecolloid concentrations since the sand layer thickness waskept constant (10 mm) for all experiments except for theintensity vs thickness test.
The fluorescence of the microspheres did not decay forup to 7 h under constant irradiation with the 535 nm light(Figure 5). All transport experiments discussed here lastedless than 7 h, and therefore potential fluorescence decayover time was not a concern.
For aqueous samples (no sand), fluorescence intensitylinearly increased (r2)1.00) as the microsphere solution con-centration increased from 105 spheres/mL to 107 spheres/mL (Figure 6). The imaging system provided a rapid (100-200 aqueous samples per hour) and a sensitive (detectionlimit of 105 spheres/mL) means of quantifying aqueousmicrosphere concentrations, eliminating the need for other
instruments such as a flow cytometer to analyze influentand effluent samples.
Transport Experiments. The real time monitoring ofcolloid concentrations inside the flow cell and in the effluentallowed the calculation of colloid mass balances at any stageof a transport experiment. For instance, microsphere massbalances at the end of 3-PV injection, 6-PV NaCl elution, and6-PV Milli-Q water elution during the transport experimentsunder various ionic strengths are presented in Table S1 (seethe Supporting Information). Excellent mass recoveries (93-103%) were achieved in all experiments, demonstrating therobustness of the epi-fluorescence imaging method forstudying colloid transport.
The breakthrough-elution curves are shown in Figure 7.The maximum breakthrough (plateau) concentration de-creased as the ionic strength of the solution increased,consistent with the classic DLVO theory (14, 15). A concen-tration spike was observed during Milli-Q water elution, asthe result of the release of previously deposited microspheresdue to a sudden decrease in ionic strength. A decrease inionic strength would increase the thickness of electric doublelayer and increase the electrostatic repulsion between thesimilarly charged particle and collector surface, resulting inparticle re-entrainment (16).
Very few details about the migration of the re-entrainedmicrospheres were available from the breakthrough-elutioncurves. In contrast, a tremendous amount of information onthe deposition/re-entrainment of microspheres in the packedsand was available via the real-time imaging of the micro-spheres inside the flow cell. A representative image showingthe 2D distribution of microspheres during injection (10 mMionic strength experiment at 0.25 PV after injection) is pre-sented in Figure S1 (see Supporting Information). Micro-sphere concentrations at selected regions (dash rectanglesin Figure S1) were extracted and plotted against travel dis-tance to yield concentration distribution profiles (Figure 8).There were 20 distribution profiles available for each PV(20 images were taken every PV), but only a few were shownin Figure 8 for clarity. Notice that it would take hundredsof traditional column transport experiments to obtain thedistribution profiles provided by this single experiment withreal time imaging.
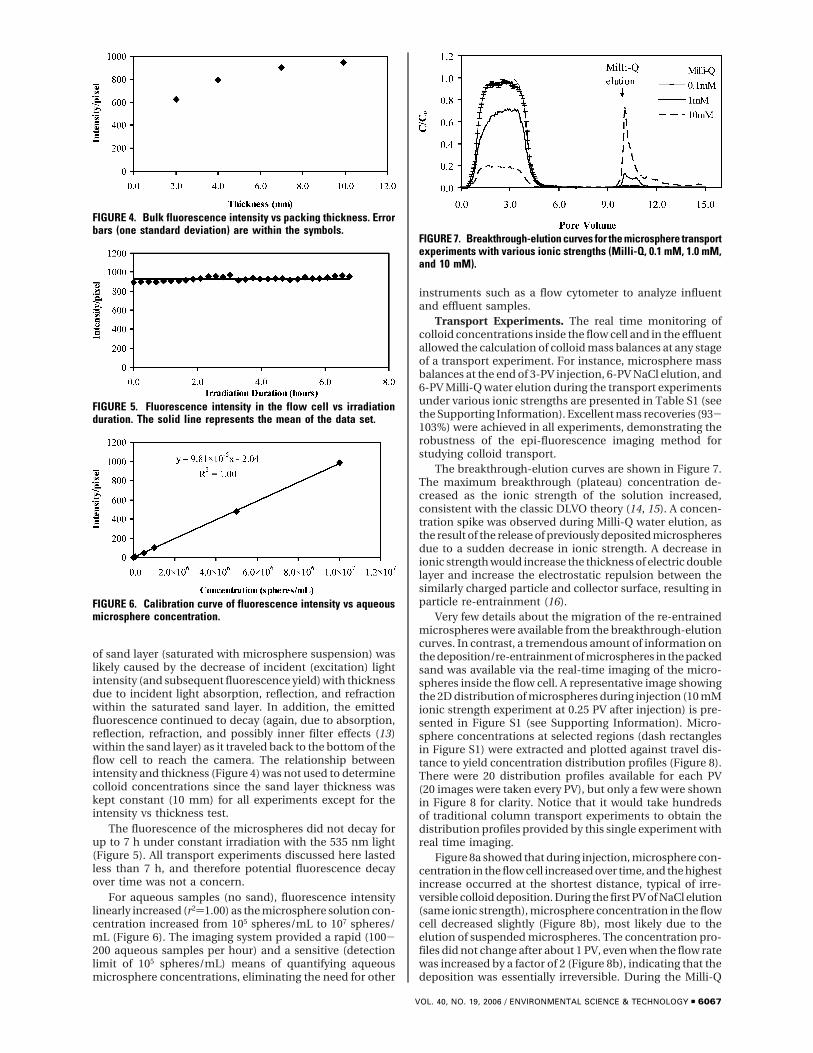
Figure 8a showed that during injection, microsphere con-centration in the flow cell increased over time, and the highestincrease occurred at the shortest distance, typical of irre-versible colloid deposition. During the first PV of NaCl elution(same ionic strength), microsphere concentration in the flowcell decreased slightly (Figure 8b), most likely due to theelution of suspended microspheres. The concentration pro-files did not change after about 1 PV, even when the flow ratewas increased by a factor of 2 (Figure 8b), indicating that thedeposition was essentially irreversible. During the Milli-Q
FIGURE 4. Bulk fluorescence intensity vs packing thickness. Errorbars (one standard deviation) are within the symbols.
FIGURE 5. Fluorescence intensity in the flow cell vs irradiationduration. The solid line represents the mean of the data set.
FIGURE 6. Calibration curve of fluorescence intensity vs aqueousmicrosphere concentration.
FIGURE 7. Breakthrough-elution curves for the microsphere transportexperiments with various ionic strengths (Milli-Q, 0.1 mM, 1.0 mM,and 10 mM).
VOL. 40, NO. 19, 2006 / ENVIRONMENTAL SCIENCE & TECHNOLOGY 9 6067
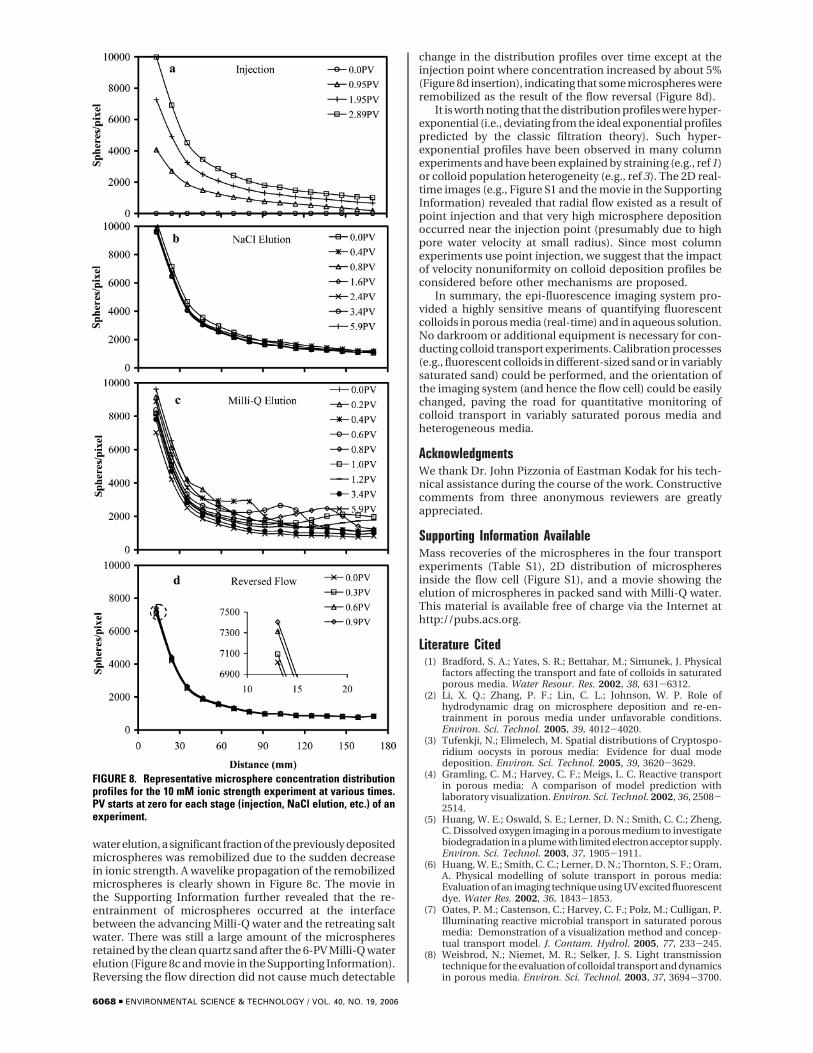
water elution, a significant fraction of the previously depositedmicrospheres was remobilized due to the sudden decreasein ionic strength. A wavelike propagation of the remobilizedmicrospheres is clearly shown in Figure 8c. The movie inthe Supporting Information further revealed that the re-entrainment of microspheres occurred at the interfacebetween the advancing Milli-Q water and the retreating saltwater. There was still a large amount of the microspheresretained by the clean quartz sand after the 6-PV Milli-Q waterelution (Figure 8c and movie in the Supporting Information).Reversing the flow direction did not cause much detectable
change in the distribution profiles over time except at theinjection point where concentration increased by about 5%(Figure 8d insertion), indicating that some microspheres wereremobilized as the result of the flow reversal (Figure 8d).
It is worth noting that the distribution profiles were hyper-exponential (i.e., deviating from the ideal exponential profilespredicted by the classic filtration theory). Such hyper-exponential profiles have been observed in many columnexperiments and have been explained by straining (e.g., ref 1)or colloid population heterogeneity (e.g., ref 3). The 2D real-time images (e.g., Figure S1 and the movie in the SupportingInformation) revealed that radial flow existed as a result ofpoint injection and that very high microsphere depositionoccurred near the injection point (presumably due to highpore water velocity at small radius). Since most columnexperiments use point injection, we suggest that the impactof velocity nonuniformity on colloid deposition profiles beconsidered before other mechanisms are proposed.
In summary, the epi-fluorescence imaging system pro-vided a highly sensitive means of quantifying fluorescentcolloids in porous media (real-time) and in aqueous solution.No darkroom or additional equipment is necessary for con-ducting colloid transport experiments. Calibration processes(e.g., fluorescent colloids in different-sized sand or in variablysaturated sand) could be performed, and the orientation ofthe imaging system (and hence the flow cell) could be easilychanged, paving the road for quantitative monitoring ofcolloid transport in variably saturated porous media andheterogeneous media.
AcknowledgmentsWe thank Dr. John Pizzonia of Eastman Kodak for his tech-nical assistance during the course of the work. Constructivecomments from three anonymous reviewers are greatlyappreciated.
Supporting Information AvailableMass recoveries of the microspheres in the four transportexperiments (Table S1), 2D distribution of microspheresinside the flow cell (Figure S1), and a movie showing theelution of microspheres in packed sand with Milli-Q water.This material is available free of charge via the Internet athttp://pubs.acs.org.
Literature Cited(1) Bradford, S. A.; Yates, S. R.; Bettahar, M.; Simunek, J. Physical
factors affecting the transport and fate of colloids in saturatedporous media. Water Resour. Res. 2002, 38, 631-6312.
(2) Li, X. Q.; Zhang, P. F.; Lin, C. L.; Johnson, W. P. Role ofhydrodynamic drag on microsphere deposition and re-en-trainment in porous media under unfavorable conditions.Environ. Sci. Technol. 2005, 39, 4012-4020.
(3) Tufenkji, N.; Elimelech, M. Spatial distributions of Cryptospo-ridium oocysts in porous media: Evidence for dual modedeposition. Environ. Sci. Technol. 2005, 39, 3620-3629.
(4) Gramling, C. M.; Harvey, C. F.; Meigs, L. C. Reactive transportin porous media: A comparison of model prediction withlaboratory visualization. Environ. Sci. Technol. 2002, 36, 2508-2514.
(5) Huang, W. E.; Oswald, S. E.; Lerner, D. N.; Smith, C. C.; Zheng,C. Dissolved oxygen imaging in a porous medium to investigatebiodegradation in a plume with limited electron acceptor supply.Environ. Sci. Technol. 2003, 37, 1905-1911.
(6) Huang, W. E.; Smith, C. C.; Lerner, D. N.; Thornton, S. F.; Oram,A. Physical modelling of solute transport in porous media:Evaluation of an imaging technique using UV excited fluorescentdye. Water Res. 2002, 36, 1843-1853.
(7) Oates, P. M.; Castenson, C.; Harvey, C. F.; Polz, M.; Culligan, P.Illuminating reactive microbial transport in saturated porousmedia: Demonstration of a visualization method and concep-tual transport model. J. Contam. Hydrol. 2005, 77, 233-245.
(8) Weisbrod, N.; Niemet, M. R.; Selker, J. S. Light transmissiontechnique for the evaluation of colloidal transport and dynamicsin porous media. Environ. Sci. Technol. 2003, 37, 3694-3700.
FIGURE 8. Representative microsphere concentration distributionprofiles for the 10 mM ionic strength experiment at various times.PV starts at zero for each stage (injection, NaCl elution, etc.) of anexperiment.
6068 9 ENVIRONMENTAL SCIENCE & TECHNOLOGY / VOL. 40, NO. 19, 2006

(9) Zinn, B.; Meigs, L. C.; Harvey, C. F.; Haggerty, R.; Peplinski, W.J.; Von Schwerin, C. F. Experimental visualization of solutetransport and mass transfer processes in two-dimensionalconductivity fields with connected regions of high conductivity.Environ. Sci. Technol. 2004, 38, 3916-3926.
(10) Longhurst, R. S. Geometrical and Physical Optics; LongmanInc.: New York, 1973.
(11) Litton, G. M.; Olson, T. M. Colloid deposition rates on silica bedmedia and artifacts related to collector surface preparationmethods. Environ. Sci. Technol. 1993, 27, 185-193.
(12) Kim, J. I. Actinide colloid generation in groundwater. Radiochim.Acta 1991, 52/53, 71-81.
(13) Yuan, P.; Walt, D. R. Calculation for fluorescence modulationby absorbing species and its application to measurements usingoptical fibers. Anal. Chem. 1987, 19, 2391-2394.
(14) Derjaguin, B. V.; Landau, L. Theory of the stability of stronglycharged lyophobic sols and of the adhesion of strongly chargedparticles in solutions of electrolytes. Acta Physicochim. (USSR)1941, 14, 633-662.
(15) Verwey, E. J. W.; Overbeek, J. T. G. Theory of the stability oflyophobic colloids; Elsevier: Amsterdam, 1948.
(16) Ryan, J. N.; Elimelech, M. Colloid mobilization and transportin groundwater. Colloids Surf., A 1996, 107, 1-56.
Received for review May 9, 2006. Revised manuscript re-ceived July 25, 2006. Accepted July 26, 2006.
ES061104Y
VOL. 40, NO. 19, 2006 / ENVIRONMENTAL SCIENCE & TECHNOLOGY 9 6069