environmental performance evolution of municipal solid
TRANSCRIPT
HAL Id: hal-01919089https://hal-mines-albi.archives-ouvertes.fr/hal-01919089
Submitted on 17 Jan 2019
HAL is a multi-disciplinary open accessarchive for the deposit and dissemination of sci-entific research documents, whether they are pub-lished or not. The documents may come fromteaching and research institutions in France orabroad, or from public or private research centers.
L’archive ouverte pluridisciplinaire HAL, estdestinée au dépôt et à la diffusion de documentsscientifiques de niveau recherche, publiés ou non,émanant des établissements d’enseignement et derecherche français ou étrangers, des laboratoirespublics ou privés.
Environmental performance evolution of municipal solidwaste management by life cycle assessment in
Hangzhou, ChinaZhaozhi Zhou, Yuanjun Tang, Jun Dong, Yong Chi, Mingjiang Ni, Li Nan,
Yongfang Zhang
To cite this version:Zhaozhi Zhou, Yuanjun Tang, Jun Dong, Yong Chi, Mingjiang Ni, et al.. Environmental performanceevolution of municipal solid waste management by life cycle assessment in Hangzhou, China. Journalof Environmental Management, Elsevier, 2018, 227, pp.23-33. �10.1016/j.jenvman.2018.08.083�. �hal-01919089�
Contents lists available at ScienceDirect
Journal of Environmental Management
journal homepage: www.elsevier.com/locate/jenvman
Research article
Environmental performance evolution of municipal solid waste managementby life cycle assessment in Hangzhou, China
Zhaozhi Zhoua, Yuanjun Tanga, Jun Dongb, Yong Chia,∗, Mingjiang Nia, Nan Lia, Yongfang Zhangc
a State Key Laboratory of Clean Energy Utilisation, Zhejiang University, Hangzhou, Chinab Centre RAPSODEE, Ecole des Mines Albi, Campus Jarlard, 81013 Albi Cedex, FrancecHangzhou Municipal Solid Waste Disposal Supervision Center, Hangzhou, China
A R T I C L E I N F O
Keywords:Waste managementSource-separated collectionEvolutionLife cycle assessmentEnvironmental impact
A B S T R A C T
There is a significant increase in the volume of Municipal Solid Waste (MSW) that is being generated across theworld. Faced with this challenge and the associated environmental issues, MSW management (MSWM) inHangzhou, China has made various positive changes in order to adapt. During the last 10 years, MSW source-separated collection was launched, which was accompanied by estimations of a new waste-to-energy (in-cineration) plant and food waste separate treatment methods. The aim of this study is to investigate the relatedevolution of the environmental performance of MSWM system in Hangzhou from 2007 to 2016 by using lifecycle assessment (LCA). LCA is a scientific tool to quantify factors such as environmental impacts from a lifecycle perspective and provides valuable inputs to decision-makers, thus leading to proper strategy determina-tion. Results illustrate that the annual environmental performance has an overall downward trend with someminor fluctuations. The MSWM system in 2010 had the lowest weighted result of 0.0349 PE/t-MSW due to thehighest incineration rate and implementation of source-separated collection. Incineration shows better en-vironmental performance than landfill, while source-separated collection can benefit the MSWM. While theimportance of source-separated collection is significant, it is also essential to concentrate on the food wastetreatment technology. It is suggested that anaerobic digestion (AD) can be considered as a primary option forfood waste treatment.
1. Introduction
The amount of municipal solid waste (MSW) in China has increasedrapidly in the last few decades and China now is the largest MSWgenerator in the world (Zhou et al., 2018). In 2015, the annual gener-ated MSW has reached 191.4 million tonnes, with a ten-year cumulativegrowth rate of 122.9% (CSYCC, 2016). The increasing amount andcomplex components of MSW impose the evolution of municipal solidwaste management (MSWM). Source-separated collection is consideredas a desirable option to achieve the principle of “reducing quantity”“harmless” “reclamation” for waste management (Han and Zhang,2017; Ma et al., 2017; Ripa et al., 2017). In 2017, an implementationplan regarding MSW source-separated collection was launched byChina's national development and reform commission. At present,source-separated collection has been implemented in many cities, andseveral corresponding regulations and facilities have been established.New policies and standards on waste treatment enable the formal andscientific management. In general, various strategies aiming at
enhancing MSWM have been adopted in the last few years, but theirrealistic effects on environmental improvement need to be examined.
To assess the environmental performance scientifically, life cycleassessment (LCA) is widely adopted. LCA is a systematic methodologyconsidering all inputs and outputs of materials and energy ‘from cradleto grave’ (ISO, 2006a,b; Jeswani and Azapagic, 2016). LCA can quantifythe environmental impacts and support the decision-makers to identifythe appropriate strategy.
Until now, LCA has been conducted in various waste managementsystems. Dong et al. (2014) compared the incineration, landfill with andwithout energy recovery and concluded the incineration was moresuitable for MSWM. Havukainen et al. (2017) suggested that refusederived fuel (RDF) production could improve the environmental im-pacts on waste incineration based on LCA results. Advanced WtEtechnologies, for instance pyrolysis, gasification and plasma, also havebeen examined by LCA in recent years. Evangelisti et al. (2015) utilizedLCA to compare the two-stage gasification and plasma with conven-tional WtE technology. Arena et al. (2015) evaluated a vertical shaft
https://doi.org/10.1016/j.jenvman.2018.08.083Received 8 January 2018; Received in revised form 13 July 2018; Accepted 20 August 2018
∗ Corresponding author.E-mail address: [email protected] (Y. Chi).
Journal of Environmental Management 227 (2018) 23–33
0301-4797/ © 2018 Elsevier Ltd. All rights reserved.
T
gasifier coupled with direct melting and suggestions for improvementin technological solutions were put forward for further development.Pyrolysis–gasification was also modeled and assessed in toxic impactsand non-toxic impacts (Zaman, 2013).
Based on the WtE case-study LCA scenarios from 1995 to 2013, aconcrete overview of assumptions and modeling choices for WtE wasprovided and some practical recommendations were put forward for thefurther LCA study (Astrup et al., 2015). Zhou et al. (2018) also sum-marized the ranges of the environmental results of different WtE tech-niques worldwide. Othman et al. (2013) analyzed the LCA scenarios inAsian MSW management systems and the results were used as a re-ference for decisions on strategies for waste management.
However, most researches focus on the environmental impacts ofwaste treatment technologies, but little attention has been paid to theevolution of the MSWM system with time. Ibáñez-Forés et al. (2018)assessed the temporal evolution of the environmental performance ofMSWM system in João Pessoa, Brazil, and focused on the effect of door-to-door selective collection of recyclable waste; however, its evolutionwas mainly caused by the change of MSW composition and the popu-lation served by each sorting unit; besides, recycle and landfill were theonly treatment methods in the system. Nowadays, WtE technologiesplay an important role in MSWM (Zhou et al., 2018). The integratedMSWM system with WtE technologies is more complex and its en-vironmental performance evolution can reflect meaningful results fordecision-makers.
The goal of this study is to analyze the environmental performanceevolution of integrated MSWM system during the last decade (i.e., from2007 to 2016) in Hangzhou, China. The evolution of MSWM is modeledand annual MSWM strategies are included. The changes of environ-mental performance with each passing year are evaluated by LCA. Theresults could give a better understanding of the environmental perfor-mance of the MSWM system and reflect effects of MSWM strategies.Source-separated collection and food waste treatment technologies arefurther analyzed in sensitivity analysis and the results can be served as asupport for the future MSWM development.
2. MSWM system in Hangzhou
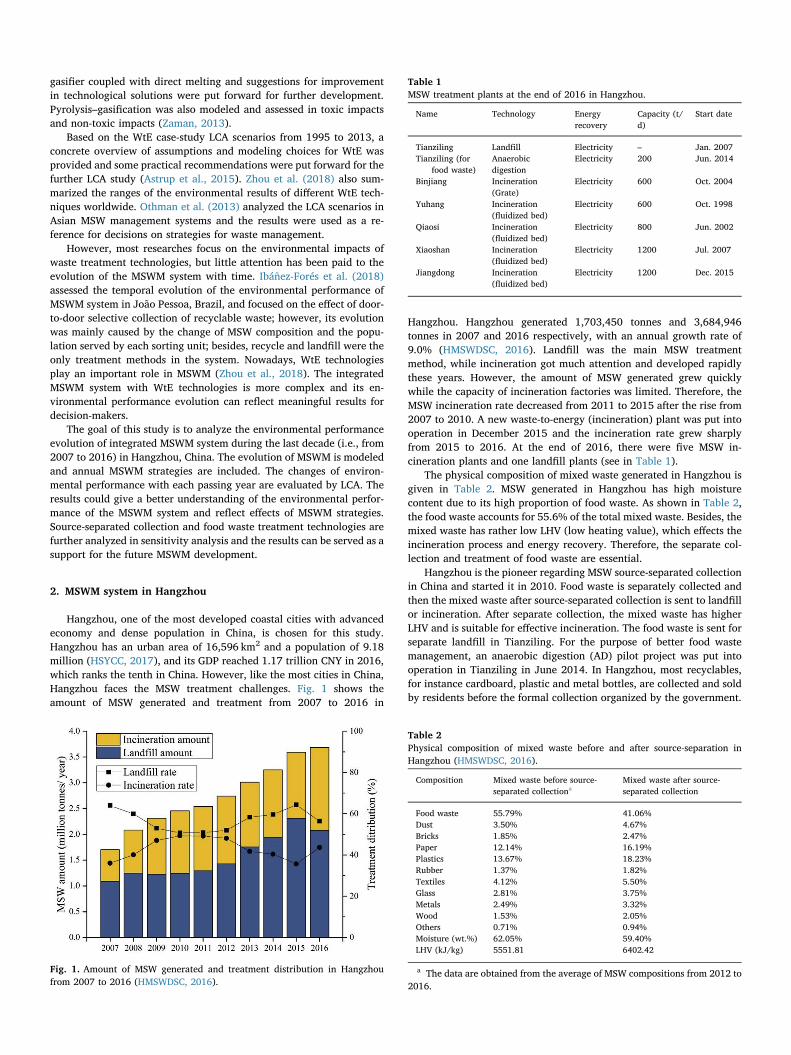
Hangzhou, one of the most developed coastal cities with advancedeconomy and dense population in China, is chosen for this study.Hangzhou has an urban area of 16,596 km2 and a population of 9.18million (HSYCC, 2017), and its GDP reached 1.17 trillion CNY in 2016,which ranks the tenth in China. However, like the most cities in China,Hangzhou faces the MSW treatment challenges. Fig. 1 shows theamount of MSW generated and treatment from 2007 to 2016 in
Hangzhou. Hangzhou generated 1,703,450 tonnes and 3,684,946tonnes in 2007 and 2016 respectively, with an annual growth rate of9.0% (HMSWDSC, 2016). Landfill was the main MSW treatmentmethod, while incineration got much attention and developed rapidlythese years. However, the amount of MSW generated grew quicklywhile the capacity of incineration factories was limited. Therefore, theMSW incineration rate decreased from 2011 to 2015 after the rise from2007 to 2010. A new waste-to-energy (incineration) plant was put intooperation in December 2015 and the incineration rate grew sharplyfrom 2015 to 2016. At the end of 2016, there were five MSW in-cineration plants and one landfill plants (see in Table 1).
The physical composition of mixed waste generated in Hangzhou isgiven in Table 2. MSW generated in Hangzhou has high moisturecontent due to its high proportion of food waste. As shown in Table 2,the food waste accounts for 55.6% of the total mixed waste. Besides, themixed waste has rather low LHV (low heating value), which effects theincineration process and energy recovery. Therefore, the separate col-lection and treatment of food waste are essential.
Hangzhou is the pioneer regarding MSW source-separated collectionin China and started it in 2010. Food waste is separately collected andthen the mixed waste after source-separated collection is sent to landfillor incineration. After separate collection, the mixed waste has higherLHV and is suitable for effective incineration. The food waste is sent forseparate landfill in Tianziling. For the purpose of better food wastemanagement, an anaerobic digestion (AD) pilot project was put intooperation in Tianziling in June 2014. In Hangzhou, most recyclables,for instance cardboard, plastic and metal bottles, are collected and soldby residents before the formal collection organized by the government.
Fig. 1. Amount of MSW generated and treatment distribution in Hangzhoufrom 2007 to 2016 (HMSWDSC, 2016).
Table 1MSW treatment plants at the end of 2016 in Hangzhou.
Name Technology Energyrecovery
Capacity (t/d)
Start date
Tianziling Landfill Electricity – Jan. 2007Tianziling (for
food waste)Anaerobicdigestion
Electricity 200 Jun. 2014
Binjiang Incineration(Grate)
Electricity 600 Oct. 2004
Yuhang Incineration(fluidized bed)
Electricity 600 Oct. 1998
Qiaosi Incineration(fluidized bed)
Electricity 800 Jun. 2002
Xiaoshan Incineration(fluidized bed)
Electricity 1200 Jul. 2007
Jiangdong Incineration(fluidized bed)
Electricity 1200 Dec. 2015
Table 2Physical composition of mixed waste before and after source-separation inHangzhou (HMSWDSC, 2016).
Composition Mixed waste before source-separated collectiona
Mixed waste after source-separated collection
Food waste 55.79% 41.06%Dust 3.50% 4.67%Bricks 1.85% 2.47%Paper 12.14% 16.19%Plastics 13.67% 18.23%Rubber 1.37% 1.82%Textiles 4.12% 5.50%Glass 2.81% 3.75%Metals 2.49% 3.32%Wood 1.53% 2.05%Others 0.71% 0.94%Moisture (wt.%) 62.05% 59.40%LHV (kJ/kg) 5551.81 6402.42
a The data are obtained from the average of MSW compositions from 2012 to2016.
Z. Zhou et al. Journal of Environmental Management 227 (2018) 23–33
24
Thus, only a small proportion of recyclables flow into the municipalcollection system. This informal collection is common in China (Steueret al., 2017; Zhang and Wen, 2014). Therefore, source-separated col-lection for recyclables is not considered in this study.
3. Methodology
According to ISO 14040 standards, the LCA consists of four phases:goal and scope definition, life cycle inventory (LCI), life cycle impactassessment (LCIA), and interpretation (ISO, 2006a,b).
3.1. Goal and scope definition
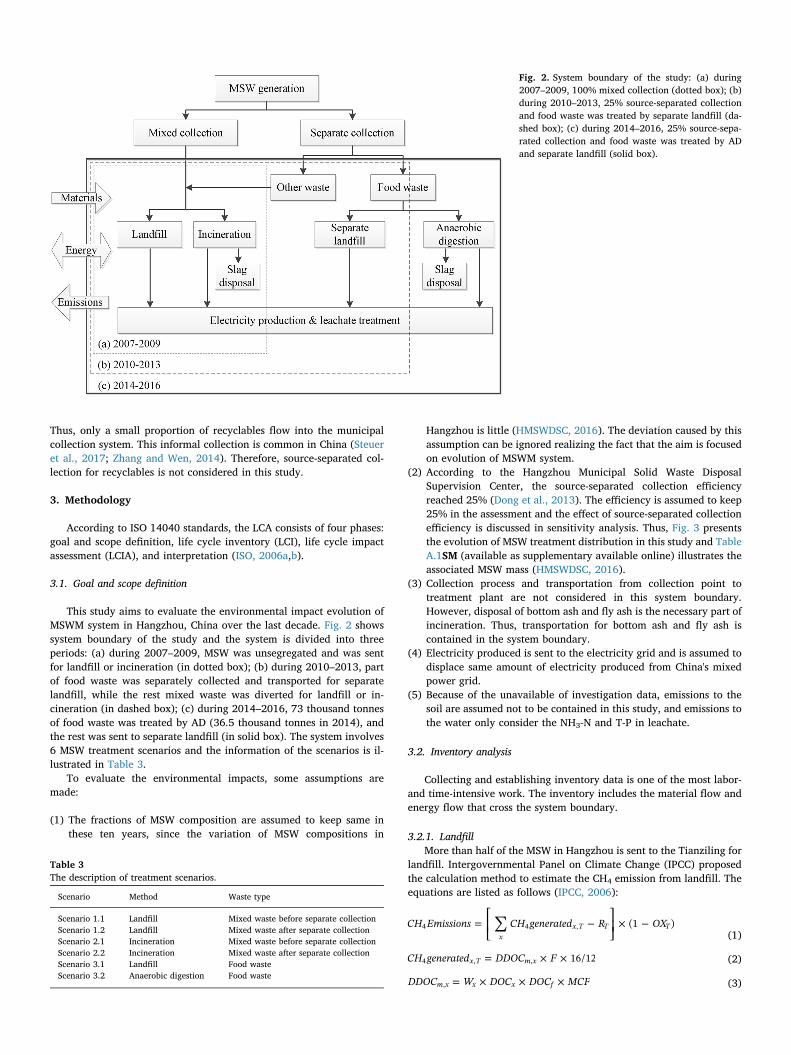
This study aims to evaluate the environmental impact evolution ofMSWM system in Hangzhou, China over the last decade. Fig. 2 showssystem boundary of the study and the system is divided into threeperiods: (a) during 2007–2009, MSW was unsegregated and was sentfor landfill or incineration (in dotted box); (b) during 2010–2013, partof food waste was separately collected and transported for separatelandfill, while the rest mixed waste was diverted for landfill or in-cineration (in dashed box); (c) during 2014–2016, 73 thousand tonnesof food waste was treated by AD (36.5 thousand tonnes in 2014), andthe rest was sent to separate landfill (in solid box). The system involves6 MSW treatment scenarios and the information of the scenarios is il-lustrated in Table 3.
To evaluate the environmental impacts, some assumptions aremade:
(1) The fractions of MSW composition are assumed to keep same inthese ten years, since the variation of MSW compositions in
Hangzhou is little (HMSWDSC, 2016). The deviation caused by thisassumption can be ignored realizing the fact that the aim is focusedon evolution of MSWM system.
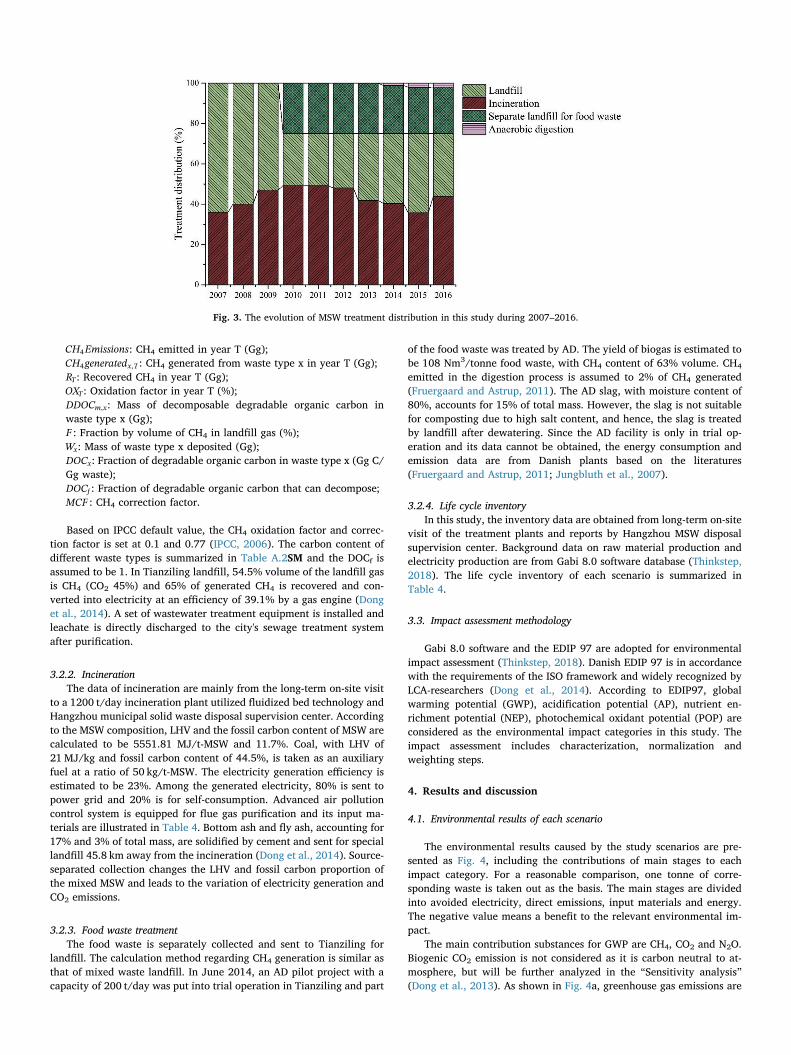
(2) According to the Hangzhou Municipal Solid Waste DisposalSupervision Center, the source-separated collection efficiencyreached 25% (Dong et al., 2013). The efficiency is assumed to keep25% in the assessment and the effect of source-separated collectionefficiency is discussed in sensitivity analysis. Thus, Fig. 3 presentsthe evolution of MSW treatment distribution in this study and TableA.1SM (available as supplementary available online) illustrates theassociated MSW mass (HMSWDSC, 2016).
(3) Collection process and transportation from collection point totreatment plant are not considered in this system boundary.However, disposal of bottom ash and fly ash is the necessary part ofincineration. Thus, transportation for bottom ash and fly ash iscontained in the system boundary.
(4) Electricity produced is sent to the electricity grid and is assumed todisplace same amount of electricity produced from China's mixedpower grid.
(5) Because of the unavailable of investigation data, emissions to thesoil are assumed not to be contained in this study, and emissions tothe water only consider the NH3-N and T-P in leachate.
3.2. Inventory analysis
Collecting and establishing inventory data is one of the most labor-and time-intensive work. The inventory includes the material flow andenergy flow that cross the system boundary.
3.2.1. LandfillMore than half of the MSW in Hangzhou is sent to the Tianziling for
landfill. Intergovernmental Panel on Climate Change (IPCC) proposedthe calculation method to estimate the CH4 emission from landfill. Theequations are listed as follows (IPCC, 2006):
∑= ⎡
⎣⎢ − ⎤
⎦⎥ × −CH Emissions CH generated R OX(1 )
xx T T T4 4 ,
(1)
= × ×CH generated DDOC F 16/12x T m x4 , , (2)
= × × ×DDOC W DOC DOC MCFm x x x f, (3)
Fig. 2. System boundary of the study: (a) during2007–2009, 100% mixed collection (dotted box); (b)during 2010–2013, 25% source-separated collectionand food waste was treated by separate landfill (da-shed box); (c) during 2014–2016, 25% source-sepa-rated collection and food waste was treated by ADand separate landfill (solid box).
Table 3The description of treatment scenarios.
Scenario Method Waste type
Scenario 1.1 Landfill Mixed waste before separate collectionScenario 1.2 Landfill Mixed waste after separate collectionScenario 2.1 Incineration Mixed waste before separate collectionScenario 2.2 Incineration Mixed waste after separate collectionScenario 3.1 Landfill Food wasteScenario 3.2 Anaerobic digestion Food waste
Z. Zhou et al. Journal of Environmental Management 227 (2018) 23–33
25
CH Emissions4 : CH4 emitted in year T (Gg);CH generatedx T4 , : CH4 generated from waste type x in year T (Gg);RT : Recovered CH4 in year T (Gg);OXT : Oxidation factor in year T (%);DDOCm x, : Mass of decomposable degradable organic carbon inwaste type x (Gg);F : Fraction by volume of CH4 in landfill gas (%);Wx: Mass of waste type x deposited (Gg);DOCx : Fraction of degradable organic carbon in waste type x (Gg C/Gg waste);DOCf : Fraction of degradable organic carbon that can decompose;MCF : CH4 correction factor.
Based on IPCC default value, the CH4 oxidation factor and correc-tion factor is set at 0.1 and 0.77 (IPCC, 2006). The carbon content ofdifferent waste types is summarized in Table A.2SM and the DOCf isassumed to be 1. In Tianziling landfill, 54.5% volume of the landfill gasis CH4 (CO2 45%) and 65% of generated CH4 is recovered and con-verted into electricity at an efficiency of 39.1% by a gas engine (Donget al., 2014). A set of wastewater treatment equipment is installed andleachate is directly discharged to the city's sewage treatment systemafter purification.
3.2.2. IncinerationThe data of incineration are mainly from the long-term on-site visit
to a 1200 t/day incineration plant utilized fluidized bed technology andHangzhou municipal solid waste disposal supervision center. Accordingto the MSW composition, LHV and the fossil carbon content of MSW arecalculated to be 5551.81 MJ/t-MSW and 11.7%. Coal, with LHV of21MJ/kg and fossil carbon content of 44.5%, is taken as an auxiliaryfuel at a ratio of 50 kg/t-MSW. The electricity generation efficiency isestimated to be 23%. Among the generated electricity, 80% is sent topower grid and 20% is for self-consumption. Advanced air pollutioncontrol system is equipped for flue gas purification and its input ma-terials are illustrated in Table 4. Bottom ash and fly ash, accounting for17% and 3% of total mass, are solidified by cement and sent for speciallandfill 45.8 km away from the incineration (Dong et al., 2014). Source-separated collection changes the LHV and fossil carbon proportion ofthe mixed MSW and leads to the variation of electricity generation andCO2 emissions.
3.2.3. Food waste treatmentThe food waste is separately collected and sent to Tianziling for
landfill. The calculation method regarding CH4 generation is similar asthat of mixed waste landfill. In June 2014, an AD pilot project with acapacity of 200 t/day was put into trial operation in Tianziling and part
of the food waste was treated by AD. The yield of biogas is estimated tobe 108 Nm3/tonne food waste, with CH4 content of 63% volume. CH4
emitted in the digestion process is assumed to 2% of CH4 generated(Fruergaard and Astrup, 2011). The AD slag, with moisture content of80%, accounts for 15% of total mass. However, the slag is not suitablefor composting due to high salt content, and hence, the slag is treatedby landfill after dewatering. Since the AD facility is only in trial op-eration and its data cannot be obtained, the energy consumption andemission data are from Danish plants based on the literatures(Fruergaard and Astrup, 2011; Jungbluth et al., 2007).
3.2.4. Life cycle inventoryIn this study, the inventory data are obtained from long-term on-site
visit of the treatment plants and reports by Hangzhou MSW disposalsupervision center. Background data on raw material production andelectricity production are from Gabi 8.0 software database (Thinkstep,2018). The life cycle inventory of each scenario is summarized inTable 4.
3.3. Impact assessment methodology
Gabi 8.0 software and the EDIP 97 are adopted for environmentalimpact assessment (Thinkstep, 2018). Danish EDIP 97 is in accordancewith the requirements of the ISO framework and widely recognized byLCA-researchers (Dong et al., 2014). According to EDIP97, globalwarming potential (GWP), acidification potential (AP), nutrient en-richment potential (NEP), photochemical oxidant potential (POP) areconsidered as the environmental impact categories in this study. Theimpact assessment includes characterization, normalization andweighting steps.
4. Results and discussion
4.1. Environmental results of each scenario
The environmental results caused by the study scenarios are pre-sented as Fig. 4, including the contributions of main stages to eachimpact category. For a reasonable comparison, one tonne of corre-sponding waste is taken out as the basis. The main stages are dividedinto avoided electricity, direct emissions, input materials and energy.The negative value means a benefit to the relevant environmental im-pact.
The main contribution substances for GWP are CH4, CO2 and N2O.Biogenic CO2 emission is not considered as it is carbon neutral to at-mosphere, but will be further analyzed in the “Sensitivity analysis”(Dong et al., 2013). As shown in Fig. 4a, greenhouse gas emissions are
Fig. 3. The evolution of MSW treatment distribution in this study during 2007–2016.
Z. Zhou et al. Journal of Environmental Management 227 (2018) 23–33
26
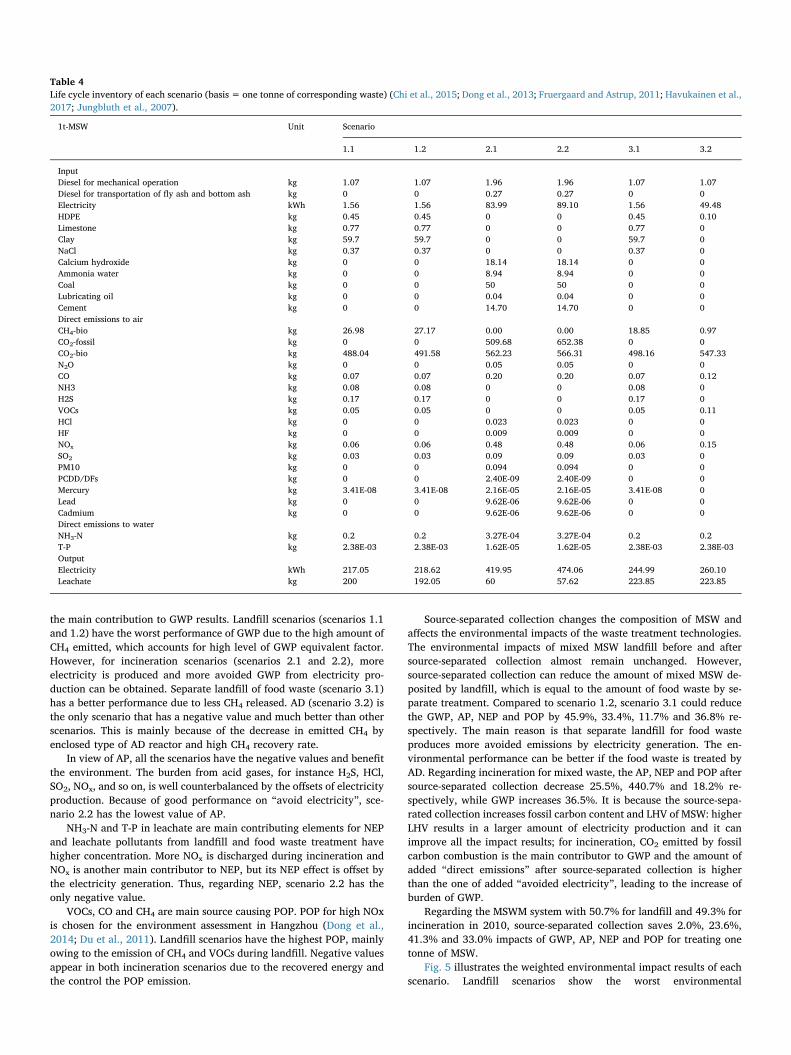
the main contribution to GWP results. Landfill scenarios (scenarios 1.1and 1.2) have the worst performance of GWP due to the high amount ofCH4 emitted, which accounts for high level of GWP equivalent factor.However, for incineration scenarios (scenarios 2.1 and 2.2), moreelectricity is produced and more avoided GWP from electricity pro-duction can be obtained. Separate landfill of food waste (scenario 3.1)has a better performance due to less CH4 released. AD (scenario 3.2) isthe only scenario that has a negative value and much better than otherscenarios. This is mainly because of the decrease in emitted CH4 byenclosed type of AD reactor and high CH4 recovery rate.
In view of AP, all the scenarios have the negative values and benefitthe environment. The burden from acid gases, for instance H2S, HCl,SO2, NOx, and so on, is well counterbalanced by the offsets of electricityproduction. Because of good performance on “avoid electricity”, sce-nario 2.2 has the lowest value of AP.
NH3-N and T-P in leachate are main contributing elements for NEPand leachate pollutants from landfill and food waste treatment havehigher concentration. More NOx is discharged during incineration andNOx is another main contributor to NEP, but its NEP effect is offset bythe electricity generation. Thus, regarding NEP, scenario 2.2 has theonly negative value.
VOCs, CO and CH4 are main source causing POP. POP for high NOxis chosen for the environment assessment in Hangzhou (Dong et al.,2014; Du et al., 2011). Landfill scenarios have the highest POP, mainlyowing to the emission of CH4 and VOCs during landfill. Negative valuesappear in both incineration scenarios due to the recovered energy andthe control the POP emission.
Source-separated collection changes the composition of MSW andaffects the environmental impacts of the waste treatment technologies.The environmental impacts of mixed MSW landfill before and aftersource-separated collection almost remain unchanged. However,source-separated collection can reduce the amount of mixed MSW de-posited by landfill, which is equal to the amount of food waste by se-parate treatment. Compared to scenario 1.2, scenario 3.1 could reducethe GWP, AP, NEP and POP by 45.9%, 33.4%, 11.7% and 36.8% re-spectively. The main reason is that separate landfill for food wasteproduces more avoided emissions by electricity generation. The en-vironmental performance can be better if the food waste is treated byAD. Regarding incineration for mixed waste, the AP, NEP and POP aftersource-separated collection decrease 25.5%, 440.7% and 18.2% re-spectively, while GWP increases 36.5%. It is because the source-sepa-rated collection increases fossil carbon content and LHV of MSW: higherLHV results in a larger amount of electricity production and it canimprove all the impact results; for incineration, CO2 emitted by fossilcarbon combustion is the main contributor to GWP and the amount ofadded “direct emissions” after source-separated collection is higherthan the one of added “avoided electricity”, leading to the increase ofburden of GWP.
Regarding the MSWM system with 50.7% for landfill and 49.3% forincineration in 2010, source-separated collection saves 2.0%, 23.6%,41.3% and 33.0% impacts of GWP, AP, NEP and POP for treating onetonne of MSW.
Fig. 5 illustrates the weighted environmental impact results of eachscenario. Landfill scenarios show the worst environmental
Table 4Life cycle inventory of each scenario (basis= one tonne of corresponding waste) (Chi et al., 2015; Dong et al., 2013; Fruergaard and Astrup, 2011; Havukainen et al.,2017; Jungbluth et al., 2007).
1t-MSW Unit Scenario
1.1 1.2 2.1 2.2 3.1 3.2
InputDiesel for mechanical operation kg 1.07 1.07 1.96 1.96 1.07 1.07Diesel for transportation of fly ash and bottom ash kg 0 0 0.27 0.27 0 0Electricity kWh 1.56 1.56 83.99 89.10 1.56 49.48HDPE kg 0.45 0.45 0 0 0.45 0.10Limestone kg 0.77 0.77 0 0 0.77 0Clay kg 59.7 59.7 0 0 59.7 0NaCl kg 0.37 0.37 0 0 0.37 0Calcium hydroxide kg 0 0 18.14 18.14 0 0Ammonia water kg 0 0 8.94 8.94 0 0Coal kg 0 0 50 50 0 0Lubricating oil kg 0 0 0.04 0.04 0 0Cement kg 0 0 14.70 14.70 0 0Direct emissions to airCH4-bio kg 26.98 27.17 0.00 0.00 18.85 0.97CO2-fossil kg 0 0 509.68 652.38 0 0CO2-bio kg 488.04 491.58 562.23 566.31 498.16 547.33N2O kg 0 0 0.05 0.05 0 0CO kg 0.07 0.07 0.20 0.20 0.07 0.12NH3 kg 0.08 0.08 0 0 0.08 0H2S kg 0.17 0.17 0 0 0.17 0VOCs kg 0.05 0.05 0 0 0.05 0.11HCl kg 0 0 0.023 0.023 0 0HF kg 0 0 0.009 0.009 0 0NOx kg 0.06 0.06 0.48 0.48 0.06 0.15SO2 kg 0.03 0.03 0.09 0.09 0.03 0PM10 kg 0 0 0.094 0.094 0 0PCDD/DFs kg 0 0 2.40E-09 2.40E-09 0 0Mercury kg 3.41E-08 3.41E-08 2.16E-05 2.16E-05 3.41E-08 0Lead kg 0 0 9.62E-06 9.62E-06 0 0Cadmium kg 0 0 9.62E-06 9.62E-06 0 0Direct emissions to waterNH3-N kg 0.2 0.2 3.27E-04 3.27E-04 0.2 0.2T-P kg 2.38E-03 2.38E-03 1.62E-05 1.62E-05 2.38E-03 2.38E-03OutputElectricity kWh 217.05 218.62 419.95 474.06 244.99 260.10Leachate kg 200 192.05 60 57.62 223.85 223.85
Z. Zhou et al. Journal of Environmental Management 227 (2018) 23–33
27
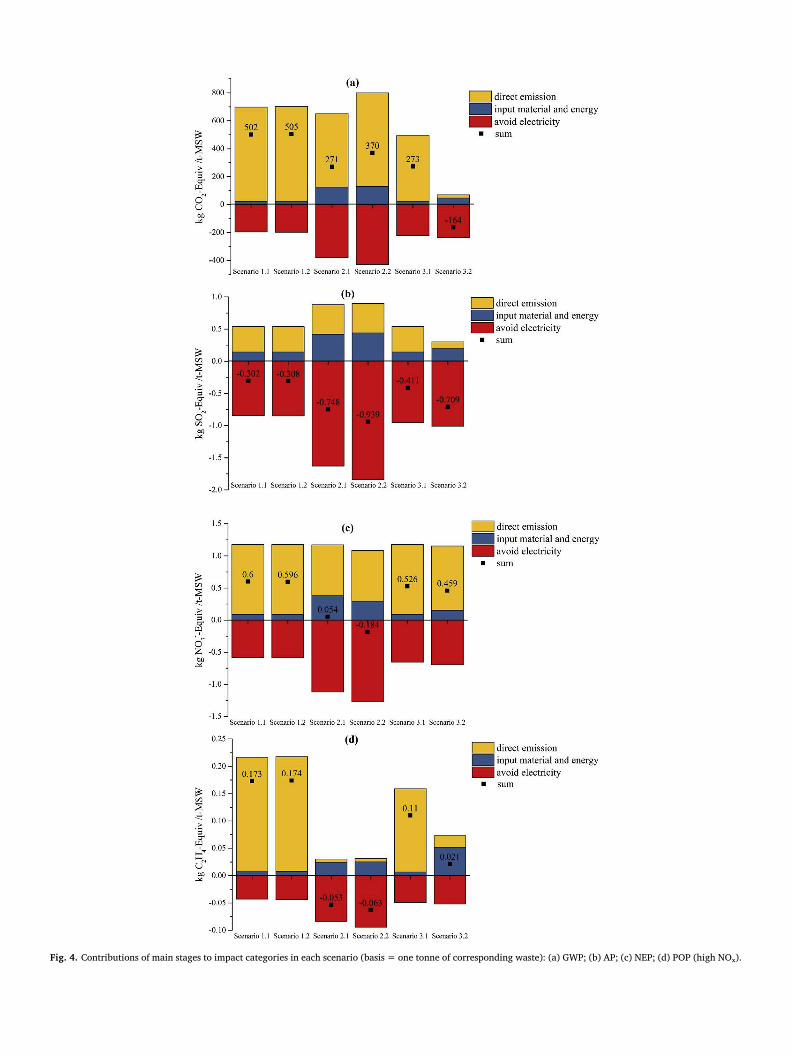
Fig. 4. Contributions of main stages to impact categories in each scenario (basis= one tonne of corresponding waste): (a) GWP; (b) AP; (c) NEP; (d) POP (high NOx).
Z. Zhou et al. Journal of Environmental Management 227 (2018) 23–33
28
performances, while GWP accounting for 88.9% and 89.3%, respec-tively. Compared to landfill for mixed waste, separate landfill for foodwaste reduces 46.6% of the weighted result. AD scenario shows the bestenvironmental favorability and is the only one achieving a benefit toenvironment. Incineration scenarios show the best performances in AP,NEP and POP, but high values of GWP. However, GWP is the principlecontributor to its weighted results. Thus, incineration scenarios performworse than AD scenario, Besides, effective techniques to reduce theGWP are essential for each scenario to the improvement of environ-mental expression.
4.2. Environmental performance evolution
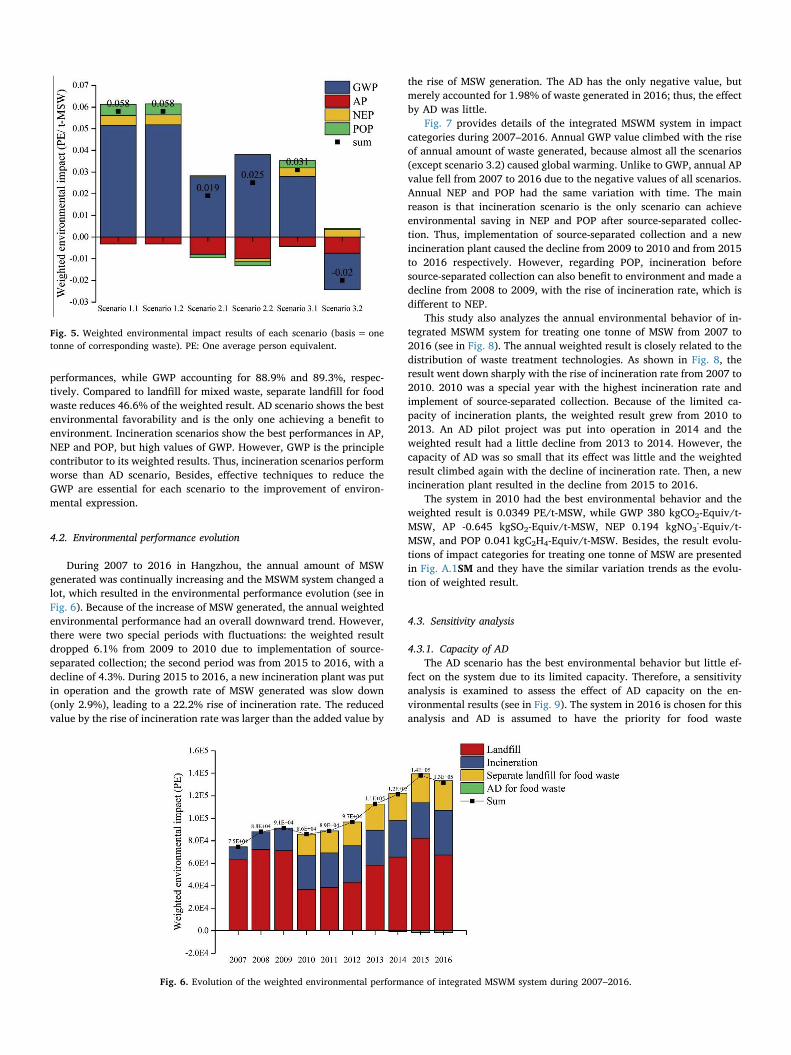
During 2007 to 2016 in Hangzhou, the annual amount of MSWgenerated was continually increasing and the MSWM system changed alot, which resulted in the environmental performance evolution (see inFig. 6). Because of the increase of MSW generated, the annual weightedenvironmental performance had an overall downward trend. However,there were two special periods with fluctuations: the weighted resultdropped 6.1% from 2009 to 2010 due to implementation of source-separated collection; the second period was from 2015 to 2016, with adecline of 4.3%. During 2015 to 2016, a new incineration plant was putin operation and the growth rate of MSW generated was slow down(only 2.9%), leading to a 22.2% rise of incineration rate. The reducedvalue by the rise of incineration rate was larger than the added value by
the rise of MSW generation. The AD has the only negative value, butmerely accounted for 1.98% of waste generated in 2016; thus, the effectby AD was little.
Fig. 7 provides details of the integrated MSWM system in impactcategories during 2007–2016. Annual GWP value climbed with the riseof annual amount of waste generated, because almost all the scenarios(except scenario 3.2) caused global warming. Unlike to GWP, annual APvalue fell from 2007 to 2016 due to the negative values of all scenarios.Annual NEP and POP had the same variation with time. The mainreason is that incineration scenario is the only scenario can achieveenvironmental saving in NEP and POP after source-separated collec-tion. Thus, implementation of source-separated collection and a newincineration plant caused the decline from 2009 to 2010 and from 2015to 2016 respectively. However, regarding POP, incineration beforesource-separated collection can also benefit to environment and made adecline from 2008 to 2009, with the rise of incineration rate, which isdifferent to NEP.
This study also analyzes the annual environmental behavior of in-tegrated MSWM system for treating one tonne of MSW from 2007 to2016 (see in Fig. 8). The annual weighted result is closely related to thedistribution of waste treatment technologies. As shown in Fig. 8, theresult went down sharply with the rise of incineration rate from 2007 to2010. 2010 was a special year with the highest incineration rate andimplement of source-separated collection. Because of the limited ca-pacity of incineration plants, the weighted result grew from 2010 to2013. An AD pilot project was put into operation in 2014 and theweighted result had a little decline from 2013 to 2014. However, thecapacity of AD was so small that its effect was little and the weightedresult climbed again with the decline of incineration rate. Then, a newincineration plant resulted in the decline from 2015 to 2016.
The system in 2010 had the best environmental behavior and theweighted result is 0.0349 PE/t-MSW, while GWP 380 kgCO2-Equiv/t-MSW, AP -0.645 kgSO2-Equiv/t-MSW, NEP 0.194 kgNO3
--Equiv/t-MSW, and POP 0.041 kgC2H4-Equiv/t-MSW. Besides, the result evolu-tions of impact categories for treating one tonne of MSW are presentedin Fig. A.1SM and they have the similar variation trends as the evolu-tion of weighted result.
4.3. Sensitivity analysis
4.3.1. Capacity of ADThe AD scenario has the best environmental behavior but little ef-
fect on the system due to its limited capacity. Therefore, a sensitivityanalysis is examined to assess the effect of AD capacity on the en-vironmental results (see in Fig. 9). The system in 2016 is chosen for thisanalysis and AD is assumed to have the priority for food waste
Fig. 5. Weighted environmental impact results of each scenario (basis= onetonne of corresponding waste). PE: One average person equivalent.
Fig. 6. Evolution of the weighted environmental performance of integrated MSWM system during 2007–2016.
Z. Zhou et al. Journal of Environmental Management 227 (2018) 23–33
29
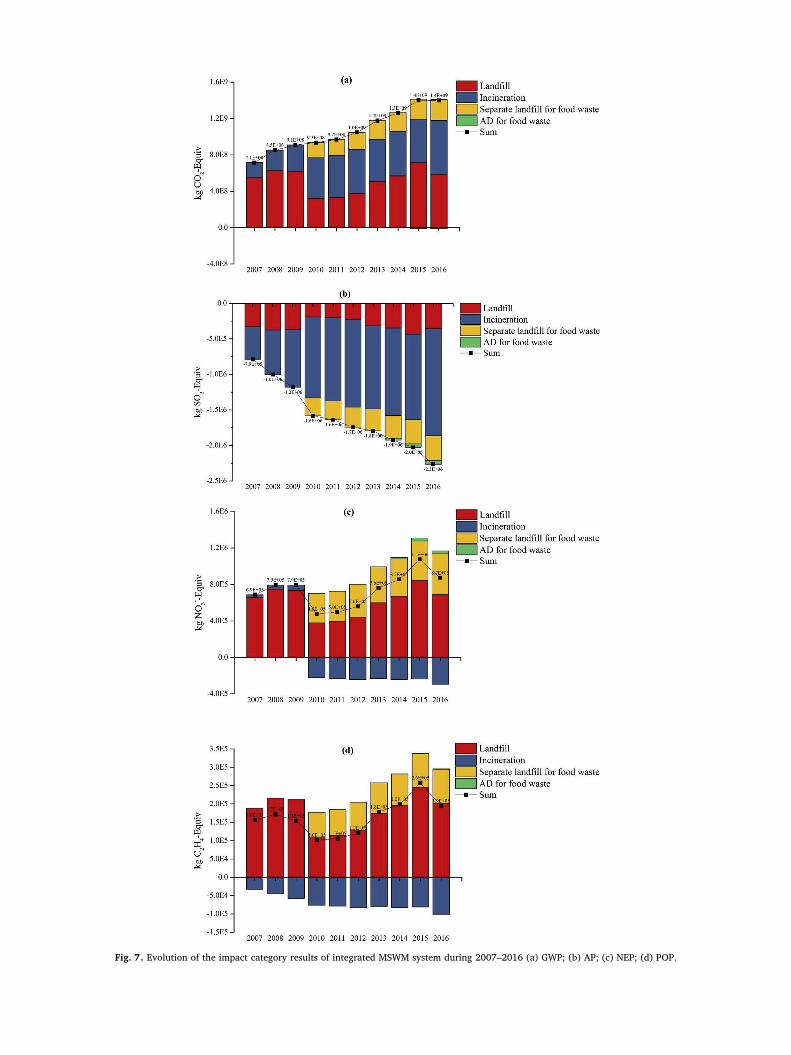
Fig. 7. Evolution of the impact category results of integrated MSWM system during 2007–2016 (a) GWP; (b) AP; (c) NEP; (d) POP.
Z. Zhou et al. Journal of Environmental Management 227 (2018) 23–33
30
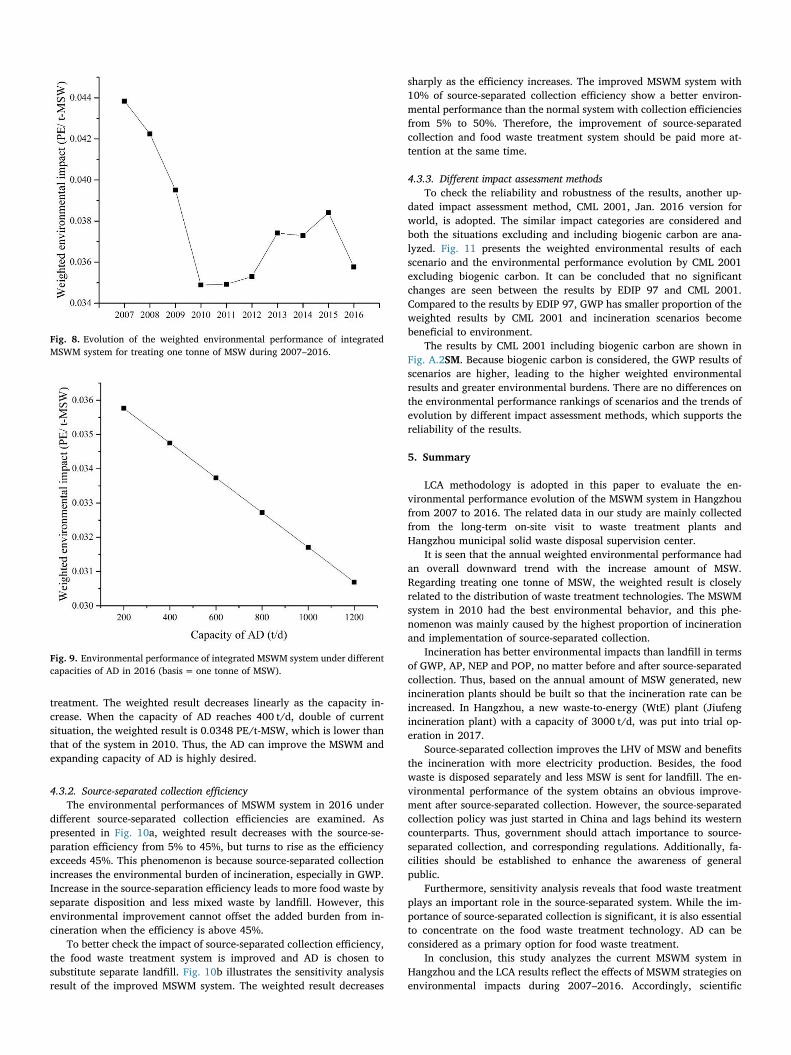
treatment. The weighted result decreases linearly as the capacity in-crease. When the capacity of AD reaches 400 t/d, double of currentsituation, the weighted result is 0.0348 PE/t-MSW, which is lower thanthat of the system in 2010. Thus, the AD can improve the MSWM andexpanding capacity of AD is highly desired.
4.3.2. Source-separated collection efficiencyThe environmental performances of MSWM system in 2016 under
different source-separated collection efficiencies are examined. Aspresented in Fig. 10a, weighted result decreases with the source-se-paration efficiency from 5% to 45%, but turns to rise as the efficiencyexceeds 45%. This phenomenon is because source-separated collectionincreases the environmental burden of incineration, especially in GWP.Increase in the source-separation efficiency leads to more food waste byseparate disposition and less mixed waste by landfill. However, thisenvironmental improvement cannot offset the added burden from in-cineration when the efficiency is above 45%.
To better check the impact of source-separated collection efficiency,the food waste treatment system is improved and AD is chosen tosubstitute separate landfill. Fig. 10b illustrates the sensitivity analysisresult of the improved MSWM system. The weighted result decreases
sharply as the efficiency increases. The improved MSWM system with10% of source-separated collection efficiency show a better environ-mental performance than the normal system with collection efficienciesfrom 5% to 50%. Therefore, the improvement of source-separatedcollection and food waste treatment system should be paid more at-tention at the same time.
4.3.3. Different impact assessment methodsTo check the reliability and robustness of the results, another up-
dated impact assessment method, CML 2001, Jan. 2016 version forworld, is adopted. The similar impact categories are considered andboth the situations excluding and including biogenic carbon are ana-lyzed. Fig. 11 presents the weighted environmental results of eachscenario and the environmental performance evolution by CML 2001excluding biogenic carbon. It can be concluded that no significantchanges are seen between the results by EDIP 97 and CML 2001.Compared to the results by EDIP 97, GWP has smaller proportion of theweighted results by CML 2001 and incineration scenarios becomebeneficial to environment.
The results by CML 2001 including biogenic carbon are shown inFig. A.2SM. Because biogenic carbon is considered, the GWP results ofscenarios are higher, leading to the higher weighted environmentalresults and greater environmental burdens. There are no differences onthe environmental performance rankings of scenarios and the trends ofevolution by different impact assessment methods, which supports thereliability of the results.
5. Summary
LCA methodology is adopted in this paper to evaluate the en-vironmental performance evolution of the MSWM system in Hangzhoufrom 2007 to 2016. The related data in our study are mainly collectedfrom the long-term on-site visit to waste treatment plants andHangzhou municipal solid waste disposal supervision center.
It is seen that the annual weighted environmental performance hadan overall downward trend with the increase amount of MSW.Regarding treating one tonne of MSW, the weighted result is closelyrelated to the distribution of waste treatment technologies. The MSWMsystem in 2010 had the best environmental behavior, and this phe-nomenon was mainly caused by the highest proportion of incinerationand implementation of source-separated collection.
Incineration has better environmental impacts than landfill in termsof GWP, AP, NEP and POP, no matter before and after source-separatedcollection. Thus, based on the annual amount of MSW generated, newincineration plants should be built so that the incineration rate can beincreased. In Hangzhou, a new waste-to-energy (WtE) plant (Jiufengincineration plant) with a capacity of 3000 t/d, was put into trial op-eration in 2017.
Source-separated collection improves the LHV of MSW and benefitsthe incineration with more electricity production. Besides, the foodwaste is disposed separately and less MSW is sent for landfill. The en-vironmental performance of the system obtains an obvious improve-ment after source-separated collection. However, the source-separatedcollection policy was just started in China and lags behind its westerncounterparts. Thus, government should attach importance to source-separated collection, and corresponding regulations. Additionally, fa-cilities should be established to enhance the awareness of generalpublic.
Furthermore, sensitivity analysis reveals that food waste treatmentplays an important role in the source-separated system. While the im-portance of source-separated collection is significant, it is also essentialto concentrate on the food waste treatment technology. AD can beconsidered as a primary option for food waste treatment.
In conclusion, this study analyzes the current MSWM system inHangzhou and the LCA results reflect the effects of MSWM strategies onenvironmental impacts during 2007–2016. Accordingly, scientific
Fig. 8. Evolution of the weighted environmental performance of integratedMSWM system for treating one tonne of MSW during 2007–2016.
Fig. 9. Environmental performance of integrated MSWM system under differentcapacities of AD in 2016 (basis= one tonne of MSW).
Z. Zhou et al. Journal of Environmental Management 227 (2018) 23–33
31
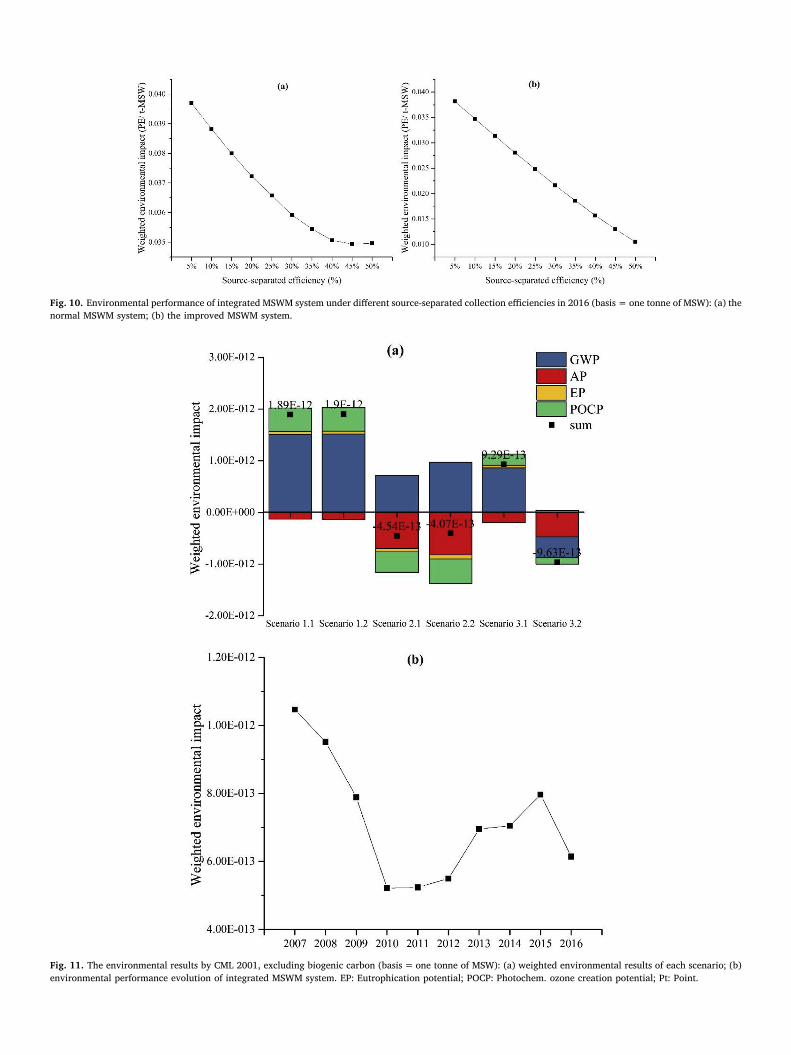
Fig. 10. Environmental performance of integrated MSWM system under different source-separated collection efficiencies in 2016 (basis= one tonne of MSW): (a) thenormal MSWM system; (b) the improved MSWM system.
Fig. 11. The environmental results by CML 2001, excluding biogenic carbon (basis= one tonne of MSW): (a) weighted environmental results of each scenario; (b)environmental performance evolution of integrated MSWM system. EP: Eutrophication potential; POCP: Photochem. ozone creation potential; Pt: Point.
Z. Zhou et al. Journal of Environmental Management 227 (2018) 23–33
32
suggestions are provided to benefit the environment for the futureMSWM development.
Acknowledgements
This project is supported by the National Natural ScienceFoundation of China (No. 51676170) and the Program of IntroducingTalents of Discipline to University (B08026).
Appendix A. Supplementary data
Supplementary data related to this article can be found at https://doi.org/10.1016/j.jenvman.2018.08.083.
References
Arena, U., Ardolino, F., Di Gregorio, F., 2015. A life cycle assessment of environmentalperformances of two combustion-and gasification-based waste-to-energy technolo-gies. Waste Manag. 41, 60–74.
Astrup, T.F., Tonini, D., Turconi, R., Boldrin, A., 2015. Life cycle assessment of thermalwaste-to-energy technologies: review and recommendations. Waste Manag. 37,104–115.
Chi, Y., Dong, J., Tang, Y., Huang, Q., Ni, M., 2015. Life cycle assessment of municipalsolid waste source-separated collection and integrated waste management systems inHangzhou, China. J. Mater. Cycles Waste Manag. 17, 695–706.
CSYCC (Chinese Statistics Yearbook Compiling Committee), 2016. Chinese statisticsyearbook 2015. In: Chinese Statistics Yearbook Compiling Committee. ChineseStatistics Press, Beijing.
Dong, J., Chi, Y., Zou, D., Fu, C., Huang, Q., Ni, M., 2014. Comparison of municipal solidwaste treatment technologies from a life cycle perspective in China. Waste Manag.Res. 32, 13–23.
Dong, J., Ni, M., Chi, Y., Zou, D., Fu, C., 2013. Life cycle and economic assessment ofsource-separated MSW collection with regard to greenhouse gas emissions: a casestudy in China. Environ. Sci. Pollut. Control Ser. 20, 5512–5524.
Du, R., Qi, B., Guo, H., Shao, B., 2011. Characteristics of atmospheric inversion tem-perature and its influence on concentration of air pollutants in Hangzhou, ZhejiangProvince. J. Meteorol. Environ. 27, 49–53.
Evangelisti, S., Tagliaferri, C., Clift, R., Lettieri, P., Taylor, R., Chapman, C., 2015. Lifecycle assessment of conventional and two-stage advanced energy-from-waste tech-nologies for municipal solid waste treatment. J. Clean. Prod. 100, 212–223.
Fruergaard, T., Astrup, T., 2011. Optimal utilization of waste-to-energy in an LCA per-spective. Waste Manag. 31, 572–582.
Han, H., Zhang, Z., 2017. The impact of the policy of municipal solid waste source-se-parated collection on waste reduction: a case study of China. J. Mater. Cycles Waste
Manag. 19, 382–393.Havukainen, J., Zhan, M., Dong, J., Liikanen, M., Deviatkin, I., Li, X., Horttanainen, M.,
2017. Environmental impact assessment of municipal solid waste management in-corporating mechanical treatment of waste and incineration in Hangzhou, China. J.Clean. Prod. 141, 453–461.
HMSWDSC (Hangzhou Municipal Solid Waste Disposal Supervision Center), 2016.Hangzhou municipal solid waste physical property analysis and disposal method. In:Municipal Solid Waste Disposal Supervision Center, (Hangzhou).
HSYCC (Hangzhou Statistics Yearbook Compiling Committee), 2017. Hangzhou statisticsyearbook 2016. In: Hangzhou Statistics Yearbook Compiling Committee. HangzhouStatistics Press, Hangzhou.
Ibáñez-Forés, V., Bovea, M.D., Coutinho-Nóbrega, C., de Medeiros-García, H.R., Barreto-Lins, R., 2018. Temporal evolution of the environmental performance of im-plementing selective collection in municipal waste management systems in devel-oping countries: a Brazilian case study. Waste Manag. 72, 65–77.
IPCC (Intergovernmental Panel on Climate Change), 2006. 2006 IPCC Guidelines forNational Greenhouse Gas Inventories. Intergovernmental Panel on Climate Change.
ISO, 2006. ISO 14040 international standard. In: Environmental Management – Life CycleAssessment – Principles and Framework. International Organisation forStandardization, Geneva, Switzerland.
ISO, 2006. ISO 14044 international standard. In: Environmental Management – Life CycleAssessment – Requirements and Guidelines. International Organisation forStandardisation, Geneva, Switzerland.
Jeswani, H., Azapagic, A., 2016. Assessing the environmental sustainability of energyrecovery from municipal solid waste in the UK. Waste Manag. 50, 346–363.
Jungbluth, N., Chudacoff, M., Dauriat, A., Dinkel, F., Doka, G., Faist Emmenegger, M.,Gnansounou, E., Kljun, N., Schleiss, K., Spielmann, M., 2007. Life Cycle Inventories ofBioenergy. Final Report Ecoinvent Data V2. 0 17.
Ma, J., Hipel, K.W., Hanson, M.L., Cai, X., Liu, Y., 2017. An Analysis of InfluencingFactors on Municipal Solid Waste Source-separated Collection Behavior in Guilin,China by Using the Theory of Planned Behavior. Sustainable Cities and Society.
Othman, S.N., Noor, Z.Z., Abba, A.H., Yusuf, R.O., Hassan, M.A.A., 2013. Review on lifecycle assessment of integrated solid waste management in some Asian countries. J.Clean. Prod. 41, 251–262.
Ripa, M., Fiorentino, G., Vacca, V., Ulgiati, S., 2017. The relevance of site-specific data inLife Cycle Assessment (LCA). The case of the municipal solid waste management inthe metropolitan city of Naples (Italy). J. Clean. Prod. 142, 445–460.
Steuer, B., Ramusch, R., Part, F., Salhofer, S., 2017. Analysis of the value chain andnetwork structure of informal waste recycling in Beijing, China. Resour. Conserv.Recycl. 117, 137–150.
Thinkstep, 2018. Gabi 8 Software-system and Database for Life Cycle Engineering,Germany.
Zaman, A., 2013. Life cycle assessment of pyrolysis–gasification as an emerging municipalsolid waste treatment technology. Int. J. Environ. Sci. Technol. 10, 1029–1038.
Zhang, H., Wen, Z.-G., 2014. The consumption and recycling collection system of PETbottles: a case study of Beijing, China. Waste Manag. 34, 987–998.
Zhou, Z., Tang, Y., Chi, Y., Ni, M., Buekens, A., 2018. Waste-to-energy: a review of lifecycle assessment and its extension methods. Waste Manag. Res. 36, 3–16.
Z. Zhou et al. Journal of Environmental Management 227 (2018) 23–33
33