environmental optimisation of gas fired engines in … · environmental optimisation of gas fired...
TRANSCRIPT

REP
OR
T
Danish Gas Technology Centre • Dr. Neergaards Vej 5B • DK-2970 Hørsholm • Tlf. +45 2016 9600 • Fax +45 4516 11 99 • www.dgc.dk
Environmental optimisation of gas fired engines in Denmark
Project ReportDecember 2013
Potential and consequences of NOx reduction by engine adjustments

Environmental optimisation of gas
fired engines in Denmark
Potential and consequences of NOx reduction by engine adjustments
Torben Kvist
Danish Gas Technology Centre
Hørsholm 2013

Title : Environmental optimisation of gas fired engines in Denmark
Report
Category : Project Report
Author : Torben Kvist
Date of issue : 20-12-2013
Copyright : Danish Gas Technology Centre
File Number : 736-18; h:\736\18 miljøoptimering 2\wp2\main_report_final.docx
Project Name : Environmental optimisation of gas fired engines
Keywords : kraftvarme, motorer, miljø (CHP, engines, environment)
ISBN : 978-87-7795-378-1

DGC-report 1
Table of Contents Page
1 Introduction ........................................................................................................................... 2
2 Summary and conclusions .................................................................................................... 3
3 Background ........................................................................................................................... 5
4 External costs related to emissions ....................................................................................... 7
4.1 Health effects ....................................................................................................................... 7
4.2 Climate effects ..................................................................................................................... 8
5 Costs of electricity production at gas engines .................................................................... 10
6 Reduction potential for different engine models ................................................................ 13
6.1 Natural gas fired engines ................................................................................................... 13
6.1.1 Example of conducted measurements ................................................................... 15
7 National reduction potential by engine adjustment ............................................................ 17
7.1 Present emission levels ...................................................................................................... 17
7.2 Gas consumption for CHP engines in Denmark ............................................................... 18
7.3 Yearly emissions from the examined engine models ........................................................ 19
7.3.1 Determination of yearly emissions of NOx, CO and CO2 ..................................... 19
7.3.2 Determination of yearly CH4 emission ................................................................. 20
8 Determination of effect on external costs ........................................................................... 25
8.1 Extrapolation of data for external costs ............................................................................. 26
8.2 External costs related to climate gases .............................................................................. 28
8.2.1 Costs related to CO2 emissions ............................................................................. 28
9 Welfare economic analysis ................................................................................................. 32
9.1.1 Fuel costs ............................................................................................................... 32
9.1.2 Maintenance costs ................................................................................................. 32
9.1.3 Taxes ..................................................................................................................... 32
9.2 Welfare economic valuation .............................................................................................. 33
9.3 Financial analysis .............................................................................................................. 34
9.4 Discussion of the financial analyses .................................................................................. 35
10 References ........................................................................................................................... 36

DGC-report 2
1 Introduction
This is the final report of the PSO ForskEL project No. 010690 “Environmen-
tal optimisation of natural gas fired engines”. In addition to this report a sup-
plementary report and a note have been published.
Report - “Environmental optimisation of gas fired engines in Denmark -
Measurement of emissions and efficiencies of natural gas and biogas
fired engines”, DGC, 2013
Note - "Socio-economic consequences of optimising NOx emissions
from gas fired engines", Flemming Møller Aarhus University, Institute
of Environmental Science, 2013.
This report summarises the above mentioned publications and describes the
potential and consequences of reduction of NOx emissions from natural gas
fired engine based decentralised power plants in Denmark.
As a part of this project, emission measurements were conducted at two differ-
ent Jenbacher engines and two different Caterpillar engines in operation on
local combined heat and power plants in Denmark. The measurements supple-
ment measurements from a previous project “ForskEL 10089”. During that
project emission measurements were conducted on two Rolls-Royce engines
and two Wärtsilä engines. External costs due to emissions were calculated as a
part of the previous project as well.
The analysis conduction in the present project applies measurement results as
well as the external costs determined in the previous project.
The participants in this project are
GE Jenbacher
PonPower
National Environmental Research Institute, DMU
Danish Gas Technology Centre, DGC.
The project was financially supported by Energinet.dk as a part the PSO
ForskEL programme

DGC-report 3
2 Summary and conclusions
In Denmark around 1.000 MW of electric power production capacity is in-
stalled at natural gas fired engine based decentralised CHP (combined heat and
power) plants. These engine units emit components such as CO2, CH4 and
NOx. CO2 and CH4 act as greenhouse gases. NOx is harmful as it has a signifi-
cant negative health impact on people exposed.
The aim of this work is to assess the potential of NOx reduction at the engine
based power plant in Denmark as wells the consequence of NOx emission re-
duction on other factors, such as greenhouse gas emission and natural gas con-
sumption.
The aim of this work is to assess the potential for optimising the operation of
these engines environmentally. In order to do so, measurements of electrical
efficiency, heat efficiency and emissions were carried out at different combina-
tions of ignition timing and excess of air. The engine models selected represent
85% of the natural gas consumption at engine based power plants in Denmark.
It was found that for all examined engines it was possible to obtain NOx emis-
sions as low as 200 mg/m3 @ 5% O2. However, in order to ensure stable engine
operation it was assessed that the engines can be adjusted to obtain NOx emis-
sions of 250 mg/m3. However, for some engines it will require implementation
of a new control system of the engine.
On average, the NOx reduction potential corresponds to a reduction of 40%
relative to the present level. Such a NOx reduction will lead to an increase of
unburned hydrocarbon emissions of 12% and the CO emission will increase by
19%. Furthermore, the natural gas consumption for the gas engines will in-
crease by 1.5% in order to keep the power production constant. This is due to
reduced electrical efficiency as a consequence of the NOx reduction. However,
increased natural gas consumption leads to increased heat production. This is
taken into account by assuming that the heat production from the boilers is
reduced accordingly.
Based on results from a previous project, external costs related to health effects
caused by emissions were determined. Emission of greenhouse gases is valuat-
ed based on prerequisites for CO2 allowances from the Danish Energy Agency.

DGC-report 4
The external costs related to emission will be decreased by 9 million € per year
as consequence of a NOx reduction as described above. A welfare economic
analysis was conducted. Besides the external costs, costs related to fuel con-
sumption, operation as well as tax yield are included in the analysis. The analy-
sis shows a potential welfare economic gain of 10.4 million € per year.
A financial analysis of the consequences for the CHP plants was conducted as
well. Due to the NOx tax a NOx reduction as described will have a beneficial
impact on the economy of the plants. However, an analysis is required for as-
sessing the economy for each individual plant as it will depend on e.g. the state
of the existing control system of the actual engine.

DGC-report 5
3 Background
The Danish EPA has proposed that NOx emission from gas engines could be
reduced in order to fulfil part of the Danish obligations in the NEC directive.
Today, engines are adjusted to meet the demands given by regulations and to
obtain the highest possible efficiency under these conditions. The NOx target
for 2010 was 127,000 ton per year. Today this target is met. The 2020 target is
79,640 ton/year. A recent projection of the NOx emission in 2020 in Denmark
is 82,999 ton/year /1/. This means that further action in terms of NOx reduction
is required. One source of NOx emissions is the gas fired engines at decentral-
ised power plants.
The gas fired engines installed at CHP plants in Denmark are lean burn en-
gines. The reason for operating the engines lean is to obtain high efficiency and
low NOx emissions. Increasing the excess of air leads to lower combustion
temperature and thereby also lower NOx emissions. A drawback of increasing
the excess of air is a decreasing flame speed. Typically, lean-burn engines at
CHP plants are operated with an excess of air around λ=1.9 - 2.2. If the excess
of air is too high, the efficiency decreases due to the lower flame speed and
poorer combustion conditions leading to higher unburned fuel emissions.
The relation between the different emissions varies from engine type to engine
type and for some engine types the UHC emissions are more sensitive to ad-
justments leading to lower NOx emissions than for others. Some correlations
between emissions, efficiency and engine settings exist for early versions of
lean-burn gas engines. New versions of lean-burn engines have been intro-
duced and emission regulations have been changed. Therefore, most of the
engines are now fitted with supplementary emission reduction equipment.
This project supplements a previous project /2/, where the relation between the
different emissions and efficiencies was examined for four different engine
types common at Danish engine-based natural gas fired combined heat and
power plants at different operational conditions. Furthermore, the external
health related costs were determined for the examined engines. One of the
main conclusions from the project was that from a socio-economic point of
view it is beneficial to reduce NOx emissions despite the fact that the level of
other emissions increases and the electrical efficiency decreases.

DGC-report 6
As a part this project, another four engines were examined in order to examine
the relation between different emissions from the engines and electrical and
heat efficiency at different engines settings. Furthermore, the potential and
consequences of NOx reduction from natural gas fired engine based power
plants in Denmark were assessed.
This work applies external cost for different components from /3/. The values
for external costs related to NOx emissions are a factor of 3.28 too high com-
pared to the true values. The reason is that the unit is stated as €/kg NO2. The
correct unit for the given values is €/kg N.

DGC-report 7
4 External costs related to emissions
External costs or externalities in relation to power production are defined as all
costs that are not directly included in the price of the produced power. Health
effects related to air pollution from power plants fall under this definition.
4.1 Health effects
The health cost externalities applied are calculated using the EVA model sys-
tem (Economic Valuation of Air pollution) developed at the National Envi-
ronmental Research Institute (NERI) - Aarhus University, along the lines of the
impact pathway chain originating from the ExternE project, see Fejl! Henvis-
ningskilde ikke fundet..
The system consists of a regional-scale atmospheric chemistry transport model
(the Danish Eulerian Hemispheric Model, DEHM) and a local-scale atmos-
pheric transport model (the Operational Meteorological Model, OML), which
together are applied to calculate footprints of the components emitted from
single sources as e.g. the CHP engines in the present project. The footprints
correspond to marginal changes in annual concentrations of air pollutants, here
called delta-concentrations, and they are calculated for the chemical compo-
nents NO2 (nitrogen dioxide), NO3- (nitrate), O3 (ozone), CO (carbon monox-
ide), HCHO (formaldehyde), C2H4 (ethene) and C3H6 (propene). Based on the
delta-concentrations and population data, the marginal population exposure is
calculated. For the different chemical components a number of responses have
been identified to the exposure, and the resulting health effects are calculated
based on exposure-response relations derived from the literature. Finally, the
associated costs in terms of direct and indirect costs for society are calculated.

DGC-report 8
Specific source
(Measured emissions)
Concentration distribution
(Atmospheric dispersion
and chemistry)
Human exposure
(Population data)
Human impact
(Exposure response
functions)
Resulting cost
(Economic valuation)
Figure 1 Pathway approach for calculation of externalities from site-specific
emissions of air pollutants
The following additional health effects have been included:
Chronic mortality: formaldehyde (HCHO), ethene (C2H4) and propene
(C3H6)
Cough: nitrogen dioxide (NO2)
Asthma attacks (affecting asthma children): NO2
Lung cancer (affecting all): HCHO
Cancer (affecting all): C2H4 and C3H6
Methane, ethane and propane are not considered carcinogenic and there is no
mentioning in general literature of other chronic health effects. No health ef-
fects from these species will hence be included in the present study. For further
information and references refer to /2/.
4.2 Climate effects
Beside the CO2, the content of methane and laughing gas (N2O) present in the
flue gas from natural gas fired engines acts as a climate gas. It is hard to valu-
ate the effect of greenhouse gases. For the approach applied in this work the
Rolls-Royce Type K gas
engine.
Rolls-Royce Type K gas engine. Make and size of the examined engines
40
41
42
43
44
45
40 60 80 100 120 140 160NOx / ppm.
hel /
%
85
87
89
91
93
95
hto
t / %
Electrical efficiencyOverall efficiency
Measured emissions and efficiencies for one of the examined engines.
Specific cost of externalities for one of the examined
engines
CPR data (who lives where)
CPR data (who lives where)
CPR data
(who lives where)

DGC-report 9
external costs related to these climate gases are accounted for by their relative
greenhouse gas potential and the cost of CO2 allowances.
DMU publishes aggregated data on emission factors (g/GJ) /5/, and for natural
gas fired CHP engines for the climate gases they are:
CO2: 56.7 kg/GJ
N2O 0.58 g/GJ
CH4: 481 g/GJ
The greenhouse gas potential of CH4 and N2O are 25 and 298, respectively /7/.
This means that the effect of N2O contributes about 0.3% of the total green-
house gas emission from the gas engines despite its high greenhouse gas poten-
tial. Therefore, the effect of N2O on greenhouse emissions can be neglected.

DGC-report 10
5 Costs of electricity production at gas engines
Decentralised natural gas engine based CHP plants must deliver the required
heat. The amount of required heat varies significantly through the year. The
heat can either be produced using an engine or a boiler. All decentralised CHP
units are also equipped with boilers. By far the most common fuel for these
boilers is natural gas. Some are, however, fuelled by other fuels, such as wood
chips or wood pellets.
The operation and maintenance costs are significantly higher for gas engines
than for boilers. Therefore, the required heat demand is covered by engines if
the electricity price is sufficiently high, and by boilers when the electricity
price is low. When it becomes profitable to cover the heat demand by an en-
gine, the electricity price is called the breakeven electricity price.
Where it is profitable to produce the required heat on an engine the breakeven
electricity price varies significantly from plant to plant. Among other things, it
depends on:
Engine
Price of natural gas (taxes are fixed)
Service and maintenance costs
Electricity and heat efficiency of the engine
Boiler
Price of fuel
Energy and CO2 tax of fuel for the boiler if different from natural gas
Boiler efficiency
When assessing the total costs related to production of electricity on natural gas
engines a number of aspects should be taken into account. Some of these are
fuel costs, value of products (heat and electricity) and external costs related to
negative environmental and health effects caused by harmful emissions from
the plants.
The total costs related to the electricity production can be determined as

DGC-report 11
productionproductsExternal CostCostCostcosts Total
ExternalCost is the cost of externalities caused by the harmful emissions in the
flue gas from the gas engines. The production costs cover operation and service
of both boiler and engine as well as fuel costs. The products are heat and elec-
tricity.
For all engines included in this survey the electricity production is the same at
all examined engine settings. As the electricity production is the same at all
conditions the income from electricity production is independent of the engine
settings chosen.
Different engine settings result in different electrical and total efficiencies. As
the electricity production is kept constant and the efficiencies vary the natural
gas consumption and heat production from the engine will change according to
engine settings. As mentioned earlier, most plants are equipped with a natural
gas boiler for heat production. It was seen from the conducted measurements
that when the electrical efficiency of the engine decreases due to changed en-
gine settings leading to reduced NOx emissions, the heat production mostly
increases.
In order to take this effect into account it is assumed that the difference in heat
production will be covered by the natural gas boiler. In this way the heat pro-
duction is kept constant and thereby the income from heat production is inde-
pendent of chosen engine settings as well.
Additional natural gas consumption of the boiler can be determined as
boiler
iref
iboilerfuelH
QQV
h
,,
where
refQ is the heat production for the measurement with highest heat produc-
tion
iQ is the heat production for each of the conducted measurements
H is the lower heating value of the fuel
hboiler is the boiler efficiency

DGC-report 12
As the boiler operation regarded here is only due to changes in heat efficiency
of the engines due to changed engine settings, the change in natural gas con-
sumption for the boiler is very low compared to that of the engine. The con-
ducted measurements showed that the gas consumption of the boiler would be
maximum 2% of the gas consumption of the engine. Furthermore, the emis-
sions from the boiler are low compared to emissions from the engines. There-
fore, the cost of externalities from the boiler is neglected in this analysis.
With this approach, the effect of varying electricity prices and different heat
prices at different locations are eliminated. The only parameter - beside emis-
sions - that is affected by changing engine settings is the natural gas consump-
tion.

DGC-report 13
6 Reduction potential for different engine models
One way of reducing emissions from gas fired engine based CHP plants is by
changing the engine settings. A main advantage of the approach is that, in prin-
ciple, it can be done without investments. However, as stated in the introduc-
tion, adjusting an engine in order to reduce one emission often lead to in-
creased emissions of other components, and the engine efficiencies are affected
as well. These relations have been experimentally examined.
6.1 Natural gas fired engines
Eight different natural gas fired engines that are in operation on decentralised
combined heat and power plants (CHP) in Denmark were examined. Makes
and sizes of the engines are given in Table 1. The engines were selected in or-
der to be representative of the natural gas engine based CHP production in
Denmark. The eight examined natural gas fired engines represent 85% of the
total natural gas consumption on natural gas engine based CHP units in Den-
mark.
Table 1 Make and size of the examined natural gas engines
Unit Make Size
#1 Rolls Royce B35:40 4990 kWe
#2 Rolls Royce KVGS-G4 2075 kWe
#3 Wärtsilä V25SG 3140 kWe
#4 Wärtsilä V34SG 6060 kWe
#5 Jenbacher J320 1063 kWe
#6 Jenbacher J620 3047 kWe
#7 Caterpillar G3516 1047 kWe
#8 Caterpillar G3616 3845kWe
For all examined engines emissions and efficiencies were measured at different
combinations of excess of air () and ignition timing (IT). The excess of air
and the ignition timing were set to obtain the following NOx emission levels:
500, 400, 300, and 200 mg/m3(n), ref. 5% O2
The level of NOx emissions was chosen to match the present threshold limit
given in the regulations for biogas and natural gas fired engines, respectively.

DGC-report 14
For each of the examined operational conditions the following measurements
were conducted:
O2 - measured by
CO and CO2 – measured by NDIR
NOx and NO2 – measured by CLD
UHC - measured by FID
Natural gas consumption, heat and electricity production. Meters on the
plants were applied.
The engine settings were chosen by the engine supplier. It was done to fit the
scheme shown in Table 2. As shown in the table four measurements with fixed
excess of air and fixed time of ignition and four measurements with fixed time
of ignition and different excess of air were carried out. However, it was not
possible to obtain steady operation at all eight chosen engine settings for all
engines.
During the previous project /2/ it was found that the negative environmental
impact of compounds, such as HCHO (formaldehyde), and higher hydrocar-
bons, such as C2H4, C3H6, C4H10 are negligible compared to the impact of CH4
and NOx. Therefore, the composition of the hydrocarbons in flue gas was not
determined as a part of this project. Similarly, no HCHO concentration meas-
urements were conducted.

DGC-report 15
Table 2 Examined operational conditions. TI denotes the time of ignition,
M is numeration of individual measurements.
Unit:
mg/m3(n) @
5% O2
TI1 TI2 TI3 TI4
λ 1 M5
NOx =
200/400
λ 2 M6
NOx =
300/600
λ 3 M1
NOx =
200/400
M2
NOx =
300/600
M3/7
NOx =
400/800
M4
NOx =
500/1000
λ 4 M8
NOx =
500/1000
A literature study conducted by DMU showed that at concentration levels rele-
vant for the exhaust gas from the engine there is no negative health effect relat-
ed to emission of C2H6 and C3H8, and that negative health effect of formalde-
hyde is negligible compared to the effect of NOx /2/.
6.1.1 Example of conducted measurements
The Rolls-Royce K engine is the most common engine model at natural gas
fired CHP plants in Denmark /4/. The relation between NOx emissions and the
emissions of CO and unburned hydrocarbon (UHC) as well electrical and heat
efficiency is shown in Figure 1. The figure shows that reduction of NOx emis-
sions lead to higher CO and UHC emissions as well as lower electrical effi-
ciency and slightly higher heat efficiency. For further information on the con-
ducted measurements please refer to /12/.

DGC-report 16
Figure 1 Relation between NOx emissions, unburned hydrocarbon emissions
(UHC) and CO emissions and heat and electrical efficiency for a
natural gas fired Rolls-Royce K engine
In this work it is assessed that all examined engines will be able to operate with
a NOx emission of 250 mg/m3 @ 5% O2. However, for some engines it will be
required to modify or replace the control system of the engine in order to ob-
tain stable operation conditions. Whether that will be the case must be assessed
in each individual case as it depends partly on engine age and on the specific
upgrading that has been made during earlier major overhauls.

DGC-report 17
7 National reduction potential by engine adjustment
This section presents the potential of NOx emission reductions and the related
consequences on other emissions as well as fuel consumption. The potential
and consequences is determined at national level.
7.1 Present emission levels
Based on the conducted measurements, the potential of reducing the NOx emis-
sions from the natural gas fired engine based CHP units in Denmark is deter-
mined. The conducted measurements show what it is possible to obtain for the
examined engine models. However, in order to determine the potential of re-
duction it is necessary to know the emissions during normal operation.
Data on this subject is published in /4/. An example of different measured NOx
emissions from different engine models is shown in Figure 2. Each mark in the
figure represents one measurement. The figure shows results from different
surveys. The oldest data is given to the left and the newest to right of each of
the three engine models shown. It is seen that the variations of the NOx emis-
sion have decreased substantially from the first to the last survey, but the varia-
tions are still significant for the two engine models included in this project. The
red line represents the threshold limit.
Figure 2 NOx emissions from three natural gas fired engine models. The fig-
ure shows results of different surveys. The oldest data is given to the
left and the newest to right of each of the three engine models. From
/4/.
0
200
400
600
800
1000
NO
X m
g/m
3n
ved
5%
O2
PSO 3141 2003-2006 2007
Nye data Middelværdier Gr. værdi (Bek. 621)
Caterpillar 3500 Caterpillar 3600 Caterpillar G16CM34

DGC-report 18
Based on a compilation of data as shown in Figure 2 the average emission of
different components from the different engine models was determined. The
results are shown in Table 3 for the NOx and UHC emissions. From the table it
is seen that the emissions vary significantly from engine model to engine mod-
el. The emission of NOx emission vary from around 300 – 500 mg/m3(n) and
the UHC emission varies 1,000 – 1,800 mg/m3(n).
The values given in Table 3 are used as reference conditions in this work
Table 3 Average emission of NOx and unburned hydrocarbons (UHC) for
common engine models at Danish natural gas fired CHP units. NOx
is calculated as NO2 and UHC as C1 equivalents. Data from /4/.
Unit: mg/m3(n) @ 5% O2 NOx UHC
Jenbacher 600 327 1,164
Jenbacher 300 455 1,042
Rolls-Royce B 443 1,049
Rolls-Royce K 499 1,517
Wärtsilä 25 SG 420 1,182
Wärtsilä 34 SG 354 1,418
Caterpillar 3500 445 1,324
Caterpillar 3600 293 1,812
7.2 Gas consumption for CHP engines in Denmark
As a part of the “Emission mapping of decentralised heat and power 2007” /4/
the energy consumption for natural gas fired engines at heat and power plants
in Denmark is described. The data is given for 2006. From the gas distribution
companies, CHP owners as well as engine suppliers DGC has learned that gas
consumption at power plants has decreased over the last years. However, in
this work the official data from /4/ is applied.
Table 4. Natural gas consumption for the engines models involved. Data is
taken from /4/.
TJ
Jenbacher 600 2,203
Jenbacher 300 4,221
Rolls-Royce B 364
Rolls-Royce K 6,417
Wärtsilä 25 SG 1,369
Wärtsilä 34 SG 2,162
Caterpillar 3500 3,805
Caterpillar 3600 2,723
Total 23,264

DGC-report 19
7.3 Yearly emissions from the examined engine models
In order to be able to determine the harmfulness of the exhaust gas it is not
enough to know the actual concentration of the different species. Also the total
flow of exhaust gas must be known in order to determine the amount emitted.
The exhaust gas flow can be determined from the measured fuel and exhaust
gas compositions as well as fuel consumption.
7.3.1 Determination of yearly emissions of NOx, CO and CO2
During combustion of a North Sea natural gas with a lower heating value of
39.6 MJ/m3(n), 12.46 m
3 of dry flue gas is produced when the oxygen content
in the dry flue gas is 5% as reference condition /6/.
The mass emitted of a given component, mi, can be calculated as
H
E
fuel
exhaust
V
V
Where
E is energy of used fuel (based on lower heating value)
H is the lower heating value of the fuel
Ci is mass specific concentration of the component i
fuel
exhaust
V
V is a term that describes the volume ratio between formed exhaust
gas (given at the same reference conditions Ci) and fuel consumption.
The Jenbacher 600 engines had a total natural gas consumption corresponding
to 2203 TJ in 2006 (see Table 4). The average NOx emission for this engine
type at normal operation conditions was 327 mg/m3(n) @ 5% O2 (see Table 3).
Based on these data the total yearly NOx emissions for this engine type can be
calculated as
3
6
6.39
102032
m
MJ
TJ
MJ
year
TJ
.
The total yearly emissions of CO and CO2 are determined as the total yearly
NOx emissions.

DGC-report 20
7.3.2 Determination of yearly CH4 emission
The method for measurement of unburned hydrocarbons applied in this work is
FID (Flame Ionazation Detector). For alkanes such as methane and ethane the
FID gives a signal proportional to the number of C-atoms present as alkanes.
This means that 100 ppm of methane (CH4) gives the same signal as 50 ppm of
ethane (C2H6) when analysed by FID. Measurement of UHC in a flue gas con-
sisting of 100 ppm methane and 50 ethane would be 200 ppm C1 equivalent
(C1,eq) if determined by FID.
The composition of the hydrocarbons in the flue is quite stable and almost in-
dependent of engine model and engine settings. Figure 3 shows the UHC com-
position at different engine settings /2/. Around 99% of the hydrocarbons in
flue gas from natural gas fired engines consist of alkanes and about 83% of the
measured UHC concentration is the due to the content of methane in the flue
gas for engines fuelled by typical North Sea gas /2/.
Figure 3 Relative UHC composition for the examined engine settings for en-
gine unit #1. The lines represent the average of examined settings.
From /2/.
The average UHC emission for this Jenbacher 600 engine type at normal op-
eration conditions is 1.164 mg/m3(n) @ 5% O2 (see Table 3). This is the con-
centration of C1. Based on these data the total yearly UHC emissions for this
engine type can be calculated.
0,000
0,010
0,020
0,030
0,040
0,050
0,060
40 60 80 100 120 140 160
NOx / ppm
Fra
ction t
ota
l of
UH
C
0
0,1
0,2
0,3
0,4
0,5
0,6
0,7
0,8
0,9
1
CH
4 f
raction o
f to
tal U
HC
C2H4
C2H6
C3H8
C4H10 +
HCHO
CH4

DGC-report 21
As 83% of the measured C1,eq originates from methane and the molar mass of
methane is 16 g/mole and 12 g/mole for C1,eq, the total emitted amount of me-
thane can be calculated as
.
The change in the yearly emissions of NOx, CO, CH4 and CO2 is determined
for all examined engine models at “normal conditions” as stated in Table 3, and
also after the engines are adjusted to low NOx emissions, which are defined as
250 mg/m3 @ 5% O2.
The results for natural gas fired CHP based engines in Denmark of the exam-
ined models are given in Table 5. It is found that on a national level the total
NOx emission from the examined models is reduced by 40%. The consequenc-
es are increased emissions of CO2, CH4 and CO.
Table 5 Effect of reduction of NOx emissions from the present level to 250
mg/m3 @ 5% O2 on other emissions from natural gas fired CHP en-
gines in Denmark. The electricity production is kept constant.
NOx CH4 CO CO2
Before After Before After Before After Before After
ton/year ton/year ton/year million
ton/year
Jenbacher 600 227 175 834 993 144 197 122 123
Jenbacher 300 604 340 1,161 1,279 360 381 235 240
Rolls-Royce B 51 29 121 143 14 19 20 20
Rolls-Royce K 1,008 513 3,411 3,852 484 633 345 350
Wärtsilä 25 SG 181 109 608 719 126 164 74 75
Wärtsilä 34 SG 241 172 669 842 78 100 118 118
Caterpillar 3500 533 307 2,134 2,253 224 233 208 213
Caterpillar 3600 251 215 1,809 1,921 168 175 147 147
Sum 3,095 1,858 10,748 12,002 1,598 1,901 1,269 1,285
Increase -40% 12% 19% 2%
Besides the effect on the other emissions, the reduction of NOx also affects the
electrical and the heat efficiency of the engines as illustrated in Figure 1. The
lower electrical efficiency at low NOx operation of the engines means that the
fuel consumption is increased in order to keep the power production constant.

DGC-report 22
Totally the fuel consumption for the gas engine will be increased by 1.5% if
NOx emissions are reduced from the present level to 250 mg/m3.
The reduction of NOx emissions leads to a slightly higher heat efficiency. This
combined with increased gas consumption means that the heat production will
increase by 2.4% due to the NOx reduction when the power production is kept
constant, see Table 6.
Table 6 Effect of reduction of NOx emissions from the present level to 250
mg/m3 @ 5% O2 on heat production and fuel consumption of the en-
gines
Electricity Natural gas Heat
Before After Before After
TJ/year TJ/year TJ/year
Jenbacher 600 909 2,203 2,219 1,231 1,229
Jenbacher 300 1,666 4,221 4,320 2,367 2,477
Rolls-Royce B 163 364 369 172 176
Rolls-Royce K 2,660 6,417 6,519 3,149 3,232
Wärtsilä 25 SG 566 1,369 1,388 716 722
Wärtsilä 34 SG 932 2,162 2,180 1,071 1,081
Caterpillar 3500 1,420 3,805 3,899 2,149 2,243
Caterpillar 3600 1,074 2,723 2,728 1,528 1,523
Sum 9,389 23,264 23,623 12,383 12,682
Increase
1.5% 2.4%
Basically, all engine based CHP plants have boiler units installed as well and
most the plants operate on market conditions. The heat demand of these plants
is covered by engines if the electricity price is sufficiently high. If not, the heat
is produced by boilers. In order to compensate the increased heat production
from the engines due to the NOx reduction it is assumed that the plants are
equipped with natural gas fired boilers, and that the heat production for these
are reduced accordingly in order to keep the heat production constant. A boiler
efficiency on 105% based on lower heating value is applied. The reduced oper-
ation of the boilers leads to lower total emissions from these boilers. The effect
on the emissions due to changed boiler operation is determined using the emis-
sion factors given in Table 7.

DGC-report 23
Table 7 Emission factors for natural gas fired boilers (<50 MW). From /5/.
NOx CH4 CO CO2
[g/GJ] [g/GJ] [g/GJ] [kg/GJ]
42 0.1 28 56,7
The effect on fuel consumption and emissions from the boilers is given in Ta-
ble 8. The table shows that the fuel consumption of the boilers will be reduced
by 285 TJ due to the compensation of the increased heat production from the
engines. This leads to a yearly reduction of the CO2 emissions of 16.1 million
ton. The other emissions are only modestly reduced.
Table 8 The effect on boiler operation in order to obtain constant heat pro-
duction despite change of engine operation.
Heat Natural
gas NOx CH4 CO CO2
million
TJ/year TJ/year ton/year ton/year ton/year ton/year
Jenbacher 600 2 2 0 0.00 0.0 0.1
Jenbacher 300 -110 -105 -4 -0.01 -2.9 -6.0
Rolls-Royce B -4 -3 0 0.00 -0.1 -0.2
Rolls-Royce K -82 -79 -3 -0.01 -2.2 -4.5
Wärtsilä 25 SG -5 -5 0 0.00 -0.1 -0.3
Wärtsilä 34 SG -10 -10 0 0.00 -0.3 -0.6
Caterpillar 3500 -93 -89 -4 -0.01 -2.5 -5.0
Caterpillar 3600 5 5 0 0.00 0.1 0.3
Sum -299 -285 -12 -0.03 -8.0 -16.1
Increase -1.2% 0% 0.0% -0.6% -1.3%
The overall consequences of NOx reduction by engine adjustment fuel con-
sumption and emissions are compiled and shown in Table 9.

DGC-report 24
Table 9 Consequence of reducing NOx emissions from the present levels to
250 mg/m3 (@ 5% O2). Effect of both changing engine operation and
the subsequent change in boiler operation in order to keep a con-
stant heat production is included.
Before After Reduction
Natural gas TJ/year 23.264 23.338 -74
NOx ton/year 3.095 1.846 1.248
CH4 ton/year 10.748 12.002 -1.254
CO ton/year 1.598 1.893 -295 CO2 million ton/year 1.269 1.269 0

DGC-report 25
8 Determination of effect on external costs
The specific external costs given as Euro per kg emitted for the different com-
ponents used in this report are based on investigations in the previous project.
For each of the engines #1 - #4 the external cost of different components in the
flue was determined /3/. It was concluded that NOx emissions are responsible
for practically all health related external cost. This is illustrated in Figure 4
showing the external costs related to electricity production for one of the exam-
ined engines.
Figure 4 External costs related to electricity production for one of the exam-
ined engines. Note the logarithmic axis.
The external costs were determined at the different operational conditions ex-
amined. The specific externality cost – measured as €/kg – varied by around
±10% depending on examined plant and engine settings. The ±10% variation
includes the influence of concentration level as well as height and geometry of
outlet of the chimney.
Furthermore, the effect of the location of the plant on the resulting externalities
was examined. In order to do so, three different locations representing three
different exposure levels were chosen, see Figure 5. It is found that externality

DGC-report 26
costs are 30-40% higher for NOx emitted in the medium-exposure location
compared to the same emission emitted in the low-exposure location. As high-
exposure location St. Valby west of Copenhagen was chosen. If the same en-
gine unit was located in St. Valby instead, the external costs would only in-
crease by 1-2% further in spite of the fact that it is expected to be a high-
exposure location. The reason for that moderate additional external cost is that
the chosen “high-exposure location” should have a location closer to Copenha-
gen in order to be a real “high-exposure location”.
Figure 5 Low-, medium- and high-exposure locations
However, as shown in Figure 4, only NOx emissions are relevant to consider
here as the external costs of the other components are negligible compared to
the cost related to NOx emissions.
8.1 Extrapolation of data for external costs
One of the purposes of this work is to determine the potential of reduction of
the total external costs related to combined heat and power production in the
engine based natural gas fired plants in Denmark.
Low exposure
Medium exposure
High exposure

DGC-report 27
In order to do so it is required to represent the health related costs for each of
the relevant species by one single aggregated value for specific external cost.
As shown earlier, only NOx is relevant to consider here as the external costs of
the other components are negligible compared to NOx. Health related external
costs can only be determined with a limited certainty. As the plants are widely
spread across the country it is chosen to apply an average value for all cases
analysed in /3/ located at the medium-exposure level location. The specific
external costs of the species, for which a negative health effect was found is
shown in Table 10.
Table 10 Specific external costs for species with a negative health effect
NOx CO HCHO C2H4
€/kg (NO2,eq) €/kg €/kg €/kg
7.6 9.3 10-4
1.3 10-3
0.29
The exposure of people due to an emission source depends on various factors:
Mass flow and composition of the source
Location of the source
Atmospheric dispersion
Atmospheric chemistry
As a part this project the emission rate from gas fired engines is determined
from a vast majority of the installed capacity of natural gas fired engine based
CHP units. From the previous project it was found that the effect of location of
the source as well as height and geometry of the chimney would have a modest
effect on determined external costs for NOx emissions.
The atmospheric chemistry is quite complex. The chemical reaction rates de-
pend on a number of factors, such as temperature and chemical composition.
Due to non-linear effects of the chemistry it is generally not possible to make
extrapolation of results determined for one source and apply this result for all
emissions in the whole country. The model described in section 4 determines
the health effects of an emission source. The health effect is caused by a
change in concentration of the individual components in the air people are ex-
posed to.
DGC-report 28
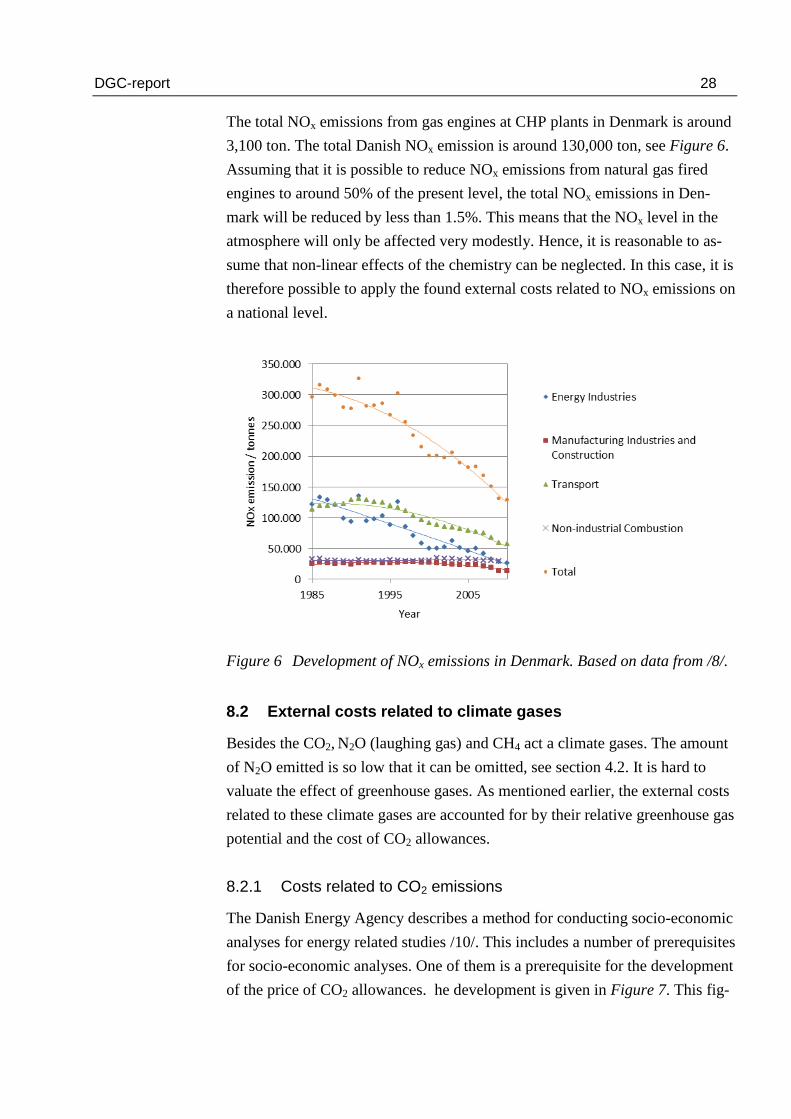
The total NOx emissions from gas engines at CHP plants in Denmark is around
3,100 ton. The total Danish NOx emission is around 130,000 ton, see Figure 6.
Assuming that it is possible to reduce NOx emissions from natural gas fired
engines to around 50% of the present level, the total NOx emissions in Den-
mark will be reduced by less than 1.5%. This means that the NOx level in the
atmosphere will only be affected very modestly. Hence, it is reasonable to as-
sume that non-linear effects of the chemistry can be neglected. In this case, it is
therefore possible to apply the found external costs related to NOx emissions on
a national level.
Figure 6 Development of NOx emissions in Denmark. Based on data from /8/.
8.2 External costs related to climate gases
Besides the CO2, N2O (laughing gas) and CH4 act a climate gases. The amount
of N2O emitted is so low that it can be omitted, see section 4.2. It is hard to
valuate the effect of greenhouse gases. As mentioned earlier, the external costs
related to these climate gases are accounted for by their relative greenhouse gas
potential and the cost of CO2 allowances.
8.2.1 Costs related to CO2 emissions
The Danish Energy Agency describes a method for conducting socio-economic
analyses for energy related studies /10/. This includes a number of prerequisites
for socio-economic analyses. One of them is a prerequisite for the development
of the price of CO2 allowances. he development is given in Figure 7. This fig-
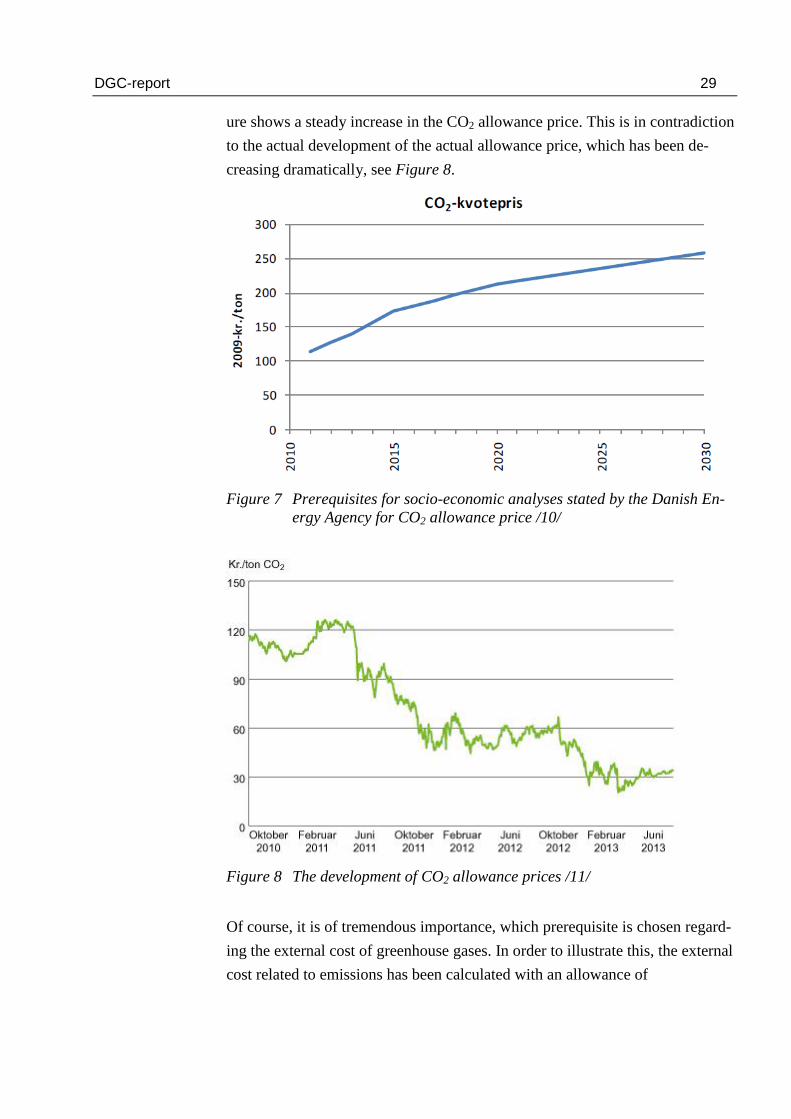
DGC-report 29
ure shows a steady increase in the CO2 allowance price. This is in contradiction
to the actual development of the actual allowance price, which has been de-
creasing dramatically, see Figure 8.
Figure 7 Prerequisites for socio-economic analyses stated by the Danish En-
ergy Agency for CO2 allowance price /10/
Figure 8 The development of CO2 allowance prices /11/
Of course, it is of tremendous importance, which prerequisite is chosen regard-
ing the external cost of greenhouse gases. In order to illustrate this, the external
cost related to emissions has been calculated with an allowance of

DGC-report 30
125 DKK/ton (16.6 €/ton) as well as with 30 DDK/ton (4 €/ton). This is illus-
trated in Figure 9. The 125 DKK/ton corresponds to the allowance price stated
as part of the prerequisites for socio-economic analyses stated by the Danish
Energy Agency for 2013 given in Figure 7. The 30 DKK/ton corresponds to
actual allowance in the first part of 2013, see Figure 8.
However, in both cases the total external costs related to emissions decreased
significantly by reducing emissions. This is because the emission of green-
house gases is not nearly as sensitive to variations in engine settings as the NOx
emissions.
CO2 allowance price 30 DKK/ton
CO2 allowance price 125 DKK/ton
Figure 9 External costs related to electricity production for a natural gas
fired engine depending on engine settings and applied cost for CO2
allowances
With the specific external costs of different components described above the
effect of changed emissions due the NOx reduction can be valuated. The con-
sequences in terms of external emissions are given in Table 11. It is shown that
the positive effect of NOx reduction by far exceeds the negative impact it has
on CH4 emission, as the reduced NOx emissions lead to a reduction in external
costs of 9.5 M€, while the increased CH4 emission results in extra external
costs of 0.5 M€.

DGC-report 31
Table 11 Consequences on external costs related to emissions of reducing the
NOx emissions from natural gas fired CHP based engines from the
present levels to 250 mg/m3 (@ 5% O2). CO2 allowance price: 125
DKK/ton (16.3 €/ton).
Before After Reduction
NOx M€/year 23.5 14.0 9.5
CH4 M€/year 4.5 5.0 -0.5
CO M€/year 0.0 0.0 0.0
CO2 M€/year 21.1 21.1 0.0
Total M€/year 49.2 40.2 9.0

DGC-report 32
9 Welfare economic analysis
A welfare analysis was conducted. This section presents a brief summary of the
analysis. For details please refer to /13/.
A welfare economic analysis assesses the overall economic impact on society.
As just shown, emission of harmful substances has negative consequences due
to e.g. health effects and climate effects. However, that is not the only effect of
a reduction of NOx emissions by engine adjustment. Other issues are described
in this section.
9.1.1 Fuel costs
The NOx reduction also leads to a change in natural gas consumption. The
money required to cover the costs of additional natural gas could have been
used elsewhere in the society, and should therefore be included in the analysis.
A natural gas price of 6.66 €/GJ is applied. The cost related to changed gas
consumption is 496,190 €.
9.1.2 Maintenance costs
Operation of engines and boilers leads to service and maintenance costs. Gas
engine service costs are normally paid according to a service contract that
states a certain cost per produced MWh of electricity. The method applied in
this work assumes constant power production. Therefore, the service and
maintenance cost for engine operation is unaffected.
The boiler operation is reduced corresponding to 285 TJ heat of production.
Service and maintenance costs for boilers are set to 5 DKK/MWhheat /14/. This
corresponds to 185 €/TJheat.
The total maintenance costs are increased by 52,700 € due to NOx reduction.
9.1.3 Taxes
A change in emissions and gas consumption will lead to a change in taxes.
Energy taxes are paid according to gas consumption by boiler and engine. The
tax depends on whether gas is used in engines or in boilers. CH4 tax is only
paid for the natural gas used in engines. CH4 emissions from boilers are so low

DGC-report 33
that they are not subject to taxation. Tax rates are different for boilers and en-
gines. The effect on the different taxes is given in Table 12.
Table 12 Yearly effect on taxes due to reduction of NOx emissions by means of
engine adjustment. From /13/.
€
Energy tax – engines 1,145,837
Energy tax – boilers -1,880,740
CO2 tax - engine and boiler 90,765
CH4 tax – engine 75,209
NOx tax – engines -4,123,333
NOx tax – boilers -40
Total -4,692,303
The reduced tax payment shown in Table 12 represents the loss in income for
the state.
9.2 Welfare economic valuation
If the expenses of the state should be unaffected by a decrease in the NOx
emissions the tax loss should be covered by increasing other taxes. This leads
to a so-called Tax Distortion Loss which is 0.2 € per € collected through com-
pensatory tax increases. This means that the net value of tax loss due to re-
duced NOx emissions are 4,692,303 € 0.2 = -938,461 €.
To get the welfare economic accounting price of goods like natural gas, which
has a market price, the market price must be increased by the so-called Net Tax
Factor, NTF, which is 1.17. By multiplying the market price of a commodity
with NTF the value of commodities that alternatively could have been bought
by consumers measured in consumer prices is obtained.
External costs due to emissions can be valuated in different ways. One way is
to valuate the consequence in terms of reduced number of days at work due to
illness, costs related to hospitalisations etc. Another way is to apply the will-
ingness to pay in order to reduce the risk of e.g. mortality. Here it is assumed
that the latter is dominant. Therefore, the external costs are not multiplied by
the Net Tax Factor in the welfare economic valuation.

DGC-report 34
Table 13 Welfare economic consequence of reduction of NOx emissions by
means of engine adjustment. From /13/.
Conse-quences
Accounting Price Value/Costs €
Natural gas consumption
+ 74,4 TJ 496,190 € ∙ 1,17 580,542
Maintenance costs
- 52,685 € - 52,685 €, ∙ 1,17 -61,641
Tax yield -4,692,303 € 4,692,303 € ∙ 0,2 938,461
External costs See Table 9 8,970,374 € 8,970,374
Total costs 10,427,735
This means that the total welfare economic consequence of NOx reduction by
means of engine adjustment is 10.4 M€ per year for Denmark as a whole.
9.3 Financial analysis
The welfare economic analysis described above examines the welfare-related
consequences of optimising NOx emissions from gas fired engines. The conse-
quences include consequences for resource use as well as environmental con-
sequences caused by emission changes. By valuation of the consequences it is
examined if the NOx optimisation represents a welfare improvement or a wel-
fare loss to society.
The financial analysis examines the economic consequences for the owners of
the combined heat and power plants that optimise their NOx emissions. The
financial consequences include changes in natural gas expenses, maintenance
costs and tax payments. The consequences are summarised in Table 14.
Table 14 Welfare economic consequences of reduction of NOx emissions by
means of engine adjustment. From /13/.
Financial costs
€
Natural gas consumption 496.190
Maintenance costs -52.686
Tax payments -4.692.303
Total costs -4.248.799
This means that the total financial consequence of NOx reduction by means of
engine adjustment is a gain of 4.2 M€ per year for Danish CHP plants as a
whole.

DGC-report 35
9.4 Discussion of the financial analyses
However, valuation of the health consequences and especially valuation of
changes in mortality resulting from changes in NOx emissions included in the
standard price of NOx is open to discussion. In fact, the standard price depends
to a considerable extent on the welfare value of changes in mortality, and this
value is highly uncertain. Therefore, the welfare economic net gain of optimis-
ing NOx emissions is almost equally uncertain, as the effect of external costs
due to NOx emissions contributes an 85% total welfare economic net gain.
If it is accepted that optimising NOx emissions will lead to a welfare gain,
power companies should be encouraged to optimise.
The financial analyses show that with the present tax rules the CHP plants al-
ready have an economic incentive to reduce NOx emissions. However, it is
assumed in this simplified analysis that the NOx reduction can be obtained
without having to perform any investments.
Required investments will vary significantly from plant to plant. In order to
obtain a reduction in NOx tax the plants must be able to document the NOx
emissions for each engine unit. This requires separate gas meters for each en-
gine. Alternatively, the tax can be paid according to emissions from the engine
with the highest NOx emissions. For some engine units it is required to replace
the whole control system of the engine in order to assure stable engine opera-
tion at low NOx conditions. Furthermore, the NOx tax yield is overestimated for
some of the engine models. In this work it is assumed that NOx tax is paid ac-
cording to actual emissions. However, this is not always the case. It is also pos-
sible to apply a standard tax rate only depending on gas consumption. This
standard rate is 140g/GJ corresponding to 450 mg/m3(n) @ 5% O2. Engines
with higher NOx emissions will choose to pay according to this level instead of
the actual emission rate. On the other hand, at some plants with engines with
NOx emissions lower than the standard emission factor pay taxes according to
the standard factor, if required investment costs exceed the expected gain in
terms of lower NOx emission tax.

DGC-report 36
10 References
/1/ Nielsen, O.-K., Plejdrup, M., Hjelgaard, K., Nielsen, M., Winther,
M., Mikkelsen, M.H.,Albrektsen, R., Fauser, P., Hoffmann, L. &
Gyldenkærne, S. 2013. Projection of SO2, NOx, NMVOC, NH3
and particle emissions - 2012-2035. Aarhus University, DCE –
Danish Centre for Environment and Energy, 151 pp. Technical
Report from DCE – Danish Centre for Environment and Energy
No. 81.
/2/ Environmental optimisation of natural gas fired engines,
DGC report R1005, 2010.
/3/ Environmental optimisation of natural gas fired engines – calcula-
tion of health externalities. Lise Marie frohn, Morten Søes Hansen,
Mikael Skov Andersen, Jesper Christensen, Ole Hertel, Jeremy
David Silver and Heidi Villadsen. DMU report 2010.
/4/ Emissionskortlægning for decentral kraftvarme 2007. Energinet.dk
Miljøprojekt nr. 07/1882. Delrapport 4. April 2010.
/5/ http://www,dmu,dk/fileadmin/Resources/DMU/Luft/e
mission/2010/emf_internet_januar2011_GHG,htm
/6/ Faster CHP gas engine start with less emission. DGC report
R0708. 2007.
/7/ “Nye global warming potential faktorer” Note form the Danish
energy agency, Energistyrelsen 13.06.2013.
/8/ http://www,dmu,dk/fileadmin/Resources/DMU/Luft/emission /
emissionshjemmesiden/Table_NOx,htm
/9/ Personal communication with Jørgen Brandt, DMU.
/10/ Forudsætninger for samfundsøkonomiske analyser på energiom-
rådet. Energistyrelsen . April 2011.
/11/ http://energinet.dk/DA/GAS/Aktuelle-temaer-ny/Det-europaeiske-
gasmarked-udvikles-og-udfordres/Sider/Lave-CO2-kvotepriser-
saetter-gassen-under-pres.aspx
/12/ Environmental optimisation of natural gas fired engines. Meas-
urement of emissions of and efficiencies of natural gas and biogas
fired engines. DGC report R1309. 2013.
Rolls-Royce Type K gas engine.
40
41
42
43
44
45
40 60 80 100 120 140 160NOx / ppm.
hel /
%
85
87
89
91
93
95
hto
t / %
Electrical efficiencyOverall efficiency
Measured emissions and efficiencies for one of the examined engines.
Specific cost of externalities for one of the examined
engines

DGC-report 37
/13/ Socio-economic consequences of optimising NOx emissions from
gas fired engines, Flemming Møller. Aarhus University, Institute
of Environmental Science. December 2013.
/14/ Technology Data for Energy Plants, Energistyrelsen and Ener-
ginet.dk. October 2013.