environmental impacts of the waste paper trade and ...pubs.iied.org/pdfs/8129iied.pdfthe economic...
TRANSCRIPT
The Economic andEnvironmental Impacts ofthe Waste Paper Trade andRecycling in India: aMaterial Balance Approach
Pieter van Beukering and AnanthaDuraiappah
CREED Working Paper Series No 10
November 1996

Drs Pieter van Beukering and Anantha Duraiappah are research economists at the Institute forEnvironmental Studies (IVM) in the Netherlands. They may be contacted at:
Institute for Environmental Studies (IVM)Vrije Universiteitde Boelelaan 11151081 HV Amsterdamthe Netherlands
direct tel Fax: Email:P van Beukering: (31) 20 444 9524 (31) 20 444 9553 [email protected] Duraiappah: (31) 20 444 9564 (31) 20 444 9553 [email protected]

The programme of Collaborative Research in the Economics of Environment and Development (CREED)was established in 1993 as a joint initiative of the International Institute for Environment and Development(IIED), London, and the Institute for Environmental Studies (IVM), Amsterdam. The Secretariat forCREED is based at IIED in London. A Steering Committee is responsible for overall management andcoordination of the CREED Programme.
Environmental Economics Programme, IIED
IIED is an independent, non-profit organisation which seeks to promote sustainable patterns of worlddevelopment through research, training, policy studies, consensus building and public information. TheEnvironmental Economics Programme is one of seven major programmes of IIED; it conducts economicresearch and policy analysis for improved management of natural resources and sustainable economicgrowth in the developing world.
Environmental Economics ProgrammeIIED, 3 Endsleigh StreetLondon WC1H 0DD, UKTel (44 171) 388 2117; Fax (44 171) 388 2826e-mail: [email protected]
Institute for Environmental Studies, (IVM)
IVM is a non-profit research institute, based at Vrije Universiteit, Amsterdam. The Institute's primaryobjective is to carry out multi- and interdisciplinary research on environmental issues, based on cross-fertilisation of monodisciplinary sciences. Environment and the Third World is one of eight major IVMresearch programmes.
IVM, Vrije UniversiteitDe Boelelaan 11151081 HV AmsterdamThe NetherlandsTel: (31 20) 444 9555; Fax: (31 20) 444 9553e-mail: [email protected]
CREED Steering Committee members include:
Prof Johannes Opschoor, Institute for Social Studies, The Netherlands (Chair)Prof Gopal Kadekodi, Institute of Economic Growth, IndiaDr Ronaldo Seroa da Motta, IPEA, BrazilDr Mohamud Jama, Institute for Development Studies, KenyaDr Anantha Duraiappah, IVM, The NetherlandsProf Harmen Verbruggen, IVM, The NetherlandsJoshua Bishop, IIED, UKMaryanne Grieg-Gran, IIED, UK
Acknowledgements
The authors thank G.D. Badrinath, Rupa Banerjee, Prakash Bhat and Kasturi of Intervention (India)Ltd for their full support during the field surveys. We are also grateful to staff at the Indira GandhiInstitute of Development Research in Bombay for their hospitality. We were grateful for thecomments of Dr. Ramanathan, Dr. Vijaya Lakshmi, Nandini Hadker, Dr. V.K.Sharma, Dr. K.V.Ramaswamy and Dr. Rajendra Vaidya. Comments from Prof.dr. David Kendrick, Dr. Konrad vonMoltke, Prof.dr. N.J. Rao and Huib Jansen were also of great value. We also acknowledge thevery useful advice from Dr. Xander Olsthoorn and Michiel van Drunen. The provision of data byMaryanne Grieg-Gran, Jaqueline Bloemhof, Ian Cooper, Jacques Lahaussois and E. Brouwer weregreatly appreciated. Finally, we thank all the entrepreneurs in the Indian paper cycle who offeredtheir valuable time to co-operate with the field survey.
Abstract
There have been increasing pressures by some governments and non-governmental organisations torestrict the international trade in waste on the premise that each nation should manage its own wasteproduction. Focusing on the Indian waste paper industry, we develop a Material Balance FlowModel to investigate if free trade in non-toxic waste can contribute to economic development andsimultaneously reduce environmental degradation. The model is formulated as a non-linearprogramming model with an objective function which minimises environmental and economic costs.The model in principle describes the life cycle of Indian paper. Preliminary results suggest that tradein waste paper is both economically and environmentally advantageous. The results also show thatdomestic and imported waste paper are complementary and that the import of waste paper does not“crowd out” the domestic waste paper sector.
Abrégé
Quelques gouvernements et ONG exercent depuis un certain temps une pression croissante pour larestriction du commerce international des déchets, ayant la conviction qu'il revient à chaque pays derésoudre ses propres problèmes d'élimination des déchets. Nous établissons dans ce document unModèle de Flux à Équilibre Physique afin d'étudier la possibilité qu'un libre commerce des déchetsnon-toxiques puisse contribuer au développement économique tout en réduisant simultanément ladégradation de l'environnement. Il s'agit d'un modèle de programmation non-linéaire doté d'unefonction objective qui minimise les coûts environnementaux et économiques. Le modèle décrit, enprincipe, le cycle de vie du papier en Inde. Les résultats préliminaires semblent indiquer que lecommerce du papier de récupération est avantageux aussi bien économiquement qu'au plan del'environnement. Ils font aussi apparaître la complémentarité du papier de récupération domestiqueet importé et montrent que les importations de papier de récupération «n'étouffent» pas le secteurdomestique de la récupération de papier.
Resumen
A partir de la creencia de que cada país debe responsabilizarse por sus propios problemas deeliminación de desechos, existe una presión creciente por parte de gobiernos y de organizaciones nogubernamentales para restringir el comercio internacional de los mismos. En este ensayodesarrollamos un “Modelo de flujo de equilibrio material” para investigar si el libre comercio dedesechos no tóxicos puede contribuir al desarrollo económico y reducir al mismo tiempo eldeterioro ambiental. El modelo está concebido como un modelo de programación no lineal cuyafunción objetiva busca minimizar los costos ambientales y económicos. En principio el modelodescribe el ciclo de vida del papel en la India. Los resultados preliminares muestran que elcomercio de desechos de papel es beneficioso tanto ambiental como económicamente. Losresultados también sugieren que los desechos domésticos e importados de papel se complementan yque la importación de desechos no elimina de la competencia a la producción doméstica.
Contents
Introduction 1
The Indian paper cycle 4
Methodology 6
Results 11
Conclusions 17
Appendix - The mathematical model 18
References 24
CREED Working Paper Series 10 1
Introduction
Recycling may generally be considered as a key strategy for alleviating the pressures of society onthe environment. A variety of environmental justifications for recycling exist: recycling processesreduce demand for energy and finite resources, result in less water pollution and air emissions andmitigate the problem of solid waste disposal. In particular, recycling paper reduces the pressure onnatural resources such as forests. Moreover, recycling may be considered economically beneficial indeveloping countries. First, it provides significant employment opportunities to a large informalsector. The high degree of labour intensity of certain reclamation processes enables numerouspeople to accrue some kind of income. Second, recycling can reduce the costs for raw materials inthe production process and thereby may result in an increase in the supply of cheaper products.Third, it can reduce dependence on foreign resources and thereby saves on expenditure on importsin developing countries. Finally, in Asia particularly, the anticipated high growth in GDP willsignificantly increase the waste disposal burden in most metropolitan areas. Besides generatingnegative impacts on the environment, the increasing economic costs of solid waste disposal willabsorb a substantial amount of the municipal budgets. Recycling will reduce the quantity of solidwaste.
Is recycling in the South any different from recycling in the North? To answer this question it isimportant to clearly understand the different features of recycling. In common vocabulary, recyclingis used as a general term for all activities related to the reclamation of waste. However, a distinctionshould be made between the recovery of solid waste and the utilisation of secondary materials inthe production process. The technical and economic aspects of the actual utilisation process do notdiffer significantly from production in industrialised and developing countries. Yet, the motivation torecover differs substantially. Recovery in most developing countries is mainly a market drivenphenomenon with a comprehensive domestic trade system. It is expanding and developing rapidlywithout any governmental support. In contrast, recovery in the industrialised world is mainlyenvironmentally motivated and public participation and government involvement play a much moreimportant role (Beukering 1994).
Besides this regional difference in the motivations for recycling, differences occur between theconfiguration of demand and supply in recyclable waste. Given the high levels of per capita wastegeneration, the supply of secondary waste materials is generally abundant in the North; withgovernments promoting the separation of waste at source, this has led to an over-supply ofsecondary materials. In developing countries, conditions are different; relatively low levels of wastegeneration and the long life span of products depress the quantity and quality of the supply ofsecondary materials.
CREED Working Paper Series 10 2
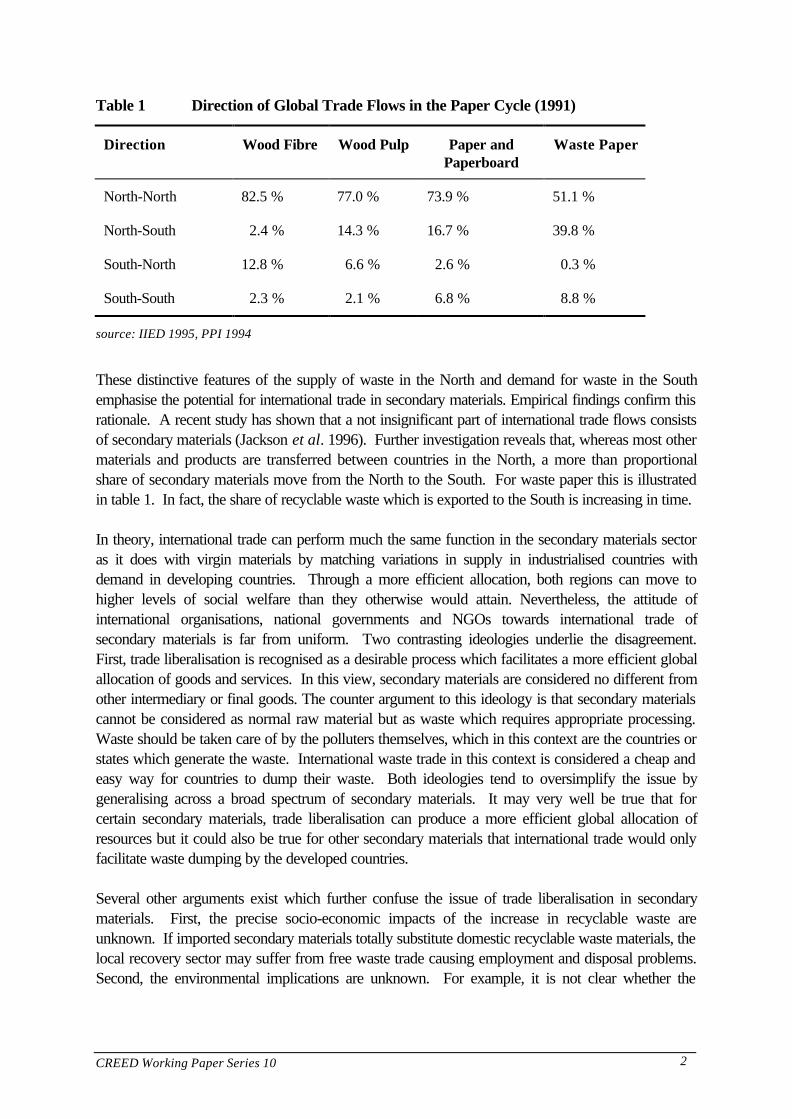
Table 1 Direction of Global Trade Flows in the Paper Cycle (1991)
Direction Wood Fibre Wood Pulp Paper andPaperboard
Waste Paper
North-North 82.5 % 77.0 % 73.9 % 51.1 %
North-South 2.4 % 14.3 % 16.7 % 39.8 %
South-North 12.8 % 6.6 % 2.6 % 0.3 %
South-South 2.3 % 2.1 % 6.8 % 8.8 %
source: IIED 1995, PPI 1994
These distinctive features of the supply of waste in the North and demand for waste in the Southemphasise the potential for international trade in secondary materials. Empirical findings confirm thisrationale. A recent study has shown that a not insignificant part of international trade flows consistsof secondary materials (Jackson et al. 1996). Further investigation reveals that, whereas most othermaterials and products are transferred between countries in the North, a more than proportionalshare of secondary materials move from the North to the South. For waste paper this is illustratedin table 1. In fact, the share of recyclable waste which is exported to the South is increasing in time.
In theory, international trade can perform much the same function in the secondary materials sectoras it does with virgin materials by matching variations in supply in industrialised countries withdemand in developing countries. Through a more efficient allocation, both regions can move tohigher levels of social welfare than they otherwise would attain. Nevertheless, the attitude ofinternational organisations, national governments and NGOs towards international trade ofsecondary materials is far from uniform. Two contrasting ideologies underlie the disagreement.First, trade liberalisation is recognised as a desirable process which facilitates a more efficient globalallocation of goods and services. In this view, secondary materials are considered no different fromother intermediary or final goods. The counter argument to this ideology is that secondary materialscannot be considered as normal raw material but as waste which requires appropriate processing.Waste should be taken care of by the polluters themselves, which in this context are the countries orstates which generate the waste. International waste trade in this context is considered a cheap andeasy way for countries to dump their waste. Both ideologies tend to oversimplify the issue bygeneralising across a broad spectrum of secondary materials. It may very well be true that forcertain secondary materials, trade liberalisation can produce a more efficient global allocation ofresources but it could also be true for other secondary materials that international trade would onlyfacilitate waste dumping by the developed countries.
Several other arguments exist which further confuse the issue of trade liberalisation in secondarymaterials. First, the precise socio-economic impacts of the increase in recyclable waste areunknown. If imported secondary materials totally substitute domestic recyclable waste materials, thelocal recovery sector may suffer from free waste trade causing employment and disposal problems.Second, the environmental implications are unknown. For example, it is not clear whether the
CREED Working Paper Series 10 3
environmental damage resulting from increased transportation outweighs the environmental gainsfrom an increase in overall recycling.
To address and resolve the arguments raised by the two ideologies, this study focuses on wastepaper as the secondary material. Waste paper is selected because of its long tradition at theinternational market. Moreover it is increasingly being collected in both industrialised anddeveloping countries. India is selected for several reasons. First, India is a large country with agrowing demand for raw materials in the rapidly developing domestic industries. Also, India hasseveral metropolitan cities where comprehensive recycling networks already exist and are growing.Thirdly, importing waste paper is not new and at present many paper industries in India areswitching from virgin materials to imported waste paper. The main objective of this study is toaddress the economic and environmental challenges and threats to India which arise from increasedinternational trade in waste paper. The outcome of this project will be particularly relevant toinstitutions and governments in developing countries to ensure that their international waste tradepolicies generate the desired impact on the local economy and the domestic recycling sector inparticular. Similarly, the results can support industrialised countries in their decision to prohibit orencourage the trade in waste paper.
The paper is structured as follows. In Section 2 the current Indian paper cycle is described in termsof production, consumption, waste management and international trade. Economic andenvironmental parameters will be explained and technical coefficients will be set. In Section 3 thematerial balance flow model is introduced. The economic and environmental assumptions underwhich optimalisation will occur are elaborated on. The results of the economic and environmentaloptimalisation are presented in Section 4. Finally, general conclusions and policy implications areprovided in Section 5.
CREED Working Paper Series 10 4
The Indian Paper Cycle
The paper industry in India is more than a century old. Commercial production of paper started asearly as 1879. Limitations with respect to forest-based raw materials forced the Indian paperindustry, in these early stages of the development, to utilise non-conventional materials. India wasthe first country in the world to have a paper mill which relied entirely on bamboo as its primaryfibre. Following this example, various other non-conventional raw materials were introduced suchas straw, bagasse, textile and waste paper. Throughout the century, this development was stronglysupported by the Indian government (Rao 1989).
At present, several developments and problems prevail in the Indian paper cycle. First, with theprospect of growing urbanisation, increasing literacy rates and general increasing economic growth,the consumption of paper and paperboard products is expected to grow considerably in the comingyears. The Indian citizen on average consumes approximately 3 kg of paper each year. Althoughlow compared to the annual per capita consumption of paper in Japan and the United States whichis respectively 234 kg and 298 kg, this figure is expected to increase over the coming decades(FAO 1993). Moreover, it should be realised that the official statistics do not account for theconsumption of re-used paper. Therefore, the actual per capita paper consumption in India isslightly higher.
Second, the lack of foreign currency has forced the Indian government to strive for self-sufficiency inpaper production. Throughout the years, dependency on imports of most types of paper and pulphas decreased. Today, only newsprint is still being imported on a substantial scale. On the onehand, this was achieved by imposing import constraints on final paper products as well as rawmaterials. On the other hand, various incentives were provided to the paper industry to increaseproduction. As a result of these developments, India, after China, accounts for the largest number ofpaper mills in the world. Paper is produced at all scales, varying from handmade paper units tolarge scale integrated mills. However, despite government support, the overall performance of theindustry is low with a constant decrease in capacity utilisation. In the last decade the Indiangovernment adopted a number of measures to improve efficiency. Not only were foreign producersallowed to enter the Indian consumers’ market, they were actually allowed to become established inIndia itself. Also, various import constraints are now being lifted such as the decrease in importtariffs for pulps, paper and paper board.
Third, the Indian paper industry is traditionally suffering from a lack of raw materials. Forest is notan abundant natural resource in India. In 1993 only 19.5% of the total land surface was coveredwith forest (FAO 1993a). Due to alternative land-uses such as crop production and hydroelectricprojects, the forest in India is declining rapidly at an annual rate of 0.6% (World Resources Institute1994). Another factor which limits the indigenous supply of wood-fibre is the low productivity ofthe Indian forest. While forests in Europe and the US increase approximately by 2.5 m3 per hectareeach year, the Indian forests grow no more than 0.5 m3 per hectare (Rao 1989). This shortage haspromoted the utilisation of non-conventional raw materials. The share of wood-pulp based paperhas declined from 65 per cent in 1985 to 49 per cent in 1992, while the share of agro- pulp basedpaper increased from 22 per cent to 29 per cent during the same period. The sharpest rise has taken
CREED Working Paper Series 10 5
place in the share of waste paper production which has risen from 13 per cent to 22 per cent overthe same period (Khanolkar 1995).
Fourth, the environmental profile of the Indian paper industry is not very positive. Energyconsumption is relatively higher than the international standard, due to interruptions in production, thepoor quality of fuel and equipment, and the relatively low rate of waste paper utilisation in theproduction. Even more important is the environmental impact of water pollution and consumption.Pollutant emissions in the waste water are generally higher than the international average and waterrecycling systems are only slowly making their entry in the Indian paper industry. Similar conclusionscan be drawn for air emissions and solid waste. The Indian government recognises the significantpressure of the paper industry on the environment and has intensified the enforcement ofenvironmental regulations. This has forced many paper mills to switch from the polluting agro-basedraw materials to waste paper which causes much less pollution. Alternatively, effluent treatmentplants have been installed. Nevertheless, especially the small-scale units lack the funds to improvetheir environmental performance and therefore are threatened with closure.
Fifth, not only are conventional raw materials becoming increasingly scarce in India, waste paperand agro-residues are also in limited supply. The yield percentage of agro-residues fibres is ratherlow (33% for bagasse and 38% for straw). The low productivity has to be weighted against thetransportation element of this commodity. It is reported that the economic distance for hauling thestraw is 50 kilometres from the mill although examples of a radius of 100 km are not uncommon(Roberts 1995). In the case of waste paper, the intensive use and re-use of paper in India oftendecreases its quality which makes it less suitable for recycling. As a result, international supply in theIndian paper cycle is proving to be more important. While in 1975, only 4% of the Indian paperoriginated from imported waste paper, this rate had increased to 12% in 1994 (Beukering et al.1996a).
Finally, an important development in the Indian paper cycle is the rapidly increasing problem ofwaste. Rapid urbanisation and economic growth increase waste and at the same time reduce theavailable landfill space. Although paper is less important in waste in developing cities than inindustrialised countries, it still comprises a significant part of the volume. Because of inefficienciesand limited municipal budgets, a large share of the waste remains uncollected causing sewerageblockage and visual and odour pollution. Inappropriate waste management leads to a number ofsocietal problems, such as increased risks of epidemics, air pollution caused by illegal waste burningand pollution of groundwater. These problems emphasise the importance of the informal wasterecovery sector which operates in most Indian cities. In Bangalore, a growing urban centre, it hasbeen estimated that 15% of the municipal waste is diverted from dumpsites because of recyclingactivities (Baud and Schenk 1994). Despite these positive contributions to urban wastemanagement, waste recovery receives little attention from most municipalities (Beukering et al.1996b). This may be explained possibly by the lack of insight into the socio-economic andenvironmental benefits of recycling throughout the life cycle of different materials. The developmentof a material flow model of a secondary material can serve to improve this understanding.
CREED Working Paper Series 10 6
Methodology
A sectoral model is developed to analyse the economic and environmental effects of internationaltrade in waste paper for the paper sector in India. A mathematical description is provided in theappendix. Sectoral models have been extensively used in the design and planning of industrialsectors (Kendrick and Stoutjedijk 1978). However, the early models were primarily formulated aseconomic planning models did not focus on environmental impacts. As the importance ofenvironmental issues has grown over the last decade, it has became imperative to look not just at theeconomics of sectoral planning but also at the environmental aspects. The model formulated for thispaper is in response to this increasing need.
The sectoral model formulated for this study captures in essence the life cycle of paper at each stageof the process, from harvesting the forest to the disposal of the waste paper. By incorporating a lifecycle within a sectoral model framework, we are able to: (1) keep track of the use and productionof the various materials (life cycle analysis); and to (2) evaluate the trade-offs that occur betweeneconomic and environmental impacts at each stage of the paper cycle (sectoral analysis).Moreover, the paper industry is characterised by multi-processes and multi-products at each stage.Therefore, to ensure that these processes and products are captured by the model, the singleproduct model is extended to a multi-process, multi-product life cycle sectoral model. Furthermore,to facilitate comparisons between different objectives which can be adopted by the decision maker,the model is developed as a static optimisation model.
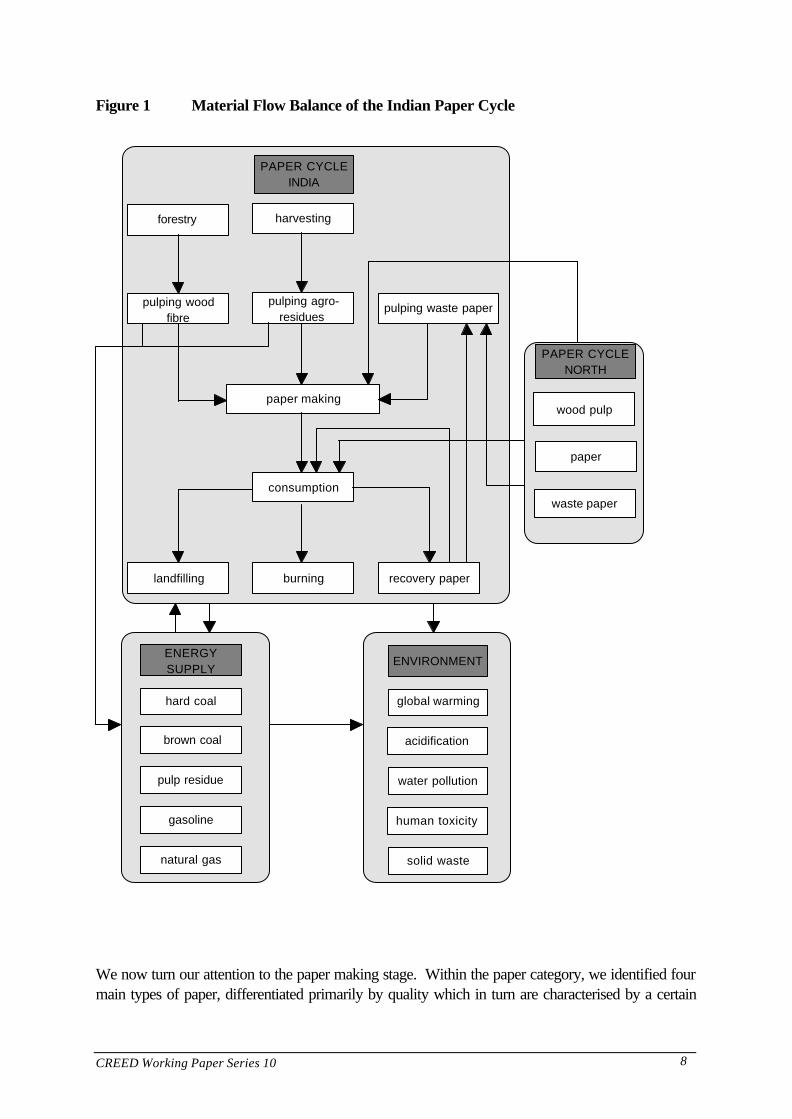
As the focus of this paper is on the Indian paper cycle, we simplify the analysis by assuming the restof the world as exogenous and reduce its role to a supplier of waste paper, pulp and finished paper.It is beyond the scope of this paper to investigate the global economic and environmental impacts ofthe liberalisation of trade in waste paper. Figure 1 provides a schematic illustration of the Indianpaper cycle. As shown in this figure, we have included the environmental impacts caused by energyuse in the paper industry. However, unlike many of the existing studies (Weaver 1995, Virtanen andNilsson 1993), we allow the decision maker to choose the optimal mix of fuels which arecomplementary to his objective. We have also included the surplus energy property of some pulpingprocesses. For example, the unbleached sulfate pulping process produces wood residue which is aby-product of the pulping process, which in turn can be used to produce electricity and steam. Theenvironmental impacts of each energy producing process is tabulated to the cumulative pollutantemission for the paper industry. In this manner, in the optimising process, depending on theobjective, an analysis of trade-off can be made with respect to the cost of the fuel versus theenvironmental impacts caused by the particular fuel. For example, brown coal may be a relativelyabundant and cheap source of fuel but is considered environmentally unfriendly whereas natural gasmay be a relatively scare fuel with high import costs but is considered environmentally friendly.
We have included the six main pulping processes which are presently relevant in India: bleachedsulfite, unbleached sulfate, unbleached local waste paper, unbleached imported waste paper,bleached sulfate, and bleached agro. These six processes may be categorised basically into threemain methods. The first method uses wood fibre as the main input, while the second usesagricultural residue and the third relies on waste paper. The three processes (bleached sulfite,unbleached sulfate, bleached sulfate) within the wood fibre category are in turn differentiated by
CREED Working Paper Series 10 7
chemical use and intensity, energy intensity, and finally the pollutant emission intensity. Each of thesethree processes produces a unique type of pulp which is then used in the final paper making process.In the agro based category, only one process is identified. The third category which uses wastepaper has two processes, one using local waste paper while the other uses imported waste paper.
As in the case of choice of energy source, the choice of pulping processes is dependent on theobjective. Once an objective has been specified, the optimal choice selection process undergoes arigorous analysis of trade-offs. However, unlike in the energy selection process, the analysis oftrade-offs at this stage is a more complex and involves two layers. At the first layer of analysis, theeconomic costs of pulp production have to be weighted against the environmental costs caused bythe respective pulping processes. In the case of imported waste paper pulping process, theenvironmental costs accruing from transportation are included in the analysis. The second layer ofanalysis takes into consideration the economic and environmental costs and benefits which arederived from some of the pulping processes which produce surplus energy.
CREED Working Paper Series 10 8
Figure 1 Material Flow Balance of the Indian Paper Cycle
PAPER CYCLEINDIA
harvesting
pulping wood fibre
pulping agro-residues
pulping waste paper
paper making
consumption
landfilling burning recovery paper
forestry
wood pulp
paper
waste paper
PAPER CYCLENORTH
ENVIRONMENT
global warming
acidification
water pollution
human toxicity
solid waste
ENERGY SUPPLY
brown coal
pulp residue
gasoline
natural gas
hard coal
We now turn our attention to the paper making stage. Within the paper category, we identified fourmain types of paper, differentiated primarily by quality which in turn are characterised by a certain
CREED Working Paper Series 10 9
mix of pulps. We formulated the input-output coefficient for this stage as an endogenous variablewhich is determined by the optimisation process. We model the process in the following way. Webegin by fixing the total amount of pulp which is required for each paper type. Next, we specify apulp combination possibility matrix which in essence specifies the maximum percentage (an upperlimit) a particular pulp can be used in the production of a particular paper type. For example, giventhe quality characteristics, waste paper can only be used to a limited extent for the production ofwriting paper. It is then left to the optimisation process to choose the optimal mix of the differentpulps to make the respective paper types.
The disposal stage is characterised by four different options. First, waste paper collection includescertain economic and environmental costs. Once collected, the waste paper can be either burned,landfilled, used as waste paper in the pulping process or reused to meet final demand of the lowestquality paper. The options are not mutually exclusive. Each option is characterised by its uniqueeconomic and environmental properties.
We identified five major environmental impacts, regional as well as global, for this study:
• Global Warming Potential• Human Toxicity• Water Pollution• Acidification• Solid Waste.
The mapping from production to environmental impact was undertaken in the following manner.Each stage of production is characterised by a technological input-output matrix. From thesetechnological matrices, we are able to tabulate the emissions of all the pollutants from every activity.The emissions are then added and a final emission level for each pollutant is determined. The nextstage involves mapping the pollutant emissions to the five environmental impacts. We do this withthe help of an environmental impact matrix which, similar to an input-output matrix, lists thecontribution a unit of each pollutant makes to each of the five environmental impacts. The data forthis environmental impact matrix was largely developed from Lim and Lindemeyer (1994) and theIPCC (1996).
At this point, we have two options of modeling the environmental factor in the model. We couldeither monetize the eco-profiles or specify eco-profile constraints explicitly in the model. We chosethe former as this method would allow us to conduct an extended cost-benefit analysis while thelatter would allow only a partial cost-benefit analysis. The decision was further prompted by theexistence of, albeit crude, damage estimates for the five environmental impact causes. The secondmethod would involve the specification of constraints for each of the five environmental impacts. Thismethod would require us first to identify the upper bounds for each environmental impact at thenational or international level, after which we would need to allocate a certain portion of thatconstraint to the paper industry. We felt that a complete cost-benefit analysis, even with crude costestimates, would provide more insight into the problem than a partial cost-benefit analysis withexogenously specified environmental constraints. However, the model structure may easily bemodified to include the constraints at a later stage if necessary.
CREED Working Paper Series 10 10
The economic valuation of the five environmental effects was based on existing literature. Becausethe main objective of this paper does not specifically address valuation aspects of externalities weonly briefly explain this step in the analysis. To calculate the effect scores the “impact equivalencyassessment” is used. This approach derives scores by aggregating emissions to their potentialeffects without any exposure analysis (Guinee 1995). The scores are derived by multiplying theaggregated emission levels by the equivalency factors. For example in the case of global warming,which is expressed in terms of “Global Warming Potentials” (GWP), carbon dioxide has anequivalency factor of 1 while the same unit of methane contributes 6 times more to global warming.In this manner, effect scores for the five environmental effects are calculated.
Next, for each of these effects, a per unit cost-price per effect score is derived from existing studies.For global warming, Fankhauser (1996) provides a damage estimate of 0.0055 dollar per GWP.From the World Bank study URBAIR, which estimated the health impact of air pollution inBombay, a damage estimate was retrieved of 0.0065 dollar per unit of Human Toxicity (Larssen etal. 1996). The Sustainable Paper Cycle study (IIED 1996) mentions a mitigation cost of 0.004dollar per unit of water emission. In a study by Markandya (1994), acidification was valued interms of damage to forest ecosystems at 0.016 dollar per acidification unit. Finally, we adopted adamage estimate from a hedonic price approach for solid waste by Powell et al. (1995) of 0.010dollar per unit of solid waste. Although this valuation approach can be improved in many ways, forinstance by incorporating exposure analysis or paying more attention to the valuation issue of benefittransfer, it still seems to be the most feasible option in this study to internalise the external effects.
As trade is an import element in this study, we allow for the possibility of imports at a number ofstages. At the pulping stage, the decision maker may choose between producing pulp domesticallyor importing it. We allow the imports of all pulp except agro-residue as it is highly unlikely that therewill be any international trade of this commodity. As there is existing capacity in the different pulpingmaking processes, the decision to import would imply an additional cost in terms of unused capital.Similarly, the import of waste paper is also allowed. The same treatment is applied to the paperproduction stage. However, the import of final goods is constrained by an import limit whichstipulates that only 20% of final demand can be met by imports.
There are two sets of prices which are exogenously determined in the model. Domestic prices forprimary inputs sourced in India. The model is formulated in a manner whereby the prices of theprimary or “raw” commodities matter. The price of intermediate and final goods which areproduced in India do not have to be declared as the cost of producing these goods are computed asthey are produced using the “raw” commodities. Therefore, intermediate goods like pulp, electricityand final goods like paper do not have domestic prices. International prices are for all commoditieswhich are sourced from outside India. In the model, these would be all imports irrespective if theyare primary, intermediate or final goods.
This brings us to the end of the model description. We next turn our attention to the results fromsome simulations runs done on the model.

CREED Working Paper Series 10 11
Results
The objective function is the driving factor behind an optimization model. To understand the trade-offs we make between environmental and economic goals, we need to analyse model results whendifferent objectives are specified. For this paper, we identified three strategies with the followingobjectives:
1. The economic strategy which implies the traditional sectoral modeling objective of economiccost minimisation;
2. the environmental strategy representing the strong environmentalist position where onlyenvironmental costs are minimised;
3. the sustainable strategy which implies minimisation of total costs including both economic andenvironmental costs, and is coterminous with sustainable management.
The purpose of this model is to analyse the outcome under different trade regimes. Therefore, theabove strategies are analysed under three different scenarios. As a result, nine (3 strategies times 3trade regimes) simulations are performed.
1. The first set of the simulations describes a situation in which no trade in waste paper is allowedbut trade in wood pulp is allowed;
2. In the second set, a situation is simulated in which trade in waste paper and wood pulp isallowed;
3. In the third set of simulations waste paper trade is allowed but an import constraint on woodpulps is introduced.
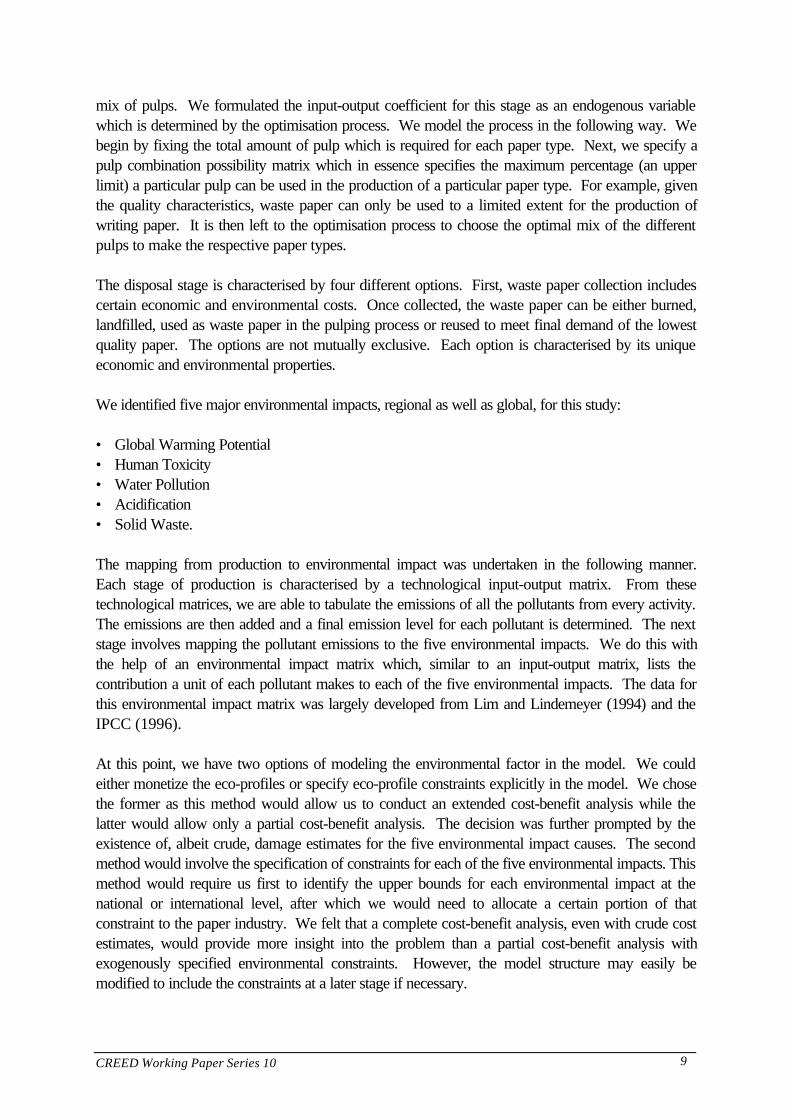
Let us begin by looking at the first set of simulation results in which no trade in waste paper isallowed. As figure 2 below illustrates, in the economic strategy, the real cost (the total cost orsocial cost) is significantly higher than the economic cost. This is because the environmental costsare high under this strategy and is primarily caused by the adoption of the cheap but polluting agro-residue pulping manufacturing process. Under the environmental strategy, economic costs arehigher than in the economic strategy but, as expected, the environmental costs are significantlyreduced. We observe that the decrease in environmental costs is much larger than the increase ineconomic costs, thus giving the environmental strategy an edge in terms of total costs. In thesustainable strategy, the final results are similar to the environmental strategy but with economiccosts being reduced further.
CREED Working Paper Series 10 12
Figure 2 Cost Comparisons with No Import of Waste Paper (Ban)
0
0.5
1
1.5
2
2.5
3
3.5
4
4.5
5
minimizeeconomic
costs
minimizeenv. costs
minimizetotal costs
Strategy
Co
sts
(Bill
ions
US
$) economiccosts
total costs
environmentalcosts
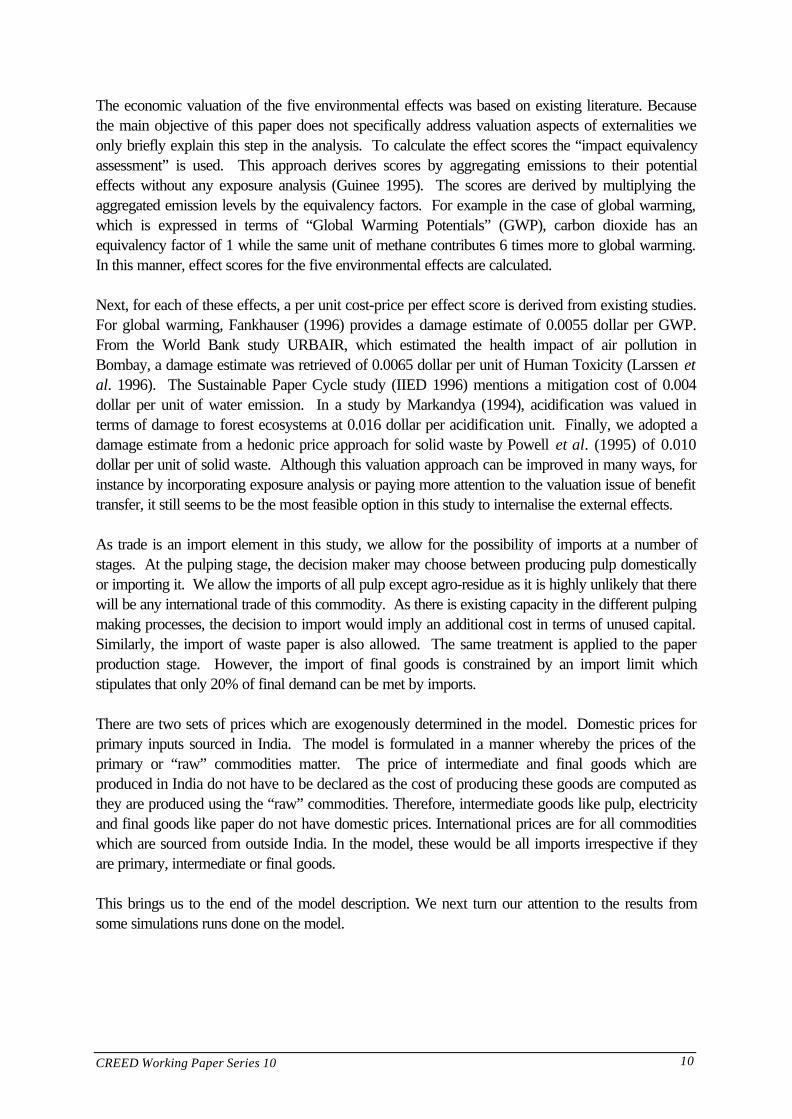
We now turn our attention to the set of simulations in which free trade in imported waste paper isallowed. As figure 3 below illustrates, a similar trend as in figure 2 is observed but with moresignificant differences between the environmental and sustainable strategy.
Figure 3 Cost Comparisons with Import of Waste Paper Allowed
0
0.5
1
1.5
2
2.5
3
3.5
4
4.5
5
minimizeeconomic
costs
minimizeenv. costs
minimizetotal costs
Strategy
Co
sts
(B
illio
ns U
S$)
economiccosts
total costs
environmentalcosts
As observed in the case with no imports, the economic strategy chooses the cheap but dirty agro-residue pulping manufacturing process while the environmental strategy does not. The drop inenvironmental costs caused by adopting the environmental strategy is 2.8 billion dollars while themarginal increase in economic costs is 1.28 billion dollars. It is clearly evident that in both cases,with and without imports, a reduction in environmental costs can be achieved at a relatively low cost.
In comparison with the sustainable strategy, the economic costs are further reduced vis a vis theenvironmental strategy but with environmental costs showing a slight increase. The economic costsdecrease by 0.67 billion dollars while the environmental costs increase by 0.03 billion dollars;
CREED Working Paper Series 10 13
leaving total costs to decrease by 0.64 billion dollars. The primary factor causing the decrease ineconomic costs is the import of waste paper. In the case of the environmental strategy in whicheconomic costs are of no concern, there is a tendency to resort to the import of pulps to reduce theenvironmental impacts. However, when economic costs are also included in the objective, a searchis made for cheaper alternatives to imported pulps and this leads the local paper sector to use bothlocal and imported waste paper pulping processes. However, the adoption of these processescauses the environmental costs to increase by the 0.03 billion dollars observed above.
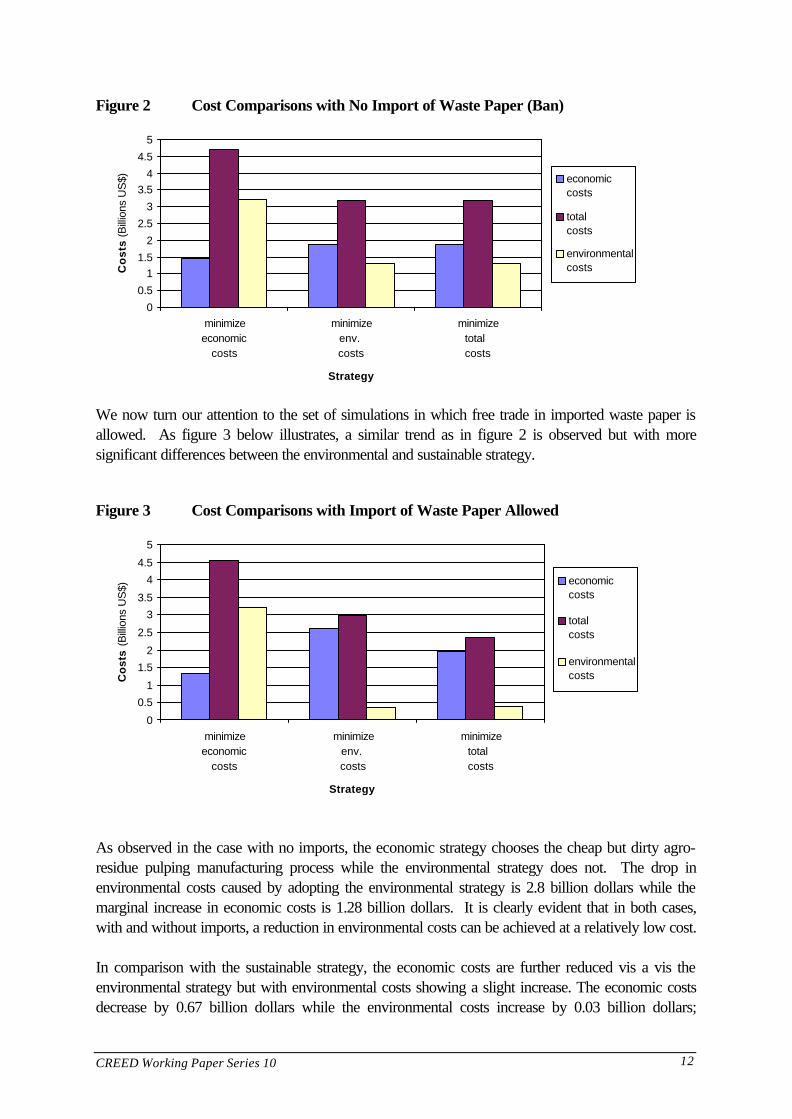
We next compare all the strategies from the first two sets of experiments done above. As figure 4below illustrates, the strategy with the lowest total costs is the sustainable strategy in which importsof waste paper is allowed.
An unexpected result is the higher economic costs that are observed in the sustainable strategy withimports as compared to the simulation without imports under the sustainable strategy. This isexplained by the higher import cost. However, the higher economic cost of 0.08 billion dollars is faroutweighed by the decrease in environmental costs of 0.9 billion dollars.
Figure 4 Costs Comparisons across all strategies
0
0.51
1.5
2
2.53
3.54
4.5
5
minimizeeconomic
costs
minimizeenv. costs
minimizetotal costs
minimizeeconomic
costs
minimizeenv. costs
minimizetotal costs
waste paper import ban waste paper import allowed
Strategies
Co
sts
(Bill
ions
US
$)
economiccosts
total costs
environmentalcosts
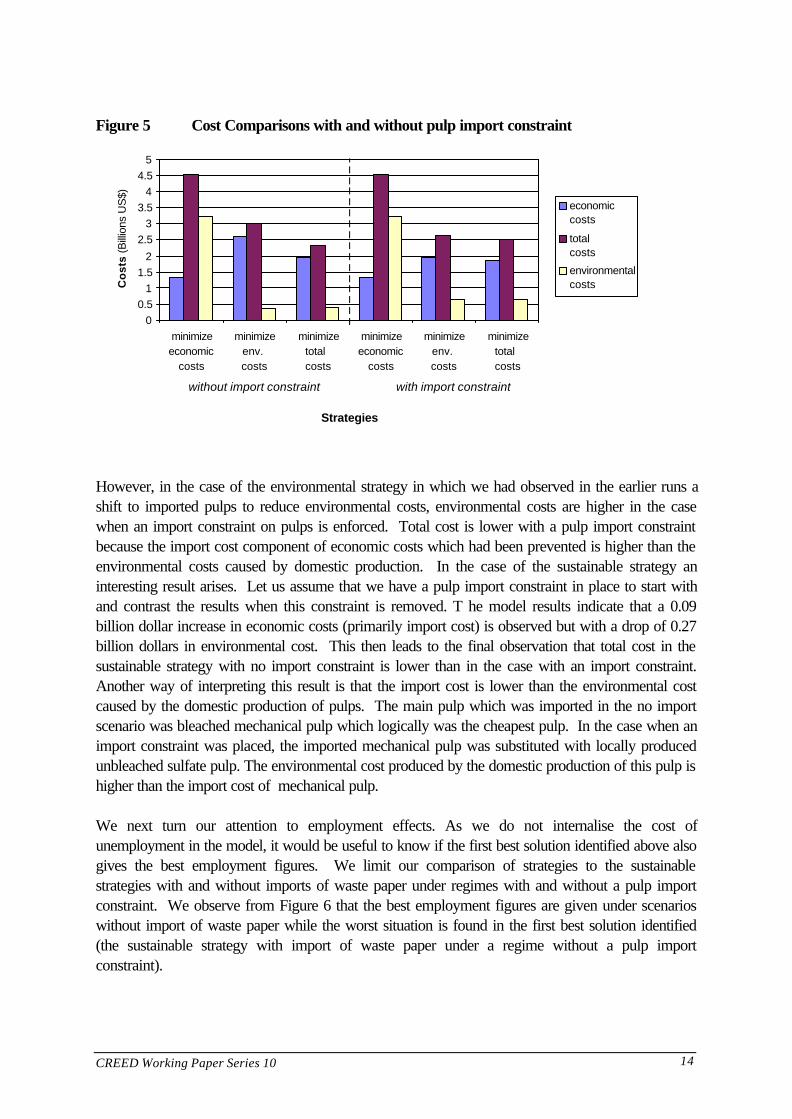
We next ran a third set of experiments in which we allowed the import of waste paper but with anadditional constraint which prevents the Indian paper sector from importing more than 50% of itspulp input requirements from foreign markets. The primary reason for this exercise was to observehow a restricted access to imported pulp will change the behaviour of the paper sector in India. Aswe mentioned in the earlier paragraphs, in many instances, the sector had resorted to imported pulpto reduce the environmental impacts. As shown in Figure 5 no differences were observed in theeconomic strategy with and without an import constraint on pulp.
CREED Working Paper Series 10 14
Figure 5 Cost Comparisons with and without pulp import constraint
0
0.5
1
1.5
2
2.5
3
3.5
4
4.5
5
minimizeeconomic
costs
minimizeenv. costs
minimizetotal costs
minimizeeconomic
costs
minimizeenv. costs
minimizetotal costs
without import constraint with import constraint
Strategies
Co
sts
(Bill
ions
US
$)
economiccosts
total costs
environmentalcosts
However, in the case of the environmental strategy in which we had observed in the earlier runs ashift to imported pulps to reduce environmental costs, environmental costs are higher in the casewhen an import constraint on pulps is enforced. Total cost is lower with a pulp import constraintbecause the import cost component of economic costs which had been prevented is higher than theenvironmental costs caused by domestic production. In the case of the sustainable strategy aninteresting result arises. Let us assume that we have a pulp import constraint in place to start withand contrast the results when this constraint is removed. T he model results indicate that a 0.09billion dollar increase in economic costs (primarily import cost) is observed but with a drop of 0.27billion dollars in environmental cost. This then leads to the final observation that total cost in thesustainable strategy with no import constraint is lower than in the case with an import constraint.Another way of interpreting this result is that the import cost is lower than the environmental costcaused by the domestic production of pulps. The main pulp which was imported in the no importscenario was bleached mechanical pulp which logically was the cheapest pulp. In the case when animport constraint was placed, the imported mechanical pulp was substituted with locally producedunbleached sulfate pulp. The environmental cost produced by the domestic production of this pulp ishigher than the import cost of mechanical pulp.
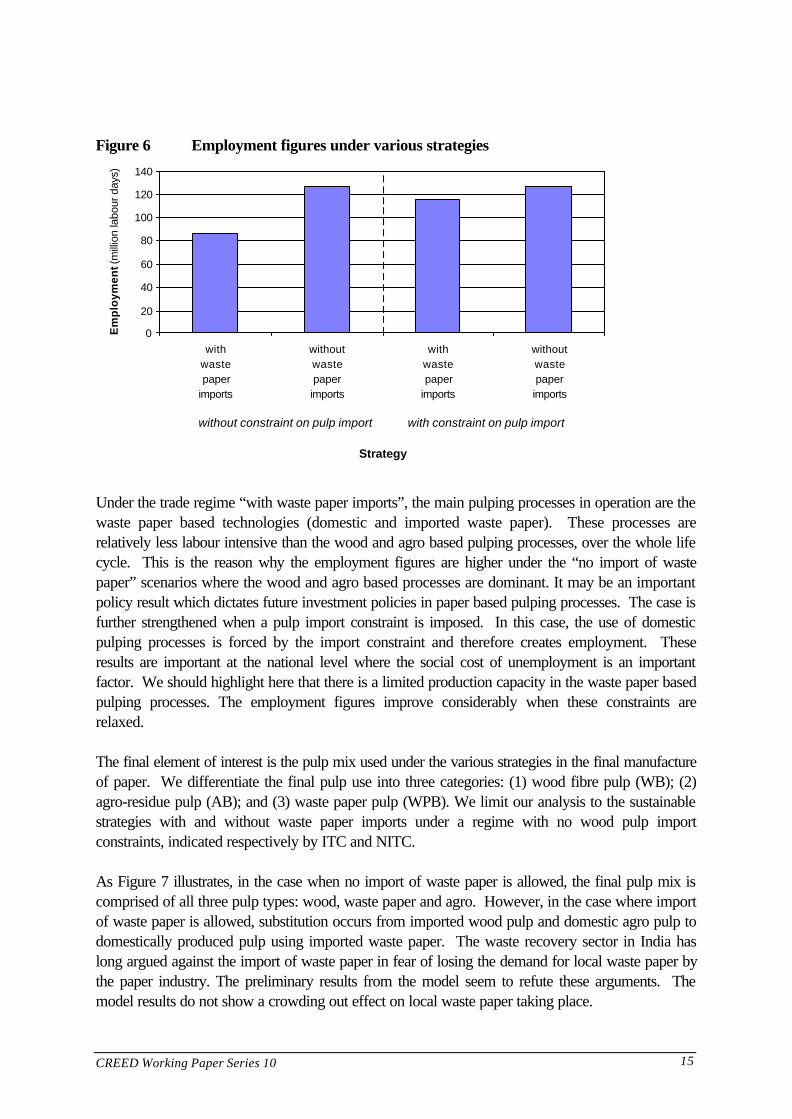
We next turn our attention to employment effects. As we do not internalise the cost ofunemployment in the model, it would be useful to know if the first best solution identified above alsogives the best employment figures. We limit our comparison of strategies to the sustainablestrategies with and without imports of waste paper under regimes with and without a pulp importconstraint. We observe from Figure 6 that the best employment figures are given under scenarioswithout import of waste paper while the worst situation is found in the first best solution identified(the sustainable strategy with import of waste paper under a regime without a pulp importconstraint).
CREED Working Paper Series 10 15
Figure 6 Employment figures under various strategies
0
20
40
60
80
100
120
140
withwastepaper
imports
withoutwastepaperimports
withwastepaper
imports
withoutwastepaperimports
without constraint on pulp import with constraint on pulp import
Strategy
Em
plo
ymen
t (m
illio
n la
bour
day
s)
Under the trade regime “with waste paper imports”, the main pulping processes in operation are thewaste paper based technologies (domestic and imported waste paper). These processes arerelatively less labour intensive than the wood and agro based pulping processes, over the whole lifecycle. This is the reason why the employment figures are higher under the “no import of wastepaper” scenarios where the wood and agro based processes are dominant. It may be an importantpolicy result which dictates future investment policies in paper based pulping processes. The case isfurther strengthened when a pulp import constraint is imposed. In this case, the use of domesticpulping processes is forced by the import constraint and therefore creates employment. Theseresults are important at the national level where the social cost of unemployment is an importantfactor. We should highlight here that there is a limited production capacity in the waste paper basedpulping processes. The employment figures improve considerably when these constraints arerelaxed.
The final element of interest is the pulp mix used under the various strategies in the final manufactureof paper. We differentiate the final pulp use into three categories: (1) wood fibre pulp (WB); (2)agro-residue pulp (AB); and (3) waste paper pulp (WPB). We limit our analysis to the sustainablestrategies with and without waste paper imports under a regime with no wood pulp importconstraints, indicated respectively by ITC and NITC.
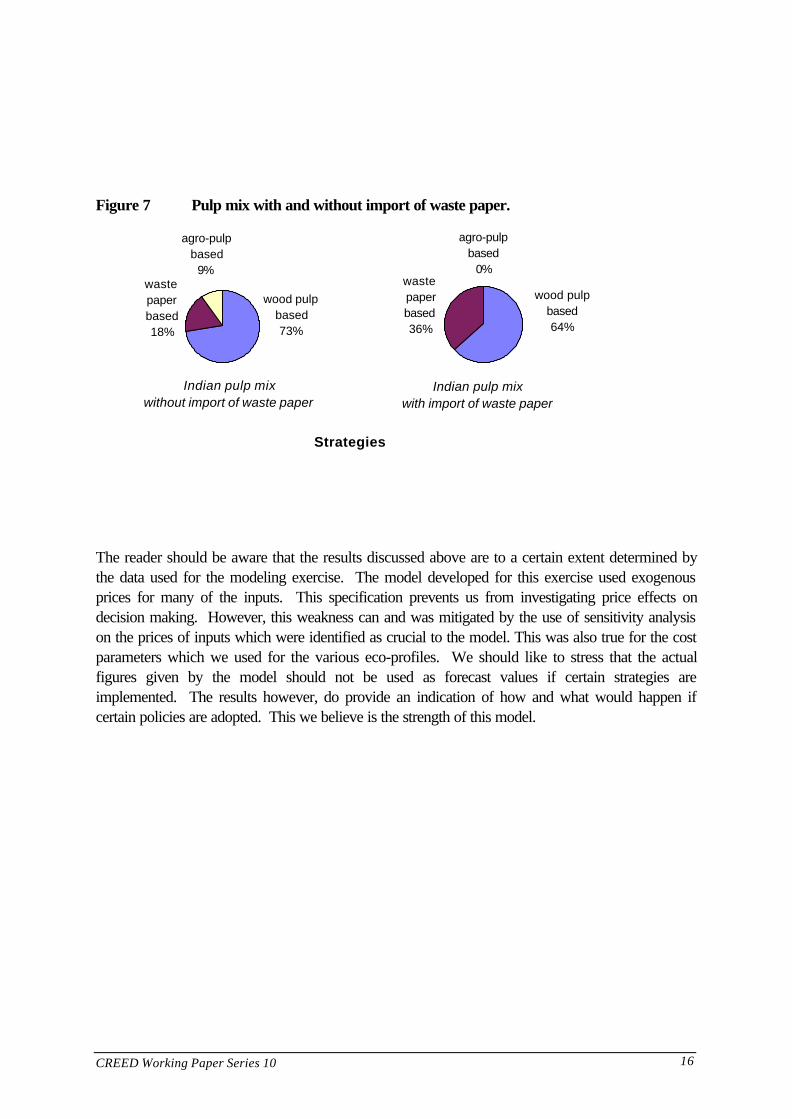
As Figure 7 illustrates, in the case when no import of waste paper is allowed, the final pulp mix iscomprised of all three pulp types: wood, waste paper and agro. However, in the case where importof waste paper is allowed, substitution occurs from imported wood pulp and domestic agro pulp todomestically produced pulp using imported waste paper. The waste recovery sector in India haslong argued against the import of waste paper in fear of losing the demand for local waste paper bythe paper industry. The preliminary results from the model seem to refute these arguments. Themodel results do not show a crowding out effect on local waste paper taking place.
CREED Working Paper Series 10 16
Figure 7 Pulp mix with and without import of waste paper.
Indian pulp mix with import of waste paper
waste paper based36%
agro-pulp based
0%
wood pulp based64%
Indian pulp mix without import of waste paper
waste paper based18%
agro-pulp based
9%
wood pulp based73%
Strategies
The reader should be aware that the results discussed above are to a certain extent determined bythe data used for the modeling exercise. The model developed for this exercise used exogenousprices for many of the inputs. This specification prevents us from investigating price effects ondecision making. However, this weakness can and was mitigated by the use of sensitivity analysison the prices of inputs which were identified as crucial to the model. This was also true for the costparameters which we used for the various eco-profiles. We should like to stress that the actualfigures given by the model should not be used as forecast values if certain strategies areimplemented. The results however, do provide an indication of how and what would happen ifcertain policies are adopted. This we believe is the strength of this model.
CREED Working Paper Series 10 17
Conclusions
Does the trade in waste paper provide environmental and economic benefits to the Indian papersector? The preliminary results from the sectoral model we developed suggests that the answer tothe question depends on the objective of the decision maker. If the prime objective is based onenvironmental criteria, then trade in waste paper is not the best solution. However, if the soleobjective is economic, then trade in waste paper is beneficial but only partly. However, if thereduction of both environmental and economic costs is the prime objective, the trade in waste paperis crucial in the sector design process. In other words, if the paper sector is forced to internalise itsenvironmental externalities, then the trade in waste paper becomes a crucial variable in industrial andenvironmental policies.
A particular problem raised by our simulations is the question of employment. It was shown thatwith imports of waste paper, the employment situation in the paper sector in India deteriorates.However, this is primarily caused by the limited existing capacity in the paper based pulpingprocesses; the results highlight a crucial bottleneck in the industry which needs to be addressed if thetrade in waste paper is to be maximised for the Indian paper sector.
The last point highlighted in our simulations is the pulp mix and the degree of substitutability betweendomestic waste paper and imported waste paper. The results show that there is no competition andthat no crowding out effect takes place. The substitution occurs with agro and wood based pulpwhich is advantageous in many ways. A reduction in the demand for wood based pulp reduces thepressure on forest reserves. The reduction in demand for agro-residue highlights an area for futuretechnological development. At present, agro-residue is cheap but extremely detrimental to theenvironment. The option is to find methods and technologies for reducing the environmental impactof this resource. In the long run, advances in technology in this area will further reduce the pressureon forests and would create an environment in which the use of waste paper as well as agro, can bemaximised.
Before we end the paper we should like to point out that the model developed in this paper is still inits infancy and many of the linkages are represented in a simplistic manner. However, the mainengine has been formulated and modifications to the existing model can be achieved with relativelylittle cost. The model has demonstrated the unique strength of incorporating a life cycle analysis withthe option of choosing the optimal life cycle configuration for a particular sector.

CREED Working Paper Series 10 18
1. AppendixTHE MATHEMATICAL MODEL
List of symbols used in the model
Variablesz: Process levelb: Endogenous input-outputv: Import levelru: Reuse levelw: Waste levelu: Domestic purchase levelep: Emissions levelepf: Environmental profileec: Environmental costsrc: Raw material costsitc: Domestic waste paper costsimc: Import costsitc: Transportation costswdc: Waste disposal coststc: Total costs
Parametersa: Input-output coefficientsp: Prices
B: Upper bound on pulp mixture
P: Pulping and paper making capacity constraints
D: Final demand
U: Upper bound on purchase of specified raw materials
CREED Working Paper Series 10 19
M: Middle distillate used in import of per unit of commodities
E: Contribution of each unit of pollutant to each eco-profile
EC: Cost per unit of eco-profile
SetsC: Set of commoditiesP: Processes
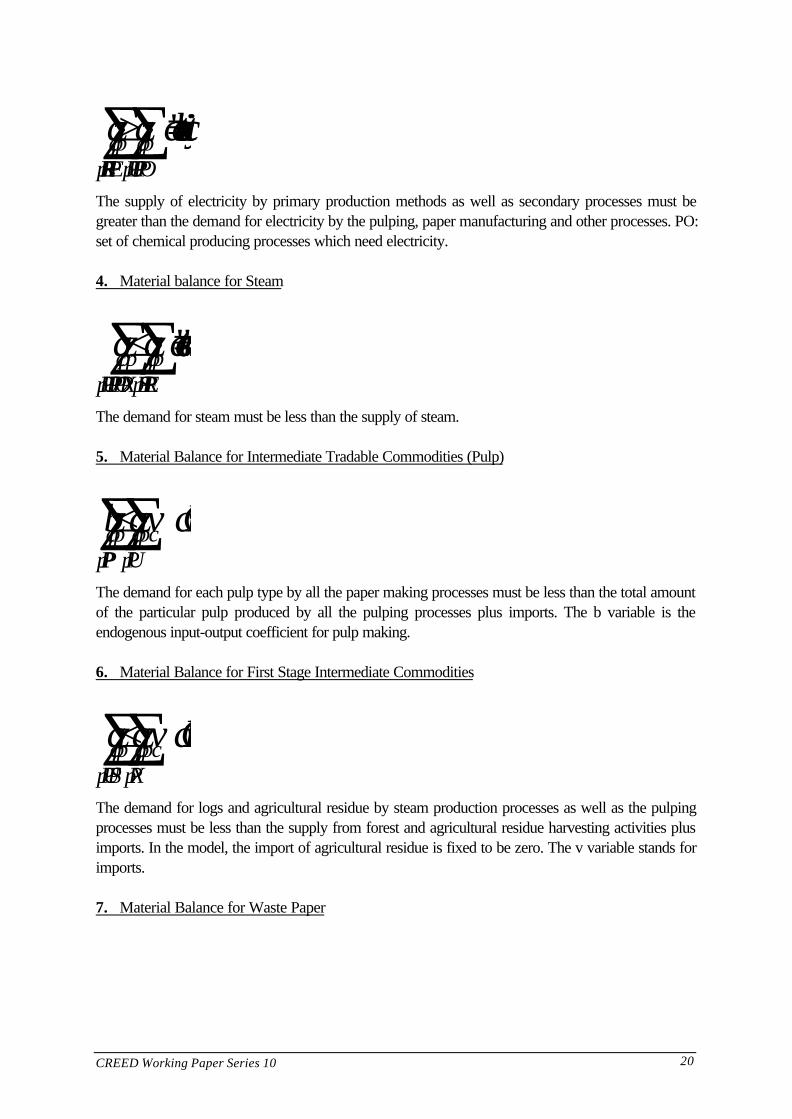
1. Material Balance Constraint on Raw Materials
azu cCRcpppPEPSPUPPPX
c,∈∪∪∪∪∑+≥∈0
Total demand of raw materials by all processes must be less than the amount purchaseddomestically. We do not allow for the import of raw commodities in this version of the model. Theprocesses are (PE: electricity production; PS: steam production; PU: pulping; PP: papermanufacturing and PX: Collection of waste paper, logging and agro-residue harvesting).2. Material Balance Constraint for Fibre and Non-Fibre Materials
az az cCFBcpppPRE
cpppPU
, ,∈ ∈∑∑≤ ∈
The demand for wood and agro residue by secondary electric and steam production processes mustbe less than the supply of the fibres by the respective pulping processes which produce these fibresas a by-product. PRE: set of electric and steam production processes which use wood and agroresidue fibre as inputs. PU: set of pulping processes.
3. Material Balance for Electricity
CREED Working Paper Series 10 20
az az celectricitycppPREPE
p cppPUPPPO
p, , ""∈∪∈∪∪∑∑≥ ≡
The supply of electricity by primary production methods as well as secondary processes must begreater than the demand for electricity by the pulping, paper manufacturing and other processes. PO:set of chemical producing processes which need electricity.
4. Material balance for Steam
az azcsteamcppPUPPPOPX
p cppPSPRE
p, , ""∈∪∪∪∈∪∑∑≤ ≡
The demand for steam must be less than the supply of steam.
5. Material Balance for Intermediate Tradable Commodities (Pulp)
bzazv cCITcppPP
p cppPU
pc, ,∈ ∈∑∑≤+ ∈
The demand for each pulp type by all the paper making processes must be less than the total amountof the particular pulp produced by all the pulping processes plus imports. The b variable is theendogenous input-output coefficient for pulp making.
6. Material Balance for First Stage Intermediate Commodities
azazv cCIITcppPUPS
p cppPX
pc, ,∈∪ ∈∑∑≤+ ∈
The demand for logs and agricultural residue by steam production processes as well as the pulpingprocesses must be less than the supply from forest and agricultural residue harvesting activities plusimports. In the model, the import of agricultural residue is fixed to be zero. The v variable stands forimports.
7. Material Balance for Waste Paper
CREED Working Paper Series 10 21
azruazcwastepapercppPUPDW
p cpppPX
, , " "∈∪ ∈∑∑+= ≡
The total use of domestic waste paper must be equal to the total amount collected. Waste paper canbe either recycled, burned, land filled, or reused. The PDW process set consists of burning andland filling while the ru variable is for the amount reused. The PX process set has collection activities.
8. Material Balance for Imported Waste Paper
azvcimportedwastepapercppPU
pc, " "∈∑= ≡
The import of waste paper is determined by the demand for imported waste paper by the pulpingprocesses.
9. Paper Manufacturing Input-Output Coefficient Condition
ba pPPcpcCIT
pulpp, "",∈∑= ∈The summation of the different types of pulp used by each paper making process must equal to anexogenously specified amount.
10. Paper Manufacturing Input-Output Probability Matrix
b
aB cCITpPP
cp
pulpppcp
,
"",, ,≤ ∈ ∈
The proportion of each type of pulp in each paper making process must be equal or less than anexogenously specified upper bound. For example, the proportion of bleached sulfite pulp in makingwriting paper must be equal or less than 40%.
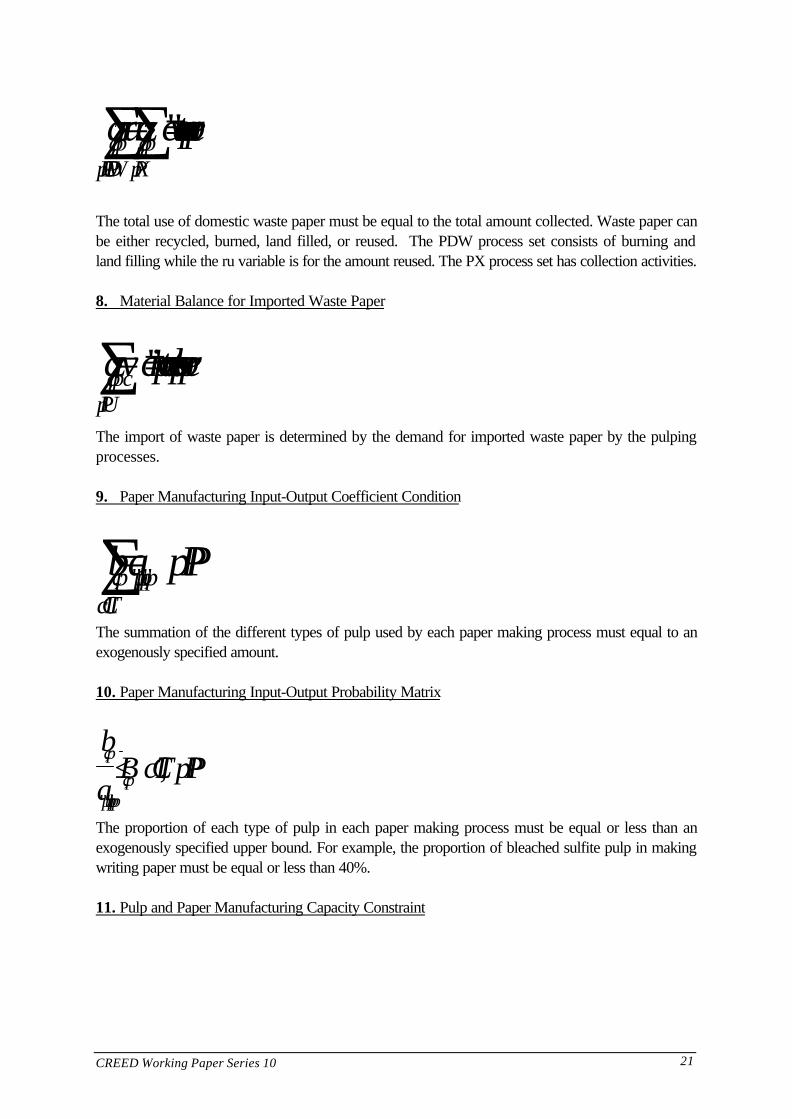
11. Pulp and Paper Manufacturing Capacity Constraint
CREED Working Paper Series 10 22
zPpPUPPpp≤ ∈∪The activity level for each pulping and paper making process is constrained by existing capacity.
12. Material balance for Non-Tradable Intermediate Goods
az az cCINTcppPO
p cppPUPP
p, ,∈ ∈∪∑∑≥ ∈
The supply of chemicals must be greater than the demand for these chemicals by the pulping andpaper making processes.
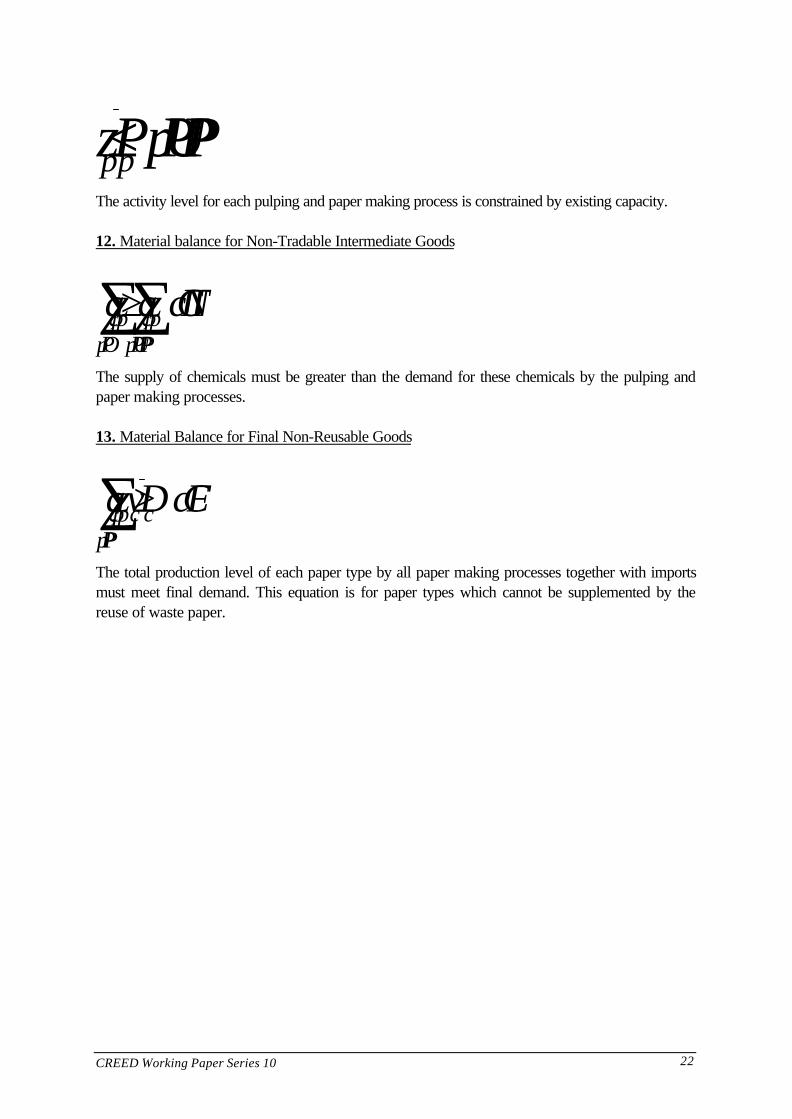
13. Material Balance for Final Non-Reusable Goods
azvDcCFcppPP
pc c,∈∑+≥ ∈
The total production level of each paper type by all paper making processes together with importsmust meet final demand. This equation is for paper types which cannot be supplemented by thereuse of waste paper.

CREED Working Paper Series 10 23
14. Material Balance for Final Reusable Goods
azvrucDcCFRcppPP
pccc,∈∑++≥ ∈
The total production level of each paper type by all paper making processes together with importsand the reuse of waste paper must meet final demand. This constraint is for paper types which canbe supplemented by the reuse of waste paper.
15. Total Waste Paper Generation
w DccCFT
=∈∑α
Total waste paper generated is equal to the recovery rate (α) multiplied by the total amount ofpaper used (the final demand).
16. Material Balance for Waste Paper
a z wwastepaperppPX
p" ",∈∑ =
The amount of waste paper collected must be equal to the waste generated. We make a distinctionbetween equation 16 and 7 because a certain amount of loss in mass occurs between total mass ofwaste paper generated and the total mass of waste paper collected. The difference is accounted asan increase in solid waste material which in turn will be captured in the emission equations.
17. Reuse Level
ru w≤03.The total amount of waste paper which can be reused to meet final demand of a certain type ofpaper is less than 30% of the total waste paper generated.
18. Raw Material Constraint
CREED Working Paper Series 10 24
uUcCRCc c≤ ∈An exogenously specified upper bound is imposed on the purchase of a sub-set of raw materials.The raw materials are trees for logs and agricultural waste for agricultural residue.
19. Final Good Import Constraint
v DccCFT
ccCFT∈ ∈
∑ ∑≤02.The total import of all paper types must be less than 20% of final demand. In other words, at theminimum, 80% of final demand must be met by local supply.

CREED Working Paper Series 10 25
20. Middle Distillate Used in Transport
az vMmdcpppPDWPXPP
cccCITCFTimportedwastepaper
,,," "∈∪∪∈
∑∑+ =
The total amount of middle distillate is equal to the amount used by domestic processes plus amountused in transportation for imported goods.
21. Emissions from Transport
etamdcCEccmiddledistillate= ∈," "The total emissions of various pollutants caused by transportation.
22. Emissions from Paper Production
azep cCEcppPEPSPUPPPXPRE
pc,∈∪∪∪∪∪∑= ∈
The total emissions of various pollutants accruing from all domestic production processes.
23. Eco-Profile
( )Eetepepf pENVPcpcCE
cc p,∈∑+= ∈The total contribution by all the pollutants from the transport and production processes towardseach environmental problem.
24. Environmental Costs
ec epfECppENVP
p=∈∑
The total costs caused by all the environmental problems.
25. Raw Material Costs
CREED Working Paper Series 10 26
rc upc cd
ccm
=∈∑
Total costs of raw materials.
26. Domestic Waste Paper Costs
( )itc a zpwastepaperpppPU
wastepaperd=
∈∑" ", " "
Total costs of buying waste paper for pulping processes. We distinguish wastepaper from rawmaterials as it is a secondary good. prices used are domestic prices.
CREED Working Paper Series 10 27
27. Import Costs
imc v pccCITCFTCIITimportedwastepaper
ci=
∈∪∪∪∑" "
Total costs of all imports which include waste paper, pulp, logs, and final paper types. Prices usedare international prices.
28. Transportation Costs
ttc a zpmiddledistillateppPXPPPDW
pmiddledistillated=
∈∪∪∑" ", "
Total costs of transport of final goods, waste paper collection, and waste paper disposal.
29. Waste Disposal Costs
wdc zpppPDW
pd=
∈∑
Total costs incurred for burning or land filling of waste paper.
30. Total Costs
tc ttc wdc imc itc rc ec= + + + + +Final total costs for the sector is the summation of all costs.
CREED Working Paper Series 10 28
References
Baud, I. and Schenk H. (eds.) 1994. Solid Waste Management: Modes, Assessments, Appraisalsand Linkages in Bangalore. Manohar:. New Delhi.
Beukering, P. van. 1994. “An Economic Analysis of Different Types of Formal and InformalEntrepreneurs, Recovering Urban Solid Waste in Bangalore (India).” Resources, Conservation andRecycling 12 (1994) 229-252.
Beukering, P. van, Bennis, M., Hoogeveen, H. and Sharma, V.K. 1996a. Recycling andInternational Trade of Waste Paper: a Global Assessment with a Special Focus on India.CREED Programme. Institute for Environmental Studies: Amsterdam.
Beukering, P. van, Schoon, E. and Mani, A. 1996b. The Informal Sector and Waste PaperRecovery in Bombay. CREED Working Paper. No.5. International Institute for Environment andDevelopment: London.
Biermann, J. 1993. Essentials of Pulping and Paper Making. Academic Press Inc. New York.
Bureau of Industrial Costs and Prices (BCIP) 1987. Report on Energy Audit of Paper Industry.July. Ministry of Industry: Delhi.
Central Board for the Prevention and Control of Water Pollution (CBP & CWP) 1986. Small Paperand Pulp Industry, Comprehensive Industry Document. New Delhi.
Central Pollution Control Board (CPCB) 1986. Comprehensive Document on Pulp and PaperIndustry, COINDS/22/1986. New Delhi, India.
CPCB. 1991. Comprehensive Industry Document for Large Pulp and Paper Industry.COINDS/36/1991. New Delhi.
Duraiappah, A.K. 1993. “Investing in Clean Technology: an Exercise in Methodology.” UNEP.Nettlap Publications No.6 :.87-103.
Food and Agriculture Organisation of the United Nations (FAO). 1993. Forestry Statistics forTomorrow. FAO: Rome.
FAO. 1993a. Waste Paper Data 1990-1992. FAO: Rome
FAO. 1993b. Pulp and Paper Towards 2010: An Executive Summary. FAO: Rome
FAO. 1993c. Forestry; Statistics Today for Tomorrow. FAO: Rome.
FAO. 1994. Paper Recycling Scenarios. FO:MISC/94/4. FAO: Rome
General Agreement on Tariffs and Trade (GATT). 1992. International Trade 1990-1991. p.25.
Grace, R., Turner, R.K. and Walter, I. 1978. “Secondary Materials and International Trade.”Journal of Environmental Economics and Management 5:.172-186.
CREED Working Paper Series 10 29
Grace, R., Turner, R.K. and Walter, I. 1979. “Secondary Materials and International Trade: Reply.”Journal of Environmental Economics and Management 6: 204-207.
Guinée, J.B. 1995. Development of a Methodology for the Environmental Life Cycle Assessmentof Products: with a Case Study of Margarines. Phd Thesis. Centre of Environmental ScienceLeiden University: Leiden.
International Institute for Environment and Development (IIED) 1995. The Sustainable PaperCycle: Phase 1 Review Report. IIED: London.
International Labour Organization (ILO) 1992. Social and Labour Issues in the Pulp and PaperIndustry. ILO. Geneva.
Jackson, S. and van Beukering, P.J.H. 1996. A Preparatory Study on International Trade andRecycling of Secondary Materials with Special Emphasis on Plastics in the People’s Republic ofChina. Institute for Environmental Studies (IVM), Vrije Universiteit, Amsterdam.
Fankhauser, S. 1994. Evaluating the Social Costs of Greenhouse Gas Emissions. CSERGEWorking Paper GEC 94-1. CSERGE: London.
Kendrick, D.A. and Stoutjesdijk, A.J. 1978. The Planning of Industrial Investment Programmes: aMethodology. John Hopkins University Press. Baltimore.
Khanolkar, V.D. 1995. Indian Pulp & Paper Industry: Past Performance and Future Scenario .Country paper presented at the Regional Workshop on the Sustainable Paper Cycle, 21-22 February1995, Bangkok.
Kirkpatrick, N. 1994. The Contribution of Life Cycle Assessment (LCA) to Responsible WasteManagement. Pira International. Surrey.
Larssen, S., Gram, F. and Hagen, L.O. 1996. Urban Air Quality Management Strategy in Asia .URBAIR. Greater Bombay City Specific Report. OR 56/95. Kjeller.
Lim, B. and Lindeijer, E. 1994. Milieubeoordeling van beglazingssystemen. p.b27. IVAM, Amsterdam.
Markandya, A. 1994. “Economic Valuation: An Impact Pathway Approach.” In Externalities ofFuel Cycles. European Commission DGXII. Brussels. Vol. 9.
Organisation for Economic Co-operation and Development (OECD) 1993. Projected Costs ofGenerating Electricity - Update 1992. OECD: Paris.
Powell, J.C., Craighill, A.L., Parfitt, J.P. and Turner, R.K. 1995. A Lifecycle Assessment andEconomic Valuation of Recycling. CSERGE. University of East Anglia. Norwich.
Pulp and Paper International (PPI). 1994. International Fact and Price Book . Compiled andedited by Heide Matussek, William Salvesen and John Pearson. Brussels.
Rao, Y.A. 1989. The Paper Industry in India - Status and Prospects. Oxford and IBH PublishingCo.: New Delhi.

CREED Working Paper Series 10 30
Roberts, S. 1995. Non Wood Fibre Substudy. Prepared for the project The Sustainable Paper Cycle.IIED: London.
Virtanen, Y. and Nilsson, S. 1993. Environmental Impact of Waste Paper Recycling, InternationalInstitute for Applied Systems Analysis. Earthscan Publications: London.
Weaver, P.M., Gabel, H.L., Bloemhof-Ruwaard, J.M. and van Wassehove L.N. 1995. OptimizingEnvironmental Product Life Cycles: a Case Study of the European Pulp and Paper Industry.INSEAD: Fontainebleau.
World Resources Institute (WRI). 1994. World Resources 1994-95. Oxford.
Yates, P.L. 1959. Forty Years of Foreign Trade. London.