environmental impacts of smart grid library/research/energy analysis... · environmental impacts of...
TRANSCRIPT
Environmental Impacts of Smart Grid January 10, 2011
DOE/NETL-2010/1428

Disclaimer This report was prepared as an account of work sponsored by an agency of the United States Government. Neither the United States Government nor any agency thereof, nor any of their employees, makes any warranty, express or implied, or assumes any legal liability or responsibility for the accuracy, completeness, or usefulness of any information, apparatus, product, or process disclosed, or represents that its use would not infringe privately owned rights. Reference therein to any specific commercial product, process, or service by trade name, trademark, manufacturer, or otherwise does not necessarily constitute or imply its endorsement, recommendation, or favoring by the United States Government or any agency thereof. The views and opinions of authors expressed therein do not necessarily state or reflect those of the United States Government or any agency thereof.

DOE/NETL-2010/1428
Environmental Impacts of Smart Grid
January 10, 2011
NETL Contact: Justin Adder
Office of Strategic Energy Analysis and Planning
National Energy Technology Laboratory www.netl.doe.gov

This page intentionally left blank
i
Table of Contents Executive Summary ........................................................................................................................ 1
1. Introduction ............................................................................................................................. 4
2. Study/Research Methodology ................................................................................................. 9
3. Key Areas of Environmental Impact of Smart Grid ............................................................. 10
4. Study/Research Findings ...................................................................................................... 11
4.1 Demand Response .......................................................................................................... 11
4.2 Smart Grid and Demand Response ................................................................................ 12
4.3 Demand Side Management ............................................................................................ 18
4.4 DR and DSM in Smart Grid Context ............................................................................. 20
4.5 Home Area Networks ..................................................................................................... 22
4.6 Electric Vehicles ............................................................................................................ 24
4.7 Renewable Energy and Distributed Storage ................................................................... 26
4.8 Improvements to Transmission and Distribution Systems ............................................. 30
5. Conclusions ........................................................................................................................... 36
6. Recommended Topics for Further Research ......................................................................... 38
7. Appendix/Tables ................................................................................................................... 35
8. References ............................................................................................................................. 48

ii
List of Tables Table 1: EIA Pollutants Data .......................................................................................................... 4
Table 2: Summer Peak Demand Savings (GW) from Energy Efficiency and Demand Response 14
Table 3: Summary of RECAP Modeling Adjustments ................................................................. 15
Table 4: Reduction in Electricity Use Resulting from Smart Grid ............................................... 16
Table 5: Smart Grid Technologies’ Impacts on Energy Sector: Predicted, Targeted ................... 20
Table 6: Assumptions, Findings and Results Related to DR, DSM ............................................. 21
Table 7: Annual GHG Emissions Reductions from PHEVs in the Year 2050 ............................. 25
Table 8: CO2 Impact of Smart Grid Enablement of Renewable Resource Deployment 2030 ..... 28
Table 9: Impact of Reduced Line Losses – Voltage Reduction 2030 ........................................... 31
Table 10: Assumptions, Findings and Results Related to T&D ................................................... 35
Table 11: Key Areas of Smart Grid Influence and Environmental Impact .................................. 39
List of Figures Figure 1: Electricity Generation Composition for United States in 2007 ....................................... 5
Figure 2: Energy Savings Estimation for a Demand Response Event .......................................... 17
Figure 3: Impact of Increased Demand Response 2030 ............................................................... 17
Figure 4: Carbon Cost Abatement Curve ...................................................................................... 22
Figure 5: Electricity Generation Capacity Additions by Fuel Type (GW), 2009-2035 ................ 27
Figure A-1: Mercury Deposition from US Power Plants in 2001……………………………….45
Figure A-2: Mercury Deposition from US Power Plants in 2020 with CAIR and CAMR………..46

iii
Prepared by:
Energy Sector Planning and Analysis (ESPA)
Dennis Huber Booz Allen Hamilton, Inc.
Zephyr Taylor
Booz Allen Hamilton, Inc.
Steven Knudsen Sextant Technical Services
DOE Contract DE-FE0004001

iv
This report was prepared by Booz Allen Hamilton, Inc. (BAH) for the United States Department of Energy’s National Energy Technology Laboratory. This work was completed under DOE NETL Contract Number DE- FE0004001. This work was performed under BAH Task 430.01.02.
Acknowledgments
The authors wish to acknowledge the excellent guidance, contributions, and cooperation of the NETL staff, particularly:
Justin Adder, NETL Technical Monitor
Joel Theis, Office of Systems, Analysis and Planning
Steven Bossart, Office of Systems, Analysis and Planning

v
AC
List of Acronyms and Abbreviations
Air conditioning ACI Activated carbon injection AMI Advanced metering infrastructure APCD Air pollution control device BAH Booz Allen Hamilton, Inc. BAU Business as usual BUG Backup generator CAA Clean Air Act CAIR Clean Air Interstate Rule CAMR Clean Air Mercury Rule CCS Carbon capture and storage CHP Combined heat and power Cl Chlorine CO Carbon monoxide CO2 Carbon dioxide DA Distribution automation DA/FA Distributed energy resources DER Distribution automation / feeder automation DG Distributed generation DOE Department of Energy DOT Department of Transportation DSM Demand side management DR Demand response EE Energy Efficiency EIA Energy Information Agency EPA Environmental Protection Agency EPRI Electric Power Research Institute ESP Electrostatic precipitator ESPA Energy Sector Planning and Analysis FERC Federal Energy Regulatory Commission FF Fabric filter FGD Flue gas desulfurization FHWA Federal Highway Administration GFA Grid Friendly appliance GHG Greenhouse gas GW Gigawatt HAN Home area network HC Hydrocarbon Hg Mercury ICE Internal combustion engine ICT Information and control technology LM Load management LSE Load serving entity M&V Measurement and verification

vi
MW Megawatt NETL National Energy Technology Laboratory NIST National Institute of Science and Technology NOx Oxides of nitrogen OH Ontario Hydro Pb Lead PCB Polychlorinated biphenyls PHEV Plug-in hybrid electric vehicle PMU Phasor measurement unit PNNL Pacific Northwest National Laboratory PQ Power quality PUC Public Utility Commission RECAP Regional Capacity Planning Model RPS Renewable portfolio standard SCADA Supervisory control and data acquisition SOx Oxides of sulfur T&D Transmission and distribution TOU Time of use UBC Unburned hydrocarbon UNDEERC University of North Dakota Energy and Environmental Research Center V2G Vehicle to grid

Environmental Impacts of Smart Grid
1
The production of electricity and the use of internal combustion vehicles in the United States generate a substantial number of pollutants. This paper focuses on the particulate and gaseous emission pollutants that are byproducts of electricity generation, and on how the Smart Grid infrastructure will affect this environmental impact. The major sources of pollution originate from coal-fired plants and include carbon dioxide (CO2), nitrogen oxides (NOx) sulfur oxides (SOx), and mercury (Hg). Coal plants also produce solid waste in the form of fly ash and bottom ash.
Executive Summary
The Energy Information Agency (EIA) forecasts (US EIA, 2010) that with nominal growth in electricity demand and the expected retirement of 45 Gigawatts of existing capacity, 250 Gigawatts of new generating capacity (including end-use Combined heat and power (CHP)) will be needed between 2009 and 2035. Natural-gas-fired plants account for 46 percent of capacity additions in the Reference case, as compared with 37 percent for renewables, 12 percent for coal-fired plants, and 3 percent for nuclear. One of the studies reviewed in this paper (EPRI, 2008) estimates a savings in power production of 12 percent, with a 100-percent implementation of the Smart Grid by 2030. It seems apparent that baseload power production will increase going forward, which implies that more coal and nuclear plants need to be built. While a very large uptake of renewable energy sources in the long-term might decrease the overall percentage of power production from traditional baseload generation, it is not clear that utilities would be in a position to effectively manage the required dispatch schedules of the myriad energy production resources without a Smart Grid infrastructure in place.
Implementation of the Smart Grid will have a role in reducing the number of pollutants being produced by electricity generation activities. This paper evaluates the impact that the Smart Grid will have on reducing the production of these pollutants in the following major areas:
• Demand response (DR)
• Electric vehicles (EVs)
• Demand side management (DSM)
• Renewables and distributed energy resources
• Transmission and distribution systems (T&D) The Smart Grid is an automated electric power system that monitors and controls grid activities, ensuring the two-way flow of electricity and information between power plants and consumers—and all points in between (Smart Grid Basics, 2010). It is different from today’s electric power grid in several important ways. First, it uses information technologies to improve how electricity travels from power plants to consumers. Second, it allows those consumers to interact with the grid. Third, it integrates new and improved technologies into the operation of the grid. A smarter grid will enable many benefits, including improved response to power demand, more intelligent management of outages, better integration of renewable forms of energy, and the storage of electricity.

Environmental Impacts of Smart Grid
2
In this report, the Energy Sector Planning and Analysis (ESPA) Team summarizes the current body of literature to ascertain its analytical coverage of Smart Grid’s impact on the environment. In doing this, the ESPA Team also seeks to identify additional research to unify the analysis and lend credibility to the expectations for this next-generation grid infrastructure.
This paper also attempts to critically evaluate the technical quality and analytical rigor found in the literature to illustrate the level of advancement embodied in the Smart Grid discussion and to provide guidance on future analytical and research endeavors in this field. This report summarizes the key studies to date on the topic of Smart Grid and the environment, highlighting key findings and topic coverage. This report also provides a more general overview of the nature of the current literature and recommendations for additional research.
The Smart Grid will enhance efficiency by reducing the information gap between utilities and consumers via advanced metering infrastructure and accompanying data management technologies. Consumers will be able to conserve energy via demand-response programs and DSM, particularly during peak demand periods. This will also allow utilities to smooth generation and use baseload generation sources more effectively. This includes facilitating a decreased dependence on fossil fuels for transportation by, for example, increased integration of EVs. A shift to such vehicles would cause a shift away from relatively emissions-intensive fossil fuel usage. With better control, utilities will also be able to more easily manage peak demand spikes and generation outages. This, in itself, would reduce the intensity of greenhouse gas (GHG) emissions in a way analogous to the past two decades of successful reductions in NOx and SOx through combustion optimization and smokestack scrubbing.
A key question that the ESPA Team wanted to answer in this paper is: Will the Smart Grid reduce the intensity of GHG emissions in the United States? To this end, the following conclusions are highlighted:
• DR, DSM, and improvements to T&D systems that optimize power consumption may reduce the need for electric power.
• EVs will increase the need for electric power, but at times of the day when that electric power is available. If implemented properly using Smart Grid technology, recharging these vehicles will likely keep the baseload operation running at higher levels all night, even with renewables (PNNL, 2010).
• The use of renewables will be a major part of the solution for additional electric power. Renewable energy generators will need to be backed up by a variety of distributed generation and storage sources, including peaking units, plug-in hybrid EVs in vehicle-to-grid mode, and demand dispatch.
• There will be continued demand for more products that consume more electricity (even if the consumption per device is reduced).
• History has shown that new appliances are added to homes as they become available and homeowners can afford them. As the population grows, new homes are built and new appliances are installed in them.

Environmental Impacts of Smart Grid
3
Many of these conclusions point in different directions. It is not clear that the Smart Grid will reduce net electric power production. It may just slow the growth in electric power production by reducing consumption over what would have otherwise been consumed without the Smart Grid. In this sense, the Smart Grid would allow electricity to be consumed “wisely.”

Environmental Impacts of Smart Grid
4
While compliant with current regulations such as the Clean Air Act (CAA), electricity production generates a substantial amount of criteria air pollutants, as evident by the continuing development of new rules under the CAA for the electric power sector, including the U.S. Environmental Protection Agency’s (EPA) recent announcement of the new Transport Rule under the CAA. This paper focuses on the particulate and gaseous emission pollutants that are produced as by-products from the generation of electricity and how the Smart Grid infrastructure will affect this environmental impact. Coal-fired power plants are the major contributor in the power sector and pollutants include fine particulates, oxides of nitrogen (NOx), oxides of sulfur (SOx), and mercury (Hg). Coal power plants are also a major contributor to carbon dioxide (CO2) emissions. Coal plants also produce solid waste in the form of fly ash and bottom ash.
Introduction
The major components of pollution in gasoline and diesel fuel used in the transportation sector are CO2, unburned hydrocarbons (HCs), carbon monoxide (CO), and NOx. Lead (Pb) has been removed from the gasoline formulation for cars and light trucks (although it is still used in the aviation industry) and is no longer a significant pollutant in the transportation sector. Ozone is produced through a series of chemical reactions with CO, NOx, and HC. To the extent that these pollutants can be reduced during the combustion of these gasoline and diesel fuels, ozone can be reduced as well. Electric vehicles have the potential to reduce these direct emissions, but may indirectly increase emissions from the power sector depending upon which electricity generation resources are used to charge the vehicles.
The U.S. Energy Information Administration (EIA, 2010) reports that in 2008, the following tons of pollutants (Table 1) were produced through the production of electricity and in the transportation sector, and are expected to be produced over the next 20 years under a “business as usual” (BAU) scenario:
Table 1: EIA Pollutants Data
Electricity Production (Million Tons) 2008 2020 2030
CO2 2300 2500 2700 SO2 7.6 4.2 3.7 NOX 3.3 2.0 2.1 Transportation Sector (Million Tons) 2008 2020 2030
CO2 1900 2000 2100 HC 12.8 13.5 14.1 CO 98.3 103.5 108.6 NOX 6.4 6.7 7.1
Source: EIA (2008)
Other sources of pollution in the grid include the polychlorinated biphenyls (PCBs) and oil that are used in transformers. Although PCBs are no longer used in the United States, there are many transformers in use today that contain this chemical. Transformers that are

Environmental Impacts of Smart Grid
5
damaged by excessive loads leak or explode, releasing PCBs and oil into the environment.
Electricity in the United States in 2007 was produced by the following energy sources (Figure 1):
Figure 1: Electricity Generation Composition for United States in 2007
Source: EIA Electric Power Annual Summary (2007)
EIA (2010) expects electricity production to increase by 1.0 percent per year from 2008 to 2035, for an increase of 250 Gigawatts (GW). In EIA’s reference case without greenhouse gas (GHG) legislation, coal’s share of electricity production is expected to decrease from 48 percent in 2008 to 44 percent in 2035. Natural gas’s share of electricity production remains essentially flat at 21 percent in 2008 and 21 percent in 2035. Renewables’ share of electricity production grows from 9 percent in 2008 to 17 percent in 2035, due to federal and state tax incentives and American Recovery and Reinvestment Act (ARRA) funding. The nuclear share of electricity production decreases from 20 percent in 2008 to 17 percent in 2035.
Implementation of the Smart Grid will have a role in reducing the number of pollutants being produced by these activities. This paper evaluates the impact that the Smart Grid will have on reducing the production of these pollutants in the following major areas:
• Demand response (DR)
• Electric vehicles (EVs)
• Demand side management (DSM)
• Renewables and distributed energy resources
• Transmission and distribution (T&D) systems

Environmental Impacts of Smart Grid
6
The Smart Grid is an automated electric power system that monitors and controls grid activities, ensuring the two-way flow of electricity and information between power plants and consumers—and all points in between (Smart Grid Basics, 2010). It is different from today’s electric power grid in several important ways. First, it uses information technologies to improve how electricity travels from power plants to consumers. Second, it allows those consumers to interact with the grid. Third, it integrates new and improved technologies into the operation of the grid. A smarter grid will enable many benefits, including improved response to power demand, more intelligent management of outages, better integration of renewable forms of energy, and the storage of electricity.
Enhanced two-way communication capabilities allow for two-way information flow and can optimize the grid’s efficiency, reliability, and security. Improvements to the transmission and distribution networks throughout the United States will allow utility operators to have a greater understanding of power consumption and flow within the network, ultimately leading to two-way power flow in areas with substantial amounts of renewable resources online. Through the use of smart meters at the edge of the network, power consumption will be monitored on a frequent basis. In addition, through the use of more robust supervisory control and data acquisition (SCADA) systems in the T&D networks, power outages will be identified and power faults will be easier to repair. Many of these activities will be performed with no need to dispatch a utility vehicle. All of these activities can lower the impact of the electrical grid on the environment by reducing the total amount of electricity generated.
The Smart Grid also enables the decentralized generation of power through the use of renewable energy systems with constantly varying power outputs, which will require a great deal of monitoring and control to be effectively integrated into the grid. Because of growth in renewable energy systems enabled by the Smart Grid beyond the current grid tolerance and resource management thresholds, the United States will ultimately rely less on fossil power systems as a total percentage of the energy generation portfolio. Thus, a shift to renewable resources for power generation will also reduce emissions associated with fossil fuel combustion.
This reduction is in addition to dramatic reductions that have taken place in pollutant emissions from existing power plants over the past two decades. These improvements were effected without a Smart Grid, but future improvements will need the multidirectional communications capability that is a key component of the Smart Grid. The purpose of this report is to identify how the Smart Grid will have an impact on the environment compared with BAU, particularly impacts involving emissions of the five pollutants SOx, NOx, particulates, CO, Hg, as well as the GHG CO2, while identifying gaps in the understanding of these impacts.
In this report, the Energy Sector Planning and Analysis (ESPA) team assesses the current literature discussing the environmental impact of smart grids. Guidance on future analytical and research endeavors in this field is also provided.
For instance, since renewable power generation sources are needed for emissions reductions, but power from such sources is intermittent, it is important to carefully assess the minimum amount of ancillary services necessary for grid reliability. Some studies discuss the use of DR as a tool to displace peak load spinning reserves. Moreover,
Environmental Impacts of Smart Grid
7
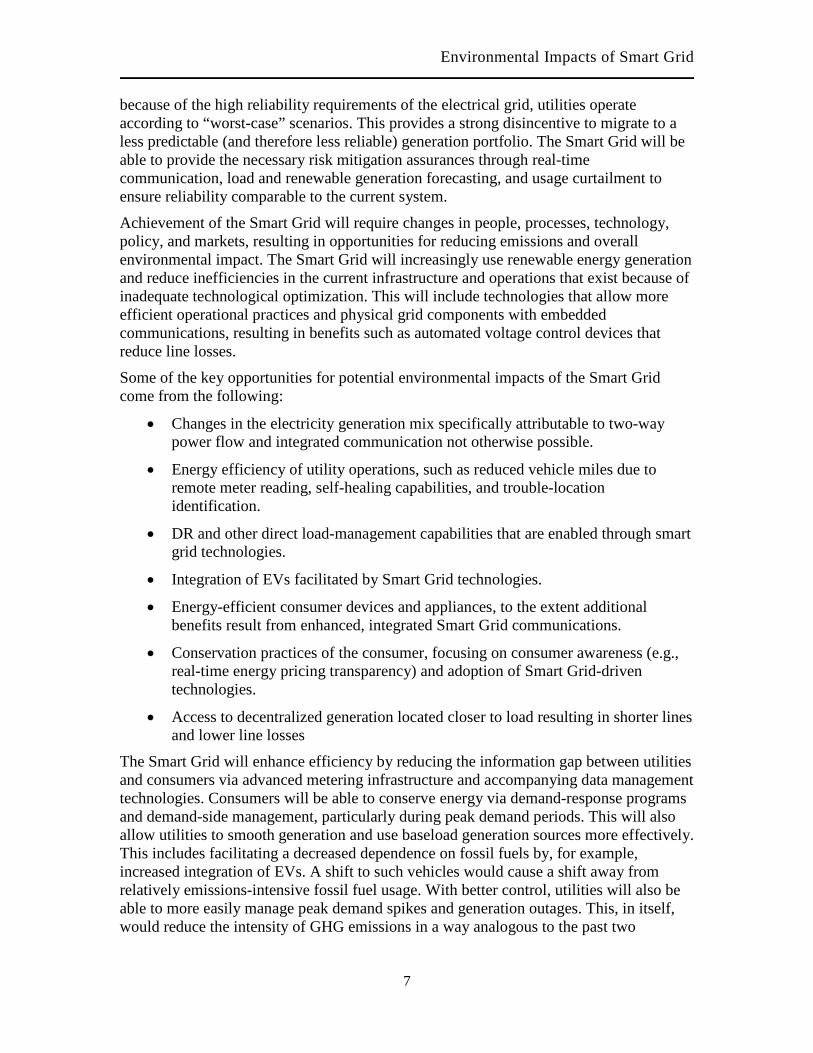
because of the high reliability requirements of the electrical grid, utilities operate according to “worst-case” scenarios. This provides a strong disincentive to migrate to a less predictable (and therefore less reliable) generation portfolio. The Smart Grid will be able to provide the necessary risk mitigation assurances through real-time communication, load and renewable generation forecasting, and usage curtailment to ensure reliability comparable to the current system.
Achievement of the Smart Grid will require changes in people, processes, technology, policy, and markets, resulting in opportunities for reducing emissions and overall environmental impact. The Smart Grid will increasingly use renewable energy generation and reduce inefficiencies in the current infrastructure and operations that exist because of inadequate technological optimization. This will include technologies that allow more efficient operational practices and physical grid components with embedded communications, resulting in benefits such as automated voltage control devices that reduce line losses.
Some of the key opportunities for potential environmental impacts of the Smart Grid come from the following:
• Changes in the electricity generation mix specifically attributable to two-way power flow and integrated communication not otherwise possible.
• Energy efficiency of utility operations, such as reduced vehicle miles due to remote meter reading, self-healing capabilities, and trouble-location identification.
• DR and other direct load-management capabilities that are enabled through smart grid technologies.
• Integration of EVs facilitated by Smart Grid technologies.
• Energy-efficient consumer devices and appliances, to the extent additional benefits result from enhanced, integrated Smart Grid communications.
• Conservation practices of the consumer, focusing on consumer awareness (e.g., real-time energy pricing transparency) and adoption of Smart Grid-driven technologies.
• Access to decentralized generation located closer to load resulting in shorter lines and lower line losses
The Smart Grid will enhance efficiency by reducing the information gap between utilities and consumers via advanced metering infrastructure and accompanying data management technologies. Consumers will be able to conserve energy via demand-response programs and demand-side management, particularly during peak demand periods. This will also allow utilities to smooth generation and use baseload generation sources more effectively. This includes facilitating a decreased dependence on fossil fuels by, for example, increased integration of EVs. A shift to such vehicles would cause a shift away from relatively emissions-intensive fossil fuel usage. With better control, utilities will also be able to more easily manage peak demand spikes and generation outages. This, in itself, would reduce the intensity of GHG emissions in a way analogous to the past two

Environmental Impacts of Smart Grid
8
decades’ successful reduction of NOx and SOx through combustion optimization and smokestack scrubbing.

Environmental Impacts of Smart Grid
9
This review summarizes the environmental impact of the Smart Grid, with particular emphasis on air emissions, and includes an assessment on the quality of the approach and results. The ESPA Team’s approach was to systematically review the major studies relating to environmental impacts, particularly emissions, of the Smart Grid. The initial body of literature was developed through a combination of expert guidance and traditional literature and journal searches online. After having put together a baseline literature database, the team subsequently identified relevant and credible references from the bibliographies of the major studies to expand the literature library by drawing upon the more academic and analytically credible reports.
Study/Research Methodology
The ESPA Team also examined reports available through Department of Energy’s (DOE) National Energy Technology Laboratory (NETL), the Electric Power Research Institute (EPRI), the Environmental Protection Agency (EPA), and the Pacific Northwest Laboratory (PNNL) in an attempt to identify existing efforts on the subject by DOE labs and associated energy think tanks. This approach captured what the energy community has identified as significant and credible sources, as evidenced by frequent citations and references. This methodology also streamlined the literature search process, allowing the ESPA Team to focus on practical aspects of implementing a Smart Grid.
A majority of the literature on this topic is qualitative and subjective. There are limited reports that involve extensive quantitative analysis and an attempted integration of external studies with direct bearing on the subject. Therefore, the team excluded a detailed overview of much of the literature since this content can be readily captured through a more general discussion of key topics associated with the Smart Grid and the environment.
Some of the key areas of review and consideration include:
• How will a Smart Grid enable renewable technologies like solar, wind, tidal, and additional hydro power to benefit the environment?
• What are the environmental impacts of a move from internal combustion vehicles to plug-in hybrid or all-electric vehicles on the environment?
• How will electricity supply be affected by Smart Grid integration in the grid, and how will this affect overall system emissions?

Environmental Impacts of Smart Grid
10
The ESPA Team focused its analysis in the following five areas for this paper:
Key Areas of Environmental Impact of Smart Grid
• DR
• DSM: Changes in consumer behavior and incorporation of Smart Devices to drive energy efficiency
o This will include a discussion of this impact area and an overview of some of the major report studies on how the Smart Grid drives changes in consumer behavior and the communication with Smart Devices.
• The Smart Grid’s ability to facilitate increased EV penetrations
• Facilitation of increased renewable penetration o This will include a discussion of this impact area and an overview of some of
the major report studies on how the Smart Grid will facilitate higher penetration rates.
• Impacts on T&D infrastructure efficiency and energy delivery Accordingly, the paper is divided into five major sections that follow these topics. The ESPA Team has reviewed the major papers on each of these topics and provides an assessment of the information contained in each paper, comparing and contrasting the assumptions and results in each of the five sections.

Environmental Impacts of Smart Grid
11
1.1 Demand Response
Study/Research Findings
The Federal Energy Regulatory Commission (FERC) definition of DR is “[c]hanges in electric usage by end-use customers from their normal consumption patterns in response to changes in the price of electricity over time, or to incentive payments designed to induce lower electricity use at times of high wholesale market prices or when system reliability is jeopardized.” (FERC, 2010)
Put another way, DR is the attempt of the utility to control load patterns. This includes the extreme of utility curtailment of electric loads during peak demand hours, with financial compensation offered to participants. However, gentler measures include time-of-use pricing designed to encourage the usage of electricity during off-peak hours. In the first case, dedicated control systems respond to a request by a utility to reduce electric usage. Conservation measures such as dimming lights, turning up the thermostat, turning off the air conditioning (AC) and water heaters, and other energy saving practices are common in a DR environment.
This ability of utilities to regulate the demand load has a significant environmental impact on the grid. DR can be used to regulate specific device power demands in accordance with the utility’s desires to either avoid negative scenarios such as line congestion or overuse, or, in the environmental case, to minimize emissions due to use of the least efficient generation on the dispatch stack. DR will also prove beneficial as the number of EVs connected to the grid increases, as the timing of their charging will determine their impact on the grid and associated emissions.
DR is often associated with emergency measures that utilities can exercise at their discretion. Consumers accept minor inconveniences because they are remunerated, and because of the occasional and short-lived nature of the power curtailment. This has been demonstrated by numerous studies and trials of DR (FERC, 2009). However, the definition allows for a broader interpretation as any economic stimulus from the utility that induces desired consumer behavior. Smart grid devices automatically communicate prices and adjust a consumer’s usage, applying pre-set conditions for buying or selling power into the grid. A “smart-charging” EV device is an example.
Presently, DR is technologically unsophisticated, and has been successfully implemented for many years with dedicated controls on water heaters and air conditioners. When DR is used in emergency situations, the reduction in electrical use is a secondary benefit because most DR simply shifts the time of electrical use. For instance, if cooling is interrupted for 15 minutes during a particularly intense period of peak demand, it is expected that the air conditioner will operate to re-cool the affected residence soon after the curtailment. In the case of dimmed lights, however, there may be significant energy savings. This results from some reduction in total kWh consumed, and from increased efficiency of generation, transmission (reduced congestion), and distribution. As a result, the emissions may be significantly reduced.
When DR is used for regulation there may be significant reductions in emissions because load and generation is more closely matched minute-by-minute (ORNL, 2000). In the

Environmental Impacts of Smart Grid
12
context of DR, environmental benefits are based on electrical savings at the point of generation. Although DR has traditionally focused on emergency demand reduction, the lessons learned by consumers have had the important secondary effect of making them more aware of their electrical use. This will be examined in more detail below in the discussion of the PNNL paper (PNNL, 2010).
1.1.1 Smart Grid and Demand Response
More sophisticated DR regulation approaches will require the two-way communication capabilities and automated decision-making software that are the hallmarks of the Smart Grid. One might ask why more sophisticated solutions are needed in the place of current solutions that have shown some efficacy (FERC, 2009). Further penetration of DR will be enabled by more effective dynamic pricing, which depends on the two-way communication provided by advanced metering infrastructure (AMI). Also, this increased sophistication is required to meet the challenges of increasing complexity of both generation and loads, particularly distributed generation sources, which add more sources to the dispatch curve.
In particular, Smart Grid technologies are envisioned as meeting both the challenges of integrating increasing amounts of intermittent renewables from the generation side, and also handling increased loads from new technologies such as HEV, EV, and PHEVs. DR is just the best established of a series of tools utilities have for influencing and controlling customer usage. For instance, dynamic pricing is envisioned as the cornerstone of DR and the broader category of DSM, which will be covered in the next section. It also would enhance the development of “demand dispatch,” where renewable or other distributed generation is paired with EV charging needs.
Since renewable generation is intermittent, AMI technology allows the utility to “open the gates” for EVs connected to the grid to recharge, ostensibly by request of the EVs in need of charging. This would optimize emissions reductions and overall environmental impact by fully utilizing the capabilities of intermittent renewables and avoiding the need to use as many carbon-intensive generation sources for fueling an EV fleet. This same logic can be applied to a range of end-user devices that, when regulated, would allow the utility to optimize emissions output while still providing the necessary energy to the grid.
As the portfolio of distributed energy generation sources expands, along with increased clean technologies, the precise and efficient management of these sources’ output with demand load will be critical to emissions abatement. This is where the incremental value of the Smart Grid on the environment will be realized. There is also an opportunity for distributed coal generators to fill the gap when intermittent renewables generation is insufficient.
The U.S. Energy Information Administration (EIA), in its 2008 Annual Energy Outlook (US EIA, 2008), projected that electricity consumption in the U.S. residential, commercial, and industrial sectors will grow at an annual rate of 1.07 percent from 2008 through 2030. EPRI (2009) has determined that energy efficiency programs have the potential to realistically reduce this growth rate to 0.83 percent per year from 2008 through 2030. Under an ideal set of conditions conducive to energy efficiency programs, this growth rate can be further reduced to as low as 0.68 percent per year.

Environmental Impacts of Smart Grid
13
EIA projects that peak demand in the United States will grow at an annual rate of 1.5 percent from 2008 through 2030. The combination of energy efficiency and demand response programs that EPRI envisions has the potential to realistically reduce this growth rate to 0.83 percent per year. Under an ideal set of conditions conducive to energy efficiency and demand response programs, this growth rate can be further reduced to as low as 0.53 percent per year The Brattle Group (Hledik, 2009) identifies a control case plus three more scenarios that can occur in a dynamic pricing environment:
• BAU
• Expanded BAU
• Achievable participation
• Full participation
The ideal case is then a limiting case where all consumers participate because the dynamic price is high enough. This raises several questions however. First, if the dynamic price must follow the true cost of the supplied electricity, it should not be engineered according to a social agenda, but follow free market principles. Prices will rise and fall according to the true cost of generation and transmission, but if the dynamic pricing is truly effective, equilibrium may be reached where prices are so moderate that supply and demand are balanced and participation in the program would achieve saturation. However, the Brattle Group also outlines the barriers to dynamic pricing (what it calls “demand response”) as technological, economic, and regulatory. They indicate that regulations inhibit the implementation of dynamic pricing, but it is possible to see dynamic pricing used by regulators to implement a social agenda. In this case, surcharges could be placed on electricity to further encourage demand reduction. Full participation could be reached, in principle; that is, economic theory allows for such a result. In reality, due to the history of the electric utility industry, and its interaction with regulators (PUC), the true dynamic price of electricity is hidden from consumers.
EPRI estimated various types of potential savings for energy efficiency and demand response options. These programs range in scope from “technical potential” to “economic potential,” but differ from the energy efficiency model in that there is no economic potential reported. Instead, the programs included in the analysis are assumed to be cost-effective for both the implementer and participant, and the predicted acceptance is encompassed in the maximum achievable potential. The potentials estimated for demand response are defined as follows:
• Technical Potential – Complete penetration of DR programs among eligible customers, assuming load shed is comparable to the highest performing customers under existing programs.
• Maximum Achievable Potential – Technical potential adjusted to include market penetration, accounting for perceived market barriers.
• Realistic Achievable Potential – Maximum achievable potential adjusted to reflect regulatory and administrative barriers.
The combined effects of energy efficiency and demand response on the potential for peak demand reduction for the United States as a whole are presented below in Table 2.

Environmental Impacts of Smart Grid
14
These estimated levels of electricity savings and peak demand reduction are achievable through voluntary customer participation in energy efficiency and demand response programs implemented by utilities or state agencies. The estimated cost of implementing programs to achieve realistic potential savings ranges from $1 to $2 billion in 2010, growing to $8 to $20 billion by 2020, to $19 to $47 billion by 2030. This analysis does not assume enactment of new energy codes and efficiency standards. More progressive codes and standards would yield even greater levels of electricity savings and peak demand reduction.
Table 2: Summer Peak Demand Savings (GW) from Energy Efficiency and Demand Response
Source: EPRI (2009)
The Brattle group article is noteworthy for its explicit connection of the Smart Grid to environmental benefits, particularly the anticipated role of Smart Grid technologies in reducing CO2 emissions. After defining the Smart Grid, beginning with the notion of two-way communication, the author visits the touchstones of consumer equipment such as advanced metering infrastructure (AMI) and in-home displays that will support DR and plug-in hybrid EV (PHEV) integration, advanced distribution, distributed generation (DG), and the resulting storage necessary to make it all work.
The focus of this article is public policy and advocacy rather than technical issues. For this reason, the author presents his points in the form of a debating position. The article presents conservative and “expanded” scenarios for Smart Grid penetration, including DR, which it uses as inputs for its Regional Capacity Planning Model, (“RECAP”).

Environmental Impacts of Smart Grid
15
Table 3: Summary of RECAP Modeling Adjustments
Smart Grid Technology
Impact Description Impact Level Applicable
Scenario Modeling
Adjustment
Dynamic pricing (for DR)
with enabling
technology (AMI)
Peak reduction
11.5 percent reduction
Conservative and Expanded
Load forecast is adjusted with shifting of load during top peak hours to off-peak hours
Overall conservation
2.6 percent reduction
Conservative and Expanded
Load forecast is adjusted by reducing demand by 2.6 percent in every hour
In-home displays (HAN)
Overall conservation
1.4 percent reduction
Conservative and Expanded
Load forecast is adjusted by reducing demand by 1.4 percent in every hour
Distributed and expanded
energy resources
Cleaner generation
mix
Doubling of RPS Expanded
RPS constraint is doubled for each model region
Reduced distribution
losses
10 percent reduction Expanded
Distribution loss factor is reduced from 7 percent to 6.3 percent
Source: Brattle Group (2009)
Because the results for CO2 reduction are based on the proprietary RECAP model, this analysis cannot be easily replicated. The report also makes optimistic projections about renewable integration of twice the current portfolio standards. For these reasons, this report has limited usefulness beyond its qualitative discussion of how the environment and the Smart Grid relate.
A more quantitative view of the Smart Grid’s impact on the environment is provided by a recently published PNNL paper (Pratt et al., 2010). This study finds small direct electricity demand reductions from DR programs, because it defines DR as curtailment (not dynamic pricing). However, the consumer becomes more aware of electricity use via the DR experience with AMI, and this leads to electricity conservation. This consumer information effect causes most of the 3 percent reduction in electrical use reported in Table 4. The PNNL paper treats DR under the category of “load shifting” and bases impact estimates on shifting “sufficient” load from the peak period for each of the 12 NERC sub-regions. This equates to a 10 percent reduction (shift) in peak load. The Smart Grid does aid load shifting via AMI, and this does enhance the overall efficiency of the grid (in terms of lack of congestion, and more efficient dispatch).

Environmental Impacts of Smart Grid
16
Table 4: Reduction in Electricity Use Resulting from Smart Grid
Mechanism
Reductions in Electricity Sector Energy and CO2
Emissions*
Direct (%) Indirect (%) Conservation Effect of Consumer Information and Feedback Systems 3 - Joint Marketing of Energy Efficiency and Demand-Response Programs - 0 Key Enabling Technology: Disaggregation of Total Loads into End Uses - - Deployment of Diagnostics in Residential and Small/Medium Commercial Buildings 3 - Measurement & Verification (M&V) for Energy Efficiency Programs 1 0.5
Shifting Load to More Efficient Generation <0.1 - Support Additional Electric Vehicles and Plug-In Hybrid Electric Vehicles 3 - Conservation Voltage Reduction and Advanced Voltage Control 2 - Support Penetration of Renewable Wind and Solar Generation (25 percent renewable portfolio standard [RPS]) <0.1 5
Total Reductions 12 6
*Assumes 100 percent penetration of the smart grid technologies.
Source: PNNL (2010)
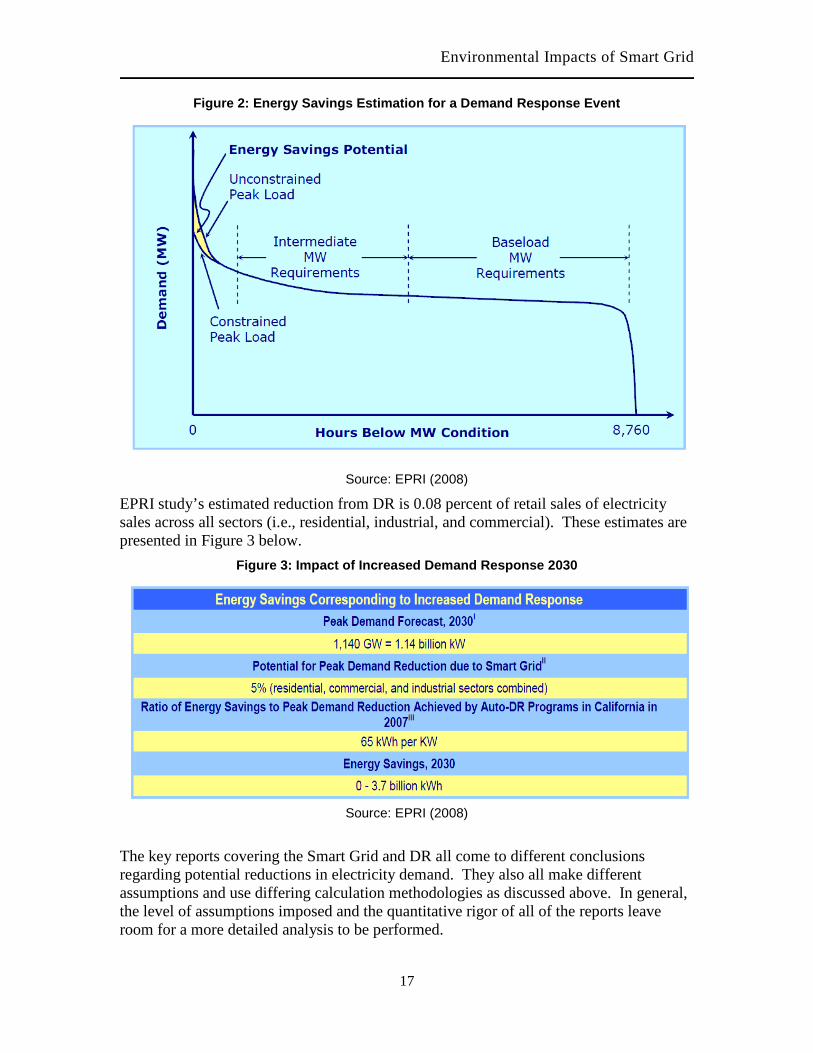
A study by EPRI (2008) details the potential reductions from DR programs. Its core argument rests on the assumption that the Smart Grid will allow for more advanced (longer and more frequent) DR events, which will incrementally decrease emissions beyond current DR programs in operation. Figure 2 below provides EPRI’s estimated savings from a typical DR event.
Environmental Impacts of Smart Grid
17
Figure 2: Energy Savings Estimation for a Demand Response Event
Source: EPRI (2008)
EPRI study’s estimated reduction from DR is 0.08 percent of retail sales of electricity sales across all sectors (i.e., residential, industrial, and commercial). These estimates are presented in Figure 3 below.
Figure 3: Impact of Increased Demand Response 2030
Source: EPRI (2008)
The key reports covering the Smart Grid and DR all come to different conclusions regarding potential reductions in electricity demand. They also all make different assumptions and use differing calculation methodologies as discussed above. In general, the level of assumptions imposed and the quantitative rigor of all of the reports leave room for a more detailed analysis to be performed.

Environmental Impacts of Smart Grid
18
1.2 Demand Side Management DSM is defined (EIA Glossary) as “[t]he planning, implementation, and monitoring of utility activities designed to encourage consumers to modify patterns of electricity usage, including the timing and level of electricity demand. It refers to only energy and load-shape modifying activities that are undertaken in response to utility-administered programs. It does not refer to energy and load-shaped changes arising from the normal operation of the marketplace or from government-mandated energy-efficiency standards. Demand-Side Management covers the complete range of load-shape objectives, including strategic conservation and load management, as well as strategic load growth.”
DSM is a superset of DR, containing energy efficiency efforts not mandated by the government (FERC, 2010). It is the process of managing the consumption of energy, often to optimize available and planned generation resources, but it can also be aimed at reducing costs and minimizing environmental impact. This is often distinguished from DR, where the utility or load serving entity (LSE) influences the demand by regulating energy delivery. With DSM the focus is on consumer behavior, both as impacted by utilities and government policies, but also as initiated by the consumer and in the consumer’s self-interest. The consumer can actively reduce usage based on real-time pricing information or deal with it passively (automated) based on predetermined usage patterns, such as programming “smart appliances” to use energy according to preset designations. DSM has historically involved utility sponsored efforts to provide incentives to customers to use high efficiency appliances and lighting and participate in peak reduction programs such as AC and electric water heater cycling. With the introduction of smart grid technologies, DSM adds dynamic pricing and automated response capabilities as a subcategory. The introduction of smart appliances will be a vehicle for both DSM influences. With sophisticated Smart Grid technologies integrated with these appliances, their electrical demands will be adjusted based not only on operational needs of the utility, but also in the interest of the consumer. This includes, for example, the ability to adjust home thermostat temperature ranges (within limits set by consumer). These smart appliances, however, will have the most control imposed on them from the end user. Consumers will have the ability to program their homes to operate in a particular fashion, such as changing the temperature of refrigeration or climate control during the daytime, depending on their needs and preferences. The ability to program these devices to operate at predetermined usage levels has a connection to the Smart Grid in that they can be programmed in accordance with price signals communicated via AMI. For example, appliances could be set to run at reduced power levels when energy prices are high, or a plugged-in EV could be set to delay charge until energy prices were at their lowest, which would overlap to some extent with the likely DR strategy of the utilities.
The second key aspect of DSM where the Smart Grid will play a critical role is that of consumer-facing AMI. These intelligent and transparent meters will offer consumers real-time pricing and usage information that provides them with the necessary tools to make conscious energy consumption decisions. In addition to these devices interacting with smart appliances as previously discussed, they now give the user the ability to make usage decisions in real time based on current electricity rates. For example, if consumers are able to see that washing laundry during the daytime is more costly, they may delay

Environmental Impacts of Smart Grid
19
this activity until prices are lower. Further, from an emissions reduction standpoint, the availability of this information has been shown to motivate consumers to reduce overall consumption, which subsequently reduces environmental impact. This learning-based behavior change is emphasized as the main reason for the 3 percent reduction in energy use (Table 4) due to AMI estimated by the PNNL paper (PNNL, 2010).
The Smart Grid can provide the two-way communication necessary for optimal energy efficiency and conservation. Energy conservation occurs when consumers curtail desirable activity in order to reduce energy use. Energy efficiency allows the desirable activity to occur, but for less energy, either based on capital expenditure on a more efficient machine, or the more efficient use of existing machinery. DSM addresses energy efficiency, not conservation, but conservation is an important element of demand analysis (FERC, 2009). A global perspective on DSM is provided by a World Bank Report (Charles River Associates (2005)). This report interprets DSM as load shaping via load management (LM) or energy efficiency (EE). The authors reference a very early paper by EPRI (Gellings), written in the mid-80s, when the concept of DSM was being refined in response to the energy shocks of the 1970s. The LM can be peak-clipping or valley-filling, and relates to attempts to integrate EVs onto the grid by having them charge when they perform a valley-filling function.
The government, utilities, and consumers all cooperated during these crises to reduce energy use. However, theorists quickly noticed that it is not in the interests of utilities for electrical use to fall dramatically. This problem and potential solutions are discussed in the World Bank report. DSM consists of DR plus EE. Managing demand can be done from the utility side via incentives or penalties (including time of use (TOU) pricing, for instance), or by consumers when they reduce costs by generating their own power, using the utility power more efficiently, or curtailing their use. The impetus in the case of DSM is the consumer, whereas in DR, the utility tries to influence behavior with economic incentives, and sometimes can forcibly curtail the consumer’s electrical use.
The successful impact of Smart Grid on the environment depends not only on the penetration of the Smart Grid, but also on the behavior of people. The "low hanging fruit" for DSM or DR are energy-intensive items like air conditioners and processes (from the business side) like making steel that are worth scheduling when electricity prices are lower. To cause greater penetration of DSM, barriers must be overcome, and these are listed in the “National Assessment of Demand Response Potential” (FERC, 2009) as being regulatory, economic, and technological. The technological barrier is overcome by installing AMI plus enabling technology (for data processing). The economic barrier for utilities and people are based around a lack of incentive to participate.
The utility is in the business of selling electricity at a profit. DR allows the utility to cut down on fuel costs because, under typical tariffs, it is underpaid for providing electricity during peak periods. However, the energy efficiency associated with DSM can reduce the total amount of electricity used, which can hurt utility profits. The World Bank report discusses how the utilities can be incentivized according to metrics other than the amount of power sold.
There are also economic barriers to DSM/DR on the consumer side. The consumer is incentivized to act via dynamic pricing, which sends the price signal to the consumer, but

Environmental Impacts of Smart Grid
20
these high prices inevitably raise some consumers’ bills to “astronomical” levels, causing a backlash (see “Bakersfield Effect”, Smart Grid Library, 2010). This backlash has a political effect, and increases the likelihood that regulations will curb dynamic pricing.
1.3 DR and DSM in Smart Grid Context DR plays a role in teaching consumers about their electrical use, and how they can be efficient and conserve. DSM is a systematic way for customers to take control of their own electrical use. DR and DSM are both increased in effectiveness by the two-way communications that the Smart Grid provides. However, the environmental successes that SG, DR, and DSM bring will be accompanied by excess generation build-out if governments and utilities don’t make good estimates of future electrical energy reductions made possible by these technological advances. EPRI’s Green Grid Study (EPRI, 2008) describes and quantifies how the enhanced communications and control functionality of a Smart Grid can unleash the following mechanisms to facilitate greater levels of energy savings, and therefore reductions in CO2 emissions:
• Continuous commissioning of buildings
• Reduced T&D line losses
• Direct feedback to consumers
• More effective and reliable DR and load control
• Enhanced measurement and verification (M&V) capabilities The major assumption in this report is the use of EIA 2008 load growth estimates between 2008 and 2030, combined with target values that EPRI developed. Table 5
Table 5: Smart Grid Technologies’ Impacts on Energy Sector: Predicted, Targeted
Technology EIA 2008 Reference Target
Efficiency Load Growth: 1.05 percent / yr Load Growth: 0.75 percent / yr
Renewables 55 GWe by 2030 100 GWe by 2030
Nuclear Generation 15 GWe by 2030 64 GWe by 2030
Advanced Coal Generation
No heat rate improvements for existing plants; 40 percent new plant efficiency by 2020
1-3 percent heat rate improvement for 130 GWe existing plants; 46 percent new-plant efficiency by 2020, 49 percent by 2030
CCS None Widely deployed after 2020
PHEV None 10 percent of new light duty vehicle sales by 2017; 33 percent by 2030
DER <0.1 percent of baseload in 2030 5 percent of baseload in 2030
Source: EPRI (2008)

Environmental Impacts of Smart Grid
21
shows the reference case, and the target that can be reached if the Smart Grid reaches its potential.
EPRI’s analysis shows that a Smart Grid could potentially reduce annual energy consumption by 56 to 203 billion kWh in 2030, corresponding to a 1.2 percent to 4.3 percent reduction in projected retail electricity sales in 2030 compared to BAU.
Unlike the PNNL paper, the EPRI paper allows the Smart Grid to facilitate greater integration of renewable generation resources as well as greater deployment of PHEVs. Both of these mechanisms, while not associated with energy savings, will reduce GHG emissions, because renewable sources such as wind and solar displace fossil-burning energy sources, and PHEVs avoid the emissions from conventional internal combustion engines (ICE) in the transportation sector.
EPRI’s estimate of the combined environmental impact of all seven Smart Grid mechanisms are an estimated annual reduction in GHG emissions equivalent to 60 to 211 million metric tons of CO2 in 2030.
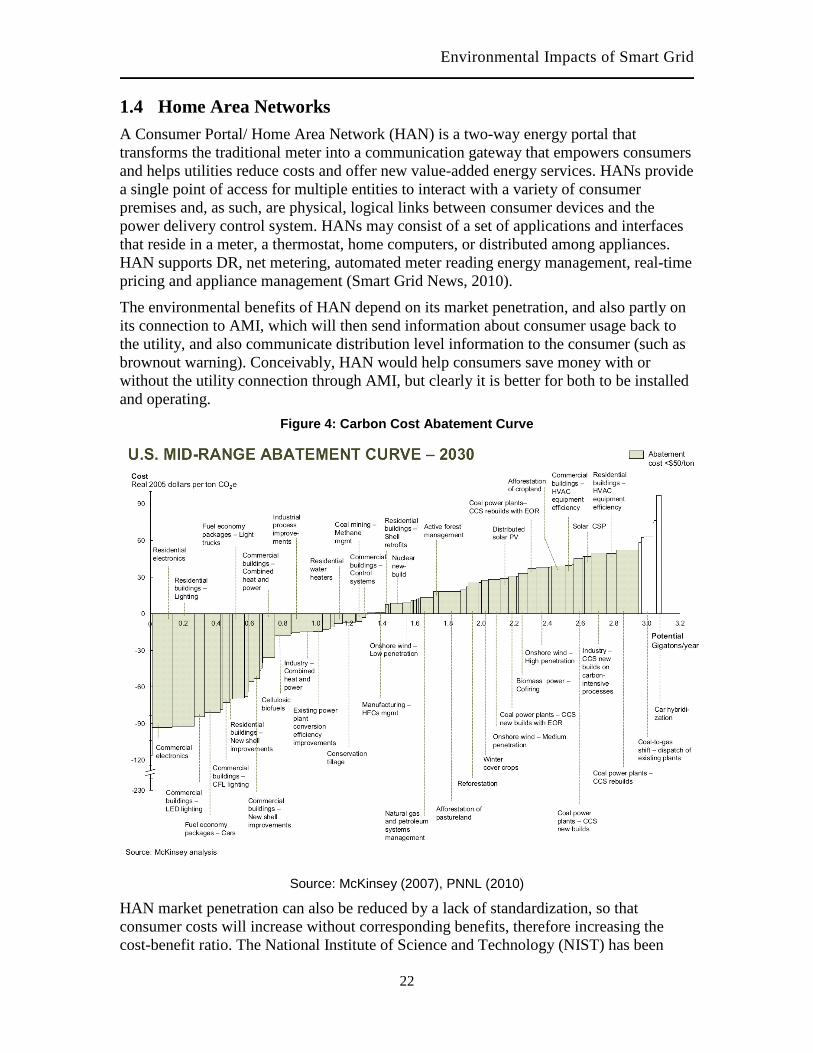
DSM is only effective when consumers are motivated to reduce electrical use. The following curve (Figure 4) from Pratt et al. (2010, original source McKinsey, 2007) shows the carbon cost abatement in dollars per ton of CO2. Negative costs indicate “win-win” situations, where reducing carbon also reduces costs. Energy efficiency is in this “win-win” zone. DSM has been very successful for industrial consumers who use a lot of energy. New DSM and DR efforts suffer from the diffuse nature of residential consumers, with the hope that millions will save relatively small amounts by reducing electrical inefficiency or permit the utility to do this for them.
Table 6 summarizes the assumptions, findings and results that were identified for DR and DSM aspects of the smart grid in its relationship to the environment.
Table 6: Assumptions, Findings and Results Related to DR, DSM
Source Assumptions Findings
FERC/BRATTLE DSM = DR + energy efficiency
Smart Grid is key enabler of increased electrical demand reductions
EPRI
Energy efficiency and DR discussed together (seen as synergistic). Economic benefit for both consumer and utility
Savings increase dramatically from 2010 to 2020 and grow more slowly from 2020 to 2030. Realistic potential by 2030 for DR and energy efficiency is 157 GW during summer peak
PNNL
DR is curtailment and voluntary reduction during peak (emergency) periods
Smart grid technologies such as AMI educate consumer and cause further efficiency and conservation
Environmental Impacts of Smart Grid
22
1.4 Home Area Networks A Consumer Portal/ Home Area Network (HAN) is a two-way energy portal that transforms the traditional meter into a communication gateway that empowers consumers and helps utilities reduce costs and offer new value-added energy services. HANs provide a single point of access for multiple entities to interact with a variety of consumer premises and, as such, are physical, logical links between consumer devices and the power delivery control system. HANs may consist of a set of applications and interfaces that reside in a meter, a thermostat, home computers, or distributed among appliances. HAN supports DR, net metering, automated meter reading energy management, real-time pricing and appliance management (Smart Grid News, 2010).
The environmental benefits of HAN depend on its market penetration, and also partly on its connection to AMI, which will then send information about consumer usage back to the utility, and also communicate distribution level information to the consumer (such as brownout warning). Conceivably, HAN would help consumers save money with or without the utility connection through AMI, but clearly it is better for both to be installed and operating.
Figure 4: Carbon Cost Abatement Curve
Source: McKinsey (2007), PNNL (2010)
HAN market penetration can also be reduced by a lack of standardization, so that consumer costs will increase without corresponding benefits, therefore increasing the cost-benefit ratio. The National Institute of Science and Technology (NIST) has been

Environmental Impacts of Smart Grid
23
tasked with crafting standards for Smart Grid interoperability, which includes metering and home network devices (NIST, 2010). The standard for HAN device communication, measurement, and control is OpenHAN (NIST, 2010, TechPulse360, 2010).
Also, even with AMI and HAN functioning, consumer behavior can be a roadblock to Smart Grid benefits. For instance, Public Utility Commission (PUC) regulations may prevent utilities from increasing the cost of electricity to the price point that will motivate consumers into making electricity-saving decisions. Utilities may find it easy to influence consumer behavior with respect to air conditioning, but may not be able to convince consumers to run a washing machine in the middle of the night at any price point allowable by the PUC.

Environmental Impacts of Smart Grid
24
1.5 Electric Vehicles EVs have tremendous potential to offset portions of the environmental impacts from both the direct transportation sector and from the electricity generation sector. With the expansive adoption and integration of EVs into the marketplace, the displaced emissions from ICEs could be substantial. From the standpoint of the electric utility grid, EVs offer an opportunity to facilitate increased penetration of renewables and reduce the need for peaking generation units during the day by acting as a distributed storage and generation source.
EVs, however, pose a tremendous threat to the current grid infrastructure if not managed appropriately. Depending on when they charge, their strain on the generation and T&D networks could be substantial, prompting the need for additional investment in generation capacity. Further, their ability to facilitate increased renewable generation comes from the grid’s ability to effectively pair their charging requirements with intermittent renewable generation cycles, and to be able to draw down their batteries during the daytime when energy storage has the highest value. EV market adoption will likely also lead to increased usage of coal generation in the short term, resulting in increased emissions from the electric power sector. Whether or not a net decrease in emissions is realized will depend on numerous factors including: regional power generation mix, increased efficiency of ICEs, utilization of renewables, and the increased efficiency of carbon intensive generation sources.
The role of Smart Grid in managing EVs while they are charging and discharging will be invaluable. Without intelligent grid technologies, the necessary management tools such as DR, variable charging rates, and renewable generation pairing will be difficult to attain. In this capacity, the Smart Grid will have a strong influence on the environmental impact reductions realized by an EV fleet. The metering and accounting technologies needed for vehicle-to-grid (V2G) discharging will be computer based, intelligent information systems similar to the Internet, where the data metrics from individual vehicles can be transmitted and processed in real time by the electric utility (or some energy broker) to make decisions about generation dispatch.
A study by EPRI (2007) analyzes the GHGs of PHEVs over the period of 2010 to 2050. The projections (Table 7, below) provide estimates on CO2 reductions associated with various PHEV penetration rates. However, this study does not explicitly disaggregate these reductions between Smart Grid and non-Smart Grid enabled utility infrastructure. Therefore, it is difficult to assign specific estimates of the impacts of Smart Grid technologies on these reductions; rather, it is assumed that high penetration rates and the reductions as detailed in the report could not exist in the absence of Smart Grid infrastructure. For example, the “high” penetration scenario listed below assumes 80 percent of the new vehicle market is from PHEVs. At this level of market penetration, the effective load and V2G management of the vehicles would be impossible without intelligent, automated communications networks.

Environmental Impacts of Smart Grid
25
Table 7: Annual GHG Emissions Reductions from PHEVs in the Year 2050
Source: EPRI (2007)
A study by PNNL (2010) looks at the incremental impact of the Smart Grid on PHEVs and how it affects the overall reduction in emissions. The analysis is based on the level of PHEV penetration that would require “smart charging” technologies to be installed to avoid additional generation capacity investments. The study finds that the Smart Grid has the potential to reduce overall electric sector GHG emissions by 3 percent. Notably, this analysis neglects to include the potential environmental benefits of more aggressively and strategically managing the charging and discharging (V2G) of an EV fleet. Therefore, the estimates from this study represent a very conservative outlook on the value of the Smart Grid to the EV industry.
Another study by EPRI (2008) looks more specifically at the Smart Grid and PHEVs, estimating overall avoided emissions of 10 to 60 million metric tons of CO2 in 2030. This estimate is based entirely on “judgment” of the attribution of benefits to the Smart Grid, making this estimate very uncertain. The conceptual framework for the EPRI study is based on the usual dimensions of PHEVs, including charging regulation, V2G, and consumer/utility investment frameworks.
In looking at these respective reports in comparison to each other, the clearest differences are in their underlying assumptions. They all use judgment to determine at what levels of market penetration the Smart Grid technologies become necessary information and decision-making conduits for the grid. None of the studies examines in detail the comprehensive portfolio of potential environmental impact offsetting of EVs. The quantitative estimates provided, as discussed above, are generally based on broad assumptions about Smart Grid technology penetration, and general grid capacity to handle increased EVs without the need for intelligent information and data management. In most of the literature, the virtues of the Smart Grid’s ability to manage EV charging and discharging are discussed, but nowhere are they estimated using rigorous analytical methodologies. More accurate quantification of the role of Smart Grid in augmenting the inherent value of EV technologies may be difficult. However, more advanced “judgment” of the Smart Grid’s role could be pursued and potentially yield more fruitful estimation.

Environmental Impacts of Smart Grid
26
1.6 Renewable Energy and Distributed Storage Renewable generation sources have clear advantages in terms of minimizing overall environmental impacts, namely GHG emissions. These come in the form of cleaner generation and, in the case of small residential installations, reduced electricity delivery distance and associated line losses. However, renewable energy sources such as wind and solar have uncertain generation schedules, making them more difficult to manage and fully utilize in an integrated generation portfolio framework. In the attempt to reduce system wide emissions, it will be the effective and intelligent management of these intermittent, clean resources that will define success. Smart Grid technology infrastructure will be a key component in the ability of the grid to integrate high penetrations of distributed, renewable generation sources (PNNL, 2010). The current grid and associated energy management systems will be capable of effectively absorbing and dispatching a certain percentage of these resources. However, as renewable energy penetration rates increase, there will be more inherent difficulty in managing these intermittent, distributed resources, prompting a need for intelligent management systems.
The Smart Grid will become the information and decision-making liaison between the renewables, baseload and peaking plant, and DR worlds. For instance, as discussed before, the Smart Grid will be capable of intelligently pairing renewable generation periods with EV charging, facilitating a need for renewable investments beyond the traditional power needs of home and industry use. The Smart Grid will also play a role in intelligently transmitting energy from active renewable sources to areas of demand that are not necessarily nearby. Currently, renewable sources can be managed somewhat effectively within individual utility networks, but as more renewable capacity is sited in regions of high productivity, the corresponding demand may not exist within the same T&D network. The necessary communication and automated decision-making for national scale T&D will be best realized using the Smart Grid.
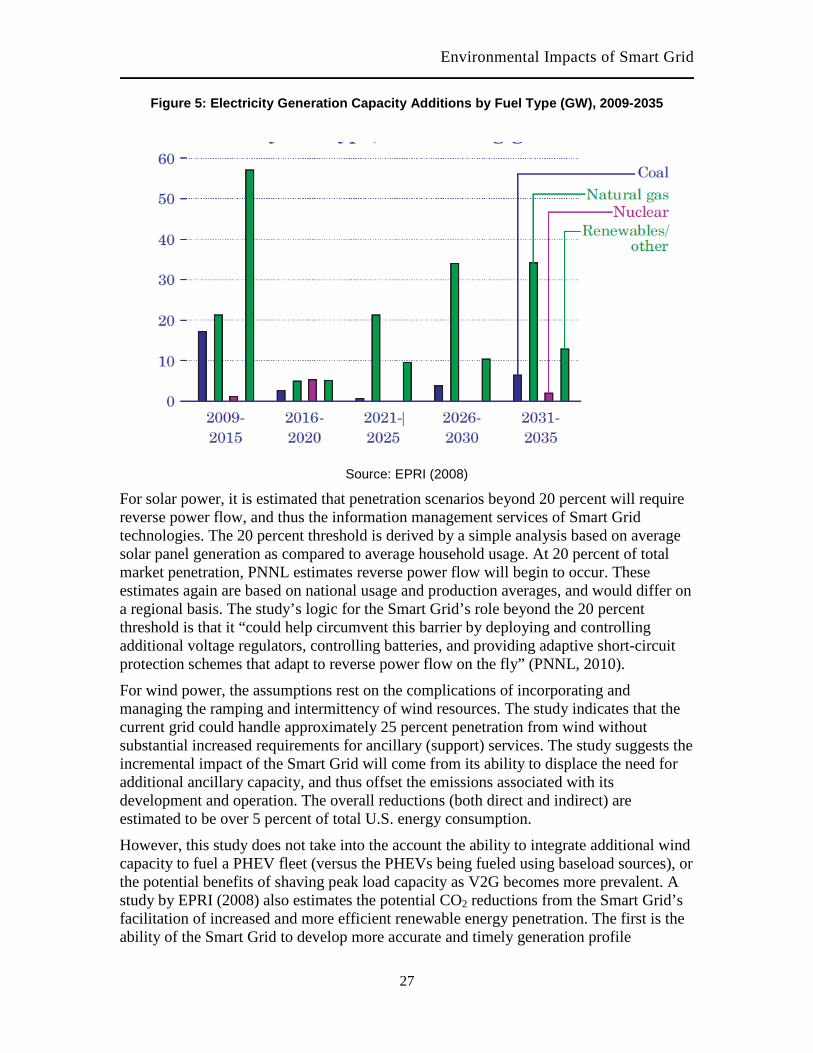
Current projections of renewable energy make the prospect of significant installed capacity of these distributed generation sources a reality. This stems from the combined pressure of attractive low carbon energy and the regulatory mandates of renewable portfolio standards (RPS). Figure 5 below highlights the increasingly large role that renewable energy will play in the national energy portfolio going forward, buttressing the discussion of Smart Grid management.
A PNNL study (2010) details the incremental percentage penetration of renewable (wind and solar) energy that can be achieved through the use of Smart Grid technologies. Subsequently, emissions offsets are calculated based on this additional introduction of carbon-free electricity generation. The study rests on the assumptions that at certain penetration rates of these intermittent renewables, reverse power flow will be necessary and that Smart Grid infrastructure will be required to adequately manage this information.
Environmental Impacts of Smart Grid
27
Figure 5: Electricity Generation Capacity Additions by Fuel Type (GW), 2009-2035
Source: EPRI (2008)
For solar power, it is estimated that penetration scenarios beyond 20 percent will require reverse power flow, and thus the information management services of Smart Grid technologies. The 20 percent threshold is derived by a simple analysis based on average solar panel generation as compared to average household usage. At 20 percent of total market penetration, PNNL estimates reverse power flow will begin to occur. These estimates again are based on national usage and production averages, and would differ on a regional basis. The study’s logic for the Smart Grid’s role beyond the 20 percent threshold is that it “could help circumvent this barrier by deploying and controlling additional voltage regulators, controlling batteries, and providing adaptive short-circuit protection schemes that adapt to reverse power flow on the fly” (PNNL, 2010).
For wind power, the assumptions rest on the complications of incorporating and managing the ramping and intermittency of wind resources. The study indicates that the current grid could handle approximately 25 percent penetration from wind without substantial increased requirements for ancillary (support) services. The study suggests the incremental impact of the Smart Grid will come from its ability to displace the need for additional ancillary capacity, and thus offset the emissions associated with its development and operation. The overall reductions (both direct and indirect) are estimated to be over 5 percent of total U.S. energy consumption.
However, this study does not take into the account the ability to integrate additional wind capacity to fuel a PHEV fleet (versus the PHEVs being fueled using baseload sources), or the potential benefits of shaving peak load capacity as V2G becomes more prevalent. A study by EPRI (2008) also estimates the potential CO2 reductions from the Smart Grid’s facilitation of increased and more efficient renewable energy penetration. The first is the ability of the Smart Grid to develop more accurate and timely generation profile

Environmental Impacts of Smart Grid
28
estimates, notably of wind, which increases the ramping efficiency of the ancillary generation capacity supporting these renewables. The second aspect is utilizing real-time and forecasted wind generation data to integrate with other generation and demand-side options. Notably, this study only assesses the impact of Smart Grid technologies on wind generation, and does not include a similar quantitative analysis for solar.
The resulting estimates from Smart Grid’s role in managing wind generation are 19 to 37 million metric tons of avoided CO2 emissions in 2030. Table 8 below provides the estimates from EPRI regarding Smart Grid’s enablement of renewable generation. Table 8: CO2 Impact of Smart Grid Enablement of Renewable Resource Deployment 2030
Source: EPRI (2008)
Both the PNNL and EPRI studies essentially make judgment calls on the portion of renewable penetration that will be facilitated and/or supported by the Smart Grid. These assumptions are based on various normative dimensions, but are not necessarily grounded in empirical analysis. The PNNL study focuses more on avoidance of additional capacity investments (that subsequently create emissions), while the EPRI study focuses on supporting new renewable energy development. Both estimates capture the same basic idea, which is displaced carbon-intensive generation.
Further, the EPRI study does not address emissions reductions from the use of solar power, which going forward can be expected to account for an increasingly large percentage of renewable energy generation. The PNNL study, for example, does not consider what level of reverse power flow from the residential solar units could be managed by utilities without Smart Grid technologies. Further, there is no analysis for

Environmental Impacts of Smart Grid
29
solar power management beyond the residential sector, meaning that distributed commercial and utility scale installation management is not included under the Smart Grid management umbrella. Clearly, Smart Grid technologies will be able to play a supportive role in the management of these assets as well, albeit to perhaps a lesser degree due to their relatively larger size and fewer locations.
1.6.1 Consumer Back-Up Generators
Consumer back-up generators (BUGs), are another form of distributed storage that would behave similarly to PHEVs. BUGs typically take the form of diesel generators, either for residential or commercial use purposes. Their investment costs are borne by the consumer, and are highly distributed. They would require somewhat similar grid-tied management, utilizing the intelligent Smart Grid network to manage their discharging onto the grid.
An NETL study (2010) estimates the potential emissions reductions from the current “fleet” of BUGs. According to the report “about 75 percent of commercial businesses have backup generators, with an average size of 18 kW.” The study notes that even these diesel-fueled generators can realize net emissions reductions relative to their peak load alternative, which are typically natural gas plants. These emissions reductions come from more efficient ramping and localized usage. The emissions categories and their respective reductions are provided below:
• More than 935,000 tons a year reduction in CO2 emissions.
• More than 54,000 tons a year reduction in NOx emissions.
• More than 33,000 tons a year reduction in SOx emissions. This study looks primarily at BUGs from a conceptual standpoint, and does not provide rigorous computations for their costs, benefits, and usage patterns. The emissions abatement estimates come from basic calculations about available BUG capacity versus national peak demand. However, a utilitarian argument is presented highlighting the fact that the BUGs capacity already exists, and thus does not require new capital investment for the resource itself, but rather only for the technology to effectively integrate it into the grid. Another notable dimension of analysis that is not included would be to evaluate the consumer behavior of running these devices for themselves during peak times. This would save the consumer energy costs and eliminate the need for the Smart Grid infrastructure management.

Environmental Impacts of Smart Grid
30
1.7 Improvements to Transmission and Distribution Systems The line losses associated with T&D average nearly 6 percent of total electricity generation. This is a considerable amount and, if reduced, would make a sizable contribution to environmental impact reduction. A majority of these line losses result not from inadequate physical infrastructure, but from poor management and maintenance. This includes transformer overloads due to excessive voltages and poorly timed variations in load that cause voltage spikes. In addition, the operational practices associated with T&D, such as truck rolls to read meters and repair circuits, all have associated emissions and environmental impact. The existence of advanced communication technologies that could automatically manage and isolate outages, provide real-time meter reads, and proactively regulate line stresses would greatly reduce the operational environmental impact of the grid.
There are a number of actions that utilities can take to reduce transmission line losses, many of which require large capital investments. These actions are typically undertaken to meet T&D capacity requirements rather than reduce line losses. However, the Smart Grid can reduce reactive power flow and maximize the amount of real power that can be transmitted on the grid, thereby minimizing transmission losses. The Smart Grid can facilitate the application and monitoring of devices that inject or absorb reactive power in the grid. These include synchronous generators and condensers, shunt capacitors, and reactors.
The Smart Grid can enable reduction of line losses in the distribution networks through adaptive voltage control at substations and line drop compensation on voltage regulators. Utilities generally operate above 120 volts to provide a safety margin during peak loads. The Smart Grid would allow utilities to operate at voltages closer to the minimum of 114 volts (essentially a 4 percent reduction) and be prepared to inject additional voltage quickly as needed. Table 9 below from EPRI displays the results of incorporating these capabilities in the Smart Grid.
Based on this analysis, EPRI estimates that the savings from a Smart Grid in reducing losses through voltage regulation ranges from 3.5 to 28 billion kWh per year in 2030.
The delivery of electricity utilizes a supervisory control and data acquisition (SCADA) system that provides monitoring and control from generation through the step-down substation to detect the need for an increase or decrease in generating resources, and to respond to system instabilities. Key limitations of the current generation of SCADA systems include
• Limited bandwidths and relatively slow data transmission rates that often require several seconds or more to respond to an alarm or system change; and
• Limited or no visibility in the distribution network below the substation.
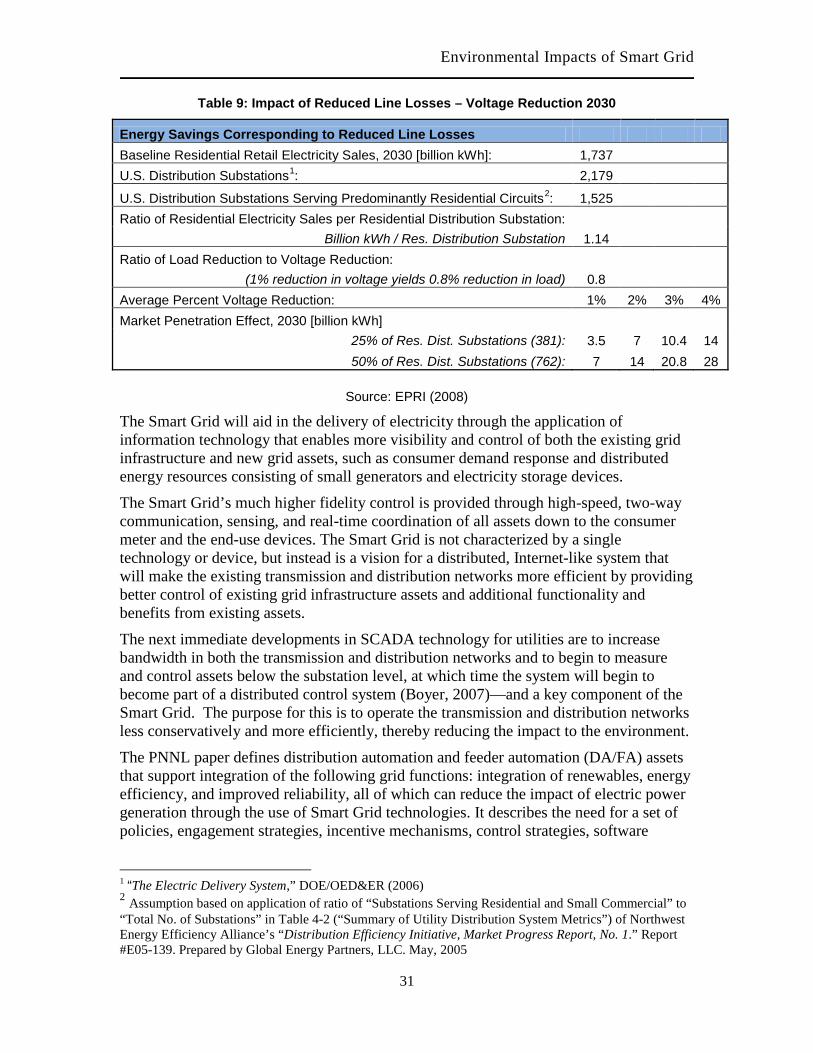
Environmental Impacts of Smart Grid
31
Table 9: Impact of Reduced Line Losses – Voltage Reduction 2030
Energy Savings Corresponding to Reduced Line Losses Baseline Residential Retail Electricity Sales, 2030 [billion kWh]: 1,737 U.S. Distribution Substations1 2,179 :
U.S. Distribution Substations Serving Predominantly Residential Circuits2 1,525 : Ratio of Residential Electricity Sales per Residential Distribution Substation:
Billion kWh / Res. Distribution Substation 1.14 Ratio of Load Reduction to Voltage Reduction:
(1% reduction in voltage yields 0.8% reduction in load) 0.8 Average Percent Voltage Reduction: 1% 2% 3% 4% Market Penetration Effect, 2030 [billion kWh]
25% of Res. Dist. Substations (381): 3.5 7 10.4 14 50% of Res. Dist. Substations (762): 7 14 20.8 28
Source: EPRI (2008)
The Smart Grid will aid in the delivery of electricity through the application of information technology that enables more visibility and control of both the existing grid infrastructure and new grid assets, such as consumer demand response and distributed energy resources consisting of small generators and electricity storage devices.
The Smart Grid’s much higher fidelity control is provided through high-speed, two-way communication, sensing, and real-time coordination of all assets down to the consumer meter and the end-use devices. The Smart Grid is not characterized by a single technology or device, but instead is a vision for a distributed, Internet-like system that will make the existing transmission and distribution networks more efficient by providing better control of existing grid infrastructure assets and additional functionality and benefits from existing assets.
The next immediate developments in SCADA technology for utilities are to increase bandwidth in both the transmission and distribution networks and to begin to measure and control assets below the substation level, at which time the system will begin to become part of a distributed control system (Boyer, 2007)—and a key component of the Smart Grid. The purpose for this is to operate the transmission and distribution networks less conservatively and more efficiently, thereby reducing the impact to the environment.
The PNNL paper defines distribution automation and feeder automation (DA/FA) assets that support integration of the following grid functions: integration of renewables, energy efficiency, and improved reliability, all of which can reduce the impact of electric power generation through the use of Smart Grid technologies. It describes the need for a set of policies, engagement strategies, incentive mechanisms, control strategies, software
1 “The Electric Delivery System,” DOE/OED&ER (2006) 2 Assumption based on application of ratio of “Substations Serving Residential and Small Commercial” to “Total No. of Substations” in Table 4-2 (“Summary of Utility Distribution System Metrics”) of Northwest Energy Efficiency Alliance’s “Distribution Efficiency Initiative, Market Progress Report, No. 1.” Report #E05-139. Prepared by Global Energy Partners, LLC. May, 2005

Environmental Impacts of Smart Grid
32
applications, and capabilities of these assets that are required to accomplish these functions.
The Smart Grid will employ DA/FA assets to expand SCADA communications in substations and into the feeders with the following types of systems: remotely actuated switches for reconfiguring the network in the event of a partial outage, advanced protective relays with dynamic and zonal control capabilities, dynamic capacitor bank controllers, and condition-based transformer-management systems. The Smart Grid will also employ transmission wide-area visualization and control—transmission control systems that rapidly sense and respond to disturbances. This will assist utilities in optimizing their availability, reliability, and resilience while leveraging the network for energy efficiency, carbon savings and reductions in the generation of pollutants.
The Smart Grid can enhance reliability in two ways: it can prevent and limit blackouts with transmission wide-area control and visualization tools that enhance situational awareness, and it can rapidly reconfigure the transmission grid to prevent or limit a blackout. At the distribution level, where the vast bulk of outages occur in terms of aggregate consumer-minutes without power, outages are typically caused by events such as vehicle accidents, wind and ice storms, and animals shorting out transformers, rather than systemic failures. The Smart Grid can quickly resolve these outages using DA/FA assets that can be used to isolate faults and then reconfigure distribution feeders through remotely actuated switches. This shortens the recovery time for nearly all consumers from an hour or more to a matter of seconds or less. In its ultimate form, this is a stand-alone micro-grid that is fully capable of supplying its own power and managing its local distribution. Generating power locally with smaller power plants using less polluting forms of energy can be supported effectively with these DA/FA assets.
The PNNL paper describes two additional Smart Grid-enabled mechanisms for assisting the penetration of renewable generation using existing transmission networks: wide-area control and dynamic thermal rating schemes. Both of these could potentially increase the throughput capacity of existing transmission lines, and thereby reduce the need to construct transmission capacity in order to move renewable power long distances to urban load centers.
Wide-area control involves using high-precision data from many phasor measurement units (PMUs) distributed throughout the grid and high-performance computing techniques to analyze the transmission grid and reconfigure it as needed in real time. In principle, this could allow some relaxation of restrictions on key transmission corridors due to stability limitations, because the grid could be reconfigured instantly to relieve a stability contingency. Wide-area control technology is a long-term technology development focus for the Smart Grid at the transmission level. When it may become practical, and how much additional new transmission capacity to serve renewable generation could be avoided, is not yet clear.
Dynamic thermal rating schemes are available today. They use sensors to account for the actual local weather conditions when computing the thermal capacity limits on transmission line segments, instead of assuming worst-case conditions, as is the current practice. Local weather conditions can lower or raise conductor temperatures. Knowing the local temperature in real time can also be used to determine conductor temperatures.

Environmental Impacts of Smart Grid
33
This information can be used to calculate line sag in real time, which may allow additional power to be delivered. How much avoided transmission capacity this promising technology can deliver in practice is uncertain. While it can increase throughput on specific lines under certain conditions, many transmission systems are constrained by stability limits rather than thermal limits. Even when wind power output is high, wind may not be blowing sufficiently at a key constrained transmission segment to increase the throughput to accommodate the increased generation. Further research is required on this subject before such estimates can be made.
PNNL made estimates of the impact of the Smart Grid based on information contained in the literature combined with expert insight to approximate the quantity of “… the energy savings and carbon reduction impact of selected discrete mechanisms to provide insight into the magnitude of Smart Grid environmental benefits” (EPRI 2008). A brief description of the mechanisms associated with T&D addressed in the PNNL study is provided here:
Reducing Line Losses through voltage control and compensation for reactive power and line drop. The estimate is based on application of voltage control to the residential sector with voltage reduction of 1 percent to 4 percent and market penetration of 25 percent to 50 percent.
The Climate Group report (also known as the ICT report) examined reductions in CO2 emissions in four sectors—Smart Grid, road transportation, buildings, and travel substitution—that could be enabled by information and control technologies (ICT) (Climate Group, 2008). This paragraph provides an estimate of the reduction in CO2 emissions in 2020 for T&D resulting from the Smart Grid. The estimate is based upon literature review and expert judgment of the Climate Group, although the assumptions and analytical methodology underlying the estimates are not clearly stated.
Energy Savings (TWHr)
Reduce T&D Losses 104–195 66–132
CO2 Reductions (Million Tons)
This reduction in CO2 production also implies (from Table 1 of this paper) a reduction in SOX production of 0.11 to 0.22 million tons and a reduction in NOX production of 0.053 to 0.11 million tons. Again, the estimated savings are through voltage control and performance monitoring of grid components. The CO2 reductions are based on production of 2,890 million tons of CO2, which is 15 percent higher than the EIA estimates for 2020.
The PNNL report (2010) identified two offsetting increases in consumption to realize the estimated reductions that the Smart Grid can deliver. The first increase assumes that a server is needed in every distribution substation to monitor end-use loads, provide two-way communications with consumers, and, where user permitted, provide automated demand response. The number of distribution substations is unknown, so an assumption of 100,000 substations is made in the report, based upon an estimated 300 to 400 thousand feeders and 3 to 5 feeders per substation. Each server is expected to draw 1kW

Environmental Impacts of Smart Grid
34
for every hour of the day throughout the year, thus increasing expected energy consumption by nearly 1 Billion kWh/year.
The second increase assumes that demand response/grid friendly appliance (DR/GFA) devices are installed in the entire stock of 466 million appliances (heat pumps, air conditioners, dryers, refrigerators, and freezers) (EIA-AEO, 2008), and individually draw a load of 1 to 5 W every hour of the day throughout the year, to additionally increase expected energy consumption by 4 to 20 Billion kWh/year.
The combined effect of the two offsets may increase the 2030 electric utility sector energy and CO2 emissions by 0.1 percent to 0.4 percent. While the increase is small and may not be considered significant, it does point to the need for technology developers to minimize the increased loads of Smart Grid technologies.
The Smart Grid will provide utilities with the ability to perform remote meter reading, avoid transformer overheating and damage, and heal networks by rerouting power when an event occurs. These capabilities are potential environmental benefits of Smart Grid technology and will result in reductions in emissions from fleet vehicles that in the past have been dispatched with workers to read meters and repair transformers or critical components. With respect to these areas, the ESPA Team found the following:
• Utilities include fuel savings, reduced number of truck rolls, and even reduced number of vehicles in their filings under “operational benefits” using such categories as:
o Reduced field service costs—turn on and turn off requests, trouble calls, fighting outages, etc., and
o Elimination of manual meter reading—trucks (and labor) are no longer needed to run the routes to read all meters every month.
• Fuel savings are real, but not large when compared to other operational benefits. The ESPA Team performed an analysis of the following references:
o SGIS assumptions used in the West Virginia Smart Grid Implementation Study.
o EPRI report on “Methodological Approach for Estimating the Benefits and Costs of Smart Grid Demonstrations.”
o A recent utility filing in Ohio.
o Current work ongoing at the Illinois Statewide Smart Grid Collaborative.
None of these breakdown utility operational benefits to the level of fuel savings. So although the ESPA Team believes that there is a reduction in utility vehicle fleet emissions resulting from the implementation of the Smart Grid, the literature does not contain quantifiable results.
In summary, the papers and reports that the ESPA Team reviewed in this section identified improvements to the T&D networks that the Smart Grid can utilize to reduce the impact of electricity production on the environment. The EPRI papers and PNNL paper provided a substantial amount of the detailed facts that are summarized above. The ESPA Team found that the EPRI papers tended to include more detailed assumptions

Environmental Impacts of Smart Grid
35
than the PNNL paper and that the PNNL paper referenced the EPRI papers for more details. The PNNL work described more applications of improvements to T&D networks than the EPRI papers covered. Some of these may lead to increased emissions reductions. Also, the PNNL paper described two improvements to T&D networks that are necessary to implement the Smart Grid, but they will lead to increased consumption of electricity while assisting in the reduction of emissions.
Table 10 summarizes the assumptions, findings and results that were identified for T&D aspects of the smart grid in relation to the environment.
Table 10: Assumptions, Findings and Results Related to T&D
Source Assumptions Findings Results
EPRI
Deploy adaptive voltage control at substations and line drop compensation on voltage regulators.
Reduce grid voltage from 120v to 114v and be prepared to inject additional voltage quickly as needed.
This results in a savings of 3.5 to 28 Billion kWh per year by 2030.
PNNL
Deploy DA/FA assets to expand communications in substations, and transmission wide area visualization and control.
This will assist utilities in optimizing availability, reliability and resilience.
This results in improved energy efficiency, carbon savings and reductions in pollutants.
PNNL Deploy wide area control systems.
Use PMUs and high performance computing to analyze the transmission network and reconfigure it as needed.
This results in relaxation of restrictions on key transmission corridors due to stability limitations.
PNNL Deploy thermal rating schemes.
Use sensors to account for the actual local weather when computing thermal capacity limits on transmission lines.
This results in additional power being delivered if stability limitations do not preclude it.
Climate Group
Deploy voltage control and compensation for reactive power and line drop.
Use these systems to reduce transmission and distribution losses.
Energy savings of 104 – 195 Billion kWh and 66 – 132 Million tons of CO2 by 2020.
PNNL
Deploy a server in every distribution substation. There are 100,000. Each will use 1 kW/hour.
This results in additional energy consumption of 1 Billion kWh/year.
The combined effect of these two offsets may increase 2030 energy consumption and CO2 production by 0.1% - 0.4%. PNNL
Deploy DR/GFA devices in 466 million appliances. These will use 1 – 5 watts/hour.
This results in additional energy consumption of 4 – 20 Billion kWh/year.

Environmental Impacts of Smart Grid
36
The general body of literature surrounding the environmental impacts of the Smart Grid focuses on the key dimensions as discussed earlier in this report regarding generation portfolio, increased operational and infrastructure efficiency, DR and DSM, energy from renewables, EVs and improvements to T&D systems.
Conclusions
Energy efficiencies can be broken into the categories of consumer driven and utility driven. Utility-driven efficiency, or DR, is based on the real-time incremental cost of energy that becomes the basis for consumer pricing. In the PNNL 2010 study, FERC estimated the contribution from existing U.S. demand response resources at about 41,000 megawatts (MW), or 5.8 percent of 2008 summer peak demand (FERC, 2008). Moreover, FERC recently estimated nationwide achievable demand response potential at 138,000 MW (14 percent of peak demand) by 2019 (FERC, 2009).
Consumer-driven efficiency is based on consumers’ willingness to become involved in managing their cost of energy—a continually active process. This consumer-driven efficiency, otherwise known as DSM, is attributed a 3 percent direct role in reducing electricity sector energy and CO2 emissions in 2010.
The introduction of smart appliances will be a vehicle for both DSM and DR influence. With sophisticated Smart Grid technologies integrated with these appliances, their load demand will have the ability to be adjusted based on operational needs of the utility. This includes, for example, the ability to adjust home thermostat temperature ranges (within limits set by consumer). These smart appliances, however, will have the most control imposed on them from the consumer.
The role of Smart Grid in managing EVs while they are charging and discharging will be invaluable. Without intelligent grid technologies, the necessary management tools such as DR, variable charging rates, and renewable generation pairing will be difficult to attain. The EPRI study (2007) evaluated the incremental impact of the Smart Grid on PHEVs and how it affects the overall reduction in emissions. The analysis is based on the level of PHEV penetration that would require “smart charging” technologies to be installed to avoid additional generation capacity investments. The study finds that the Smart Grid has the potential to reduce overall electric sector GHG emissions by 3 percent.
The PNNL study (2008) evaluates the incremental percentage penetration of renewable (wind and solar) energy that can be achieved through the use of Smart Grid technologies. The study assumes that at certain penetration rates of these intermittent renewables, reverse power flow will be necessary and that Smart Grid infrastructure will be required to adequately manage this information. For solar power, it is estimated that penetration scenarios beyond 20 percent will require reverse power flow. For wind power, the study evaluates the complications of incorporating and managing the intermittency of wind resources. The study indicates that the current grid could handle approximately 25 percent penetration from wind without substantial increased requirements for ancillary services. It suggests the incremental impact of the Smart Grid will come from its ability to displace the need for additional ancillary capacity, and thus offset the emissions

Environmental Impacts of Smart Grid
37
associated with its development and operation. The overall reductions are estimated to be over 5 percent of total U.S. energy consumption.
There are a number of actions that utilities can take to reduce transmission line losses, many of which require large capital investments. The Smart Grid can facilitate the application and monitoring of devices that inject or absorb reactive power in the grid. The Smart Grid can enable reduction of line losses in the distribution networks through adaptive voltage control at substations and line drop compensation on voltage regulators. The PNNL study (2010) describes how the Smart Grid can enhance reliability in two ways: it can (1) prevent and limit blackouts with transmission wide-area control and visualization tools that enhance situational awareness and (2) rapidly reconfigure the transmission grid to prevent or limit a blackout. Both of these activities require the use of two-way, high-speed communications and sufficient computing capability to formulate and execute a strategy in real time.
Ultimately, the Smart Grid’s impact on the environment will come in the form of reducing fossil fuel usage compared to BAU (e.g., by reducing the need for peaking units in favor of renewables and DR) and the associated emissions, or replacing relatively inefficient use of fossil fuels (e.g., ICEs) with fossil-fueled electric drive motors. This reduced fossil fuel usage and associated emissions (carbon and particulates) is driven largely by energy efficiency (behavioral and technological), T&D efficiency (infrastructural), and the integration of clean alternative and renewable generation sources. In the future, fossil fuel power plants may reduce their carbon emissions through carbon capture and storage technologies.
The ability of the grid to effectively utilize and incorporate large-scale penetration of renewable power sources with varying output will be driven by a comprehensive infrastructure investment in Smart Grid technologies, requiring standardization and large-scale systems integration. This task will have both significant technological and market barriers. Measuring the environmental impacts of the Smart Grid going forward is complex and challenging because of these substantial uncertainties in connection to global markets, innovation and adoption timelines, national and state level regulatory regimes, and the development of competing environmental priorities and impact mitigation strategies.

Environmental Impacts of Smart Grid
38
The Smart Grid can improve the optimization of transmission line assets (present and future) relative to the sometimes conflicting goals of DG. Without the Smart Grid, any such optimization must be done "on the fly" by utility operators or estimated by planners. With the Smart Grid, real-time information informs control strategies for optimal grid operation while providing some information for grid build-out (asset planning).
Recommended Topics for Further Research
Although this review mentioned HANs as a means to make appliances more efficient, it would be helpful to examine if homes of the future are projected to have more smart appliances, and also to tie in the projected increase to the number of residences.
There is also uncertain demand due to digital devices. Everything from data centers to personal electronics, even the power electronics and communications gear of the Smart Grid, will require more power. These may require higher power quality (MGS, 2008), which could add to Smart Grid design costs and result in lower environmental benefits.
In order to have up-to-date knowledge of the impact of the Smart Grid on the environment, it is important to include drivers at the state and territory level. The American Clean Energy and Security Act (HR 2454, also known as the Waxman-Markey Bill), which passed the House of Representatives in 2009, also sets a standard for the RPS at the national level.
Another area for follow-up analysis is to identify tiered levels of Smart Grid technology penetration to measure varying scenarios of associated environmental impacts. This could include state-specific analyses or NERC regional analyses.
The estimated generation mix in 2020 and 2030 indicates how critical the Smart Grid will be for managing renewables and EVs. The majority of estimates project increased percentages of EVs and distributed renewable generation installations. A more structured and systematic evaluation of the value added by Smart Grid technologies in managing these resources, and the subsequent levels of penetration that are acceptable, is an excellent area for further research, and the results of such an analysis would be very useful for many other researchers.
An important evaluation is how the Smart Grid will affect electricity supply dispatch programs, and how will this affect overall system emissions. , The addition of many new energy sources which are generally smaller and more locally distributed to the loads will add another level of complexity to availability and dispatch of such resources, and to the resulting analysis of system emissions.
Another important analysis is evaluation of actual power production capacity by time of day, to better assess the contribution that wind turbines can make and understand the resulting requirement for standby generation.

Environmental Impacts of Smart Grid
39
The appendix to this paper includes a summary of key areas of the Smart Grid that have an impact on the environment. It also includes summaries from several papers and reports on selected criteria pollutants that were not discussed directly in the report, but will be affected by the development of the Smart Grid in the United States over the next two decades.
Appendix/Tables
Table 11: Key Areas of Smart Grid Influence and Environmental Impact
Smart Grid Impact Area Area Description Environmental Impact
Grid optimization Developing the perfect balance among reliability, availability, efficiency, and cost.
Contributes to general efficiency of operations that directly relate to waste and emissions created by grid.
Demand response and demand-side management
Incorporating automated mechanisms that enable utility consumers to reduce electricity use during periods of peak demand and help utilities manage their power loads.
Offers energy use reduction opportunities from consumers and producers based on real time price signals and usage control
Advanced utility control Employing systems to monitor essential components, enabling rapid diagnosis and precise solutions appropriate to any event.
Ensures more efficient overall operations of utility infrastructure than can reduce automated recovery and thus reduced truck rolls, etc.
Energy storage Adding technology to store electrical energy to meet demand when the need is greatest.
Will facilitate increased renewable generation penetration and thus displacement of more carbon intensive generation sources.
Plug-in hybrid electric vehicle smart charging and vehicle-to-grid technologies
Incorporating systems through which electric and plug-in hybrid vehicles communicate with the power grid and store or feed electricity back to the grid during periods of high demand.
Will displace traditional internal combustion engines (ICEs) with relatively less emissions intense transportation fuel in the form of electricity.
Advanced metering Collecting usage data and providing energy providers and consumers with this information via two-way communications.
Will facilitate consumer behavioral changes towards energy efficiency by providing real-time, transparent pricing information to drive household usage decisions.
Home area networks Enabling home networks that Will increase ease and

Environmental Impacts of Smart Grid
40
allow communication between digital devices and major appliances so consumers can respond to price signals sent from the utility.
efficiency of consumer energy conservation decisions.
Renewable energy and distributed generation sources
Implementing infrastructure upgrades to support the integration of a higher penetration of clean, renewable energy generation onto the grid to reduce greenhouses gas emissions, provide energy independence, and lower electricity costs.
Displace relatively carbon intensive generation sources. Also displace generation sources producing particulate matter and significant cradle to grave environmental impacts.
Source: http://www.smartgrid.gov/basics
The following references are associated with criteria pollutants such as Pb and Hg that were not discussed in the main body of the paper. It is expected that the Smart Grid will assist in reducing the amount of these pollutants released into the environment, although that will be a function of the types of energy sources that are used. This information is included here for reference purposes only.
From “Management of Polychlorinated Biphenyls in the United States,” U.S. EPA, January 30, 1997 Introduction This document provides a summary of production and use of PCBs in the United States from 1927 to 1977. It describes major uses and amounts of PCBs during this period.
Findings The fate of PCBs as of 1977: Of the 700,000 tons of PCBs produced, 150,000 tons had been landfilled; 75,000 tons had entered the air, water, and soil; 25,000 tons had been incinerated; and 375,000 tons remained in electrical equipment. The remainder, approximately 75,000 tons, had been exported.
The paper also discusses storage and disposal inventory of PCBs, and sources and releases of PCBs.
From “Use of Waste and Byproduct Materials in Pavement Construction: Coal Fly Ash,” Turner Fairbank Highway Research Center, Department of Transportation (DOT, Federal Highway Administration
Introduction In part, this report summarizes fly ash production from coal plants and potential uses of the ash.
Findings

Environmental Impacts of Smart Grid
41
Uses of fly ash include:
• Cement production and/or concrete products
• Structural fills or embankments
• Stabilization of waste materials
• Road base or sub-base materials
• Flowable fill and grouting mixes
• Mineral filler in asphalt paving The report also discusses typical chemical compositions of the materials.
Conclusions / Recommendations Much of the fly ash produced in the United States can be recovered and used in the products listed above, but in 1996 only 13.3 million tons (or 22 percent of fly ash produced) was actually used in such products. The rest was placed in landfills or storage lagoons.
From “Use of Waste and Byproduct Materials in Pavement Construction: Coal Bottom Ash / Boiler Slag,” Fairbank Highway Research Center, Department of Transportation, Federal Highway Administration
Introduction This report summarizes the United States’ production of uses for coal bottom ash / boiler slag production from coal plants.
Findings Uses of bottom ash and boiler slag include:
• Snow and ice control
• Aggregate in lightweight concrete masonry units
• Raw feed material for production of Portland cement
• Road base and sub-base aggregate
• Structural fill material
• Fine aggregate in asphalt paving
• Flowable fill
• Blasting grit
• Roofing shingle granules The report also describes the typical chemical compositions of these materials.

Environmental Impacts of Smart Grid
42
Conclusions / Recommendations During 1996, approximately 16.1 million tons of bottom ash and 2.6 million tons of boiler slag were produced. Much of this waste can be recovered and used in the above products, although in 1996 30 percent of bottom ash and 93 percent of boiler slag was used in such products. The rest was placed in landfills or storage lagoons.
From “An Update on DOE/NETL’s Mercury Control Technology Field Testing Program,” DOE, NETL, SAIC, July, 2008 Introduction NETL initiated comprehensive Hg research under the Office of Fossil Energy’s Innovations for Existing Plants (IEP) Program in the early 1990s to ensure that cost-effective and reliable pollution control technologies are available for the existing fleet of coal-fired utility boilers. Emissions characterization performed by NETL and others in the early 1990s showed that Hg was not effectively captured across existing air pollution control device (APCD) configurations. To overcome this hurdle, NETL co-funded development of the Ontario Hydro (OH) method through a jointly sponsored research program with the University of North Dakota’s Energy and Environmental Research Center (UNDEERC).
Findings Analysis of OH method sampling campaigns revealed that the trace amount of Hg present in coal is volatilized during combustion and converted to gaseous elemental mercury (Hg0). Subsequent cooling of the coal combustion flue gas and interaction of the gaseous Hg0 with other flue gas constituents, such as chlorine (Cl) and unburned carbon (UBC), result in a portion of the Hg0 being converted to gaseous oxidized forms of mercury (Hg2+) and particulate-bound mercury (HgP). As a result, coal combustion flue gas contains varying percentages of HgP, Hg2+, and Hg0 and the exact speciation has a profound effect on the Hg capture efficiency of existing APCD configurations, which has been found to range from 0 to over 90 percent. The HgP fraction is typically removed by a particulate control device such as an electrostatic precipitator (ESP) or fabric filter (FF).
The Hg2+ portion is water-soluble and, therefore, a relatively high percentage can be captured in wet flue gas desulfurization (FGD) systems, while the Hg0 fraction is generally not captured by existing APCD.
From 2001 to 2008, NETL managed full-scale field tests of Hg control technologies at nearly 50 U.S. coal-fired power generation facilities. The flexible nature of this program allowed NETL to quickly incorporate insights and lessons learned from its network of partners into the development of advanced Hg control technologies tailored to specific areas of need. For instance, a determination that chlorine released during coal combustion promotes Hg0 oxidation in flue gas led to the development of technologies designed to provide a halogen “boost” for coals, such as sub-bituminous and lignite, that tend to contain low levels of Cl and thus lower concentrations of the more reactive oxidized form of Hg.

Environmental Impacts of Smart Grid
43
NETL has observed a step-change improvement in both the cost and performance of Hg control during full-scale field tests with chemically-treated activated carbon injection (ACI). The improved Hg capture efficiency of these advanced sorbent injection systems has given coal-fired power plant operators the confidence to begin deploying technology. As of April 2008, nearly 90 full-scale ACI systems have been ordered by U.S. coal-fired power generators. These contracts include both new and retrofit installations and represent over 44 GW of coal-based electric generating capacity. The ACI systems have the potential to remove more than 90 percent of the Hg in many applications based on results from NETL’s field testing program, at a cost estimate of approximately $10,000/lb Hg removed.
Conclusions / Recommendations This paper provides a substantial amount of data from many of the 50 coal-fired power generation tests that were performed from 2001 to 2008. These data can be used to estimate the effectiveness of Hg capture if the ACI systems are deployed at all coal-fired power generation facilities.
From “Mercury Emissions from Coal Power Plants,” EPA, 2010 Introduction EPA provides an estimate of the amount of Hg pollution that exists with and without additional regulation of its release at coal-fired power plants.
Findings Figure A-1 below displays Hg deposition from U.S. power plants in 2001. Figure A-2 displays expected mercury deposition from U.S. power plants in 2020 with Clean Air Interstate Rule (CAIR) and Clean Air Mercury Rule (CAMR). EPA signed CAIR on March 10, 2005, and CAMR on March 15, 2005. This rule would have significantly reduced Hg emissions from coal-fired power plants across the country. Taken together, CAIR and CAMR would have reduced electric utility Hg emissions by nearly 70 percent from 1990 levels.
CAIR was remanded by the DC Circuit Court on December 23, 2008. On February 8, 2008, the DC Circuit Court vacated EPA’s rule removing power plants from the Clean Air Act (CAA) list of sources of hazardous air pollutants, and vacated CAMR.
CAMR would have created a market-based cap-and-trade program that permanently caps utility mercury emissions in two phases: The first phase cap was to be 38 tons beginning in 2010, and the second cap was to be set at 15 tons beginning 2018.
Current Status On July 6, 2010, EPA proposed a Transport Rule (http://www.epa.gov/airtransport/), which would improve air quality in the eastern United States by reducing power plant emissions from 31 states and the District of Columbia. This proposal would require significant reductions in SO2 and NOx emissions that cross state lines. These pollutants react in the atmosphere to form fine particles and ground-level ozone and are transported long distances, making it difficult for other states to achieve national clean air standards.

Environmental Impacts of Smart Grid
44
By 2014, the rule and other state and EPA actions would reduce power plant SO2 emissions by 71 percent over 2005 levels. Power plant NOx emissions would drop by 52 percent. This rule proposes a response to the court remand of CAIR and will replace CAIR when it becomes final.
EPA is developing air toxics emissions standards for power plants under the CAA, consistent with the DC Circuit Court’s opinion regarding CAMR. EPA intends to propose air toxics standards for coal- and oil-fired electric generating units by March 10, 2011, and finalize a rule by November 16, 2011.
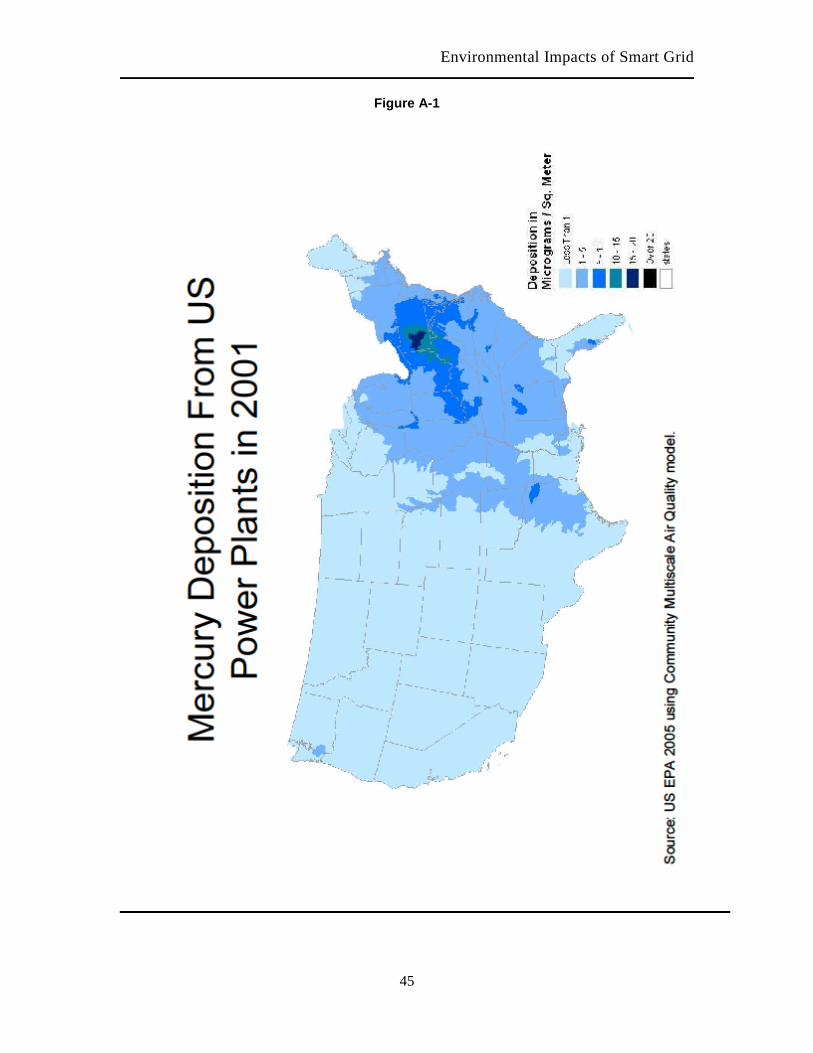
Environmental Impacts of Smart Grid
45
Figure A-1

Environmental Impacts of Smart Grid
46
Figure A-2

Environmental Impacts of Smart Grid
47
From House of Representatives (HR) 2454: American Clean Energy and Security Act (aka Waxman-Markey Bill), passed by the House June 26, 2009
Summary of provisions associated with Smart Grid:
• Combined efficiency and renewable electricity standard: 20 percent renewable generation by 2020
o Includes wind, solar, geothermal, biomass, landfill gas, incremental hydropower, marine, and hydrokinetic
o Does not include existing hydropower, any nuclear or any CCS generation
• Clean transportation o Utilities required to plan for integration of electric vehicles into the grid
o Large scale vehicle electrification program: Use of funds to assist fleet owners in the purchase of vehicles and to provide supporting infrastructure for Smart Grids
o “SmartWay” transportation efficiency program: measures and designates energy-efficient, low GHG technologies and strategies
• Transmission and Distribution o Smart Grid: Requires states to establish peak demand reduction goals
o Expands rebate and public information programs to include Smart Grid equipment
Calls for regional transmission planning process to be coordinated by FERC.

Environmental Impacts of Smart Grid
48
American Clean Energy and Security Act (HR 2454, aka the Waxman-Markey Bill). Passed the U.S. House of Representatives, June 26, 2009; available at
References
http://www.govtrack.us/congress/bill.xpd?bill=h111-2454.
American Clean Energy Leadership Act (S 1462). Passed U.S. Senate Committee on Energy and Natural Resources, June 17, 2009.
Charles River Associates. “Primer on Demand-Side Management, with an Emphasis on Price-responsive Programs,” available at http://siteresources.worldbank.org/INTENERGY/Resources/PrimeronDemand-SideManagement.pdf.
Corbus, D. “Eastern Wind Integration and Transmission Study – Preliminary Finding,” http://www.nrel.gov/wind/systemsintegration/ewits.html, accessed July 12, 2010.
DOE/NETL. “2008 Carbon Sequestration Atlas of the United States and Canada, Second Edition, (Atlas II),” 2008.
DOE/NETL. “An Update on DOE/NETL’s Mercury Control Technology Field Testing Program,” July 2008.
DOE/NETL. “Cost and Performance Baseline for Fossil Energy Plants,” 2007; DOE/NETL-2007/1281.
DOE. “The Electric Delivery System,” Office of Electricity Delivery & Energy Reliability: Washington, DC, February 2006.
DOT/FHWA. “Fairbank Highway Research Center: Use of Waste and Byproduct Materials in Pavement Construction: Coal Bottom Ash / Boiler Slag.”
DOT/FHWA. “Turner Fairbank Highway Research Center: Use of Waste and Byproduct Materials in Pavement Construction: Coal Fly Ash.”
Energy Information Agency (EIA).”Annual Energy Outlook 2008 with Projections to 2030 (Revised Preliminary Reference Case),” EIA, U.S. Department of Energy: Washington, DC, March 2008; DOE/EIA-0383(2008). EIA. “Annual Energy Outlook–2010,” pgs. 66, 67, and 82; Tables 1.1. and 7.2.
EIA, Glossary, www.eia.doe.gov/glossary/index.cfm?id=D, accessed 8/31/2010
Enkvist, N., Rosander. “A Cost Curve for Greenhouse Gas Reduction,” McKinsey Report, 2007. Environmental Research Corporation. “Analysis of Oil Spill Trends in the United States and Worldwide,” Presented at 2001 International Oil Spill Conference, 2001.
EPRI. “Assessment of Achievable Potential from Energy Efficiency and Demand Response Programs in the U.S. (2010–2030),” Palo Alto, CA, January 2009. EPRI. “Environmental Assessment of Plug-In Hybrid EVs,” Palo Alto, CA, 2007.

Environmental Impacts of Smart Grid
49
EPRI. “Power Delivery System of the Future: A Preliminary Estimate of Costs and Benefits,” Palo Alto, CA, July 2004. EPRI. “The Green Grid: Energy Savings and Carbon Emissions Reductions Enabled by a Smart Grid,” Palo Alto, CA, June 2008.
FERC, http://www.ferc.gov/industries/electric/indus-act/demand-response/dr-potential.asp
FERC, “A National Assessment of Demand Response Potential,” The Brattle Group, Freeman, Sullivan & Co, Global Energy Partners, LLC,06-01-09, http://www.smartgridnews.com/artman/uploads/1/06-09-demand-response_1.pdf;
accessed August 26,2010.
Gellings, C., et al. “Strategic Implications of Demand-Side Planning,” in Strategic Management and Planning for Electric Utilities, Prentice-Hall, 1985.
Hledik, R. (Brattle Group). “How Green is the Smart Grid,” Elsevier, April 2009.
NETL. “Power Quality for the Digital Economy,” Pittsburgh, PA, October, 2008.
NETL. “Backup Generators (BUGS): The Next Smart Grid Peak Resource,” Pittsburgh, PA, April 15, 2010.
NIST. “NIST Smart Grid Standards,”
http://cio.nist.gov/esd/emaildir/lists/b2g_interop/msg00606.html, accessed September 1, 2010.
NIST. “NIST Framework and Roadmap for Smart Grid Interoperability Standards, Release 1.0,” January 1, 2010.
Northwest Energy Efficiency Alliance. “Distribution Efficiency Initiative, Market Progress Report, No. 1,” prepared by Global Energy Partners, LLC, May 18, 2005; Report #E05-139.
Perkin Elmer Corporation. “The Determination of Total Mercury in Coal and Coal Fly Ash Using Thermal Combustion and Amalgamation Coupled with Atomic Absorption,” 2009.
PNNL. “The Smart Grid: An Estimation of the Energy and CO2 Benefits,” January 2010.
Power Systems Engineering Research Center. “Facilitating Environmental Initiatives While Maintaining Efficient Markets and Electric System Reliability,” Cornell University, October 2009.
Smart Grid Basics, accessed June 15, 2010; available at http://www.smartgrid.gov/basics.
Smart Grid Technologies, accessed June 15, 2010; available at http://www.smartgrid.gov/technologies.
Smart Grid News. “Home Area Networks,” accessed July 13, 2010; available at http://www.smartgridnews.com/artman/publish/Technologies_Home_Area_Networks/.

Environmental Impacts of Smart Grid
50
Smith, J.C. "Best Practices in Grid Integration of Variable Wind Power: Summary of Recent US Case Study Results and Mitigation Measures1," EWEC presentation, May 2007; available at http://www.uwig.org/EWEC07paper.pdf.
TechPulse360. “White House Feels Heat on HAN Standards,” accessed July 13, 2010; available at http://techpulse360.com/2010/05/28/white-house-feels-heat-on-han-standards/.
The Climate Group. “SMART 2020: Enabling the Low Carbon Economy in the Information Age,” submitted on behalf of the Global eSustainability Initiative, 2008. U.S. Environmental Protection Agency (EPA). “Management of Polychlorinated Biphenyls in the United States,” January 30, 1997.
U.S. EPA. “Using Community Multi-Scale Air Quality Model,” 2005.